failure rates in barsebäck-1 reactor coolant pressure
TRANSCRIPT

SKI Report 98:30
Failure Rates in Barsebäck-1 ReactorCoolant Pressure Boundary Piping
An Application of a Piping Failure Database
ISSN 1104-1374ISRN SKI-R--98/30--SE
Bengt Lydell
May 1999

SKI Report 98:30
This report concerns a study which has been conducted for the Swedish NuclearPower Inspectorate (SKI) and Barsebäck Kraft AB (BKAB). The conclusions andviewpoints presented in the report are those of the author and do not necessarily
coincide with those of the SKI or BKAB.
Bengt Lydell
RSA Technologies, 1736 Promenade Circle,Vista, CA 92083-6172, USA
May 1999
SKI Project Number 97258BKAB Project Number 1998-8113
Failure Rates in Barsebäck-1 ReactorCoolant Pressure Boundary Piping
An Application of a Piping Failure Database

SKI Report 98:30 ii
Summary
SKI Report 98:30 documents an application of a piping failure database to estimatethe frequency of leak and rupture in reactor coolant pressure boundary piping. The studyused Barsebäck-1 as reference plant. The study tried two different approaches to pipingfailure rate estimation: 1) ‘PSA-style’, simple estimation using Bayesian statistics, and 2)fitting of statistical distribution to failure data. A large, validated database on pipingfailures (like the ‘SKI-PIPE’ database) supports both approaches. In addition todocumenting leak and rupture frequencies, the SKI report describes the use of pipingfailure data to estimate frequency of medium and large loss of coolant accidents(LOCAs). This application study was cosponsored by Barsebäck Kraft AB and SKIResearch. Urho Pulkkinen and Kaisa Simola (Technical Research Centre of Finland;VTT Automation) performed an independent peer review of the final manuscript to thisreport.
Sammanfattning [Summary in Swedish]
Sedan 1994 har enheten för anläggninssäkerhet på SKI bedrivit ett FoU-projektinom området rörtillförlitlighet. En viktig del av projektet har varit insamling ochbearbetning av erfarenhetsdata från kärnkraftverk i Norden såväl som utomlands.Statistisk utvärdering av dessa data har möjliggjort bestämning av läckage- ochbrottfrekvenser för bl.a. böjar, svetsar och T-stycken ingående i rörsystem innan- ochutanför reaktorinneslutningen. Projektet avslutades under 1998 med entillämpningsstudie avseende prediktering av brottsfrekvenser i rör innanförinneslutningen i Barsebäck-1. Tillämpningsstudien under 1998 samfinansierades avBarsebäck Kraft AB och SKI. VTT Automation (Urho Pulkkinen och Kaisa Simola)utförde oberoende granskning av det slutgiltliga manuskriptet till SKI Rapport 98:30.
SKI Report 98:30 iii
Table of Contents
1. Introduction............................................................................................................ 11.1 Background......................................................................................................... 11.2 Conventions & Definitions................................................................................... 21.3 Objectives............................................................................................................ 31.4 Report Organization ............................................................................................ 4
2. Data on Piping Failures.......................................................................................... 62.1 Summary of the BWR-Specific Failure Data ........................................................ 62.2 Piping Failures in ABB-Atom BWR Units............................................................ 92.3 Data Interpretation Guidelines ........................................................................... 122.4 Organization of the Application Study ............................................................... 16
3. Models of Piping Reliability ................................................................................. 213.1 Basic Models & Classification of Pipe Failures................................................... 213.2 Time-dependence of Crack Growth ................................................................... 253.3 Time-dependence of Thermal Fatigue Damage................................................... 26
4. Brief Description of Barsebäck-1 RCPB Piping .................................................. 274.1 RCPB Piping Design Features ........................................................................... 274.2 Operating Experience ........................................................................................ 284.3 RCPB Piping Design Database .......................................................................... 29
5. Weld Leak & Rupture Frequency Due to IGSCC .............................................. 325.1 Reviewing the Service Data ............................................................................... 325.2 Parameter Estimation......................................................................................... 365.3 Parameter Estimation - A Different Perspective ................................................. 39
6. Rupture Frequency Due to Thermal Fatigue ...................................................... 436.1 Reviewing the Service Data ............................................................................... 436.2 Thermal Fatigue Issue Summary ........................................................................ 456.3 Parameter Estimation......................................................................................... 46
7. Barsebäck-1 Piping Reliability Database ............................................................ 487.1 Base Values versus Adjusted Values.................................................................. 487.2 Barsebäck-1 Piping Reliability Database ............................................................ 507.3 Weld ‘Location-Dependency’ - Limitations & Pitfalls ........................................ 51
8. LOCA Frequencies in Barsebäck-1 PSA ............................................................. 528.1 LOCA Categories in Barsebäck-1 PSA.............................................................. 528.2 New LOCA Frequencies.................................................................................... 538.3 Study Insights.................................................................................................... 54
9. Review of Technical Issues ................................................................................... 569.1 Issues in Sensitivity & Uncertainty Analysis ....................................................... 569.2 Justifications for Detailed Modeling................................................................... 579.3 PSA Methods & Material Sciences .................................................................... 589.4 Direct Estimation versus PFM ........................................................................... 589.5 Location Dependency of Weld Failures.............................................................. 59
10. Conclusions and Recommendations................................................................... 6010.1 Conclusions ..................................................................................................... 6010.2 Recommendations on Future R&D Directions.................................................. 60
11. References ........................................................................................................... 63

A. Abbreviations, Acronyms & Notation ………………….…..……… 62B. Barsebäck-1 RCPB Piping Components …………….…………… 65C. SKI-PIPE - The Database Content ……………….……………… 72D. Database Structures - PSA_VER2 & SKI-PIPE ……………… 76E. Vibration-Fatigue in Small-Diameter Piping ………...………..…79F. Erosion-Corrosion in RCPB Piping ………………….…………… 80G. Note on Statistical Analysis of Censored Data ….…….………….. 81

SKI Report 98:30 v
List of Tables
Table 2-1 Summary of SKI-PIPE - BWR & PWR Data …………………….…… 6Table 2-2 ABB-Atom BWR Design Generations ……………………..………… 8Table 2-3 Barsebäck-1 RCPB Piping Systems ……………………….……….…… 16Table 2-4 The Main Steps in Piping Reliability Data Analysis ……………….…… 17
Table 5-1 Weld Failures in Medium-diameter RCS Piping ……………..…..… 32Table 5-2 Weld Failures in Medium-diameter RCS Piping (US)……..….…… 32Table 5-3 Weld Failures in Medium-diameter SIR Piping ……….…….……..…… 32Table 5-4 Weld Failures in Medium-diameter SIR Piping (US) ……..….…… 32Table 5-5 Weld Failures in Large-diameter RCS Piping ……………..………….. 32Table 5-6 Weld Failures in Large-diameter RCS Piping (US) …………………… 33Table 5-7 Weld Failures in Large-diameter SIR Piping ………………….……… 32Table 5-8 Weld Failures in Large-diameter SIR Piping (US) …………………… 33Table 5-9 RCS Weld Crack & Leak Frequencies Due to IGSCC …….………. 33Table 5-10 SIR Weld Crack & Leak Frequencies Due to IGSCC ……...… 34Table 5-11 Baseline Rupture Frequencies Due to IGSCC in Welds ….…..… 35Table 5-12 Example of Rupture Frequencies in Different Welds ……………… 35Table 5-13 Distribution Parameters for IGSCC-Susceptible Piping ….…..… 37Table 5-14 Through-wall Cracks in Large-diameter RCS Piping ……………… 38
Table 6-1 Summary of Thermal Fatigue Events……….……………………… 41Table 6-2 Thermal Fatigue Failures by Pipe Size ………………………..………42Table 6-3 Thermal Fatigue in Nordic Plants ……………………………..……… 42Table 6-4 Baseline Leak and Rupture Frequencies …………………..……………44
Table 7-1 Barsebäck-1 Plant System Names and the System Groups ……………… 45Table 7-2 Excerpt from Barsebäck-1 Database ………………..…………………… 48Table 7-3 Comparison of Pipe Rupture Frequencies ………………..………………48
Table 8-1 Proposed LOCA Frequencies …………………………….…………… 50Table 8-2 Comparison of LOCA Frequencies …………………………….……… 51
Table B-1 Main Steam Piping System Components …………….………..………. 65Table B-2 Main Feedwater Piping System Components …………………..……... 66Table B-3 Recirculation Piping System Components…………………………. 66Table B-4 Main Steam Pressure Relief Piping System Components ….………..... 67Table B-5 Residual Heat Removal Piping System Components …..…………. 68Table B-6 Core Spray Piping System Components …………………..….………. 69Table B-7 RPV Head Cooling Piping System Components ……………..……. 69Table B-8 Auxiliary Feedwater Piping System Components ……...……………. 70Table B-9 Standby Liquid Control Piping System Components ……..………. 70Table B-10 Hydraulic Scram Piping System Components ……………..……. 71

SKI Report 98:30 vi
Table C-1 Database Coverage by Country ……………………………….…………. 74Table C-2 Summary of IGSCC Data in SKI-PIPE ………………………….…….75
Table D-1 PSA_VER2 - Description of Data Fields ……………………….……….76Table D-2 SKI-PIPE - Description of Data Fields ……………………….……….77
Table E-1 Weld Counts in Small-Diameter RCPB Piping …………………………. 79Table E-2 Service Data on Small-Diameter RCPB Piping …………………………. 79
Table F-1 Piping Component Counts in Carbon Steel Steam Systems …..……. 80

SKI Report 98:30 vii
List of Figures
Figure 2-1Failure Definitions Based on Manifestations of IGSCC ………....…… 7Figure 2-2Piping Failures in LWRs by Year of Operation ……………………...….. 7Figure 2-3Piping Failures in BWRs by Year of Operation …………..……………... 8Figure 2-4Piping Failures in ABB-Atom Plants by Year of Operations ……….... 9Figure 2-5Piping Failures in ABB-Atom Plants by Size & Year ……………….…… 10Figure 2-6BWR Population by Years of Commercial Operations ….…….……. 11Figure 2-7Criteria for Classifying ISI Results ………..…………………………… 12Figure 2-8Conditional Rupture Probability Given IGSCC ……………...………..… 13Figure 2-9Conditional Rupture Probability According to PFM ………….………… 14Figure 2-10 The Databases of the R&D Project………………………….….……… 15Figure 2-11 Guide to SKI Report 98:30 ……………………………………..…… 18
Figure 3-1Location-Dependency of Weld Failures ………………………..….….. 21Figure 3-2Location-Dependency of Weld Failure in SIS Piping ……………..…...…21Figure 3-3Location-Dependency of Weld Failures in RHR Piping …………....… 22Figure 3-4Location-Dependency of Weld Failures in RCS Piping …..………..… 22Figure 3-5Hypothetical Crack Growth Histories …………………..….….. 23Figure 3-6Crack Growth in DN700 Recirculation System Piping ………..…….. 24
Figure 4-1Recirculation System Loop in ABB-Atom BWR-1, 2 & 3 …………….…25Figure 4-2Overview of the PSA_VER2 Access Database ……………..………….. 28Figure 4-3Example of Database on Attribute Data ……………..…………….….. 29
Figure 5-1Weld Failures in RCS Piping ………….………………………..….….. 30Figure 5-2Weld Failures in SIR Piping ……………………….…….…………… 31Figure 5-3Conditional Rupture Probability ………………………………..…… 35Figure 5-4Hazard Functions for IGSCC-Susceptible Piping ……….…………… 37Figure 5-5Hazard Plot of RCS Weld Failure Data ………………….…….………38
Figure 6-1Thermal Fatigue in BWRs Worldwide …………………..…....………40Figure 6-2Hazard Functions for Piping Susceptible to Thermal Fatigue…….... 44
Figure 7-1Information on IGSCC Sensitivity of Welds ………………….... 46
Figure 8-1Medium- and Large LOCA Categories ………….…...…..…….. 49Figure 8-2Contributors to Large LOCA …………………………….…….... 51Figure 8-3Contributors to Medium LOCA …………………..…...……… 52Figure 8-4Contributors to Large LOCA by Degradation Mechanism ……….... 52
Figure C-1 Overview of SKI-PIPE Database …………………..…………....72Figure C-2 Examples of Data Sources in SKI-PIPE ……………….……….... 73Figure C-3 The Coverage of SKI-PIPE - Operating BWR Units ……………… 73Figure C-4 Piping Failures in Swedish BWRs 1972-1998 ………..………...…74

SKI Report 98:30 viii
Figure G-1 Hazard Plot of RCS Piping Failure Data ……………..……..…… 82Figure G-2 Hazard Plot of Thermal Fatigue Data …………………….…… 82Figure G-3 Hazard Plot of CRD Piping Failure Data ……………..…..….…… 83Figure G-4 Hazard Plot of Failure Data on DN80-100 Piping ……………… 83

SKI Report 98:30 ix
Acknowledgments
The author provides special thanks to Ralph Nyman (SKI project manager) for hisstrong commitment to bring the 4-year program to successful completion. Specialthanks are also extended to Ingemar Ingemarson (BKAB) for his foresight tocommission the application study. The excellent work by Lennart Åström1 (BKAB) indeveloping PSA_VER1 was key to performing the application study with Barsebäck-1as reference plant. Mr. Harald Gmeiner (Enconet Consulting Ges.m.b.H.) assisted withthe review and enhancement of PSA_VER1.
The author would like to acknowledge the invaluable contributions to the pipingfailure database by Walter Burchardt (Energie-Versorgung Schwaben AG), TinkoGantchev (Bulgarian Nuclear Safety Authority), Rudolf Häussermann (KernkraftwerkLeibstadt AG), Kalle Jänkälä (IVO International, Ltd.), Bernd Schubert (HamburgischeElectricitäts-Werke AG), Ralph-Michael Zander and Adelbert Gessler (KernkraftwerkeGundremmingen Betriebsgesellschaft mbH), Caroline Lauron and Louise Lund (U.S.Nuclear Regulatory Commission).
Finally, the author provides special thanks to Karl Fleming (ERIN Engineering andResearch, Inc.) who graciously shared insights and results from his work on pipingreliability with applications to risk-informed in-service inspection.
The final version of SKI Report 98:30 was peer reviewed by Urho Pulkkinen andKajsa Simola (VTT Automation). The work to finalize the study documentationbenefited greatly from their review comments.
1 Currently with Fagerström Industrikonsult AB (Helsingborg, Sweden).

SKI Report 98:30 1
1. Introduction
This summary report presents an application of a database on piping failures toestimate frequencies of leaks and ruptures in medium- and large diameter reactorcoolant pressure boundary (RCPB) piping. Together with a description of the technicalapproach, the report includes an overview of results and insights of a plant-specificanalysis of piping reliability with Barsebäck-1 as reference plant.
1.1 Background
Of limited or unproved usefulness, several databases on piping failures exist.Factors such as accessibility (e.g., proprietary data), incompleteness or lack of validationsignificantly impacts their usefulness. Initiated in mid-1994, the R&D leading to theapplication study included the development of a validated, comprehensive database onpiping failures in commercial nuclear power plants worldwide. Consistent with the datacollection standard ISO 14 224 “Collection of Reliability and Maintenance Data forEquipment,” the database development program specified the following characteristics:
• Verification of the completeness of data sources through reviews of full-textevent reports and in-service inspection (ISI) reports.
• Verification that data sources have the proper information and that basic
information (population, material composition, diameter, wall thickness,installation data, operating period) on the piping is available.
• Well documented set of failure definitions against which the service data are
collected. • Accurate input of service data, and handling of the data using quality principles
(e.g., document control).
A framework for interpreting and analyzing service data on piping evolved with thedatabase development effort. According to that framework, the statistical parameterestimation should be performed on the basis of carefully defined piping reliabilityattributes and reliability influence factors. Interim results of the R&D were published asSKI Reports 95:58 (SKI, 1995a), 95:61 (SKI, 1995b) and 97:26 (SKI, 1997) andconference papers (e.g., Lydell and Nyman, 1996, 1998). Limited to ASME Class 1, 2and 3 piping systems, the database currently (end of December, 1998) includes well over3,000 event reports addressing significant degradations (cracks in the through-walldirection) and failures (small to major leaks and ruptures). The database also includes anadditional 400 event reports addressing water hammer events leading to piping systemdamage (e.g., failure of hangers or supports), leaks or ruptures.

SKI Report 98:30 2
Historically, different technical approaches have been applied to estimate thefrequency of pipe leaks and ruptures. These approaches have ranged from directstatistical estimation using the available service data to application of probabilisticfracture mechanics models. In the subject application, statistical estimates of leaks andruptures were obtained through consideration of trends in event frequencies correlatedto the length of service time. The statistical estimation process was intimately coupled toa framework for interpreting and analyzing service data on occurred flaws (e.g., cracks)and leaks. The reader is referred to SKI Report 97:26 for additional backgroundinformation.
1.2 Conventions & Definitions
Piping failures occur because of degradation and failure mechanisms not accountedfor in the original piping system design, fabrication and installation. Collecting qualitydata on degradations and failures enable direct statistical estimation of pipe leak andrupture frequency. Requirements for reliability data analysis differ significantly betweenactive components and passive components, however.
Since no major RCPB piping failures in BWRs have occurred, piping reliabilityanalysis builds on interpretations of data on incipient and degraded failures. Thecompleteness of databases on piping failures is particularly important when estimatingreliability parameters for rare events such as large leaks or ruptures. The SKI-PIPEdatabase2 contains detailed data on degradation and failure mechanisms, root causeevaluations and operating conditions for piping failure events during 1970-1998. It is aperiodically updated database on failures in carbon steel and stainless steel piping incommercial nuclear reactors worldwide. This study only considered service data relevantto boiling water reactors (BWRs). It used an archived version of the database (SKI-PIPE, Revision 98:4).
All failure event records in the database are mutually exclusive events. While asingle weld could contain multiple cracks, even multiple pinholes, for each such instancethe database only records one weld failure representative of the most significant crack.The term ‘weld’ encompasses the weld metal and the weld heat-affected zone (HAZ).
Degradation mechanisms addressed by the application study included forms ofdegradation mechanisms specific to BWR operating environments. Examples of suchmechanisms are intergranular stress corrosion cracking (IGSCC) in weld heat affectedzones (HAZ), transgranular stress corrosion cracking (TGSCC) in cold worked pipebends, and thermal fatigue in piping system branch points. 2 Several recent industry reports on piping reliability, including NUREG-1661 (U.S. NRC, 1999) andEPRI TR-112657 (Dimitrijevic et al, 1999), refers to a database developed for SKI in 1995 (SKI Report96:20; Bush et al, 1996). It should be recognized that the SKI-PIPE database is independent of thedatabase documented in SKI Report 96:20.

SKI Report 98:30 3
As recorded in SKI-PIPE, the failures are classified as either ‘crack’, ‘pinholeleak’, ‘leak’ or ‘rupture’. An event classified as ‘crack’ implies that the crack tip did notpenetrate the pipe wall. By contrast, welds containing pipe wall penetrating cracks oflimited with and length but with visible water seepage or drop leakage are classified aspinhole leaks. Events involving at-power leaks discovered through normal global orvisual leak detection systems are classified simply as ‘leaks’. Finally, the term ‘rupture’implies a sudden, major piping failure having a significant effect on plant operations. Theconsequence could be a large release of process medium (say, 50 kg/s, depending onsize and location), or complete separation of pipe-ends (e.g., double-ended guillotinebreak).
The term ‘failure’ implies that a corrective action was taken to refurbish a pipingsystem. Examples of corrective actions include repair by using the weld overlay repairtechnique, replacement using piping component of same type and material compositionas the original design, replacement using piping component of same size and schedulebut of different layout or material composition, and replacement of an entire pipingsystem using a material composition different from the original design. The term ‘failure’also has a risk connotation. Depending on risk significance, failures are classified asincipient, degraded or complete failures.
Derived weld leak and rupture frequencies build on data interpretations and not onapplication of physical models of failure. The data interpretations assume weld crackinitiation to be a function of the quality of piping fabrication and installation. Crackpropagation is assumed to be a function of plant thermal transient history and operatingconditions. Hence, the occurred weld cracks as recorded in the database representmanifestations of quality deficiencies during plant construction, and of plant thermaltransient histories. Throughout the report, all pipe diameters are quoted as nominaldiameters (DN) in millimeters. Also, the report uses the terms ‘small-’, ‘medium-’ and‘large-diameter’ piping to mean piping of diameter < DN100, 100 ≤ DN ≤ 250, and >DN250, respectively.
1.3 Objectives
The application study was concerned with the estimation of RCPB piping leak andrupture frequencies in Barsebäck-1, a third design generation ABB-Atom BWR unit.These leak and rupture frequencies were input to a component-by-component model ofthe RCPB piping representing loss of coolant accident (LOCA) initiating events. InBarsebäck-1, the RCPB consists of the following ten piping systems; the plant-specificsystem IDs are given in parentheses:
1. Main steam system (System 311) up to the outside containment isolation valves.2. Main feedwater system (System 312) from the outside containment isolation valves
to the reactor pressure vessel (RPV).3. Main reactor coolant recirculation system (System 313) in its entirety.

SKI Report 98:30 4
4. Nuclear steam pressure relief system (System 314).5. Residual heat removal system (System 321) from the recirculation system and to
the outside containment isolation valves, and from the outside containmentisolation valves to the System 312 branch connections.
6. Emergency core cooling system (System 323) from the outside containmentisolation valves to the RPV.
7. RPV head cooling system (System 326) in its entirety. This system connects to therecirculation pump discharge side of the main recirculation loops.
8. Auxiliary feedwater system (System 327) from the outside containment isolationvalves to the System 312 branch connections.
9. Standby liquid control system (System 351) from the outside containment isolationvalves to the RPV.
10. Hydraulic control rod insertion system (System 354) from the outside containmentisolation valves to the respective control rod group.
The evaluation was limited to typical piping components (bends/elbows, nozzles,pipes, tees and welds). Failures of other types of passive components (e.g., pumpcasings, rupture discs, valve bodies) were not addressed by the study. In Barsebäck-1,the RCPB piping nominal diameter ranges from DN650 (recirculation system; System313) to DN25 (hydraulic scram system; System 354). The impact of breaks ininstrument sensing lines (DN8-DN10), sample lines and vent lines (DN20) was alsoaccounted for.
Consideration of statistical uncertainty is an integral part of risk and reliabilityanalysis. It is recognized that uncertainty analysis is particularly important whenmodeling rare events such as medium- and large-diameter pipe ruptures. The workscope did not include a comprehensive uncertainty analysis, however. Instead, the studyincluded a qualitative evaluation of the impact by model and data uncertainties on theoverall insights and results. Also, uncertainty propagation was selectively performed toillustrate the confidence intervals of derived leak and rupture frequencies.
1.4 Report Organization
This report documents the data analysis methodology together with results andinsights of a plant-specific application of derived piping component leak and rupturefrequencies. It is a summary report of a data analysis effort performed over a relativelylong time. The report is divided into eleven chapters and seven appendices as follows:
Chapter 1 Introduction, study conventions and objectives.Chapter 2 Service data on piping failures, description of SKI-PIPE; time-dependent
failure rates; service data specific to Barsebäck-1/2; basic data analysisconsiderations; technical organization of application study.
Chapter 3 Models of piping reliability.

SKI Report 98:30 5
Chapter 4 Description of the Barsebäck-1 Reactor Coolant Pressure Boundarypiping systems and description of the Barsebäck-1 LOCA initiating eventmodel.
Chapter 5 Estimation of ‘baseline’ weld leak and rupture frequencies due toIGSCC. The impact of corrective actions on leak and rupturefrequencies.
Chapter 6 Estimation of ‘baseline’ leak and rupture frequencies in piping susceptibleto thermal fatigue.
Chapter 7 Development of a piping component reliability database for Barsebäck-1and quantification of piping system leak and rupture frequencies.
Chapter 8 Medium and large LOCA frequencies in Barsebäck-1 PSA.Chapter 9 Results & insights including a discussion of the sensitivity and uncertainty
analysis results. Review of technical issues in piping reliability parameterestimation.
Chapter 10 Conclusions and recommendations.Chapter 11 References.
Appendix A Abbreviations, Acronyms & NotationAppendix B Barsebäck-1 RCPB piping component populations.Appendix C SKI-PIPE - database content as of 12/31/98.Appendix D Database Structures - PSA_VER2 and SKI-PIPE.Appendix E Vibration-fatigue in small-diameter piping.Appendix F Note on the potential for flow-assisted corrosion (FAC) in RCPB Piping.Appendix G Note on the statistical analysis of censored data. Hazard plots for a
selection of piping systems.
Numerous MS-Excel spreadsheets, spreadsheet programs and MS-Accessdatabases were developed to facilitate the plant-specific application of service data onpiping failures. These spreadsheets, spreadsheet programs and databases are notincluded in the report. All charts and tables displaying service data were based onqueries in the archived version of SKI-PIPE. The ‘model’ of the Barsebäck-1 RCPBpiping (PSA_VER2) is proprietary to the plant operator, BKAB (a division of Sydkraft),and therefore not included with the report.

SKI Report 98:30 6
2. Data on Piping Failures
Section 2 presents the piping failure database with data interpretation guidelines.Approximately 50% of the failures in SKI-PIPE apply to piping in BWR units. ThisBWR-specific service experience includes documented evidence of about 1400 pipingfailures in BWR plants worldwide. The database content influenced the approach to dataanalysis.
2.1 Summary of the BWR-Specific Failure Data
As documented in SKI-PIPE, the overall service experience with piping systems inlight water reactors is summarized in Table 2-1. The data are organized according totypes of degradation and failure mechanisms and pipe size. Next, Figures 2-2 and 2-3show the BWR-specific database content.
Table 2-1: Summary of SKI-PIPE (Version 98:4) - BWR & PWR Data.
Failure Mechanism ≤≤ DN50 > DN50
I.D. Description Type of Failure Type of Failure
All Crack Leak Rupture All Crack Leak Rupture
SC Stress Corrosion Cracking 152 20 132 0 794 587 207 0
TF Thermal Fatigue 36 7 27 2 63 31 32 0
E-C Erosion-Cavitation 3 0 3 0 7 0 7 0
CF Corrosion-Fatigue 9 0 9 0 11 4 7 0
E/C Erosion / Flow AcceleratedCorrosion
208 2 193 13 236 11 180 45
COR Corrosion Attack / MIC 84 1 80 3 80 3 74 3
VF Vibration Fatigue 670 14 592 65 96 6 85 5
D&C Design & ConstructionDefects
148 2 140 6 68 5 61 2
WH Water Hammer 71 7 47 17 89 14 31 44
HEc Human Error 45 0 44 1 16 0 15 1
UNR Unreported Cause 103 0 102 1 86 0 83 3
All Mechanisms 1530 53 1369 108 1546 661 782 103
All failure data in Table 2-1 are for piping components external to the reactorpressure vessel (RPV). Also, the database is limited to events involving damage topiping components in the through-wall direction of base or weld metal. For welds thedatabase is limited to failures of ‘Type 1’ per Figure 2-1.

SKI Report 98:30 7
Crack - UT indication confirmed by destructive testing or second party NDE - Repair by weld overlay or replacement
Leak - Detection during routine power operation (e.g., via TV camera in drywell or leak detection system) - Replacement of failed weld component
Pinhole (P/H) leak - Detected during ISI (e.g., upon completion of IHSI) as water seepage - Replacement of failed weld component
Type 1a
Type 2
Type 1.b
Type 1c
IGSCC / TGSCC Crack indication- No independent verification of presence of IGSCC/TGSCC- No weld repair
Figure 2-1: Failure Definitions Based on Manifestations of IGSCC & TGSCC.
Specifically, the definitions in Figure 2-1 apply to welds susceptible to IGSCC inBWR operating environments. Often, weld cracks originate in the transgranular modeand propagate in the intergranular mode.
In Figure 2-2 the service data on cracks, leaks and ruptures are differentiated byplant type (BWRs and PWRs) and by year of commercial operation. The piping failuresare strongly time-dependent, showing a decline after the first 10 to 15 years ofoperation. The population of operating PWR plants is about twice that of BWRs.
0
50
100
150
200
250
300
350
1 2 3 4 5 6 7 8 9 10 11 12 13 14 15 16 17 18 19 20 21 22 23 24 25 26 27 28 29 30 31 32 33 34
Year(s) of Commercial Operation
Num
ber
of P
ipin
gF
ailu
re E
vent
s
All
BWR
PWR
Figure 2-2: Piping Failures in BWR & PWR Plants by Year of Operation.
Figure 2-3 (page 8) shows service data specific to ASME Class 1, 2 and 3 pipingsystems in BWR plants. The data are organized in two groups: (1) Small-diameterpiping failures by year of operation; and (2) Medium- to large diameter piping failures byyear of operation. Again, this data summary emphasizes the strong time dependency ofpiping failures. For medium- to large-diameter piping, a sharp decline occurs after the13th year of operation. Figures 2-4 through 2-6 summarize the worldwide BWR-specific

SKI Report 98:30 8
service experience with piping susceptible to flow-assisted corrosion (FAC), IGSCC andvibration-fatigue, respectively. The vibration-fatigue data almost exclusively relates tofailures in small-diameter piping such as instrument lines, drain lines, sample lines andvent lines. The number of operating BWR units is not constant for each year. In Figures2-4 through 2-6 the number of failures is scaled according to the number of operatingplants for each year.
0
20
40
60
80
100
120
1 2 3 4 5 6 7 8 9 10 11 12 13 14 15 16 17 18 19 20 21 22 23 24 25 26 27 28 29 30 31 32 33 34
Year(s) of Commercial Operation
Num
ber
of P
ipin
gF
ailu
re E
vent
s
≤ ∅50
> ∅50
Figure 2-3: Piping Failures in BWR Plants by Pipe Size and Year of Operation.
0
0.05
0.1
0.15
0.2
0.25
0.3
0.35
0.4
0.45
0.5
1970
1972
1974
1976
1978
1980
1982
1984
1986
1988
1990
1992
1994
1996
1998
Num
ber
of F
AC
Eve
nts
/ BW
R U
nit
Figure 2-4: Flow-Assisted Corrosion in BWR Units Worldwide.
SKI Report 98:30 9
0
0.5
1
1.5
2
2.5
3
3.5
1970
1971
1972
1973
1974
1975
1976
1977
1978
1979
1980
1981
1982
1983
1984
1985
1986
1987
1988
1989
1990
1991
1992
1993
1994
1995
1996
1997
1998
No.
IGS
CC
Eve
nts
P
er B
WR
Uni
t
Figure 2-5: IGSCC in BWR Units Worldwide.
0
0.1
0.2
0.3
0.4
0.5
0.6
0.7
1970
1972
1974
1976
1978
1980
1982
1984
1986
1988
1990
1992
1994
1996
1998
Num
ber
of V
ibra
tion-
Fat
igue
Eve
nts
/ BW
R U
nit
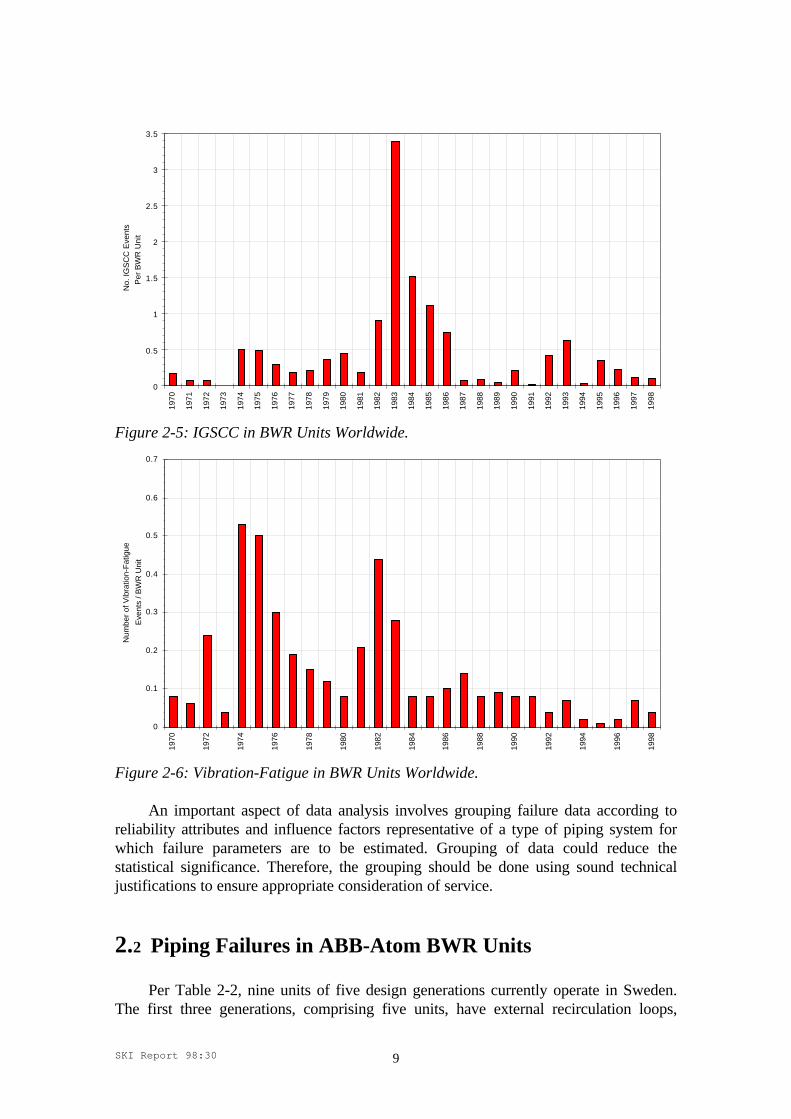
Figure 2-6: Vibration-Fatigue in BWR Units Worldwide.
An important aspect of data analysis involves grouping failure data according toreliability attributes and influence factors representative of a type of piping system forwhich failure parameters are to be estimated. Grouping of data could reduce thestatistical significance. Therefore, the grouping should be done using sound technicaljustifications to ensure appropriate consideration of service.
2.2 Piping Failures in ABB-Atom BWR Units
Per Table 2-2, nine units of five design generations currently operate in Sweden.The first three generations, comprising five units, have external recirculation loops,

SKI Report 98:30 10
while the BWR-4 and 5 units have internal recirculation pumps without large-diameterpiping connected to the reactor pressure vessel below top-of-active fuel (TAF).
Table 2-2: ABB-Atom BWR Design Generations.
UnitDesign
Generation Main Technical Design FeaturesOskarshamn-1 BWR-1 External recirculation loops. Only unit with internal feedwater
riser pipes. Diversification by auxiliary condenser. Fine-motioncontrol rods, diversified shutdown system.
Ringhals-1 BWR-2 Similar to BWR-1 but improved physical separation of theelectrical systems. Diversification by steam-driven emergencycore cooling and auxiliary feedwater pumps.
Barsebäck-1/2Oskarshamn-2
BWR-3 Stronger requirements on physical separation of the safetysystems. Full two-train electrical separation. Improved electricalsupply reliability instead of diversification.
Forsmark-1/2 BWR-4 Full four-train electrical separation. Internal recirculationpumps; no external recirculation piping. Pipe-whip restraints.
Forsmark-3Oskarshamn-3
BWR-5 Complete physical separation of safety systems. Internalrecirculation pumps. Consideration of seismic safety.
Figure 2-7 summarizes service data on piping failures in ABB-Atom units(including the two BWR-4 units in Finland; TVO-1/2). The time-dependent failuretrends differ from the industry-wide data shown in Figures 2-2 and 2-3. The shape of thefailure trends and its impact on parameter estimation will be addressed in more detail inChapters 5 through 7.
0
5
10
15
20
25
30
1 2 3 4 5 6 7 8 9 10 11 12 13 14 15 16 17 18 19 20 21 22 23 24 25 26 27 28
Year(s) of Commercial Operation
Tot
al N
umbe
r of
Pip
ing
Fai
lure
Eve
nts
ABB-Atom (All Units)
Barsebäck-1 / 2
Figure 2-7: Piping Failures in ABB-Atom Plants by Year of Operation.
In-service inspection (ISI) during the cold shutdown plant state is the main methodof detecting failures in medium- and large-diameter Class 1 and 2 piping. In part, thetime-dependent piping failures reflect inspection practices as much as the impact ofcorrective actions on susceptibilities to degradation and failure mechanisms. Further, asmuch as the patterns and trends in Figure 2-7 reflect the ABB-Atom plant-specific

SKI Report 98:30 11
piping reliability they also reflect the Nordic regulatory domains and the ISI programplans as implemented by the plant operators.
During the mid to late 1980’s, the RCPB portions of the residual heat removalsystems of TVO-1 and 2 were replaced with piping of nuclear grade material.Oskarshamn-1, the oldest unit, was in an extended outage during 1993-95. The outagework included modifications to the emergency core cooling system and partialreplacement of RCPB piping, welds and nozzles.
The 1997 annual refueling and maintenance outage of Ringhals-1 included thereplacement of the RCPB-portion of the residual heat removal system piping. The newpiping material is of low carbon content austenitic stainless steel. Also, the workincluded the replacement of a total of 81 nozzles belonging to the six external mainrecirculation loops. The 1998 annual refueling and maintenance outage of Barsebäck-2included replacing the RCPB-portion of the residual heat removal piping with nucleargrade austenitic stainless steel. Use of pre-formed piping sections reduced the weldcount.
In Figure 2-8, the service data on piping systems in ABB-Atom plants areorganized in two groups: (1) Small-diameter piping failures by year of operation; and (2)Medium- to large diameter piping failures by year of operation.
0
2
4
6
8
10
12
14
16
18
20
1 2 3 4 5 6 7 8 9 10 11 12 13 14 15 16 17 18 19 20 21 22 23 24 25 26 27 28
Year(s) of Commercial Operation
Tot
al N
umbe
r of
Pip
ing
Fai
lure
Eve
nts
ABB-Atom (all) <= DN50
ABB-Atom (all) > DN50
Barsebäck-1 / 2 <= DN50
Barsebäck-1 / 2 > DN50
Figure 2-8: Piping Failures in ABB-Atom Plants by Pipe Size and Year of Operation.
For each failure record in SKI-PIPE detailed information on root causes, operatingconditions, material, crack morphology, etc. is given by the sixty-one data fields in thedatabase (Appendix D). Many of the data fields are filters for database queriesperformed to group the data according to reliability attributes and influence factors.

SKI Report 98:30 12
2.3 Data Interpretation Guidelines
Failures of piping system components are location dependent. This means thatcracks, leaks or ruptures occur at the weakest points in piping systems. Examples offailure locations include bends or elbows thinned to the point of rupture due to flow-assisted corrosion, and welds cracked by stress corrosion mechanisms. An essential stepin data analysis involves organizing the failure data according to reliability attributes andinfluence factors. Justifications for prior distributions and likelihood functions rest ondata interpretations that acknowledge the why-where-how of occurred failure events.Evaluations of degradation and failure mechanisms determine the piping componentboundary, which in turn determine the form of the failure rate estimators. The dimensionof failure frequency could be failure per weld and hour, or failure per piping section andhour. A basic expression for calculating failure frequency is:
fFAILURE = (Number of Failures) / (Time × Extension)(2.1)
where ‘Extension’ = Component boundary; e.g., number of welds as defined by a<attribute-influence> set.
In Equation (2.1), the value of the numerator is a function of the database coverageand completeness, which entails capturing all relevant failure events. Accurate eventclassifications and descriptions enable database queries producing accurate failure eventcounts. The denominator is a function of the completeness of the piping system designinformation. It asks for information on the component population of a specific attribute(e.g., material, diameter) known to be susceptible to an influence (e.g., IGSCC). Thisbasic failure frequency estimator requires information on component populations andplant populations (i.e., BWR units having a system representative of a selectedattribute). Figure 2-9 shows the number of BWR units covered in SKI-PIPE.
0
10
20
30
40
50
60
70
80
90
100
1 2 3 4 5 6 7 8 9 10 11 12 13 14 15 16 17 18 19 20 21 22 23 24 25 26 27 28 29
Year(s) of Commercial Operation
Num
ber
of O
pera
ting
BW
R U
nits
BWR - All
BWR - Ext. Recirc. Loops

SKI Report 98:30 13
Figure 2-9: The BWR Population by Year of Commercial Operation.

SKI Report 98:30 14
Both the numerators and denominators used in calculating failure frequencies areattribute-sensitive parameters and therefore sources of statistical uncertainties. Asindicated by Figure 2-9, not all BWR units have external (to the reactor pressure vessel)recirculation loops. Hence, the denominator should account for plants with externalloops when calculating main recirculation weld failure frequencies.
Optimum utilization of a failure event database follows on having a well-definedanalysis objective. The database contains no rupture events in medium- to large-diameterClass 1 and 2 BWR pipes. Consequently, the ways of interpreting and grouping incipientand degraded failure events influence the parameter estimates.
The database includes information on incipient and degraded failures; from shallowcracks to through-wall cracks (TWCs). For a TWC to become unstable and possiblyrupture, at least 40% of the inside pipe circumference must be cracked (Figure 2-7) at adepth of 100% through-wall or 100% of the inside circumference at a depth of 70%through-wall. Of the data records on IGSCC-induced weld failures, 490 records (circa65% of total data-base content) include crack sizing data (crack depth and/or cracklength). Most of the events fall below, at or slightly above the ‘Repair Criteria’ limit line.A selection of actual data from SKI-PIPE are included in Figure 2-10. None of theevents in the database were determined to lie above the ‘Collapse’ limit line.
0.00
0.10
0.20
0.30
0.40
0.50
0.60
0.70
0.80
0.90
1.00
0.00 0.20 0.40 0.60 0.80 1.00
l/IDCrack Length / ID
a/t
Cra
ck D
epth
/ W
all T
hick
ness
a/t (Actual Data)
Collapse Line
Repair Line
Figure 2-10: Criteria for Classifying ISI Results - Typical Interpretations.
Given the nature of the piping failure data, the statistical parameter estimationbegins by defining failure mode criteria. The parameter estimation includes the followinganalysis steps:
1. Develop a model of piping reliability (see Chapter 3, page 21)

SKI Report 98:30 15
2. Define the failure mode (crack, P/H-leak or leak). Depending on the intendedapplication, it could be the combination of all modes or ‘leak’ only in the case ofrupture frequency estimation supporting the modeling of LOCA events.
3. Define prior distribution (e.g., informative versus noninformative prior, or
empirical Bayes). The choice of prior should reflect the piping reliability state-of-knowledge.
4. Determination of population data (i.e., total number of welds).
In this study, the approach to calculating the conditional probability of rupturegiven weld failure uses the Jeffrey’s noninformative prior distribution. The updating ofthis distribution uses the number of occurred cracks, pinhole leaks and leaks forspecified sets of attributes and influence factors. Each event occurrence is assumed to bea function of the thermal transient history of respective plant. Figure 2-11 displaysexamples of conditional rupture probabilities for IGSCC-susceptible welds.
1.00E-03
1.00E-02
1.00E-01
≤ ∅ 50 50 < ∅ ≤ 100 100 < ∅ ≤ 250 ∅ > 250
Nominal Diameter [mm]
pR
|F
Jeffrey's rule: Noniniformative; all dataJeffrey's rule: Noninformative; leaks onlyBeta:Informative prior; all data; mean = 0.1Beta:Informative prior; leaks only; mean = 0.1Beta:Informative prior; all data, mean = 2.5/DN (Beliczey, 1995)
Figure 2-11: Conditional Probability of Rupture Given Weld Failure Due to IGSCC.3
A source of uncertainty as well as debate, the definition of prior distributionsaffects the numerical results. A good overview of practical aspects of Bayesian statisticsis found in a recent paper by Siu and Kelly (1998). As indicated in Figure 2-11, thisstudy addressed the topic of defining an appropriate prior through a limited sensitivityanalysis using two different distributions. The choice of prior distribution is less criticalthan the data interpretation approach, however. As shown, the conditional ruptureprobabilities become insensitive to pipe size when using leak data only.
In the opinion of the author of this report, the conditional rupture probability isstrongly dependent on the combination of reliability attributes and influence factors.Conversely, a derived conditional rupture probability should reflect a unique 3 Chapter 5 documents the basis for how the chart was generated.

SKI Report 98:30 16
combination of piping diameter and material as well as unique degradation/failuremechanism. Again, this technical opinion points to the importance of having a databaseof sufficient depth (i.e., coverage and completeness). As an example, for IGSCC-susceptible piping very few at-power leaks exist in the database. Mostly, the P/H-leakswere induced by ISI-preparations (e.g., pipe surface preparations through grinding) orstress improvement treatment processes (e.g., induction heat stress improvement, IHSI).Unrealistically high conditional rupture probabilities would result if only the at-powerleak events were to be used in the calculations. Chapter 5 includes more details on theestimation of conditional rupture probabilities.
As the database development process matures, more research should be directed tothe methods and techniques for statistical analysis of piping failure data. In the absenceof a scientifically developed basis for data interpretation and analysis, this applicationstudy used the Jeffrey’s noninformative prior throughout to facilitate parameterestimation. The conditional rupture probabilities as shown in Figure 2-11 built on datainterpretation. By contrast, Figure 2-12 shows results from a recent fracture mechanicsevaluation (Rahman et al, 1995) of recirculation system piping in a General Electricboiling water reactor.
1.00E-14
1.00E-12
1.00E-10
1.00E-08
1.00E-06
1.00E-04
1.00E-02
1.00E+00
0.001 0.01 0.1 1 10
Leak Rate [kg/s]
p R|L
DN250 weld in recirculation riser
DN250 recirculation riser - base metal
Figure 2-12: Conditional Rupture Probability According to Fracture Mechanics.
The largest IGSCC-induced leak rate recorded in SKI-PIPE is for the U.S. plantDuane Arnold. On June 17, 19784, a containment entry was made to identify a primarysystem leakage which had existed for about three days. The leak rate was determined tobe approximately 0.2 kg/s coming from a through-wall crack in a DN250 safe-end weld.In February 1980, the Spanish plant Santa Maria de Garona experienced a 0.05 kg/sleakage due to IGSCC damage in recirculation system piping. 4 The event was reported to the U.S. Regulatory Commission in LER 50-331/78-030.

SKI Report 98:30 16
2.4 Organization of the Application Study
The data parameter estimation needs (c.f. Equation 2.1, page 12) and datainterpretation guidelines determined how the technical work was organized. First, adetailed review of isometric drawings, and fabrication and material data provided thenecessary design information on the RCPB piping systems. This evaluation produced anextensive database (in MS-Access) containing reliability attribute data for each of thecirca 4,000 piping components comprising the ten Barsebäck-1 RCPB piping systems.Second, reviews of the industry-wide and plant specific service data applicable to the tensystems provided the reliability influence factors used to create queries in SKI-PIPE aswell as a basis for grouping of failure data. Finally, the attribute and influence data werepooled to facilitate the calculation of leak and rupture frequencies. The total work scopewas accomplished in five steps as described below (and Figure 2-13).
Steps 1 & 2:Chapter 4
+Appendices A & E
Step 3: Chapters 5 & 6
Chapters 7 & 8Step 4:
Chapter 9Step 5:
Barseback-1 RCPB Piping Design &Service Experience
Leak & Rupture Frequency Due toIGSCC/TGSCC & Thermal Fatigue
Barseback-1 Piping System RuptureFrequency & LOCA Frequency
Results & Insights
Figure 2-13: Guide to SKI Report 98:30.
Step 1 involved an independent review of the database on all RCPB piping systemcomponents. The PSA_VER1.mdb was originally prepared by BKAB personnel during1997 (Åström, 1997). In its initial form, the database addressed both Units 1 and 2 atBarsebäck. At the conclusion of the pilot project a new database, specific to Unit 1 hadbeen created, consisting of close to 4,000 data records on bends, pipe, welds and tees(Figure 2-14).
The enhanced database (PSA_VER2.mdb), includes information on weld locations,piping components (bends, elbows, pipes, tees), elevations (above and below top-of-active-fuel), ISI histories, material data, results of the degradation/failure mechanismevaluations, and leak and rupture frequencies. Described in Chapter 4, this databaserepresents the model of the RCPB piping systems used to derive LOCA initiating eventfrequencies.
As formulated in a paper by Fleming and Gosselin (1997a) on piping failure, theservice experience shows that piping failures result from degradation mechanisms andloading conditions not anticipated in the original piping design. Since the likelihood of afailure is strongly dependent upon presence of an active degradation mechanism, thedata on the service experience support direct estimation of the probability of piperupture. This premise lead to the formulation of Step 2

SKI Report 98:30 17
B1 RCPB Piping Components Population Data (3991 Entries)
Service ExperienceWith ASME Class 1/2/3 piping in NPPs Worldwide (1970-1998)
SKI-PIPE.mdb(MS-Access 7.0)
SKI/RA
PSA_VER1.mdb(MS-Access 2.0)
BKAB
B1/B2 RCPB Piping Components Population Data (6004 Entries)
Review+
DegradationEvaluations
PSA_VER2.mdb(MS-Access 7.0)
SKI Report 98:30
Figure 2-14: The Databases of the R&D Project.
In Step 2, the piping components in PSA_VER2.mdb were evaluated by comparingactual piping design (material, pipe size, component type) and operating conditions toservice experience with piping of equivalent attributes. System descriptions includedcurrent information on material compositions, known degradation and failuremechanisms, and summaries of piping replacements due to occurred cracks and leaks.Extensive use was made of the information in SKI-PIPE.mdb, supplemented by recenttopical reports on degradation and failure mechanisms; e.g., fatigue (Mehta andGosselin, 1995), thermal fatigue (Su, 1990; Stevens, 1998), water hammer (Van Duyne,Yow and Sabin, 1992; Griffith, 1997). Table 2-3 summarizes main features of the tenRCPB piping systems subjected to degradation evaluation.
Table 2-3.1: Barsebäck-1 RCPB Piping Systems.
SystemConnecting
SystemsKnown Degradation
Mechanisms MaterialSusceptibleComponent5
311Main steam
(MS)
314, 316 IGSCC/TGSCC,corrosion, FAC, vibration-fatigue, severe overloading
Carbon steel (CS)(St 45.9/III)
Bends; Welds
312Main
feedwater
321, 327 IGSCC, thermal fatigue Mainly stainlesssteel (SS)
Pipes; Tees;Welds
313Reactor
Recirculation
211, 321, 326,352
IGSCC, weldembrittlement
SS-clad CS,venturi pipes in
austenitic SS, buttrings in Inconel
182
Welds
314MS pressure
relief
311, 316 TGSCC, corrosion in lineswith stagnant condensate,
weld embrittlement,vibration-fatigue
Valve impulselines in SS, relief
lines leading to thesuppression pool in
galvanized CS
Bends; Pipes;Welds
Table 2-3.2: Barsebäck-1 RCPB Piping Systems. 5 Susceptibility to degradation and/or failure mechanism. Based on actual occurrences in Barsebäck-1and generic insights from the piping failure database.

SKI Report 98:30 18
SystemConnecting
SystemsKnown Degradation
Mechanisms MaterialSusceptibleComponent6
321Residual heat
removal
313, 327 IGSCC, thermal fatigue Mainly SS Bends; Welds
323ECCS
213 IGSCC, weldembrittlement, vibration-
fatigue
Austenitic SS Bends; Welds
326RPV head
spray
313 IGSCC, weldembrittlement, vibration-
fatigue
Austenitic SS Bends; Welds
327Aux. Feed
312, 321 IGSCC, vibration-fatigueof small-diameter piping
Austenitic SS Bends; Welds
351SLCS
213, 352 IGSCC, B/A-CC,vibration-fatigue of small-
diameter piping
Austenitic SS Bends; Pipes;Welds
354 211, 221, 316 IGSCC, vibration-fatigue Austenitic SS Bends; Welds
The active degradation mechanisms result from combinations of designcharacteristics, environment, service conditions, and operating environments. While theirpresence cannot be eliminated with absolute certainty, the negative effects can beminimized through the implementation of appropriate measures. Step 2 acknowledgedthe following attribute and influence factors:
• Design Characteristics. Design characteristics include material composition, pipediameter and wall thickness, component type. The design characteristics varybetween systems and can occasionally vary within a system.
• Fabrication Practices. These practices include material selection, weld filler
material, heat treatment, forming method, bending method. • Operating Conditions. The operating conditions determine the internal and
external environments that impact material degradation. These include operatingtemperatures and pressures, fluid conditions (stagnant, laminar, turbulent flow),quality of process medium (primary water, raw water, dry steam, wet steam),chemical control, service environment (humidity, radiation, etc.).
• Service Experience. The operating experience with a particular piping system
provide confirmation that damage mechanisms identified for a specific location areappropriate and complete.
Step 3 consisted of organizing, evaluating and analyzing the failure data accordingto the attributes and influence factors as identified in Step 2. Established methods ofreliability life data analysis were used; see Table 2-4. The estimation of piping reliabilityparameters especially considered the development of hazard functions by recognizingthe partial and complete failures (i.e., the penetration of pipe wall by growth-type 6 Susceptibility to degradation and/or failure mechanism. Based on actual occurrences in Barsebäck-1and generic insights from the piping failure database.

SKI Report 98:30 19
degradation mechanisms), renewals by repair or replacement, as well as non-failures.While some plants have experienced incipient, degraded and complete failures, manyplants have operated for long periods without any failures.
Table 2-4: The Main Steps of Analyzing Service Data on Piping.Activity Objective Comment
1 Organize the service data by attribute &influence factor(s). Ensure mutuallyexclusive groups of data.
SKI-PIPE includes service data on a wide range ofplant designs and piping systems. The service datamust be organized to reflect a specific application.
2 Define failure criterion; develop/applya physical model of failure (e.g., crackpropagation law).
A failure criterion is necessary to ensureconsisted data interpretations and data poolingstrategies
3 Determine the total number of‘failures’ for the specific combinationof attribute & influence.
Unless Activity 2 & 3 are performed consistently,the parameter estimates could be overlyconservative.
4 Determine the total time in service forcomponent boundary of choice.
Very important, and time consuming activity.Requires detailed knowledge of piping systemdesign.
5 Estimate the reliability parameters The quality of the estimate(s) is a function of theefforts expended on Activity 1 through 4.
Any variability in estimated leak and rupture frequencies could be related to thequality of the database development effort as well as the method of estimation. Datacompleteness becomes particularly important when analyzing rare event data. Once theinitial hurdle of establishing a database has been overcome, the parameter estimation canbe streamlined and simplified. As in all reliability data work, the analyst responsible foranalyzing the service data must be intimately familiar with the nature of the degradationor failure mechanisms, failure modes, and piping designs. In part, the required level offamiliarity is obtained by reviewing service data and root cause analysis reports. In part,the familiarity is obtained via degradation evaluations as in Step 2.
Step 4 consisted of quantifying piping system leak and rupture frequencies, andultimately LOCA initiating event frequencies using the component-level frequencies inStep 3. The following LOCA initiating events were quantified:
• Medium LOCA (S1); distinction between LOCA above or below top-of-active fuel(TAF).
• Large LOCA (A); distinction between LOCA above or below TAF. • Medium LOCA (S1); above or below TAF and with requirement for back-flush
operations due to dynamic effects resulting in stripped pipe insulation materialclogging the containment sump ECCS strainers.
• Large LOCA (A); above or below TAF and with requirement for back-flush
operations due to dynamic effects resulting in stripped pipe insulation material.

SKI Report 98:30 20
• Large LOCA (A); above or below TAF and with dynamic effects from severanceof adjacent small- and medium-size piping due pipe whip. The potentialconsequences of severed small- and medium-size piping could be loss of reactorvessel level indication system, loss of containment spray function, or loss of ordegraded core spray function.
In the final Step 5 the interpretation of the results included performing sensitivityand selected uncertainty analysis. Due to the nature of the failure data, reliabilityparameter estimation involves a series of assumptions. Each of these assumptions couldhave a large or small impact on results. The impact of changing the assumptions in Step3 were addressed by re-quantifying the LOCA model. Finally, the statistical uncertaintyin predicted results was qualitatively addressed by identifying the sources of data andmodeling uncertainty.

SKI Report 98:30 21
3. Models of Piping Reliability
This chapter presents ‘data-influenced’ models of piping reliability thatacknowledge different degradation and failure mechanisms. These models reflect thedata collection process and the classification of failure events. Except implicitly, themodels do not account for crack growth or other complex physical phenomena. Theirapplication assumes access to a large body of observational data on piping failures. Ananalytical challenge involves the consistent interpretation of service data per theguidelines in Chapter 2.
3.1 Basic Models & Classification of Pipe Failures
A framework for analyzing service data and calculating piping leak and rupturefrequencies was presented in SKI Report 97:26. According to the analysis framework,evaluations of service data should be done on the basis of reliability attributes andinfluence factors. Depending on specific attributes of piping (size, material, materialcomposition, method of fabrication), a piping system could be more or less susceptibleto degradation or failure mechanisms (i.e., different influences). Using service data alonefor estimating leak and rupture frequencies, three simple models of piping reliability are:
(1) Active Degradation MechanismExamples include flow accelerated corrosion (FAC), stress corrosion cracking(e.g., IGSCC, TGSCC), thermal fatigue.Freq.{Rupture} = Freq.{Failure} x Prob.{RuptureFailure}
(2) No Active Degradation MechanismMainly affecting small-diameter piping, a typical failure mechanism includesvibration-fatigue.Freq. {Rupture} is developed directly from rupture data.
(3) Piping Which Is Susceptible to Water HammerFreq.{Rupture} = Freq.{Water Hammer} x Prob.{RuptureWater Hammer}
Within any given piping system, individual piping sections could be susceptible todegradation mechanisms or failure mechanisms or water hammer. The known orpotential degradation or failure susceptibilities must be determined prior to organizingand interpreting a database content. Such determination requires reviewing full textevent reports and root cause evaluation reports. In other words, the piping failuredatabase must include enough information to support good data pooling strategies.
It is seldom straightforward to identify underlying causes of an event. For example,pipe ruptures due to water hammer could occur due to combinations of aggressive flowaccelerated corrosion, lack of in-service inspection, poor system operating proceduresand/or inadequate piping system design. Before pursuing parameter estimation, a

SKI Report 98:30 22
systematic degradation mechanism evaluation determines the types of degradationand/or failure mechanisms to consider when organizing and interpreting service data.The symbolic Equation (3.1) gives the frequency of pipe rupture for a general pipingsystem, consisting of piping components of different size and material and susceptible todifferent degradation and failure mechanisms:
FR{System} = 38j(D)njPj{R*D} + 38k(R ) + 38l(WH)nlPl{R*WH} 3.1)
FR{System} = Frequency of pipe rupture;8j(D) = Failure rate per component (e.g., weld, foot of piping, bend, tee)
for all degradation mechanisms in category ‘j’;8k(R) = Rupture rate per component for all failure mechanisms in category
‘k’ piping;nj = Number of components in category ‘j’;8l(WH) = Frequency of water hammer in category ‘l’ piping;nl = Number of components in category ‘l’;Pj{R|F} = Probability of rupture given failure of component in category ‘j’
piping;Pl{R|WH} = Probability of rupture given water hammer in category ‘l’ piping.D = Number of piping degradations; e.g., crack in through-wall
direction, leak or rupture;R = Number of ruptures;WH = Number of water hammer events.
According to Equation (3.1), determining piping system rupture frequency isreduced to estimating piping component leak and rupture frequencies from observationaldata. The coverage and completeness of the piping failure database and the accuracy ofthe degradation mechanism evaluation determine the quality of the rupture frequencyestimate. Before application, some specialization of Equation (3.1) may be required.
As an example, for IGSCC-susceptible piping the likelihood of weld failuredepends on the location the weld in a piping system. As derived from piping failure data,this weld location dependency is shown in Figure 3-1. For a given reliability attribute(e.g., pipe size and material), and if IGSCC is determined to be a predominantdegradation mechanism, the frequency of piping system failure should be determined bythe frequency of weld failure per symbolic Equation (3.2):
FD-System= f f f( i j( ) ( ) ,.., )Weld Weld Weldi
m
j
n
kk
r
= = =∑ + ∑ + + ∑
1 1 1(3.2)
That is, the failure frequency is a function of the contributions from weld failures oftype ‘i’, ‘j’,…. , ‘k’. Index ‘D’ in FD-System stands for degradation by IGSCC in the example.This study defines ‘weld type’ as a characteristic according to the location of a weld inpiping; e.g., elbow-to-pipe weld, pipe-to-pipe weld. Figure 3-1 represents the full rangeof medium- and large diameter stainless steel piping systems. An intrinsic assumptionbehind symbolic Equation (3.2) is that there is a direct relationship between the achievedquality of welding and the location of a weld in the piping. Some locations (due to

SKI Report 98:30 23
factors such as piping geometry, accessibility) could be more amenable to adversecombinations of weld sensitization and tensile stresses.
45.8%
13.3%
7.5%
6.2%
6.2%
3.9%
2.6%
2.6%
1.6%
1.5%
1.5%
1.3%
1.3%
0.0% 5.0% 10.0% 15.0% 20.0% 25.0% 30.0% 35.0% 40.0% 45.0% 50.0%
Bend/elbow-to-pipe
Pipe-to-pipe
Pipe-to-valve
Pipe-to-safe-end
Bend/elbow-to-valve
Pipe-to-tee
Pipe-to-pipe-cap
Pipe-to-nozzle
Pipe-to-pump
Pipe-to-flange
Safe-end-to-nozzle
Reducer-to-safe-end
Pipe-to-reducerBased on sample of 308 event reports
The graph shows the percentage of eventreports in database containing information on
exact location of failed weld.
Figure 3-1: Location-Dependency of Weld Failure in IGSCC-Susceptible Piping.
Summarized in Figures 3-2 through 3-5 is information on the ‘location-dependency’ of weld failures in different systems. Not only do these data summariesreflect the susceptibilities of different weld locations, but also the actual counts ofdifferent welds in different systems. Additionally, these data summaries reflect the fullrange of plant types in the piping failure database.
52.6%
21.1%
5.3%
5.3%
5.3%
2.6%
2.6%
2.6%
2.6%
0% 10% 20% 30% 40% 50% 60%
Bend-to-pipe
Pipe-to-pipe
Bend-to-bend
Bend-to-valve
Pipe-to-nozzle
Pipe-to-valve
Cap-to-tee
Pipe-to-safe-end
Safe-end-to-nozzle
Figure 3-2. Location Dependency of Weld Failure in Medium-Diameter SafetyInjection Piping.

SKI Report 98:30 24
44%
24%
8%
8%
8%
4%
4%
0% 10% 20% 30% 40% 50% 60%
Bend-to-pipe
Pipe-to-valve
Bend-to-valve
Pipe-to-pipe
Pipe-to-tee
Pipe-to-nozzle
Pipe-to-reducer
Figure 3-3: Location-Dependency of Weld Failure in Medium-Diameter RHR Piping.
45.4%
11.6%
7.4%
6.5%
5.1%
4.2%
3.2%
2.8%
1.9%
0% 10% 20% 30% 40% 50% 60%
Bend-to-pipe
Pipe-to-pipe
Pipe-to-safe-end
Bend-to-valve
Pipe-to-valve
Pipe-to-tee
Pipe-to-cap
Pipe-to-pump
Reducer-safe-end
Figure 3-4: Location-Dependency of Weld Failure in Large-Diameter RCS Piping.
46.1%
18.0%
11.2%
5.6%
3.4%
3.4%
3.4%
2.3%
1.1%
1.1%
0% 10% 20% 30% 40% 50% 60%
Bend-to-pipe
Pipe-to-pipe
Pipe-to-valve
Bend-to-valve
Bend-to-bend
Pipe-to-nozzle
Pipe-to-tee
Pipe-to-reducer
Pipe-to-flange
Pipe-to-safe-end
Figure 3-5: Location-Dependency of Weld Failures in SIR Piping.

SKI Report 98:30 25
Another important example of specialization of Equation (3.1) entails considerationof TGSCC in the base metal of bends in cold worked medium-diameter stainless steelpiping. For a given reliability attribute, and if TGSCC is determined to be a predominantdegradation mechanism, the frequency of piping system failure should be determined bythe frequency of bend failure per symbolic Equation (3.3):
fD-System = f i( )Bendi
m
=∑
1(3.3)
That is, the failure frequency is a function of the contributions from through-wallcracking in base metal of bends. Theoretically, failure propensity of bends in coldworked piping could be a function of bending angle; i.e., 30-degree bend versus, say,90-degree bend. This study did not explore the piping failure database to determine suchcorrelations, however.
3.2 Time-dependence of Crack Growth
Considering historical service data on austenitic stainless steel piping, IGSCC hasbeen a major degradation mechanism in BWRs. Few circumferential cracks have actuallypenetrated the pipe wall, however. Mostly, the cracks have been shallow and attributedto improper welding procedures during initial plant construction. Even in the case ofsignificant cracking, the margin to pipe wall penetration is substantial.
An ‘a/t-ratio’ (crack depth to wall thickness) of 60% or more implies a requirementfor prompt corrective action. Current service experience indicates that below 60% crackdepth, design weld overlay repairs allow continued operation indefinitely. According toan analysis by the New York Power Authority (1990), without corrective action a crackdepth of 60% would be reached after approximately 30,000 hours of plant operation.For a through-wall crack to become unstable it must extend more than 40% of the pipecircumference. Figure 3-6 is an example of estimated crack growth applicable toFitzPatrick Nuclear Power Plant.
Kassir (1985) and Andresen (1998) summarize experimental and actual crackgrowth rates in BWR construction materials. Aaltonen, Saarinen and Simola (1993)demonstrate possible relationships between the TVO-1 transient history and crackpropagation in RHR piping welds. Actual crack growth rates can be determined directlyfrom the extensive crack morphology data in the piping failure database. To facilitatestatistical parameter estimation using the hazard plotting technique (Nelson, 1972), thedata in SKI-PIPE were extrapolated to estimate a fictitious time when a given crackwould penetrate the pipe wall. A linear crack growth rate of 5.0E-9 cm/s was used tocalculate the time of pipe wall penetration.

SKI Report 98:30 26
0
5
10
15
20
25
30
35
0 5000 10000 15000 20000 25000 30000 35000 40000
Service time [hours]
Cra
ck d
epth
[mm
]DN700 Recirculation System Piping (wall thickness = 32.45 mm). Initial crack depth = 10.4 mm (32% TWC) in May 1990.
a/t = 19.5 mm (60% TWC)
Figure 3-6: Crack Growth in DN700 Reactor Recirculation System Piping.7
As an example, assume ISI detected a crack of 80% TWC (a/t = 0.8) in thick-walled, large diameter recirculation piping (35 mm wall thickness) on 1/1/90. The pipewall penetration could occur after approximately 4.4 years given no corrective action.Conversely, an at-power leak could feasibly have occurred around mid-1994 had the ISIfailed to detect this particular flaw. This simplified crack growth extrapolation was usedin this study to evaluate the sensitivity of derived piping failure parameters to thecompleteness of the database. Appendix G includes a selection of hazard plots based oncrack growth extrapolation.
3.3 Time-dependence of Thermal Fatigue Damage
In BWRs, crack growth induced by thermal fatigue could be a function ofoperating cycles involving the injection of hot water from the Reactor Water CleanupSystem into cold main feedwater. The operating practices vary from plant-to-plant.Some plants operate with a continuous cleanup flow while others operate withintermittent flow. It is not possible to derive plant operating profiles from service datacollections, however. Plant service time was selected as the basis for the parameterestimation in this project, and without adjustments for scheduled or unscheduled outages 7 James A. FitzPatrick Nuclear Power Plant, 1990. Summary of Intergranular Stress CorrosionCracking Inspection During 1990 Refueling Outage, JPN-90-041, New York Power Authority, WhitePlains (NY).

SKI Report 98:30 27
4. Brief Description of Barsebäck-1 RCPB Piping
The Sydkraft Group, through its wholly-owned subsidiary Barsebäck Kraft AB(BKAB) operates the two 615 MWe units at Barsebäck. The contract for Barsebäck-1was placed with ABB-Atom in 1969 and commercial operation began in July 1975. Thetwo units at Barsebäck and Oskarshamn-2 are nearly identical BWR-3 units (see Table2-2, page 8). Chapter 4 gives a brief summary of key RCPB piping design features andoperating experience.
4.1 RCPB Piping Design Features
In Barsebäck-1, the major RCPB piping consists of four external recirculationloops (Figure 4-1), four main steam lines and two main feedwater lines (System 312).
Inside the containment, each ofthe two incoming feedwaterlines split into two risers thatconnect to the RPV. Exceptfor the recirculation loops andmain steam lines, the pipingsystems are made of austeniticstainless steel material (averagecarbon content of about0.04%, or slightly above).
The main recirculation loopsare made of duplex material(carbon steel with a stainlesssteel coating). The venturisections of the recirculationloops consists of austeniticstainless steel piping; verticalpipe sections with nozzles forventuris. Butt-welding ringsare Inconel 182 fittings.Welding material between mainloops and venturi pipes isInconel 182. Pump casings andvalves in the recirculationloops are cast austenitic
stainless steel units. The medium- and large-diameter sections of the main steam linesare made of carbon steel, while the small-diameter sections are made of austeniticstainless steel.
Figure 4-1: Recirculation Loop in ABB-AtomBWR-1, 2 & 3.

SKI Report 98:30 28
In connection with repairs and scheduled replacements, sections of the originalRCPB piping have been replaced with piping of low or extra-low carbon content(‘nuclear grade’) stainless steels. Main contractor for the original RCPB piping design,including fabrication, was Mannesmann-Rohrleitungsbau AG (Düsseldorf, Germany).
4.2 Operating Experience
Currently at the mid-point of its expected technical service life, the Unit 1 hasoperated with a capacity factor exceeding 80% for most of its life. Exceptions werecalendar years 1979 and 1992. In 1979 the unit experienced a major turbine-generatorfailure and ensuing turbine building fire (Sydkraft, 1985). In 1992 the unit was shutdownfor modifications of the emergency core and containment spray systems following theJuly 28, 1992 incident at Unit 2 when a rupture disc at the outlet of a safety relief valveinadvertently opened (OECD-NEA, 1996). That incident revealed a weakness in thedefense-in-depth, which under another set of circumstances could have led to theemergency core cooling system failing to provide water to the core.
Like other BWRs worldwide, the units at Barsebäck have been affected by stresscorrosion cracking (IGSCC) damage in the stainless steel piping (mainly the ECCS andRHR piping). Unit 1 has operated with intermittent hydrogen water chemistry (HWC)since April 1991. For about four months in early 1992 the unit operated without anyhydrogen injection. After that period the unit has operated with HWC for 70-90% of thetime. The most recent IGSCC occurrence was discovered during the 1997 annualrefueling outage when inspecting the RPV Head Spray piping. During the 1996 annualrefueling outage, IGSCC was detected in ten different locations of the residual heatremoval piping.
Early indications of a thermal fatigue cracking problem generic to ABB-Atomplants were identified during 1978 in Barsebäck-1 and Oskarshamn-2, respectively. Bothunits experienced thermal fatigue in base metal of piping close to a RWCU/RHR branchconnection. In 1979, a significant thermal fatigue incident occurred in TVO-1 (BWR-4per Table 2-2, page 8) when a DN150 tee in the RWCU System8 fractured (Holmbergand Pyy, 1993). That event resulted in the release of about 5,000 kg of reactor water inthe reactor building. The pipe fracture area was approximately 2.3 cm2 (maximum 150mm long and 2 mm wide fracture).
The 1980 ISI-program for Barsebäck-2 was implemented in response to IGSCC-concerns. Liquid penetrant and gamma radiography examinations were carried outexternally but gave no positive indications of possible defects in the stainless steel basematerial close to the Main Feedwater and Residual Heat Removal branch connections.Sections of the branch connections were removed. This revealed visible cracks on theinside of the pipe sections even before cleaning. Using liquid penetrant, and aftercleaning, reveled more extensive cracking similar in appearance to a spider’s web. Thatdiscovery led to an investigation of each similar branch in Barsebäck-1, Oskarshamn-2, 8 The RWCU System is not part of the RCPB in the ABB-Atom designed BWR units.

SKI Report 98:30 29
Ringhals-1 and Forsmark-1 (which at the time was in the final stages of startup). ExceptForsmark-1, all inspected units exhibited thermal fatigue cracks.
During a shiftly walk-down in Oskarshamn-1 in 1979, plant personnel detected asmall leak in a DN100 bend in the residual heat removal piping system. The leak wasdetermined to be caused by the combination of TGSCC and IGSCC in the cold workedpipe section. The metallographic evaluations revealed extremely high cold deformationin the affected area, and 8-12% martensite was measured. During the fall/winter 1979-80, additional through-wall cracks and leaks were detected in bends in the RWCUsystem piping in Oskarshamn-1. Later it was revealed that the particular pipe bendingmachine used in fabricating the RHR and RWCU piping for Oskarshamn-1 also had beenused to fabricate corresponding piping at Barsebäck-1/2 and Ringhals-1. Specifically forBarsebäck-1, the piping failure database does not include any records involvingTGSCC/IGSCC in base metal, however.
4.3 RCPB Piping Design Database
Development of piping leak and rupture frequencies representative of a specificplant design generation requires access to accurate and complete information onreliability attributes and piping component populations. For Barsebäck-1, all RCPBpiping design information was contained in the PSA_VER1 (Åström, 1997).
Prepared by plant personnel, this database stored essential data for each of theapproximately 4,000 RCPB piping components (type, diameter, material, location,inspection data). The database work entailed detailed reviews of the entire isometricdrawing package for the ten systems, supplemented by system walk-downs, reviews ofinspection records and fabrication data (material compositions for each charge/heatnumber). An additional aspect of the database work consisted of identifying locationsinside containment susceptible to dynamic effects from double-ended guillotine breaks(DEGBs). An example of a dynamic effect could be the break of a small- or medium-diameter pipe caused by pipe whip effects by a large-diameter DEGB. The PSA_VER1represented the complete LOCA initiating event model for the plant.
In Step 1 of the application study, PSA_VER1 was subjected to an independent reviewwhich entailed all isometric drawings and of how the information off these drawings hadbeen transferred to the database. The review focused on the accuracy and completenessof the original database. Equally important, the independent review accomplished pipingsystem design familiarization by the data analyst. During the review, the databasecontent was augmented as follows:
• For each system, pipes were added to the database. Originally, the databaseincluded bends, tees, welds. In the revised database all pipes were given a uniqueID with appropriate reference to the weld components joining a pipe to othercomponents in the piping system.

SKI Report 98:30 30
• The location of each weld was identified by referencing its position in the pipingsystem per the example below (and Figure 4-3).
Database Fields
Bend ID9 Weld ID Weld‘Type’10
Pipe ID Weld ID
PSA_VER1.mdb (original) 5522 5523 N/A N/A 5524PSA_VER2.mdb (after review) 5522 5523 Bend/pipe 5523-S 5524
• All connecting instrument lines, drain lines, and sample lines were recorded inthe revised database.
• Results from the degradation evaluation (Step 2) were entered into the data-base
by adding a field for the degradation/failure mechanism potentially impactingrespective component. Also, derived leak and rupture frequencies were added.
The modified database, PSA_VER2 (Figure 4-2), provided population data for differentsets of reliability attributes and influence factors (Appendix B). In facilitating parameterestimation, queries in PSA_VER2 defined the combinations of attributes and influencesfor which queries were made in SKI-PIPE.
Figure 4-2: Overview of the PSA_VER2 Access Database. 9 Each piping component has a unique alpha-numeric component ID. An archived, marked-up set ofisometric drawings is kept on-site. Any changes to the isometric drawings will be included inPSA_VER2.mdb.10 This data field relates to SKI-PIPE; see Chapter 3 and Figures 3-1 through 3-4 for details.

SKI Report 98:30 31
As shown in Figure 4-2, each RCPB piping system is represented by its ownAccess-table; for a list of database field definitions, see Appendix D. An example of atable in the database is given in Figure 4-3 (see also Table on top of page 27). It shows asmall portion of the design information for the Reactor Recirculation System piping ascaptured in the database. The second column from the left includes the unique pipingcomponent IDs. As an example, line 4 (EID #266) includes data on a pipe (componentID 5519-S). By scrolling to the right on the display screen, information about size,fabrication, material, dynamic effects, etc. becomes visible to the viewer/database-user.
Figure 4-3: Example of Database on Reliability Attributes & Component Populations.
The original piping installation includes piping components supplied by Germanand Swedish vendors. For each component the database records the appropriate materialdesignation, charge/heat-number, and for stainless steels the carbon content.
PSA_VER2 is part of the overall PSA documentation for Barsebäck-1. Therefore,the database is subject to the specific QA/QC requirements defined for the Barsebäck-1PSA project.

SKI Report 98:30 32
5. Weld Leak & Rupture Frequency Due to IGSCC
Chapter 5 develops the baseline weld leak and rupture frequencies applicable tomedium-and large-diameter piping susceptible to IGSCC in the BWR operatingenvironment. The chapter covers applicable service data, groupings of service data, anddata interpretations.
5.1 Reviewing the Service Data
Figures 5-1 through 5-3 summarize the data in SKI-PIPE on weld failures due toIGSCC. Figures 5-1 shows the overall, BWR-specific data. It differentiates the dataaccording to mode of failure at the time of discovery (i.e., crack, pinhole leak and at-power leak). Figures 5-2 and 5-3 show the number of weld failures as a function ofyears of commercial operation and pipe diameter in two system groups: 1) ReactorRecirculation System (RCS) including bypass loops and RPV head cooling lines (ABB-Atom units); and 2) Emergency Core Cooling, Reactor Water Cleanup and ResidualHeat Removal Systems (SIR).
11
106
150
334
25
40
35
37
20
9
9
2
0
50
100
150
200
250
300
350
400
≤ 50 ≤ 100 ≤ 250 >250
Num
ber
of W
eld
Fai
lure
s
Number of Leaks
Number of P/H-leaks
Number of Cracks
Figure 5-1: Weld Failures Due to IGSCC in BWR Units Worldwide (1970-1998).

SKI Report 98:30 33
0
10
20
30
40
50
60
70
80
90
100
1 2 3 4 5 6 7 8 9 10 11 12 13 14 15 16 17 18 19 20 21 22 23 24 25 26 27 28
Year(s) of Commercial Operation
Num
ber
of R
CS
Wel
d F
ailu
res
100 < ∅ ≤ 250∅ > 250
Figure 5-2: Weld Failures in RCS Piping in BWR Units Worldwide (1970-1998).
0
5
10
15
20
25
30
35
40
45
50
1 2 3 4 5 6 7 8 9 10 11 12 13 14 15 16 17 18 19 20 21 22 23 24 25 26 27 28
Year(s) of Commercial Operation
Num
ber
of S
IRW
eld
Fai
lure
s
100 < ∅ ≤ 250∅ > 250
Figure 5-3: Weld Failures in SIR Piping in BWR Units Worldwide.
For welds in RCS-piping, Figure 5-2 shows a very sharp decline in the number ofIGSCC occurrences. The large number of events during the 9th through 13th year ofcommercial operation mainly reflects industry response in the United States to the U.S.Nuclear Regulatory Commission’s Inspection and Enforcement Bulletins 82-0311 (datedOctober 14, 1982) and 83-0212 (dated March 4, 1983). These Bulletins were issued inresponse to extensive cracking found at Browns Ferry-2, Monticello, Nine Mile Point-1 11 IEB 82-03: Stress corrosion Cracking in Thick-Wall, Large Diameter, Stainless Steel RecirculationSystem Piping at BWR Plants, U.S. Nuclear Regulatory Commission, Washington (DC).12 IEB 83-02: Stress Corrosion Cracking in Large-Diameter Stainless Steel Recirculation SystemPiping at BWR Plants, U.S. Nuclear Regulatory Commission, Washington (DC).

SKI Report 98:30 34
and other BWR units and involved weld heat affected zones in recirculation distributionheaders and jet pump risers. Further, the Bulletins requested that augmented in-serviceinspections be performed in all plants. At approximately the same time, extensive RCSweld cracking was reported at Mühleberg (Switzerland), Santa Maria de Garona (Spain)and several German BWR units. In January 1999, Commonwealth Edison in the USAreported IGSCC flaws in the large-diameter Reactor Recirculation System at QuadCites-1 (ComEd, 1999). Those recent data are included in Figure 5-2.
For system group ‘SIR’, most of the failure data apply to medium-diameter piping(up to DN250). According to Figure 5-3, up to the 10th to 15th year of commercialoperation, the IGSCC occurrence rate in SIR-piping is lower than in RCS-piping. Thefailure trend for the two system groups is similar beyond the 15th year of operation. Thelow IGSCC occurrence rate is attributed to corrective actions such as HWC, morerobust piping material, effectiveness of weld overlay repairs in combination with stressimprovement treatments, etc.
According to above weld failure trends, the service data were divided according toevents within the first 14 years of operation versus events beyond the first 14 years ofoperation. The former group of event data is denoted as representing a ‘literal prior’.After the first 14 years of operation at least one of several options for mitigating IGSCChad been implemented at all plants susceptible plants; e.g., HWC, weld stress remedies,new material.
The division of the data according to events within and after the first 14 years ofoperation, respectively, is significant for the following reasons: Most of the data onIGSCC are for U.S. plants. As documented in NUREG-1061 (U.S. NRC, 1984), theregulatory and industry initiatives to mitigate IGSCC had largely been implemented bythe 14th year of operation. That is, events to the left of year 14 in Figures 5-2 and 5-3occurred as the result of insufficient attention to water chemistry and residual stresses oninner surfaces of piping. Beyond year 14, BWR piping reliability has benefited fromimproved water chemistry and weld stress improvement13. Using these arguments, the‘literal prior’ represents the service experience before implementing improved waterchemistry and weld overlay techniques.
Tables 5-1 through 5-8 summarize IGSCC event data for medium- and large-diameter RCPB piping; grouped as RCS and SIR piping. Also, the data aredifferentiated according to US versus worldwide service data. The tables compare theworldwide failure data with the U.S. data. As discussed on page 9, the comparisonhighlights different regulatory domains. The comparison also reflects differences incorrective action strategies.
13 Techniques have been developed to ensure that the internal surfaces of welds exposed to reactor waterare in compression. In the U.S., the external weld overlay technique is widely used.

SKI Report 98:30 35
Table 5-1: Weld Failures in RCS Piping (100 ≤ DN ≤ 250) - Worldwide BWR Data.
Time PeriodTotal
Number ofEvents
RatioLeak:
Crack14
Number ofCracks
Number ofP/H-Leaks
Number ofLeaks
Within the First 14Years of Operation
112 0.15 97 15 0
Beyond the First 14Years of Operation
8 0.14 7 1 0
Table 5-2: Weld Failures in RCS Piping (100 ≤ DN ≤ 250) - US BWR Data.
Time PeriodTotal
Number ofEvents
RatioLeak: Crack
Number ofCracks
Number ofP/H-Leaks
Number ofLeaks
Within the First 14Years of Operation
28 1 14 14 0
Beyond the First 14Years of Operation
0 -- 0 0 0
Table 5-3: Weld Failures in SIR Piping (100 ≤ DN ≤ 250) - Worldwide BWR Data.
Time PeriodTotal
Number ofEvents
RatioLeak: Crack
Number ofCracks
Number ofP/H-Leaks
Number ofLeaks
Within the First 14Years of Operation
137 0.63 84 39 14
Beyond the First 14Years of Operation
44 0.16 38 6 0
Table 5-4: Weld Failures in SIR Piping (100 ≤ DN ≤ 250) - US BWR Data.
Time PeriodTotal
Number ofEvents
RatioLeak: Crack
Number ofCracks
Number ofP/H-Leaks
Number ofLeaks
Within the First 14Years of Operation
110 0.71 64 34 12
Beyond the First 14Years of Operation
24 0.17 20 4 0
Table 5-5: Weld Failures in RCS Piping (> DN250) - Worldwide BWR Data.
Time PeriodTotal
Number ofEvents
RatioLeak: Crack
Number ofCracks
Number ofP/H-Leaks
Number ofLeaks
Within the First 14Years of Operation
284 0.12 252 30 2
Beyond the First 14Years of Operation
34 0.06 32 2 0
14 In calculating the ‘leak:crack’ ratio, the leak-term encompasses pinhole leaks and at-power leaks.

SKI Report 98:30 36
Table 5-6: Weld Failures in RCS Piping (> DN250) - US BWR Data.
Time PeriodTotal
Number ofEvents
RatioLeak: Crack
Number ofCracks
Number ofP/H-Leaks
Number ofLeaks
Within the First 14Years of Operation
258 0.14 227 30 1
Beyond the First 14Years of Operation
24 0.09 22 2 0
Table 5-7: Weld Failures in SIR Piping (> DN250) - Worldwide BWR Data.
Time PeriodTotal
Number ofEvents
RatioLeak: Crack
Number ofCracks
Number ofP/H-Leaks
Number ofLeaks
Within the First 14Years of Operation
33 0.14 29 4 0
Beyond the First 14Years of Operation
2 1 1 1 0
Table 5-8: Weld Failures in SIR Piping (> DN250) - US BWR Data.
Time PeriodTotal
Number ofEvents
RatioLeak: Crack
Number ofCracks
Number ofP/H-Leaks
Number ofLeaks
Within the First 14Years of Operation
25 0.19 21 4 0
Beyond the First 14Years of Operation
2 1 1 1 0
5.2 Parameter Estimation
Calculating pipe rupture frequency entails determining the frequency of leaks andthe conditional rupture probability for specific sets of attributes and influence factors.For the leak frequency, Bayesian statistics using gamma priors and noninformative priorsgave the results as given by Tables 5-9 and 5-10.
The choice of prior distributions remains an area of technical debate and a sourceof statistical uncertainty. For details on different strategies for selecting distributions, seethe texts by Kapur and Lamberson (1977) and Martz and Waller (1982). In Tables 5-9and 5-10, the given frequency values are based on:
• A gamma prior corresponding to 0.5 was applied to weld crack data for medium-diameter- and large-diameter RCS and medium-diameter SIR piping. The posteriormean was calculated from (δ + r)/(ρ + T) where δ/ρ = 0.5 represent parametersdetermining the shape of the gamma distribution15.
15 δ = shape parameter and ρ = scale parameter. That is, in this example the shape and scale parameterare chosen in such a way that δ/ρ = 0.5 or δ = 1 and ρ = 2.

SKI Report 98:30 37
• A gamma prior corresponding to 5E-02 was applied to weld crack data for large-diameter SIR piping. The posterior mean was calculated from (δ + r)/(ρ + T)where δ/ρ = 5.0E-02.
• A gamma prior corresponding to 4.0E-3 was applied to weld leak data for large-diameter RCS piping (δ = 0.5 and ρ = 126)16.
• A gamma prior corresponding to 2.7E-2 was applied to weld leak data formedium-diameter SIR piping (δ = 2 and ρ = 74).
• For medium-diameter RCS piping and large-diameter SIR piping the statisticalevidence is 0 ‘at-power leaks’ during the entire observation interval. The respectiveleak frequency is derived from a noninformative prior, and according to Jeffrey’srule the posterior mean is (2r + 1)/2T (Martz and Waller, 1982).
Table 5-9: RCS Weld Crack & Leak Frequencies Due to IGSCC - Worldwide Data.System Statistical Evidence δδ / ρρ Posterior DataGroup (Tables 5-1 through 5-8) Crack
Frequency17Leak
FrequencyRCS
(100 ≤ DN ≤250)
(Table 5-1)
Literal prior: 112 cracks in 504 yearsLiteral posterior: 8 cracks in 1078 yearsLiteral prior: 0 leaks in 504 yearsLiteral posterior: 0 leaks in 1078 years
1 / 2
--
8.33E-3
3.16E-4RCS (> DN250)
(Table 5-5)Literal prior: 284 failures in 504 yearsLiteral posterior: 34 failures in 1078 yearsLiteral prior: 2 leaks in 504 yearsLiteral posterior: 0 leaks in 1078 years
1 / 2
0.5/126
3.24E-2
4.15E-4
Table 5-10: SIR Weld Crack & Leak Frequencies Due to IGSCC - Worldwide Data.System Statistical Evidence δδ / ρρ Posterior DataGroup (Tables 5-1 through 5-8) Crack
FrequencyLeak
FrequencySIR
(100 ≤ DN ≤250)
(Table 5-3)
Literal prior: 137 failures in 522 years18
Literal posterior: 44 failures in 1105 yearsLiteral prior: 14 leaks in 522 yearsLiteral posterior: 0 leaks in 1105 years
1 / 2
2 / 74
4.07E-2
1.70E-3SIR (> DN250)
(Table 5-7)Literal prior: 33 failures in 522 yearsLiteral posterior: 2 failures in 1105 yearsLiteral prior: 0 leaks in 522 years‘Literal’ posterior: 0 leaks in 1105 years
1 / 20
--
2.67E-3
3.07E-4
Without statistical evidence on ruptured medium- to large-diameter Class 1 andClass 2 piping, the conditional probability of rupture given failure built on anoninformative prior (Jeffrey’s rule19). Its relative merit was illustrated throughcomparisons with results from Bayesian updates using different prior distributions. 16 The prior distribution parameters were selected to give more weight to the fact that no at-power leakshave occurred. Furthermore, the parameters were selected to reflect a belief that NDE methods becomemore effective as the pipe size (diameter and wall thickness) decreases.17 All frequencies have dimension (1/System-Group-Year). For BWR units with external recirculationloops, the total service experience covers circa 1582 reactor-years.18 The frequency of leak in SIR piping is based on the total BWR service experience (i.e., BWRs withand without external recirculation loops), which is approximately 1627 reactor-years as of 12/31/98.19 The mean value of the conditional rupture probability is calculated from (2r + 1)/(2n + 2), where r =number of ruptures and n equals the total number of demands (cracks + leaks + ruptures).

SKI Report 98:30 38
Figure 5-3 includes mean values associated with the updated noninformative prior.The four discrete data points in Figure 5-3 are joined by a line for display only. Eachestimate has its own uncertainty distribution. According to Beliczey (1995), as a rule-of-thumb, in small diameter piping (< DN25) the pR|F ∝ 1.0E-1 and in larger diameterpiping pR|F ∝ 2.5/DN. Table 5-11 summarizes the suggested weld rupture frequencies.
1.41E-03
2.67E-03
8.77E-03
3.21E-03
1.00E-03
1.00E-02
1.00E-01
≤ ∅ 50 50 < ∅ ≤ 100 100 < ∅ ≤ 250 ∅ > 250
Nominal Diameter [mm]
pR
|F
Jeffrey's rule (SKI-PIPE.mdb)
Beliczey (1995)
Figure 5-3: Conditional Probability of Rupture Given Weld Failure (Mean Values).
Table 5-11: Baseline Rupture Frequencies Due to IGSCC in WeldsSystemGroup
Leak Frequency20 ConditionalProbability of Rupture
RuptureFrequency21
[1/Reactor-Year]RCS (> DN250) 4.15E-4 1.41E-3 5.87E-7
RCS (100 ≤ DN ≤ 250) 3.16E-4 2.67E-3 8.44E-7SIR (> DN250) 3.07E-4 1.41E-3 4.33E-7
SIR (100 ≤ DN ≤ 250) 1.70E-3 2.67E-3 4.54E-6
Up to this point, all frequencies are per plant-year and system-group. The givenleak and rupture frequencies represent the total contributions from leaking and rupturedwelds, respectively (see Chapter 3, pp 20-21). Conversion to per-weld frequencieswould require access to weld population data for all plants in the database. That is, foreach plant in the database, information equivalent to PSA_VER2 (Appendix B) wouldbe required. Collecting such information is time consuming, and was beyond the definedwork scope. Instead, the study utilized the information about location dependency ofIGSCC-induced weld failures (Chapter 3, pp 20-21). As an example, on average 45.8%of the total rupture frequency of large-diameter RCS piping comes from a rupture in aweld between bend/elbow-to-pipe. Using the information in Figure 3-1 (page 20), Table5-12 summarizes rupture frequencies for a selection of weld locations. 20 Frequency of leak per RCS-Year (SIR-Year); mean values.21 Rupture frequency per RCS-Year (SIR-Year); mean values.

SKI Report 98:30 39
Table 5-12: Examples of Weld Rupture Frequencies for Different Weld Types.SystemGroup
Leak Frequency ConditionalProbability of Rupture
Rupture Frequency[1/Reactor-Year]
RCS (> DN250)Bend/elbow-to-pipe weld
Pipe-to-pipe weldPipe-to-valve weld
1.90E-45.52E-53.11E-5
1.41E-31.41E-31.41E-3
1.41E-31.41E-31.41E-3
RCS (100 ≤ DN ≤ 250)Bend/elbow-to-pipe weld
Pipe-to-pipe weldPipe-to-valve weld
1.45E-44.20E-52.37E-5
2.67E-32.67E-32.67E-3
3.86E-71.12E-76.33E-8
SIR (> 10 inch)Bend/elbow-to-pipe weld
Pipe-to-pipe weldPipe-to-valve weld
1.41E-45.53E-53.44E-5
1.41E-31.41E-31.41E-3
1.98E-77.80E-84.85E-8
SIR (4-10 inch)Bend/elbow-to-pipe weld
Pipe-to-pipe weldPipe-to-valve weld
7.84E-43.06E-41.90E-4
2.67E-32.67E-32.67E-3
2.09E-68.17E-75.08E-7
All values in Table 5-12 represent base-line values for BWR units that haveimplemented at least one of following corrective action strategies: 1) Stressimprovement of welds using IHSI; 2) hydrogen water chemistry; or 3) IHSI andhydrogen water chemistry. As explained under ‘Study Conventions’ in Chapter 1, theterm rupture implies a fractured pipe with a hole size big enough to cause a release ofprimary water > 5 kg/s (> 80 gpm). A leakage of this magnitude would result in theactuation of a primary system make-up system.
5.3 Parameter Estimation - A Different Perspective
The simple Bayesian (or ‘PSA-style’) approach to piping reliability analysisadequately accounts for trends and uncertainties in failure data. An alternate approach toestimating weld leak and rupture frequency would be to fit a statistical distribution to thefailure data. However, it is important to recognize that modeling and data analysis gohand-in-hand. Changing the approach to data analysis could enable applications of moredetailed reliability models. As an example, a parametric data analysis method wouldsupport applications of a parametric model of piping reliability such as proposed in thework by Fleming and Mikschl (1998).
An application of PSA-style piping reliability analysis highlights questions aboutvalidity. Would derived leak and rupture frequencies be affected by different datagroupings or interpretations? A large database on piping failures enables differentsensitivity studies. Also, such a database responds to questions about completeness.Parallel to the simple Bayesian approach, this study included extensive parametric dataanalyses to fully explore the database.

SKI Report 98:30 40
As a test for trends in the failure data, this study applied the hazard plottingtechnique (Nelson, 1972). In reliability analysis, the hazard function h(t) is theinstantaneous failure rate. For a 2-parameter Weibull distribution, the hazard function is:
h(t) = (β / θ)×(t/θ)β-1 (5.1)Mean = θ × Γ(1 + 1/β) (5.2)β= shape parameterθ = characteristic lifeΓ(•) = Gamma function
Queries in SKI-PIPE for specific attribute-influence sets generated summaries offailure times. Next, using the procedure in Appendix G, an Excel spreadsheet programgenerated the distribution parameters from hazard plots. Under the assumption of pre-existing cracks, Table 5-13 summarizes distribution parameters for piping susceptible toIGSCC and Figure 5-4 shows the corresponding hazard functions.
Table 5-13: Distribution Parameters for IGSCC-Susceptible Piping.
System Group Pipe SizeShape Parameter
ββScale parameter - θθ
[Years]RCS DN > 250 1.29 41.5RCS 100 ≤ DN ≤ 250 1.14 66.4SIR 150 ≤ DN ≤ 250 0.91 55.7
RWCU 150 ≤ DN ≤ 250 0.97 66.4SIR 80 ≤ DN ≤ 100 0.89 38.7
CRD DN50 1.75 40.7
1.00E-03
1.00E-02
1.00E-01
10 20 30 40 50 60 70 80 90 100
Plant Age [Years]
Con
diti
onal
Fre
quen
cy o
f Lea
k[1
/Yea
r]
RCS (Medium-Diameter)
RCS (Large-Diameter)
SIR (Medium-Diameter)
SIR (Small-Diameter)
RWCU (Medium-Diameter)
CRD (Small-Diameter)
Figure 5-4: Hazard Functions for IGSCC-Susceptible Piping.
A shape factor near 1.0 is indicative of a constant failure rate. The shapes ofrespective hazard function in Figure 5-4 indicate where corrective actions have been

SKI Report 98:30 41
effective. Also, the shapes of respective hazard function shape reflect data interpretationand data completeness issues.
Derived failure parameters that are based on relatively few data points have a highdegree of variability. Using a spreadsheet program for parameter estimation makes itconvenient to analyze the impact on the parameters by different data interpretationstrategies. Table 5-14 is an interpretation of data on known P/H-leaks and at-powerleaks in large-diameter RCS piping. Figure 5-5 shows the corresponding hazard plot.
Table 5-14: Through-wall Pipe Cracks in Large-Diameter Recirculation Piping.Plant Event
DateSKI-PIPE
EIDDN Comment
Santa Mariade Garona
2/13/80 2419(IAEA/NEA-IRS #22.00)
550 The second known ‘near-miss’ DEGB;through-wall crack and leak fromInconel-600 safe-end.
Nine MilePoint-1
3/23/82 437(LER 82-009)
700 The third known ‘near-miss’ DEGB;through-wall crack and leak fromInconel-600 safe-end. Similar eventoccurred at Duane Arnold in June 1978(DN250 safe-end).
Hatch-1 11/6/82 2850(LER 82-089)
550 During WOR, small leakage wasobserved on end-cap-to-manifold weld.Unit was in cold shutdown forrefueling.
Dresden-2 2/25/83 1144(LER 83-015)
750 Small leak was detected on a DN750recirculation pump suction pipe weld.
Browns Ferry-2
2/21/85 1397 300/700 Leaking weld in junction betweenDN700 recirculation loop ‘A’ mainheader and DN300 jet pump riser.
Duane Arnold 3/10/85 2855(LER 85-010)
250/700 Leaking weld between junction of mainrecirculation header and jet pump riser.
Brunswick-2 1/9/86 1723(LER 86-002)
750 Visual and ultrasonic testing revealedTWC indications within the HAZ of 5welds in the recirculation piping.
1
10
100
1000
10000 100000 1000000Time to Failure [Hours]
Cum
ulat
ive
Haz
ard
(100
x ln
[1/(
1-M
R)]
)
Figure 5-5: Hazard Plot of RCS Weld Failure Data in Table 5-14.

SKI Report 98:30 42
The same data analysis approach could be applied to crack data (e.g., welds inspecific system and location). Combining a hazard function for cracked weld with acorresponding hazard function for leaking weld given crack would then produce a time-dependent estimate of the overall weld leak frequency. Preservation of analyticalconsistency depends on having a well-structured approach to data analysis. An effort toestimate piping reliability data parameters must correspond with the selected modelingapproach. Development of parametric data suggests a parametric model of pipingreliability; e.g., Markov model (Fleming and Mikschl, 1998). By contrast, in PSA-styleanalyses a simple Bayesian approach is adequate.

SKI Report 98:30 43
6. Rupture Frequency Due to Thermal Fatigue
Limited to thermal fatigue and with support of the database on piping failures,Chapter 6 develops the baseline weld leak and rupture frequency applicable to medium-and large-diameter RCPB piping in BWR operating environments. The chapter coversapplicable service data, groupings of service data, and data interpretations.
6.1 Reviewing the Service Data
Figure 6-1 shows the number of piping failures caused by thermal fatigue as afunction of years of commercial operation and pipe diameter. Affected system involvethe main feedwater, reactor water cleanup and residual heat removal systems. UnlikeIGSCC/TGSCC, the thermal fatigue failures mostly have affected the ABB-Atom plantsin Finland and Sweden.
0
1
2
3
4
5
1 2 3 4 5 6 7 8 9 10 11 12 13 14 15 16 17 18 19 20 21 22 23 24 25 26 27 28
Year(s) of Commercial Operation
Num
ber
of E
vent
sIn
volv
ing
The
rmal
Fat
igue
All (medium + large diameter)
Barsebäck-1
Barsebäck-2
Figure 6-1: Thermal Fatigue in BWRs Worldwide.
Table 6-1 summarizes selected thermal fatigue events. The Finnish plant TVO-1experienced a major event in 1979 (Holmberg and Pyy, 1994). A branch connection inthe Reactor Water Cleanup System fractured after a short period of operation. The rootcause analysis attributed the event to design error and human factors deficiencies.Approximately 5,000 kg of primary water was released through a 2.3 cm² hole onto theReactor Building floor. Table 6-2 summarizes the thermal fatigue data for different pipesizes. Table 6-3 summarizes the Nordic experience by system and pipe size.

SKI Report 98:30 44
Table 6-1: Service Experience Involving Thermal Fatigue in BWR Plants.Plant Date SKI-PIPE
Event IDDN Comment
Oskarshamn-2 5/26/78 341(O2-RO-08/78)
150 Leak from branch connection between321 and 331.
Barsebäck-1 6/20/78 2904 125 Significant cracking of a section ofpiping in 331.
TVO-I22 8/29/79 1619(NEA-IRS #0014)
150 Fracture of tee in 331 resulting insubstantial leak outside containment.
Barsebäck-1 8/1/80 375(NEA-IRS #0010)
300 Cracking of tee (312/321); crack depthexceeded 26% TWC.
Oskarshamn-2 8/1/80 2429 250 Cracking of tee (312/321); crack depthapproximately 25% TWC.
Ringhals-1 8/1/80 2428 250 Cracking of tee (312/321); crack depthapproximately 20% TWC.
Dodewaard 1/1/82 28(NEA-IRS #305.00)
450 Cracking of nozzles; up to 46% TWC.The plant has been de-commissioned.
Forsmark-2 5/31/83 2555(F2-RO-009/83)
400 Cracking of tee connecting 321 and331; max. of 78% TWC.
Forsmark-1 7/21/83 356(F1-RO-13/83)
150 Cracking of branch connection between321/331; crack depths unknown.
Forsmark-1 7/20/83 357(RO-F1-17/83)
400 Crack in tee joint (312/321).
TVO-II 8/10/83 87(INPO-SER 5-85)
150 Cracking of branch connection betweenSystems 321 and 331.
WNP-2 8/22/84 3057(AEOD/S902)
150 Feedwater (FW) piping deflection andsmall leak from RWCU/FW branchconnection.
Leibstadt 10/1/84 2411(AEOD/S902)
25 During startup testing, leaks wereobserved at flanges of venturi flowmeter in FW-line.
Forsmark-1 7/28/90 359(F1-RO-20/90)
150 Through-wall crack leading to leak inmixer point between valve 331-V20and heat exchanger 331-E5.
Forsmark-2 7/17/91 365(F2-RO-11/91)
150 Cracking of branch connection inSystem 331; crack depths unknown.
Ringhals-1 8/1/92 350(RO-R1-19/92)
300 Cracking of nozzles in 312; up to about50% TWC
Oskarshamn-123
6/18/93 335(O1-RO-07/93)
150 Cracking of branch connection between321 & 331 (just before System 312distributor); max. crack depth of about25% TWC.
Forsmark-1 11/16/94 361(F1-RO-32/94)
150 Small leak from mixer point in 331.
Barsebäck-1 9/1/97 2918 200 Cracking of tee in 331; crack depthsunknown.
KKI Isar-1 9/19/97 3046 150 Cracking of branch connection between321/331; crack depths unknown.
22 System operating procedure had been incorrectly translated from Swedish to Finnish causing the mis-positioning of a flow control valve.23The metallurgical evaluation indicated no crack growth since 1981; cracks first identified around1972/73. The initial crack growth was attributed to lack of operating experience among plant personnel.

SKI Report 98:30 45
Table 6-2: Thermal Fatigue Failures by Pipe Size.Plant Type Pipe Size Total Number
of EventsCrack P/H-Leak +
LeakRupture
ABB-Atom24 100 ≤ DN ≤ 250 22 12 10 0ABB-Atom DN > 250 8 6 2 0
BWR 100 ≤ DN ≤ 250 24 13 11 0BWR DN > 250 9 7 2 0PWR 100 ≤ DN ≤ 250 18 4 14 0PWR DN > 250 8 0 8 0
Sum25: 59 24 35 0
Table 6-3: Thermal Fatigue in Nordic Plants by System and Pipe Size.System Pipe Size Total Number
of EventsCrack P/H-Leak +
LeakRupture
AFWSECCSFWS
RHRSRWCUOther
100 ≤ DN ≤ 250 22 103260
020152
000000
FWSMS
RHRSRWCU
DN > 250 8 4011
1100
0000
Sum: 30 18 12 0
6.2 Thermal Fatigue Issue Summary
Thermal fatigue occurs where a piping component is exposed to thermalfluctuations caused by the mixing of process media at different temperatures. Assumingsufficient (or excessive) thermal cycling, the thermal fatigue cracks develop in the wallsof austenitic stainless steel piping. Ferritic materials are considered immune to thermalfatigue. The underlying physical phenomena of thermal fatigue is termed thermalstratification. It is a condition in which two streams of fluid of different temperaturesflow in separate layers without appreciable mixing. When the flow rate is low,turbulence is low and the potential for mixing is minimal. The lighter hot fluid staysabove the heavier cold fluid.
The potential for stratification increases as the temperature difference between thehot and cold fluids increases. Increasing fluid temperature difference increases the effectof density variation and the buoyancy force. Fluid velocity has a negative effect on thepotential for thermal stratification. As the fluid velocity increases, the potential forturbulent flow and mixing increases. The ‘Richardson number’ (Ri ) is a measure ofthese effects (Su, 1990); this number is used as a screening criterion for addressing the 24 Total of 217 reactor-years of operating experience with ABB-Atom plants as of 12/98.25 Less data in the rows for ABB-Atom plants.

SKI Report 98:30 46
potential for thermal stratification. The thermal stratification phenomena are classifiedas:
• Global thermal stratification;• Cyclic thermal stratification;• Thermal striping.
Consequences of global thermal stratification include: a) macroscopic movementsof the piping and resulting in hanger damage; b) generation of stress in the piping, whichmight not have been considered in the design of the piping system; and c) low cyclefatigue. Consequences of cyclic thermal stratification and thermal striping are pipecracks from high cycle fatigue.
Most of the service experience involving thermal fatigue damage due to globalthermal stratification is concerned with the PWR operational environment. As anexample, the main degradation mechanisms affecting the PWR feedwater lines arethermal fatigue and flow-accelerated corrosion (FAC); c.f. Shah, Ware and Porter(1997). By contrast, cyclic thermal stratification is the dominant cause of thermal fatiguedamage in the BWR operating environment.
6.3 Parameter Estimation
Compared to IGSCC, the thermal fatigue data are scarce. Additionally, there is noclear trend in thermal fatigue occurrences (Figure 6-1). Operational practices (e.g.,intermittent versus continuous RWCU flow) strongly influence the susceptibility tothermal fatigue. The database content could be indicative of: 1) Incompleteness; 2)Thermal fatigue being less significant than IGSCC; or 3) Inadequacy of ISI methods orISI programs in detecting thermal fatigue degradations. On the other hand, assummarized on page 40, the data could be indicative of a thermal fatigue phenomenaspecific to ABB-Atom plants. Figure 6-2 shows hazard functions for data in Table 6-2.
Considering data for ABB-Atom plants and BWRs worldwide, the time-averagedfailure frequencies are 3.4E-2/Year and 2.6E-2/Year, respectively. The hazard functionrepresenting BWRs worldwide does not include failures occurring within the first 4years of commercial operation. Although the time-averaged values are quite close, theshapes of respective function differ significantly. The analysis of data on thermal fatigueraises the following questions:
• Mixing data for different BWR plant designs. Should the analysis be limited to dataon the ABB-Atom experience? In view of design differences, could the pooling ofABB-Atom with GE service data be justified?
• Choice of prior distribution. Ideally, the prior distribution should reflect what isknown about thermal fatigue. In view of the limited data, how should the prior bestbe defined?

SKI Report 98:30 47
1.00E-03
1.00E-02
1.00E-01
10 20 30 40 50 60 70 80 90 100
Plant Age [Years]
Con
diti
onal
Fre
quen
cy o
f Lea
k[1
/Yea
r]
ABB-Atom Plants
All BWRs (Excluding Early LifeFailures)
Figure 6-2: Hazard Functions for Piping Susceptible to Thermal Fatigue.
This study used non-informative priors (Jeffrey’s rule) to estimate the frequency of leakand rupture. Table 6-4 summarizes the proposed leak and rupture frequencies for branchconnections in Auxiliary Feedwater, Main Feedwater and Residual Heat Removalsystems (system group ‘F+R’). It uses the data in Table 6-3 while acknowledging thatthe Reactor Water Cleanup System (System 331) is not part of the RCPB in ABB-Atomplants.
Table 6-4: Baseline Leak and Rupture Frequency Due to Thermal Fatigue.System Group Pipe Size Evidence Leak Frequency
[1/Plant-Year]Rupture Frequency
[1/Plant-Year]F+R
ABB-Atomplants
100 ≤ DN ≤250
• 1 leak in 217reactor-years
• 0 ruptures
6.91E-3 --
1.11E-426
F+RBWR plantsworldwide
100 ≤ DN ≤250
• 1 leak in1582 reactor-years
• 0 ruptures
9.48E-4
7.90E-6
F+RABB-Atom
plants
DN > 250 • 1 leak in 217reactor years
• 0 ruptures
6.91E-3 --
1.11E-4F+R
BWR plantsworldwide
DN > 250 • 1 leak in1582 reactoryears
• 0 ruptures
9.48E-4 --
7.90E-6
26 The conditional rupture probability uses pooled data for medium- and large-diameter piping; 0ruptures, 30 failures (59 failures worldwide) per Table 6-3. Using a noninformative prior, according toJeffrey’s rule, the posterior mean is (2R + 1)/(2F +2) = 1.6E-2. Using an informative prior; e.g., betawith mean = 0.1 gives posterior mean of 2.5E-2.

SKI Report 98:30 48
7. Barsebäck-1 Piping Reliability Database
Chapter 7 summarizes the conversion of baseline rupture frequencies to plant-specific rupture frequencies input to PSA_VER2, the model of the RCPB pipingreliability (Chapter 4 and Appendix B). In PSA_VER2 each of the ten RCPB pipingsystems is represented by a table of piping system components (bends, pipes, tees,welds) and associated reliability attributes and influence factors.
7.1 Base Values versus Adjusted Values
For BWRs, Chapters 5 and 6 developed base values for the frequency of leak andrupture in piping susceptible to IGSCC, TGSCC and thermal fatigue. These frequenciesare ‘base values’ in that they were developed at the system level, not accounting forplant-specific piping designs such as layouts, or material compositions. The conversionof a system-level base frequency to a component-level, plant-specific frequency is nottrivial. Adjusting a baseline frequency involves:
• Apportioning of baseline frequency for system group to the systems making up thegroup. As an example, SIR includes service data on ECCS, RHRS and RWCUSystems; Table 7-1.
• Collecting piping component population data for the BWR units represented in thepiping failure database. Ideally, the population data should be of the same qualityas for the reference plant in this study. Since such data are not readily available, anapproximation of the population data should be established.
• Accounting for the effects on piping reliability by different material compositions(e.g., stainless steels of extra-low carbon content stainless steel versus high carboncontent).
• Accounting for the effects on piping reliability by different water chemistry (e.g.,hydrogen water chemistry versus normal water chemistry).
Table 7-1: Barsebäck-1 Plant System Names and the System Groups.System Group Rupture Frequency
[1/Reactor-Year]Plant
Name (ID)Rupture Frequency
[1/System-Year]-Comment
RCS (> DN250) 5.87E-7 313 5.87E-7RCS (100≤ DN
≤ 250)8.44E-7 313 (bypass);
3268.44E-7
SIR (> DN250) 4.33E-7 RHR - 321ECC - 323
1.44E-71.44E-7
Equal contributionfrom 3 SIR.
SIR (100≤ DN ≤250)
3.66E-6 RHR - 321ECC - 323
5.89E-71.07E-6
16.1% contr.27
29.3% contr.
27 Based on SKI-PIPE.mdb.

SKI Report 98:30 49
Each step to adjust an estimated frequency from the system-to the component-levelis a source of uncertainty, however. As an example, for a given system, pipe size groupand design vintage the weld population could differ by a factor 2 among plants. As anadded complexity, the piping failure database includes several cases where an originalpiping design was modified to reduce the weld count, thus minimizing the IGSCCsusceptibility. Using pre-formed piping sections, eliminating elbows, etc., could reducean original weld count by at least a factor of 2, and in some cases by as much as a factorof 10. It would be a formidable undertaking to develop detailed population data.
One solution to this aspect of failure frequency estimation would be to apply DPD-formalism28 to characterize the uncertainty in population data. This was done in thework by Fleming et al (1998). In the present application with Barsebäck-1 as referenceplant, the problem of not having a complete set of population data was addressed usingdata on the location dependency of weld failures (Chapter 3, page 20 and Chapter 5,page 34).
The location dependency data are yet another source of uncertainty, however. Dothese data accurately portray the IGSCC-sensitivity of different weld locations? Do thedata accurately account for the number of different locations in the piping systemscovered by the database? Expanding the SKI-PIPE database content on IGSCC-inducedweld failures yielded an additional 450 records; an expansion from initially 350 events to800 events. Figure 7-1 compares the location dependency data before and after thedatabase scope expansion.
40.7%
7.5%
12.1%
3.8%
45.8%
13.3%
7.5%
6.2%
0.0% 5.0% 10.0% 15.0% 20.0% 25.0% 30.0% 35.0% 40.0% 45.0% 50.0%
Bend-to-pipe weld
Pipe-to-pipe weld
Pipe-to-valve weld
Bend-to-valve weld After database expansion
Before database expansion
Figure 7-1: Information on IGSCC-Sensitivity of Welds.
Figure 7-1 conveys two insights about weld failures due to IGSCC. First, a weldbetween a bend and pipe is more prone to cracking than other locations in a pipingsystem. Second, the insights about location dependency changes with the completenessof the database. 28 DPD = discrete-probability distribution

SKI Report 98:30 50
Within the given work scope limitations, the study on location dependency was nottaken beyond comparing the before-and-after insights. The location dependency dataafter database expansion were taken to accurately portray IGSCC-susceptibility ofdifferent weld locations. The baseline rupture frequency was apportioned across thedifferent locations, without accounting for uncertainty in the dependency information.
Different material compositions and primary water chemistry strategies significantlyimpact weld reliability. Many studies have evaluated the effects on IGSCC-susceptibilityby different carbon content stainless steels. Lowering the carbon content improves theIGSCC-resistance. Extra-low carbon content (‘nuclear grade’, NG) stainless steels29 areconsidered immune to IGSCC. The piping failure database includes data on plants wherepiping systems have been partially or completely replaced using NG-steels. There are noreports on IGSCC in NG-steels in the database. According to studies by the ElectricPower Research Institute, the use of NG-steels (ELC) should increase the time to failureby a factor of 20 or more (Danko, 1983). This study applied a factor of 10 improvementin failure times by low carbon (LC) content stainless steels
Hydrogen water chemistry (HWC) has proven effective in reducing or eliminatingIGSCC. The SKI-PIPE database identifies BWR units with and without HWC.According to the database, approximately 50% of the BWR units operate with HWC.The water chemistry strategy differs among these plants, however. Some units have beenoperating with 100% HWC for many years, while others have operated with intermittentHWC. Plant-specific factors such as the operability of demineralizers and the integrity ofcondenser tubes affect the HWC-effectiveness.
The piping failure database summaries in Chapter 5 reflect industry programs tominimize IGSCC. Implicitly, the baseline rupture frequencies account for improvedwater chemistry, weld overlay repairs, different materials, etc. The application study didnot pursue formal statistical analysis of the correlation between IGSCC and differentinfluence factors.
7.2 Barsebäck-1 Piping Reliability Database
Converting the IGSCC baseline frequencies to Barsebäck-1 specific frequenciesaccounted for influences by material composition and weld location. In addition toanalyzing data on weld failures, the data analysis also considered cracks and leaks inbase metal of cold worked piping. According to SKI-PIPE, for medium-diameter coldworked stainless steel piping, approximately 1-of-6 reported events involved damage inbase metal of residual heat removal piping. Table 7-1 shows plant-specific (i.e.,adjusted) component rupture frequencies applicable to base and weld metal of theResidual Heat Removal System (System 321). The study developed similar datatabulations for all Barsebäck-1 RCPB piping systems. 29 For example, stainless steels of type SS 2353EL (Sweden) or AISI-316NG (USA); ≤ 0.02% carbon.

SKI Report 98:30 51
Table 7-2: Excerpt from Barsebäck-1 Piping Component Reliability Database.Component FR-TOTAL
(Base-line)Influence by
Location - WeldInfluence by
MaterialPopulation FR - Mean
[1/Comp.-Year]Weld
Weld - DN200
SYSTEM 321(RHR System)
5.89E-0730 Bend-to-pipe
Pipe-to-penetr.
Pipe-to-pipePipe-to-reducer
Pipe-to-valve
Tee-to-pipe
--LC
LC----
LC--
LC--
128--2131222
7.00E-0931
7.00E-10--
8.71E-101.25E-085.89E-095.89E-101.77E-081.77E-099.42E-09
WeldWeld - DN250
SYSTEM 321(RHR System)
5.89E-07 Bend-to-pipe
Bend-to-valvePipe-to-penetr.
Pipe-to-valveTee-to-pipe
--LC
ELC/NG----
LC----
LC
2512--1221
7.00E-097.00E-103.50E-101.18E-08
--1.25E-091.77E-089.42E-099.42E-10
7.3 Weld ‘Location-Dependency’ - Limitations & Pitfalls
For a given system, the proposed ‘location-dependency’ concept (Chapter 3)reflects populations of different welds and different susceptibilities to IGSCC. Uncriticaluse of the concept could lead to unwarranted reduction in estimated rupture frequency,however. Data specialization as demonstrated in this chapter should always include acheck for reasonableness; see Table 7-3. Unless a piping system has been subjected torepair/replacements and/or modification, the baseline and adjusted rupture frequenciesshould be the same. In the given example, the data specialization was model-driven.
Table 7-3: Comparison of Baseline and Specialized Pipe Rupture Frequency.Baseline Rupture Frequency
in RHR Piping[1/Reactor-Year]
Barsebäck-1 RuptureFrequency in RHR Piping
[1/Reactor-Year]Comments
5.89E-7 4.59E-07The data specialization resultedin a rupture frequency reductionby about 22%. The reduction isattributed to influence by low-and extra-low carbon contentstainless steels.
30 From Table 7-1, page 45.31 Calculated from: 5.89E-07 × 0.44, where 0.44 is taken from Figure 3-3. Total of 37 bend-to-pipewelds in medium-diameter RHR-piping (Table B-5, page 68); (5.89E-07 × 0.44)/37 = 7.00E-09.

SKI Report 98:30 52
8. LOCA Frequencies in Barsebäck-1 PSA
The application study resulted in a set of new LOCA initiating event frequenciesfor input to the Barsebäck-1 PSA. As such, the estimation of new LOCA frequencieswas subservient to the overall R&D program objective, however. The ultimate objectivewas to demonstrate an application of a piping failure database. Chapter 8 presentsresults, insights and implications relative to future PSA applications.
8.1 LOCA Categories in Barsebäck-1 PSA
The definition of LOCA categories (Figure 8-1) built on an integrated evaluation oflocation-dependent pipe ruptures and dynamic effects of pipe whips and steam/water jetson piping and pipe insulation adjacent to the rupture. This approach to defining LOCAconsidered structural failures in any of the circa 4,000 RCPB-piping components. Anevaluation of pipe break consequences lead to identification of dynamic effectsimpacting plant and operator response to LOCA.
MEDIUM & LARGELOCA CATEGORIES
Small to Large PipeFracture
Large-Diameter RCPBPiping > DN250
Medium-Diameter RCPBPiping <= DN250
???
Double-ended Guillotine Breakor Very Large Fracture
L-LOCA / B-TAF(Below top of Active Fuel)
M-LOCA / B-TAFM-LOCA / A-TAF
DynamicEffects?
Location-dependent LOCA categories withoutsignificant, incapacitating dynamic effect
Location-dependent LOCA categories withsignificant dynamic effects impacting small- ormedium-diameter piping inside containment
Yes
L-LOCA / A-TAF(Above top of Active Fuel)
No
Figure 8-1: Medium & Large LOCA Categories in Barsebäck-1 PSA.
As a simplifying assumption, a large- or medium LOCA was classified on the basisof pipe diameter at the location of failure. A rupture in large-diameter piping causes theequivalent of a large LOCA. A large leak in a large-diameter piping causes theequivalent of a medium- to small-LOCA.

SKI Report 98:30 53
8.2 New LOCA Frequencies
Table 8-1 summarizes the new LOCA frequencies. Table 8-2 is a comparison withthe current version of Barsebäck-1 PSA (December 1998) using old data (based onWASH-1400), and NUREG/CR-5750 (Poloski et al, 1999), respectively.
Table 8-1: LOCA Frequencies in Barsebäck-1 PSA - Proposed Values.
Category Definition / Boundary Condition(s)Frequency -
Mean [1/year]AT.1 DEGB of System 323, Loop 1 (DN200-250) 1.25E-07
AT.1.1 DEGB of System 323, Loop 1 (DN250). Consequential rupture inSystem 322.
1.49E-08
AT.2 DEGB of System 323, Loop 2 (DN250) 1.64E-07AT.3 DEGB of System 312 (DN200-350), or System 321 (DN200), or
System 327 (DN250).8.48E-06
AT.3.1 DEGB in the portion of System 312 (DN250) that could causeconsequential rupture in System 322.
1.12E-07
AT.4 DEGB in System 311/314 (DN125-500) 3.74E-07AT.4.1 DEGB of System 311 (DN500). Consequential break in System
313/321.5.18E-08
AT.4.2 DEGB of System 311 (DN500). Consequential break in System312/321.
8.61E-09
AT.4.3 DEGB of System 311 (DN500). Consequential pipe break inSystem 723 (CCW).
1.39E-09
AT.4.4 DEGB of System 311 (DN500). Consequential breaks in RPVlevel indication system and System 723.
1.27E-08
AT.4.5 DEGB of System 311 (DN500). Consequential break in RPV levelindication system.
1.82E-08
Large LOCA (A-TAF); total: 9.36E-06S1T.1 Rupture in System 323 Loop 1 (DN100), or fracture in piping
corresponding to AT.12.77E-07
S1T.2 Rupture in System 323 Loop 2 (DN100), or fracture in pipingcorresponding to AT.2
3.88E-07
S1T.3 DEGB of System 351, or fracture in piping corresponding to AT.3 1.86E-06S1T.4 DEGB of System 311/314 (DN50-80), System 326, or fracture in
piping corresponding to AT.4 and AT.4.1-52.36E-07
Medium LOCA (A-TAF); total: 2.76E-06AB.1 DEGB of System 313 (DN200-600) piping or DEGB of System
321 (DN250) connecting to System 313.1.83E-06
Large LOCA (B-TAF); total: 1.83E-06S1B.1 Rupture of System 313 (DN100-150) or System 321 (DN150) or
System 326 connecting to System 313 or fracture in pipingcorresponding to AB.1
3.99E-07
S1B.1.1 DEGB of System 326 piping and consequential break in RPVlevel indication piping/tubing.
1.96E-07
S1B.2 DEGB of System 354 piping (Sum of 17 ‘scram groups’) 4.14E-05Medium LOCA (B-TAF); total: 4.20E-05

SKI Report 98:30 54
Table 8-2: Comparison of LOCA Frequencies (Mean Values).Category This Project
[1/year]Barsebäck-1 PSA(BKAB, 1998) 32
[1/year]
NUREG/CR-5750(Poloski et al, 1999)
[1/year]Large LOCA
(A-TAF); total:9.36E-06 1.39E-04 --
Medium LOCA(A-TAF); total:
2.76E-06 4.56E-04 --
Large LOCA(B-TAF); total:
1.83E-06 1.08E-04 --
Medium LOCA(B-TAF); total:
4.20E-05 7.63E-04 --
TOTAL LARGELOCA:
1.1E-05 2.5E-04 3.0E-05
TOTAL MEDIUMLOCA:
4.5E-05 1.2E-03 4.0E-05
8.3 Study Insights
The above results relate to specific degradation and failure mechanisms andvulnerabilities specific to RCPB piping systems in Barsebäck-1. As examples, Figure 8-1through 8-3 display contributions to large and medium LOCA from different pipe breaklocations above top-of-active-fuel (TAF).
8.48E-06
3.74E-07
1.64E-07
1.25E-07
1.12E-07
5.18E-08
1.82E-08
1.49E-08
1.27E-08
8.61E-09
1.39E-09
1.00E-09 1.00E-08 1.00E-07 1.00E-06 1.00E-05 1.00E-04
AT.3
AT.4
AT.2
AT.1
AT.3.1
AT.4.1
AT.4.5
AT.1.1
AT.4.4
AT.4.2
AT.4.3
Figure 8-1: Contributors to Large LOCA - Pipe Break Above TAF.
32 Based on PSA_VER1 (see Chapter 4) and data from WASH-1400.
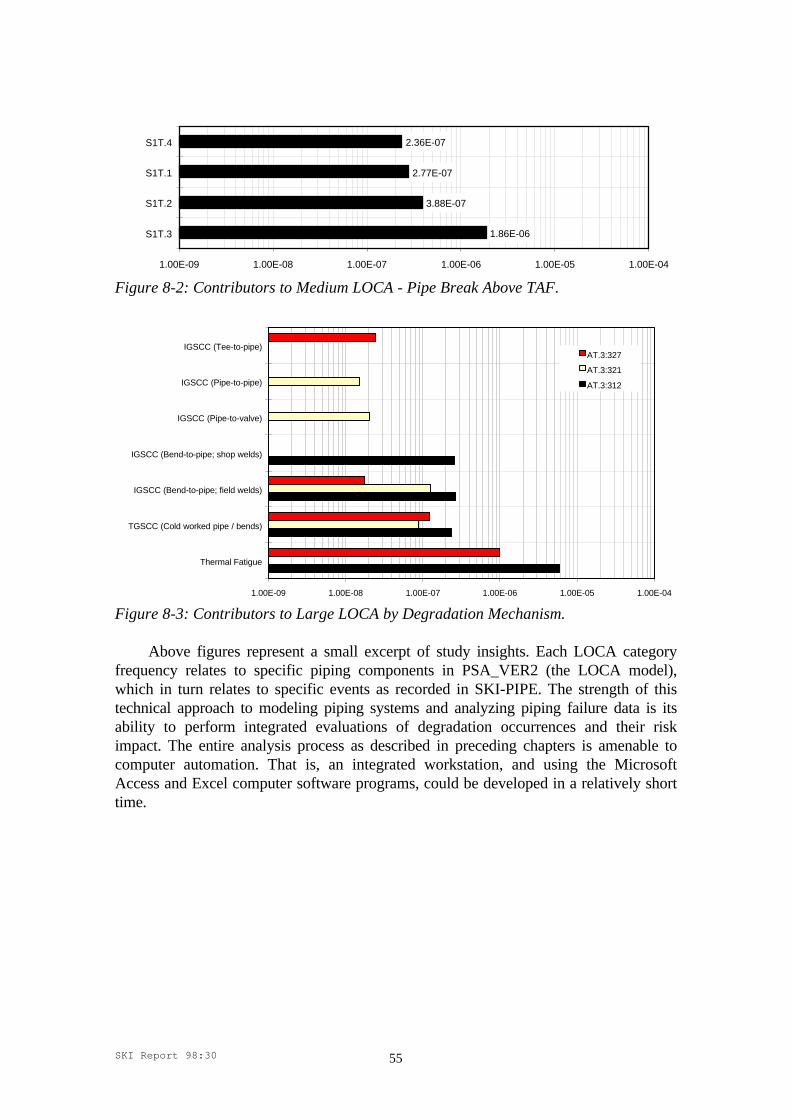
SKI Report 98:30 55
1.86E-06
3.88E-07
2.77E-07
2.36E-07
1.00E-09 1.00E-08 1.00E-07 1.00E-06 1.00E-05 1.00E-04
S1T.3
S1T.2
S1T.1
S1T.4
Figure 8-2: Contributors to Medium LOCA - Pipe Break Above TAF.
1.00E-09 1.00E-08 1.00E-07 1.00E-06 1.00E-05 1.00E-04
Thermal Fatigue
TGSCC (Cold worked pipe / bends)
IGSCC (Bend-to-pipe; field welds)
IGSCC (Bend-to-pipe; shop welds)
IGSCC (Pipe-to-valve)
IGSCC (Pipe-to-pipe)
IGSCC (Tee-to-pipe)AT.3:327
AT.3:321
AT.3:312
Figure 8-3: Contributors to Large LOCA by Degradation Mechanism.
Above figures represent a small excerpt of study insights. Each LOCA categoryfrequency relates to specific piping components in PSA_VER2 (the LOCA model),which in turn relates to specific events as recorded in SKI-PIPE. The strength of thistechnical approach to modeling piping systems and analyzing piping failure data is itsability to perform integrated evaluations of degradation occurrences and their riskimpact. The entire analysis process as described in preceding chapters is amenable tocomputer automation. That is, an integrated workstation, and using the MicrosoftAccess and Excel computer software programs, could be developed in a relatively shorttime.

SKI Report 98:30 56
9. Review of Technical Issues
Chapter 9 discusses five technical issues in piping reliability analysis: 1) Sensitivityand uncertainty analysis; 2) Justifications of detailed probabilistic modeling; 3)Integration of PSA methods and material sciences; 4) Direct estimation of pipe rupturefrequency versus probabilistic fracture mechanics; and 5) Location-dependency of weldfailures due to IGSCC.
9.1 Issues in Sensitivity & Uncertainty Analysis
Much of the failure data on RCPB piping reflects results of ISI programs anddetection of flaws in base metal and weld metal. Therefore, the coverage andcompleteness of the piping failure database are directly proportional to the effectiveness(i.e., reliability) of ISI. An inherent source of data uncertainty stems from the evolvinginspection methods. In recognition of human factors (Bauer, 1994; Enkvist, Edland andSvenson, 1999) and technical limitations (Doctor, Lemaitre and Crutzen, 1995), thereliability of ISI using non-destructive examination methods33 has been the subject ofsignificant R&D. All along, power plant organizations have made efforts to ensure highISI reliability by relying on independent verifications of results. It is difficult todetermine by how much the piping failure database under-estimates the absolute numberof piping degradations due to the evolving ISI programs, however.
The given pipe rupture and LOCA frequencies are predicted values based oninterpretation and statistical analysis of piping failure data. The rupture frequencies aresensitive to the completeness of service data and the intrinsic assumptions of the dataanalysis approach.
The results are specific to Barsebäck-1. Over the years, piping replacements havebeen made using low- and extra-low carbon content stainless steels to mitigate IGSCC.The reliability parameter estimation explicitly accounted for different grades of stainlesssteel in the RCPB-piping. Because of the unique piping design, the new LOCAfrequencies are not directly applicable to other BWR units. Validation of LOCAfrequencies for application to any other PSA project by referencing SKI Report 98:30would be inadmissible. The estimation of pipe rupture frequencies is non-trivial, and thestatistical analysis involved several steps:
• Degradation evaluation to determine the predominant degradation mechanisms. Aqualitative evaluation of susceptibility to degradation mechanisms was done on thebasis of service experience specific to Barsebäck-1 and industry-wide serviceexperience as documented in SKI-PIPE.
33 For example, automated or manual ultrasonic testing, X-ray techniques, visual testing, eddy currenttetsting.

SKI Report 98:30 57
• Organizing service data according to specific attributes and reliability influencefactors. A critical step involved collecting data of sufficient quality, and evaluatingthe data against specific definitions of failure.
• Verification of data quality. The quality of failure data and parameter estimates was
ensured by validation for completeness and accuracy. Full text event reports werereviewed so that ‘illegal data’ were removed from pooled data prior to parameterestimation.
• The parameter estimation involved PSA-style Bayesian updates of prior failure
distributions as well as formal statistical analysis by fitting statistical distributions tothe data. In the Bayesian analysis, the definition of prior distributions wasinfluenced by the way the service data were organized and evaluated.
Determining accurate piping component exposure data proved difficult, tediousand uncertain. Except for the subject plant and selected systems in other plants, adetailed count of RCPB piping components in the range of plants of different designvintage in the SKI-PIPE was not pursued. For IGSCC-susceptible piping the databasesupported determination of the rate of cracking by weld location. This then was used todetermine reliability parameters on the basis of expected failure location. Next,component counts specific to Barsebäck-1 were used to estimate the reliabilityparameters on a component basis.
An omission in the qualitative failure data evaluations would impact the predictedreliability parameters. Repeated database queries and data verification minimized theopportunity for omissions. Following the initial data analysis during April - September1998, the piping failure database was expanded to determine the robustness of theoriginal analysis insights. The impact on estimated rupture frequencies would have beenconsiderable had the database expansion revealed new significant leaks or ruptures. Asan example, for any given set of attribute-influence, the impact of a single rupture eventwould raise an original mean rupture frequency by at least a factor of 3.
A formal uncertainty analysis was outside the work scope. The application studywas a ‘proof-of-principles study.’ The sources of statistical uncertainty are many,however. Each step to specialize service data impacts the uncertainty bounds onestimated parameters. Qualitative as well as quantitative information on the serviceexperience supported the grouping of data according to attribute-influence sets. In aformal uncertainty analysis, each step to specialize should be evaluated. As outlined inChapter 10, additional R&D should be pursued to more fully explore the entire failuredatabase.
9.2 Justifications for Detailed Modeling
Pursuit of detailed modeling solely to demonstrate low or very low LOCAfrequencies is an insufficient justification. Instead, the justifications behind the detailed

SKI Report 98:30 58
modeling of RCPB piping extend far beyond the prediction of plant-specific LOCAfrequencies. Two technical reasons should determine the need for detailed modeling.
First, an added realism to the event tree and fault tree models of the plant responseto LOCAs of different size and location, and with different dynamic effects on importantplant equipment enable pro-active risk management or monitoring. As an example, theBarsebäck-1 PSA considers dynamic effects of a pipe whip (following a DEGB)involving the stripping of insulation material from adjacent piping.
Second, using reliability models and parameter estimation approach by this projectsupports PSA applications such as risk-informed ISI, and PSA-based event analysis.Successful risk-informed ISI projects would require validated pipe rupture frequencies,where validation is accomplished through evaluations of applicable service experiencedata. This application study with Barsebäck-1 as reference plant is an alternative to thetechnical options to risk-informed ISI described in NUREG-1661 (Guttmann et al,1999).
9.3 PSA Methods & Material Sciences
The application study was a demonstration of how to use of a piping failure data toderive pipe rupture frequencies. The author of this report does recognize the strengthsand weaknesses of probabilistic fracture mechanics (PFM). An important analyticalstrength of PFM evaluations is the correlation of pipe leaks and ruptures to specific leakrates and size of pipe fracture.
In its present form, the data analysis approach to frequency estimation does notcharacterize pipe ruptures by leak rate. A rupture was interpreted to be an event causinga release of process medium well beyond the plant technical specification leak rate limits.A significant advancement would be to couple data analysis to a physical model (such asa PFM model), and thereby relating frequency of failure to pipe fracture size.
9.4 Direct Estimation versus PFM
Direct estimation using a piping failure database is technically viable, and a cost-effective approach to piping reliability analysis. The direct estimation is not a short-cutapproach, however. The level of effort involved in collecting and analyzing data isconsiderable. Yet, on a system-wide basis, the direct estimation could providesubstantial savings in engineering effort versus the PFM-approach. Also, directestimation is compatible with the tools and techniques of PSA, and it makes a closerconnection with ISI-findings and operational data.

SKI Report 98:30 59
9.5 Location Dependency of Weld Failures
The ‘location dependency’ concept was introduced in Chapter 3. It was formulatedto address two problems in piping component reliability analysis: 1) Lack of detailedpiping component population data for the full range of BWR plants covered by thepiping failure database; and 2) The possibility that some weld locations could be moreprone to IGSCC than others because due to the ease or difficulty of welding. Also, thestudy needed a simplified way of generating piping component reliability data to fullysupport the Barsebäck-1 RCPB piping reliability model. The concept is a source ofuncertainty, however.

SKI Report 98:30 60
10. Conclusions and Recommendations
The application study on RCPB piping reliability was performed to demonstratebasic piping failure data analysis principles. It was a ‘proof-of-principle’ study, andshould not be seen as an all-inclusive, ultimate piping reliability analysis. As outlinedbelow, routine applications of the technical approach would require additionalmethodological enhancements.
10.1 Conclusions
In Barsebäck-1, important contributions to the LOCA frequency come from pipebreaks that are due to thermal fatigue. Other significant LOCA frequency contributionsare due to TGSCC/IGSCC in base metal of bends in cold worked medium-diameterpiping. Compared with the seminal WASH-1400, the new medium- and large LOCAfrequencies are lower by about an order of magnitude.
The study tried two different approaches to piping failure rate estimation: 1) ‘PSA-style’, simple estimation using Bayesian statistics, and 2) Fitting of statistical distributionto failure data. A large, validated database on piping failures (like SKI-PIPE) supportsboth approaches. The ability to perform failure rate estimation is limited by thecompleteness of the piping failure database. There is significant statistical uncertainty infailure rates for RCPB piping susceptible to thermal fatigue and flow-assisted corrosionin RCPB piping systems.
10.2 Recommendations on Future R&D Directions
Initiated in mid-1994, the R&D supported by SKI’s Department of Plant SafetyAssessment34 resulted in a major piping failure database. With financial and engineeringsupport from BKAB, the 4-year program came to closure through the Barsebäck-1RCPB piping reliability application study.
Without this application, the full potential of the piping failure database could nothave been demonstrated. Also, the application study identified areas in need of furtherR&D. Listed below are recommendations for future R&D and applications: 34 SKI/RA is the organizational acronym.

SKI Report 98:30 61
SKI
• SKI should continue its support of the SKI-PIPE database. Ideally, databasemanagement should eventually be shared by the international nuclear safetycommunity to expand the content, and to enable authorized access by PSAanalysts, structural engineers and ISI personnel. An authorized user would comefrom an organization actively supporting the database with information (e.g.,root cause analysis reports, ISI summary reports) on occurred failures anddegradations.
In the short term, SKI should ensure that new events be added to the database asthey occur. Also, full validation of the quality and completeness of all eventrecords for BWRs as well as PWRs should be prioritized. In the longer term,SKI should promote the database in ongoing national, Nordic and internationalprograms in risk-informed ISI.
• SKI should actively facilitate new R&D in the area of statistical analysis ofpiping failure data, including uncertainty analysis. Such research should addressthe development of appropriate prior distributions for leaks and ruptures inpiping characterized by typical light water reactor attribute-influence sets.Furthermore, some R&D should be performed on data pooling guidelines.Specific questions to be addressed include: a) Guidelines for pooling of datafrom different plant designs; b) The concept of location dependent piping failuresshould be explored in further detail, including establishment of a database onpiping component population data. SKI-PIPE tracks failure data on field weldsversus shop welds. Within the scope of the application study, that particularsubset of failure data was not explored.
• The application study utilized several qualitative and semi-quantitative failure
data insights to facilitate parameter estimation. These ‘database insights’ shouldbe converted into probabilistic quantities; i.e., concepts like the ‘locationdependency’ of weld failures should be characterized by appropriate statisticaldistributions.
• As discussed in Chapter 8, the total approach to pipe rupture frequency
estimation and LOCA frequency estimation is amenable to computer automation.A relatively limited effort would be required to develop an integrated computerworkstation concept building on commercially available spreadsheet anddatabase programs.
• Chapters 3, 5, 6 and 7 presented some baseline and adjusted leak and rupture
frequencies. To prevent misapplications of published data, SKI Report 98:30does not include the full Barsebäck-1 piping reliability database. It is desirablethat high quality, generic reliability data on piping become available to PSAanalysts. Therefore, SKI should consider R&D to develop requirements forgeneric data; e.g., recommended prior and posterior distribution types fordifferent piping, sets of raw data for a range of typical attribute-influence sets.

SKI Report 98:30 62
BKAB
• In BKAB’s living PSA program, familiarity with the LOCA model and dataanalysis approach should be established through model decomposition andsensitivity studies. Chapter 8 presented a very small subset of results. It isrecommended that a detailed summary of results and insights be prepared byPSA engineers for presentation to operations, maintenance, ISI personnel.
• Training of PSA engineers in statistical analysis of piping failure data. A training
program should be developed around SKI Report 98:30. • The project developed a set of ‘look-up’ tables35 summarizing the piping
reliability data applicable to the ten RCPB piping systems in Barsebäck-1. Inedited form, these tables should be included in the PSA engineers’ work booksand be updated as new service data become available.
• Limited to estimation of pipe rupture frequency and LOCA frequency, the work
scope produced PSA_VER2 and a piping component reliability database. Thesedatabases represent major elements towards risk-informed ISI for Barsebäck-1.A near-term application should involve a formal risk-informed ISI programdevelopment.
35 Not included in SKI Report 98:30.

SKI Report 98:30 63
11. References
Aaltonen, P., K. Saarinen and K. Simola, 1993. “The Correlation of IGSCC Propagationwith the Power Plant Transient History,” Int. J. Pres. Ves. & Piping, 55:149-162.
Advisory Committee on Reactor Safeguards (ACRS), 1998. Risk-based InserviceInspection & Loss of Shutdown Cooling at River Bend, Meeting Transcript of the 451st
ACRS, Washington (DC).
Andresen, P.L., 1998. IGSCC Crack Propagation Rate Measurement in BWREnvironments. Executive Summary of a Round Robin Study, SKI Report 98:27,Swedish Nuclear Power Inspectorate, Stockholm (Sweden).
Bauer, C.-O., 1994. “Reliability, Uncertainties, Their Origin and Consequences inPresenting Test Results,” Int. J. Pres. Ves. & Piping, 59:313-322.
Beliczey, S. (Ed.), 1995. Ermittlung der Häufigkeiten von Lecks und Brüchen indruckführended Systemen für probabilistische Sicherheitsanalysen, Gesellschaft fürAnlagen- und Reaktorsicherheit (GRS) mbH, Köln (Germany).
BKAB, 1998. Barsebäck-1 PSA. Section 1.2, T-9812-31 (in Swedish), Barsebäck(Sweden).
Bush, S.H. et al, 1996. Piping Failures in United States Nuclear Power Plants: 1961-1995, SKI Report 96:20, Swedish Nuclear Power Inspectorate, Stockholm (Sweden).
Commonwealth Edison, 1999. Results of the Root Cause Analysis of Flaws in InductionHeat Stress Improvement Treated Recirculation System Piping, SVP-98-376 (withAttachment), Cordova (IL).
Crowder, M.J. et al, 1994. Statistical Analysis of Reliability Data, Chapman & Hall,London (UK), ISBN 0-412-59480-3.
Danko, J.C., 1983. “Boiling Water Reactor Pipe Cracking: The Problem and Solution,”Proc. Materials in Nuclear Energy, American Society for Metals, Metals Park (OH).
Dimitrijevic, V. et al, 1999. Revised Risk-Informed Inservice Inspection EvaluationProcedure, TR-112657, Electric Power Research Institute, Palo Alto (CA).
Doctor, S.R., P. Lemaitre and S. Crutzen, 1995, “Austenitic Steel Piping TestingExercises in PISC,” Nuclear Engineering and Design, 157:231-244.

SKI Report 98:30 64
Enkvist, J., A. Edland and O. Svenson, 1999. Human Factors Aspects of Non-Destructive Testing in the Nuclear Power Context. A Review of Research in the Field,SKI Report 99:8, Swedish Nuclear Power Inspectorate, Stockholm (Sweden).
Erve, M. et al, 1997. “Planned and Implemented Remedial Measures to Prevent IGSCCand to Ensure Safe Plant Operation with BWR Piping Systems Made of StabilizedAustenitic Steels,” Nuclear Engineering and Design, 171:125-136.
Fleming, K.N. and S.R. Gosselin, 1997a. “Evaluation of Pipe Failure Potential viaDegradation Mechanism Assessment,” Proc. ICONE 5: 5th International Conference onNuclear Engineering, May 26-30, Nice (France).
Fleming, K.N. and T.J. Mikschl, 1998. “Application of Markovian Technique toModeling Influences of Inspection on Pipe Rupture Frequencies,” Proc. PSAM-IV,Springer Verlag, New York (NY), pp 463-470.
Fleming, K.N. et al, 1998. Piping System Reliability and Failure Rate EstimationModels for Use in Risk-Informed In-Service Inspection Applications, TR-110161(Proprietary Licensed Material), Electric Power Research Institute, Palo Alto (CA).
Griffith, P., 1997. Screening Reactor Steam/Water Piping Systems for Water Hammer,NUREG/CR-6519, U.S. Nuclear Regulatory Research, Washington (DC).
Kapur, K.C. and L.R. Lamberson, 1977. Reliability in Engineering Design, John Wiley& Sons, Inc., New York (NY), ISBN 0-471-51191-9.
Kassir, M. et al, 1985. An Evaluation of Stress Corrosion Crack Growth in BWR PipingSystems, BNL-NUREG-51874 (NUREG/CR-4221), Brookhaven National Laboratory,Upton (NY)
Lydell, B.O.Y. and R. Nyman, 1996. “Incorporation of Piping System Failures in PSA.Some Basic Analysis Considerations,” Proc. PSA’96, American Nuclear Society, LaGrange Park (IL).
Lydell, B.O.Y. and R. Nyman, 1998. “Systematic Evaluation of Service Data on Piping:A Framework for Effective Aging Management,” Proc. of ICONE-6: 6th InternationalConference on Nuclear Engineering, Paper #6303, American Society of MechanicalEngineers, New York (NY).
Martz, H.F. and R.A. Waller, 1982. Bayesian Reliability Analysis, John Wiley & Sons,Inc., New York (NY), ISBN 0-89464-395-9.
Mehta, H.S. and S.R. Gosselin, 1995. An Environmental Factor Approach to Accountfor Reactor Water Effects in Light Water Reactor Pressure Vessel and Piping FatigueEvaluations, EPRI TR-105759, Electric Power Research Institute, Palo Alto (CA).

SKI Report 98:30 65
Moosemiller, M. and B. Weber, 1998. Guidelines for Improving Plant Reliabilitythrough Data Collection and Analysis, Center for Chemical Process Safety, AmericanInstitute of Chemical Engineers, New York (NY), ISBN 0-8169-0751-X.
Nelson, W., 1972. “Theory and Application of Hazard Plotting for Censored FailureData,” Technometrics, 14:945-966.
New York Power Authority, 1990. Summary of Intergranular Stress CorrosionCracking Inspection During the 1990 Refueling Outage, JPN-90-041, James A.FitzPatrick Nuclear Power Plant, White Plains (NY).
Nyman, R. et al, 1997. Reliability of Piping System Components. Framework forEstimating Failure Parameters from Service Data, SKI Report 97:26, Swedish NuclearPower Inspectorate, Stockholm (Sweden).
Organization for Economic Cooperation and Development, Nuclear Energy Agency(OECD-NEA), 1996. Knowledge Base for Emergency Core Cooling SystemRecirculation Reliability, NEA/CSNI/R (95)11.
Poloski, J.P. et al, 1999 Rates of Initiating Events at U.S. Nuclear Power Plants 1987through 1995, NUREG/CR-5750, U.S. Nuclear Regulatory Commission, Washington(DC).
Rahman, S. et al, 1995. Probabilistic Pipe Fracture Evaluations for Leak-Rate-Detection Applications, BMI-2174 (NUREG/CR-6004), Battelle, Columbus (OH).
Sandstedt, J. (1998). Barsebäck-1 PSA Level 1. Main Report. Section 6.5: Pipe Breaksand Consequential Events, (in Swedish) BKAB.
Shah, V.N., A.G. Ware and A.M. Porter, 1997. Review of Industry Efforts To ManagePressurized Water Reactor Feedwater Nozzle, Piping, and Feedring Cracking and WallThinning, NUREG/CR-6456, U.S. Nuclear Regulatory Commission, Washington (DC).
Siu, N.O. and D.L. Kelly, 1998. “Bayesian Parameter Estimation in Probabilistic RiskAssessment,” Reliability Engineering and System Safety, 62:89-116.
Stevens, G.L., 1998. Evaluation of Environmental Thermal Fatigue on SelectedComponents in a Boiling Water Reactor Plant, EPRI TR-110356, Electric PowerResearch Institute, Palo Alto (CA).
Su, N.T., 1990. Review of Thermal Stratification Operating Experience, AEOD/S902,U.S. Nuclear Regulatory Commission, Washington (DC).
Sydsvenska Värmekraft AB (Sydkraft), 1985. Säkerhetsgranskning BARSEBÄCK 1984,Malmö (Sweden), pp 2-25--26.

SKI Report 98:30 66
U.S. Nuclear Regulatory Commission, 1984. Investigation and Evaluation of StressCorrosion Cracking in Piping of Boiling-Water Reactor Plants, NUREG-1061,Washington (DC).
U.S. Nuclear Regulatory Commission, 1999. Technical Elements of Risk-InformedInservice Inspection Programs for Piping, NUREG-1661 (Draft), Washington (DC).
Van Duyne, D.A., W. Yow, J.W. Sabin, 1992. Water Hammer Prevention, Mitigation,and Accommodation, EPRI NP-6766, Electric Power Research Institute, Palo Alto(CA).
Åström, L., 1997. PSA B1/B2: Survey of Pipe Break Locations Inside the Containment,T-9706-180 (in Swedish), BKAB.

Appendices
SKI Report 98:30 67
A: Abbreviations, Acronyms & Notation
AISI Americal Iron and Steel InstituteASME American Society of Mechanical EngineersASTM American Society for the Testing of MaterialsB/A-CC Boric acid induced stress corrosionBFS Bundesamt für Strahlenschutz (Germany)BKAB Barsebäck Kraft AktiebolagBOP Balance of PlantBRS Bibliographical Retrieval System of the U.S. NRCBWR Boiling water reactorCACD Code allowable crack depthDBA Design Basis AccidentD&C Design & constructionDEGB Double-ended guillotine breakDN Nominal diameter [mm]ELC Austenitic stainless steel of extra-low carbon content (C < 0.03%)EPRI Electric Power Research InstituteFAC Flow Assisted CorrosionGRS Gesellschaft für Anlagen- und ReaktorsicherheitHAZ Heat affected zoneHSK Swiss Federal Nuclear Safety InspectorateHSW Heat sink weldingHWC Hydrogen water chemistryIC Inside containmentIGSCC Intergranular stress corrosion crackingIHSI Induction heating stress improvementINEEL Idaho National Engineering and Environmental LaboratoryISI In-service inspectionLC Austenitic stainless steel of low carbon content (0.03% # C # 0.04%)LER Licensee Event ReportLOCA Loss of coolant accidentLWR Light water reactorMIC Microbiologically-induced corrosionMSIP Mechanical stress improvement processNEA Nuclear Energy Agency of the OECD(Organization for Economic
Cooperation & Development)NDE Non-destructive examinationNRC Nuclear Regulatory CommissionPDR Public Document Room of the NRCPFM Probabilistic fracture mechanicsPSA Probabilistic Safety AssessmentPWR Pressurized water reactorPWSCC Primary Water Stress Corrosion CrackingRCPB Reactor coolant pressure boundary

Appendices
SKI Report 98:30 68
RHR Residual heat removalRPV Reactor Pressure VesselRWCU Reactor water cleanupSCC Stress Corrosion CrackingSHT Solution heat treatmentSKI Statens KärnkraftinspektionSLCS Standby liquid control systemSPIN Standardized Plant Identification NumberTAF Top of active fuelTGSCC Transgranular stress corrosion crackingTTF Time to failureTWC Through-wall crackT&M Test and maintenanceUT Ultrasonic testingVGB Technisches Vereinigung der Grosskraftwerkbetreiber (Germany)WH Water hammerWOR Weld overlay repair
Notation
C-d Censored data. The process of including non-failed items in theparameter estimation. This becomes important when considering rareevents.
F Number of failure events. In the context of calculating the conditionalprobability of pipe rupture, ‘F’ has a specific meaning (see below). Inequation (6.2), ‘F’ also has the meaning of frequency.
FR Frequency of pipe rupture.m Mean time to failure (= 8-1, where 8 is the constant failure rate).MR Median rank; used for skewed distributions, it is a non-parametric
estimate of the cumulative distribution based on ordered failures.r Number of rupture events.pR|F Conditional probability of rupture given a failure, where ‘failure’ implies
a through-wall crack extending 30% of the pipe circumference (i.e.,unstable crack propagation).
T Exposure time" Significance level.$ Shape factor.* Location parameter (or minimum life).'(n) Gamma functionP2 Chi-square distribution.: Meanθ Characteristic life

Appendices
SKI Report 98:30 69
Swedish Standardized Plant System IdentificationNumbers (SPINs)
200-Series, A Selection
211 Reactor pressure vessel (RPV)213 Core spray nozzle assemblies221 Control rod drive assemblies
300-Series, A Selection
311 Main steam system312 Main feedwater system313 Recirculation system (Reactor coolant system, PWR)314 Main steam pressure relief system316 Containment pressure suppression system321 Residual heat removal system322 Containment spray system323 Emergency core cooling system326 RPV head cooling system327 Auxiliary feedwater system331 Reactor water cleanup system351 Boron injection system352 Reactor controlled drain system354 Hydraulic scram system

Appendices
SKI Report 98:30 70
B: Barsebäck-1 RCPB Piping Component Counts
Table B-1: Main Steam Piping System Components - System 311.Component
TypeLocation of Weld Nominal
Diameter[DN]
No. ofComponents
(ELC-SS)
No. ofComponents
(HC-SS)
No. ofComponents
(CS)Bend N/A 50
80500
000
000
682623
Pipe N/A 5080500
004
12625
8190
Tee N/A 5080500
000
000
121
10Weld Bend-to-bend
Bend-to-pipeBend-to-valveBend-to-tee
Nozzle-to-pipeSafe-end-to-bend
Pipe-to-pipePipe-to-valve
Safe-end-to-pipeSafe-end-to-tee
Tee-to-pipeTee-to-valve
50 000000000000
000100000000
2111
95151
2433
232
Weld Bend-to-pipeBend-to-valveBend-to-teePipe-to-pipePipe-to-valve
Safe-end-to-pipeTee-to-pipeTee-to-valve
80 00000000
220310400
301031011
Weld Pipe-to-valveTee-to-valve
150 00
20
02
Weld Tee-to-valve 175 0 0 10Weld Bend-to-pipe
Bend-to-teeBend-to-valveNozzle-to-pipe
Pipe-to-pipePipe-to-valve
Safe-end-to-bendSafe-end-to-pipe
Tee-to-pipeTee-to-valve
500 21310050122
17410121160
2001001001

Appendices
SKI Report 98:30 71
Table B-2: Main Feedwater Piping System Components - System 312.Component
TypeLocation of Weld Nominal
Diameter[DN]
No. ofComponents
(ELC-SS)
No. ofComponents
(LC-SS)
No. ofComponents
(HC-SS)Bend N/A 250
35001
00
250
Pipe N/A 250350
01
00
252
Tee N/A 200350
00
00
24
Weld Tee-to-tee 200 1 0 0Weld Bend-to-bend
Bend-to-pipeBend-to-tee
Bend-to-valveNozzle-to-pipePipe-to-valveTee-to-pipe
250 0000000
01432030
42601431
Weld Bend-to-pipeBend-to-valvePipe-to-pipePipe-to-valve
Safe-end-to-safe-end
Safe-end-to-teeTee-to-pipe
350 01010
02
00010
22
10121
00
Table B-3.1: Recirculation Piping System Components - System 313.Comp.Type
Location ofWeld
NominalDiam.[DN]
No. ofComponents
(ELC-SS)
No. ofComponents
(LC-SS)
No. ofComponents
(HC-SS)
No. ofComponents
(CS/SS)Bend N/A 100
200600
200
000
780
00
12Pipe N/A 100
200600650
3000
0001
12863
00
140
Weld Bend-to-pipeNozzle-to-pipe
Pipe-to-pipePipe-to-tee
Pipe-to-valve
100 40200
00000
122127
00000
Weld Bend-to-nozzle
Buttring-to-nozzle
Buttring-to-valve
150 0
0
0
0
0
0
10
16
16
0
0
0
Weld Bend-to-pipeBend-to-valveNozzle-to-pipePipe-to-valve
200 0000
3100
9271
0000

Appendices
SKI Report 98:30 72
Table B-3.2: Recirculation Piping System Components - System 313.Comp.Type
Location ofWeld
NominalDiam.[DN]
No. ofComponents
(ELC-SS)
No. ofComponents
(LC-SS)
No. ofComponents
(HC-SS)
No. ofComponents
(CS/SS)Weld Nozzle-to-pipe 250 0 0 1 0Weld Bend-to-pipe
Bend-to-valveNozzle-to-pipePipe-to-pumpPipe-to-valve
Pipe-to-venturiSafe-end-to-
pipeValve-to-pump
Valve-to-venturi
600 0000000
0
0
0000000
4
4
0004148
0
0
20420300
0
0
Table B-4.1: Main Steam Pressure Relief Piping System Components - System 314.Component
TypeLocation of Weld Nominal
Diameter[DN]
No. ofComponents
(ELC-SS)
No. ofComponents
(LC-SS)
No. ofComponents
(CS)Bend N/A 125
150250
000
000
723917
Pipe N/A 50125150250
0000
0000
21295731
Reducer N/A 125 x 150150 x 250
00
00
145
Tee N/A 125150250
000
000
21214
Weld Nozzle-to-bendNozzle-to-pipe
50 00
00
31
Weld Bend-to-pipePipe-to-pipe
Pipe-to-reducerTee-to-pipe
125 0000
0000
124492
14Weld Bend-to-bend
Bend-to-pipeBend-to-reducer
Bend-to-teeBend-to-valvePipe-to-pipe
Pipe-to-reducerPipe-to-valve
Safe-end-to-bendSafe-end-to-pipe
Tee-to-pipeTee-to-reducer
150 000000000000
000000000000
2664314411
20162

Appendices
SKI Report 98:30 73
Table B-4.2: Main Steam Pressure Relief Piping System Components - System 314.Component
TypeLocation of Weld Nominal
Diameter[DN]
No. ofComponents
(ELC-SS)
No. ofComponents
(LC-SS)
No. ofComponents
(CS)Weld Bend-to-pipe
Bend-to-teeBend-to-valvePipe-to-pipePipe-to-valveTee-to-pipe
Tee-to-reducer
250 0000000
0000000
2742
103
175
Table B-5: Residual Heat Removal Piping System Components - System 321.Component
TypeLocation of Weld Nominal
Diameter[DN]
No. ofComponents
(ELC-SS)
No. ofComponents
(LC-SS)
No. ofComponents
(HC-SS)Bend N/A 150
200250
000
000
5104
Pipe N/A 150200250
001
000
5156
Tee N/A 250 0 0 1Weld Bend-to-pipe
Bend-to-penetrationBend-to-tee
Pipe-to-valve
150 00
10
41
00
40
02
Weld Bend-to-pipeBend-to-valve
Pipe-to-penetrationPipe-to-pipe
Pipe-to-reducerPipe-to-valveTee-to-pipe
200 000
0000
820
1200
1201
3222
Weld Bend-to-pipeBend-to-valve
Pipe-to-penetration
Pipe-to-valveTee-to-pipe
250 100
00
501
01
220
22

Appendices
SKI Report 98:30 74
Table B-6: Core Spray Piping System Components - System 323.Component
TypeLocation of Weld Nominal
Diameter[DN]
No. ofComponents
(ELC-SS)
No. ofComponents
(LC-SS)
No. ofComponents
(HC-SS)Bend N/A 80
100200250
0000
0000
23819
Pipe N/A 80100250
001
001
4329
Tee N/A 250 0 0 1Weld Bend-to-pipe
Pipe-to-pipePipe-to-valve
80 000
000
422
Weld Bend-to-bendBend-to-pipeBend-to-teePipe-to-pipeTee-to-pipe
100 334200
00005
817071
Weld Bend-to-pipeBend-to-teeTee-to-valve
200 000
000
111
Weld Bend-to-pipeBend-to-tee
Bend-to-valvePipe-to-valveTee-to-pipe
250 00000
111001
40160
Table B-7: RPV Head Cooling Piping System Components - System 326.Component
TypeLocation of Weld Nominal
Diameter[DN]
No. ofComponents
(ELC-SS)
No. ofComponents
(LC-SS)
No. ofComponents
(HC-SS)Bend N/A 150 0 0 15Pipe N/A 150 0 0 21Tee N/A 150 0 0 1
Weld Bend-to-pipePipe-to-flangePipe-to-pipePipe-to-valve
Pipe-to-venturiSafe-end-to-bend
Safe-end-to-nozzle
Tee-to-pipe
150 0100010
1
14100000
1
15014201
3

Appendices
SKI Report 98:30 75
Table B-8: Auxiliary Feedwater Piping System Components - System 327.Component
TypeLocation of Weld Nominal
Diameter[DN]
No. ofComponents
(ELC-SS)
No. ofComponents
(LC-SS)
No. ofComponents
(HC-SS)Bend N/A 125
15032
00
32
Pipe N/A 125150
00
60
16
Reducer N/A 150 x 200 0 0 1Tee N/A 150 0 0 1
Weld Bend-to-pipePipe-to-pipePipe-to-valve
125 000
621
010
Weld Bend-to-pipeBend-to-tee
Nozzle-to-pipePipe-to-pipe
Pipe-to-reducerPipe-to-valveTee-to-pipe
150 0000000
0000000
2122131
Weld Reducer-to-valve 200 0 1 0
Table B-9: Standby Liquid Control Piping System Components - System 351.Component
TypeLocation of Weld Nominal
Diameter[DN]
No. ofComponents
(ELC-SS)
No. ofComponents
(LC-SS)
No. ofComponents
(HC-SS)Bend N/A 50 11 0 11Pipe N/A 50 0 0 18Weld Bend-to-bend
Bend-to-pipeNozzle-to-bend
Pipe-to-penetration
Pipe-to-valve
50 31110
0
0000
1
51612
7

Appendices
SKI Report 98:30 76
Table B-10: Hydraulic Scram Piping System Components - System 354.Component
TypeLocation of Weld Nominal
Diameter[DN]
No. ofComponents
(ELC-SS)
No. ofComponents
(LC-SS)
No. ofComponents
(HC-SS)Bend N/A 15
2565
000
000
5023551
Pipe N/A 1565
00
00
7111
Reducer N/A 65 x 80 1 0 29Tee N/A 15 0 0 7
Weld Bend-to-pipeBend-to-tee
Bend-to-valveTee-to-pipe
15 0000
0000
16
2313
Weld Nozzle-to-pipePipe-to-valve
25 5110
00
598
Weld Bend-to-bendBend-to-pipeBend-to-valveNozzle-to-pipe
Pipe-to-pipePipe-to-valve
Reducer-to-bend
65 0000001
0000000
3521
9821
30Weld Reducer-to-valve 80 0 12 18

Appendices
SKI Report 98:30 77
C: SKI-PIPE - The Database Content59
Covering the period 1970 to the present, SKI-PIPE (MS-Access 7.0) is a periodicallyupdated database on piping failures in commercial nuclear power plants worldwide.Figure C-1 shows an overview of the database content as of December 1998. The‘Master Database’ includes 3080 piping failure reports. Four subsets of the MasterDatabase are: 1) Piping failures in Soviet designed reactors (about 180 failure reports);2) Weld failures due to IGSCC in BWRs (about 800 failure reports); 3) Piping failuresspecific to Barsebäck-1/2 (55 failure reports); and 4) Database supporting agingevaluations.
Figure C-1: Overview of SKI-PIPE Database - Status as of 12/98.
The database includes public domain and proprietary data as indicated in Figure C-2.Examples of proprietary data include failure reports supplied by utilities to the databasedevelopment project. These were reports excluded from normal licensee reporting tosafety authorities. Figure C-3 shows the coverage of BWR units. Except for JapaneseBWR units, the database covers almost all, currently operating commercial BWR units.Figure C-4 shows piping failures by degradation mechanisms in Swedish BWR units.Most of the database records are for U.S. plants, supplemented with data fromEuropean (France, Germany, Switzerland) and Nordic plants (Table C-1). Finally, TableC-2 shows the database coverage of IGSCC events in BWRs worldwide. 59 Status as of December 31, 1998.

Appendices
SKI Report 98:30 78
U.S. NRC LERs, Inspection Reports,Daily Event Reports, Augmented Inspection
Team (AIT) Reports
Swedish 'RO' Reports(Reportable Occurrences)
Public Domain Data Sources
Annual Reports by HSK inSwitzerland
IAEA Annual Report; 'OperatingExperience With Nuclear Power
Stations in Member States'
Restricted DataSources
IAEA/NEA: 'Advanced IncidentReporting System Database
(AIRS)'
Imatran Voima Oy (Finland)Proprietary DataSources
BKAB (Sweden)
VGB, Germany
KKL - Kernkraftwerk Leibstadt AG,Switzerland
Annual & Quarterly Event ReportsPublished by BfS in Germany
Private communications(e.g., various tele-com. notes
based on direct communicationswith utilties & authorities in different countries)
Figure C-2: Examples of Data Sources in SKI-PIPE.
0
200
400
600
800
1000
1200
1400
1600
1970
1972
1974
1976
1978
1980
1982
1984
1986
1988
1990
1992
1994
1996
1998
Cu
mu
lati
ve N
o. o
f B
WR
-Yea
rs
0
10
20
30
40
50
60
70
80
90
No
. of
Co
mm
erci
al B
WR
Un
its
Reactor-Years (IAEA Statistics)
Reactor-Years (PIPE-98:3.mdb)
Total No. of BWR Units (IAEA Statistics)
No. of BWR Units in PIPE-98:3.mdb
Figure C-3: The Coverage of SKI-PIPE - Currently Operating BWR Units

Appendices
SKI Report 98:30 79
92
26
21
8
8
7
6
4
0 10 20 30 40 50 60 70 80 90 100
IGSCC
Vibration-fatigue
Thermal fatigue
Manufacturing defect
Other
Severe overloading
Erosion-corrosion
Corrosion
Number of Events
172 failure events(Piping failures only)
Figure C-4: Piping Failures in Swedish BWRs 1972-1998.
Table C-1: Database Coverage by Country.Country All
EventsCracks
[No. of Events]Leaks
[No. of Events]Ruptures
[No. of Events]Argentina 6 5 1 0Belgium 5 1 3 1Brazil 1 0 1 0
Bulgaria 8 0 7 1Canada 84 6 68 10
Czech Republic 9 0 9 0Finland 25 8 15 2France 46 12 27 7
Germany (5%) 160 98 57 5Hungary 9 0 4 5
India 6 0 4 2Japan 22 0 21 1Korea 5 0 3 2
Lithuania 9 0 7 2Netherlands 3 1 1 1
Pakistan 5 0 3 2Russia 85 5 64 16
Slovak Republic 12 0 11 1Slowenia 3 0 2 1
Spain 9 4 3 2South Africa 2 0 1 1Sweden (6%) 192 99 75 18Switzerland 46 36 8 2
Ukraine 26 2 22 2United Kingdom60 1 0 1 0
USA (75%36) 2324 468 1712 144Column Summary: 3103 745 2130 228
60 Sizewell ‘B’; no data on piping failures in gas-cooled reactors included in database.36 The percentage of U.S. event reports to the total number of reports.

Appendices
SKI Report 98:30 80
Table C-2: Summary of IGSCC and Weld Overlay Repairs in BWRs.NUREG-1061 (1984) SKI-PIPE (1999)
Plant Name # Cracks # WORs # Cracks # WORs RemarkBarsebäck-1 -- -- 20 0Barsebäck-2 -- -- 13 3 New RHR in 1998.Forsmark-1 -- -- 2 0Forsmark-2 -- -- 6 0Forsmark-3 -- -- 3 0Gundremmingen-B -- -- 1 0KKB Brunsbüttel -- -- 36 0KKI Isar-1 -- -- 25 0KKK Krümmel -- -- 2 0KKP1 Phillipsburg-1 -- -- 28 0Muehleberg -- -- 34 7 New piping in 1985.Oskarshamn-1 -- -- 15 0 New piping 1993-95.Oskarshamn-2 -- -- 7 0Ringhals-1 -- -- 25 1Santa Maria de Garona -- -- 5 4TVO-1 -- -- 4 4TVO-2 -- -- 1 1Big Rock Point -- -- 4 0Browns Ferry-1 47 42 35 0Browns Ferry-2 2 0 7 1Browns Ferry-3 0 0 4 0Brunswick-1 3 3 15 8Brunswick-2 16 8 41 36Cooper 20 13 20 15Dresden-1 0 0 4 0Dresden-2 10 7 53 15Dresden-3 64 61 72 63 IHSI in 12/83Duane Arnold 0 0 20 11 IHSI in 3/85FitzPatrick 1 0 23 14Grand Gulf-1 -- -- 1 0Hatch-1 7 6 42 23Hatch-2 39 27 2 1Hope Creek-1 -- -- 1 1Millstone-1 0 0 31 21Monticello 6 6 11 1Nine Mile Point-1 53 0 11 0Nine Mile Point-2 -- -- 1 0Oyster Creek 0 0 4 0Peach Bottom-2 26 21 4 0Peach Bottom-3 15 15 22 20Pilgrim -- -- 9 0 ‘NG’ piping in 1984Quad Cities-1 0 0 33 19Quad Cities-2 22 9 58 18 IHSI in 83/84Vermont Yankee 34 22 19 9
Totals: 365 240 227+54737 20+276 37 Foreign + U.S. data.

Appendices
SKI Report 98:30 81
D: Database Structures - PSA_VER2 & SKI-PIPE
The Barsebäck-1 RCPB piping design information was collected in PSA_VER2 (MS-Access 7.0). Originally developed by BKAB personnel, this database was independentlyreviewed for completeness and accuracy as part of the work scope of the R&D project.The database structure is summarized in Table D-1. The new data fields, which wereadded to support the reliability parameter estimation and LOCA frequency calculationare indicated by asterisks.
SKI-PIPE (MS-Access 7.0) is SKI’s database on piping degradations and failures incommercial nuclear power plants worldwide. Queries in this database were instrumentalin processing the raw data for statistical analysis. The database structure is summarizedin Table D-2.
Table D-1.1: PSA_VER2 - Description of Data Fields.Field Name Type Description
Component ID Number Unique component ID; each piping component on the isometricdrawings were given a unique identity. All isometric drawings weremarked-up accordingly.
System Number Unit 1 SPIN; i.e., 311, 312, 313, etc.Drawing No. Text Isometric drawing number.
Component Type Text Type of component; e.g., bend, pipe, weld, tee. This data fielddistinguishes between field-fabricated (F) and shop-fabricated (S)welds.
* Weld Location Text Defines where in a system a particular weld is located; e.g., BP =bend-to-pipe weld, PP = pipe-to-pipe weld, PV = pipe-to-valveweld, etc.
Object Text Weld number (as given by isometric drawing), bend angle (e.g.,45°, 90°)
* LOCA Class Text LOCA category as defined by PSA; A = large LOCA, S1 = mediumLOCA, T = break location above TAF, B = break location belowTAF, etc.
DN Text Nominal diameter* f-DEGB Number Predicted break frequency.
Temperature Text Operating temperature of process medium; < 100 °C, 100-150°C, or> 150 °C
CHARGE_A Text Material composition identity as provided by manufacturer. Forbase metal in weld joint towards the lower isometric drawingnumber.
CHARGE_B Text Material composition identity as provided by manufacturer. Forbase metal in weld joint towards the higher isometric drawingnumber.
Material_A Text Type of base material (in ‘A-side’) per national standard; e.g., SS2343-24 (austenitic stainless steel).
Material_B Text Type of base material (in ‘B-side’) per national standard; e.g., SS2343-24 (austenitic stainless steel).
Carbon_A Text For stainless steels, carbon content of base material (in ‘A-side’); <0.03, 0.03-0.04, > 0.04% C.
Carbon_B Text For stainless steels, carbon content of base material (in ‘B-side’); <0.03, 0.03-0.04, > 0.04% C.

Appendices
SKI Report 98:30 82
Table D-1.2: PSA_VER2 - Description of Data Fields.Field Name Type Description
fGB Number Frequency of DEGB based on WASH-1400 data and engineeringjudgment as documented in BKAB Report T 9710-54 (in Swedish)
fUB Number Frequency of fracture (large leak < DEGB) based on WASH-1400data and engineering judgment as documented in BKAB Report T9710-54 (in Swedish)
Back-flush Text Qualitative evaluation of the likelihood of the need of back-flushoperations to ensure ECCS operability given dynamic effects ofsteam/water jets on pipe insulation; ‘low’, ‘medium’ or ‘high’.
ISI-Year Date Year of the most recent ISI of weld.ISI-Frequency Number Frequency in years of ISI.
ISI-Next Date Year of the next planned ISI.
Table D-2.1: SKI-PIPE - Description of Data Fields.Field Name Type Description
MER Yes/No Multiple Events Report; some reports include information on morethan one crack/leak in one system. Used to identify events where adiscovery resulted in an investigation to identify further pipingdegradations due to a common cause.
EDT Date Event date; date of discovery.PTY Text Plant type; e.g., BWR, PWR, WWER.
NSSS-VENDOR Text Reactor vendor; e.g., ABB-Atom, KWU/Siemens, WestinghouseFNM Text Plant name
CONSTRUCTOR Text Name of company responsible for the original piping system design.The default name is the architect engineering firm.
COD Date Date of commercial operation as default. If known, date of initialcriticality. For U.S. data, based on NUREG-0020.
POS Text Plant operational state (at the time of discovery).DSA Text Reference(s)ETY Text Event type; ‘Crack’, ‘Leak’, ‘Severance’, ‘Rupture’ECA Text Type of Corrective Action; e.g., ‘Repair’; ‘Replacement’; ‘Weld
Overlay Repair (WOR).ISS Yes/No Safety system actuationIRT Yes/No Automatic reactor tripTTR Number Repair time
NARRATIVE Memo Event narrativeLQT Number Quantity of process medium released [kg]DOL Text Duration of releaseLRT Number Leak rate [kg/s]FLO Text Location of crack/leak/rupture; description of where in the piping
system a degradation or failure occurred by referring to isometriccomponent ID.
MSA Text Name of the affected plant systemOSA Text Name of other systems affected by the degradation or failure.
Secondary effects of piping failureS-TYPE Text Category of system affected by the degradation or failure; e.g., BOP,
FIRE, RCPB, SUPPORT)ISO Yes/No Isolateable?DET Text Method of detection; e.g., ISI, ST = surveillance testing, WT =
walk-through, etc.CRS Text Crack morphology; size/geometry of crack or fracture.

Appendices
SKI Report 98:30 83
Table D-2.2: SKI-PIPE - Description of Data Fields.Field Name Type Description
CRACK-DEPTH Number Crack depth in percent of wall thickness.CRACK-LENGTH Number Circumferential crack length in percent of inside diameter.
WELD-LOCATION
Text Location of affected weld; e.g., BP = bend-to-pipe weld, PP = pipe-to-pipe weld, etc.
FIELD-WELD Yes/No Check if ‘Yes’SHOP-WELD Yes/No Check if ‘Yes’
WOR Yes/No Weld overlay repair; check if ‘Yes’REPLACEMENT Yes/No Check if ‘Yes’
REPL-DATE Date/Time Date of component replacementCTA Text Type of piping component; e.g., bend/elbow, pipe, weld, tee.YOO Number Year of commercial operation when failure occurred.AGE Number Age of component socket [hours]
CLASS Number Based on diameter; events grouped in six diameter classes; 1= #DN15, 15 < DN # 25, 25 < DN # 50, 50 < DN # 100, 100 < DN #250, > DN250
THOMAS Number Ratio of diameter and pipe wall thicknessCSI Number Nominal diameter [DN]
WTK Number Wall thickness [mm]MTR Text Material; e.g., carbon steel, stainless steel, etc.
MTR-DES Text Material designation according to national standard; e.g., AISI 304,SS2343, etc.
PMD Text Process mediumHWC Yes/No For BWRs; hydrogen water chemistry; check if ‘Yes’
HWC-START Date/Time Date when HWC was introduced.IHSI Yes/No Induction heat stress improvement; check if ‘Yes’
IHSI-DATE Date/Time Date when IHSI was performedSTG Yes/No Normally stagnant process medium?OPA Number Operating temperature [°C]OPB Number Operating pressure [MPa]OPC Text Process medium chemistry (for primary system); e.g., NWC =
neutral water chemistry, HWC = hydrogen water chemistrySYS Yes/No Systematic failure?RFL Text Description of the extent and nature of a systematic failure
REST Yes/No Failure due to deficient system restoration?; e.g., no venting prior tofill procedure, etc.
CEA Text Apparent cause of failure; e.g., IGSCC, PWSCC, TGSCC, etc.RC1 Text Root cause (i)RC2 Text Root cause (ii)CEC Memo Description of events and causal factors.CMT Memo Any other information of relevance to the understanding of the
underlying causal factors. Also, information on the type and extentof repair/replacement.
ISI Yes/No Deficient ISI; e.g., ISI not performed, or ISI failed to detect a flawISI-CMT Memo Comments on ISI history

Appendices
SKI Report 98:30 84
E: Vibration-Fatigue in Small-Diameter Piping (BWROperating Environment)
In developing PSA_VER2, information was collected on all instrument sensinglines, RCPB drain and vent lines, and sample lines. Based on the information in Table E-1 and Table E-2, the frequency of rupture in small-diameter piping was estimated to bein the range of 7.4E-6/reactor-year (15 < DN # DN25) to 1.0E-5/reactor-year (#DN15).
Table E-1: Weld Counts in Small-Diameter RCPB Piping in Barsebäck-1.DN EE 311 312 313 314 321 323 326 327 351 354# 15 100 5 3 16 0 5 0 8 0 4 59
15 < DN # 25 230 0 0 12 0 0 0 0 0 0 218
Table E-2: Service Data on Small-Diameter RCPB Piping per SKI-PIPE.Diameter
[DN]Row Summary Crack
[#]Leak
[#]Rupture
[#]# 15 12 0 11 1
15 < DN # 25 63 1 60 2
Bayesian update of Jeffrey’s noninformative prior, and pipe reliability model ‘2’ gives:
## DN15: fR|V-F = (2R+1)/2T = 3/[2(1479.7 x 100)] = 1.01E-05/r.y.
15 < DN ## 25: fR|V-F = (2R+1)/2T = 5/[2(1479.7 x 230)] = 7.35E-06/r.y.
These estimates were derived under the assumption that the weld counts for Barsebäck-1 are representative of the overall BWR plant population.

Appendices
SKI Report 98:30 85
F: Erosion-Corrosion in RCPB Piping (BWROperating Environment)
According to SKI-PIPE, there have been no reported degradations due erosion-corrosion in carbon steel piping within the RCPB of the worldwide LWR population. Ajudgmental conditional rupture probability (pR|E_C) of 2.0E-3 was assigned the carbonsteel piping in Systems 311 (Main Steam) and 314 (Main Steam Pressure Relief).Furthermore, it is assumed that major steam piping replacements within the RCPBwould not occur within the first 40 years of plant operation. Table F-1 summarizes thecomponent counts (bends and welds) of the respective system in Barsebäck-1.
Table F-1: Piping Component Counts in Carbon Steel Steam Systems in Barsebäck-1.Component Row
SummaryDN50 DN80 DN125 DN150 DN175 DN250 DN500
311 - Bend 117 68 26 0 0 0 0 23314 - Bend 128 0 0 72 39 0 17 0
311 - Weld61 243 189 37 0 2 10 0 5314 - Weld 583 4 0 387 124 0 68 0
1071 261 63 459 165 10 85 28
Bayesian update of Jeffrey’s noninformative prior, and pipe reliability model ‘1’ gives:
fR|E-C = [(2R+1)/2T] A pR|E-C = [1/[2(40 x 63)]] A 2.0E-3 = 4.0E-7/r.y. Y
fR|E-C = 4.0E-7 / 1071 = 3.7E-10/component.r.y.
Virtually all known major degradations due to erosion-corrosion have occurred insecondary side wet-steam and water systems. The physical phenomena in erosion-corrosion processes are reasonably well understood62, and the discussion above is abelieved to be a reasonable approximation. The steam systems within the RCPB shouldbe subjected to further evaluations to search for vulnerabilities to severe overloadingcaused by improperly placed pipe whip restraints in the main steam system and waterhammer effects in pressure relief system.
61 It is assumed that vulnerability to erosion-corrosion damage exists in the pipe section immediatelydownstream a weld in carbon steel.62 Cragnolino, G., C. Czajkowski and W.J. Shack, 1988. Review of Erosion-Corrosion in Single-PhaseFlows, NUREG/CR-5156, U.S. Nuclear Regulatory Commission.

Appendices
SKI Report 98:30 86
G: Note on Statistical Analysis of Censored Data
In practical reliability work, it is often necessary to estimate the failure rate from asample data set of time-to-failure. Some of these data points may be incomplete; e.g.,when an observation ends before all the items have failed. A common method of dealingwith censored data is to arrange all the data in time order and assign an order number toeach failure for the particular mode being studies. In general, the order numbers of thefailures following the first censoring will no longer be integers, but will take fractionalvalues to allow for the censored item. When analyzing the censored data in this study,the derivation of median ranks (MRs) was done as follows63:
1. List order number (i) of failed items; 2. List increasing ordered sequence of life values (ti) of failed items; 3. Against each failed item, list the number of items which have survived to a time
between that of the previous failure and this failure (or between t = 0 and the firstfailure);
4. For each failed item, calculate the mean order number it.i using the formula
it.i = it.i-1 + Nt.i
where
Nt.i = [(n + 1) - it.i-1]/[1 + (n - number of preceding items)]
in which n is sample size.
5. Calculate median rank (MR) for each failed item, using the formula64
MRt.i = (it.i - 0.3) / (n + 0.4)
In this project the hazard plotting technique was used extensively to explore thepiping failure data. Shown below is a set of hazard plots for different sets of failure data. 63 From O’Connor, P.D.T., 1991. Practical Reliability Engineering. Third Edition, John Wiley & Sons(New York), ISBN 0-471-92696-5.64 For details, see Kapur, K.C. and L.R. Lamberson, 1977. Reliability in Engineering Design, JohnWiley & Sons (New York), ISBN 0-471-51191-9, pp 297-311.
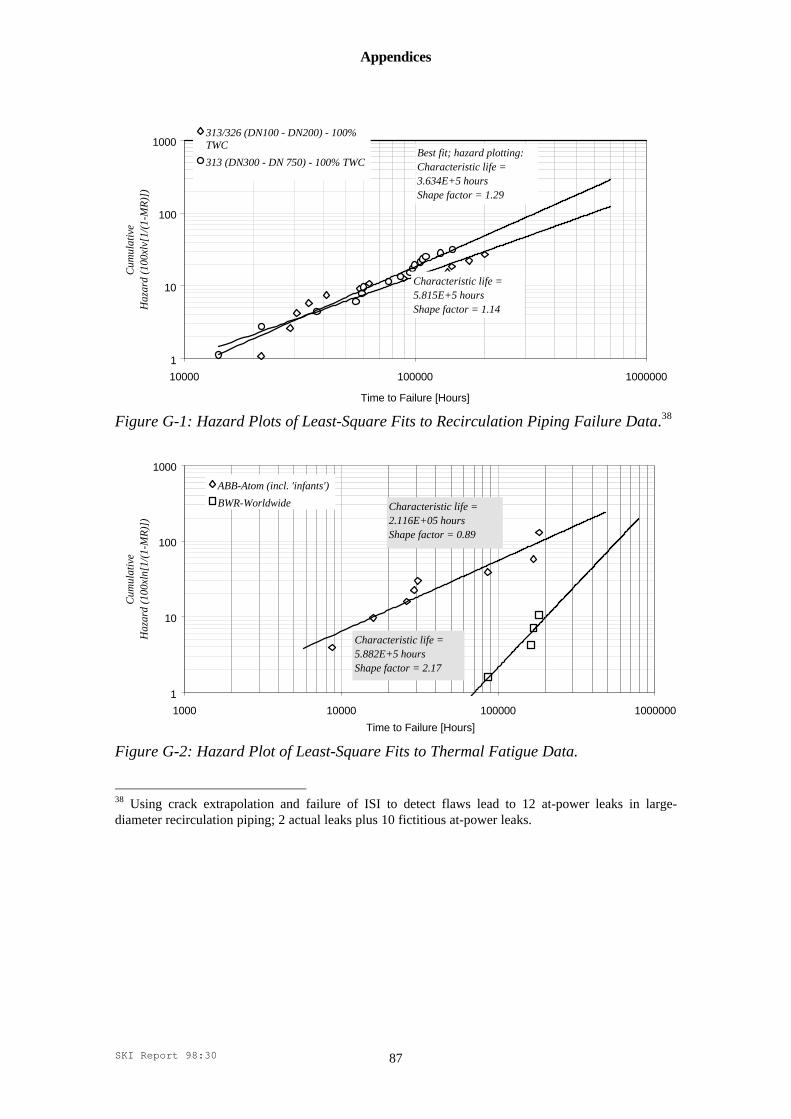
Appendices
SKI Report 98:30 87
1
10
100
1000
10000 100000 1000000
Time to Failure [Hours]
Cum
ulat
ive
Haz
ard
(100
xlv[
1/(1
-MR
)])
313/326 (DN100 - DN200) - 100%TWC
313 (DN300 - DN 750) - 100% TWC
Characteristic life = 5.815E+5 hoursShape factor = 1.14
Best fit; hazard plotting:Characteristic life = 3.634E+5 hoursShape factor = 1.29
Figure G-1: Hazard Plots of Least-Square Fits to Recirculation Piping Failure Data.38
1
10
100
1000
1000 10000 100000 1000000
Time to Failure [Hours]
Cum
ulat
ive
Haz
ard
(100
xln[
1/(1
-MR
)])
ABB-Atom (incl. 'infants')
BWR-Worldwide Characteristic life = 2.116E+05 hoursShape factor = 0.89
Characteristic life = 5.882E+5 hoursShape factor = 2.17
Figure G-2: Hazard Plot of Least-Square Fits to Thermal Fatigue Data.
38 Using crack extrapolation and failure of ISI to detect flaws lead to 12 at-power leaks in large-diameter recirculation piping; 2 actual leaks plus 10 fictitious at-power leaks.

Appendices
SKI Report 98:30 88
1
10
100
1000
10000 100000 1000000
Time to Failure [Hours]
Cum
ulat
ive
Haz
ard
(100
xln[
1/(1
-MR
)]) CRD-Piping (System 354)
Characteristic life = 3.568E+5 hoursShape factor = 1.75
Monticello (4/17/98)LER 50-263/98-003
Figure G-3: Hazard Plot of Least-Square Fit to CRD Piping Failure Data.
1
10
100
1000
1000 10000 100000 1000000
Time to Failure [Hours]
Cum
ulat
ive
Haz
ard
(100
xln[
1/(1
-MR
)])
Cold Worked SS-Piping (DN80-DN100)
Characteristic life = 3.387E+5 hoursShape factor = 0.89Mid-life plants only
Figure G-4: Hazard Plot of Least-Square Fit to DN80-100 Pipe Failure Data.