failure properties of passive human aortic tissue. i
TRANSCRIPT

, B,mwhoor<s ‘401 15. No 11. pp 887-902. 1982
f’nnted ,n Great Bntam
FAILURE PROPERTIES OF PASSIVE HUMAN AORTIC TISSUE. I-UNIAXIAL TENSION TESTS
DINE~H MOHAN*
Centre for Biomedical Engineering, Indian Institute of Technology, New Delhi 110016, India.
and
JOHN W. MELVIN Biomechanics Department, Highway Safety Research Institute,
The University of Michigan. Ann Arbor, Michigan 48109.
(Received for publication 22 June 1982)
Abstract-Samples of descending mid-thoracic aortas were obtained from human autopsies and experi- ments were performed to determine the effect of strain rate and direction of loading on the failure properties of the tissue in uniaxial tension. The tests were performed at quasi-static strain rates in the range 0.01 s-‘-O.07 s-’ and dynamic tests in the range 8Os- ‘-100 s-l. Ultimate stress and extension ratio values have been calculated for specimens tested in the longitudinal and transverse directions of the aorta.
INTRODUCTION
Mechanical properties of aortic walls have been stu- died for almost a century. Rindfleisch (1873) was one of the first to document instances of traumatic rupture of thoracic aorta and Greendyke (1966) estimated that about one sixth of traffic deaths may be ascribed to this injury. Roy (1880) was the first to publish length-tension and pressure-volume relationships for human and animal aortic tissue. Numerous studies have appeared since and they have been reviewed by Milch (1965), Bergel(1972), Taylor (1973), Pate1 et al. (1974) and Roach (1977).
The purpose of this experimental study was to determine the failure properties of human aortic tissue at quasi-static and dynamic (5 IOOs-‘) strain rates. The dynamic strain rate was chosen to be repre- sentative of those estimated in a thoracic impact which might cause aortic rupture. Descending mid-thoracic aortas were obtained from autopsies performed at the Veterans Administration Hospital and The University of Michigan Hospital in Ann Arbor, Michigan. The experiments were designed to determine the effect of strain rate and direction of loading on the failure properties of the tissue in uniaxial tension.
Since the determination of failure properties of soft tissue involves large deformations, experimental tech- niques had to be developed so that accurate results could be obtained without the use of strain-gages or mechanical extensometers. In the high strain-rate tests, extension had to be measured in milliseconds without disturbing the test specimen. Photographic techniques were developed to record the deformation histories in
*This work was completed while the senior author was at the Highway Safety Research Institute, The University of Michigan, Ann Arbor, Michigan, U.S.A.
both the dynamic and quasi-static tests. Low-mass pressure piston grips were designed to clamp the tissue specimen. The grips exerted a constant clamping force while maintaining the ability to follow the thinning of the specimen during deformation. All the tissue speci- mens were tested under passive conditions.
MATERIALS AND METHODS
Tissue sources. storage and specimen preparation
Fresh specimens of human mid-thoracic descending aorta were obtained from 31 autopsies. Mean age of the subjects was 54.6 years, the youngest was 4 years and the oldest 89 years. Five were less than 40 years old, Seven more than 70 years old, and eight were females. The aortic specimens were stored in polythene bags which were kept in a refrigerator maintained at I-3°C. A small amount of Ringer’s solution was sprayed on the aorta and the humidity maintained at iOO% inside the air-tight bags. Autopsies were usually performed within 24 hr of death and the tests were conducted as soon as possible after the autopsy (l-7 days).
When the equipment was ready for testing, the aorta was slit open and cleaned but the intima and adventitia were left intact. The opened up aorta was laid flat and dumbbell specimens stamped out using metal dies
(Fig. 1). Only the mid-thoracic section of the descend- ing aorta was used. The thickness of the specimen was measured with an Ames 5642-l thickness gage (smallest division 0.025 mm) and then a quarter-inch-square grid was lightly printed on it with a rubber stamp using regular black stamp-pad ink. The average thickness of the specimen was more than 50 times the smallest count on the gage. We found the stamp-pad ink to be most suitable for this purpose since it stained the tissue very well and did not smudge even when the tissue was
887
888 DINE~H MOHAN and JOHN W. MELVIN
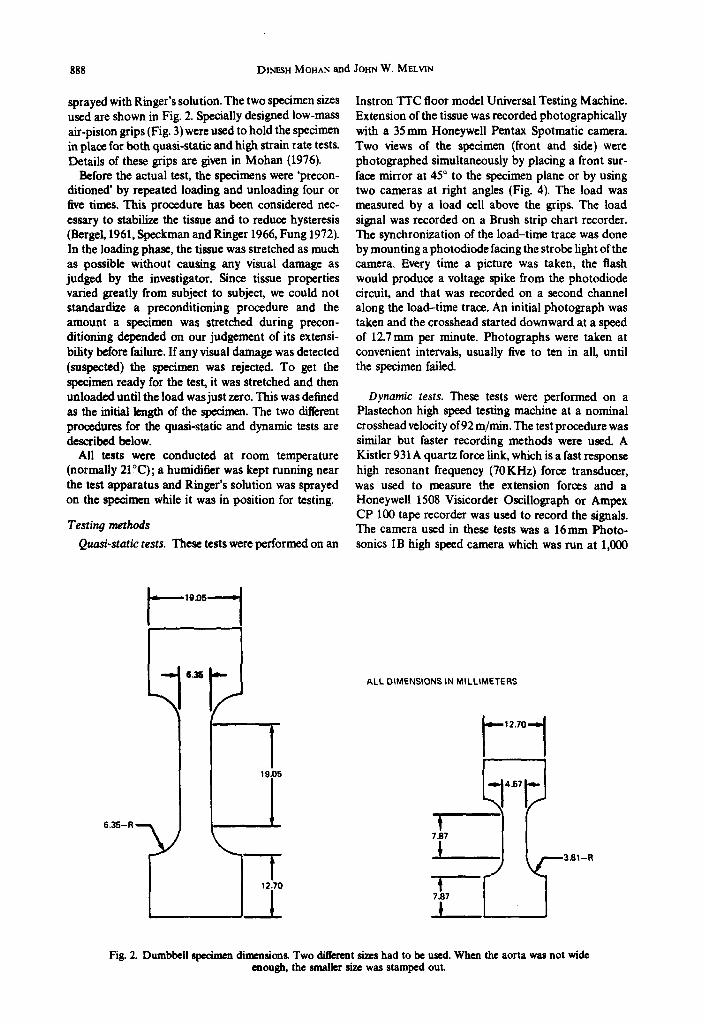
sprayed with Ringer’s solution. The two specimen sizes
uSed are shown in Fig. 2. Specially designed low-mass air-piston grips (Fig. 3) were used to hold the specimen in place for both quasi-static and high strain rate tests. Details of these grips are given in Mohan (1976).
Before the actual test, the specimens were ‘precon- ditioned’ by repeated loading and unloading four or five times. This procedure has been considered nec- essary to stabilize the tissue and to reduce hysteresis (Bergel, 1961, Speckman and Ringer 1966, Fung 1972). In the loading phase, the tissue was stretched as much as possible without causing any visual damage as judged by the investigator. Since tissue properties varied greatly from subject to subject, we could not standardize a preconditioning procedure and the amount a specimen was stretched during precon- ditioning depended on our judgement of its extensi- bility before failure. If any visual damage was detected (suspected) the specimen was rejected. To get the specimen ready for the test, it was stretched and then unloaded until the load was just zero. This was deflned as the initial length of the specimen. The two different procedures for the quasi-static and dynamic tests are described below.
All tests were conducted at room temperature (normally 21°C); a humidifier was kept running near the test apparatus and Ringer’s solution was sprayed on the specimen while it was in position for testing.
Testing methods
Quasi-static tests. These tests were performed on an
Instron TIC floor model Universal Testing Machine. Extension of the tissue was recorded photographically with a 35mm Honeywell Pentax Spotmatic camera Two views of the specimen (front and side) were photographed simultaneously by placing a front sur- face mirror at 45” to the specimen plane or by using two cameras at right angles (Fig. 4). The load was measured by a load cell above the grips. The load signal was recorded on a Brush strip chart recorder. The synchronization of the load-time trace was done by mounting a photodiode facing the strobe light of the camera. Every time a picture was taken, the flash would produce a voltage spike from the photodiode circuit, and that was recorded on a second channel along the load-time trace. An initial photograph was taken and the crosshead started downward at a speed of 127mm per minute. Photographs were taken at convenient intervals, usually live to ten in all until the specimen failed.
Dynamic tests. These tests were performed on a Plastechon high speed testing machine at a nominal crosshead velocity of 92 m/mm. The test procedure was similar but faster recording methods were used. A Kistler 931 A quartz force link, which is a fast response high resonant frequency (70KHz) force transducer, was used to measure the extension forces and a Honeywell 1508 Visicorder Oscillograph or Ampex CP 100 tape recorder was used to record the signals. The camera used in these tests was a 16mm Photo- sonics IB high speed camera which was run at 1,000
ALL DIMENSIONS IN MILLIMETERS
12.70 l-1 4.57 It-
7 87
4i
3.914
7.97
L
Fig. 2. Dumbbell specimen dimnsions. Two d&rent sim had to be used. When the aorta was not wide enough, the smaller size was stamped out.

Fig. 1. Dumbbell specimens stamped out from ao opened up aorta The aortic tissue was laid flat, intima side up, on a vinyl tik and the specimens were stamped out using metal dies.
889
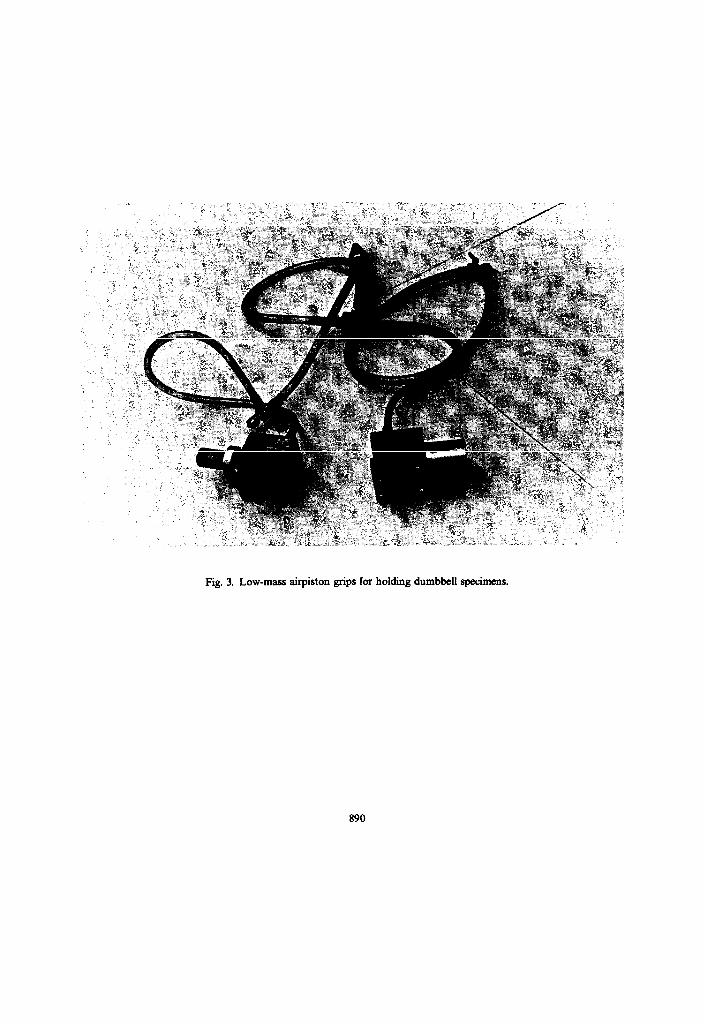
Fig. 3. Low-mass airpiston grips for holding dumbbell specimens.
890

Fig. 4. Use of two cameras in mutually perpendicular directions for uniaxial tension tests on an Instron. Photographs were taken simultaneously in the two cameras and the flash of strobe recorded on the chart
recorder alongside the load-time trace.
891
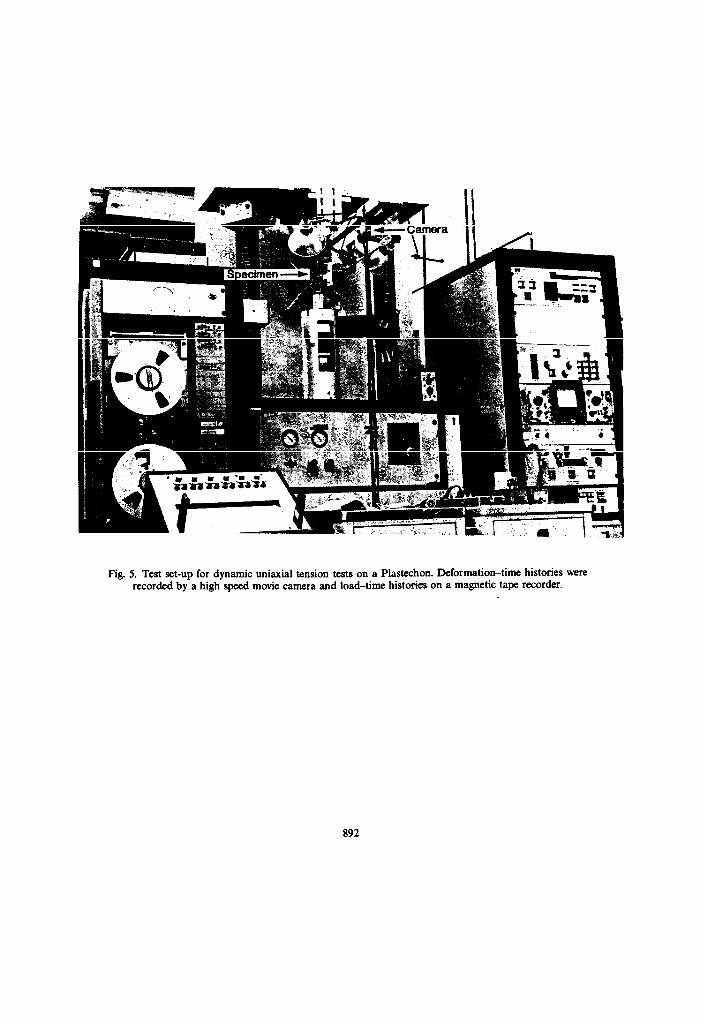
Fig. 5. Test set-up for dynamic uniaxial tension tests on a Plastechon. Deformation-time histories were recorded by a high speed movie camera and load-time histories on a magnetic tape recorder.
892
--
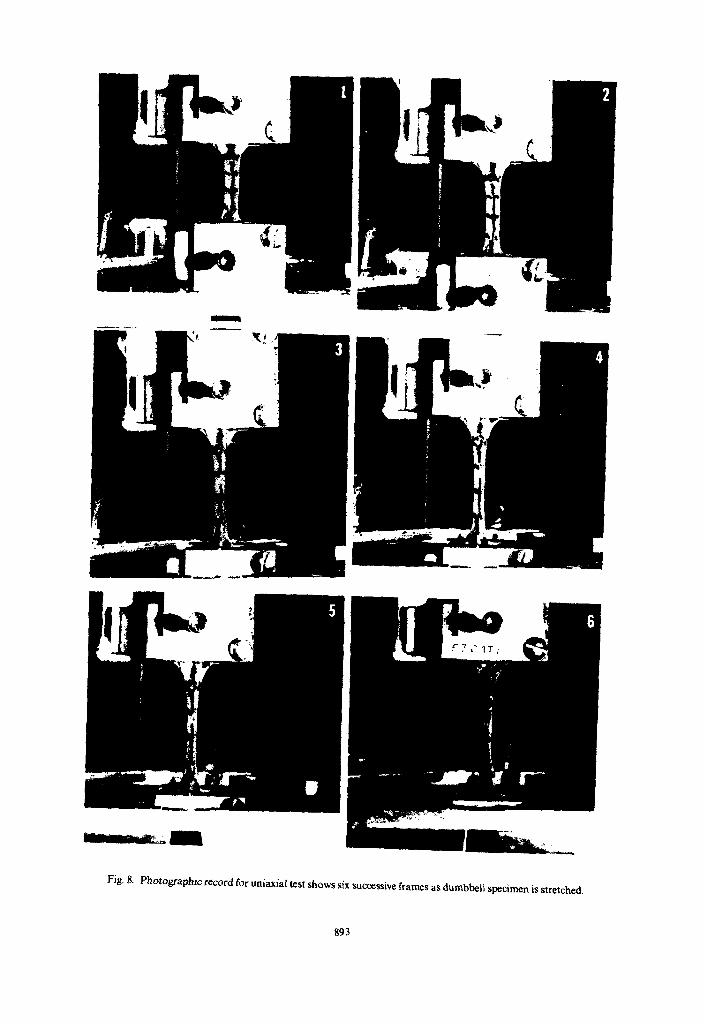
Fk- 8. Photogf+ic reccmi for uniaxial test shows six successive frames as dumbbell specimen is stretched.
893
Failure properties of passive human aortic tissue. I-Uniaxial tension tests 895
frames per second using Kodak 7277 4X-Reversal film. The film record was correlated with the load time trace by an initial single flash of a strobe light and simultaneous recording of time pulse generator tim- ings marks (1.000 s- ’ ) on the film and load trace. The experimental set up is shown in Fig. 5. The experimen- tal procedure is described in greater detail in Mohan (1976).
Data reducrion
For each test, the photographic record was exam- ined to determine the location of failure. The grid within which the tear occurred was selected for measurement and the deformation-time history cor- related with the load-time history. The deformation-time histories for the uniaxial tests were transferred from film to paper by projecting the pictures onto a flat surface and tracing out the images of the specimens onto sheets of paper placed on the surface. Since extension ratios are calculated by divid- ing the current grid length by the initial grid length, absolute values of measurements are not important as long as the magnification factors remained the same for each test. For two uniaxial tests, data reduction was done three times independently and for each test the three extension ratios were found to within 37; of the largest value. The width measurements were not found to be reliable and therefore were not used as they were not needed for calculation of true stress (tissue as- sumed to be incompressible. see below). From this data
true stresses and extension ratios were computed as outlined below.
Measured variables. 1. Axial load, F. 2. Initial grid length. 1,. 3. Current grid length, 1. 4. Initial grid width. u’,,. 5. Current grid width, w. 6. Initial specimen thickness, h,. 7. Current specimen thickness, h. 8. Current time, t. Calculated variables. 1. Axial extension ratio, I, = l/l,. 2. Width extension ratio, I, = w/wO. 3. Thickness extension ratio, I, = h/h,. 4. Engineering tensile stress, Q~ = F/w&,. 5. True tensile stress, Q~ = F/wh = i, F/w&
(assuming tissue incompressibility) 6. Average strain rate = (A, - 1) + (time to failure
in seconds) = (1, - 1 )/tr.
RESULTS
The total number of tests performed were as follows :
Dynamic Quasi-static Longitudinal 28 19 Transverse 24 19
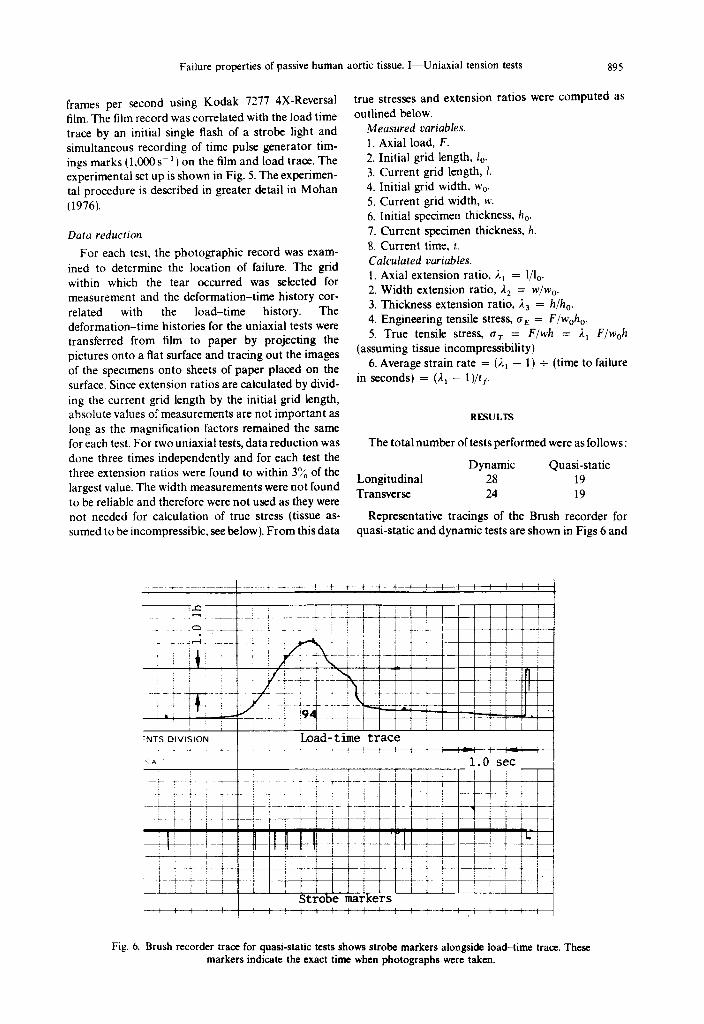
Representative tracings of the Brush recorder for quasi-static and dynamic tests are shown in Figs 6 and
Fig. 6. Brush recorder trace for quasi-static tests shows strobe markers alongside load-time trace. These markers indicate the exact time when photographs were taken.

896 DINESH MOHAN and JOHN W. MELVIN
7 and an example of the sequence of photographs from following points should be kept in mind when looking uniaxial tests is given in Fig. 8. at these numbers.
The true tensile stresses and extention ratios at the point of failure have been selected for comparison and analysis. It is important to use true stress values rather than engineering stress values in soft tissue testing. In the case of incompressible materials the cross-sectional area changes in inverse proportion to the extention ratio for uniaxial stretch. When extension ratios are large (1.2-2.2) the difference between engineering stress and true stress will also be large.
(i) Invalid failures are those where the specimen did not fail in the straight portion of the dumbbell or it slipped out of the grips. Such values have not been included in any analysis of failure properties.
(ii) The term dynamic has been used to describe those tests where the strain rate had a value between 80~~’ and 120~~‘.
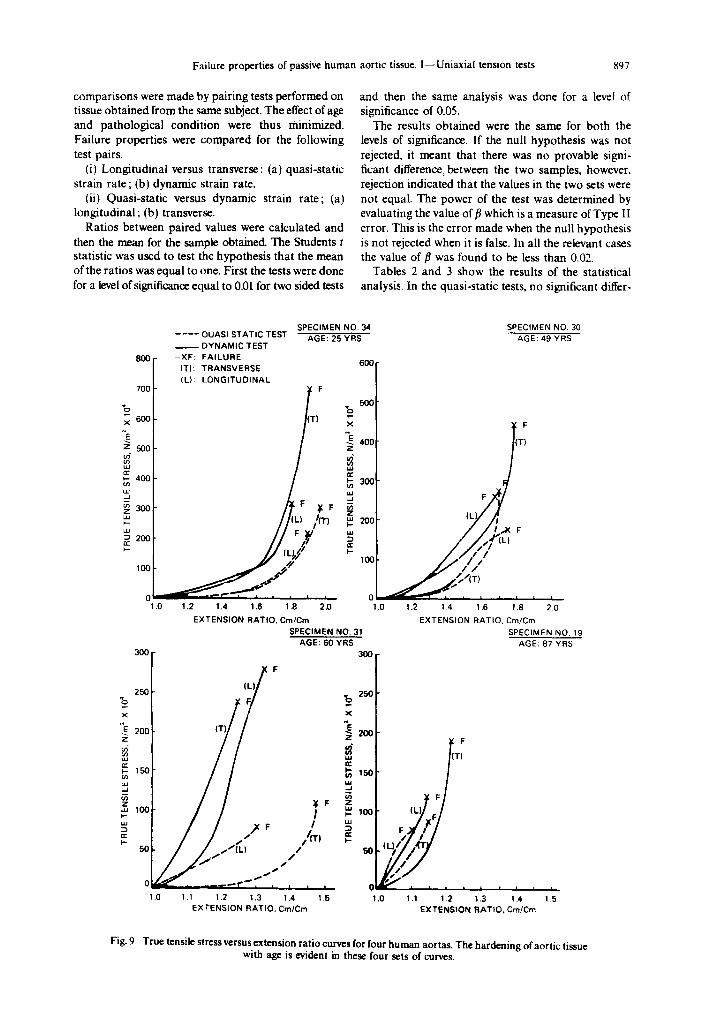
Examples of tensile stress versus extension ratio curves are shown in Fig. 9. These sets of curves reveal how great the differences can be between aortas obtained from individuals of different age and path- ology. Because of these differences, the effect of strain rate and orientation should be compared between specimens obtained from the same individual.
(iii) The term quasi-static has been used to describe those tests where the nominal strain rate was between 0.01 s-l and 0.07~~‘.
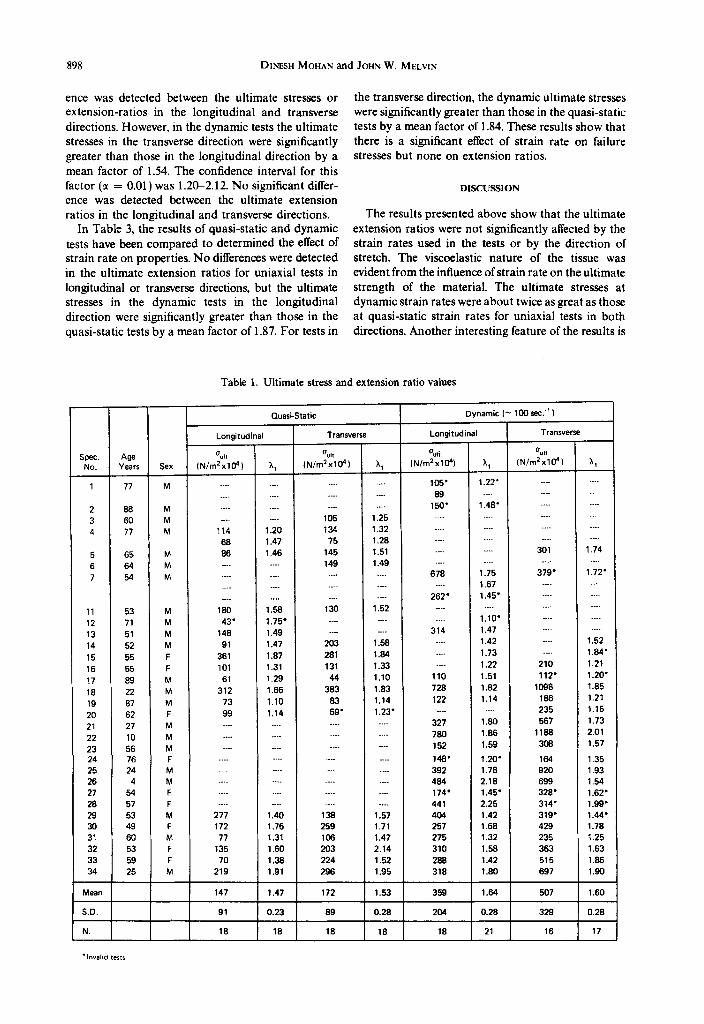
The ultimate (failure) stress and extension ratio values for all the tests are given in Table 1 and the
(iv) The term strain rate has been used for average values and not instantaneous values.
(v) True stresses have been calculated by assuming the aortic tissue to be incompressible.
The values of ultimate stresses and extension ratios in Table 1 show that the variation among specimens is very high. To evaluate the effect of mean rate and orientation of the tissue on its failure properties,
A ___~~_ __.___. _-..._ _ &_...74..._.. ___k--y-
Load-time trace
__._._..- ..-
Flash
V _.__- -.-_-. .~ ._ _ ~~_~.
Strobe marker
1.0 msec
4+
Timing light--record
Fig. 7. Magnetic tape record for dynamic tests transferred onto chart recorder. Flash recorded on chart and on film helps to correlate the film and the load-time record for an initial reference frame. Timing light record
on film and along load trace helps to correlate load-time and extension-time data.
Failure properties of passive human aortic tissue. I-Uniaxial tension tests 897
comparisons were made by pairing tests performed on tissue obtained from the same subject. The effect of age and pathological condition were thus minimized. Failure properties were compared for the following
test pairs. (i) Longitudinal versus transverse : (a) quasi-static
strain rate ; (b) dynamic strain rate. (ii) Quasi-static versus dynamic strain rate; (a)
longitudinal; (b) transverse. Ratios between paired values were calculated and
then the mean for the sample obtained. The Students t statistic was used to test the hypothesis that the mean of the ratios was equal to one. First the tests were done
for a level of significance equal to 0.01 for two sided tests
and then the same analysis was done for a level of significance of 0.05.
The results obtained were the same for both the levels of significance. If the null hypothesis was not
rejected. it meant that there was no provable signi- ficant difference, between the two samples, however, rejection indicated that the values in the two sets were not equal. The power of the test was determined by evaluating the value of B which is a measure of Type II error. This is the error made when the null hypothesis is not rejected when it is false. In all the relevant cases the value of fl was found to be less than 0.02.
Tables 2 and 3 show the results of the statistical analysis. In the quasi-static tests, no significant differ-
Boo-
700 -
600-
SPECIMEN NO. 34 ---- OUASI STATIC TEST AGE: 25 YRS - DYNAMIC TEST
-XF: FAILURE
(TI: TRANSVERSE
(L). LONGITUDINAL
b x
1.2 1.4 1.6 1 .a 2.0
EXTENSION RATIO, Cm/Cm
600
300-
200-
1.2 1.4 1.6 1 .a 2.0 1 .o
SPECIMEN NO. 30
AGE: 49 YRS
XF
400 _ (T)
SPECIMEN NO. 31
AGE: 60 YRS
300
‘b 250 -
EXTENSION RATIO, Cm/Cm
SPECIMEN NO. 19
AGE: 07 YRS
1 .o 1 .l 1.2 1.3 1.4 1.5
EXTENSION RATIO, Cm/Cm 1 .o 1.1 1.2 1.3 1.4 1.5
EXTENSION RATIO, Cm/Cm
Fig. 9. True tensile stress versus extension ratio curves for four human aortas. The hardening of aortic tissue with age is evident in these four sets of curves.
898 DINESH MOHAN and JOHN W. MELVIN
ence was detected between the ultimate stresses or extension-ratios in the longitudinal and transverse directions. However, in the dynamic tests the ultimate stresses in the transverse direction were significantly greater than those in the longitudinal direction by a mean factor of 1.54. The confidence interval for this factor (a: = 0.01) was 1.2CL2.12. No significant differ- ence was detected between the ultimate extension ratios in the longitudinal and transverse directions.
In Table 3, the results of quasi-static and dynamic tests have been compared to determined the effect of strain rate on properties. No differences were detected in the ultimate extension ratios for uniaxial tests in longitudinal or transverse directions, but the ultimate stresses in the dynamic tests in the longitudinal direction were significantly greater than those in the quasi-static tests by a mean factor of 1.87. For tests in
the transverse direction, the dynamic ultimate stresses were significantly greater than those in the quasi-static tests by a mean factor of 1.84. These results show that there is a significant effect of strain rate on failure stresses but none on extension ratios.
DISCUSSION
The results presented above show that the ultimate extension ratios were not significantly affected by the strain rates used in the tests or by the direction of stretch. The viscoelastic nature of the tissue was evident from the influence of strain rate on the ultimate strength of the material. The ultimate stresses at dynamic strain rates were about twice as great as those at quasi-static strain rates for uniaxial tests in both directions. Another interesting feature of the results is
Table 1. Ultimate stress and extension ratio values
Quasi-Static Dynamic (- 1OOsec.")
Longitudinal Longitudinal
Spec. Age 0 "I, %h %i %I,
NO. Years Sex IN/m'xl@) X, (N/m'xl@l A, (Nlm2x10? A, (N/m2xl@) h,
1 77 M
2 88 M 3 M3 M
4 77 M
5 65 M
6 64 M 7 54 M
11 53 M
12 71 M
13 51 M
14 52 M
15 55 F
16 55 F
17 89 M
16 22 M
19 87 M
20 62 F
21 27 M
22 10 M
23 56 M
24 76 F
25 24 M
26 4 M
27 54 F
28 57 F
29 53 M
30 49 F
31 60 M
32 53 F
33 59 F
34 25 M
. . . .
. . . .
. . . . . . .
114 68
86
. . . .
. . .
. . . .
. . . . 180
43'
148
91
361
101
61
312
73
99
. . . .
. . . .
.
. .
_...
.
. . .
277
172
77
135
70
219
. . . .
. . .
. . . . .
1.20 1.47
1.46
. . . .
. . . .
. . . .
. . . . 1.58
1.75'
1.49
1.47
1.87
1.31
1.29
1.66
1.10
1.14
.
. . . .
. . . .
. . . .
.
. . . .
. .
. . . .
1.40
1.76
1.31
1.60
1.38
1.91
. . . .
. . .
. . . . 105
134 75
145
149 . . . .
. . .
. . . .
130
. . . .
. . . .
203
281
131
44
383
83
59'
. . .
. . . .
. . . .
. .
. . .
. . . .
. .
. .
139
259
106
2o3
224
296
. . .
. . . . 1.25
1.32 1.28
1.51
1.49 . . . .
. . . .
1.52
. . . .
. . .
1.58
1.84
1.33
1.10
1.83
1.14
1.23'
.
. .
.
. . . .
. . .
. . .
. . . .
. . . .
1.57
1.71
1.47
2.14
1.52
1.95
105' 89
150' _...
_... . . . .
. . .
. . .
676
. .
262' . . . .
. . . .
314 .
. . . .
. . .
110
728
122
. . .
327
780
152
148'
392
484
174'
441
404
257
275
310
288
318
1.22' .
1.48'
. .
.
_...
1.75
1.67
1.45' . . .
1.10'
1.47
1.42
1.73
1.22
1.51
1.82
1.14
1.80
1.86
1.59
1.20'
1.78
2.18
1.45'
2.25
1.42
1.68
1.32
1.58
1.42
1.90
. . .
.
. .
.
. . . .
301 . . . .
379' . .
. . .
. . . .
. . . .
. .
. . . .
. . . .
210
112'
lo98
186
235
567
llaa
309
164
920
699
328'
314'
319'
429
235
363
515
697
. .
.
. .
. .
1.74 .
1.72' . . . .
. .
. . . .
. . .
. .
1.52
1.84'
1.21
1.20'
1.85
1.21
1.15
1.73
2.01
1.57
1.35
1.93
1.54
1.62'
1.99'
1.44'
1.78
1.25
1.63
1.86
1.90
Meall 147 1.47 172 1.53 359 1.64 507 1.60
SD. 91 0.23 89 0.28 204 0.28 329 0.28
N. ia 18 la ia la 21 16 17

Failure properties of passive human aortic tissue. I-uniaxial tension tests
Table 2. Comparison of failure properties, longitudinal versus transverse
Parameter Description
Uniaxirl. Quasi-Smic
Uk. stress, Long.
Wt. Stress, Trans.
Ult. Ext. Ratio, Long.
Ult.Ext. Ratio,Trans.
Uniaxial, Dynamic
Ult. stress, Long.
Ult. Stress, Trans.
Ult. Ext. Ratio, Long.
Ult. Ext. Ratio.Trans.
0.9151 0.4572 16 0.7427
16 1.3275
12 6.062 1 3.106 YES
0.991 0.1417
I 14 0.2427 3.012
t fo.01 Statistic N-l
2.947
2.947
Null
NO
899
that while there was no significant difference in the ultimate stress properties in the longitudinal and transverse directions at low strain rates, this difference became quite significant at dynamic strain rates. These results have important implications for failure theory of aortas and are discussed below.
Most of the studies conducted on mechanical prop erties of aortic tissue have concentrated on stresestrain properties of aortic tissue under con- ditions of low strain rates. To our knowledge this is the first time tension tests have been conducted on aortic tissue at strain rates greater than 3.5 s-i. While it is generally accepted that aortic tissue is viscoelastic the effects of strain rate have not been quantified. Roy, as far back as 1880, detected the effect of strain rate and wrote, “When curves are not taken too fast they have the same form.” In the past, dynamic tests on aortic tissue were mainly limited to pressurcvolume re- lationships of aorta pressurized cyclically or vibration
tests on aortic strips at low levels of strain (Bergel, 1961, Pate1 et al., 1973, Lawton, 1955). The purpose of those experiments was to provide information to explain the mechanical behavior under physiological conditions and so high levels of extension and stress were not considered. Extensive data on failure proper- ties of the aorta has been summarized by Yamada (1970) but only for quasi-static strain rates.
There are no prevtous data to compare the results from our high strain rate tests. For quasi-static tests, Yamada (1970) reports mean values of ultimate stres- ses and strains for adult aortas. The values recorded were in terms of engineering stresses and therefore the true stresses would be greater. The ultimate engineer- ing stress in the longitudinal direction was 7.5 x 10sN/mz and in the transverse direction 8.9 x l@N/m’. These indicate a ratio of 1.18 between transverse and longitudinal directions. This ratio is almost the same as found in this study. In this study the
Table 3. Comparison of failure properties, quasi-static versus dynamic
Mean Estimated Number Null
of Standard of Pain t ‘o.or Hypothesis
Parameter Description Ratiot Deviation N Statistic N-l Rejected?
Unirxial, Longitudinal
Ult. Stress, Static
Ult. Stress, Dynamic 0.5344 0.2147 10 6.957 3.250 YES
Ult. Ext. Ratio,Static
Ult. Ext. Rstio,Dynamic 1 xl434 0.1362 12 1.099 3.106 NO
Uniaxial. Transwrre
Ult. Stress, Static Ult. Stress. Dynamic 0.5443 0.0964 9 14.162 3.355 YES
Ult. Ext. Ratio,Static
Ult. Ext. Ratio.DYnamic 1.023 0.1456 10 0.4993 3.250 NO
mean values true stresses for transverse and longitu- dinal directions are 1.72 x 10⁶N/m2 and 1.47 x lo6 N/m’, which are not too different from Yamada’s values if the difference between true stress and engineering stress is accounted for. The fact that a few young aortas are included in the present study also increases the mean values. Yamada found the mean ultimate extension ratio in the transverse direction to be 1.71 and that in the longitudinal direction to be 1.56. The values from this study are 1.53 and 1.47 re- spectively. The difference in values in the two studies could be because of the difference in measuring techniques.
circumference of the aorta, resulting in the greater strength of the transverse specimens at high strains. The difference between longitudinal and transverse directions are more pronounced at the higher strain rates which may help to explain the reason why aortic failures occur in transverse tears of the wall.
The behavior of the tissue &fore failure has not been characterized mathematically in this paper. On com- paring the longitudinal and transverse curve pairs it was noticed that in most cases the transverse specimen was less stiff than the longitudinal one in the low stress region. As the specimens were stretched further, the stresses increased more rapidly in the transverse specimens and the stiffnesses became similar in the high-stress and high-strain regions. In some cases the curves also crossed. This phenomena has also been reported by Roy (1880), Hierton and Jordan (1956), and Milch (1965) among others. The curve shapes were similar to those reported by almost all the other investigators. Many others have described the struc- tural basis for these curves and general stiffening after physiological stress levels has been attributed to the progressive straightening of aortic lamellae and in- creasing dispersion and alignment of collagen fibers (Wolinsky and Glagov, 1964).
Many researchers have proposed high vascular pressures as being the main cause of aortic rupture (Oppenheim, 1918; Tannenbaum and Ferguson, 1948; Klotz and Simpson, 1932; Kleinsasser, 1943; Strassman, 1947). Others laid more importance on longitudinal stretching (Rindfleisch, 1873 ; Letterer, 1924). Lundewall (1964) put forward the idea of the water hammer eflect. Cammack et al. (1959) and Roberts et al. (1967) suggested that torsion and stretching both probably play an important role. The effect of curvature and tapering of the aorta has also been investigated by Ayorinde et al. (1975) and Ray et al. (1975). The reason why investigators doubted that excessive pressure was the main cause of aortic failure was that if the aorta is modelled as a cylinder then the wall axial (longitudinal) stresses turn out to be one half the circumferential (transverse) stresses. In such a situation transverse tears can only occur due to internal pressure if the transverse strength is more than twice the longitudinal strength. The data obtained from quasi-static tests indicated that this was not so and the transverse strength was nominally 1.2 times the longitudinal strength. Hence the need for alternate theories of failure.
The effect of strain rate seemed to manifest itself roughly in proportional increases in the strength and stiffness of the material The ultimate extension ratios were not affected by strain rate. This finding does not agree with Collins and Hu (1972) who wrote that “as strain rate increases, rupture occurs at higher stress and lower strain.” This discrepancy could be due to two reasons: Firstly, Collins and Hu themselves questioned the accuracy of their strain measuring technique, and secondly, it is not clear how they compared the two sets of data. Even in this study if one just looks at the means of dynamic and quasi-static ultimate extension ratio values they appear to be different, but when the tests are paired no significant difference is detected. Where our findings agree is that ultimate stress values increase with increase in strain rate. The actual values cannot be compared since they used pig’s aortae and much lower dynamic rates (3.5 s - l ).
The results of this study show that the difference between longitudinal and transverse ultimate stresses increases with increasing strain rate and this difference is signiticant at a strain rate of lOOs_‘. This is the magnitude of strain rates which are likely to be experienced in the aorta during blunt trauma caused by automobile crashes (Kivity and Collins, 1974). The 99% confidence limits for the ratio of dynamic ultimate true stresses between transverse and longitudinal directions have been shown to be 1.23 and 2.04. So in the limit these ratios come closer to the ratio of 1 : 2 as needed in a cylindrical model. The aorta is not a perfect cylinder and in trauma it probably gets partly occluded by being squeezed between the viscera and the spinal column. It is possible that during impact a portion of the vessel may form a bulge whose shape is more spherical than cylindrical. In the spherical situ- ation the stresses in the two orthogonal directions are in the ratio 1 :l. In all other imperfect shapes between the two extremes of the cylinder and the sphere the ratio would be between 1 : 1 and 1 :2. In light of the above, it seems entirely possible that the aorta can rupture with a tear in the transverse direction under dynamic loading. This is not to say that the other factors do not contribute, for indeed-they must under different impact conditions. The important point being made here is that is not impossible for a transverse failure to be caused by high pressures alone.
From the data presented we conclude that the most reasonable failure theory for aortic tissue is the maxi- mum tensile strain theory. Because of the intermesh- ing of collagen and elastin fibers in the tissue (Glagov, 1973, Milch, 1965) the forces probably tend to be shared equally between the collagen fibers ; hence the grossly similar behavior in the longitudinal and trans- verse directions. The collagen bundles in aortic tissue are mainly arranged in a helical manner around the _______. ._ ~~~ ~~~ _~
The data gathered in the above experiments are not enough to formulate constitutive eauations for aOrtiC
900 DINESH MOHAN and JOHN W. MELVIN
Failure properties of passive human aortic tissue. I-uniaxial tension tests 901
tissue since it is necessary to have information from tests under at least three deformations states for that purpose. Furthermore, more accurate information is needed for biaxial behavior and comparisons to be made between behavior of aortic tissue under con- ditions of cylindrical and spherical stretch. As far as experimental procedures are concerned, it would be useful to have more pictures per test so that the stress-strain curves in the low stress, low strain region could be plotted more easily. More tests should be done at strain rates between 0.1 and lOOs_ ’ so that a relationship between stress and strain rate can be established. The photographic techniques can be im- proved upon. If the grid lines were made thinner and lighting arranged such that the side views were clearer it would help greatly in improving accuracy.
The effect of ‘preconditioning’ on failure properties of aortic tissue is not known. The extent to which the tissue should be stretched so that it exhibits repeatable behavior is also not known. If the stabilization occurs only within the extension range in which the specimen is cycled during preconditioning, then standardized preconditioning procedures will have to be established to obtain comparable data. This phenomenon needs to be studied more carefully.
We do not know the kinematics of the human aorta during blunt chest trauma. This can only be de- termined through high-speed X-ray photography. Un- til more details are found out we will have to depend upon guesswork. The most important thing to note is that when properties have to be compared between different test conditions, the tests being compared should be on tissue from the same source.
CONCLUSIONS
This is the first time that passive mechanical proper- ties of the human descending aortic tissue have been tested at strain rates in the range of lOOs- ‘.
The major conclusions are as follows. 1. Ultimate extension ratios are not affected signi-
ficantly by strain rate or orientation of tissue. 2. Difference between ultimate stresses in the trans-
verse and longitudinal directions increase with strain rate.
3. The most reasonable failure theory for aortic tissue is maximum tensile strain theory.
4. It is possible for the thoracic aorta to fail with an initial transverse tear caused by excess pressure alone.
Acknowledgements-Part of this work was supported by NHTSA Contract No. DOT-HS-031-3-763 and NSF Grant No. ENG 75-04267.
REFERENCES Strassman, G. (1947) Traumatic rupture of the aorta, Am.
Heart J. 33, 508-515. Ayorinde, 0. A.. Kobayasbi, A. S. and Merati, J. K. (1975) Tannenbaum, I. and Ferguson, J. A. (1948) Rapid de-
Finite elasticity analysis of unanesthetized and anesthe- celeration and rupture of the aorta. Archs Path. 45, tized aorta. J. appl. Mech. 42, 547-551. 503-506.
Bergel,D. H. (1961)The staticelasticpropertiesof the arterial wall. J. Physiol. Lond. 156.445-457.
Bergel, D. H., (Editor) (1972) Curdiooascular Fluid Dynamics. Academic Press London.
Cammack, K., et al. (1959) Deceleration injuries of the thoracic aorta. Archs Surg. 79, 244-251.
Collins, R. and Hu. W. C. L. (1972) Dynamic deformation experiments on aortic tissue. J. Biomechanics 5. 333-335.
Fung, Y. C. (1972) Stress-strain history relations of soft tissues in simple elongation. In Biomechanics. its Foundations md Objectiws (Edited by Fung, Y. C., Perrone. N.. and Anliker. M.), pp. 181-208. Prentice-Hall. Engelwood Cliffs. N.J.
Glagov, S. (1973) Mechanical stresses on vessels and the non- uniform distribution of atherosclerosis. Med. C/ins .&‘. Am. 57. 63-77.
Greendyke, R. M. (1966) Traumatic rupture of the aorta. J. Am. med. Ass. 195, 527-530.
Haas, G. M. (1942) Elastic tissue. II. A study of the elasticity and tensile strength of elastic tissue isolated from the human aorta. Archs Path. 34, 971-981.
Hierton, T. E. and Jordan, P. (1956) The tensile strength of canine aortic segments. Angioloyy 7. 21-26.
Kivity, Y. and Collins, R. (1974). Non-linear wave propa- gation in viscoelastic tubes: application to aortic rup- ture. J. Biomechanics 7, 67-76.
Kleinsasser, L. J. (1943) Traumatic rupture of thoracic aorta. Arm. Surg. 118, 1071-1075.
Klotz, 0. and Simpson, W. (1932) Spontaneousrupture of the aorta. Am. J. med. Sci 184. 455-473.
Lawton, R. W. (1955) Measurements on the elasticity and damping of isolated aortic strips of the dog. Circulation Res. l&403-408.
Letterer, E. (1924) Beitrage zur Entstehung der Aorteruptur an typischer stelle. Virchows. Arch. path. Anat. Ph\)siol. 253, 534-544.
Lundewall, J. (1964) The mechanics of traumatic rupture of the aorta. Acta pathol. microbial. scund. 62, 34-36.
Milch, R. A. (1965) Matrix properties of the agmg arterial wall. Monogr. surg. Sci. 2, 26l-j4i,
Mohan, U. (1Y Ib) Passwe mecnamcal propernes 01 numan aortic tissue. Ph.D. Thesis, The University of Michigan, Ann Arbor, MI.
Oppenheim, F. (1918) Gibt es eine Spontanruptur der gesunden Aorta und wie kommt es zustande. Munch med. Wschr. 65, 1234-1237.
Patel. D. J. et ul. (1973)Dynamic anisotropic properties of the aorta in living dogs. Circulation Res.. XxX11. 93- 107.
Patel, D. J. et al. (1974) Hemodynamics. Ann. Rec. Phpsiol. 36, 125-154.
Ray,G., Liu, Y. K. andDavids,N. (1975)Wall stressin curved aorta in blunt chest trauma. Proceedings ofthe 28th Annuul Conference on Engineering in Medicine and Biology. Al- liance for Engineering in Medicine and Biology, Chevy Chase, MD.
Rindfleisch, E. (1873) Zur entstehung und heilung des Aneurysma Dissecans Aortae. Virchows Arch. path. Anut. Physiol. 131, 374.
Roach, M. R. (1977) Biophysical analyses of blood vessel walls and blood flow. Ann. Rev. Physiol. 39. 51-71.
Roberts, V. L. et al. (1967) Heart motion due to blunt trauma to the thorax. Proceedings of the Tenth Stapp Cur Crash Conference. Society of Automotive Engineers, Warrendale, PA.
Roy, C. S. (1880) Elastic properties of arterial wall. J. Physiol.. Lond. 3, 125-159.
Speckman, E. W. and Ringer. R. K. (1966) Volume-pressure relationships of the turkey aorta. Gun. J. Physiol. Phur- mat. 44,901-907.

902 DINESH MOHAN and JOHN W. MELVIN
Taylor, M. G. (1973) Hcmodynamics. Ann. Rev. Physiol. 35, larion Res. XIX, 400413. 87-116. Yamada, H. (1970) Strength of Biobical Materials. (Edited
Wolinsky, H. and Glagov, S. (1964) Structural basis for the by F. Gaynor Evans, T.). Williams and Wilkins, Baltimore. static mechanical properties of the aortic media. Circu-