failure detection in energized high voltage substation ...5)7/d0507024035.pdf · failure detection...
TRANSCRIPT
International Journal of Engineering Science Invention
ISSN (Online): 2319 – 6734, ISSN (Print): 2319 – 6726
www.ijesi.org ||Volume 5 Issue 7|| July 2016 || PP. 24-35
www.ijesi.org 24 | Page
Failure Detection in Energized High Voltage Substation
Grounding Grids - A Case Study
Luana Vasconcelos Gomes1, Euler C. T. Macedo
2, Edson Guedes da Costa
1,
Raimundo Carlos Silvério Freire1 and Malone Soares de Castro
1
1(Postgraduate of Electrical Engineering/Federal University of Campina Grande, Brazil)
2(Department of Electrical Engineering/Federal University of Paraiba, Brazil)
Abstract: An electronic system of measuring and processing surface voltage potentials distributed along the
grounding grid was developed. The electronic system is composed of several parts, an embedded computer,
signal conditioning circuits and computational routines. The adopted processor was a low-power open-source
single-board computer that allows the implementation of routines based on the finite-difference method. It was
possible to create two real time dimensional plots using the fall-of-potential method. The electronic system was
able to make a correct diagnosis of the aging state of the grounding grid. The results allowed evaluation of the
potential behaviour of the ground surface voltage in a consistent manner in a steady state operation. The results
obtained from measurements in high voltage substations using the developed embedded system were satisfactory
when compared to other measuring devices. This system was capable of easily locating problematic zones, such
as high potential concentrations, allowing efficient and fast grounding grid diagnosis.
Keywords: diagnostic, grounding grid degradation, high voltage grounding, substation, surface voltages
I. Introduction The introduction most equipment found in a high voltage substation uses the ground connection as a reference
for all operational voltages in the system. From an operational safety point of view, the objective of a ground
grid is to allow safe equipotential surface voltage on the ground during a surge (e.g. atmospheric and switching
surges) and when an industrial frequency current is flowing to the grounding.
A poor grounding system not only results in unnecessary transient damage, but also causes data and equipment
loss, plant shutdown, and increases fire and personnel risk[1]. An efficientgrounding systemcan impacton
betterenergy qualityrate.A low ground resistance value is not a guarantee of safety, because there is no direct
relationship between the grounding resistance and the maximum electric current that that a person is capable of
surviving[2]; based on this, alongside the necessity of verifying ground resistance during inspections, it is
necessary to evaluate the grid conductor condition and its connection points. The difference of potential between
different substation positions must mitigate personal safety and the adequate operation of equipment installed in
high voltage substations.
Based on their importance in relation to the system‟s operational continuity, grounding grids require periodic
evaluation, not only based on conductor corrosion, but also on ground resistivity and soil imperfections (e.g.
rocks, soil composition, soil inclination, etc.).
Some analytical methods are now being implemented in computational routines. Most of these methods try to
simulate real situations in grounding systems, promoting an additional analysis to the practical measurement
method[3-8].Many papers deal with the monitoring and diagnosis of the operational conditions of grounding
grids[1], [9-16].
An indirect manner of evaluating the degradation level of a grounding grid is to analyze the potential surface
distribution in the substation area and its surroundings. Grids that possess a uniform potential distribution and
low ground resistance do not present degradation problems, however, an elevated potential concentration might
indicate degradation [9], or other problems, such as rocks, unsuitable soil composition, etc.
A methodology that allows the detection of failures in energized grounding grids in real time is presented.
Therefore, an electronic device was specially developed for this application, which measures and processes the
surface potentials of an energized high voltage substation. The device is capable of measuring several points of
surface potential distributed along the grounding grid, performing the surface potential mapping in order to
identify high resistivity and degradation zones, discontinuities in the grid or failure points. The measured data is
processed with the aid of embedded software based on the Finite Difference Method. The measurements are
performed at industrial frequency and use the substation transformer unbalance current as a reference for ground
potential elevation.
Failure Detection In Energized High Voltage Substation Grounding Grids - A Case Study
www.ijesi.org 25 | Page
II. Grounding System Theory 2.1 Grounding Grids
Grounding systems must be projected to allow the surface potential in a high voltage substation to stay under the
maximum potential limits allowed for safety. The surface potential values must be limited in steady state and
transient conditions. To satisfy the low ground resistance values and to obtain low touch and step potential
values, high voltage substations are normally projected with ground grids composed of horizontal cables that
connect all copper electrodes. The grounding grids are efficient and economic, and are adopted in all kinds of
substations.
The IEEE standard [17]defines some important concepts in relation to the electric potential distribution:
Step voltage: The difference in surface potential experienced by a person bridging a distance of 1 m with
their feet without contacting any other grounded object.
Touch voltage: The difference of potential between the ground potential rise (GPR) and the surface
potential at the point where a person is standing, while at the same time having their hands in contact with a
grounded structure.
Mesh voltage: The maximum touch voltage to be found within a mesh of a ground grid.
Transferred voltage: A special case of touch voltage where voltage is transferred into or out of the
substation.
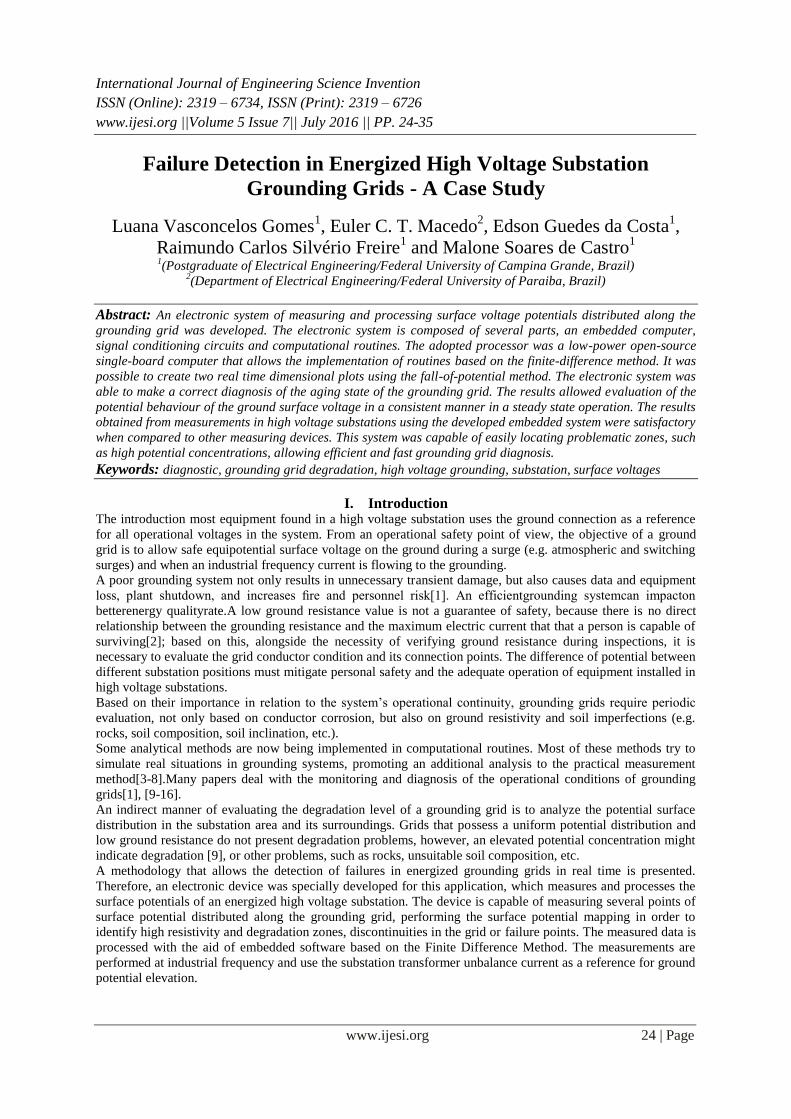
In a grounding grid, the current flows preferentially through the edges. The typical equipotential distribution
lines inside and in the neighboring region of the ground grid are given in Error! Reference source not found.1.
(a)
(b)
Figure 1. Equipotential distributions lines: (a) Equipotential lines (b) Potentials inside and in the neighboring
regions of a ground grid.
2.2 Finite Difference Methods (FDM)
To determine the electric potential in a region when the potential Vis known only in certain points of the region
under analysis, either a Poisson Equation (1) or a Laplace equation (2) is used [18], [19]. [9] presents the
mathematical development and the computer simulation steps.
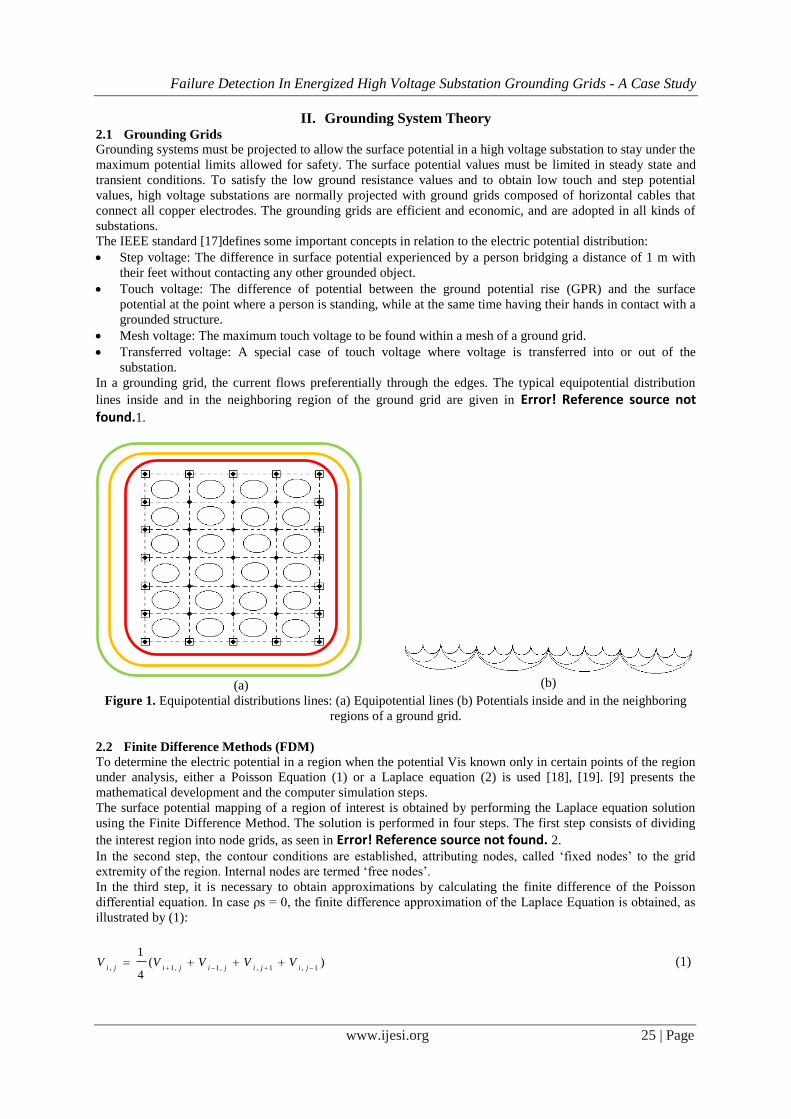
The surface potential mapping of a region of interest is obtained by performing the Laplace equation solution
using the Finite Difference Method. The solution is performed in four steps. The first step consists of dividing
the interest region into node grids, as seen in Error! Reference source not found. 2.
In the second step, the contour conditions are established, attributing nodes, called „fixed nodes‟ to the grid
extremity of the region. Internal nodes are termed „free nodes‟.
In the third step, it is necessary to obtain approximations by calculating the finite difference of the Poisson
differential equation. In case ρs = 0, the finite difference approximation of the Laplace Equation is obtained, as
illustrated by (1):
)(4
1
1,1,,1,1,
jijijijijiVVVVV
(1)
Failure Detection In Energized High Voltage Substation Grounding Grids - A Case Study
www.ijesi.org 26 | Page
The Laplace finite difference equation is determined for each point of the discretized region for which it is
desired to calculate the problem solution.
The fourth step consists of iteratively calculating the potential values at all grid nodes.
Figure 2. Domain discretization [18].
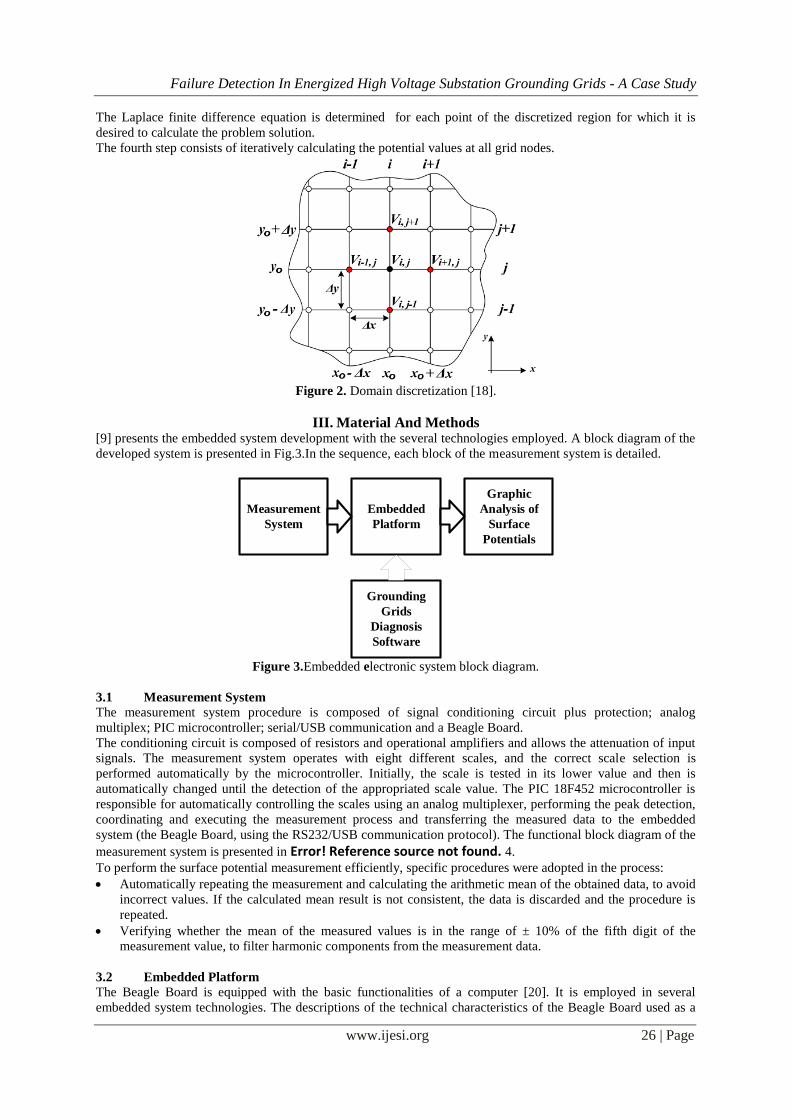
III. Material And Methods [9] presents the embedded system development with the several technologies employed. A block diagram of the
developed system is presented in Fig.3.In the sequence, each block of the measurement system is detailed.
Measurement
System
Embedded
Platform
Graphic
Analysis of
Surface
Potentials
Grounding
Grids
Diagnosis
Software
Figure 3.Embedded electronic system block diagram.
3.1 Measurement System
The measurement system procedure is composed of signal conditioning circuit plus protection; analog
multiplex; PIC microcontroller; serial/USB communication and a Beagle Board.
The conditioning circuit is composed of resistors and operational amplifiers and allows the attenuation of input
signals. The measurement system operates with eight different scales, and the correct scale selection is
performed automatically by the microcontroller. Initially, the scale is tested in its lower value and then is
automatically changed until the detection of the appropriated scale value. The PIC 18F452 microcontroller is
responsible for automatically controlling the scales using an analog multiplexer, performing the peak detection,
coordinating and executing the measurement process and transferring the measured data to the embedded
system (the Beagle Board, using the RS232/USB communication protocol). The functional block diagram of the
measurement system is presented in Error! Reference source not found. 4.
To perform the surface potential measurement efficiently, specific procedures were adopted in the process:
Automatically repeating the measurement and calculating the arithmetic mean of the obtained data, to avoid
incorrect values. If the calculated mean result is not consistent, the data is discarded and the procedure is
repeated.
Verifying whether the mean of the measured values is in the range of ± 10% of the fifth digit of the
measurement value, to filter harmonic components from the measurement data.
3.2 Embedded Platform
The Beagle Board is equipped with the basic functionalities of a computer [20]. It is employed in several
embedded system technologies. The descriptions of the technical characteristics of the Beagle Board used as a
Failure Detection In Energized High Voltage Substation Grounding Grids - A Case Study
www.ijesi.org 27 | Page
coordinator system are found in [9], but, with the objective of maintaining the low-cost development, an open-
source Linux® operational system was used, the Angstrom® distribution.
3.3 Grounding Grid Diagnosis Software
The software must be able to map the potential at the ground surface of the substation and itsneighborhoods.
The diagnosis enables possible field concentrations or eventual difficulties for current draining to be noted, such
as high resistivity zones in the grid area, corrosion or discontinuity in steady-state operation condition or in a
short-circuit occurrence.
The computational routine was developed by using a multiplatform tool, the Qt®, which is widely used for the
application development of graphical user interfaces (GUI), in embedded systems. The tools adopted were the
QT Creator platform, C++ language and the Qwt graphical library (Qt Widgets for Technical Applications). The
Qwt library possesses several types of data structures for bi-dimensional data plotting. These features include
curve plots, scatter plots, spectrograms, contour plots, histograms, dials, compasses, knobs, wheels, sliders,
thermos, etc.
In order to use the software, the specification of a domain, contour conditions and/or initial conditions are
necessary. Using these conditions associated with computational resources, it was possible to simulate the
behavior of the electric potential (V) in a determined region, in this case, the HV substation [9] - [16].
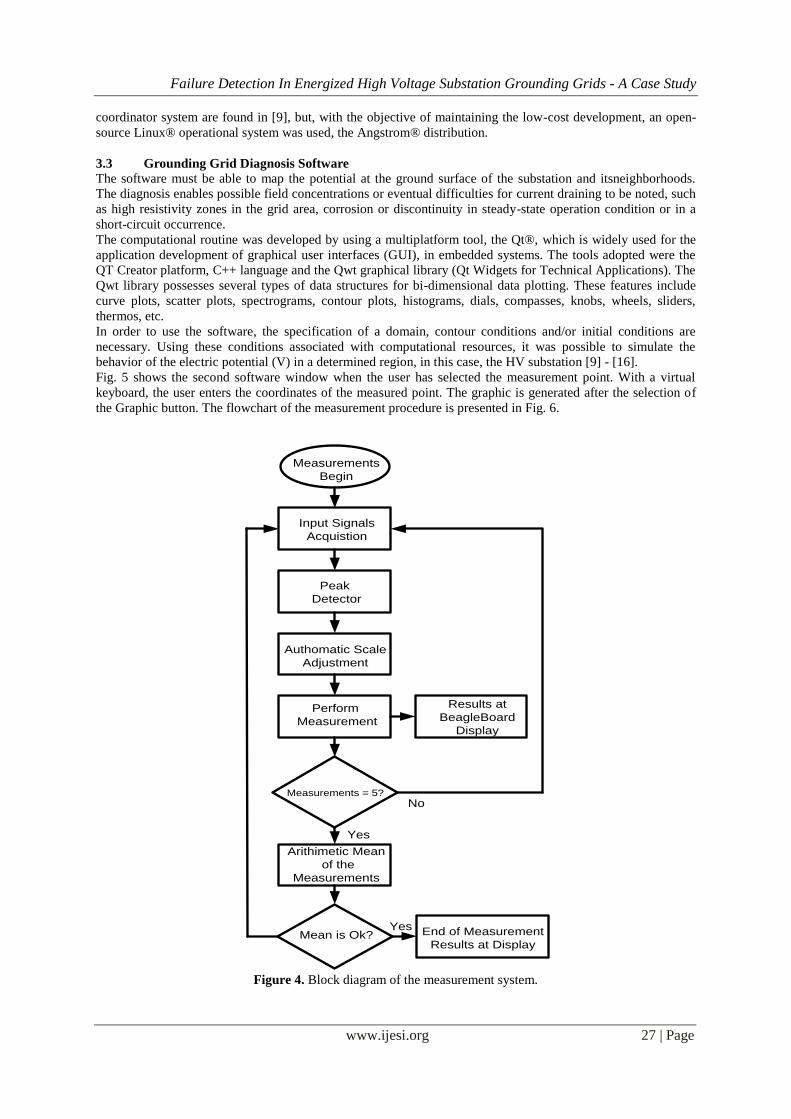
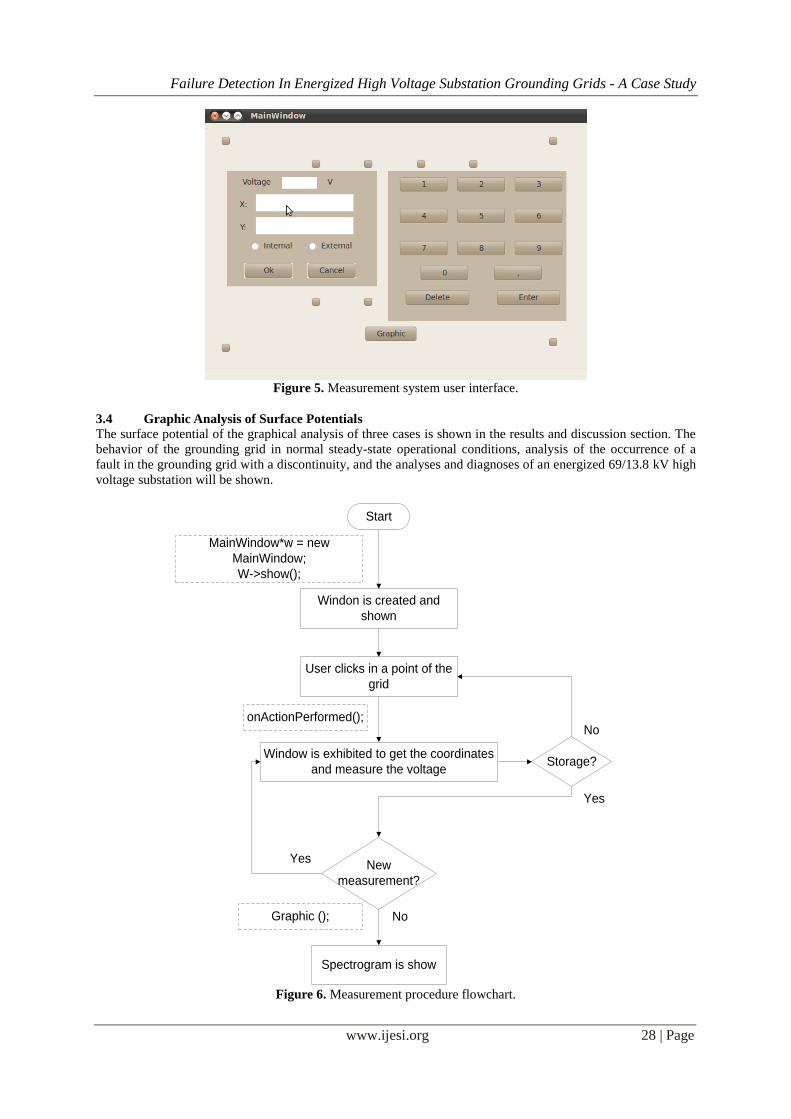
Fig. 5 shows the second software window when the user has selected the measurement point. With a virtual
keyboard, the user enters the coordinates of the measured point. The graphic is generated after the selection of
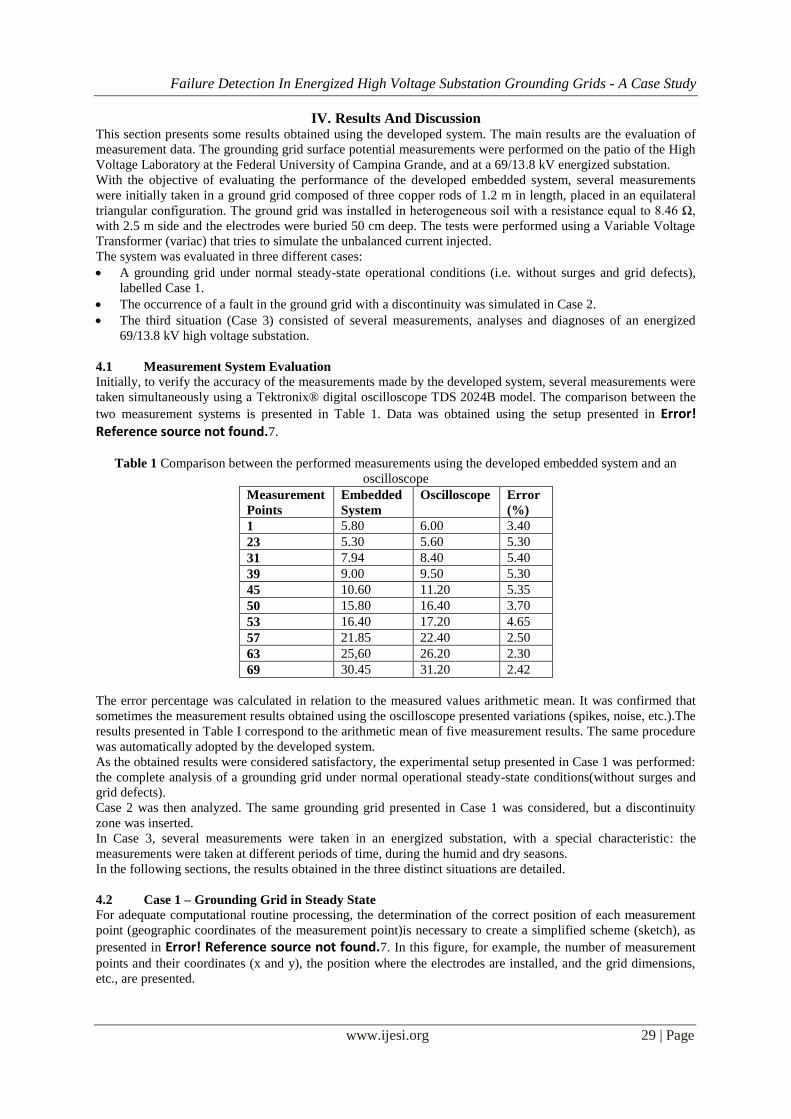
the Graphic button. The flowchart of the measurement procedure is presented in Fig. 6.
Perform
Measurement
Peak
Detector
Authomatic Scale
Adjustment
Measurements = 5?
Results at
BeagleBoard
Display
Arithimetic Mean
of the
Measurements
Mean is Ok?Yes End of Measurement
Results at Display
Input Signals
Acquistion
Measurements
Begin
Yes
No
Figure 4. Block diagram of the measurement system.
Failure Detection In Energized High Voltage Substation Grounding Grids - A Case Study
www.ijesi.org 28 | Page
Figure 5. Measurement system user interface.
3.4 Graphic Analysis of Surface Potentials
The surface potential of the graphical analysis of three cases is shown in the results and discussion section. The
behavior of the grounding grid in normal steady-state operational conditions, analysis of the occurrence of a
fault in the grounding grid with a discontinuity, and the analyses and diagnoses of an energized 69/13.8 kV high
voltage substation will be shown.
Start
Windon is created and
shown
User clicks in a point of the
grid
Window is exhibited to get the coordinates
and measure the voltageStorage?
New
measurement?
Spectrogram is show
MainWindow*w = new
MainWindow;
W->show();
onActionPerformed();No
Yes
Yes
NoGraphic ();
Figure 6. Measurement procedure flowchart.
Failure Detection In Energized High Voltage Substation Grounding Grids - A Case Study
www.ijesi.org 29 | Page
IV. Results And Discussion This section presents some results obtained using the developed system. The main results are the evaluation of
measurement data. The grounding grid surface potential measurements were performed on the patio of the High
Voltage Laboratory at the Federal University of Campina Grande, and at a 69/13.8 kV energized substation.
With the objective of evaluating the performance of the developed embedded system, several measurements
were initially taken in a ground grid composed of three copper rods of 1.2 m in length, placed in an equilateral
triangular configuration. The ground grid was installed in heterogeneous soil with a resistance equal to 8.46 Ω,
with 2.5 m side and the electrodes were buried 50 cm deep. The tests were performed using a Variable Voltage
Transformer (variac) that tries to simulate the unbalanced current injected.
The system was evaluated in three different cases:
A grounding grid under normal steady-state operational conditions (i.e. without surges and grid defects),
labelled Case 1.
The occurrence of a fault in the ground grid with a discontinuity was simulated in Case 2.
The third situation (Case 3) consisted of several measurements, analyses and diagnoses of an energized
69/13.8 kV high voltage substation.
4.1 Measurement System Evaluation
Initially, to verify the accuracy of the measurements made by the developed system, several measurements were
taken simultaneously using a Tektronix® digital oscilloscope TDS 2024B model. The comparison between the
two measurement systems is presented in Table 1. Data was obtained using the setup presented in Error! Reference source not found.7.
Table 1 Comparison between the performed measurements using the developed embedded system and an
oscilloscope
Measurement
Points
Embedded
System
Oscilloscope Error
(%)
1 5.80 6.00 3.40
23 5.30 5.60 5.30
31 7.94 8.40 5.40
39 9.00 9.50 5.30
45 10.60 11.20 5.35
50 15.80 16.40 3.70
53 16.40 17.20 4.65
57 21.85 22.40 2.50
63 25,60 26.20 2.30
69 30.45 31.20 2.42
The error percentage was calculated in relation to the measured values arithmetic mean. It was confirmed that
sometimes the measurement results obtained using the oscilloscope presented variations (spikes, noise, etc.).The
results presented in Table I correspond to the arithmetic mean of five measurement results. The same procedure
was automatically adopted by the developed system.
As the obtained results were considered satisfactory, the experimental setup presented in Case 1 was performed:
the complete analysis of a grounding grid under normal operational steady-state conditions(without surges and
grid defects).
Case 2 was then analyzed. The same grounding grid presented in Case 1 was considered, but a discontinuity
zone was inserted.
In Case 3, several measurements were taken in an energized substation, with a special characteristic: the
measurements were taken at different periods of time, during the humid and dry seasons.
In the following sections, the results obtained in the three distinct situations are detailed.
4.2 Case 1 – Grounding Grid in Steady State
For adequate computational routine processing, the determination of the correct position of each measurement
point (geographic coordinates of the measurement point)is necessary to create a simplified scheme (sketch), as
presented in Error! Reference source not found.7. In this figure, for example, the number of measurement
points and their coordinates (x and y), the position where the electrodes are installed, and the grid dimensions,
etc., are presented.
Failure Detection In Energized High Voltage Substation Grounding Grids - A Case Study
www.ijesi.org 30 | Page
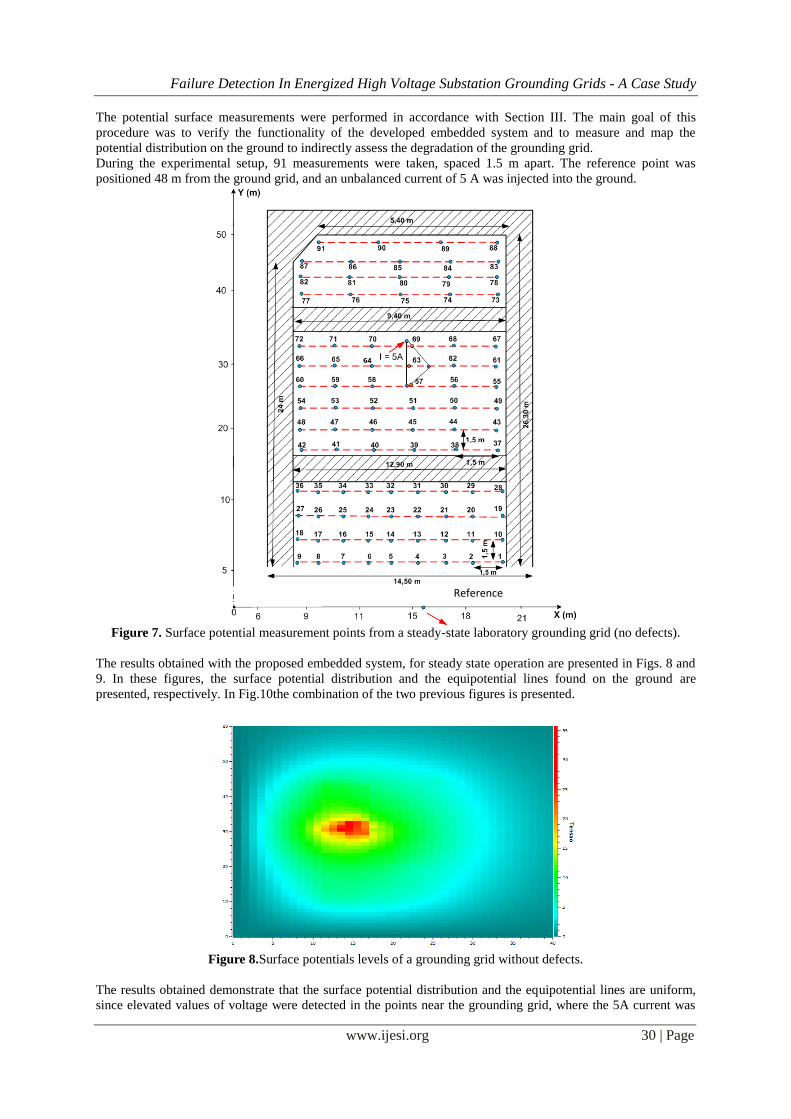
The potential surface measurements were performed in accordance with Section III. The main goal of this
procedure was to verify the functionality of the developed embedded system and to measure and map the
potential distribution on the ground to indirectly assess the degradation of the grounding grid.
During the experimental setup, 91 measurements were taken, spaced 1.5 m apart. The reference point was
positioned 48 m from the ground grid, and an unbalanced current of 5 A was injected into the ground.
Figure 7. Surface potential measurement points from a steady-state laboratory grounding grid (no defects).
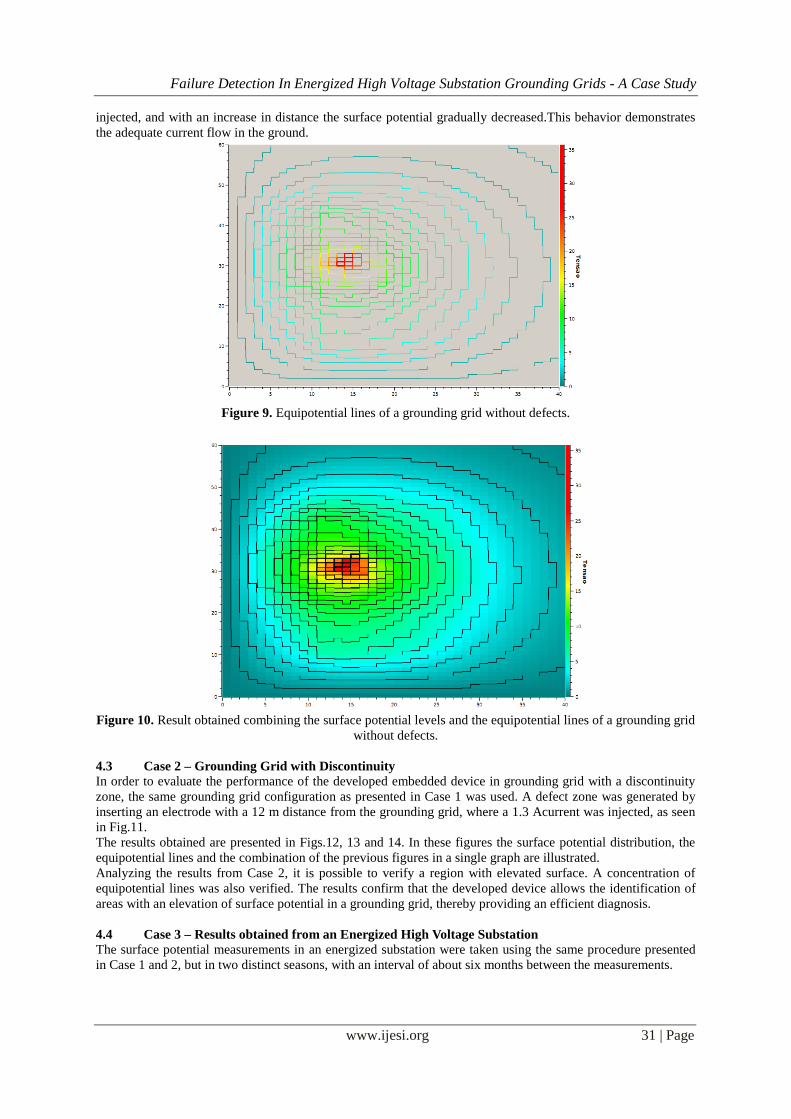
The results obtained with the proposed embedded system, for steady state operation are presented in Figs. 8 and
9. In these figures, the surface potential distribution and the equipotential lines found on the ground are
presented, respectively. In Fig.10the combination of the two previous figures is presented.
Figure 8.Surface potentials levels of a grounding grid without defects.
The results obtained demonstrate that the surface potential distribution and the equipotential lines are uniform,
since elevated values of voltage were detected in the points near the grounding grid, where the 5A current was
Reference
Failure Detection In Energized High Voltage Substation Grounding Grids - A Case Study
www.ijesi.org 31 | Page
injected, and with an increase in distance the surface potential gradually decreased.This behavior demonstrates
the adequate current flow in the ground.
Figure 9. Equipotential lines of a grounding grid without defects.
Figure 10. Result obtained combining the surface potential levels and the equipotential lines of a grounding grid
without defects.
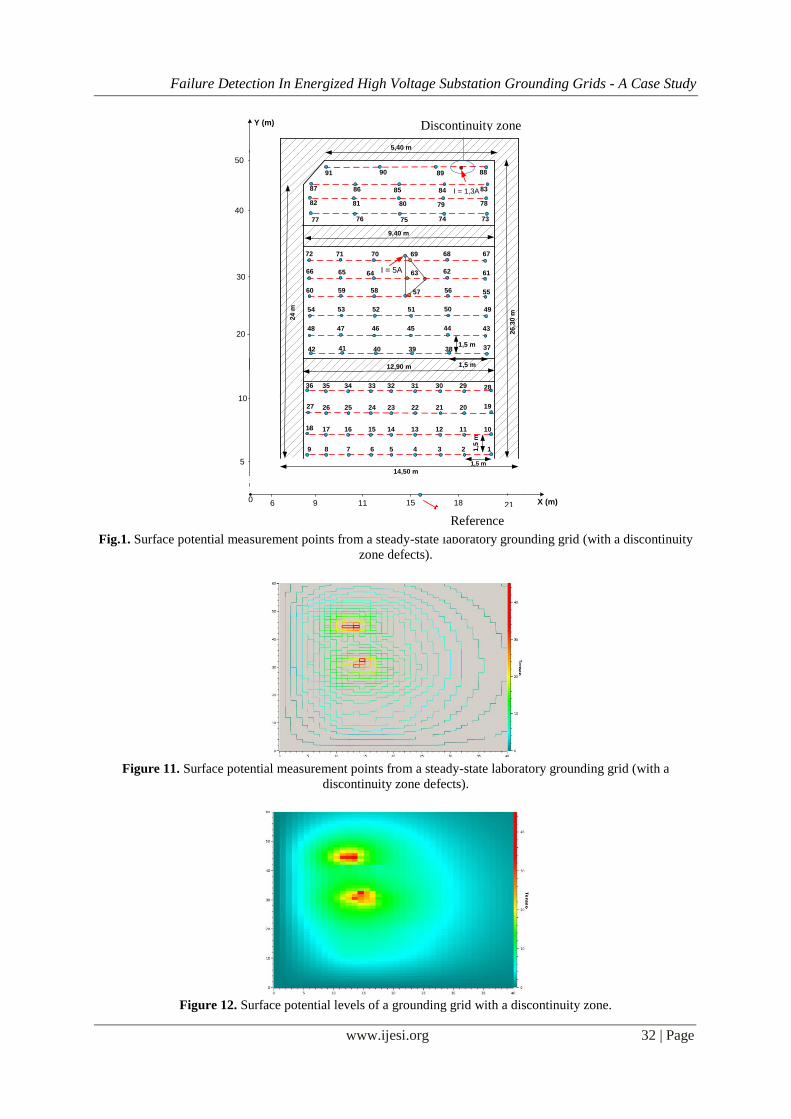
4.3 Case 2 – Grounding Grid with Discontinuity
In order to evaluate the performance of the developed embedded device in grounding grid with a discontinuity
zone, the same grounding grid configuration as presented in Case 1 was used. A defect zone was generated by
inserting an electrode with a 12 m distance from the grounding grid, where a 1.3 Acurrent was injected, as seen
in Fig.11.
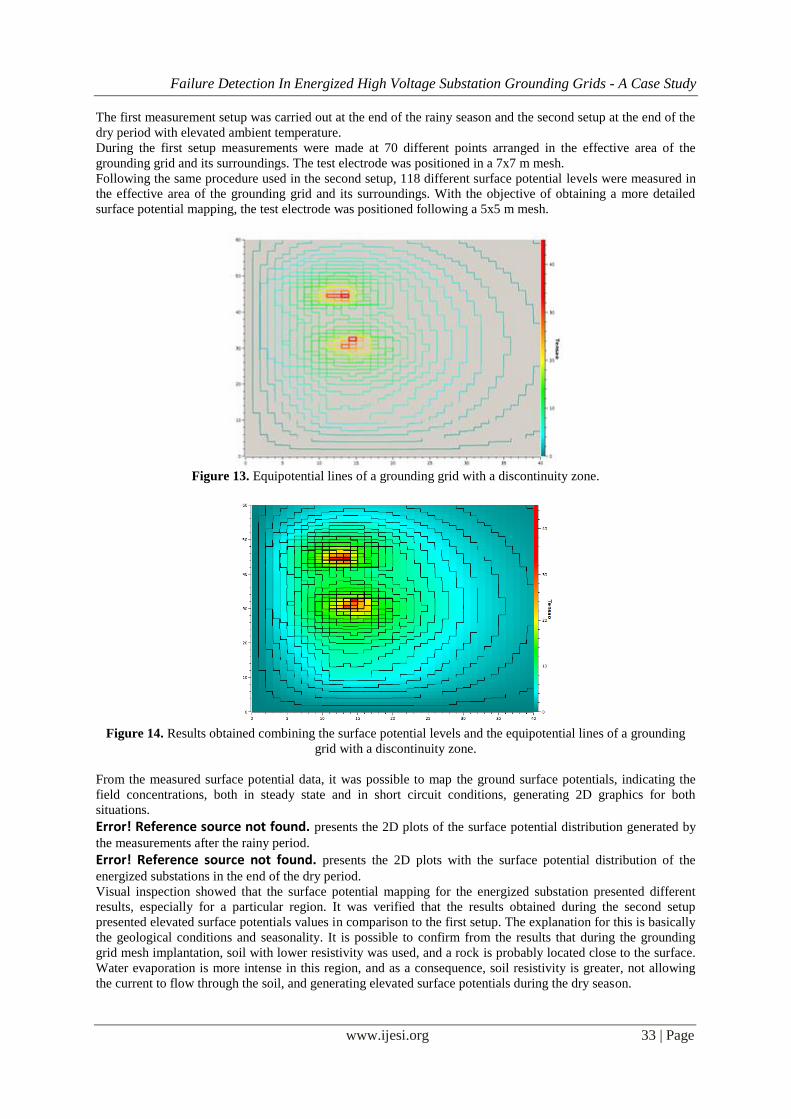
The results obtained are presented in Figs.12, 13 and 14. In these figures the surface potential distribution, the
equipotential lines and the combination of the previous figures in a single graph are illustrated.
Analyzing the results from Case 2, it is possible to verify a region with elevated surface. A concentration of
equipotential lines was also verified. The results confirm that the developed device allows the identification of
areas with an elevation of surface potential in a grounding grid, thereby providing an efficient diagnosis.
4.4 Case 3 – Results obtained from an Energized High Voltage Substation
The surface potential measurements in an energized substation were taken using the same procedure presented
in Case 1 and 2, but in two distinct seasons, with an interval of about six months between the measurements.
Failure Detection In Energized High Voltage Substation Grounding Grids - A Case Study
www.ijesi.org 32 | Page
0 6 9 11 15 18 21
10
20
30
40
50
42 39 38 37
77 76 74 73
91 90 89
Ponto de
Referencia
X (m)
Y (m)
88
1,5 m
1,5 m
9,40 m
26
,30
m
I = 5A
14,50 m
24
m
12,90 m
5,40 m
5
9 2 178
1,5 m
6 5 4 3 1,5
m
111617 15 14 13 12
202526 24 23 22 21
293435 33 32 31 30
18
27
36
10
19
28
4041
51 505253
69 687071
63 626465
57 565859
45 444647 43
49
55
61
6772
66
60
54
48
75
78
83
79808182
84858687 I = 1,3A
Ponto de Falha
Fig.1. Surface potential measurement points from a steady-state laboratory grounding grid (with a discontinuity
zone defects).
Figure 11. Surface potential measurement points from a steady-state laboratory grounding grid (with a
discontinuity zone defects).
Figure 12. Surface potential levels of a grounding grid with a discontinuity zone.
Reference
Discontinuity zone
Failure Detection In Energized High Voltage Substation Grounding Grids - A Case Study
www.ijesi.org 33 | Page
The first measurement setup was carried out at the end of the rainy season and the second setup at the end of the
dry period with elevated ambient temperature.
During the first setup measurements were made at 70 different points arranged in the effective area of the
grounding grid and its surroundings. The test electrode was positioned in a 7x7 m mesh.
Following the same procedure used in the second setup, 118 different surface potential levels were measured in
the effective area of the grounding grid and its surroundings. With the objective of obtaining a more detailed
surface potential mapping, the test electrode was positioned following a 5x5 m mesh.
Figure 13. Equipotential lines of a grounding grid with a discontinuity zone.
Figure 14. Results obtained combining the surface potential levels and the equipotential lines of a grounding
grid with a discontinuity zone.
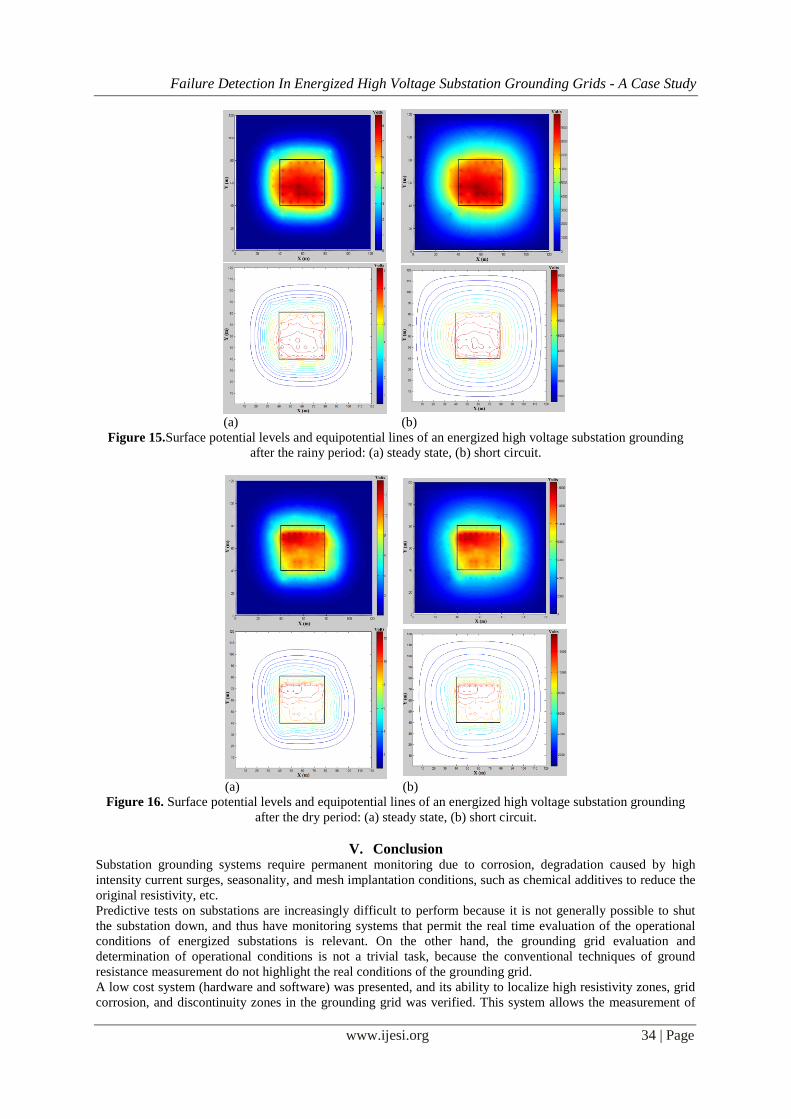
From the measured surface potential data, it was possible to map the ground surface potentials, indicating the
field concentrations, both in steady state and in short circuit conditions, generating 2D graphics for both
situations.
Error! Reference source not found. presents the 2D plots of the surface potential distribution generated by
the measurements after the rainy period.
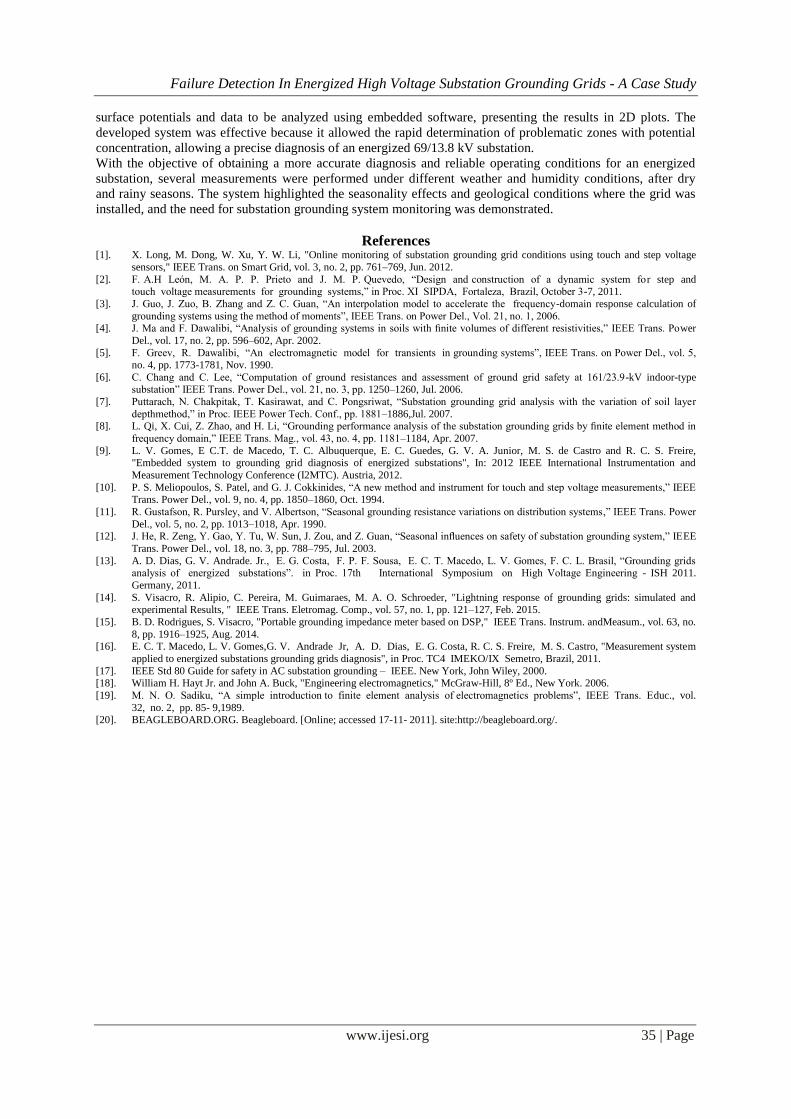
Error! Reference source not found. presents the 2D plots with the surface potential distribution of the
energized substations in the end of the dry period.
Visual inspection showed that the surface potential mapping for the energized substation presented different
results, especially for a particular region. It was verified that the results obtained during the second setup
presented elevated surface potentials values in comparison to the first setup. The explanation for this is basically
the geological conditions and seasonality. It is possible to confirm from the results that during the grounding
grid mesh implantation, soil with lower resistivity was used, and a rock is probably located close to the surface.
Water evaporation is more intense in this region, and as a consequence, soil resistivity is greater, not allowing
the current to flow through the soil, and generating elevated surface potentials during the dry season.
Failure Detection In Energized High Voltage Substation Grounding Grids - A Case Study
www.ijesi.org 34 | Page
(a) (b)
Figure 15.Surface potential levels and equipotential lines of an energized high voltage substation grounding
after the rainy period: (a) steady state, (b) short circuit.
(a) (b)
Figure 16. Surface potential levels and equipotential lines of an energized high voltage substation grounding
after the dry period: (a) steady state, (b) short circuit.
V. Conclusion Substation grounding systems require permanent monitoring due to corrosion, degradation caused by high
intensity current surges, seasonality, and mesh implantation conditions, such as chemical additives to reduce the
original resistivity, etc.
Predictive tests on substations are increasingly difficult to perform because it is not generally possible to shut
the substation down, and thus have monitoring systems that permit the real time evaluation of the operational
conditions of energized substations is relevant. On the other hand, the grounding grid evaluation and
determination of operational conditions is not a trivial task, because the conventional techniques of ground
resistance measurement do not highlight the real conditions of the grounding grid.
A low cost system (hardware and software) was presented, and its ability to localize high resistivity zones, grid
corrosion, and discontinuity zones in the grounding grid was verified. This system allows the measurement of
Failure Detection In Energized High Voltage Substation Grounding Grids - A Case Study
www.ijesi.org 35 | Page
surface potentials and data to be analyzed using embedded software, presenting the results in 2D plots. The
developed system was effective because it allowed the rapid determination of problematic zones with potential
concentration, allowing a precise diagnosis of an energized 69/13.8 kV substation.
With the objective of obtaining a more accurate diagnosis and reliable operating conditions for an energized
substation, several measurements were performed under different weather and humidity conditions, after dry
and rainy seasons. The system highlighted the seasonality effects and geological conditions where the grid was
installed, and the need for substation grounding system monitoring was demonstrated.
References [1]. X. Long, M. Dong, W. Xu, Y. W. Li, "Online monitoring of substation grounding grid conditions using touch and step voltage
sensors," IEEE Trans. on Smart Grid, vol. 3, no. 2, pp. 761–769, Jun. 2012.
[2]. F. A.H León, M. A. P. P. Prieto and J. M. P. Quevedo, “Design and construction of a dynamic system for step and touch voltage measurements for grounding systems,” in Proc. XI SIPDA, Fortaleza, Brazil, October 3-7, 2011.
[3]. J. Guo, J. Zuo, B. Zhang and Z. C. Guan, “An interpolation model to accelerate the frequency-domain response calculation of
grounding systems using the method of moments”, IEEE Trans. on Power Del., Vol. 21, no. 1, 2006. [4]. J. Ma and F. Dawalibi, “Analysis of grounding systems in soils with finite volumes of different resistivities,” IEEE Trans. Power
Del., vol. 17, no. 2, pp. 596–602, Apr. 2002.
[5]. F. Greev, R. Dawalibi, “An electromagnetic model for transients in grounding systems”, IEEE Trans. on Power Del., vol. 5, no. 4, pp. 1773-1781, Nov. 1990.
[6]. C. Chang and C. Lee, “Computation of ground resistances and assessment of ground grid safety at 161/23.9-kV indoor-type substation” IEEE Trans. Power Del., vol. 21, no. 3, pp. 1250–1260, Jul. 2006.
[7]. Puttarach, N. Chakpitak, T. Kasirawat, and C. Pongsriwat, “Substation grounding grid analysis with the variation of soil layer
depthmethod,” in Proc. IEEE Power Tech. Conf., pp. 1881–1886,Jul. 2007. [8]. L. Qi, X. Cui, Z. Zhao, and H. Li, “Grounding performance analysis of the substation grounding grids by finite element method in
frequency domain,” IEEE Trans. Mag., vol. 43, no. 4, pp. 1181–1184, Apr. 2007.
[9]. L. V. Gomes, E C.T. de Macedo, T. C. Albuquerque, E. C. Guedes, G. V. A. Junior, M. S. de Castro and R. C. S. Freire, "Embedded system to grounding grid diagnosis of energized substations", In: 2012 IEEE International Instrumentation and
Measurement Technology Conference (I2MTC). Austria, 2012.
[10]. P. S. Meliopoulos, S. Patel, and G. J. Cokkinides, “A new method and instrument for touch and step voltage measurements,” IEEE Trans. Power Del., vol. 9, no. 4, pp. 1850–1860, Oct. 1994.
[11]. R. Gustafson, R. Pursley, and V. Albertson, “Seasonal grounding resistance variations on distribution systems,” IEEE Trans. Power
Del., vol. 5, no. 2, pp. 1013–1018, Apr. 1990. [12]. J. He, R. Zeng, Y. Gao, Y. Tu, W. Sun, J. Zou, and Z. Guan, “Seasonal influences on safety of substation grounding system,” IEEE
Trans. Power Del., vol. 18, no. 3, pp. 788–795, Jul. 2003.
[13]. A. D. Dias, G. V. Andrade. Jr., E. G. Costa, F. P. F. Sousa, E. C. T. Macedo, L. V. Gomes, F. C. L. Brasil, “Grounding grids analysis of energized substations”. in Proc. 17th International Symposium on High Voltage Engineering - ISH 2011.
Germany, 2011.
[14]. S. Visacro, R. Alipio, C. Pereira, M. Guimaraes, M. A. O. Schroeder, "Lightning response of grounding grids: simulated and experimental Results, " IEEE Trans. Eletromag. Comp., vol. 57, no. 1, pp. 121–127, Feb. 2015.
[15]. B. D. Rodrigues, S. Visacro, "Portable grounding impedance meter based on DSP," IEEE Trans. Instrum. andMeasum., vol. 63, no.
8, pp. 1916–1925, Aug. 2014. [16]. E. C. T. Macedo, L. V. Gomes,G. V. Andrade Jr, A. D. Dias, E. G. Costa, R. C. S. Freire, M. S. Castro, "Measurement system
applied to energized substations grounding grids diagnosis", in Proc. TC4 IMEKO/IX Semetro, Brazil, 2011.
[17]. IEEE Std 80 Guide for safety in AC substation grounding – IEEE. New York, John Wiley, 2000. [18]. William H. Hayt Jr. and John A. Buck, "Engineering electromagnetics," McGraw-Hill, 8º Ed., New York. 2006.
[19]. M. N. O. Sadiku, “A simple introduction to finite element analysis of electromagnetics problems”, IEEE Trans. Educ., vol.
32, no. 2, pp. 85- 9,1989. [20]. BEAGLEBOARD.ORG. Beagleboard. [Online; accessed 17-11- 2011]. site:http://beagleboard.org/.