failure analysis of a ch-47 horizontal hinge pin assembly ... · failure analysis of a ch-47...
TRANSCRIPT
Failure Analysis of a CH-47 Horizontal Hinge Pin
Assembly, P/N 114RS226
by Marc Pepi and Gary Wechsler
ARL-TR-4011 December 2006 Approved for public release; distribution is unlimited.
NOTICES
Disclaimers The findings in this report are not to be construed as an official Department of the Army position unless so designated by other authorized documents. Citation of manufacturer’s or trade names does not constitute an official endorsement or approval of the use thereof. Destroy this report when it is no longer needed. Do not return it to the originator.
Army Research Laboratory Aberdeen Proving Ground, MD 21005-5069
ARL-TR-4011 December 2006
Failure Analysis of a CH-47 Horizontal Hinge Pin
Assembly, P/N 114RS226
Marc Pepi
Weapons and Materials Research Directorate, ARL
Gary Wechsler U.S. Army Research, Development and Engineering Command
Approved for public release; distribution is unlimited.
ii
REPORT DOCUMENTATION PAGE Form Approved OMB No. 0704-0188
Public reporting burden for this collection of information is estimated to average 1 hour per response, including the time for reviewing instructions, searching existing data sources, gathering and maintaining the data needed, and completing and reviewing the collection information. Send comments regarding this burden estimate or any other aspect of this collection of information, including suggestions for reducing the burden, to Department of Defense, Washington Headquarters Services, Directorate for Information Operations and Reports (0704-0188), 1215 Jefferson Davis Highway, Suite 1204, Arlington, VA 22202-4302. Respondents should be aware that notwithstanding any other provision of law, no person shall be subject to any penalty for failing to comply with a collection of information if it does not display a currently valid OMB control number. PLEASE DO NOT RETURN YOUR FORM TO THE ABOVE ADDRESS. 1. REPORT DATE (DD-MM-YYYY)
December 2006 2. REPORT TYPE
Final 3. DATES COVERED (From - To)
November 2005–July 2006 5a. CONTRACT NUMBER
5b. GRANT NUMBER
4. TITLE AND SUBTITLE
Failure Analysis of a CH-47 Horizontal Hinge Pin Assembly, P/N 114RS226 5c. PROGRAM ELEMENT NUMBER
5d. PROJECT NUMBER
680L31 5e. TASK NUMBER
6. AUTHOR(S)
Marc Pepi and Gary Wechsler*
5f. WORK UNIT NUMBER
7. PERFORMING ORGANIZATION NAME(S) AND ADDRESS(ES)
U.S. Army Research Laboratory ATTN: AMSRD-ARL-WM-MC Aberdeen Proving Ground, MD 21005-5069
8. PERFORMING ORGANIZATION REPORT NUMBER
ARL-TR-4011
10. SPONSOR/MONITOR'S ACRONYM(S)
AMCOM 9. SPONSORING/MONITORING AGENCY NAME(S) AND ADDRESS(ES)
U.S. Army Aviation and Missile Command Redstone Arsenal, AL 35898 11. SPONSOR/MONITOR'S REPORT
NUMBER(S)
12. DISTRIBUTION/AVAILABILITY STATEMENT
Approved for public release; distribution is unlimited.
13. SUPPLEMENTARY NOTES
*U.S. Army Research, Development and Engineering Command, Redstone Arsenal, AL 35898 14. ABSTRACT
A CH-47D horizontal hinge pin assembly was examined to determine the root cause of ring and roller fracture and spalling. Chemical analyses, metallography, and hardness testing indicated that the rings and rollers conformed to the material requirements of the governing drawing. Metallography and visual and scanning electron microscopy indicated the failure likely initiated in the lag ring due to rolling contact fatigue because of high-service loads.
15. SUBJECT TERMS
failure analysis, parachute bag knife, metallography, horizontal hinge pin, rolling contact pin
16. SECURITY CLASSIFICATION OF: 19a. NAME OF RESPONSIBLE PERSON Marc Pepi
a. REPORT UNCLASSIFIED
b. ABSTRACT UNCLASSIFIED
c. THIS PAGE UNCLASSIFIED
17. LIMITATION OF ABSTRACT
UL
18. NUMBER OF PAGES
38
19b. TELEPHONE NUMBER (Include area code) 410-306-0848
Standard Form 298 (Rev. 8/98) Prescribed by ANSI Std. Z39.18

Contents
List of Figures iv
List of Tables vi
Acknowledgments vii
1. Summary 1
2. Background 1
3. Visual Examination 1
4. Chemical Analysis 6
4.1 Metallography .................................................................................................................7
4.2 Hardness Testing ...........................................................................................................11 4.2.1 Rings....................................................................................................................11 4.2.2 Rollers .................................................................................................................14
4.3 Scanning Electron Microscopy .....................................................................................20
5. Discussion 20
6. Recommendations 24
7. Conclusions 25
8. References 26
Distribution List 27
iii
List of Figures
Figure 1. The rollers, cage, and sleeve of the lead roller bearing set. The scale is 6 inches in length..........................................................................................................................................2
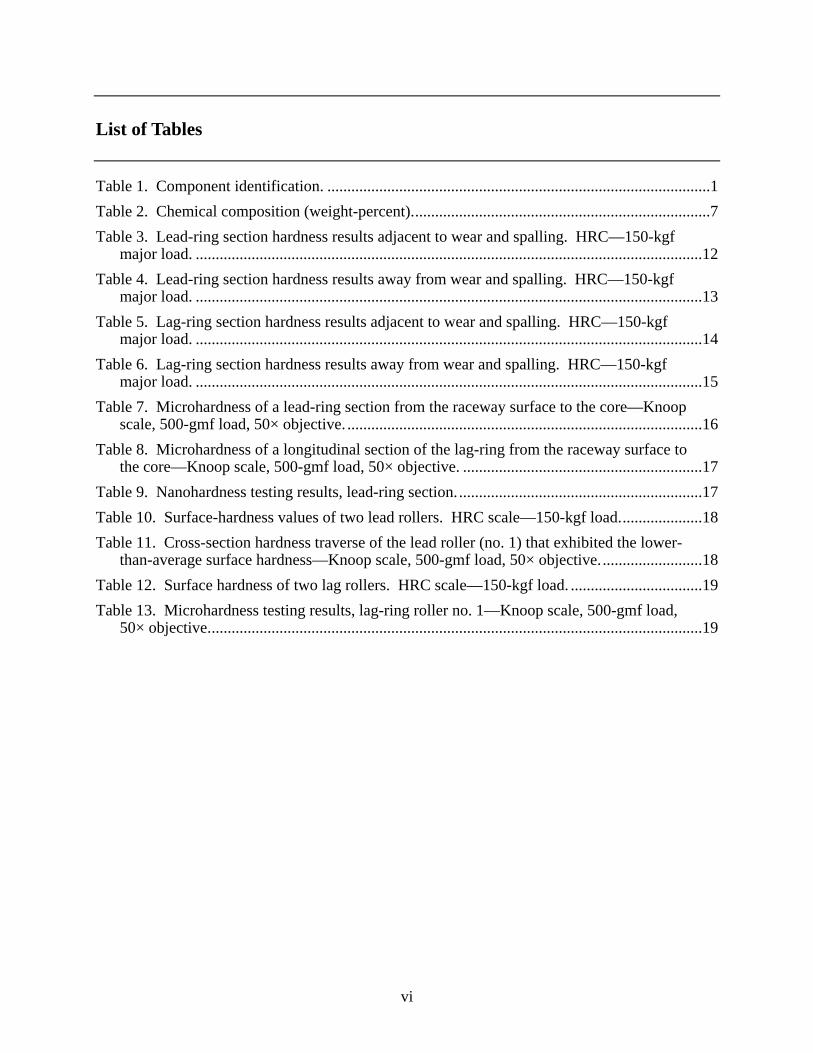
Figure 2. View of the lag ring showing that the fractured region encompassed an approximately 4-in arc length of the ring’s circumference........................................................2
Figure 3. Three pieces of material that fractured from the lag ring depicted in figure 2................3 Figure 4. The lag-ring raceway exhibited a spalled surface topography. Fracture and
cracking were relegated to the portion of the lag ring exhibiting a spalled raceway surface. .......................................................................................................................................3
Figure 5. Lag-ring fracture exhibiting beach marks (parallel with yellow lines), river patterns (parallel to black arrows), and multiple origins (white arrows). Scale demarcations at image bottom denote 1/64-in spacing. .......................................................................................3
Figure 6. Typical surface damage and spalling exhibited on the lag rollers. The topography of the surface created by spalling exhibited the beach marks (parallel with the blue lines) and river patterns (parallel with the black arrows) indicative of subsurface crack initiation and propagation by RCF. Magnified ~5.7×. .............................................................................4
Figure 7. One of the eight damaged rollers was broken in the two pieces shown. Scale demarcations at image bottom denote 1/64-in spacing..............................................................4
Figure 8. Inner surface of the lag retainer exhibiting wear damage caused by contact with the mating rotating roller—indicative of high contact loads between the two parts. Magnified 9.7×...........................................................................................................................5
Figure 9. Lead-ring raceway spalling. ............................................................................................5 Figure 10. Lead-ring raceway spalling likely began by the edge of a groove. ...............................5 Figure 11. The HHP in the as-received condition exhibited discolored lead-sleeve and lag-
sleeve raceways. The chrome-plated surface of the HHP between the sleeves exhibited wear induced by mating seals and fretting product created by the relative motion between the HHP and a mating pitch-shaft sleeve...................................................................................6
Figure 12. Micrograph of an as-polished section cut from the spalled portion of the lag-ring raceway. No microstructural anomalies were observed. Magnified 200×...............................7
Figure 13. Spalling and cracking on the raceway of the lead ring. Dashed line represents section made for metallographic examination. ..........................................................................8
Figure 14. Detail of lead-ring raceway cracking depicted within red box in figure 13—likely the onset of spalling. ..................................................................................................................8
Figure 15. Metallography of the lead-ring region depicted in figure 14 revealed a subsurface crack running parallel with the lead ring’s raceway surface......................................................9
Figure 16. Metallography of the spalled and cracked area to the left of the area depicted in figure 13 revealed cracking parallel with the raceway surface and 45o to the raceway surface. .......................................................................................................................................9
iv

Figure 17. Etching the microstructure of the subsurface crack depicted in figure 15 revealed the presence of microstructural alterations—a feature associated with RCF. Etchant: Vilella’s reagent. ......................................................................................................................10
Figure 18. Microstructure of the lead ring exhibiting the carbides (both acicular and globular) dispersed in a matrix of tempered martensite observed in all the metallographic cross sections produced from the M50 steel rings and rollers. Etchant: Vilella’s reagent. ...10
Figure 19. Micrograph of the lag-ring microstructure showing a grain size that conformed to the required average ASTM grain size no. 8 or finer, with occasional grains as large as ASTM grain size no. 6. Etchant: Vilella’s reagent. Magnified 100×. ..................................11
Figure 20. Schematic showing location of hardness readings on lead-ring sample, adjacent to wear (see table 3). ...................................................................................................................12
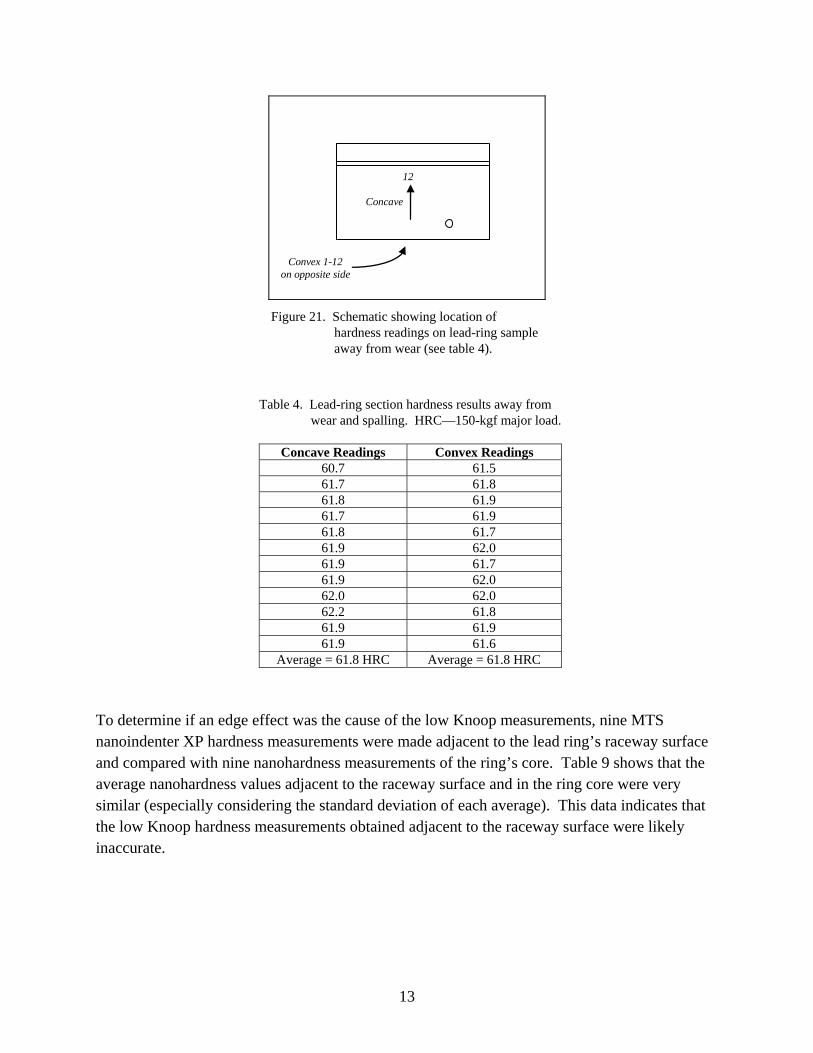
Figure 21. Schematic showing location of hardness readings on lead-ring sample away from wear (see table 4). ....................................................................................................................13
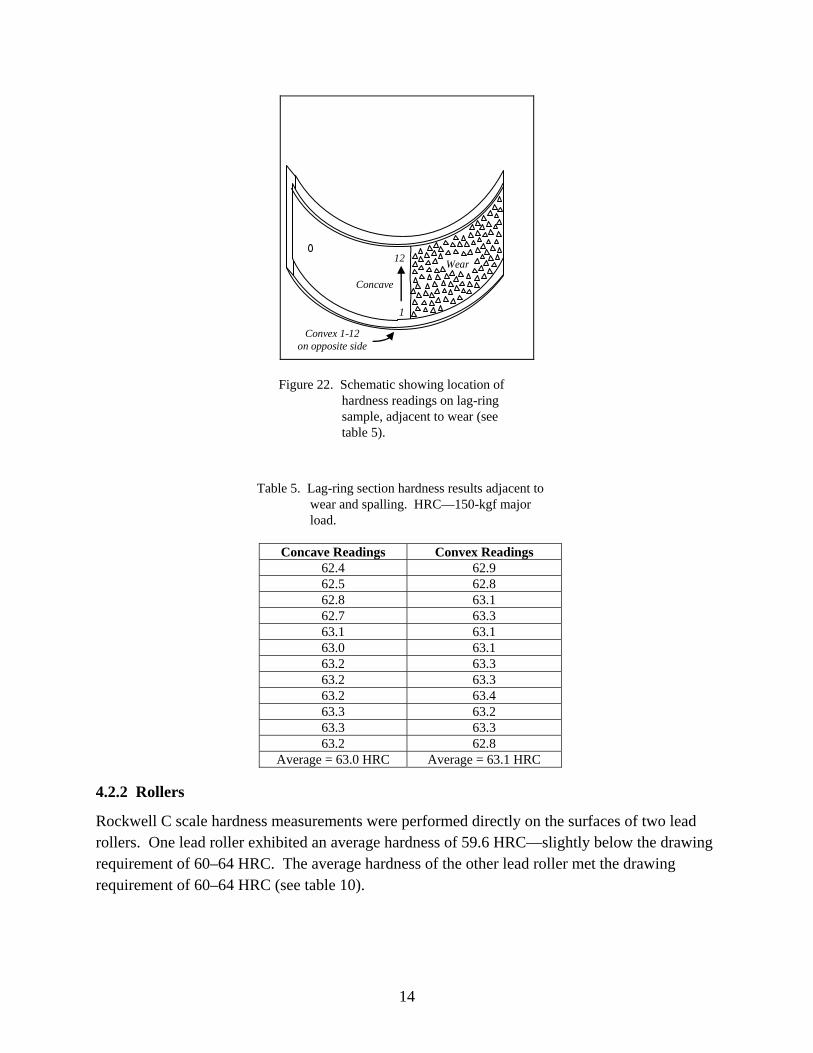
Figure 22. Schematic showing location of hardness readings on lag-ring sample, adjacent to wear (see table 5). ...................................................................................................................14
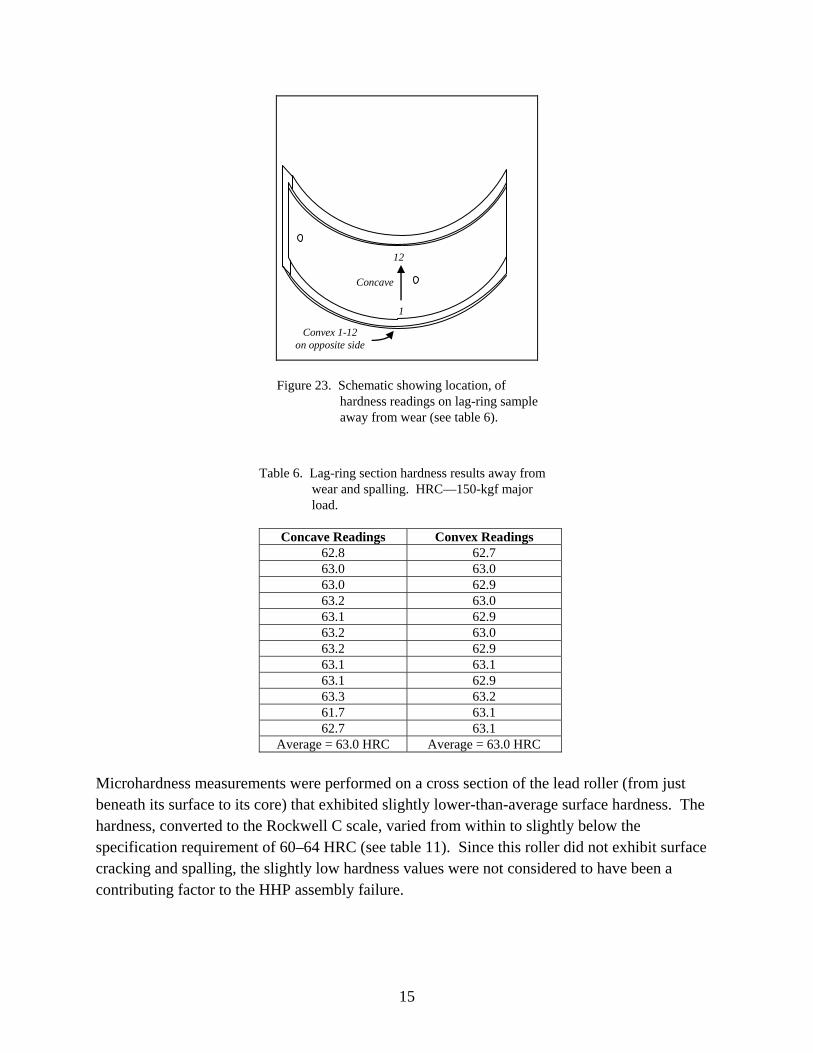
Figure 23. Schematic showing location, of hardness readings on lag-ring sample away from wear (see table 6). ....................................................................................................................15
Figure 24. One of the fracture origins on the surface of the lag ring (identified via light-optical microscopy and labeled with the nomenclature A in figure 13). .................................20
Figure 25. Detail view of the origin shown in figure 24 showing that the topography of the origin is smeared. .....................................................................................................................21
Figure 26. The fracture morphology of the lag ring was transgranular—typical of a fatigue-fracture mode. ..........................................................................................................................21
Figure 27. Surface spalling (fatigue pit) exhibited by a lag roller—typical of the spalling observed on the other lag rollers..............................................................................................22
Figure 28. Detail of the spall depicted in figure 27 showing the beach marks typical of RCF-induced spalling. ......................................................................................................................22
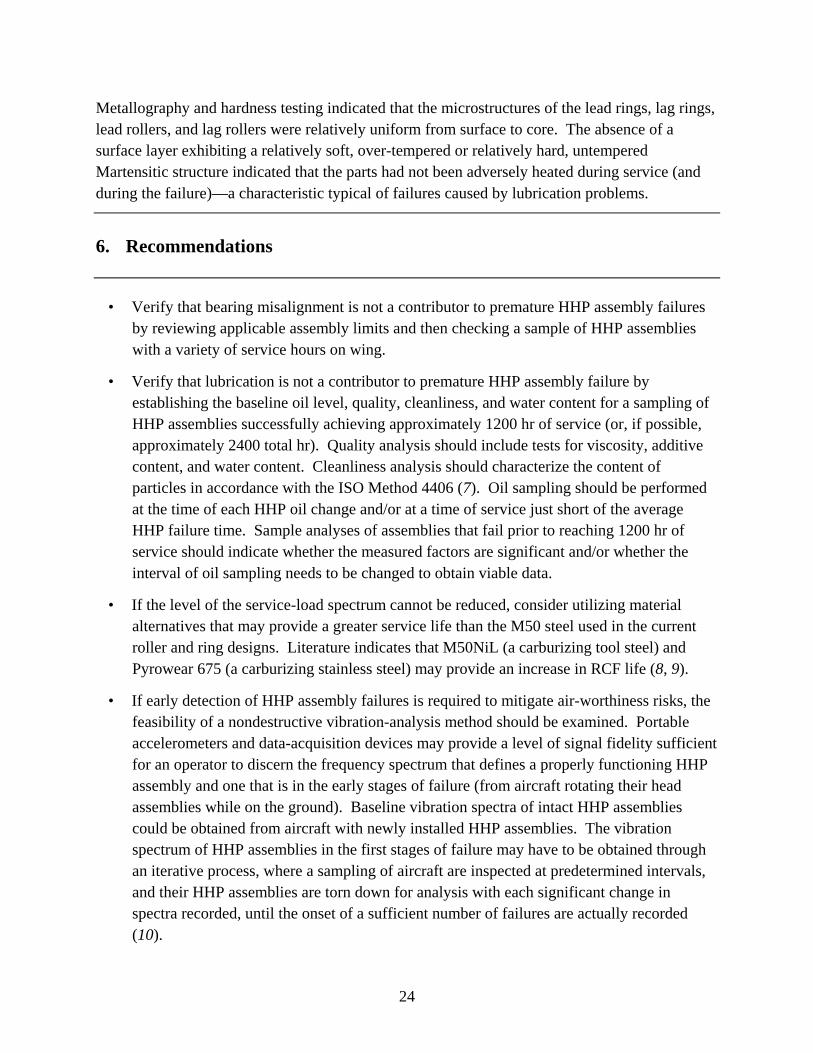
Figure 29. Detail of figure 28 showing the transgranular fracture morphology of the spalled surface typical of RCF-induced spalling..................................................................................23
v
List of Tables
Table 1. Component identification. ................................................................................................1 Table 2. Chemical composition (weight-percent)...........................................................................7 Table 3. Lead-ring section hardness results adjacent to wear and spalling. HRC—150-kgf
major load. ...............................................................................................................................12 Table 4. Lead-ring section hardness results away from wear and spalling. HRC—150-kgf
major load. ...............................................................................................................................13 Table 5. Lag-ring section hardness results adjacent to wear and spalling. HRC—150-kgf
major load. ...............................................................................................................................14 Table 6. Lag-ring section hardness results away from wear and spalling. HRC—150-kgf
major load. ...............................................................................................................................15 Table 7. Microhardness of a lead-ring section from the raceway surface to the core—Knoop
scale, 500-gmf load, 50× objective. .........................................................................................16 Table 8. Microhardness of a longitudinal section of the lag-ring from the raceway surface to
the core—Knoop scale, 500-gmf load, 50× objective. ............................................................17 Table 9. Nanohardness testing results, lead-ring section..............................................................17 Table 10. Surface-hardness values of two lead rollers. HRC scale—150-kgf load.....................18 Table 11. Cross-section hardness traverse of the lead roller (no. 1) that exhibited the lower-
than-average surface hardness—Knoop scale, 500-gmf load, 50× objective..........................18 Table 12. Surface hardness of two lag rollers. HRC scale—150-kgf load. .................................19 Table 13. Microhardness testing results, lag-ring roller no. 1—Knoop scale, 500-gmf load,
50× objective............................................................................................................................19
vi

Acknowledgments
Thanks are extended to the following U.S. Army Research Laboratory personnel for their assistance during this investigation: Scott Grendahl, Dr. Andrew Davis, Benjamin Hardisky, Chris Norfolk, and Tom Juliano. The authors are also grateful for the manuscript review performed by Randy McFarland, U.S. Army Materiel Command.
vii

INTENTIONALLY LEFT BLANK.
viii

1. Summary
A CH-47D horizontal hinge pin (HHP) assembly was examined to determine the root cause of ring and roller fracture and spalling. Chemical analyses, metallography, and hardness testing indicated that the rings and rollers conformed to the material requirements of the governing drawing. Metallography and visual and scanning electron microscopy indicated the failure likely initiated in the lag ring due to rolling contact fatigue (RCF) because of high-service loads.
2. Background
The HHP assembly failure was found during an inspection of a main rotor head assembly that had been removed from CH-47 S/N 81-23387 because of an oil leak. The HHP assembly had accumulated 637 hr of flight time when the failure was found and recorded as Category I quality deficiency report no. 019449-04240-001, U.S. Army Materiel Command control no. M24H90314.
The failed CH-47D HHP assembly was sent to the U.S. Army Research Laboratory from the U.S. Army Aviation and Missile Research, Development, and Engineering Center for failure analysis by the CH-47 Cargo Division, Aviation Engineering Directorate. Table 1 lists the part and serial number information marked on the lead-roller and lag-roller bearing sets—information which indicated each set had been manufactured by RBC Bearings in West Trenton, NJ.
Table 1. Component identification.
Nomenclature Drawing No. Part No. Serial No. Lag-roller bearing, HHP 114R2197 — 77272
Lead ring 114RS225 TJ-75222-9D — Lag ring 114RS226 TJ-75223-9D —
In service, only half of an HHP assembly is subjected to significant loading. After 1200 hr of service, each HHP is removed, rotated 180°, and reinstalled for an additional 1200 hr of service before it is retired. With only 637 hr of service, the subject HHP assembly did not reach the 1200 hr point when the pin would have been removed, rotated, and reinstalled.
3. Visual Examination
The lead-roller and the lag-roller bearing sets were each comprised of 58 rollers, one cage, and one ring (the lead set is shown in figure 1).
1
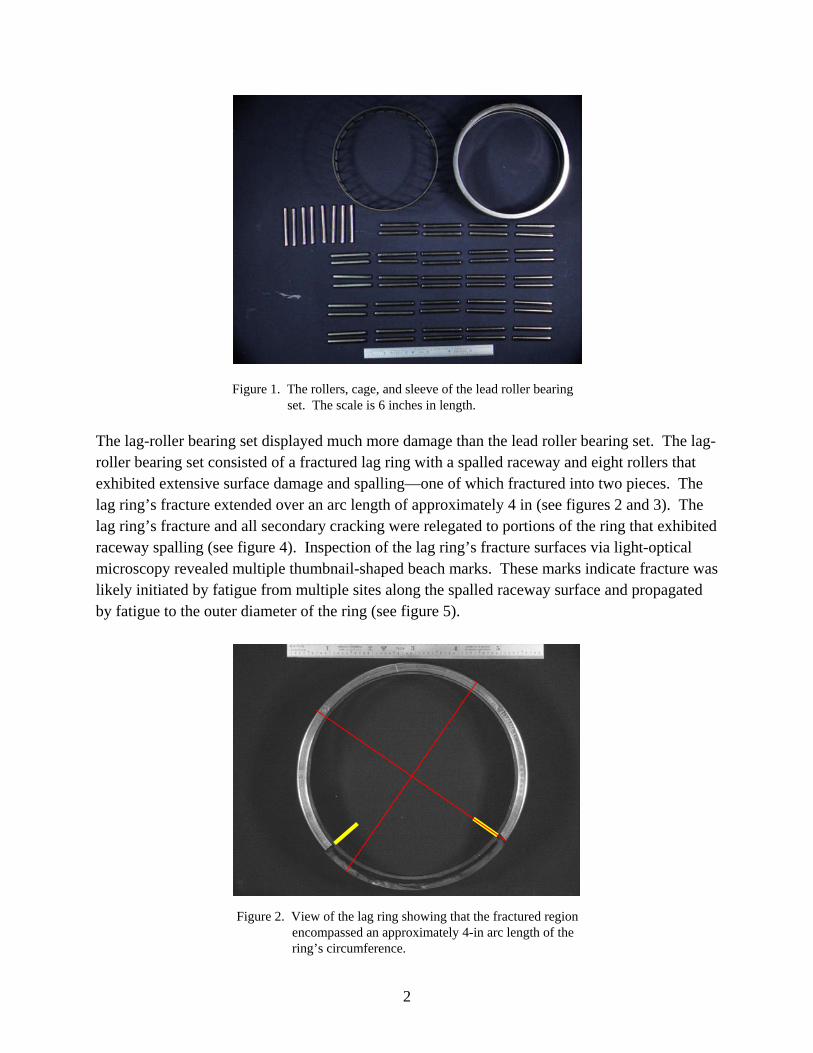
Figure 1. The rollers, cage, and sleeve of the lead roller bearing set. The scale is 6 inches in length.
The lag-roller bearing set displayed much more damage than the lead roller bearing set. The lag-roller bearing set consisted of a fractured lag ring with a spalled raceway and eight rollers that exhibited extensive surface damage and spalling—one of which fractured into two pieces. The lag ring’s fracture extended over an arc length of approximately 4 in (see figures 2 and 3). The lag ring’s fracture and all secondary cracking were relegated to portions of the ring that exhibited raceway spalling (see figure 4). Inspection of the lag ring’s fracture surfaces via light-optical microscopy revealed multiple thumbnail-shaped beach marks. These marks indicate fracture was likely initiated by fatigue from multiple sites along the spalled raceway surface and propagated by fatigue to the outer diameter of the ring (see figure 5).
Figure 2. View of the lag ring showing that the fractured region
encompassed an approximately 4-in arc length of the ring’s circumference.
2
Figure 3. Three pieces of material that fractured from the lag ring depicted in figure 2.
Figure 4. The lag-ring raceway exhibited a spalled surface topography. Fracture and cracking were relegated to the portion of the lag ring exhibiting a spalled raceway surface.
Figure 5. Lag-ring fracture exhibiting beach marks (parallel with yellow lines), river patterns (parallel to black arrows), and multiple origins (white arrows). Scale demarcations at image bottom denote 1/64-in spacing.
3

Eight of the lag rollers exhibited surface damage and spalling (figure 6). Many of the spalled regions within the rollers exhibited river patterns and concentric beach marks, which indicate that spalling had initiated and propagated due to fatigue from a subsurface origin—a typical failure mode of RCF. One of the eight damaged lag rollers fractured into two pieces (figure 7).
The lag-ring bearing cage exhibited wear damage likely due to high-contact loads with the flat ends (or sides) of the mating rollers (see figure 8).
Figure 6. Typical surface damage and spalling exhibited on the lag rollers. The topography of the surface created by spalling exhibited the beach marks (parallel with the blue lines) and river patterns (parallel with the black arrows) indicative of subsurface crack initiation and propagation by RCF. Magnified ~5.7×.
Figure 7. One of the eight damaged rollers was broken in the two pieces shown. Scale demarcations at image bottom denote 1/64-in spacing.
The only damage exhibited by the lead-roller bearing set was the spalled raceway surface of the ring (see figures 9 and 10). The surfaces of the mating lead rollers and the cage did not exhibit surface damage.
4
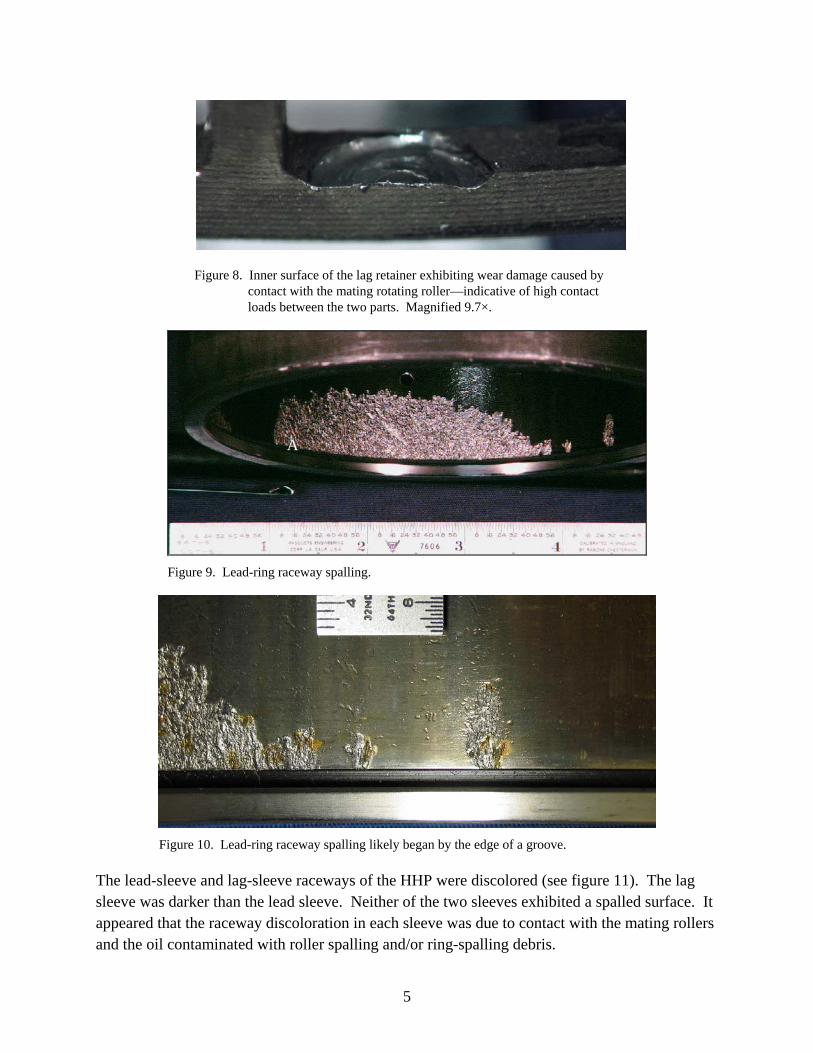
Figure 8. Inner surface of the lag retainer exhibiting wear damage caused by contact with the mating rotating roller—indicative of high contact loads between the two parts. Magnified 9.7×.
A
Figure 9. Lead-ring raceway spalling.
Figure 10. Lead-ring raceway spalling likely began by the edge of a groove.
The lead-sleeve and lag-sleeve raceways of the HHP were discolored (see figure 11). The lag sleeve was darker than the lead sleeve. Neither of the two sleeves exhibited a spalled surface. It appeared that the raceway discoloration in each sleeve was due to contact with the mating rollers and the oil contaminated with roller spalling and/or ring-spalling debris.
5

Lag sleeve surface discoloration
Lead sleeve surface wear and damage Fretting product
Wear induced by mating seals.
Figure 11. The HHP in the as-received condition exhibited discolored lead-sleeve and lag-sleeve raceways. The chrome-plated surface of the HHP between the sleeves exhibited wear induced by mating seals and fretting product created by the relative motion between the HHP and a mating pitch-shaft sleeve.
Between the lead sleeves and the lag sleeves, the HHP exhibited circumferential lines of wear, likely created by contact with the mating rollers and the oil contaminated with roller-spalling debris and/or ring-spalling debris. These lines were induced by mating seals and the fretting product created by the relative motion between the HHP and a mating, 15-5PH SS, pitch-shaft sleeve (see figure 11). The level of fretting was greatest in the areas immediately adjacent to the seals. A similar pattern of fretting products was found on the opposite side of the pin.
4. Chemical Analysis
The chemical contents of a lead roller and a lag roller, along with a section from each mating ring, were shown to have met the requirements of AMS 6491 (1)—the specification for VIM-VAR M50 required by each roller-bearing set drawing (see table 2). Although the phosphorus content for each part was at or near the maximum level allowed by AMS 6491, literature on M50 steel and a conversation with a bearing expert (2) indicated these levels were not atypical for the alloy in bearing applications. Also, a conversation with RBC revealed that the company considered steel that met the chemistry requirements of the governing drawings to be suitable for service. The chemical content of each part listed in table 2, except for carbon and sulfur, was determined via direct-current plasma emission spectroscopy. The carbon and sulfur content of each part listed in table 2 was measured by combustion/infrared detection.
6

Table 2. Chemical composition (weight-percent).
Element Lead Ring Lag Ring Lead-Ring
Roller Lag-Ring
Roller AMS 6491 Carbon 0.81 0.83 0.83 0.83 0.80–0.85
Manganese 0.22 0.21 0.23 0.19 0.15–0.35 Silicon 0.19 0.20 0.18 0.18 0.25 max.
Phosphorus 0.013 0.015 0.015 0.014 0.015 max. Sulfur 0.002 0.004 0.003 0.003 0.008 max.
Chromium 4.13 4.13 4.06 4.13 4.00–4.25 Molybdenum 4.29 4.25 4.30 4.25 4.00–4.50
Vanadium 1.06 1.04 1.07 1.02 0.90–1.10 Nickel 0.058 0.10 0.055 0.099 0.15 max. Cobalt 0.013 0.016 0.013 0.020 0.25 max.
Tungsten 0.010 0.015 0.027 0.028 0.25 max. Copper 0.060 0.062 0.057 0.077 0.10 max.
4.1 Metallography
Sections of rollers and rings from the lead-ring and lag-ring assemblies were mounted in phenolic resin and metallographically prepared using silicon carbide papers ranging in grit size from 240 to 2400. Final polishing was accomplished with a 0.05-μm alumina suspension.
Because the level of spalling had progressed too far in the region subjected to contact with the mating rollers, regions of the lag-ring raceway exhibiting the onset of spalling could not be found and examined metallographically. A metallographic specimen cut from the spalled region and examined in the as-polished condition exhibited the carbide inclusions typical of this alloy, but not any microstructural defects that may have contributed to the raceway spalling (see figure 12).
Figure 12. Micrograph of an as-polished section cut from the spalled portion of
the lag-ring raceway. No microstructural anomalies were observed. Magnified 200×.
A metallographic cross section was produced from a portion of the lead ring exhibiting the onset of spalling (see figures 13 and 14). This metallographic cross section exhibited subsurface cracks—some of which didn’t open to the raceway surface and some of which did. Figure 15 shows a subsurface crack parallel with the raceway surface that appeared to be a subsurface crack that initiated RCF. Figure 16 shows a subsurface crack that opened to the raceway surface at a 45° angle—an angle associated with the shear-lip formation that occurs typically during
7

Figure 13. Spalling and cracking on the raceway of the lead ring. Dashed line
represents section made for metallographic examination.
Figure 14. Detail of lead-ring raceway cracking depicted
within red box in figure 13—likely the onset of spalling.
the final stage of an overload fracture. Etching the subsurface crack (figure 15) with Vilella’s reagent (5 mL of hydrochloric acid, 1g of picric acid, and 100 ml of ethanol) revealed the presence of local microstructural alterations (see figure 17). Microstructural alterations are the localized plastic deformations created by the subsurface cyclic stresses of RCF. These features create planes of weakness on which cracks can propagate (3).
All of the roller metallographic samples and the ring metallographic samples etched with Vilella’s reagent revealed a microstructure typical of M50 in the hardened condition—equiaxed and acicular carbides dispersed in a matrix of tempered martensite (figure 18). The
8

Figure 15. Metallography of the lead-ring region depicted in figure 14 revealed a subsurface crack running parallel with the lead ring’s raceway surface.
Figure 16. Metallography of the spalled and cracked area to the left of the area depicted in figure 13 revealed cracking parallel with the raceway surface and 45o to the raceway surface.
9

Figure 17. Etching the microstructure of the subsurface crack depicted in figure 15 revealed the presence of microstructural alterations—a feature associated with RCF. Etchant: Vilella’s reagent.
Figure 18. Microstructure of the lead ring exhibiting the carbides (both acicular and globular) dispersed in a matrix of tempered martensite observed in all the metallographic cross sections produced from the M50 steel rings and rollers. Etchant: Vilella’s reagent.
metallographic specimens did not exhibit the overtempered and/or untempered Martensitic surface microstructures that are typically created by excessive service temperatures when bearing failure is caused by a lubrication problem.
10
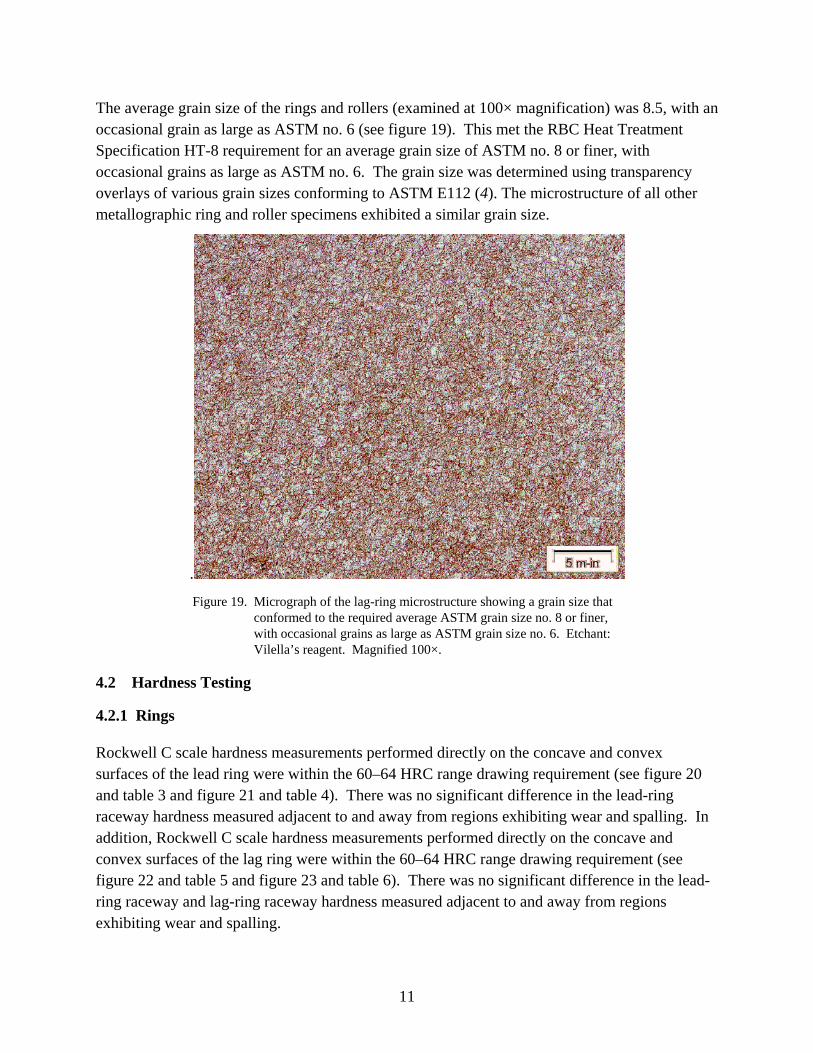
The average grain size of the rings and rollers (examined at 100× magnification) was 8.5, with an occasional grain as large as ASTM no. 6 (see figure 19). This met the RBC Heat Treatment Specification HT-8 requirement for an average grain size of ASTM no. 8 or finer, with occasional grains as large as ASTM no. 6. The grain size was determined using transparency overlays of various grain sizes conforming to ASTM E112 (4). The microstructure of all other metallographic ring and roller specimens exhibited a similar grain size.
.
Figure 19. Micrograph of the lag-ring microstructure showing a grain size that conformed to the required average ASTM grain size no. 8 or finer, with occasional grains as large as ASTM grain size no. 6. Etchant: Vilella’s reagent. Magnified 100×.
4.2 Hardness Testing
4.2.1 Rings
Rockwell C scale hardness measurements performed directly on the concave and convex surfaces of the lead ring were within the 60–64 HRC range drawing requirement (see figure 20 and table 3 and figure 21 and table 4). There was no significant difference in the lead-ring raceway hardness measured adjacent to and away from regions exhibiting wear and spalling. In addition, Rockwell C scale hardness measurements performed directly on the concave and convex surfaces of the lag ring were within the 60–64 HRC range drawing requirement (see figure 22 and table 5 and figure 23 and table 6). There was no significant difference in the lead-ring raceway and lag-ring raceway hardness measured adjacent to and away from regions exhibiting wear and spalling.
11

Concave
1
12
Convex 1-12 on opposite side
Wear
Figure 20. Schematic showing location of
hardness readings on lead-ring sample, adjacent to wear (see table 3).
Table 3. Lead-ring section hardness results adjacent to wear and spalling. HRC—150-kgf major load.
Concave Readings Convex Readings 62.3 62.2 62.5 62.4 63.8 62.6 62.5 62.8 62.5 62.8 62.7 62.7 62.9 62.3 62.9 62.9 62.4 62.4 62.6 62.5 62.5 62.5 62.4 62.5
Average = 62.7 HRC Average = 62.6 HRC
Knoop microhardness testing performed on a metallographic cross section of the lead ring, traversing from just beneath the ring’s raceway surface to the ring’s core, indicated the raceway surface was lower than the allowable drawing minimum (see table 7). Converted readings of 55.2 and 47.4 HRC were obtained from two separate areas, both approximately 0.001 in beneath the raceway surface. These values were lower than the 60–64 HRC drawing requirement. Knoop microhardness measurements performed on a metallographic cross section of the lag ring (traversing from just beneath the ring’s raceway surface to the ring’s core) and converted to the Rockwell C scale all fell within the 60–64 HRC range drawing requirement (see table 8).
12
Concave
A
12
Convex 1-12 on opposite side
Figure 21. Schematic showing location of
hardness readings on lead-ring sample away from wear (see table 4).
Table 4. Lead-ring section hardness results away from wear and spalling. HRC—150-kgf major load.
Concave Readings Convex Readings 60.7 61.5 61.7 61.8 61.8 61.9 61.7 61.9 61.8 61.7 61.9 62.0 61.9 61.7 61.9 62.0 62.0 62.0 62.2 61.8 61.9 61.9 61.9 61.6
Average = 61.8 HRC Average = 61.8 HRC
To determine if an edge effect was the cause of the low Knoop measurements, nine MTS nanoindenter XP hardness measurements were made adjacent to the lead ring’s raceway surface and compared with nine nanohardness measurements of the ring’s core. Table 9 shows that the average nanohardness values adjacent to the raceway surface and in the ring core were very similar (especially considering the standard deviation of each average). This data indicates that the low Knoop hardness measurements obtained adjacent to the raceway surface were likely inaccurate.
13
Concave
1
12
Convex 1-12 on opposite side
Wear
Figure 22. Schematic showing location of hardness readings on lag-ring sample, adjacent to wear (see table 5).
Table 5. Lag-ring section hardness results adjacent to wear and spalling. HRC—150-kgf major load.
Concave Readings Convex Readings 62.4 62.9 62.5 62.8 62.8 63.1 62.7 63.3 63.1 63.1 63.0 63.1 63.2 63.3 63.2 63.3 63.2 63.4 63.3 63.2 63.3 63.3 63.2 62.8
Average = 63.0 HRC Average = 63.1 HRC
4.2.2 Rollers
Rockwell C scale hardness measurements were performed directly on the surfaces of two lead rollers. One lead roller exhibited an average hardness of 59.6 HRC—slightly below the drawing requirement of 60–64 HRC. The average hardness of the other lead roller met the drawing requirement of 60–64 HRC (see table 10).
14
Concave
1
12
Convex 1-12 on opposite side
Figure 23. Schematic showing location, of hardness readings on lag-ring sample away from wear (see table 6).
Table 6. Lag-ring section hardness results away from wear and spalling. HRC—150-kgf major load.
Concave Readings Convex Readings 62.8 62.7 63.0 63.0 63.0 62.9 63.2 63.0 63.1 62.9 63.2 63.0 63.2 62.9 63.1 63.1 63.1 62.9 63.3 63.2 61.7 63.1 62.7 63.1
Average = 63.0 HRC Average = 63.0 HRC
Microhardness measurements were performed on a cross section of the lead roller (from just beneath its surface to its core) that exhibited slightly lower-than-average surface hardness. The hardness, converted to the Rockwell C scale, varied from within to slightly below the specification requirement of 60–64 HRC (see table 11). Since this roller did not exhibit surface cracking and spalling, the slightly low hardness values were not considered to have been a contributing factor to the HHP assembly failure.
15
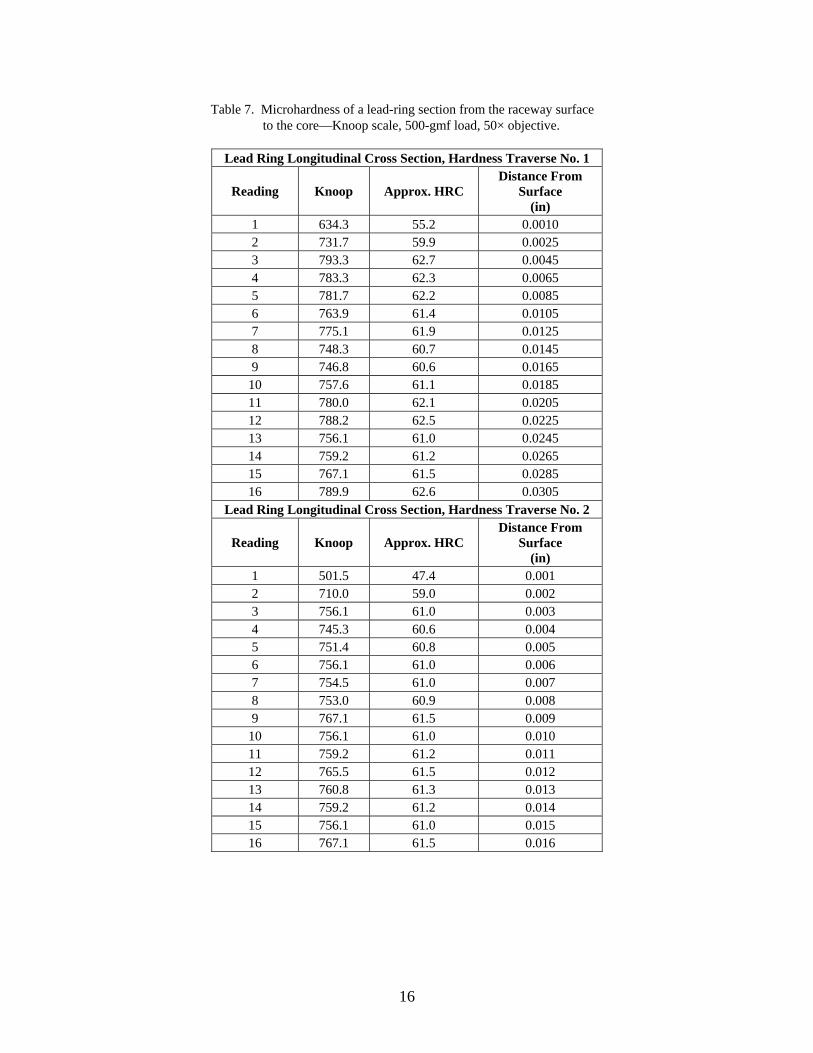
Table 7. Microhardness of a lead-ring section from the raceway surface to the core—Knoop scale, 500-gmf load, 50× objective.
Lead Ring Longitudinal Cross Section, Hardness Traverse No. 1
Reading Knoop Approx. HRC Distance From
Surface (in)
1 634.3 55.2 0.0010 2 731.7 59.9 0.0025 3 793.3 62.7 0.0045 4 783.3 62.3 0.0065 5 781.7 62.2 0.0085 6 763.9 61.4 0.0105 7 775.1 61.9 0.0125 8 748.3 60.7 0.0145 9 746.8 60.6 0.0165
10 757.6 61.1 0.0185 11 780.0 62.1 0.0205 12 788.2 62.5 0.0225 13 756.1 61.0 0.0245 14 759.2 61.2 0.0265 15 767.1 61.5 0.0285 16 789.9 62.6 0.0305
Lead Ring Longitudinal Cross Section, Hardness Traverse No. 2
Reading Knoop Approx. HRC Distance From
Surface (in)
1 501.5 47.4 0.001 2 710.0 59.0 0.002 3 756.1 61.0 0.003 4 745.3 60.6 0.004 5 751.4 60.8 0.005 6 756.1 61.0 0.006 7 754.5 61.0 0.007 8 753.0 60.9 0.008 9 767.1 61.5 0.009
10 756.1 61.0 0.010 11 759.2 61.2 0.011 12 765.5 61.5 0.012 13 760.8 61.3 0.013 14 759.2 61.2 0.014 15 756.1 61.0 0.015 16 767.1 61.5 0.016
16

Table 8. Microhardness of a longitudinal section of the lag-ring from the raceway surface to the core—Knoop scale, 500-gmf load, 50× objective.
Reading Knoop Approx. HRC DistanceFrom
Surface (in)
1 739.2 60.3 0.0015 2 767.1 61.5 0.0025 3 762.4 61.3 0.0045 4 801.7 63.1 0.0065 5 767.1 61.5 0.0085 6 784.9 62.3 0.0105 7 773.5 61.8 0.0125 8 775.1 61.9 0.0145 9 763.9 61.4 0.0165 10 788.2 62.5 0.0185 11 781.7 62.2 0.0205 12 783.3 62.3 0.0225 13 784.9 62.3 0.0245 14 786.6 62.4 0.0265 15 788.2 62.5 0.0285 16 803.4 63.1 0.0305
Table 9. Nanohardness testing results, lead-ring section.
Results Region Tested Average of Nine Readings
(GPa) Standard Deviation
Surface 11.5 ±1.3 Bulk 11.4 ±0.9
The average Rockwell C scale hardness measured directly on the surface of two lag rollers was, for each lag roller, within the drawing requirement of 60–64 HRC (see table 12).
Microhardness measurements were performed on a cross section of a lag roller, from just beneath its surface to its core. The hardness values, converted to the Rockwell C scale, varied from within to slightly below the specification requirement of 60–64 HRC (see table 13). The two hardness values exhibited within the cross section, 59.1 and 59.9 HRC, were not so far below the drawing’s minimum hardness requirement as to have likely contributed to the premature failure of the HHP assembly.
17
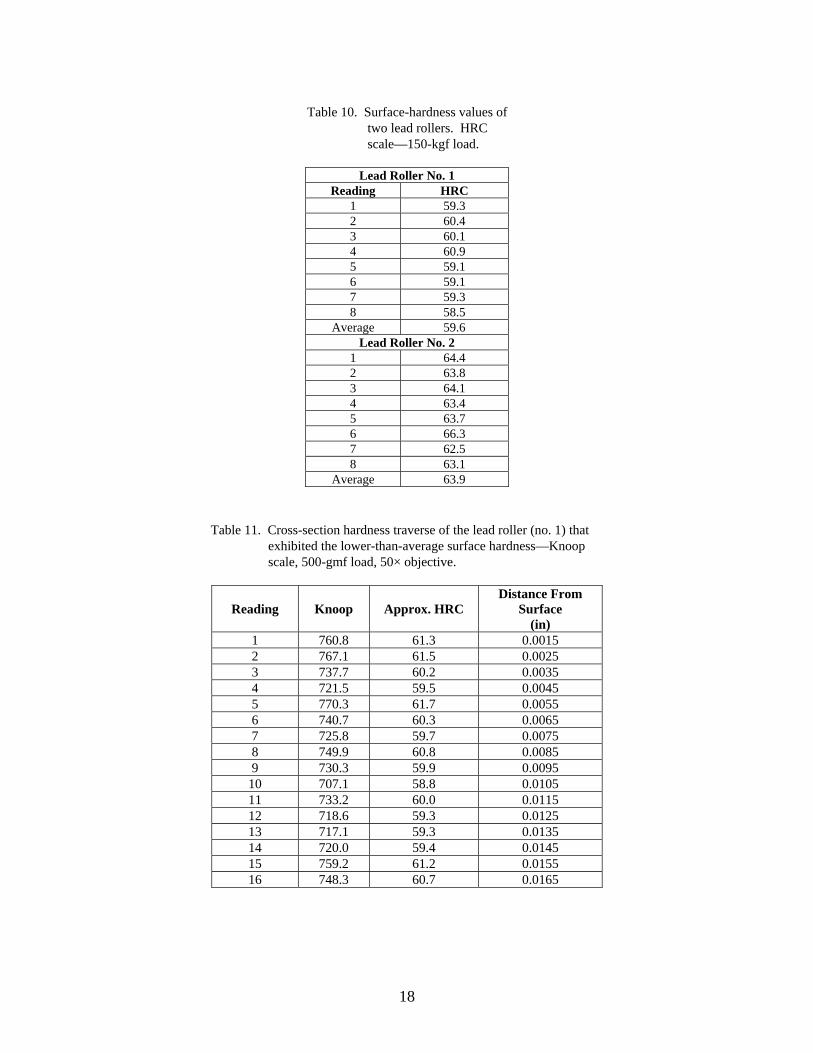
Table 10. Surface-hardness values of two lead rollers. HRC scale—150-kgf load.
Lead Roller No. 1 Reading HRC
1 59.3 2 60.4 3 60.1 4 60.9 5 59.1 6 59.1 7 59.3 8 58.5
Average 59.6 Lead Roller No. 2
1 64.4 2 63.8 3 64.1 4 63.4 5 63.7 6 66.3 7 62.5 8 63.1
Average 63.9
Table 11. Cross-section hardness traverse of the lead roller (no. 1) that exhibited the lower-than-average surface hardness—Knoop scale, 500-gmf load, 50× objective.
Reading Knoop Approx. HRC Distance From
Surface (in)
1 760.8 61.3 0.0015 2 767.1 61.5 0.0025 3 737.7 60.2 0.0035 4 721.5 59.5 0.0045 5 770.3 61.7 0.0055 6 740.7 60.3 0.0065 7 725.8 59.7 0.0075 8 749.9 60.8 0.0085 9 730.3 59.9 0.0095
10 707.1 58.8 0.0105 11 733.2 60.0 0.0115 12 718.6 59.3 0.0125 13 717.1 59.3 0.0135 14 720.0 59.4 0.0145 15 759.2 61.2 0.0155 16 748.3 60.7 0.0165
18
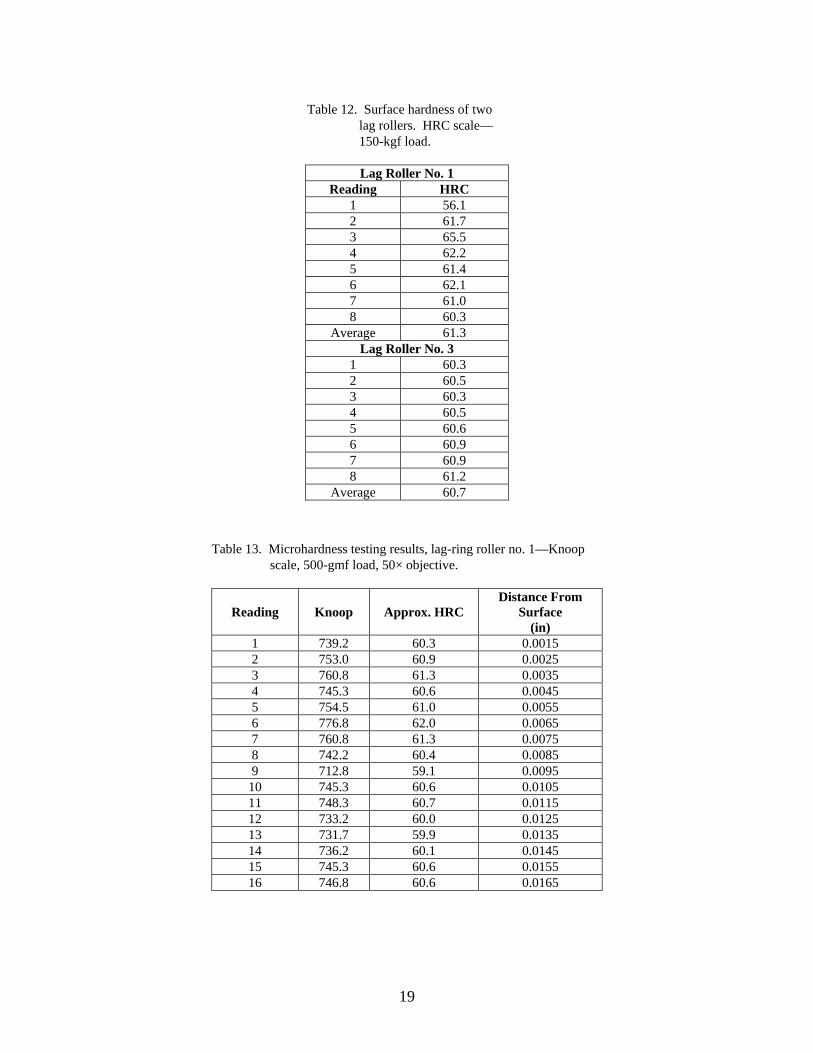
Table 12. Surface hardness of two lag rollers. HRC scale—150-kgf load.
Lag Roller No. 1 Reading HRC
1 56.1 2 61.7 3 65.5 4 62.2 5 61.4 6 62.1 7 61.0 8 60.3
Average 61.3 Lag Roller No. 3
1 60.3 2 60.5 3 60.3 4 60.5 5 60.6 6 60.9 7 60.9 8 61.2
Average 60.7
Table 13. Microhardness testing results, lag-ring roller no. 1—Knoop scale, 500-gmf load, 50× objective.
Reading Knoop Approx. HRC Distance From
Surface (in)
1 739.2 60.3 0.0015 2 753.0 60.9 0.0025 3 760.8 61.3 0.0035 4 745.3 60.6 0.0045 5 754.5 61.0 0.0055 6 776.8 62.0 0.0065 7 760.8 61.3 0.0075 8 742.2 60.4 0.0085 9 712.8 59.1 0.0095
10 745.3 60.6 0.0105 11 748.3 60.7 0.0115 12 733.2 60.0 0.0125 13 731.7 59.9 0.0135 14 736.2 60.1 0.0145 15 745.3 60.6 0.0155 16 746.8 60.6 0.0165
19

4.3 Scanning Electron Microscopy
Scanning electron microscopy (SEM) revealed that a lag-ring fracture origin identified by light-optical microscopy (see the origin adjacent to the white arrow with the letter A in figure 5) exhibited a smeared surface topography (see figures 24 and 25). It was not clear if the surface topography of the crack origin was smeared due to the repeated closure and rubbing of the initiating crack or to post-fracture handling. However, there was no indication that the fatigue crack initiated anywhere except the spalled raceway. Areas of the fracture face that were not smeared were predominantly transgranular—the expected fracture morphology for fatigue failures of this alloy (see figure 26).
The spalling exhibited by several of the lag rollers was also examined via SEM (see figure 27). The fracture topography of the spalled surfaces exhibited beach marks and a transgranular surface morphology (see figures 28 and 29)—characteristics of an RCF mode of failure.
Fracture surface
Origin
Spalled raceway
Figure 24. One of the fracture origins on the surface of the lag ring (identified via light-optical
microscopy and labeled with the nomenclature A in figure 13).
5. Discussion
The failed HHP assembly was discovered on wing after approximately 637 flight hours. It is not known when the failure initiated. Laboratory inspection of the HHP assembly revealed a greater level of damage (a combination of cracks, fractures, and spalling) in the lag ring and lag rollers
20
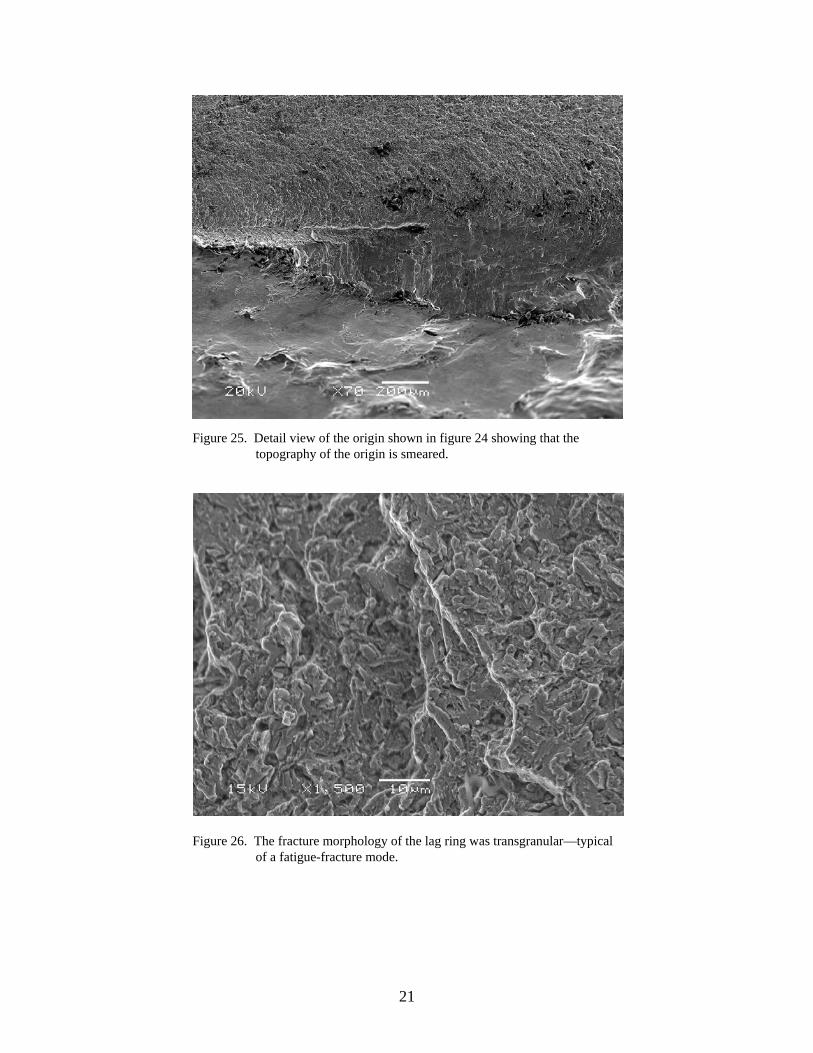
Figure 25. Detail view of the origin shown in figure 24 showing that the topography of the origin is smeared.
Figure 26. The fracture morphology of the lag ring was transgranular—typical of a fatigue-fracture mode.
21

Figure 27. Surface spalling (fatigue pit) exhibited by a lag roller—typical of the spalling observed on the other lag rollers.
Figure 28. Detail of the spall depicted in figure 27 showing the beach marks typical of RCF-induced spalling.
22
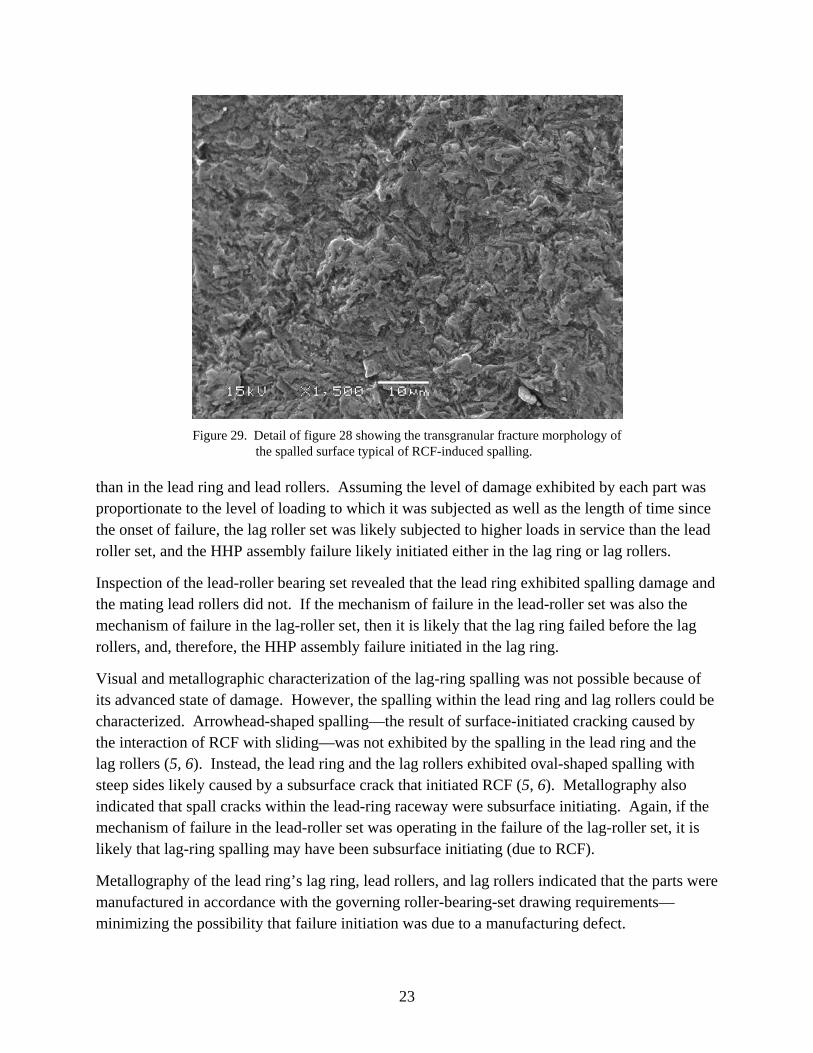
Figure 29. Detail of figure 28 showing the transgranular fracture morphology of
the spalled surface typical of RCF-induced spalling.
than in the lead ring and lead rollers. Assuming the level of damage exhibited by each part was proportionate to the level of loading to which it was subjected as well as the length of time since the onset of failure, the lag roller set was likely subjected to higher loads in service than the lead roller set, and the HHP assembly failure likely initiated either in the lag ring or lag rollers.
Inspection of the lead-roller bearing set revealed that the lead ring exhibited spalling damage and the mating lead rollers did not. If the mechanism of failure in the lead-roller set was also the mechanism of failure in the lag-roller set, then it is likely that the lag ring failed before the lag rollers, and, therefore, the HHP assembly failure initiated in the lag ring.
Visual and metallographic characterization of the lag-ring spalling was not possible because of its advanced state of damage. However, the spalling within the lead ring and lag rollers could be characterized. Arrowhead-shaped spalling—the result of surface-initiated cracking caused by the interaction of RCF with sliding—was not exhibited by the spalling in the lead ring and the lag rollers (5, 6). Instead, the lead ring and the lag rollers exhibited oval-shaped spalling with steep sides likely caused by a subsurface crack that initiated RCF (5, 6). Metallography also indicated that spall cracks within the lead-ring raceway were subsurface initiating. Again, if the mechanism of failure in the lead-roller set was operating in the failure of the lag-roller set, it is likely that lag-ring spalling may have been subsurface initiating (due to RCF).
Metallography of the lead ring’s lag ring, lead rollers, and lag rollers indicated that the parts were manufactured in accordance with the governing roller-bearing-set drawing requirements— minimizing the possibility that failure initiation was due to a manufacturing defect.
23
Metallography and hardness testing indicated that the microstructures of the lead rings, lag rings, lead rollers, and lag rollers were relatively uniform from surface to core. The absence of a surface layer exhibiting a relatively soft, over-tempered or relatively hard, untempered Martensitic structure indicated that the parts had not been adversely heated during service (and during the failure)—a characteristic typical of failures caused by lubrication problems.
6. Recommendations
• Verify that bearing misalignment is not a contributor to premature HHP assembly failures by reviewing applicable assembly limits and then checking a sample of HHP assemblies with a variety of service hours on wing.
• Verify that lubrication is not a contributor to premature HHP assembly failure by establishing the baseline oil level, quality, cleanliness, and water content for a sampling of HHP assemblies successfully achieving approximately 1200 hr of service (or, if possible, approximately 2400 total hr). Quality analysis should include tests for viscosity, additive content, and water content. Cleanliness analysis should characterize the content of particles in accordance with the ISO Method 4406 (7). Oil sampling should be performed at the time of each HHP oil change and/or at a time of service just short of the average HHP failure time. Sample analyses of assemblies that fail prior to reaching 1200 hr of service should indicate whether the measured factors are significant and/or whether the interval of oil sampling needs to be changed to obtain viable data.
• If the level of the service-load spectrum cannot be reduced, consider utilizing material alternatives that may provide a greater service life than the M50 steel used in the current roller and ring designs. Literature indicates that M50NiL (a carburizing tool steel) and Pyrowear 675 (a carburizing stainless steel) may provide an increase in RCF life (8, 9).
• If early detection of HHP assembly failures is required to mitigate air-worthiness risks, the feasibility of a nondestructive vibration-analysis method should be examined. Portable accelerometers and data-acquisition devices may provide a level of signal fidelity sufficient for an operator to discern the frequency spectrum that defines a properly functioning HHP assembly and one that is in the early stages of failure (from aircraft rotating their head assemblies while on the ground). Baseline vibration spectra of intact HHP assemblies could be obtained from aircraft with newly installed HHP assemblies. The vibration spectrum of HHP assemblies in the first stages of failure may have to be obtained through an iterative process, where a sampling of aircraft are inspected at predetermined intervals, and their HHP assemblies are torn down for analysis with each significant change in spectra recorded, until the onset of a sufficient number of failures are actually recorded (10).
24
7. Conclusions
• High-service loads likely caused the premature failure of the subject HHP assembly, starting in the lag ring by RCF-induced spalling.
• The damage caused by the RCF-initiated spalling, combined with the service loads, led to the subsequent fracture of the lag ring and one of the lag rollers.
• It could not be determined at what number of service hours spalling and fracture initiated in the lag ring and one of the lag rollers.
• The lead roller set and lag roller set did not exhibit the heat-related microstructural damage typically generated in failures caused by lubrication problems.
• Metallography and chemical analyses revealed the lead-roller set and lag-roller set were free from manufacturing anomalies known to contribute to RCF failures.
25

8. References
1. AMS 6491. Steel Bars, Forgings, and Tubing 4.1cr 4.2mo 1.0V (0.80–0.85c) Premium Aircraft – Quality for Bearing Applications, Double Vacuum Melted. 2005.
2. Huang, P. U.S. Army Research Laboratory, Aberdeen Proving Ground, MD. Electronic correspondence, 14 April 2006.
3. Failure Analysis and Prevention. ASM Handbook; Vol. 11. ASM International: Metals Park, OH, 1986; pp 504–505.
4. ASTM E112. Standard Test Methods for Determining Average Grain Size. Annu. Book ASTM Stand. 2004.
5. Metal Suppliers Online. http://www.suppliersonline.com/propertypages/M50.asp (accessed 9 May 2006).
6. Wulpi, D. J. Understanding How Components Fail. American Society for Metals 1985, 188.
7. ISO Method 4406. Hydraulic Fluid Power – Fluids-Method for Coding the Level of Contamination by Solid Particles, International Organization for Standardization, 1999.
8. Wells, M. G. H.; Beck, J. C.; Middleton, R. M.; Huang, P. J.; Wert, D. E. Rolling Contact Fatigue Behaviour of Pyrowear 675. Surface Engineering 1999, 15 (4), 321–323.
9. Averbach, B. L.; Van Pelt, S. G.; Pearson, P. K.; Bamberger, E. N. Surface-Initiated Spalling Fatigue in M-50 and M-50Nil Bearings. Journal of the Society of Tribologists and Lubrication Engineers 1991, 47, 10, 843.
10. Practicing Oil Analysis. http://www.practicingoilanalysis.com/article_detail.asp?articleid= 603&relatedbookgroup=OilAnalysis (accessed 16 May 2006).
26
NO. OF COPIES ORGANIZATION
27
1 DEFENSE TECHNICAL (PDF INFORMATION CTR ONLY) DTIC OCA 8725 JOHN J KINGMAN RD STE 0944 FORT BELVOIR VA 22060-6218 1 US ARMY RSRCH DEV & ENGRG CMD SYSTEMS OF SYSTEMS INTEGRATION AMSRD SS T 6000 6TH ST STE 100 FORT BELVOIR VA 22060-5608 1 DIRECTOR US ARMY RESEARCH LAB IMNE ALC IMS 2800 POWDER MILL RD ADELPHI MD 20783-1197 3 DIRECTOR US ARMY RESEARCH LAB AMSRD ARL CI OK TL 2800 POWDER MILL RD ADELPHI MD 20783-1197
ABERDEEN PROVING GROUND 1 DIR USARL AMSRD ARL CI OK TP (BLDG 4600)

NO. OF COPIES ORGANIZATION
28
3 USARDECOM AMRDEC AMSRD AMR AE C R MERGEL BLDG 5678 HICKS RD
REDSTONE ARSENAL AL 35898-5000 3 USA RDECOM AMSRD AMR AE F M K BHANSALI BLDG 4488 RM B276 REDSTONE ARSENAL AL 35898-5000 3 USA RDECOM AMSRD AMR AE F M G WECHSLER BLDG 4488 RM B269 REDSTONE ARSENAL AL 35898-5000 1 USA RDECOM AMSRD AMR AE F M R MCFARLAND BLDG 4488 RM B272 REDSTONE ARSENAL AL 35898-5000