faecal characteristics and production of dairy cows in ... · faecal characteristics and production...
TRANSCRIPT

Faecal Characteristics and Production of Dairy Cows in
Early Lactation
Anthony Christian Mgbeahuruike
Master of Science Programme in Veterinary Medicine for International Students
Faculty of Veterinary Medicine and Animal Science Swedish University of Agricultural Sciences
Skara 2007

2
Report / Master of Science Programme in Veterinary Medicine for International Students Faculty of Veterinary Medicine and Animal Science Swedish University of Agricultural Sciences Report no. 62 ISSN 1403-2201

3
Faecal Characteristics and Production of Dairy Cows in Early Lactation
Anthony Christian Mgbeahuruike
Department of Animal Environment and Health Faculty of Veterinary Medicine and Animal Science
Swedish University of Agricultural Sciences Skara 2007

4
The present thesis is a partial fulfilment of the requirements for a
Master of Science Degree in Veterinary Medicine for International
Students at The Swedish University of Agricultural Sciences (SLU),
in the field of Animal Nutrition and Management.
Anthony Christian Mgbeahuruike Department of Animal Environment and Health Faculty of Veterinary Medicine and Animal Science Swedish University of Agricultural Sciences (SLU) P.O. Box 234, SE – 532 23 Skara, Sweden Print: SLU Service/Repro, Uppsala 2007

5
This work is dedicated to God almighty for his special favour and support throughout the
study.

6
7
Table of Contents
Abstract ...........................................................................................9
Introduction ..................................................................................11
Aims of the investigation..............................................................12
Study of literature ........................................................................13
Diet composition and intake by dairy cows...........................13
Physical structure of feeds and chewing activity by ruminants .................................................................................14
Ruminal pΗ, milk production and milk fat percentage.......16
Rumen microbes and nutrient digestion ...............................17
Fermentation patterns and effects of ruminal pΗ on microbial fermentation ..........................................................18
Ruminal acidosis and displaced abomasum..........................19
Factors affecting faecal particle size and consistency ..........21
Particle size, sieving technique and image analysis ..............23
References .....................................................................................25
Paper I
“Faecal characteristics and production of early-lactation dairy cows fed diets differing in forage source” ........................35 Abstract .........................................................................................35
Introduction ..................................................................................37
Materials and methods.................................................................39
Animals and management.......................................................39
Feeds and feeding.....................................................................40
Registrations.............................................................................41
Sample collection .....................................................................46
Chemical analysis ....................................................................46
Wet sieving of faeces................................................................46
Statistical analysis....................................................................47

8
Results............................................................................................49
Feed intake, milk production and faecal characteristics .....49
Relationships among diets, production and faecal Characteristics .........................................................................52
Discussion ......................................................................................57
Conclusions ...................................................................................59
Acknowledgements .......................................................................59
References .....................................................................................61
Brief communication
“Image analysis methodology for particle-size determination of washed faeces from dairy cows in early lactation” ...............65 Abstract .........................................................................................65 Introduction ..................................................................................67
Materials and methods.................................................................68
Results and discussion..................................................................74
Conclusions ...................................................................................84
Acknowledgements .......................................................................84
References .....................................................................................85
Acknowledgements .......................................................................87

9
Abstract
Mgbeahurike . A. C. Faecal characteristics and production of dairy cows in early lactation. Master of Science Thesis. No. 62 ISSN 1403-2201
There is limited information available on the effects of different forages on faecal characteristics in early-lactation dairy cows. In addition, information regarding relationships among dietary variables, production and faecal characteristics is limited. The aim of the present investigation includes 1) determination of the effects of diets, when differing in forage source, on faecal particle size distribution, consistency, pH and nutrient content as well as on production and body condition scores of early-lactation dairy cows; 2) investigation of potential correlations among dietary, production and faecal variables; and 3) understanding the principle involved in the use of image analysis to characterize particles from faeces of early lactating dairy cows. Twenty-six herds in Sweden comprising dairy cows (37.4±17.9 days in milk) of Swedish Red and Swedish Holstein breeds were used in the study. Nine herds used grass-clover silage (GCS) as the sole forage, eight herds used GCS combined with whole crop cereal silage (WCCS), four herds used GCS combined with whole-crop maize silage (MS) and five herds used GCS combined with ensiled pressed beet pulp (EPBP). The chemical composition of forages, nutrient contents of the diets and the formulated intakes were registered. Data were analysed by ANOVA using the GLM procedure of SAS (2001) with herd as the experimental unit. Visit was treated as repeated measure on a herd level. Because no significant treatment by visit interactions were found, data were analyzed as a mean over the two visits. Pearson partial correlation coefficients, with consideration to treatment effects, were estimated among dietary, production and faecal variables on a herd level basis (n=26) using the CORR procedure of SAS. Cows fed GCS alone or GCS combined with EPBP tended to have a higher yield of energy-corrected milk (ECM) than cows fed WCCS (P<0.059). For cows fed EPBP in addition to GCS, the higher ECM yield can be related to their higher formulated DM intake (P<0.033) and their improved feed conversion (P<0.040). Cows fed GCS combined with MS or WCCS had a higher faecal NDF concentration in dry matter than cows fed GCS alone or in combination with EPBP (P<0.034). The higher faecal NDF concentration in cows fed GCS and MS was associated with the improved faecal consistency score value by cows fed this diet (P<0.016). Increased formulated starch intake from concentrate and
10
diet increased the number of long faecal particles (r=0.439* and r=0.390†, respectively). Increased formulated DM intake of forage was associated with decreased faecal DM concentration (r=-0.541**) whereas increasing formulated DM intake of concentrate increased faecal DM concentration (r=0.630**). The strong positive linear correlation between number of grain kernels in the faeces and faecal starch concentration could be used as a tool to predict faecal starch content (r=0.827***). For the particle size determination by image analysis, gamma distribution curves (density plots) and accumulated distribution curves described and characterized the different particle dimensions in faeces into arithmetic mean particle length, arithmetic mean particle width, mode particle length, mode particle width, median particle length, median particle width, geometric mean particle length, geometric mean particle width and a 95-percentile fraction. The median length and width values, as well as the 95% length and width values were estimated using cumulative distribution function CDF in SAS. The 95-percentile fraction shows the maximum length or width for 95% of the faecal particles and describes the capacity of rumen to retain large particles. Image analysis can be used for measuring the characteristics, the length and width dimension values, of washed faecal particles. Keywords: Dairy Cow, Faeces, Particle Size, Forages, Image Analysis

11
Introduction
Forage composition and the level of concentrate supplementation in dairy cow feeding have variable effects on intake, rumen fermentation, milk production and milk quality (Sutton, 1989). Changes in milk constituents have been reported to be due to the effects of diets on rumen fermentation pattern and quantity of glucose absorbed from the small intestine (Thomas and Chamberlain, 1984). Healthy rumen function in dairy cows can be ensured by feeding diets containing adequate amounts of physical structure (Yang and Beauchemin, 2005). Feeding dairy cows with diets rich in highly fermentable carbohydrates and finely chopped silages does not only encourage maximum milk yield, but also reduces fibre digestion and predispose the cows to metabolic diseases, such as subclinical ruminal acidosis, milk fat depression and displaced abomasum (NRC, 2001). Such feeding strategy results in extensive hindgut fermentation and consequently, presence of undigested long fibre particles in the feaces (Hall, 2002a). Fahey and Berger (1988) reported that cows consuming sufficient amounts of NDF but insufficient amounts of long particles have the tendency to have the same metabolic disorders as cows consuming diets deficient in chemical fibre. This led to the concept of physically effective neutral detergent fibre (pеNDF; Mertens, 1997).The pеNDF is the characteristic of forage that stimulates chewing and ruminal mat formation (Mertens, 1997). A healthy rumen environment is maintained if the roughage can stimulate chewing to produce salivary buffers sufficient enough to neutralize the effect of the fermentation acids produced in the rumen (Emery et al., 1960; Bailey and Balch, 1961; Yang et al., 2001a; Krause et al., 2002a; Beauchemin et al., 2003; Kononoff et al., 2003). Acids in the rumen are derived from the fermentation of carbohydrates which accounts for over 65% of the dry matter (DM) of dairy cattle diets (Mertens, 1997). An acidic rumen environment decreases fibre digestion (Mould et al., 1983). This is probably due to the destructive effect of the rumen acids on the fibre degrading micro organisms (Bonhomie, 1990; Yang and Varga, 1993). Particle size reduction is achieved through mastication, chemical and microbial degradation (Sahlin, 2006). Ruminants, which are unable to produce fibre degrading enzyme systems of their own, resort to the vast population of ruminal microbes which range from bacteria to protozoa and anaerobic fungi (Hume and Sakaguchil, 1991).When the rumen microbial population is adversely affected by a low pΗ, rumen residence time is reduced and undigested fibre particles pass quickly to the large intestine and ceacum, resulting in hindgut fermentation (Hall, 2002a). Hindgut fermentation has less nutritional relevance to the dairy cows because only VFA is absorbed whereas microbial proteins are lost in faeces as undigested particles (Hall, 2002a).

12
Different sieving techniques, such as wet and dry sieving, have been used to determine the size of particles in ingested feeds and faeces. Reports by Kennedy (1984) and Ulyatt et al. (1986) have shown that the wet-sieving procedure is the most widely accepted sieving method for particle-size determination. Although the method is widely accepted, it still lacks standardization in its measurement with respect to equipment, sieving time, degree of agitation and mass of particles applied to the sieves. The sieving techniques have given more insight to the concept of critical particle size (CPS). Particles that pass a sieve of a mesh size of 150 µm are fine enough to behave like solutes (Hungate, 1966; Weston and Hogan, 1967; Kennedy, 1984). However, in the rumen, only a few of them flow in the fluid phase, whereas a large number of them are trapped in the filter bed of the reticulorumen digesta mass (Faichney, 1986; Bernard et al., 2000). On the other hand, particles above a certain size are retained in the reticulorumen (Ulyatt et al., 1986). Therefore, this suggests that there is a certain size, CPS, above which large particles have a low probability of passing through the rumen. Poppi et al. (1980) suggested a CPS of 1.18 mm for cattle and sheep whereas Nørgaard and Sechic (2003) suggested a CPS of 5 mm for cattle. Van Soest (1982) stated that the CPS is not constant and increases when hay is ground and when the level of intake increases. This statement was challenged by Faichney (1986) because it was based on a mean particle size of the faeces, which is a measurement that gives no information about the CPS in contrast to the 95 percentile value. In recent times, new techniques that appear to be more reliable and describing have been developed. These include the use of separators with screens (Lammers et al., 1996), image analysis (Luginbuhl et al., 1984, Nørgaard and Bendixen, 2002), and laser diffractions (Olaisen et al., 2001). These new methods give information on both the size and shape of the particles in both ingested feed and faeces (Dijkstra et al., 2005).
Aims of the Investigation • To determine the effects of diets, when differing in forage
source, on faecal particle size distribution, consistency, pH and nutrient content as well as on production and body condition of early-lactation dairy cows.
• To investigate potential correlations among dietary,
production and faecal variables.
• To understand the principle involved in the use of image analysis to characterize particles from faeces of early lactating dairy cows.

13
Study of Literature
Diet Composition and Intake by Dairy Cows Effective utilisation and intake of DM by dairy cows depend on both the chemical composition and physical characteristics of the ration. Carbohydrates, as the major energy source for high-producing lactating dairy cows, account for 60 to 65% of the total DM in dairy rations (Mertens, 1997). The major carbohydrates in forages include cellulose and hemicellulose whereas the concentrates mainly contain starch, sugars and pectin. Recommendations by the National Research Council stated that the diet should contain relatively low amounts of fibre (NRC, 2001). This practice maximizes milk production but at the same time predisposes the lactating cows to metabolic disorders such as subclinical ruminal acidosis, milk fat depression, displaced abomasum and laminitis (NRC, 2001). Studies by others (McCullough, 1973; Mertens, 1985; Weiss and Shockey, 1991) have shown the importance of an optimal F:C ratio on the productivity of dairy cows. According to Mertens (1985), an NDF intake of 1.2 ± 0.1 percentage of live weight with 70 to 80 % of neutral detergent fibre (NDF) supplied from forage is optimal for early-lactating dairy cows. Mertens (1987, 1992) also proposed the use of NDF as a tool for establishing the upper limit for the F:C ratio of the dairy rations. By definition, NDF is the partially or the slowly digested part of the ingesta. It measures the total chemical fibre in the feed. The NDF has been related to intake (Sudweeks et al., 1981; Allen, 1997; Mertens, 1994). Also, studies by others (Oba and Allen, 2000; Tafaj et al., 2004; Tafaj et al.,, 2005) have shown that increasing the amount of digestible fibre of hay or maize silage in dairy rations increases digesta stratification, particle breakdown in the rumen as well as digesta turnover, forage intake and fibre digestibility. Others have shown that increasing the non-fibre carbohydrates (NFC) of dairy rations increases the DM intake by dairy cows (Nocek and Russell, 1988; Batajoo and Shaver, 1994). This could probably be due to the palatable nature of the NFC. Feeding cows with rations severely lacking in fibre or too high in non-structural carbohydrates, such as finely ground maize, has been shown to cause extensive hindgut fermentation resulting in negative effects on cow health and production (Hall, 2002a). Hindgut fermentation, which is a normal digestive process in horses and rabbits, encourages the loss of microbial proteins which is the source of essential amino acids to the ruminants (Varga, 2003). In addition, there is less buffering capacity in the hindgut than in the rumen, resulting in a more acidic environment, causing epithelial damage of the large intestine and long mucins in faeces, which is an indication

14
of hindgut fermentation (Hall, 2002b). This calls for a generally accepted standard to create a balance between forages and concentrates in diets in order to encourage both productivity and health of lactating dairy cows.
Physical Structure of Feeds and Chewing Activity by Ruminants
Chewing activity has been shown to be a response associated with the pеNDF of a feed (Welch and Smith, 1969; Welch and Smith, 1970; Camell and Osbourn, 1972; Mertens, 1997). The pеNDF is defined in relation to the physical characteristics of fibre that influence chewing and the bi-phasic nature of the rumen environment (Mertens, 1997). It is calculated as the physically effectiveness factor × the NDF concentration of the feed. The ef ranges from 0 to1, where long straw that requires much chewing has an ef of 1 and finely ground concentrate, that is not capable of stimulating chewing, has an ef of 0 (Mertens, 1997). The effective NDF (eNDF), on the other hand, is the NDF needed in a diet to maintain the percentage of milk fat produced by the cow (Mertens, 1997). Cattle have been reported to show a rhythm of chewing activity when fed long hay, whereas an evenly distributed chewing activity is exhibited by cows fed chopped hay (Jester and Murphy, 1983). Chewing occurs during 8 to 20 periods per day, which are evenly distributed throughout the day. Each chewing period lasts from five minutes up to two hours (Nørgaard, 2003). Chewing activity per kg of DM is an attribute that varies with the fibre content and particle size of the feed, level of intake and the physical state of the animal (Jaster and Murphy, 1983; Mertens, 1986; Sauvant et al., 1987; Nørgaard, 2003). When there is a high intake of feed, cattle spend less time chewing and ruminating per unit of feed (Welch and Hooper, 1988; Kovacs et al., 1997). Particle size and the NDF content of feed are more reliable indicators of chewing activity than the NDF content of the forage alone (Yang et al., 2001a). Studies have shown that group-fed cows tend to eat more than separately fed cows (Albright and Arave, 1997).This is because, cattle may be stimulated to start eating by imitating the first one that resumes eating after a break (Sahlin, 2006). Increased amounts of fibre in dairy rations stimulate chewing activity and decrease the acid environment in the rumen (Yang et al., 2001a; Krause et al., 2002a; Beauchemin et al., 2003; Plaizer, 2004). Yang and Beauchemin (2006) reported that increased chewing time due to differences in dietary particle size does not always increase ruminal pΗ. The neutralizing effect of the salivary buffers, secreted by dairy cows during chewing, when they are fed diets containing adequate amounts of pеNDF, levels out and neutralizes ruminal pΗ (Bailey and Balch, 1961; Allen, 1997; Maekawa et al., 2002). When too small amounts of pеNDF is fed to dairy cows, there will be a

15
decreased chewing activity, resulting in less salivary buffer secretion, which results in a decreased ruminal pΗ. This results in alteration of the ruminal fermentation patterns with a low ratio of acetate to propionate and, consequently, to modified animal metabolism and reduced milk fat synthesis (Mertens, 1997). The fermentation acids produced have been shown to be the major cause of ruminal acidosis (Owens et al., 1998). To decrease the risks of ruminal acidosis, chewing time should be increased by adjusting the level of particle size and NDF concentration in the diet resulting in an improved ruminal pΗ status (Yang et al., 2001; Krause et al., 2002). However, the amount of pеNDF that provides the most optimal chewing, saliva production and buffering of rumen environment has not been clearly stated (Einarson et al., 2004). This inconsistency probably could be due to the differences in measurements, definition of dietary pеNDF and interactions among levels of concentrate inclusion, forage and grain sources and animal response variables (Zebeli et al., 2006). Santini et al. (1983) proposed that fibre or roughage intake can be adjusted by mean particle length to create a roughage index that more closely corresponds to total chewing time (TCT). The TCT is the sum of the rumination time and the eating time (Nørgaard, 2003). Nørgaard (2005) created a chewing index (CI) for dairy rations to be used in the new Nordic Feed Evaluation system “NorFor”. The CI is the sum of the eating index (EI) and the ruminating index (RI) (Nørgaard, 2005). The National Research Council (2001) has also given a minimum NDF requirement from forage to be 15-19 % of dietary DM intake depending on dietary NDF concentration in order to allow for sufficient pеNDF content in the diet. The time spent chewing and ruminating is a function of animal and dietary factors (Beauchemin, 1991). Body weight has been described as a major determinant of rumination and chewing, as large animals tend to be more efficient in rumination than smaller animals (Bae et al., 1983). The efficiency of rumination is increased until a maximum value is reached after two years of age (Welch and Hooper, 1988). Weston et al. (1989) related rumination to particle size and intake. According to them, the duration of rumination increases with dietary intake and fibre content to a maximum of at least 12 h/day. Rumination times of cows at high intakes of forages of low feeding values can be 10 h/day (Dulphy et al., 1980). Longer particle sizes of feed influences the time spent eating, the time spent ruminating, the number of ruminating periods, the length of ruminating periods and the frequency of double contraction cycles in the reticulorumen (Nørgaard, 1989). Rumination time decreases when animals are fed diets with small amounts of roughage or when the roughage is finely chopped as finely chopped diets might not provide enough stimuli to evoke rumination (Nørgaard, 1989). Normal rumination requires forage particles greater than 5 mm to be retained in the rumen (Nørgaard, 1989). Increased intakes reduce

16
time spent ruminating per gram of feed, which explains the increase in average faecal particle size at higher intakes (Van Soest, 1994). Pseudorumination may occur if the feed particles are longer than 300 mm, such as long hay and silages and this may cause delayed and less efficient rumination activity (Deswysen and Vanbelle, 1978; Leek, 2004). Rumination takes up to 20 to 40% more time than eating (Nørgaard, 2003) and the rate varies in different animals during eating (Dulphy et al., 1980; Weston et al., 1989). During eating, rumination performs the primary function of comminution as well as facilitating the clearance of digested particles from the reticulo-rumen by reducing the particle size and positioning them at the zone of escape (adjacent to the reticulo-omasal orifice; Ulyatt et al., 1986; Waghorn et al., 1986; Ellis et al., 1999).
Ruminal pH, Milk Production and Milk Fat Percentage
Relationships among ruminal pΗ, milk production and milk fat percentage have been studied to a great extent. Beauchemin et al. (2003) and Krause and Comb (2003) recorded an increased milk production but a decreased milk fat percentage when cows were fed forages with low particle size. They also showed a reduction in ruminal pΗ to a relatively low level when ruminally fermentable carbohydrates were fed to lactating dairy cows. The studies suggest that a decrease in ruminal pΗ encourages high milk production but decreases milk fat yield. The decreased milk fat percentage has been reported to be due to the low proportion of acetate to propionate in the rumen (Mertens, 1997; Beauchemin et al., 2003). Mertens (1997) related milk fat percentage to eNDF. According to him, milk fat percentage is the animal’s response that is associated with eNDF. Allen (1997) reported that milk fat percentage of cows in early lactation is less responsive to the diet than cows later in lactation. Therefore he suggested that the ruminal pΗ should be used as a response variable for determining the fibre requirements by dairy cows. Beauchemin et al. (2003) and Nelson and Satter (1990) also reported an increase in milk production due to high DMI when diets containing high proportion of alfalfa silage were fed to lactating dairy cows. This is because of the relatively low content of NDF in alfalfa and its high rate of digestion (Nelson and Satter, 1990; Beauchemin et al. 2003). Maintaining the ruminal pΗ at a normal status is important in dairy production because a decrease in ruminal pΗ decreases appetite (Britton and Stock, 1987), ruminal motility (Ash, 1959), fibre digestion (Mould et al., 1983), microbial yield (Hoover, 1986) and milk fat percentage (Mertens, 1997). The volatile fatty acids (VFA), which are produced during ruminal fermentation, are absorbed across the rumen wall. Butyric acid, during its passage across the rumen wall converts into ß-hydroxybutyric acid (BHBA; McDonald et al., 1988). Acetic and

17
propionic acid on the other hand, pass almost unchanged across the rumen wall into the portal blood and are carried, together with the BHBA, to the liver (McDonald et al., 1988). The utilisation of the produced acetate is strongly insulin dependent (Kaneko, 1980). Both acetic and BHBA pass from the liver by blood circulation to various organs and tissues, where they are used as sources for energy and fatty acids (McDonald et al., 1988). Propionate is converted to glucose in the liver and joins the liver glucose pool. Some part of it may be converted to glycogen, and stored in the muscles or to fatty acids, reduced coenzymes and L-glycerol-3-phosphate and used for triacyl-glycerol synthesis (McDonald et al., 1988). Part of the glucose is circulated by the blood to various body tissues, where it may be used as energy source or as a source of reduced co-enzyme in the synthesis of fatty acids and glycerol.
Rumen Microbes and Nutrient Digestion
The rumen environment has a vast population of microorganisms, which have adapted the ruminant animals to various ecological niches and they are able to convert low quality feeds to high quality proteins (Varga et al., 1997). These rumen microbes attach, degrade and ferment structural carbohydrates in forage cell walls, thereby providing volatile fatty acids and protein to the host animal (Varga et al., 1997). Studies by Cheng et al. (1991) showed that ruminal fibre digestion depend on the following factors; plant structure and composition, which regulate bacterial access to nutrients; nature of the population densities of the predominant fibre digesting micro-organisms; microbial factors that control adhesion and hydrolysis by complexes of hydrolytic enzymes of the adherent microbial population and animal factors that increase the availability of nutrients through mastication, salivation and digesta kinetics. The major ruminal microbes include the cellulolytic bacteria Ruminococcus albus, Ruminococcus flavefaciens and Fibrobacter succinogenes, which account for 0.3-4 % of the bacterial population (Krause et al., 1999; Weimer et al., 1999), fungi, which accounts for 8% of the microbial biomass (Orpin, 1983) and a limited number of protozoal genera, which can digest 5-21% of the cellulosic material dependent on the diet (Dijkstra and Tamminga, 1995). The fibrolytic bacteria tend to degrade the more readily digestible structures, such as the mesophyll cells, but F. succinogenes also digests parenchyma bundle sheats, epidermal cell walls and leaf sclerenchyma (Akin, 1989). Varga et al. (1997) showed that these bacteria have an array of hydrolytic enzymes including cellulase and hemicellulase. The fungi degrade the more recalcitrant cell wall materials, including the sclerenchyma cells and the vascular tissue (Akin, 1989). Fungi have also been shown to have cutinase effects because of their ability to penetrate the cuticle and cell wall of lignified tissues (Kolattukudy,

18
1984). Studies by Gijzen et al. (1988) have shown that 19-28% of the total cellulase activity in fibre digestion can be attributed to protozoa. Akin (1989) however, suggested that digestion by protozoa seems to be limited to very susceptible tissues, such as the mesophyll cells.
Fermentation Patterns and Effects of Ruminal pΗ on Microbial
Fermentation The pattern of fermentation is influenced by the composition of the microbial population which in turn is determined by the basal diet, particularly the type of dietary carbohydrates and by the rate of depolarization of available substrates (review by Dijkstra, 1994). Diets rich in fibre encourage the growth of acetate-producing bacterial species and the acetate:propionate:butyrate molar proportions will typically be 70: 20:10 (Dijkstra et al., 2005). Feeding a starch-rich concentrate diet favours the development of propionate-producing bacteria. However, acetate is in most cases more abundantly produced than other acids (Dijkstra et al., 2005). Studies have shown that a large protozoal population could develop under certain conditions if a concentrate-rich diet is fed to ruminants, which will result in a shift from propionate to butyrate production (Williams and Coleman, 1997). Fermentation patterns can shift from acetic acid to propionic acid if the amount of substrates available for fermentation is high, either as a result of high intake or due to increased rates of depolarization of substrates (Dijkstra, 1994). Studies have shown that ruminal fermentation patterns could be affected by factors, such as physical form of diet, level of intake, frequency of feeding and the use of chemical additives in feed processing (Nagaraja et al., 1997; Ørskov, 1981; Thomas and Rook, 1981). Effects of ruminal pΗ on rumen microbial activity have been demonstrated by various researchers. Hoover (1986) showed that when the ruminal pΗ was less than 6, the structural carbohydrate-fermenting microbes were usually limited. Russell and Wilson (1996) supported this finding after carrying out an in-vitro investigation of microbial activity at a decreased pΗ. From their studies, ruminal microbial activity was compromised when the rumen pΗ decreased below 6.2. Strobel and Russell (1986) also showed reduced microbial yield in vitro when the ruminal pΗ was low. The drop in rumen pΗ has been reported to be due to excess fermentation of starch to VFA, which overwhelms the buffering and absorptive capacity of the cow (Krause et al., 2003). Rapidly fermenting carbohydrates, such as sugars, soluble fibres and some starches, have the potential to decrease ruminal pΗ rapidly by virtue of the sheer mass of organic acids produced in the rumen in a

19
relatively short period of time. Sugars and starch are fermented to lactic acid, which is a stronger acid than acetic and butyric acids. However, sugars (mono- and disaccharides) may not be as prone to causing ruminal acidosis as starch, possibly due to the conversion of some portion of sugars to glycogen, as opposed to its immediate fermentation (Thomas, 1960). A decrease in rumen pΗ due to the excess VFA has been shown to decrease fibre digestion (Mould et al., 1983) probably due to the defaunating effect of the ruminal acids (Bonhomie, 1990; Yang and Varga 1993). The ruminal acids kill or destroy the fibre digesting micro organisms, thereby interrupting the mechanism involved in fibre digestion. This results to the presence of undigested fibre particles greater than 0.5 inches in faeces (Hall, 2002a). The ruminal acids also cause some ulceration on the intestinal epithelium and this has been evidenced by the presence of mucin and fibrin cast in the faeces (Hall, 2002b).The undigested feed particles by-pass the rumen to the large intestine and ceacum thereby producing foamy, sticky and acidic faeces. This form of fermentation is of reduced nutritional value to the dairy cow since the microbial protein is lost in faeces although the VFA probably is absorbed (Van Soest, 1994). These findings suggest that effective fibre digestion is enhanced in a rumen environment with adequate rumen flora and at a normal and even pΗ level.
Ruminal Acidosis and Displaced Abomasum Acidosis has been defined by Stedman (1982) as a decrease in the alkali (base excess) in the body fluids relative to the acid (hydrogen ion) content (Stedman, 1982). Ruminal acidosis is a production problem that usually occurs when ruminants ingest an excessive amount of readily fermented carbohydrates (Owen et al., 1998). It has been found to occur both in acute and chronic (subacute) forms (Owen et al., 1998). Acute ruminal acidosis is a condition that occurs when the ruminal pΗ is aproximately less than 5 to 5.2, whereas the subacute ruminal acidosis (SARA) is defined as a ruminal pΗ of approximately 5.2 to 5.6 (Mishra, 1970; Owen et al., 1998; Keunen et al., 2002). Acute ruminal acidosis is marked with increased osmolality, ruminal acidity and peracute ruminitis, with high accumulation of acids and glucose in the blood whereas chronic ruminal acidosis causes reduced performance and intake probably due to hypertonicity of the digesta (Radostits et al., 1994; Owen et al.,1998). The etiology of ruminal and systemic acidosis has been described in excellent reviews by Britton and Stock (1987), Huntington (1988), Elanco (1993) and Hermon (1996). Carbohydrates in the rumen and ceacum are fermented to VFA and lactate by anaerobic microbes. These organic acids are absorbed by herbivores for metabolism in

20
tissues (Owen et al., 1998). However, when the carbohydrate supply is increased abruptly; following grain engorgement or during adaptation to high concentrate diets, the supply of total acids and the prevalence of lactate increases, which results in metabolic disturbances (Owen et al., 1998). These metabolic disturbances have been variously described as D-lactic acidosis; overeating, acute impaction, grain founder and grain overload (Dunlop and Hammond, 1965). Owen et al. (1998) showed that the occurrence of ruminal acidosis could be influenced by factors, such as grain source, grain processing and starch type, because of the effect of these factors on the rate of cleavage of starch to glucose. For example, wheat has a more readily extractable starch than maize, which has less surface area for microbial attack. Heat and pressure processing, particle size reduction, and high moisture storage of grain increase starch availability and propensity for acidosis (Reinhardt et al., 1997; Britton and Stock, 1987). Studies by Hungate (1966) showed that the release of free glucose in the rumen during fermentation encourages the growth of Streptococcus bovis, which thrives only when free glucose is available and has been incriminated as a major cause of lactic acidosis. Streptococcus bovis is a good lactate producer and the rate of production of lactate by this organism depends on the ruminal pΗ (Stone, 2004). Leedle (1993), however, showed that the concentration of these organisms is very low in the rumen of cattle fed high- concentrate diets. Studies by others (Mishra et al., 1970; Oetzel et al., 1996; Oba and Allen, 2000) showed that dairy cows with SARA have a low level of lactate. Heat stress also has been reported to be one of the causes of ruminal acidosis (Dale and Brody, 1954). Heat stress alters a cow’s acid-base balance when a cow pants and exhales carbondioxide and the total amount of buffering capacity within her system decreases (Dale and Brody, 1954). Clinically, acidosis can be diagnosed by measuring ruminal or blood acidity, with a ruminal pΗ of 5.6 and 5.2 often being used as a benchmark for chronic and acute acidosis, respectively (Cooper and Klopfenstein, 1996). Britton et al. (1991) has used variations in feed intake among days as an index for subclinical or chronic acidosis based on the concept that an increased variability from day to day in feed intake by an individual animal is associated with feeding acidotic diets (Britton and Stock, 1987). Acidosis can be prevented by observing some good management practices. Feeding more roughage or modulating intake of starch by dairy cows reduces the incidence of acidosis (Owen et al., 1997). In addition, including monensin in the diets of ruminants has proved to decrease the incidence of digestive deaths in pens of feedlot cattle (Parrott, 1993; Vogel, 1996). This is probably due to the inhibition of certain lactate-producing bacteria and reduced daily variation in feed intake (Cooper and Klopfenstein, 1996).
21
Reports have indicated that the intensification in milk production in the dairy industry has an increasing effect on the incidence of displaced abomasums (DA). In Sweden for instance, there was an increased incidence of DA from 0.3 to 0.7 % between 1993 and 1999 and the corresponding increase in average annual milk production during the same period was from 7 740 to 8 300 kg of energy-corrected milk (ECM: 0.25 × kg of milk + 12.2 × kg of fat +7.7 kg of protein)/cow (Stengärde and Pehrson, 2002). The same study showed that multiparious cows were more prone to DA than the primiparious cows and that the Swedish Friesians were more predisposed to DA than the Swedish Red cows. The incidence of DA in lactating dairy cows has been suggested to be caused by conditions, such as, decreased forage to concentrate ratio (Coppock et al.,1972), presence of volatile fatty acids within the abomasum (Breukink, 1991), sorting occurring when feeding total mixed rations (Stengärde and Pehrson, 2002) and finely chopping of forages before ensiling (Shaver, 1997). The review by Shaver (1997) showed that when a high grain, low forage diet or finely chopped forages are fed to lactating dairy cows, there will be a reduction in the depth of the ruminal mat. The ruminal mat plays an important role in capturing grains so that they are fermented at the top of the ruminal fluid. The VFA produced at the top of the ruminal fluid are absorbed from the rumen with almost no VFA entering the abomasums in healthy cows. A thick ruminal mat is generally present during the dry period when cows are fed a high forage diet, but the depth of the ruminal mat is reduced drastically in early lactation, especially when cows experience pronounced declines in DMI (NRC, 2001). Although VFA within the abomasum can initiate abomasal displacement; the ruminal concentration of VFA is not highly correlated to the concentration in the abomasum (Breukink and de Ruyter, 1976). Other studies have shown that near parturition, a decline in plasma calcium up to 5 mg/dl can result in abomasal atony and distension with subsequent displacement of the abomasum (Hull and Wass, 1973; Curtis et al., 1983; Massey et al., 1993). Clinical treatment of displaced abomasum has been studied by Oetzel, (1996). Oral administration of calcium chloride to cows with DA has proved to be an effective measure of preventing the metabolic disorder (Oetzel, 1996). Stengärde and Pehrson (2002) suggested a management approach, where the rumen fill is maintained by feeding forages rich in physically effective fibre both before and after calving.
Factors Affecting Faecal Particle Size and Consistency
Faecal particle size and consistency have been reported to be affected by the pеNDF content of the feed that maintains rumen function and the impact of the type of non-fibre carbohydrates NFC

22
on ruminal pΗ (Hall, 2002a). When diets less in pеNDF or high in digestible NFC is fed to lactating dairy cows, ruminal residence time is shortened and proper ruminal fermentation process will be disturbed (Varga, 2003). This results in the presence of long fibre particles in faeces (Hall, 2002a). Large fibre particles in faeces is an indication of short retention time of feed in the rumen and poor reduction in size of particles by rumination and microbial fermentation (Hall, 2002a) High-producing dairy cows show high DMI with subsequent increases in rates of passage of feed through the rumen. This results in more of the feed being fermented in the small intestine, caecum and large intestine. Inadequate intake of pеNDF results in insufficient formation of the ruminal mat, which is not effective enough to retain large particles in the rumen (Mertens, 1997). Decreased feed particle size can increase faecal particle size if there is insufficient pеNDF in the diet (Poppi et al., 1980). Long pieces of coarse fibre in faeces suggest sorting of feed whereas the presence of grain in manure is an indication of poor grinding or insufficient consumption of pеNDF (Hall, 2002a). When cows are fed a well mixed TMR, there is a tendency of proper rumen fermentation and a better nutrient utilization than when cows are fed concentrates and forages separately (NRC, 2001). Animals’ access to feed and sequence of feeding also have a role to play in the consistency and particle size of the faeces (NRC, 2001). Robinson and McQueen (1994) reported an increase in both ruminal pΗ and propionate concentration when number of feedings was increased from two to five per day. Klusmeyer et al. (1990) indicated that increasing feeding from two to four times per day did not improve ruminal fermentation patterns and milk production. In a related investigation, Sniffen and Robbinson (1984) hypothesized that feeding highly fermentable carbohydrates to cows that have been without feed for over 6 hrs could cause ruminal acidosis; and at the same time depress feed intake and fibre digestion. Therefore, they suggested that feeding forages as the first feed in the morning before other feedstuffs would encourage the formation of fibre mat as well as providing a buffering capacity in the rumen by salivary production associated with chewing. The consistency of manure is a function of the feed moisture content and the mean retention time of the feed in the digestive tract of the animal (Varga, 2003). A normal faecal consistency consists of manure that has a medium porridge-like appearance and forms a dome-shaped pile, 2.5 to 5.0 cm high when dropped on the ground (Varga, 2003). Loose manure may be due to excessive intakes of protein or high levels of rumen degradable protein (Varga, 2003). This is probably because of increased water consumption in an attempt to excrete excess nitrogen through the urine. Extensive hindgut fermentation of carbohydrates and increased acid production may cause diarrhea. Also, poisoning, bacterial and parasitic

23
infections could result in diarrhea. Reports have also indicated that during periods of heat stress, cows produce large quantities of loose manure (Hall, 2002a). Studies have shown that high-producing cows excrete a more liquid faeces (Shellenberger and Kesler, 1961). Restricted water or protein intake and severe dehydration could result in firmer faeces (Varga, 2003).
Particle Size, Sieving Technique and Image Analysis Particle size determination is usually performed either by a wet sieving or a dry sieving technique. Wet sieving has been described in the works of Kennedy (1984) and Ulyatt et al. (1986) as the most generally accepted procedure for identifying long particles in faeces. The technique has helped to understand the concept of the CPS of 1.18 mm, below which particles can pass through the reticulo-omasal orifice (Ulyatt et al., 1976; Reid et al., 1977; Poppi et al., 1980, 1985; Mertens, 1997). The wet sieving technique also was used by Tomoko et al. (2004) to explain the effect of different forage types on particle size distribution of ruminal digesta and faeces of non-lactating dairy cows fed high-quality forages. From their findings, the CPS for escape from the reticulo rumen was between 2 and 4 mm for cows fed round-baled silages and long orchardgrass hay. They concluded that particle size reduction and passage from the rumen could be attributed to intrinsic factors of the fed forages. These results agree with the findings by Nørgaard and Sechic (2003), who observed that 95% of washed faeces particles from cattle fed grass silage at maintenance level were shorter than 5 mm. Washing of faecal samples, which is one of the preliminary steps to dry sieving techniques and image analysis, has been described by Nørgaard et al. (2004). Dry sieving has been applied in several studies to understand the different characteristics of plant materials fed to ruminant animals (Robertson and Van Soest, 1982; Kennedy and Poppi, 1984; Ulyatt et al., 1986; Faichney and Brown, 1991; Nørgaard et al., 2004). The particles were separated into different fractions based on their ability to pass through apertures of different sizes. Luginbuhl et al. (1988) observed that materials retained by any sieve represent a range of sizes determined by the resistance of that sieve to onward passage of particles and by the mesh size of the sieve situated immediately above it. Luginbuhl et al. (1985) observed a pronounced inverse relationship in the length to mesh size ratio of scanned particles and they suggested that the smaller the particles the more likely it is to be presented end on for passage through the sieve. This suggests the manner in which particles are reduced in size during ingestive chewing, comminution and the method of positioning at the zone of escape from the rumen. Large particles are chewed during eating until they are reduced to a certain size, which is appropriate for bolus formation and subsequent swallowing. The swallowed

24
particles are ruminated and fermented to small sizes that fall to the ventral rumen. Following series of double contraction cycles at the reticulo-omasal orifice, small particles below 1.18 mm pass through to the abomasum (Ulyatt et al., 1976; Reid et al., 1977; Poppi et al., 1980, 1985). Image analysis has also been used in some studies to understand the different characteristics of forage samples fed to ruminant animals (Grenet et al. 1989; Nørgaard and Bendixen, 2002; Nørgaard and Sehic, 2003). Grenet et al. (1989) investigated, by use of image analysis, the different morphological characteristics of ruminal digesta particles in sheep fed mixed grass hay. They concluded that a precise assessment of particle length, width, area and shape could be made by use of image analysis. Nørgaard and Sehic (2003) reported a particle length distribution in the faeces of cows fed roughages and concentrates from different diet sources to be similar to their observations in lambs fed the same diets. Also, the distribution of particle length and width of sieved forage samples have been charaterized by mode, median, arithmetic mean, geometric mean and 95 percentile values (Nørgaard and Bendixen, 2002; Nørgaard and Sehic, 2003; Nørgaard et al., 2004;). The use of logarithmic (log) normal curves to describe the weight of sieved particles has been adopted by the American Society of Animal Science (1969), the American Society of Dairy Science (1970) and Waldo et al. (1971). Waldo et al. (1971) suggested that the log normal distribution gives a thorough description of the weight distribution of sieved digesta from the rumen and faeces of cows fed chopped and pelleted hay. However, data from image analysis has shown that forages are not fragmented into spherical or cuboidal shapes (Luginbuhl et al., 1988); as a result, there is likely a deviation from the log normal distribution of the lengths of sieved particles according to Waldo et al. (1971). Gamma distribution curves and cumulative distribution curves have been used to describe the length and width distribution of particles from both feed and faeces samples (Nørgaard and Bendixen, 2002; Nørgaard and Sechic, 2003; Nørgaard et al., 2004). The shape of the gamma distribution curve explains rumen fermentation (Nørgaard et al., 2004). A flat curve indicates many long particles whereas a steep curve indicates many short particles in faeces (Nørgaard et al., 2004). Many small particles in faeces describe good rumen fermentation (Nørgaard et al., 2004). However, many long particles in faeces indicate a diet that has not been properly fermented in the rumen (Nørgaard et al., 2004).

25
References Akin, D.E. (1989). Histological and physical factors affecting digestibility of
forages. J. Agric.Sci.81:17-25. Albright, J.L. and Arave, C.W. 1997. The behaviour of cattle. CAB International.
Oxon, UK. Allen, M.S. 1997. Relationship between fermentation acid production in the rumen
and the requirements for physically effective fibre. J. Dairy Sci.80: 1447-1462. American Society of Animal Science. 1969. Summary of the minutes of the 61st
business meeting of the American Science. J. Anim. Sci. 29: 1021. American Dairy Science Association. 1970. A report: Committee on classification
of particle size in feedstuffs. J. Dairy Sci. 53:689. Ash, R.W.1959. Inhibition and excitation of reticulo-rumen contractions follows
the introduction of acids into the rumen and abomasium. J. Physiol. 147:58-73. Bae, D.H., Welch, J.G. and Gilman, B.E. 1983. Mastication and rumination in
relation to body size. J.Dairy Sci. 66:1371-2141. Bailey, C.B., and Balch, C.C. 1961. Saliva secretion and its relation to feeding in
cattle.2.The composition and rate of secretion of mixed saliva in the cow during rest. Br. J. Nutr. 15: 383.
Batajoo, K.K., and Shaver, R.D. 1994. Impact of nonfibre carbohydrate on intake, digestion , and milk production by dairy cows. J. Dairy Sci. 77:1580.
Beauchemin, K.A. 1991. Ingestion and mastication of feed by dairy cattle. Vet. Clin. North Am. Food Anim. Pract. 7:439-453.
Beauchemin, K.A., Yang, W.Z. and Rode, L.M. 2003. Effect of particle size on alfalfa based dairy cow diets on chewing, activity, ruminal fermentation, and milk production. J. Dairy Sci. 86:630-643.
Bernard, L. and Doreau, M. 2000. Use of rare earth elements as external markers for mean retention time measurements in ruminants. Reproduction Nutrition Development. 40: 89-101.
Breukink, H.J. 1991. Abomasal displacement, etiology, pathogenesis, treatment and prevention. Bovine Practitioner. 26:148-153.
Breukink, H. J. and de Ruyter, T.1976. Abomasal displacement in cattle: Influence of concentrates in the ration on fatty acid concentration in ruminal, abomasal and duodenal contents. Am. J. Vet. Res. 37:1181-1184.
Bonhomme, A. 1990. Rumen ciliates: their metabolism and relationships with bacteria and their hosts. Anim. Feed Sci. Technol. 30:203-266.
Britton, R.A. and Stock, R. 1987. Acidosis, rate of starch digestion and intake. Okla. Agric. Exp. Stn. MP-121:125-137.
Britton, R., Stock, R.A., Sindt, M., Oliveros, B. and Parrot, C. 1991. A new feed additive and technique to evaluate acidosis in cattle. Nebr. Cattle Feeders Day. pp 55-58. University of Nebraska, Lincoln.
Cammell, S.B. and Osbourn, D.F. 1972. Factors influencing the total time spent chewing by sheep given diets containing long dried forages. Proc. Nutr. Soc. 31:63A.
Cheng, K.J., Forsberg, C.W., Minato, H. and Costerton. J.W. 1991. Microbial ecology and physiology of feed degradation within the rumen. In: Physiological
26
Aspects of Digestion and Metabolism in Ruminants. Tsuda, T., Sasaki, Y. and Kawashima, R. (eds). pp. 595-624. Academic Press, Toronto, ON.
Cooper, R. and Klopfenstein, T. 1996. Effects of rumensin and feed intake variation on ruminal pH In: Scientific Update on Rumensin/Tylan/Mycotil for the professional Feedlot Consultant. pp A1-A14. Elanco Animal Healt, Indianapolis, IN.
Coppock, C.E., Noller, C.H., Wolfe, S.A., Callahan, C.J and Baker, J.S. 1972. Effect of forage to concentrate ratio in complete feeds fed ad libitum on feed intake prepartum and the occurrence of abomasal displacement in dairy cows. J. Dairy Sci. 55:783-789.
Curtis, C.R., Erb, H. N., Sniffen, C.J., Smith, R.D., Powers, P.A., Smith, M.C., White, M.E., Hilman, R.B., Dale, H.E. and Brody, S. 1983. Environment physiology and shelter engineering XXX. Thermal stress and acid-base balance in dairy cattle. Univ. Missouri Agric. Exp. Sta. Bulletin 562:1-27, University of Missouri, Columbia, MO.
Dale, H. E. and Brody, S. 1954. Environment physiology and shelter engineering XXX. Thermal stress and acid-base balance in dairy cattle. Univ. Missouri Agric. Exp. Sta. Bulletin 562:1-27, University of Missouri, Columbia, MO.
Deswysen, A. and Vanbelle, M.1978. How chopping improves grass silage intake by sheep and heifers. Pp. 6.19-6.26. Constraints to grass growth and grassland output. Proceedings of the 7th General Meeting of the European Grassland Federation. June 5-9, Gent, Belgium.
Dijkstra, J. 1994. Production and absorption of volatile fatty acids in the rumen. Livestock Production Science 39:61-69.
Dijkstra, J., Forbes, J. M. and France, J. 2005. Quantitative aspects of ruminant digestion and nutrition. 2nd ed CABI Publishing.
Dijkstra, J. and Tamminga, S. 1995. Stimulation of the effects of diets on the contribution of rumen protozoa to degradation of fibre in the rumen. Brit. J. Nutri. 74:617-634.
Dulphy, J. P., Remond, B. and Theriez, M. 1980. Ingestive behaviour and related activities in ruminants.In: Ruskebusch, Y. and Thivend, P. (eds.). Digestive Physiology and Metabolism in Ruminants. MTP Press, Lancaster, pp. 103-122.
Dunlop, R. H. and Hammond. 1965. D-Lactic acidosis of ruminants. Ann. NY Acad. Sci. 119:1109-1132.
Elanco, 1993. Scientific Update on Rumensin/Tylan for the Professional Feedlot Consultant. Elanco Animal Health, Indianapolis. IN.
Ellis, W.C., Poppi, D.P., Matis, J. H., Lippke, H., Hill, T.M. and Rouquette, F.M. Jr.1999. Dietary digestive metabolism interactions determining the nutritive potential of ruminant diets. In: Jung, H. J.G. and Fahey, G.C. (eds) Nutritional Ecology of Herbivores. American Society of Animal Science, Illinos, pp.423-481.
Emery, R. S., Smith, R.M., Grimes, R.M., Huffman, C. F. and Duncan, C.W. 1960. Physical and chemical changes in bovine saliva and rumen lipid with different hay-grain rations. J. Dairy Sci. 43:76.
Ernason, M.S., Plaizer, J.C. and Winttenberg K.M. 2004. Effect of barley silage chop length on productivity and rumen conditions of lactating dairy cows fed a total mixed ration. J. Dairy Sci.87:2987-2996.

27
Fahey, G.C. and Berger. L.L. 1988. Carbohydrate nutrition of ruminants. Pages 269-297 in Ruminant Animal Digestive Physiology and Nutrition. Prentice Hall, Englewood Cliffs, NJ.
Faichney, G.J. 1986. The kinetics of particulate matter in the rumen. In: Milligan, L.P., Grovum, W.L. and Dobson, A. (eds). Control of Digestion and Metabolism in Ruminants. Prentice-Hall, Englewood Cliffs, New Jersey, pp.173-195.
Faichney, G.J. and Brown, G.H. 1991. Critical size of particles leaving the rumen of sheep given chopped or ground lucerne hay. In: Proceedings of the Third International Symposium on the Nutrition of Herbivores. Malaysian Society of Animal Production, Serdang, Selangor, Malaysia, p.29.
Gijzen, H.J., Lubberding, H.J., Gerdardus, M.J.T. and Vogels, G.D. 1988. Contribution of rumen protozoa in fibre degradation and cellulase activity in vitro. FEMS Microbiol. Lett. 55:3039-3045.
Grenet, E., Luginbuhl, J.M., Barry, P., Pond, K.R. and Baumont, R. 1989. Image analysis of the size and morphological characteristics of ruminal digesta particles from sheep fed mixed-grass hay. Canadian Society of Animal Science, Edmonton, Alberta, p. 170.
Hall, M. 2002a. Characteristics of manure: What do they mean? Department of Animal Sciences. University of Florida. http://www.das.psu.edu/dcn/WORKSHOP/dcn2002/docs/hallwksh2.pdf Accessed 20040726.
Hall, M. 2002b. Rumen acidosis: Carbohydrate feeding considerations. Department of Animal Science. University of Florida. http://www.das.psu.edu/dcn/WORKSHOP/dcn2002/docs/hall.pdfAccessed 20040726.
Harmon, D. 1996. Sudden feedlot deaths: Are pen deads due to ruminal or systemic dysfunction or combination of both? In: Scientific Update on Rumensin/Tylan/Mycotil for the professional Feedlot Consultant. pp L1-L6. Elanco Animal Health. Indainapolis, IN.
Hoover, W.H. 1986. Chemical factors involved in ruminal fibre digestion. J. Dairy Sci. 69:2755-2767.
Hull, B.L. and Wass, W.M. 1973. Abomasal displacement. 2. Hypocalceamia as a contributing causative factor. Vet. Med. Small Anim. Clin. 68:412-417.
Hume, I.D. and Sakaguchi, E. 1991. Patterns of digesta flow and digestion in foregut and hindgut fermenters. In: Tsuda, T., Sasaki, Y. and Kawashima, R. (eds) Physiological Aspects of Digestion and Metabolism in Ruminants. Academic Press, London, pp. 427-451.
Hungate, R.E. 1966. The Rumen and its Microbes. Academic Press, New York. Huntington, G.B. 1988. Nutritional problems related to the gastrointestinal tract.
Acidosis. In: Church, D.C. (ed) The Ruminant Animal. pp 474-480. Waveland Press, Prospect Heights, IL.
Jaster, E.H. and Murphy, M.R. 1983. Effect of varying particle size of forage on digestion and chewing behavior of dairy heifers. J. Dairy Sci. 66:802.
Kaneko, J.J. 1980. Clinical Biochemistry of Domestic Animals. 3rd ed. Academic Press NY.
Kennedy, P.M. 1984. Summary and conclusions from discussion. In: Kennedy, P.M. (ed) Techniques in Particles Size Analysis of Feed and Digesta in Ruminants. Canadian Society of Animal Science, Edmonton, Alberta, pp. 184-186.

28
Kennedy, P.M. and Poppi, D.P. (1984). Critical particle size in sheep and cattle. In: Kennedy,P.M. (ed.) Techniques in Particle Size Analysis of Feed and Digesta in Ruminants. Canadian Society of Animal Science.
Keunen, J.E., Plaizer, J.C., Kyriazakis, L., Dunfield, T.F., Widowski, T.M., Lindinger, M.I. and McBride, B.W. 2002. Effects of a subacute ruminal acidosis model on the diet selection of dairy cows. J. Dairy Sci. 85:3304-3313.
Klusmeyer, T.H., Cameron, M.R., McCoy, G.C. and Clark, J.H. 1990. Effects of feed processing and frequency of feeding on ruminal fermentation, milk production and milk composition. J. Dairy Sci. 73:3538-3543.
Kolattukudy, P. E. 1984. Biochemistry and function of cutin and suberin. Can. J. Bot. 62:2981-2986.
Kononoff, P.J., Heinrich, A.J. and. Lehman. H.A. 2003.The effect of corn silage particle size on eating behavior, chewing activities, and rumen fermentation in lactating dairy cows. J. Dairy Sci. 86:3343-3353.
Kovacs, P.L., Sudekum, K.H. and Stangassinger, M. 1997. Effects of intake level of a mixed diet on chewing activity and on particle size of ruminated boli, ruminal digesta fractions and faeces in steers. Reprod. Nutr. Dev. 37: 517-528.
Krause, K.M and Comb, D.K. 2003. Effect of forage particle size, forage source and grain fermentability on performance and ruminal pΗ in mid-lactation cows. J. Dairy Sci. 86:1382-1397.
Krause, K.M., Comb, D.K. and Beauchemin, K.A. 2002. Effect of forage particle size and grain fermentability in midlactation cows. II. Ruminal pΗ and chewing activity. J. Dairy Sci. 85:1947-1957.
Krause, K.M., Comb D.K. and Beauchemin, K.A. 2003. Effect of increasing levels of refined corn starch in the diet of lactating dairy cows on performance and ruminal pH. J. Dairy Sci. 86:1341-1351.
Krause, D.O., Dalrymple, B.P. Smith, W.J. Mackie, R.I. and McSweeney, C.S. 1999. 16SrDNA sequencing of Ruminococcus albus and Ruminococcus flavefaciens: design of a signature probe and its application in adult sheep. Microbiology 145:1797-1807.
Lammers, B.P., Buckmaster, D.R. and Heinrichs, A.J. 1996. A simple method for analysis of particle sizes of forage and total mixed rations. J. Dairy Sci. 79:922-928.
Leedle, J.A.Z. 1993. Modulating ruminal fermentation in high-grain fed cattle: The role Rumensin. In: Scientific Update on Rumensin/Tylan for the Professional Feedlot Consultant. pp B1-B22. Elanco Animal Health, Indianapolis, IN.
Leek, B.F. 2004. Digestion in the ruminant stomach. In: Reece, W.O. (ed). Dukes’ physiology of domestic animals.12th edn. Cornell University Press, New York.
Luginbuhl, J.M., Pond, K.R., Burns, J.C and Russ, J. C. 1988. Effects of ingestive mastication on particle dimensions and weigth distribution of coastal bermudergrass hay fed to steers at flour levels. J. Anim. Sci. 67 (2) pp. 538-546.
Luginbuhl, J.M., Pond, K.R., Russ, J.C. and Burns, J.C. 1985. Direct evaluation of particles in masticated forage. J. Anim. Sci. 61 (Suppl. 1): 349 (Abstr.).
Luginbuhl, J.M., Pond, K.R., Russ, J.C .and Trolley, E.A. 1984. Use of microscopic computer in feedstuff particle evaluation: a direct approach. In: Kennedy, P.M. (ed) Techniques in Particle Size Analysis of Feed and Digesta in
29
Ruminants. Occasional Publication No.1, Canadian Society of Animal Science, Edmonton, Alberta, pp. 184-186.
McDonald, P., Edwards, R.A. and Greenhalgh, J.F.D. 1988. Animal Nutrition 4th edn. Longman Scientific and Technical.
Maekawa, M., Beachemin, K.A. and Christensen, D.A. 2002. Effect of concentrate level and feeding management on chewing activities, saliva production and ruminal pΗ of lactating dairy cows. J. Dairy Sci. 85:1165-1175.
Massey, C.D., Wang, C., Donovan, G.A., and Beede, D.K. 1993. Hypocalceamia at parturition as a risk factor for left sided displacement of abomacium in dairy cows. J. Am. Vet. Med. Assoc. 203:852-853.
McCullough, M.E. 1973. Optimum Feeding of Dairy Animals.Univ. Press, Athens, GA.
Mertens, D.R .1985. Factors influencing feed intake in lactating cows: from theory to application using neutral detergent fibre. Page 1 in Georgia Nutr. Conf.
Mertens, D.R. 1986. Effect of physical characteristics, forage particle size and density on forage utilization. p. 91 in Proc. Nutr. Symp., St. Louis,MO. Am. Feed Ind. Assoc., Arlington, VA.
Mertens, D.R. 1987. Predicting intake and digestibility using mathematical models of ruminal function. J. Anim. Sci. 64:1548.
Mertens, D.R. 1992. Nonstructural and structural carbohydrates. Page 219 in Large Dairy Herd, Am. Dairy Sci. Assoc., Champaign, IL.
Mertens, D.R. 1994. Regulation of forage intake. Page 450 in Forage Quality, Evaluation and Utilization. Fahey, Jr. G.C., Mertens, D.R. and Moster, L.E. (ed). Am. Soc. Agron., Madison, WI.
Mertens, D.R. 1997. Creating a system for meeting the fibre requirement of dairy cows. J. Dairy Sci. 80:1463-1481.
Mishra, M., Martz, F.A., Stanley, R.W., Johnson, H.D., Campell, J.R. and Hilderbrand, E. 1970. Effect of diet and ambient temperature humidity on ruminal pΗ, oxidation reduction potential, ammonia and lactic acid in lactating cows J. Anim. Sci. 30: 1023.
Mould, F.L., Orskov, E.R. and Mann, S.O. 1983. Associative effects of mixed feeds .I. Effects of type and level of supplementation and the influence of the rumen fluid pΗ on cellolysis in-vivo and dry matter digestion of various roughages. Anim. Feed Sci. Technol. 10: 15-30.
Nagaraja, T.G., Newbold, C.J., Van Nevel, C.J. and Demeyer, D.I. 1997. Manipulation of rumen fermentation. In Hobson, P.N. and Stewart, C.S. (eds.). The Rumen Microbial Ecosystem, 2nd edn. Balckie Academic and Professional, London, pp. 387-443.
National Research Council. 2001. Nutrient Requirement of Dairy Cattle. 7th Rev. ed. Natl. Acad. Sci.Washington, DC.
National Research Council. 1989. Nutrient Requirements of Dairy Cattle. 6th rev.ed. Natl. Acad. Sci., Washington, DC.
Nelson, W.F. and Satter, L.D. 1990. Effects of stage of maturity and method of preservation of alfalfa on production by lactating dairy cows. J.Dairy Sci.73:1800.

30
Nocek, J.E. and Russell, J.B. 1988. Protein and energy as an integrated system. Relationship of ruminal protein and carbohydrate availability to microbial synthesis and milk production. J. Dairy Sci. 73:1800-1811.
Nørgaard, P.1989. The influence of physical form of ration on chewing activity and rumen motility in lactating cows. Acta Agric. Scand. 39:187-202.
Nørgaard, P. 2003. Optagelse af folder og drøvtygning. Chp. 6. In: Hvelpelund, T. and Nørgaard, P. (ed). Kvægets enæring og fysiologi. Bind 1. Naeringsstofomsætning og fodervurdering. DJF rapport, Husdyrbrug nr. 53.
Nørgaard, P.2005a.Note about hardness factor of structural fibre. Stencil, 2 pp. Nørgaard, P. and Bendixen. 2002. Particle size distribution in silage, boluses,
rumen content and faeces from cows fed grass silage with different theoretical chopping length. Paper presented at the 53rd Annual EAAP Meeting, Commission of Animal Nutrition, Abstract No. 306, Cairo, 1-4 September.
Nørgaard, P., Husted, S. and Ranvig, R. 2004. Effect of supplementation with whole wheat or whole oat grains on the dimensions of faeces particles from lambs. J. Anim. and Feed Sci., 13. suppl. 1, pp.175-460.
Nørgaard, P. and Sehic, A. 2003. Particle size distribution in silage, boluses, rumen content and faeces from cows fed grass silage with different theoretical chopping length. Trop. and Subtrop. Agroecosyst. 3:457-460. Herrera-Camacho, J. and Sandoval-Castro, C. A. (eds.) Proc. of the sixth Int. Symp. on the Nutr. of Herbivores Oct. 19-24, Merida, Yucatan, Mexico.
Oba, M. and Allen, M.S. 2000. Effects of brown midrib3 mutation in corn silage on productivity of dairy cows fed two concentrates of dietary neutral detergent fibre: 2. Chewing activity. J. Dairy Sci. 83:1342-1349.
Oetzel, G.R.1996. Effect of calcium chloride gel treatment in dairy cows on incidence of parturient diseases. J. Am. Vet. Med. Assoc. 209:956-961.
Orpin, C.G.1983. The role of ciliate protozoa and fungi in the rumen digestion of plant cell wall. Animal Feed Science and Technology 10:121-143.
Owens, F.N., Secrist, D.S., Hill, W.J. and Gill, D.R. 1998. Acidosis in catlle. 1st rev. J. Anim. Sci. 76:275-286.
Olaisen, V., Nesse, N. and Volden, H. 2001. Technical note: use of laser diffraction for particle size distributions in duodenal digesta. J. Anim. Sci. 79: 761-765.
Ørskov, E.R.1981. Recent advances in understanding of cereal processing for ruminants. In: Haresign, W. and Cole, D.J.A (eds). Recent Developments in Ruminants Nutrition. Buterworths, London, pp. 258-267.
Parrot, C. 1993. Secondary benefits from feeding rumensin. In: Scientific Update of Rumensin/Tylan for Professional Feedlot Consultant. pp H1-H11. Elanco Animal Health, Indianapolis, IN.
Plaizer, J.C. 2004. Replacing chopped alfalfa hay with alfalfa silage in barley grain and alfalfa based total mixed rations for lactating dairy cows. J. Dairy Sci. 87:2495-1028.
Poppi, D.P., Hendricksen, R.E. and Minson, D.J. 1985. The relative resistance to escape of leaf and stem particles from the rumen of cattle and sheep. J.Agric. Sci. (Camb.) 105:9.

31
Poppi, D. P., Norton, B.W., Minson. D.J. and Hendricksen, R.E. 1980. The validity of the critical size theory for particles leaving the rumen. J. Agric. Sci. (Camb.) 94: 275.
Radostits, O.M., Blood, D.C. and Gay, C.C. 1994. Acute carbohydrate engorgement of ruminants (rumen overload). In: Radostits, D.C. Blood, and Gay, C.C. (eds), Veterinary Medicine, W.B. Sunders, Philadelphia, PA (1994), pp. 262-269.
Reid, C.S.W., Ulyatt, M.J. and Monro, J.A. 1977. The physical breakdown of feed during digestion in the rumen. Proc. N.Z. Soc. Anim. Prod. 37:173.
Reinhart, C.D., Brandt, R.T., Behnke, K.C. Jr., Freeman, A.S. and Eck, T.P. 1997. Effect of steam-flaked sorghum grain density on performance, mill production rate, and subacute acidosis in feedlot steer. J. Anim. Sci. 75: 2852.
Russell, J.B. and Wilson, D.B.1996. Why are ruminal cellulotic bacteria unable to digest cellulose at low pH? J. Dairy Sci. 66:811-820.
Robertson, J.B. an Van Soest, P.J. 1981. Analysis of fibre by detergent system. In: James, W.P.T. and Theander, O. (ed). The Analysis of Dietary Fibre. pp 123-158. Mercel Dekker, New York.
Robinson, P.H and McQueen, R.E. 1994. Influence of supplemental protein source and feeding frequency on rumen fermentation and performance in dairy cows. J. Dairy Sci.77: 1340-1353.
Sahlin, A. 2006. Effects of particle length and maturity stage of whole crop barley silage on feed intake, chewing activity and eating behaviour by growing dairy steers. Student report 88. Section of Production Systems, Department of Animal Environment and Health, Swedish University of Agricultural Sciences, Skara, Sweden.
Santini, F.J., Hardie, A.R. and Jorgensen, N.A. 1983. Proposed use of adjusted intake based on forage particle length for calculation of roughage index. J. Dairy Sci. 66:811.
Sauvant, D., Aufrere, J., Michalet-Dorea, B., Giger, S. and Chapoutot. P. 1987. Value nutritive de aliments concentres simples: table et prevision. Int. Natl. Rech. Agron. Ctr. Res. Zootech. Vet. (Theix) Bull. Tech.70:75.
Shaver, R. D. 1997. Nutritional risk factors in the etology of left displaced abomacium in dairy cows: A review. J. Dairy Sci. 80:2449-2459.
Shellengberger, P.R and Kesler, E.M. 1961. Rates of passage of feeds through the digestive tract of Holstein cows. J. Animal Sci. 20: 416.
Sniffen, C.J. and Robinson, P.H. 1984. Nutritional Strategy. Can. J. Anim. Sci. 64: 529-542.
Stedman, T.L. 1982. Stedmans’s Medical Dictionary. Williams and Wilkins, Baltimore, MD.
Stengärde, L.U. and Pehrson, B.G. 2002. Effects of management, feeding and treatment on clinical and iochemical variables in cattle with displaced abomasums. AJVR, Vol. 63, No.1.
Stone, W.C. 2004. Nutritional approaches to minimize subacute ruminal acidosis and laminitis in dairy cattle. J. Dairy Sci. 87(E. Suppl.): E12-E26.
Strobel, H.J. and Russell, J.B1986. Effect of pH and energy spilling on bacterial protein synthesis by carbohydrate limited cultures of mixed rumen bacteria. J. Dairy Sci. 69:2941-2947.

32
Sudweek, E.M., Ely, O., Mertens, D.R. and Sisk. L.R. 1981. Assessing minimum amounts and forms of roughages in ruminant diets: roughage value index system. J. Anim. Sci. 53:1406.
Suton, J.D. 1989. Altering milk composition by feeding. J. Dairy Sci. 72: 2801-2814.
Tafaj, M., Kolaneci, V., Junck, B., Maulbetsch, A, Steingass, H. and Drochner, W. 20005. Influence of fibre content and concentrate level on chewing activity, ruminal digestion, digesta passage rate and nutrient digestibility in dairy cows in late lactation. Asian-Aust. J. Anim. Sci.18:1116-1124.
Tafaj, M., Junck, V. Maulbetsch, A., Steingass, H., Piepo, H.P. and Drochner, W. 2004. Digesta characteristics of dorsal, middle and ventral rumen of cows fed with different hay qualities and concentrate levels. Arch. Anim. Nutr. 58: 325-342.
Thomas, G.J. 1960. Metabolism of soluble carbohydrates of grasses in the rumen of sheep. J. Agric.Sci. 54:360-372.
Thomas, P.C. and Chamberlin, D.G. 1984. Manipulation of milk composition to meet market needs. In: Haresign, W. and Cole, D.J.A. (ed). Recent Advances in Animal Nutrition. pp. 219-243. Butterworths, London.
Thomas, P.C and Rook, A.J.F. 1981. Manipulation of rumen fermentation. In: Haresign, W. and Cole, D.J.A (eds) Recent Developments in Ruminant Nutrition. Butterworths, London, pp. 157-183.
Tomoko, O., Nonaka, K., Kume, S. and Nakui, T. 2004. Effects of forage type on particle size distribution of ruminal digesta and faeces of non-lactatting cows fed high quality forage. J. Livestock Prod. Sci. 91:107-115.
Ulyatt, M.J., Baldwin, R.L. and Koong, L. J. 1976. The basis of nutritive value- A modelling approach. Proc. N. Z. Soc. Anim. Prod. 36:140.
Ulyatt, M.J., Dellow, D.W., John, A., Reid, C.S.W. and Waghorn, G.C.1986. Contribution of chewing during eating and rumination to the clearance of digesta from the ruminoreticulum. In: Milligan, L.P., Grovum, W.L. and Dobson, A.(eds). Control of Digestion and Metabolism in Ruminants. Prentice-Hall, Englewood Cliffs, New Jersey, pp. 498-515.
Van Soest, P. J.1982. Nutritional Ecology of Ruminants. O and B Books Incoporated, Corvallis, Oregon.
Van Soest, P.J. and Robertsson, J.B. 1994. Systems of analysis for evaluating fibrous feeds. In: Stanrdization of Anlytical Methodology in Feeds In: Pigden, W.J., Balch, C.C. and Graham, M. (eds.), pp.49-60. International Research Development Center, Ottawa, Canada.
Varga, G.A. and Kolver, E.S. 1997. Microbial and animal limitations to fibre digestion and utilisation. J. Nutr.127:819-823.
Varga,G.A. 2003.Can manure evaluation diagnose areas for improvement in ration formulation, management and health. .In: Djurhälso och Utfodringskonferens, pp. 33-36.19-21 Augusti. Kalmar, Sweden. Svensk Mjölk, Eskilstuna. En liknande artikel finns även på: http://www.das.psu.edu/dcn/catnut/PDF/manure.pdf
Vogel, G. 1996. Rumensin efficacy; A review of large pen research trials. In: Scientific Update on Rumensin/Tylan/Micotil for the Professional Feedlot Consultant. pp B1-B10. Elanco Anim. Health, Indianapolis, IN.

33
Waghorn, G.C., Reid, C.S.W., Ulyatt, M.J. and John, A. 1986. Feed communition, particle composition and distribution between the four compartments of the stomach in sheep fed chaffed lucerne hay at two feeding frequencies and intakes levels. J. Agric. Sci., Cambr. 106:287-296.
Waldo, D.R., Smith, L.W., Cox, E.L.,Weinland, B.T. and Lucas, Jr, L.H. 1971. Logarithmic normal distribution for description of sieved forage materials. J. Dairy Sci. 54:1456.
Welch, J.G. and Smith A.M. 1969. Influence of forage quality on rumination time in sheep. J. Dairy.Sci. 28:813.
Welch, J.G. and Smith, A.M. 1970. Forage quality and rumination time in cattle. J. Dairy Sci. 53:797.
Welch, J.G. and Hooper, A.P. 1988. Ingestion of feed and water. In: Church, D. C. (ed.). The ruminant animal. Digestive physiology and nutrition. 2th ed. Prentice Hall, Englewood Cliffs, New Jersey.
Weimer, P.J., Waghorn, G.C., Odi, C.L. and Mertens, D.R. 1999. Effect of diet on populations of three species of ruminal cellulotic bacteria in lactating dairy cows. J. Dairy Sci. 82:122-134.
Weiss, W.P. and Shockey, W.L. 1991.Value of orchardgrass and alfalfa silages fed with varying amounts of concentrates to dairy cows. J. Dairy Sci. 74:1933.
Weston, R.H. and Hogan, J.P. 1967. The digestion of chopped and ground roughages by sheep.1. The movement of digesta through the stomach. Austr. J. Agric. Res. 18: 789-801.
Weston, R.H., Lindsay, J.R., Peter, D.W. and Buscall, D.J. 1989. Factors limiting the intake of feed by sheep. Comparisons of voluntary feed consumption and various transactions in the alimentary tract between lambs and sheep fed roughage diets. Austr. J. Agric. Res. 40:625-642.
Williams, A.G. and Coleman, G.S. 1997. The rumen protozoa. In: Hobson, P.N. and Stewart, C.S. (eds.) The Rumen Microbiological Ecosystem, 2nd edn. Blackie Academic and Professional, London, pp. 73-138.
Yang, W.Z. and Beauchemin, K.A. 2006. Effect of physically effective fibre on chewing activity and ruminal pH of dairy cows fed diets based on barley silage. J. Dairy Sci. 89:217-228.
Yang, W.Z. and Beauchemin, K.A. 2005. Effects of physically effective fibre on intake, chewing activity and ruminal acidosis for dairy cows fed diets based on corn silage. J. Dairy Sci. 88:2117-2129.
Yang, W.Z., Beachemin, K.A. and Rode, L.M. 2001a. Effects of grain processing, forage to concentrate ratio, and forage particle size on rumen PH and digestion in dairy cows. J. Dairy Sci. 84:2203-2216.
Yang, C.J.M. and Varga, G.A. 1993. The effect of continuous ruminal dosing with diotyl sodium sulphosuccinate on ruminal and metabolic characteristics of lactating cows. Br. J. Nutr. 69:397-408.
Zebeli, Q.M., Tafaj, M., Steingass, H. Metzler, B. and Drochner, W. 2006. Effect of physically effective fibre on digestive processes and milk fat content in early lactating dairy cows fed total mixed ration. J. Dairy Sci. 89: 651-668.

34
35
Faecal characteristics and production of early-lactation dairy cows fed diets differing in forage source
A. Mgbeahuruike*, E. Nadeau*, T. Eriksson† and P. Nørgaard‡
*Department of Animal Environment and Health, Swedish University of
Agricultural Sciences, P.O. Box 234, SE-532 23 Skara, Sweden
†Kungsängen Research Center, Department of Animal Nutrition and Management, Swedish University of Agricultural Sciences, SE-75323 Uppsala, Sweden
‡Division of Nutrition, Department of Basic Animal and Veterinary Sciences, Faculty of Life Sciences, University of Copenhagen, Groennegaardsvej 3, 1870
Fredriksberg, Denmark
Abstract
Effects of feeding grass-clover silage alone or in combination with another forage source on faecal characteristics and production of early-lactation dairy cows were studied in 26 herds comprising cows of Swedish Red and Swedish Holstein breeds. The study also involved investigations of potential correlations among dietary, production and faecal variables. Nine herds used grass-clover silage (GCS) as the sole forage, eight herds used GCS combined with whole crop cereal silage (WCCS), four herds used GCS combined with whole-crop maize silage (MS) and five herds used GCS combined with ensiled pressed beet pulp (EPBP). The chemical composition of forages, nutrient contents of the diets and the formulated intakes were registered. Data were analysed by ANOVA using the GLM procedure of SAS (2001) with herd as the experimental unit. Visit was treated as repeated measure on a herd level. Because no significant treatment by visit interactions were found, data were analyzed as a mean over the two visits. Because breed and housing system did not have significant effects on any of the variables studied, they were not used as covariates in the model. Pearson partial correlation coefficients, with consideration to treatment effects, were estimated among dietary, production and faecal variables on a herd level basis (n=26) using the CORR procedure of SAS. Cows fed GCS alone or GCS combined with EPBP tended to have a higher yield of energy-corrected milk (ECM) than cows fed WCCS (P=0.059). For cows fed EPBP in addition to GCS, the higher ECM yield can be related to their higher formulated DM intake (P=0.033). Cows fed GCS combined with MS or WCCS had a higher faecal NDF concentration in dry matter than cows fed GCS alone or in combination with EPBP (P=0.034). The higher faecal NDF concentration in cows fed GCS and MS was associated
36
with the improved faecal consistency score value by cows fed this diet (P=0.016). Increased formulated starch intake from concentrate and diet increased the number of long faecal particles (r=0.439* and r=0.390†, respectively). Increased formulated DM intake of forage was associated with decreased faecal DM concentration (r=-0.541**) whereas increasing formulated DM intake of concentrate increased faecal DM concentration (r=0.631**). The strong positive linear correlation between number of grain kernels in the faeces and faecal starch concentration could be used as a tool to predict faecal starch content (r=0.827***).
Keywords: Dairy Cow, Faeces, Particle Size, Forages

37
Introduction
Dairy diets are formulated to achieve high intake and productivity by balancing fibre and non-fibre carbohydrates with the protein needs of the cow (McCullough, 1973; Weiss and Shockey, 1991). A low forage to concentrate ratio in dairy diets may decrease feed efficiency and increase the risk of digestive disorders (Nocek, 1997). Evaluating the faecal characteristics of dairy cows provides information about the general health, rumen fermentation and digestive functions of the cows. A low intake of dietary physically effective neutral detergent fibre (pеNDF) may compromise the function of the ruminal mat of longer particles, rumen motoric and fibre digestion (Weidner and Grant, 1994; Mertens, 1997). Tafaj et al. (1999, 2001) observed that dairy cows fed a ground - (2.6 mm) vs. a long (28.7 mm) or a chopped (9.2 mm) hay, had impaired rumen conditions, including a 10-h shorter mean rumen retention time of digesta and a decreased fibre digestibility. According to Hall (2002), such feeding regimes may result in undesirable rumen fermentation and presence of undigested fibre particles in faeces. Failure of the rumen to selectively retain particles could result in passage of potentially digestible feed particles to the small and large intestine, which, consequently, might cause faeces with a loose and foamy consistency (Hall, 2006). On the contrary, a firm faeces characteristic indicates less hindgut fermentation and a low intake of dietary protein (Hall, 2006). The presence of large fibre particles and grain kernels in the faeces indicates a too short retention of feed particles in the ruminal system to achieve a proper particle size reduction during rumination and microbial degradation (Hall, 2002). This may be due to an inadequate intake of pеNDF for stimulating rumination and maintaining a normal ruminal pH (Mertens, 1997). Dairy cows in early lactation have a high intake and a high passage rate of feeds out of the rumen. Furthermore, cows in early lactation require high-energy diets to minimize body condition losses and to fulfil energy demands for high milk yields. A high grain intake is required to meet such energy demands. Nørgaard et al. (2004) observed that whole grain in the rumen combined with a starchy diet, low in peNDF, might reduce the capacity of the rumen system to retain large particles. However, increasing the amount of digestible fibre of hay or maize silage in dairy rations increases digesta stratification, particle breakdown in the rumen as well as digesta turnover, forage intake and fibre digestibility (Oba and Allen, 2000; Tafaj et al., 2005). Maize silage has a lower NDF concentration than grass silage because of its high grain concentration (Allen et al., 2003). In addition, maize silage and whole crop cereal silage contain NDF that has a lower rate of potential degradability in the rumen than grass

38
silage (Quirke et al., 2002; Bååth Jacobsson, 2005). Ensiled pressed beet pulp has a relatively high rate of fibre degradation in rumen because of its content of the soluble fibre fraction pectin (Mara et al., 1999; Micard and Thibault, 1999; Hartnell et al., 2005). The use of wet sieving technique for particle size determination in faeces has been documented in the works by Poppi et al. (1980), Kennedy (1984) and Ulyatt et al. (1986). The technique has a wide application and has given information on the dynamics involved in ruminal digesta flow and particle communition (Kennedy, 1984; Ulyatt et al., 1986). Kennedy and Poppi (1984) have tried to develop a dynamic model of ruminal digestion based on the critical particle theory. Particles leaving the reticulo-rumen are reduced to a certain size (critical particle size (CPS)) small enough to pass through the reticulo-omasal orifice (Kennedy and Poppi, 1984). There is limited information available on the effects of different forages on faecal characteristics in early-lactation dairy cows. In addition, information regarding relationships among dietary variables, production and faecal characteristics is limited. The aim of this study was to determine effects of diets, when differing in forage source, on faecal particle size, consistency, pH and nutrient content as well as on production, body condition and cleanliness of early-lactation dairy cows. The study also involved investigations of potential correlations among dietary, production and faecal variables.

39
Materials and Methods
Animals and management
This experiment was conducted in 29 dairy herds comprising cows of Swedish Red breed and Swedish Holstein breed (Table 1). The herds were visited twice; the first visit occurred during the period from November 2004 to January 2005 and the second visit occurred from February to April, 2005. The diets were changed between visits in two of the herds and one herd was visited only once, resulting in 26 herds for data analysis. Twenty-three of the herds were located in the south-west region and the remaining three were located in Uppland in the east of Sweden.
From each of the 26 herds, 5 cows in early lactation, less than 78 days in milk (37.4±17.9 DIM) were randomly selected at each visit, because cows at this stage of lactation are more prone to nutritional disorders. The number of milking cows and rolling herd average are shown in Table 1. The cows were milked twice a day and the milk yield and composition (fat, protein, and urea) were recorded once a month at the regular test day. The energy-corrected milk (ECM) was calculated according to Sjaunja et al. (1991).
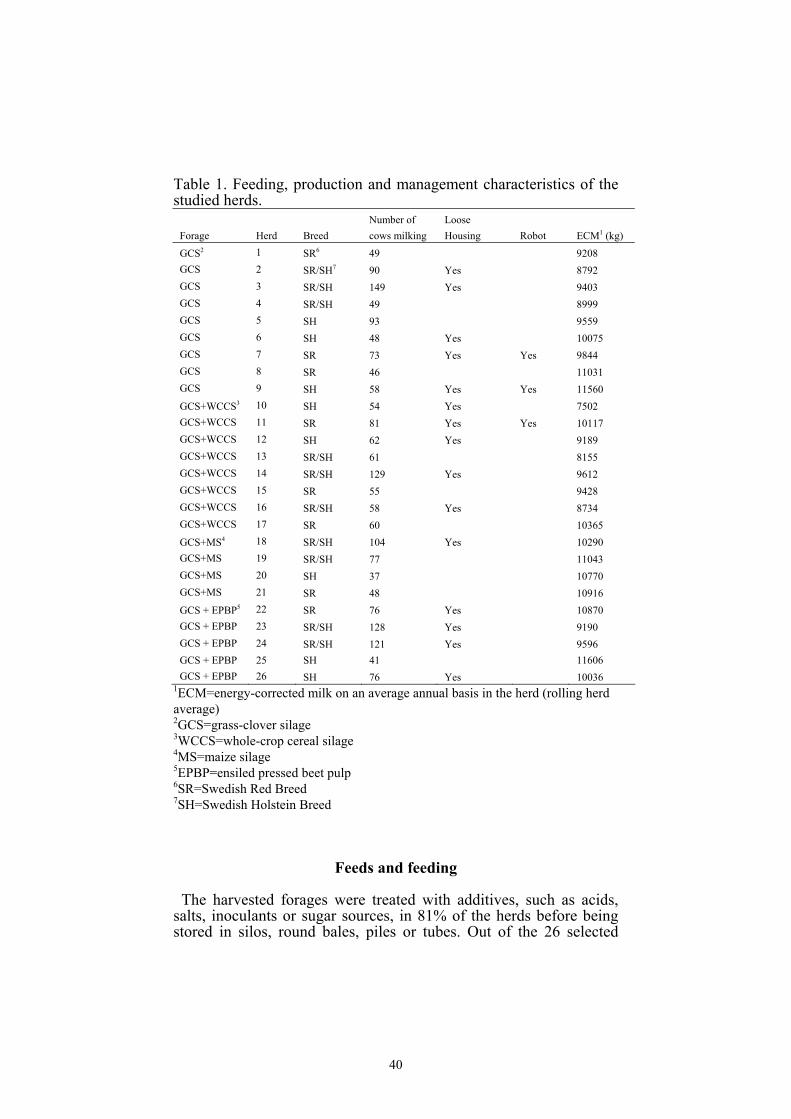
40
Table 1. Feeding, production and management characteristics of the studied herds.
Forage Herd Breed Number of cows milking
Loose Housing Robot ECM1 (kg)
GCS2 1 SR6 49 9208 GCS 2 SR/SH7 90 Yes 8792 GCS 3 SR/SH 149 Yes 9403 GCS 4 SR/SH 49 8999 GCS 5 SH 93 9559 GCS 6 SH 48 Yes 10075 GCS 7 SR 73 Yes Yes 9844 GCS 8 SR 46 11031 GCS 9 SH 58 Yes Yes 11560 GCS+WCCS3 10 SH 54 Yes 7502 GCS+WCCS 11 SR 81 Yes Yes 10117 GCS+WCCS 12 SH 62 Yes 9189 GCS+WCCS 13 SR/SH 61 8155 GCS+WCCS 14 SR/SH 129 Yes 9612 GCS+WCCS 15 SR 55 9428 GCS+WCCS 16 SR/SH 58 Yes 8734 GCS+WCCS 17 SR 60 10365 GCS+MS4 18 SR/SH 104 Yes 10290 GCS+MS 19 SR/SH 77 11043 GCS+MS 20 SH 37 10770 GCS+MS 21 SR 48 10916 GCS + EPBP5 22 SR 76 Yes 10870 GCS + EPBP 23 SR/SH 128 Yes 9190 GCS + EPBP 24 SR/SH 121 Yes 9596 GCS + EPBP 25 SH 41 11606 GCS + EPBP 26 SH 76 Yes 10036
1ECM=energy-corrected milk on an average annual basis in the herd (rolling herd average) 2GCS=grass-clover silage 3WCCS=whole-crop cereal silage 4MS=maize silage 5EPBP=ensiled pressed beet pulp 6SR=Swedish Red Breed 7SH=Swedish Holstein Breed
Feeds and feeding
The harvested forages were treated with additives, such as acids, salts, inoculants or sugar sources, in 81% of the herds before being stored in silos, round bales, piles or tubes. Out of the 26 selected

41
herds, 9 herds were fed grass-clover silage as the sole forage, 8 herds were fed grass-clover silage and whole crop cereal silage, 4 herds were fed grass-clover silage and whole crop maize silage and 5 herds were fed grass-clover silage and ensiled pressed sugar beet pulp. The concentrates were fed either separately or mixed with forages to a mixed ration. Concentrates were complete feed or small grains and purchased protein concentrates or rapeseed, flaxseed, peas, rapeseed cake and field beans. Feeding strategies in the herds are shown in Table 2.
Registrations
During each of the two visits in a herd, herd level registrations were made for feed storage and quality as well as milk production. Chemical composition of the different forages fed is shown in Table 3. Whole-crop cereal silage consisted of barley, oats and wheat in pure stands or in mixtures with peas or field beans. Individual feed rations and milk production from 5 cows in early lactation were registered in all the herds visited. Feed rations used in the herds were reformulated according to milk yield registered from the latest monthly test day. Formulated intake, that is the expected feed intake according to milk yield, was registered (Table 4). Each of these 5 cows were checked for body condition scores (BCS) by visual observation and palpation according to Edmonson et al. (1984), cleanliness according to Cook (2002) and general health. The BCS was determined on a scale from 1 to 5 with a 0.5-unit precision, where 1 is extremely thin and 5 is excessively fat (Edmonson et al., 1984). Cleanliness of the cows was determined on a scale from 1 to 4, where 1 is completely clean and 4 represents dried manure covering legs, udder and tighs (Cook, 2002). General health of the cows was checked.
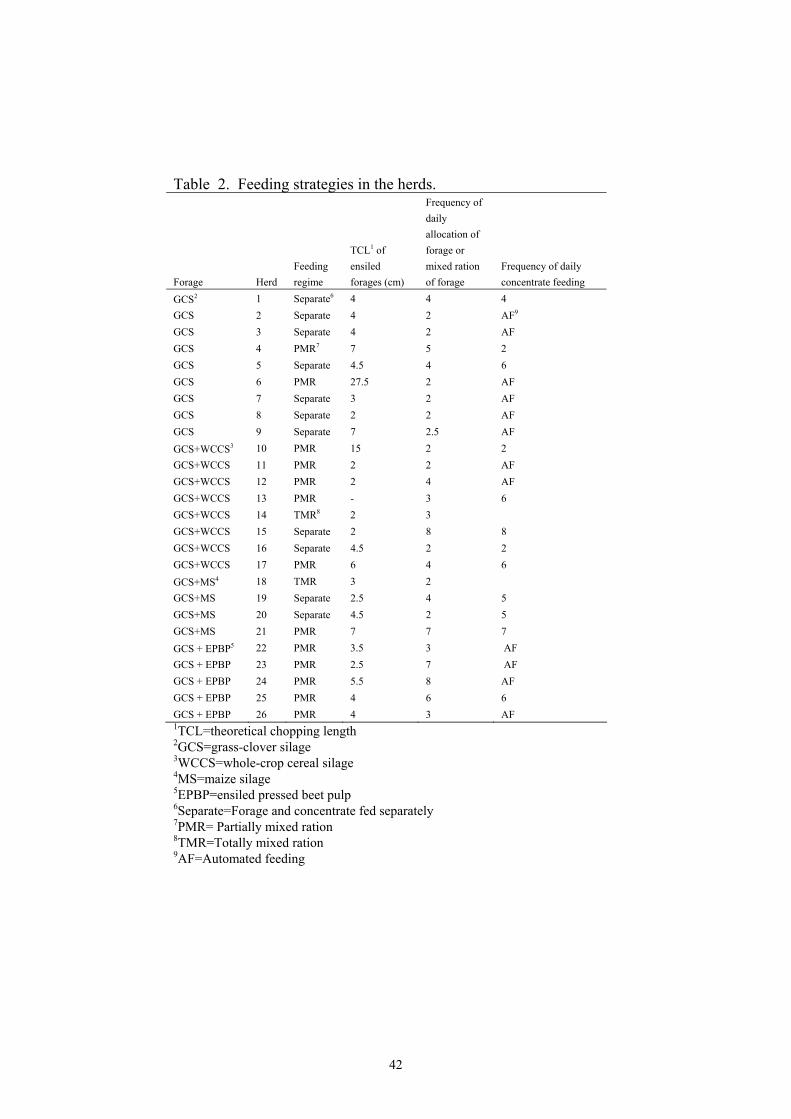
42
Table 2. Feeding strategies in the herds. Forage
Herd
Feeding regime
TCL1 of ensiled forages (cm)
Frequency of daily allocation of forage or mixed ration of forage
Frequency of daily concentrate feeding
GCS2 1 Separate6 4 4 4 GCS 2 Separate 4 2 AF9 GCS 3 Separate 4 2 AF GCS 4 PMR7 7 5 2 GCS 5 Separate 4.5 4 6 GCS 6 PMR 27.5 2 AF GCS 7 Separate 3 2 AF GCS 8 Separate 2 2 AF GCS 9 Separate 7 2.5 AF GCS+WCCS3 10 PMR 15 2 2 GCS+WCCS 11 PMR 2 2 AF GCS+WCCS 12 PMR 2 4 AF GCS+WCCS 13 PMR - 3 6 GCS+WCCS 14 TMR8 2 3 GCS+WCCS 15 Separate 2 8 8 GCS+WCCS 16 Separate 4.5 2 2 GCS+WCCS 17 PMR 6 4 6 GCS+MS4 18 TMR 3 2 GCS+MS 19 Separate 2.5 4 5 GCS+MS 20 Separate 4.5 2 5 GCS+MS 21 PMR 7 7 7 GCS + EPBP5 22 PMR 3.5 3 AF GCS + EPBP 23 PMR 2.5 7 AF GCS + EPBP 24 PMR 5.5 8 AF GCS + EPBP 25 PMR 4 6 6 GCS + EPBP 26 PMR 4 3 AF 1TCL=theoretical chopping length 2GCS=grass-clover silage 3WCCS=whole-crop cereal silage 4MS=maize silage 5EPBP=ensiled pressed beet pulp 6Separate=Forage and concentrate fed separately 7PMR= Partially mixed ration 8TMR=Totally mixed ration 9AF=Automated feeding
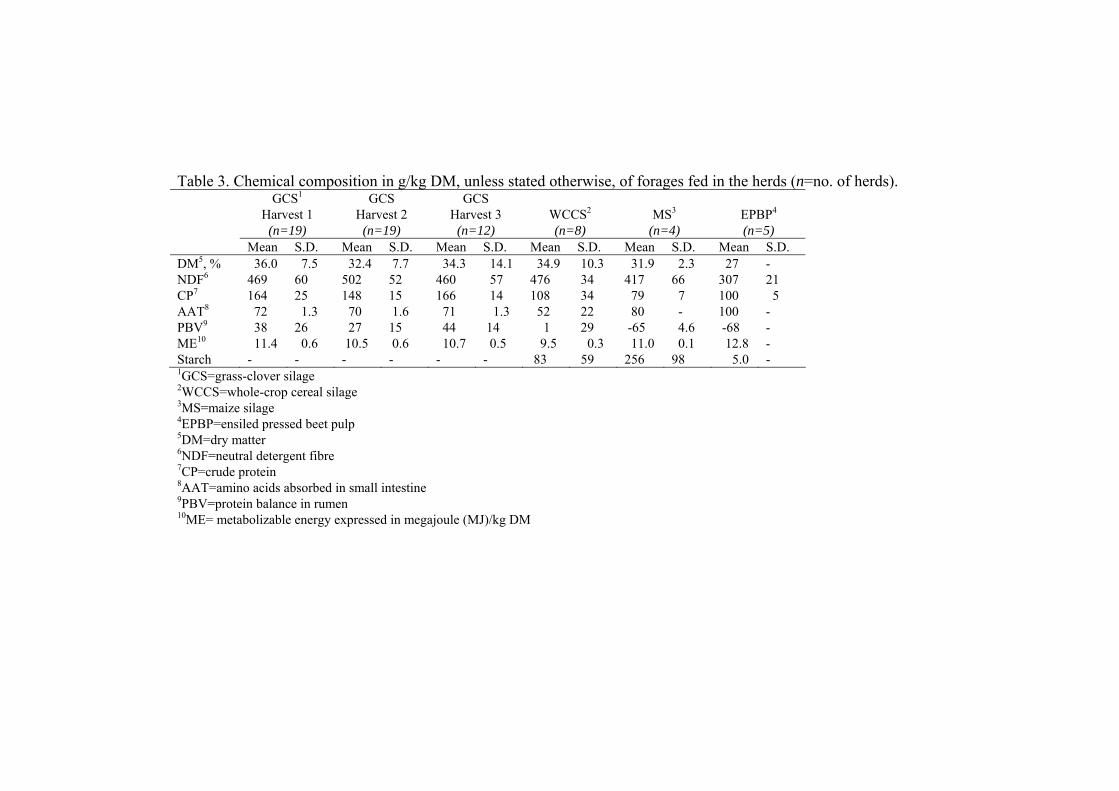
Table 3. Chemical composition in g/kg DM, unless stated otherwise, of forages fed in the herds (n=no. of herds). GCS1
Harvest 1 (n=19)
GCS Harvest 2
(n=19)
GCS Harvest 3
(n=12)
WCCS2
(n=8)
MS3
(n=4)
EPBP4
(n=5) Mean S.D. Mean S.D. Mean S.D. Mean S.D. Mean S.D. Mean S.D. DM5, % 36.0 7.5 32.4 7.7 34.3 14.1 34.9 10.3 31.9 2.3 27 - NDF6 469 60 502 52 460 57 476 34 417 66 307 21 CP7 164 25 148 15 166 14 108 34 79 7 100 5 AAT8 72 1.3 70 1.6 71 1.3 52 22 80 - 100 - PBV9 38 26 27 15 44 14 1 29 -65 4.6 -68 - ME10 11.4 0.6 10.5 0.6 10.7 0.5 9.5 0.3 11.0 0.1 12.8 - Starch - - - - - - 83 59 256 98 5.0 - 1GCS=grass-clover silage 2WCCS=whole-crop cereal silage 3MS=maize silage 4EPBP=ensiled pressed beet pulp 5DM=dry matter 6NDF=neutral detergent fibre 7CP=crude protein 8AAT=amino acids absorbed in small intestine 9PBV=protein balance in rumen 10ME= metabolizable energy expressed in megajoule (MJ)/kg DM

Table 4. Formulated intakes of forages and concentrates fed to dairy cows in early lactation. Values are averaged over herds within treatment (n=no. of herds).
Treatment GCS1 (n=9)
GCS + WCCS2
(n=8) GCS + MS3
(n=4) GCS +EPBP4
(n=5)
Dietary Ingredient Mean S.D. Mean S.D. Mean S.D. Mean S.D. GCS, kg DM 10.0 2.4 8.0 1.9 6.7 1.0 8.0 0.9 WCCS, kg DM - - 2.8 1.5 - - - - MS, kg DM - - - - 3.4 0.4 - - EPBP, kg DM - - - - - - 4.1 2.1 Total forage, kg DM 10.0 2.4 10.8 2.1 10.1 0.8 10.0 1.5 Concentrate, kg DM 12.0 3.0 10.8 3.1 11.1 3.1 14.3 2.8 Forages, % of total feed 45.8 12.8 50.6 11.1 48.8 8.9 41.7 6.7 1GCS=grass-clover silage 2WCCS=whole-crop cereal silage 3MS=maize silage 4EPBP=ensiled pressed beet pulp

45
Nutrient concentrations of rations given to cows in early lactation are shown in Table 5. Table 5. Nutrient concentrations of the diets fed to dairy cows in early lactation. Values are averaged over herds within treatment (n=no. of herds).
Treatment GCS1
(n=9) GCS + WCCS2
(n=8) GCS + MS3
(n=4) GCS +EPBP4
(n=5) Nutrient Mean S.D. Mean S.D. Mean S.D. Mean S.D. CP5, g/kg DM 183 13 171 22 188 14 206 18 AAT6, g/MJ ME 7.8 0.7 7.5 1.1 8.1 0.6 8.7 1.3 PBV7, g/day 551 171 455 186 408 180 343 185 NDF8, g/kg DM 344 26 340 41 336 36 353 17 Starch, g/kg DM 160 38 174 44 186 31 146 30 ME9, MJ/kg DM 12.1 0.8 11.5 1.0 11.9 1.1 11.5 1.6 1GCS=grass-clover silage 2WCCS=whole-crop cereal silage 3MS=maize silage 4EPBP=ensiled pressed beet pulp 5CP=crude protein 6AAT =amino acids absorbed in the small intestine per megajoule (MJ) of metabolisable energy (ME) 7PBV=difference between the amount of rumen degradable protein and the amount of microbial protein synthesized in the rumen 8NDF=neutral detergent fibre. 9ME=metabolizable energy expressed in megajoule (MJ)/kg DM

Sample collection
Faecal samples were collected from each of the 5 cows in a bucket placed directly behind the rectum and the cows were allowed to drop the faeces at will. Consistency of the faeces was determined during the excretion as described by Zaaijer and Noordhuizen (2003) and modified by Steen (2004). The consistency was determined on a scale from 1 to 5 with 0.5-unit precision, where 1 represented runny faeces and 5 hard and dry faeces (Steen, 2004). Faecal colour was scored on a scale from 1 to 3 where 1 represented dark brown, 2 was brown and 3 was yellowish brown (Steen, 2004). Faecal pH was determined with litmus paper (pH range 6.4-8, Merck KgaA, Darmstadt, Germany). A composite faecal sample of 300-400 g from the 5 cows was collected and frozen for later analysis of contents of DM, neutral detergent fibre (NDF), and starch as well as particles size. In addition, samples of silages being fed to the herds at the time of the visits were taken for analysis of chemical composition if not already analysed by the farmer.
Chemical analysis
The DM content of the silage was determined at 60ºC for 24 h, whereas the DM content of faeces was determined at 55-60ºC for 48 h. The crude protein content of silage was determined as the total N concentration by the Kjeldahl technique in a Tecator Kjeltec Auto Sample 1035Analyser (Tecator Inc., Höganäs, Sweden). The NDF concentration of silage and faeces was determined according to Goering and Van Soest (1970), with the inclusion of NaSO4 after heat treatment of the ND solution, which followed amylase treatment. Whole-crop cereal silage and maize silage were analysed enzymatically for starch content, including maltodextrin, according to Larsson and Bengtsson (1983). The starch content of the faeces was analysed with the same method but without correction for free glucose because of its insignificant content in faeces. Amino acids absorbed in small intestine (AAT) and protein balance in rumen (PBV) were calculated from standards according to Madsen et al. (2005).
Wet sieving of faeces
Each composite faecal sample was put in a plastic bucket and mixed thoroughly with a spoon in order to distribute the particles evenly. A duplicated 100-g faecal sample was used for wet sieving of each composite sample. Samples were wet sieved with a 2.36-mm sieve placed in a plastic container under running tap water until it was 2/3 full with water. The faeces were dissolved in the sieve, which was shaken gently with two hands to ensure that all the

47
particles were thoroughly washed. The dark green water resulting from the dirty samples was discarded and then the sample was rewashed 3 to 4 times until only the visible particles and kernels remained. The sieve with the particles on it was placed on a surface and particles >1cm were removed with an artery forceps. The length of the particles was measured to ensure their sizes being longer than 1 cm. The particles >1cm and the grain kernels were counted and their numbers were recorded. The counted particles and kernels were dried in an oven at 105˚C for 24 h. Weight of the dried particles were recorded. Average number of particles >1 cm and grain kernels, as well as average dry weights of long particles, were calculated from the duplicates of each faecal sample. Also the percentage of long particles (>1 cm) on a dry weight basis was calculated for each duplicate and then averaged over the duplicates for each faecal sample.
Statistical analysis
Data from 26 herds were analysed by analysis of variance using the GLM procedure of SAS version 8.2 (2001) and herd as the experimental unit. Sources of variation in the model were forage treatments and visits. Visit was treated as a repeated measure on herd level. Because no significant treatment by visit interactions were found, data were analyzed as a mean over the two visits. Because breed and housing system did not have significant effects on any of the variables studied, they were not used as covariates in the model. Number of herds (n) per treatment were 9, 8, 4 and 5 for grass-clover silage, grass-clover silage + whole-crop cereal silage, grass-clover silage + maize silage and grass-clover silage + ensiled pressed beet pulp, respectively. When a significant F-value was detected at P<0.05, unless stated otherwise, significant differences among treatment means were tested by using a t-test (LSD) with a 95% confidence interval. Pearson partial correlation coefficients, with considerations to treatment effects, were estimated among dietary, production and faecal variables on a herd level basis (n=26) using the CORR procedure of SAS (2001). Linear correlations were declared significant at P<0.05 and tendencies to significant correlations were discussed at P<0.10. Data describing diet composition averaged over herds within treatment are shown as means and standard deviations (S.D.).

48

49
Results
Feed intake, milk production and faecal characteristics
Cows fed grass-clover silage combined with ensiled pressed beet pulp had higher formulated DM and NDF intakes than cows fed the other dietary treatments (Table 6). Furthermore, cows fed grass-clover silage combined with ensiled pressed beet pulp had a higher formulated intake of amino acids absorbed in the small intestine than cows fed whole-crop cereal silage in combination with grass-clover silage (Table 6). No differences in the theoretical length of cut of the silages were found among the dietary treatments (data not shown). Table 6. Formulated daily intakes of dry matter (DM) and nutrients as well as feed efficiency of early-lactation dairy cows fed different dietary treatments. Values are averaged over herds within treatment (n=no. of herds).
Treatment Significance
GCS1 (n=9)
GCS + WCCS2 (n=8)
GCS + MS3
(n=4)
GCS + EPBP4 (n=5)
P-value
S.D.
Total DM, kg 22.0b 21.6b 21.2 b 24.3a 0.033 1.69 Total CP5, kg 4.03 3.71 3.99 4.38 0.111 0.46 Total AAT6, kg 2.07a,b 1.88b 2.08 a,b 2.40a 0.036 0.29 Total NDF7, kg 7.58b 7.30b 7.10b 8.58a 0.054 0.86 Total starch, kg 3.53 3.78 3.98 3.54 0.821 0.89 Total ME8, MJ 268 247 253 280 0.198 27.7 FC9, MJ ME/kg ECM10
7.00 7.19 6.50 6.88 0.561 0.78
FC, kg DM/kg ECM 0.57 0.62 0.54 0.59 0.176 0.64 a,bValues in the same row with different superscripts differ significantly at P<0.05. 1GCS=grass-clover silage 2WCCS=whole-crop cereal silage 3MS=maize silage 4EPBP=ensiled pressed beet pulp 5CP=crude protein 6AAT=amino acids absorbed in small intestine 7NDF=neutral detergent fibre 8ME=metabolizable energy expressed in megajoule (MJ) 9FC=feed conversion expressed in megajoule (MJ) metabolizable energy (ME)/kg ECM 10ECM=energy-corrected milk

50
Cows fed a diet containing grass-clover silage alone or in combination with ensiled pressed beet pulp tended to yield more milk in kg ECM and also yielded more milk protein compared to cows fed grass-clover silage combined with whole-crop cereal silage (Table 7). Yield of milk fat was higher for cows fed grass-clover silage combined with maize silage or fresh sugar beet pulp than for cows fed grass-clover silage combined with whole-crop cereal silage. Cows fed grass-clover silage combined with maize silage tended to have a higher content of milk urea than cows fed the other dietary treatments. Faecal consistency was improved when feeding a diet containing grass-clover silage combined with maize silage compared to feeding the other dietary treatments. Cows fed grass-clover silage combined with maize silage or whole-crop cereal silage had a higher faecal NDF content than cows fed grass-clover silage alone or in combination with ensiled pressed beet pulp (Table 7). There were no differences in the contents of long particles or grain in faeces from cows fed the different dietary treatments (Table 7). Cows were in good general health (data not shown).
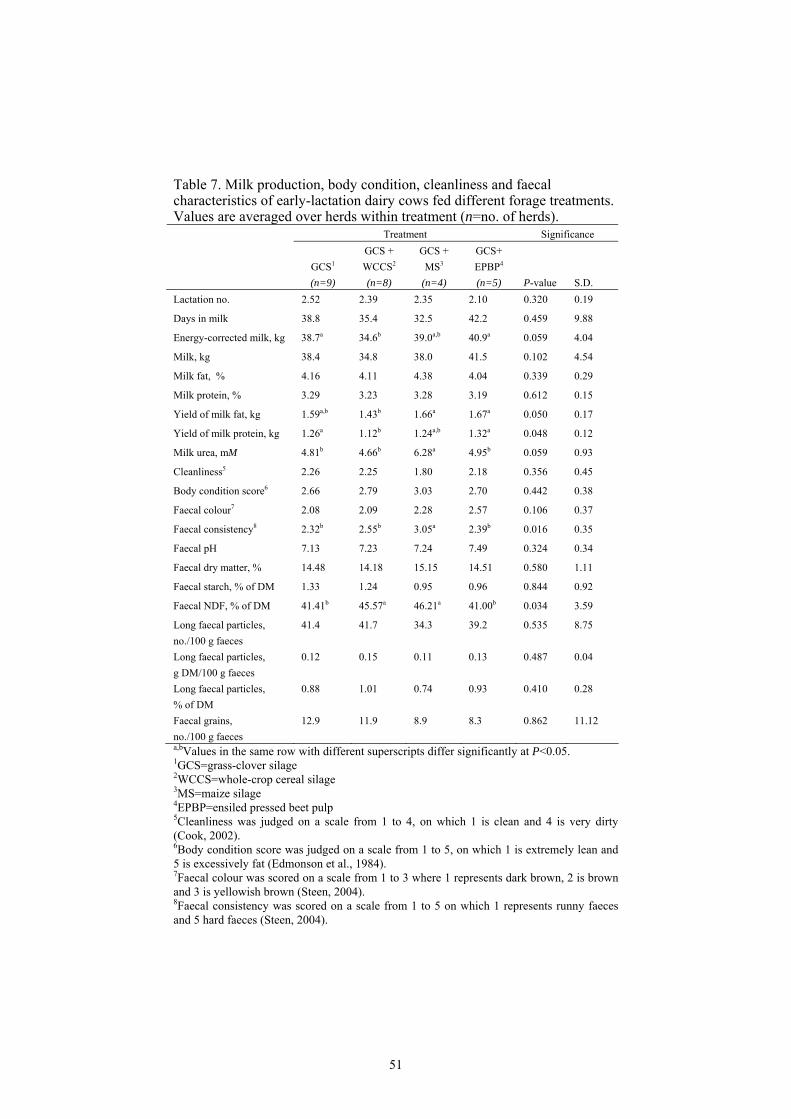
51
Table 7. Milk production, body condition, cleanliness and faecal characteristics of early-lactation dairy cows fed different forage treatments. Values are averaged over herds within treatment (n=no. of herds).
Treatment Significance
GCS1 (n=9)
GCS + WCCS2 (n=8)
GCS + MS3
(n=4)
GCS+ EPBP4 (n=5)
P-value
S.D.
Lactation no. 2.52 2.39 2.35 2.10 0.320 0.19
Days in milk 38.8 35.4 32.5 42.2 0.459 9.88
Energy-corrected milk, kg 38.7a 34.6b 39.0a,b 40.9a 0.059 4.04
Milk, kg 38.4 34.8 38.0 41.5 0.102 4.54
Milk fat, % 4.16 4.11 4.38 4.04 0.339 0.29
Milk protein, % 3.29 3.23 3.28 3.19 0.612 0.15
Yield of milk fat, kg 1.59a,b 1.43b 1.66a 1.67a 0.050 0.17
Yield of milk protein, kg 1.26a 1.12b 1.24a,b 1.32a 0.048 0.12
Milk urea, mM 4.81b 4.66b 6.28a 4.95b 0.059 0.93
Cleanliness5 2.26 2.25 1.80 2.18 0.356 0.45
Body condition score6 2.66 2.79 3.03 2.70 0.442 0.38
Faecal colour7 2.08 2.09 2.28 2.57 0.106 0.37
Faecal consistency8 2.32b 2.55b 3.05a 2.39b 0.016 0.35
Faecal pH 7.13 7.23 7.24 7.49 0.324 0.34
Faecal dry matter, % 14.48 14.18 15.15 14.51 0.580 1.11
Faecal starch, % of DM 1.33 1.24 0.95 0.96 0.844 0.92
Faecal NDF, % of DM 41.41b 45.57a 46.21a 41.00b 0.034 3.59
Long faecal particles, no./100 g faeces
41.4 41.7 34.3 39.2 0.535 8.75
Long faecal particles, g DM/100 g faeces
0.12 0.15 0.11 0.13 0.487 0.04
Long faecal particles, % of DM
0.88 1.01 0.74 0.93 0.410 0.28
Faecal grains, no./100 g faeces
12.9 11.9 8.9 8.3 0.862 11.12
a,bValues in the same row with different superscripts differ significantly at P<0.05. 1GCS=grass-clover silage 2WCCS=whole-crop cereal silage 3MS=maize silage 4EPBP=ensiled pressed beet pulp 5Cleanliness was judged on a scale from 1 to 4, on which 1 is clean and 4 is very dirty (Cook, 2002). 6Body condition score was judged on a scale from 1 to 5, on which 1 is extremely lean and 5 is excessively fat (Edmonson et al., 1984). 7Faecal colour was scored on a scale from 1 to 3 where 1 represents dark brown, 2 is brown and 3 is yellowish brown (Steen, 2004). 8Faecal consistency was scored on a scale from 1 to 5 on which 1 represents runny faeces and 5 hard faeces (Steen, 2004).

52
Relationships among diet, production and faecal characteristics
Increaed formulated intakes of total DM, CP, AAT and metabolizable energy, as well as DM intake of concentrate, increased milk production in kg of ECM (Table 8). Increased formulated intakes of total CP and AAT and increased dietary CP concentration increased milk urea concentration but increased formulated intake of forage NDF decreased milk urea concentration. Increased formulated forage DM intake resulted in cleaner cows whereas increased formulated intake of concentrate DM resulted in dirtier cows. Increased formulated intake of starch from diet and concentrate and increased dietary starch concentration increased the number of long particles in faeces (Table 8). Increased formulated intake of forage decreased faecal DM concentration whereas increased formulated intake of concentrate as well as total intakes of CP, AAT and metabolisable energy, as well as dietary CP concentration, increased faecal DM concentration. Increased formulated intake of forage NDF and increased dietary concentration of NDF increased faecal NDF concentration whereas increased formulated intake of starch from forage decreased faecal NDF concentration. Increased formulated intake of starch from forage increased faecal starch concentration whereas increased dietary NDF concentration decreased concentration of starch in faeces (Table 8).
Increased dietary NDF concentration increased faecal consistency but increased body condition score values decreased faecal consistency score values and faecal DM concentration (Table 9). Increased faecal DM concentration decreased the number of long particles in faeces. Increased number of grain in faeces increased faecal starch concentration but decreased number of long particles in faeces.
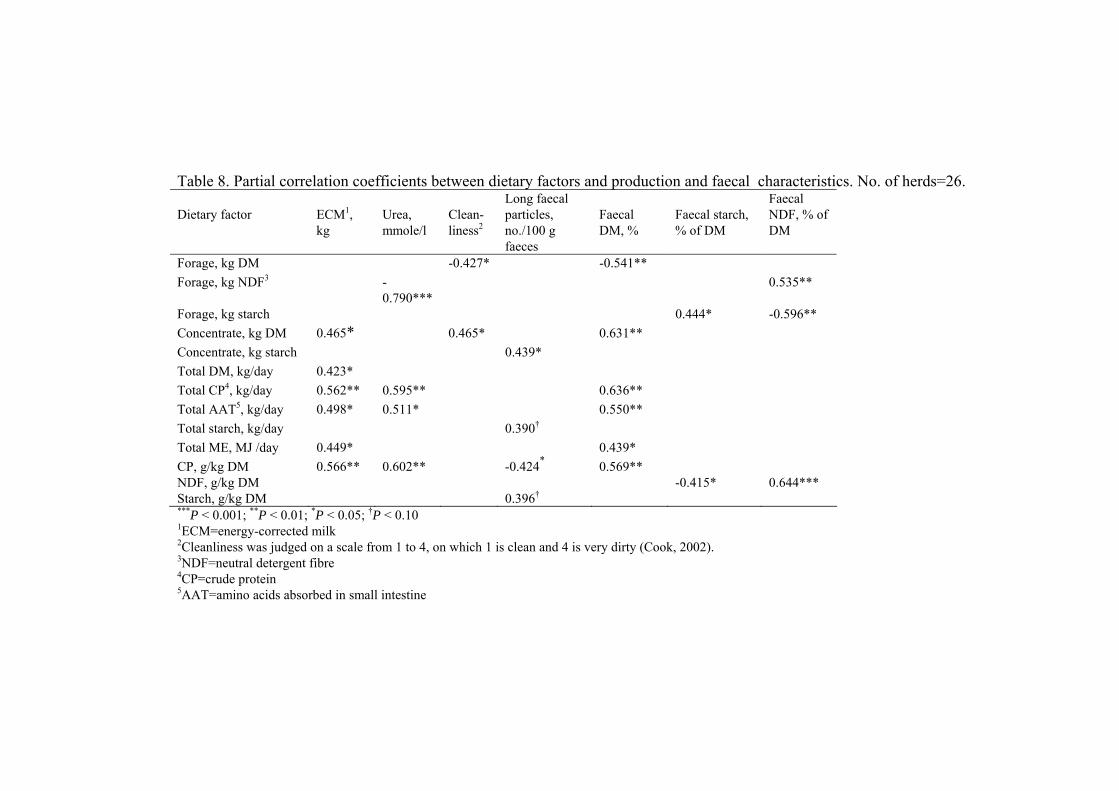
Table 8. Partial correlation coefficients between dietary factors and production and faecal characteristics. No. of herds=26. Dietary factor
ECM1, kg
Urea, mmole/l
Clean-liness2
Long faecal particles, no./100 g faeces
Faecal DM, %
Faecal starch, % of DM
Faecal NDF, % of DM
Forage, kg DM -0.427* -0.541** Forage, kg NDF3 -
0.790*** 0.535**
Forage, kg starch 0.444* -0.596** Concentrate, kg DM 0.465* 0.465* 0.631** Concentrate, kg starch 0.439* Total DM, kg/day 0.423* Total CP4, kg/day 0.562** 0.595** 0.636** Total AAT5, kg/day 0.498* 0.511* 0.550** Total starch, kg/day 0.390† Total ME, MJ /day 0.449* 0.439* CP, g/kg DM 0.566** 0.602** -0.424* 0.569** NDF, g/kg DM -0.415* 0.644*** Starch, g/kg DM 0.396† ***P < 0.001; **P < 0.01; *P < 0.05; †P < 0.10 1ECM=energy-corrected milk 2Cleanliness was judged on a scale from 1 to 4, on which 1 is clean and 4 is very dirty (Cook, 2002). 3NDF=neutral detergent fibre 4CP=crude protein 5AAT=amino acids absorbed in small intestine

Table 9. Partial correlation coefficients between diet, production and faecal characteristics. No. of herds=26.
Faecal Consistency1
Faecal DM, %
Long faecal particles, no./100 g faeces
Long faecal particles, % of DM
Faecal grains, no./100 g faeces
Faecal pH
NDF, g/kg DM 0.431* ECM2, kg/day 0.368† Milk, kg/day 0.367† Milk protein, % -0.496* Body condition score3 -0.667*** -0.417* Faecal DM, % 0.401† -0.442* -0.377† -0.370† Faecal starch, % of DM 0.370† 0.827*** Long faecal particles, no./100 g faeces
-0.464*
***P < 0.001; *P < 0.05; †P < 0.10 1Faecal consistency was scored on a scale from 1 to 5 on which 1 represents runny faeces and 5 hard faeces (Steen, 2004). 2ECM=energy-corrected milk. 3Body condition score was judged on a scale from 1 to 5, on which 1 is extremely lean and 5 is excessively fat (Edmonson et al., 1984). Means and variations of factors presented with partial correlation coefficients are shown in Table 10.

Table 10. Means and variations of factors presented with partial correlation coefficients in tables 8 and 9. No. of herds=26. Factor Mean S.D. Min Max Forage, kg DM 10.2 1.76 6.9 13.5 Forage, kg NDF1 4.7 0.74 3.7 5.9 Forage, kg starch 0.2 0.37 0 1.3 Concentrate, kg DM 12.0 2.58 5.5 16.4 Concentrate, kg starch 3.5 0.78 2.2 5.6 Total DM, kg 22.3 1.91 18.6 26.8 Total CP2, kg 4.0 0.50 2.4 4.8 Total AAT3, kg 2.1 0.33 1.2 2.6 Total starch, kg 3.7 0.82 2.2 5.6 Total energy, MJ 262 29.3 214 347 CP, g/kg DM 184 20.2 126 224 NDF, g/kg DM 344 27.9 264 405 Starch, g/kg DM 167 36.3 99 227 ECM4, kg/day 37.5 3.97 26.2 47.0 Milk, kg/day 37.5 4.59 27.4 50.6 Milk protein, % 3.25 0.15 3.00 3.52 Milk urea, mM 5.04 1.04 3.30 6.80 BCS5 2.78 0.37 2.00 3.60 Cleanliness6 2.18 0.46 1.35 3.00 Faecal consistency7 2.51 0.42 1.80 3.80 Faecal pH 7.26 0.34 6.61 7.75 Faecal DM, % 14.5 1.11 12.6 16.6 Faecal starch, % of DM 1.20 0.88 0.26 3.69 Faecal NDF, % of DM 43.5 4.05 37.1 52.3 Long faecal particles, no./100 g faeces
40.0 8.80 22.5 53.2
Long faecal particles, g DM/100 g faeces
0.130 0.039 0.049 0.206
Long faecal particles, % of DM
0.913 0.284 0.451 1.529
Faecal grain, no./100 g faeces
11.5 10.65 0.3 42.3
1NDF=neutral detergent fibre. 2CP=crude protein. 3AAT=amino acids absorbed in small intestine. 4ECM=energy-corrected milk. 5BCS=body condition score; was judged on a scale from 1 to 5, on which 1 is extremely lean and 5 is excessively fat (Edmonson et al., 1984). 6Cleanliness was judged on a scale from 1 to 4, on which 1 is clean and 4 is very dirty (Cook, 2002). 7Faecal consistency was scored on a scale from 1 to 5 on which 1 represents runny faeces and 5 hard faeces (Steen, 2004).

56

57
Discussion
Increased faecal consistency score values were observed in cows fed diets containing grass-clover silage combined with maize silage, which is an indication of improved nutrient utilization (Varga, 2003). However, no differences in feed conversion among cows fed different dietary treatments were found in this study. Maize silage and whole-crop cereal silage contain NDF that has a lower rate of potential degradability in the rumen than grass silage (Quirke et al., 2002; Bååth Jacobsson, 2005). This was associated with a higher faecal concentration of NDF in cows fed maize silage or whole-crop cereal silage in combination with grass-clover silage than in cows fed grass-clover silage only or in combination with ensiled pressed beet pulp. Ensiled pressed beet pulp contains the soluble fibre fraction pectin (160 g/kg DM) that is easily degraded in the rumen (Mara, 1999; Micard and Thibault, 1999; Hartnell et al., 2005). Reasons for why the higher faecal NDF concentration resulted in higher faecal consistency in cows fed maize silage but not in cows fed whole-crop cereal silage are unclear. The increased number of long faecal particles observed when both formulated intakes of starch from concentrate and starch from the total diet were increased or when the dietary starch concentration was increased, indicates a shortened ruminal residence time and a poor fermentation of the fibre particles due to a decrease in ruminal pΗ with a subsequent decrease in the number of fibre degrading micro-organisms (Hall, 2002; Varga, 2003; Nordqvist, 2006). Faecal DM concentration decreased with increased formulated intake of forage DM but increased with increased formulated intakes of concentrate DM, dietary CP, AAT and energy as well as with increased dietary CP concentration. Similar results were achieved by Ireland-Perry and Stallings (1992), who determined the relationships among faecal DM concentration and intakes of forage, concentrate and metabolizable energy. The decreased faecal DM concentration with increased forage intake but the increased faecal DM concentration with increased concentrate intake can be explained by the waterholding capacity by fibrous materials (Marynard et al., 1979). The increased faecal DM concentration with increased formulated intake of concentrate could be due to a simultaneous decrease in NDF concentration as there was a tendency to a negative correlation between faecal DM concentration and faecal pH in the present study. In this study, increased BCS values correlated with decreased faecal consistency score values indicating that increased fatness in cows might tend to result in a higher risk of imbalanced ruminal fermentation of nutrients. The positive correlation between formulated intake of forage NDF, dietary NDF concentration and
58
faecal NDF concentration is in agreement with results by Ireland-Perry and Stallings (1992). In the present study, increased number of grains in faeces correlated with increased faecal starch concentration but decreased the number of long particles in faeces. This could be an indication of feed sorting or poor processing of grain as have been reported by others (Hall, 2002). A large number of faecal grains could be an indication of unprocessed dietary cereal grain and/or insufficient dietary pеNDF content (Poppi et al., 1980; Hall, 2002). The higher yield of milk fat by cows fed grass-clover silage combined with ensiled pressed beet pulp than by cows fed grass-clover silage combined with whole-crop cereal silage probably was related to the higher content of soluble fibres, such as pectin, in ensiled pressed beet pulp (Ferris and Mayne, 1994). Mertens (1997) reported that milk fat concentration is closely correlated to the effective NDF (eNDF) of the diet. However, no significant correlation was observed in the present study between milk fat content and dietary NDF intake, possibly because milk fat percentage in early-lactation dairy cows is only partly sensitive to dietary composition (Allen, 1997). Cows fed grass-clover silage alone or grass-clover silage combined with ensiled pressed beet pulp tended to have a higher milk yield in kg ECM than cows fed whole-crop cereal silage (Table 7). For cows fed fresh sugar beet pulp in addition to grass-clover silage, the higher ECM yield can be related to their higher formulated DM intake (Tables 6 and 7). In addition, yield of milk protein was higher in cows fed grass-clover silage alone or in combination with ensiled pressed beet pulp than for cows fed grass-clover silage combined with whole-crop cereal silage. For cows fed ensiled pressed beet pulp, the higher milk protein yield can be explained by their higher formulated intake of AAT compared to cows fed grass-clover silage in combination with whole-crop cereal silage. The tendency to a higher milk urea content in cows fed grass-clover silage combined with maize silage compared to cows fed the other forage sources might be explained by an energy release during carbohydrate degradation of the maize silage needed for an efficient microbial protein synthesis (De Campeneere et al., 2005). De Campeneere et al. (2005) reported a much higher milk urea concentration in cows fed maize silage to 50 or 100% of the dietary forage portion compared to cows fed prewilted grass silage as the sole forage source. They concluded that the low milk urea concentration in the cows fed the grass silage was due to a high rate of urinary loss of urea because grass silage increased urinary volume (De Campeneere et al., 2005). However, the study by Campeneere et al. (2005) and the present study did not determine the urinary urea concentration from the cows. Based on results from different feeding trials with cows fed maize-silage based diets and cows fed grass-silage based diets, a

59
higher urinary clearance rate of urea is evident in grass-silage based diets (Faverdin and Vérité, 1998).
Conclusions Feeding maize silage in combination with grass-clover silage to dairy cows in early lactation improves faecal consistency compared to feeding grass-clover silage alone or in combination with whole-crop cereal silage or ensiled pressed beet pulp. However, daily milk yield in kg of ECM tended to be higher in cows fed grass-clover silage alone or combined with ensiled pressed beet pulp compared to cows fed whole-crop cereal silage in addition to grass-clover silage. Increasing formulated starch intake from concentrate or from the total diet was associated with an increased number of long faecal particles, which might be explained by digestive disorders. Feeding more forages decreases faecal DM concentration, whereas feeding more concentrate increases faecal DM concentration. The close positive linear relationship between the number of grain kernels in faeces and faecal starch concentration appears as a potentially easy and cheap practical diagnostic dietary tool on farm level.
Acknowledgements This experiment was financed by The Swedish Farmers’ Foundation for Agricultural Research, Skaraborgs läns Nötkreatursförsäkringsbolags stiftelse, The Swedish University of Agricultural Sciences and Faculty of Life Sciences, University of Copenhagen, Denmark. The authors are grateful to the participating farmers for their time and interest. The authors are also grateful to the technical assistance by Lars Johansson, Department of Animal Environment and Health, Swedish University of Agricultural Sciences, Skara, for visiting the herds, Anna Siekierska, Department of Basic Animal and Veterinary Sciences, University of Copenhagen, Denmark, for her guidance in the wet sieving technique and to MSc Maria Nordqvist for her work on the data registration. Statistical consultancy by Dr. Jan-Eric Englund, Division of Statistics, Department of Landscape Management and Horticultural Technology, Swedish University of Agricultural Sciences, Alnarp, is greatly acknowledged.

60
61
References
Allen, M.S. 1997. Relationship between fermentation acid production in the rumen and the requirements for physically effective fibre. J. Dairy Sci.80: 1447-1462.
Allen, M.S., Coors, J.G. and Roth, G.W. 2003. Corn silage. pp. 547-608. Silage Science and Technology, Agronomy No. 42. Buxton, D.R., Muck, R.E. and Harrison, J.H. (eds). ASA, CSSA, SSSA, Madison, Wisconsin, USA.
Bååth Jacobsson, S. 2005. Ruminal degradation profile of fibre in whole crop cereals – effects of plant species, stage of maturity and methodology. Student report 29. Swedish University of Agricultural Sciences, Department of Animal Environment and Health, Section of Production Systems. Skara, Sweden.
Beauchemin, K.A., Farr, B.I, Rode, L.M. and Schaalje, G.B. 1994. Effects of alfalfa silage chop length and supplementary long hay on chewing and milk production of dairy cows. J. Dairy Sci. 77:1326–1339.
Cook, N.B. 2002. The influence of barn design on dairy cow hygien, lameness and udder health. 35th Annual Convention Proceedings American Association of Bovine Practitioners Madison, Wisconsin. September 26-28. pp. 97-100.
De Campeneere, S., De Brabander, D.L. and Vanacker, J.M. 2005. Milk Urea concentration as affected by the roughage type offered to dairy cattle. J. Livestock Sci. 103(1-2):30-39.
Edmonson, A.J., Faver, T., Lean, I.J., Weaver, I.D. and Webster, G. 1984. Body condition scoring chart for Holstein dairy cows. J. Dairy Sci. 72(1):68-78.
Faverdin, P. and Vérité, R. 1998. Use of milk urea concentration as an indicator of protein nutrition and nitrogen losses in dairy cows, Resc. Rech. Rum. 5. pp. 209-212.
Goering, H.K. and Van Soest, P.J.1970. Forage fibre analyses (apparatus, reagents, procedures, and some applications). Agricultural Handbook, No. 379, Agricultural Research Services, USDA, US Gov. Printing Office, Washington, DC., pp.1-20.
Ferris, C.P. and Mayne, C.S. 1994. The effects of incorporating sugar-beet pulp with herbage at ensiling on silage fermentation, effluent output and in-silo losses. Grass and Forage Science 49(2):216-228.
Hall, M.B. 2002. Characteristics of manure: What do they mean? Department of Animal Sciences. University of Florida. http://www.das.psu.edu/dcn/WORKSHOP/dcn2002/docs/hallwksh2.pdf Accessed 20040726.
Hall, M.B. 2006. Tools for monitoring rumen function in dairy cows: Workshop on manure from dairy cattle, methods, interpretation and application in dairy herds. Brædstrup Inn, Copenhagen Denmark.
Hartnell, G.F. Hvelplund, T. and Weisbjerg, M.R. 2005. Nutrient digestibility in sheep fed diets containing Roundup Ready or conventional fodder beet, sugar beet and beet pulp. J. Anim. Sci. 83:400-407.
Ireland-Perry, R.L. and Stalling, C.C. 1992. Faecal consistency as related to dietary composition in lactating Holdtein cows. J. Dairy Sci. 76:1074-1082.
Jensen, C. Weisbjerg, M.R. Nørgaard, P. and Hvelplund, T. 2005. Effects of maize silage maturity on site of starch and NDF digestion in lactating dairy cows. J. Anim. Feed Sci. and Tech. 118:274-294.

62
Kennedy, P.M. 1984. Summary and conclusions from discussion. In: Kennedy, P.M. (ed) Techniques in Particles Size Analysis of Feed and Digesta in Ruminants. Canadian Society of Animal Science, Edmonton, Alberta, pp. 184-186.
Kennedy, P.M. and Poppi, D.P. 1984. Critical particle size in sheep and cattle. In: Kennedy, P.M. (ed.) Techniques in Particle Size Analysis of Feed and Digesta in Ruminants. Canadian Society of Animal Science.
Larssson, K. and Bengtsson, S. 1983. Bestämning av lätt tillgängliga kolhydrater i växtmaterial. Methods Report no 22. National Laboratory of Agricultural Chemistry, Uppsala, Sweden (in Swedish).
Madsen, J., Hvelplund, T., Weisbjerg, M.R., Bertilsson, J., Olsson, I., Spörndly, R., Harstad, O. M., Volden, H., Tuori, M., Varvikko, T., Huhtanen, P., Olafsson, B.L., 1995. The AAT/PBV protein evaluation system for ruminants. A revision. Norwegian J. Agric. Sci., Suppl. 19:5–37.
Mara, F.P., Coyle, J.E., Drennan, M.J., Young, P. and Caffrey, P.J. 1999. A comparison of digestibility of some concentrate feed ingredients in cattle and sheep. Anim, Feed Sci. Tech. 81:167-174.
Marynard, L.A., Loosli, J.K. Hintz, H.F. and Warmer, R.G. 1979. Animal Nutrition. 7th ed. McGraw Hill, New York. NY.
McCullough, M.E. 1973. Optimum Feeding of Dairy Animals.Univ. Press, Athens, GA.
Mertens, D.R. 1997. Creating a system for meeting the fibre requirement of dairy cows. J. Dairy Sci. 80:1463-1481.
Micard, V. and Thibault, J.F. 1999. Oxidative gelation of sugar- beet pectins: use of laccases and hydration properties of cross-linked pectins, Carbohydrate Polymers 39, pp. 265-273.
National Research Council. 2001. Nutrient Requirement of Dairy Cattle. 7th Rev. ed. Natl. Acad. Sci.Washington, DC.
Nocek, J.E. 1997. Bovine acidosis: Implcations on laminitis. J. Dairy Sci. 80: 1005-1028.
Nordqvist, M. 2006. Manure evaluation as a method to evaluate rumen function and feed utilization by dairy cows. Student report 59. Swedish University of Agricultural Sciences, Department of Animal Environment and Health, Section of Production Systems. Skara, Sweden.
Nørgaard, P., Husted, S. and Ranvig, R. 2004. Effect of supplementation with whole wheat or whole oat grains on the dimensions of faeces particles from lambs. J. Animal and Feed Sci., 13. Suppl. 1, p. 175-178.
Oba, M. and Allen. M.S . 2000. Effects of brown midrib3 mutation in corn silage on productivity of dairy cows fed two concentrates of dietary neutral detergent fibre: 2.Chewing activity. J. Dairy Sci. 83:1342-1349.
Poppi, D.P., Norton, B.W., Minson. D.J. and Hendricksen, R.E. 1980. The validity of the critical size theory for particles leaving the rumen. J. Agric. Sci.(Camb.) 94: 275.
Quirke, J. Rath, M . Caffrey, P.J. and O’Mara, F.P. 2002. Intake, digestibility, milk production and kinetics of digestion and passage for diets based on maize or grass silage fed to late lactation dairy cows. Livestock Production Science. 74(2): 113-124.

63
SAS, 2001. User’s Guide. Release 8.2 Edition. SAS Institute Inc. Cary, NC, USA. Shaver, R.D., Nytes, A.J., Satter, L.D., Jorgensen, N.A. 1988. Influence of feed
intake, forage physical form and forage fibre content on particle size of masticated forage, ruminal digesta, faece of dairy cows. J. Dairy Sci. 71:1566-1572.
Sjaunja, L.O. Baevre, L. Junkkarinen, L., Pedersen, J. and Setälä, J. 1990. A Nordic proposal for an energy corrected milk (ECM) formular. International Committee for Recording the Productivity of Milk Animals (ICRPMA) 27th session. 2-6 July, 1990. Paris, France.
Steen, K. 2004. Träckdiagnostik hos mjölkkor, Examensarbete 205. Institutionen för husdjurens utfodring och vård, Sveriges Lantbruksuniversitet, Uppsala, Sweden.
Tafaj, M., Kolaneci, V., Junck, B., Maulbetsch, A., Steingass, H. and Drochner, W. 2005. Influence of fibre content and concentrate level on chewing activity, ruminal digestion, digesta passage rate and nutrient digestibility in dairy cows in late lactation. Asian-Aust. J. Anim. Sci. 18:1116-1124.
Tafaj, M. Steingass, H. and Drochner, W. 2001. Influence of hay particle size at different concentrate and feeding levels on digestive processes and feed intake in ruminants. 2. Passage, digestibility and feed intake. Archives of Animal Nutrition- Archiv Fur Tierernahrung 53(3): 243-259.
Tafaj, M. Steingass, H., Susenbeth, A., Lang, G.U. and Drochner, W. 1999. Influence of hay particle size at different concentrate and feeding levels on digestive processes and feed intake in ruminants. Archives of Animal Nutrition- Archiv Fur Tierernahrung 52 (2): 167-184.
Ulyatt, M.J., Dellow, D.W., John, A., Reid, C.S.W. and Waghorn, G.C. 1986. Contribution of chewing during eating and rumination to the clearance of digesta from the ruminoreticulum. In: Milligan, L.P., Grovum, W.L. and Dobson, A. (eds) Control of Digestion and Metabolism in Ruminants. Prentice-Hall, Englewood Cliffs, New Jersey, pp. 498-515.
Van Soest, P.J. 1980. The limitations of ruminants. Page 78 in Proc. Cornell Nutri. Conf., Feed Manuf. Cornell Univ., Ithaca, NY.
Varga, G.A. 2003. Can manure evaluation diagnose areas for improvement in ration formulation, Management and health. In: Djurhälso och Utfodringskonferens.33-36.19-21 Augusti. Kalmar. Svensk Mjölk, Eskilstuna. En liknande artikelfinns även på: http://www.das.psu.edu/dcn/catnut/PDF/manure.pdf
Weidner, S.J. and Grant, R.J. 1994. Altered ruminal mat consistency by high percentages of soybean hull fed to lactating dairy cows. J. Dairy Sci. 77: 522-532.
Weiss, W.P. and Shockey, W.L. 1991. Value of orchardgrass and alfalfa silages fed with varying amounts of concentrates to dairy cows. J. Dairy Sci. 74:1933.
Welch, J.G. 1982. Rumination, particle size and passage from the rumen. J. Anim. Sci. 54:885-894.
Zaaijer, D. and Noordhuizen, J.T.M. 2003. A novel scoring system for monitoring the relationship between nutritional efficiency and fertility in dairy cows. Irish. J.Vet. Sci. 56: 145-151.

64
65
Brief Communication
Image analysis methodology for particle-size determination of washed faeces from dairy cows in
early lactation
A. Mgbeahuruike*, P. Nørgaard†, E. Nadeau*, T. Eriksson‡ and M. Nordqvist*
*Department of Animal Environment and Health, Swedish University of
Agricultural Sciences, P.O. Box 234, SE-532 23 Skara, Sweden
†Division of Nutrition, Department of Basic Animal and Veterinary Sciences, Faculty of Life Sciences, University of Copenhagen, Groennegaardsvej 3,
1870 Fredriksberg, Denmark ‡Kungsängen Research Center, Department of Animal Nutrition and Management,
Swedish University of Agricultural Sciences, SE-753 23 Uppsala, Sweden
Abstract
Image analysis is a technique for measuring the dimensions of particles in feed and washed faeces. The new technique has thrown more light on the concept of the critical particle size (CPS) and the dynamics involved in particle size reduction in the rumen. The method involves several steps which include washing of faeceal samples in nylon bags, freeze drying before dry sieving in a set of four sieves and scanning of the particles. In this study, faecal sample (FcWCS181) from cows fed grass clover silage and whole crop cereal silage was analysed using image analysis. The distribution of the particle length and width in the individual sieving fraction from the sample (FcWCS181) was described using a gamma distribution function. An accumulated distribution curve was also used to describe the different characteristics of the particle length and width. The median length and width values, as well as the 95% length and width values were estimated using a cumulative distribution function CDF in SAS. The distribution of the particle length in the sample (FcWCS181) showed that 95% of the particles were longer than 15 mm and this was taken to be the critical particle length (CPL), also 95% of the particles were thinner than 1.32 mm. The outstandingly high CPL value recorded in this study in sample (FcWCS181) was attributed to poor rumen capacity to retain large particles for sufficient fermentation to occur.
Keywords: Dairy Cow, Faeces, Particle Size, Image Analysis

66
67
Introduction
Image analysis is a new technique that characterizes particles according to length, width and area (Nørgaard et al., 2004). The technique also describes the various dimensions of the length and width of washed feed and faecal particles using terms such as mode, arithmetic means, geometric means and 95 percentile fractions (Nørgaard et al., 2004). The method has been used by some scholars to measure the different dimensions of sieved feed and faecal particles (Grenet et al., 1989). The findings by Grenet et al. (1989) showed that the precise assessment of particle shape, width, length and area could be ascertained by use of image analysis. Gamma distribution curves and cumulative distribution curves have been used to describe the length and width distribution of particles from feed (Nørgaard & Sehic 2003) and faeces samples Nørgaard et al. (2004). The 95 percentile length value reflects the capacity of the rumen system to retain large particles (Nørgaard et al., 2004). A flat curve indicates many long particles whereas a steep curve indicates many short particles in faeces (Nørgaard et al., 2004). Many small particles in faeces describe good rumen function (Nørgaard et al., 2004). However, many long particles in faeces indicate a diet that does not allow proper retention of large particles in the rumen (Nørgaard et al., 2004). Waldo et al. (1971) suggested the use of a log normal distribution to describe the length distribution of sieved digesta from the rumen and faeces of cows fed chopped and pelleted hay. However, data from image analysis has shown that forages are not fragmented into spherical or cuboidal shapes (Luginbuhl et al., 1988). As a result, there is likely a deviation from the log normal distribution of the lengths of sieved particles according to Waldo et al. (1971). Image analysis has also been used to explain the concept of the critical particle length (CPL; Nørgaard and Sechic, 2003). According to them, the CPL for cattle fed grass silage at maintenance level is 5 mm. The aim of this study was 1) to understand the principle involved in the use of image analysis to characterize particles from faeces of early lactating dairy cows fed grass-clover silage and whole-crop cereal silage plus concentrate and 2) to determine the critical particle length in the faeces of cows fed this same diet, using image analysis.
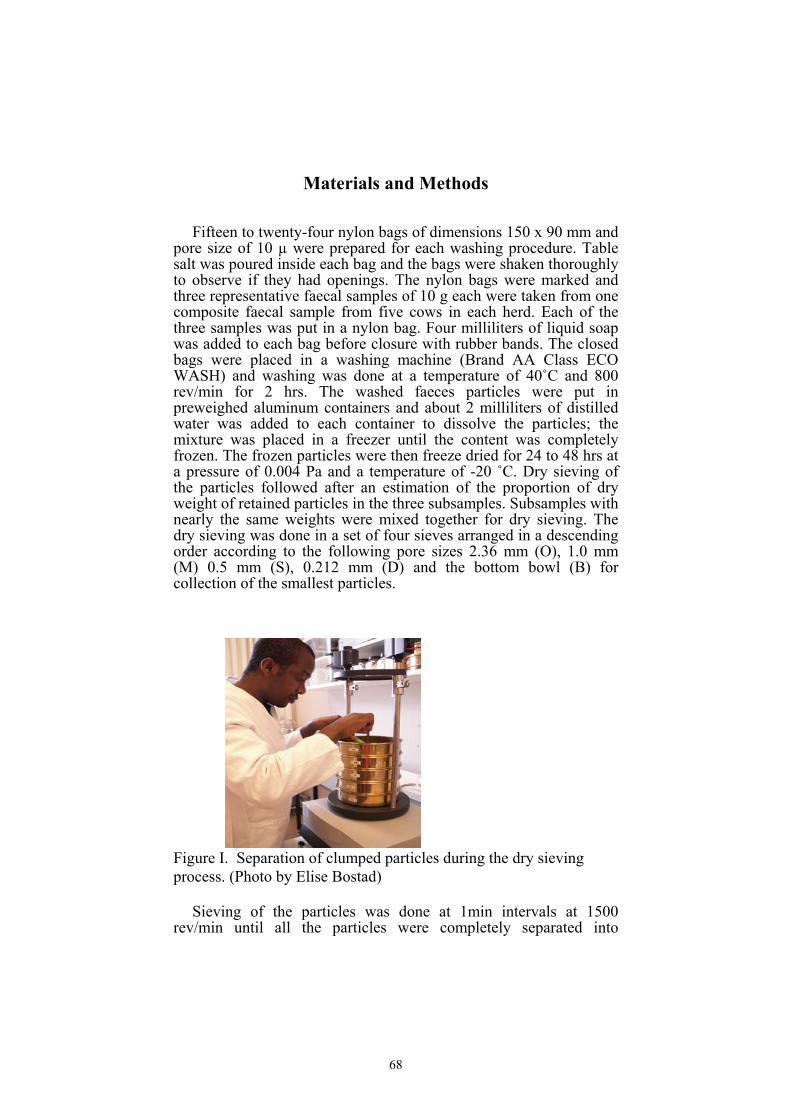
68
Materials and Methods
Fifteen to twenty-four nylon bags of dimensions 150 x 90 mm and pore size of 10 µ were prepared for each washing procedure. Table salt was poured inside each bag and the bags were shaken thoroughly to observe if they had openings. The nylon bags were marked and three representative faecal samples of 10 g each were taken from one composite faecal sample from five cows in each herd. Each of the three samples was put in a nylon bag. Four milliliters of liquid soap was added to each bag before closure with rubber bands. The closed bags were placed in a washing machine (Brand AA Class ECO WASH) and washing was done at a temperature of 40˚C and 800 rev/min for 2 hrs. The washed faeces particles were put in preweighed aluminum containers and about 2 milliliters of distilled water was added to each container to dissolve the particles; the mixture was placed in a freezer until the content was completely frozen. The frozen particles were then freeze dried for 24 to 48 hrs at a pressure of 0.004 Pa and a temperature of -20 ˚C. Dry sieving of the particles followed after an estimation of the proportion of dry weight of retained particles in the three subsamples. Subsamples with nearly the same weights were mixed together for dry sieving. The dry sieving was done in a set of four sieves arranged in a descending order according to the following pore sizes 2.36 mm (O), 1.0 mm (M) 0.5 mm (S), 0.212 mm (D) and the bottom bowl (B) for collection of the smallest particles.
Figure I. Separation of clumped particles during the dry sieving process. (Photo by Elise Bostad)
Sieving of the particles was done at 1min intervals at 1500 rev/min until all the particles were completely separated into
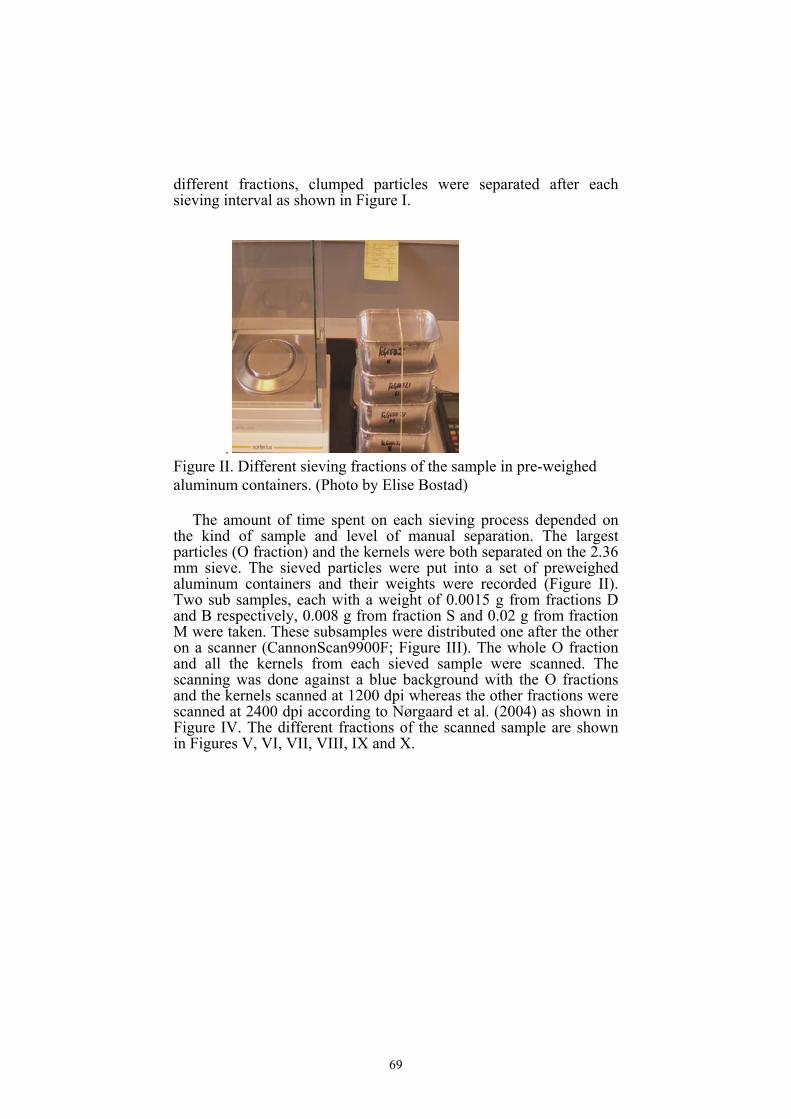
69
different fractions, clumped particles were separated after each sieving interval as shown in Figure I.
. Figure II. Different sieving fractions of the sample in pre-weighed aluminum containers. (Photo by Elise Bostad) The amount of time spent on each sieving process depended on the kind of sample and level of manual separation. The largest particles (O fraction) and the kernels were both separated on the 2.36 mm sieve. The sieved particles were put into a set of preweighed aluminum containers and their weights were recorded (Figure II). Two sub samples, each with a weight of 0.0015 g from fractions D and B respectively, 0.008 g from fraction S and 0.02 g from fraction M were taken. These subsamples were distributed one after the other on a scanner (CannonScan9900F; Figure III). The whole O fraction and all the kernels from each sieved sample were scanned. The scanning was done against a blue background with the O fractions and the kernels scanned at 1200 dpi whereas the other fractions were scanned at 2400 dpi according to Nørgaard et al. (2004) as shown in Figure IV. The different fractions of the scanned sample are shown in Figures V, VI, VII, VIII, IX and X.

70
Fig III. Separation of particles on scanner. Figure IV. Scanning of particles. particles (Photo by (Photo by Elise Bostad) Elise Bostad)
Figure V. Scanned kernels and particles.
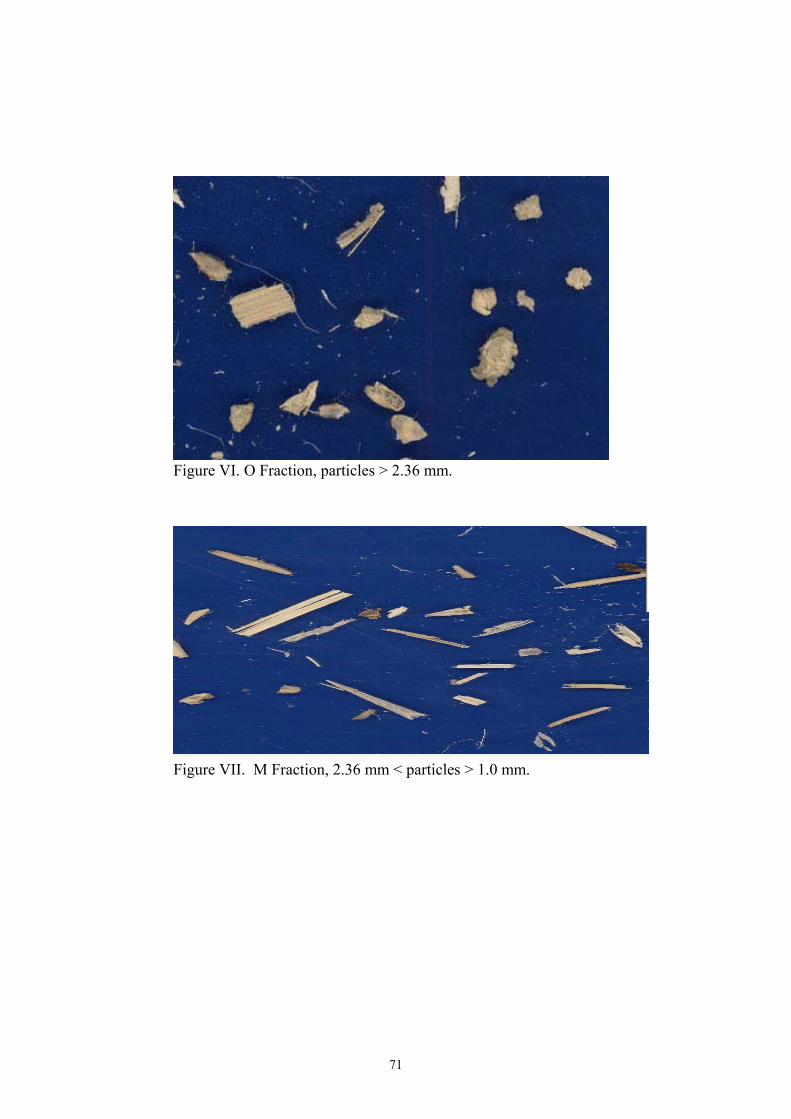
71
Figure VI. O Fraction, particles > 2.36 mm.
Figure VII. M Fraction, 2.36 mm < particles > 1.0 mm.
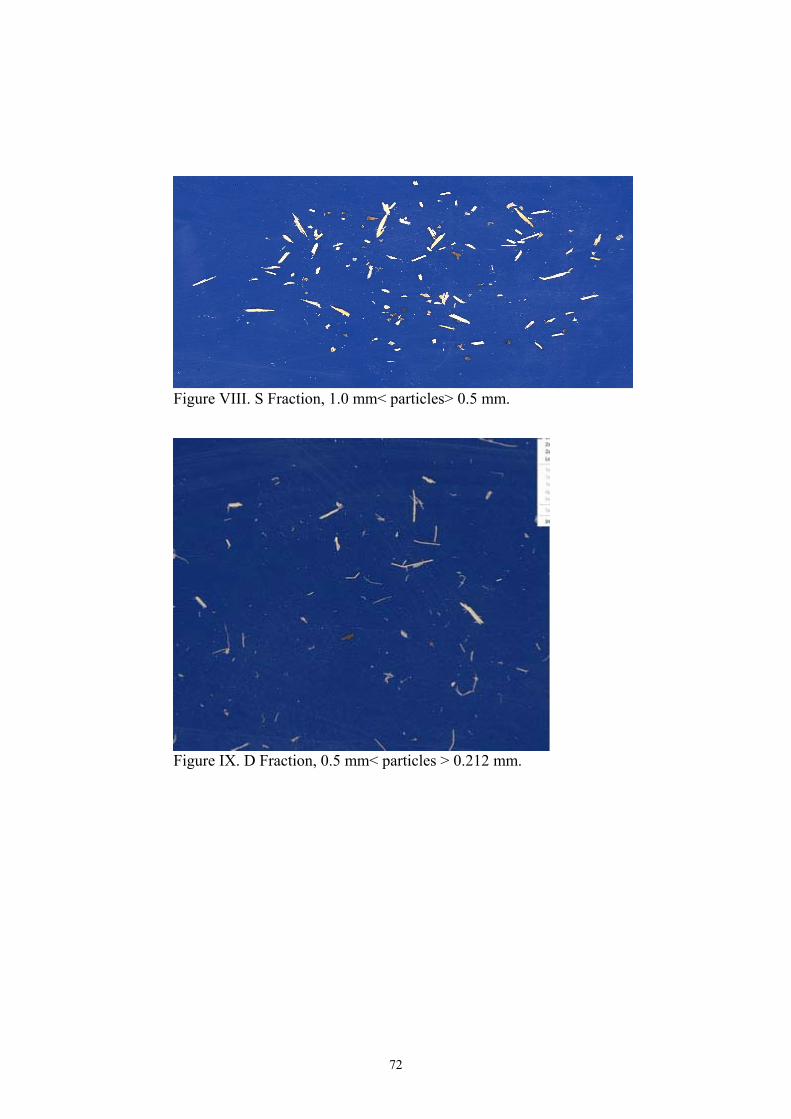
72
Figure VIII. S Fraction, 1.0 mm< particles> 0.5 mm.
Figure IX. D Fraction, 0.5 mm< particles > 0.212 mm.

73
Figure X. B Fraction, particles < 0.212 mm. The particles were separated with paint brush and forceps before scanning to avoid overlapping. Background segmentation was performed to enable the programme count and to identify the individual particles. The particles were identified individually and the areas (A), lengths (PL) and widths (PW) of the particles were measured by “Image Analysis”: Image ProbPlus version 5.1, Media Cybernatics, http://www.mediacy.com (Nørgaard and Bendixen, 2002). Descriptive terminologies, such as arithmetic mean particle length (APL), arithmetic mean particle width (APW), mode particle length (Mode_PL), mode particle width (Mode_PW), median particle length (MPL), median particle width (MPW), geometric mean particle length (GPL), geometric mean particle width (GPW) and 95 percentile fraction (Frac_95%) described the different dimensions of the length and width of the particles and these were estimated by using the principles described by Nørgaard, (2006a).The mass proportion of particles retained on an individual sieve (Massep) was also calculated according to Nørgaard (2006a). The arithmetic mean length (APL) and the arithmetic particle width (APW) were estimated by using the weighed A values in each sieving fraction and by using the sieve mass proportions. Also, a gamma distribution function γ (x, αi, ßi ) for PL and PW values from each sieving fraction was estimated by using the weighed A values. A composite distribution function (C= mM × γM + mS × γS1 + mB × γB…..) was used to estimate the overall distribution of the particles from the different sieving fractions. Estimation of the mode length

74
and width values was done by a stepwise (0.01 mm) identification of the maximum C(PL) and C(PW) values (Tables I and II). The median length and width as well as the 95% length and width values were estimated using cumulative distribution function CDF in SAS.
Results and Discussion
The length and width dimensions of the pre-washed and freeze-dried faecal particles from cows fed grass-clover silage and whole-crop cereal silage plus concentrates are shown in Tables I and II, respectively. The percentages of particles retained on the 1.0 mm (M), 0.5 mm (S), 0.212 mm (D) sieves and on the bottom bowl (B) were 10, 30, 36 and 24%, respectively (Tables I and II). The D sieve retained the highest proportion of particles (36%) compared to the other fractions M, S and B. The particles retained on the M sieve fraction accounted for the smallest proportion of particles (10%). There were no particles retained on the 2.36 mm sieve (O fraction) in the sample FcWCS181, as can be seen from the two tables. There was a large difference between the length and the width dimensions of the particles from faeces of cows fed grass clover silage and whole-crop cereal silage (Tables I and II). The APL, Mode_PL, MPL and GPL decreased as screen size decreased (Table I). Also, a similar result was obtained in the APW, Mode_PW, MPW and GPW (Table II). In this study, 95% of the length of washed faecal particles was shorter than 15 mm whereas 95% of the width of the particles was thinner than 1.32 mm (Tables I and II). Relating this finding to the sieve sizes, materials retained by each sieve was determined by the rate of separation of the clumped particles, their onward passage through the sieve openings and by the mesh size of the sieve situated immediately above the other. This agrees with the findings of Luginbuhl et al. (1988). Futhermore, the particle size is a factor of the mesh size (pore size) and the ability of the particles to pass through sieves of different pore sizes. Particles on each of the sieves have similar characteristics with regard to size and shape in the sample (FcWSC181). This suggests the manner in which particles are reduced in size during ingestive chewing, comminution and the method of positioning at the zone of escape from the rumen (Luginbuhl et al., 1988).

75
Table I. Characteristic length dimension values of washed and freeze-dried faeces particles from the individual sieving fractions in sample FcWCS181.
Descriptive terms and dimensions of the particle length (mm)
Sieving fraction
Pore size in sieve (mm)
Massepa
Mode_PLb MPLc GPLd APLe Frac_95%f
O 2.36 - - - - - M 1.0 0.10 4.87 9.15 8.12 11.17 27.54 S 0.5 0.30 1.24 2.20 1.82 2.67 6.42 D 0.212 0.36 0.13 0.91 0.78 1.18 3.14 B Bottom
bowl 0.24 0.13 0.37 0.32 0.49 1.31
Overall 1.00 0.20 1.58 1.27 3.33 14.81 aMassep=proportion of particles retained on the individual sieve bMode_PL= most frequent particle length cMPL= median particle length dGPL= geometric mean particle length eAPL= arithmetric mean particle length fFrac_95%= predicted 95 percentile value Table II. Characteristic dimensions of the width of washed faeces particles in the individual sieving fractions from sample FcWCS181.
Descriptive terms and dimensions of the particle width (mm)
Sieving fraction
Pore size in sieve (mm)
Massepa
Mode_PWb
MPWc
GPWd
APWe
Frac_95%f
O 2.36 - - - - - M 1.0 0.10 1.21 1.31 1.23 1.35 2.14 S 0.5 0.30 0.32 0.43 0.37 0.49 1.03 D 0.212 0.36 0.09 0.15 0.14 0.17 0.41 B Bottom
bowl 0.24 0.06 0.08 0.07 0.09 0.18
Overall 1.00 0.07 0.27 0.19 0.36 1.32 aMassep=proportion of particles retained on the individual sieve bMode_PW=most frequent particle width cMPW=median particle width dGPW=geometric mean particle width eAPW=arithmetric mean particle width fFrac_95%=predicted 95 percentile value Gamma distribution curves (density plots) and accumulated distribution curves to illustrate the distribution of the particle length and the particle width values in the individual sieving fractions are shown in Figures 1a and 2a (length) and in Figures 3a and 4a

76
(width), respectively. Also, curves showing the overall density distribution and the overall accumulated distribution of the particle length and width in faeces from the cows fed grass clover silage and whole crop cereal silage can be found in Figures 1b and 2b (length) and in Figures 3b and 4b (width), respectively. Among the five sieving fractions, the bottom bowl (B fraction) retained the largest number of short particles. This is illustrated by the sharp steep curve in Figure 1a. Ninty-five percent of the particles on the bottom bowl were shorter than 1.3 mm whereas the Frac_95% value for fractions M, S and D was 27, 6.4 and 3.1 mm (Table I). The Fra_95% value for the overall sample (FcWCS181) was estimated to be 15 mm which is 3 times longer than the CPL of 5 mm by Nørgaard and Sehic (2003). This could be due to poor retention of large particles in the rumen system. Nørgaard et al. (2004) attributed long particles that were longer than 5 mm in faeces to poor rumen fermentation. The long particles could also be related to the forage source and forage maturity stage Tomoko et al. (2004). Particle size reduction and passage of digesta from the rumen seemed to be due to the intrinsic factors associated with the forage (Tomoko et al., 2004).
Figure 1a. Density distribution of particle length (PL) in the individual sieving fractions (B, D S and M) and the overall (G) from cows fed grass-clover silage and whole-crop cereal silage supplemented with concentrates. Figure 1b shows the overall distribution of particle length values of washed faeces particles from sample FcWCS181. The most frequent particle length (Mode_PL) value was 0.2 mm. The arithmetic mean particle length value was 3.3 mm, which represents the APL value shown in Figure 1b. This value was above the CPS of 1.18 mm by Ulyatt et al. (1976). The geometric mean particle length (GPL) and the MPL values were 1.27 mm and 1.58 mm (dotted lines), respectively (Figure1b).
γi (x, αi, β ) distribution function for the individual sieving fractions
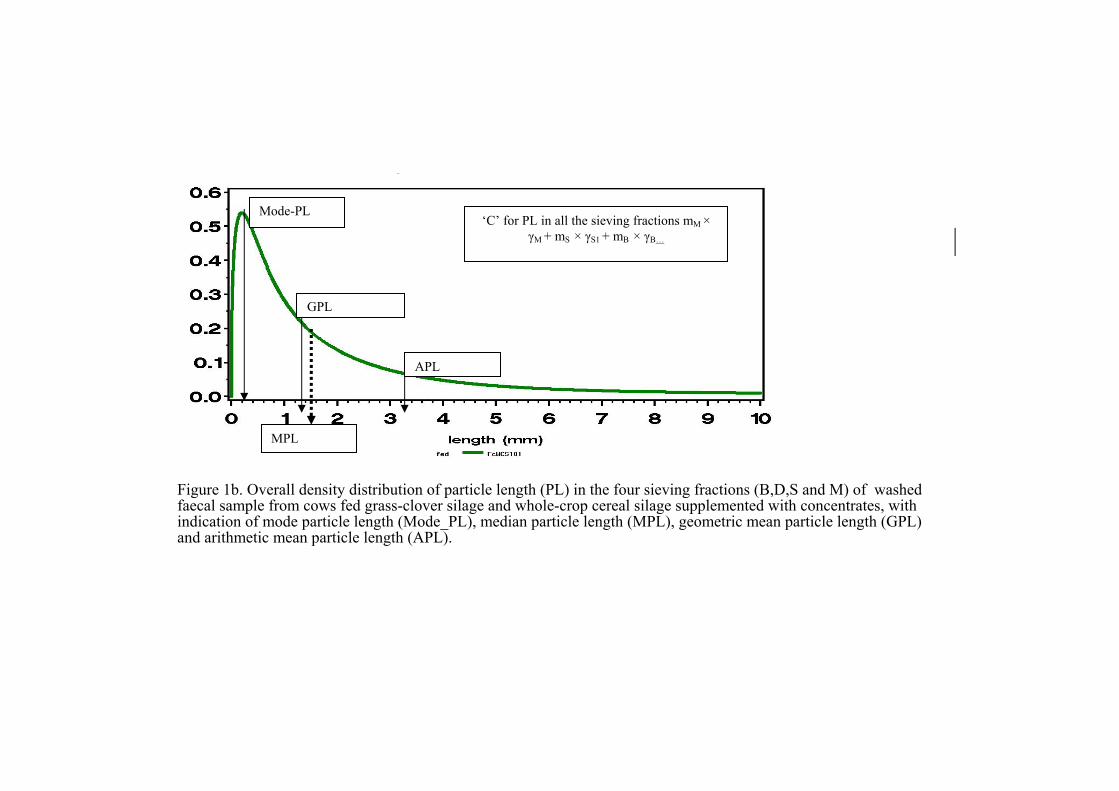
Figure 1b. Overall density distribution of particle length (PL) in the four sieving fractions (B,D,S and M) of washed faecal sample from cows fed grass-clover silage and whole-crop cereal silage supplemented with concentrates, with indication of mode particle length (Mode_PL), median particle length (MPL), geometric mean particle length (GPL) and arithmetic mean particle length (APL).
Mode-PL
APL
GPL
MPL
‘C’ for PL in all the sieving fractions mM × γM + mS × γS1 + mB × γB…

Figure 2a. Accumulated distribution of particle length (PL) in the individual sieving fractions (B, D, S and M) and the overall (G) distribution of washed faecal sample from cows fed grass-clover silage and whole-crop cereal silage supplemented with concentrates. An accumulated distribution of the particle length in the entire sample (FcWCS181) of the washed faeces particles shows that 95% of the particles (Frac_95%) were shorter than 15 mm whereas 5% of the particles were 15 mm and above (Figure 2b).

Figure 2b. Overall accumulated distribution of particle length (PL) of the four sieving fractions (B, D, S and M) of washed faecal sample from cows fed grass-clover silage and whole-crop cereal silage supplemented with concentrates, with indications of the median value (1.6 mm) and the 95 percentile fraction of the particle length (15 mm).
Frac_95% Median

Figure 3a. Density distribution of particle width (PW) in the individual sieving fractions (B, D, S and M) of washed faecal sample from cows fed grass-clover silage and whole-crop cereal silage supplemented with concentrates. Figure 3b shows the overall density distribution of the particle width (PW) values of washed faecal particles in sample FcWCS181. The distribution is left skewed with many thin and few wide particles. The most frequent mean width of particles (Mode-PW) was 0.07 mm illustrated by the peak of the steep curve. The APW value in the sample was 0.36 mm. The GPW value of the particle width was 0.19 mm whereas the MPW value was 0.27 mm.

Figure 3b. Overall density distribution of particle width (PW) of the four sieving fractions (B, D, S and M) of washed faecal sample from cows fed grass-clover silage and whole-crop cereal silage supplemented with concentrates with the indication of the mode particle width (Mode PW), median particle width (MPW), geometric mean particle width (GPW) and arithmetic mean particle width (APW).
Mode-PW
GPW
APW
MPW

Figure 4a. Accumulated distribution of particle width (PW) in the individual sieving fractions (B, D, S and M) and the overall (G) distribution of washed faecal sample from cows fed grass-clover silage and whole crop cereal silage supplemented with concentrates.

Figure 4b. Overall accumulated distribution of particle width (PW) in the in the four sieving fractions(B, D, S and M) of washed faecal sample from cows fed grass-clover silage and whole-crop cereal silage supplemented with concentrates with indication of the median value (0.27 mm) and the 95 percentile fraction of the particle width.
(Frac_95%) Median

Figure 4a and Table II show that 95 percent of all the particles on the bottom bowl (B fraction) were thinner than 0.18 mm (Frac_95%) value whereas the Frac_95% value of the particles in the D sieving fraction was 0.41 mm. Particles in the M and S sieving fractions appeared to be thicker than those of B and D with thicknesses of 2.0 and 1.0 mm (Frac_95%), respectively. Figure 4a shows the accumulated distribution of the particle width in each sieving fraction (Bottom bowl, D, S and M) and the overall (G) from sample FcWCS181. From the curve, 95% of the particles (Frac_95%) values from fractions B, D and S were below 1.32 mm in width whereas 5% of the particles had their width above 1.32 mm. Particles from fraction M appeared to deviate from the 95 percentile range. An overall accumulated distribution of the particle width showed that 95% of the particles (Frac_95%) in sample FcWCS181 were thinner than 1.5 mm in width (Figure 4b).
Conclusions
Image analysis can be used for measuring the characteristic, the length and width dimension values of washed faeces particles. The technique has successfully identified and characterized the different dimensions of the particles from faeces of cows fed grass-clover silage and whole-crop cereal silage plus concentrates. The method also can be used for identification of the 95 percentile length and width values, which in the sample used in the present study was higher than the CPL of 1.18 mm and 5 mm for cattle proposed by other researchers. The findings, therefore, suggest that, 95 percentile values might reflect the capacity of the rumen system to retain large particles.
Acknowledgements
The experiment was financed by The Swedish Farmers’ Foundation for Agricultural Research, Skaraborgs läns Nötkreatursförsäkringsbolags stiftelse, The Swedish University of Agricultural Sciences and The Faculty of Life Sciences, University of Copenhagen, Denmark. Anna Siekierska is acknowledged for her assistance in the laboratory work at the Department of Basic Animal and Veterinary Sciences, University of Copenhagen, Denmark.

85
References
Grenet, E., Luginbuhl, J.M., Barry, P., Pond, K.R. and Baumont, R. 1989. Image analysis of the size and morphological characteristics of ruminal digesta particles from sheep fed mixed grass hay. Canadian Society of Animal Science, Edmonton, Alberta, p. 170.
Luginbuhl. J.M., Pond. K.R., Burns J.C and Russ, J.C. 1988. Effects of ingestive mastication on particle dimensions and weight distribution of coastal bermudergrass hay fed to steers at four levels. J. Anim. Sci. 67(2) pp. 538-546.
Nørgaard, P. 2006a. Use of image anlysis for measuring particle size in feed, digesta and faeces. Workshop 3. Methods in studying particle size and digesta flow. In: Ruminant Physiology. Sejrsen, K., Hvelplund, T. and Nielsen, M.O. (ed.) Proceedings from the X International Symposium on Ruminant Physiology, Copenhagen, August 30th to September 4th, 2004, pp. 579-609.
Nørgaard, P., Husted, S. and Ranvig, H. 2004. Effect of supplementation with whole wheat or whole oat grains on the dimensions of faeces particles from lambs. Journal of Animal and Feed Sciences 13, suppl. 1:175-178.
Nørgaard, P. and Sechic, A. 2003. Particle size distribution in silage, boli, rumen content and faeces from cows fed grass silage with different theoretical chopping length. The Sixth International Symposium on the Nutrition of Herbivores. October 19-24, Mérida, South México. Tropical and Subtrop. Agro ecosystems. 3:457-460.
Tomoka, O., Nonaka, K., Kume, S. and Nakui, T. 2004. Effects of forage type on particle size distribution of ruminal digesta and faeces of non-lactating cows fed high quality forage. J. Livestock Prod. Sci. 91:107-115.
Ulyatt, M.J., Baldwin, R.L. and Koong, L.J. 1976. The basis of nutritive value – A modeling approach. Proc. N.Z. Soc. Anim. Prod. 36:140.
Waldo, D.R., Smith, L.W., Cox, E.L., Weinland, B.T. and Lucas, Jr, L.H. 1971. Logarithmic normal distribution for description of sieved forage materials. J. Dairy Sci. 54:1456.

86
87
Acknowledgements
The experiment was financed by The Swedish Farmers’ Foundation for Agricultural Research, Skaraborgs läns Nötkreatursförsäkringsbolags stiftelse, The Swedish University of Agricultural Sciences and The Faculty of Life Sciences, University of Copenhagen, Denmark. The study was lead by the Department of Animal Environment and Health, Swedish University of Agricultural Sciences, Skara, Sweden. The field study was conducted on dairy farms in Sweden but the laboratory work was done at the Department of Basic Veterinary and Animal Sciences, Faculty of Life Sciences, University of Copenhagen, Denmark. I wish to express sincere appreciation to my supervisors, Elisabet Nadeau for all her help and for having time to read through my work, Peder Nørgaard for his wisely advice and for imparting knowledge in me, Torsten Eriksson, who ushered me into Sweden on my arrival at the Arlanda Airport Sweden and helped me to settle. To my brothers, sisters, in-laws and their families who consistently have supported me with prayers throughout the period of this work. I also thank Prof. Fred. Asiegbu and family for his acedemic guidance. To my friends, Chuks Chilaka, Philip Obasi, Emeka Asiegbu and Cassmir Nwaishi, I say thank you for your encouragements. To Therese Rehn, Johani Karonen and family, my special Swedish friends who made my stay in Skara lively and showed so much concern about my well-being, I say thank you. I am also grateful to Marie Sundberg and Karin Östensson, the organisers of the International MSc programme in Veterinary Medicine, Anna Siekierska, the lab technician who assisted me in the laboratory work, Hanne H. Hansen for her inspiration and all the staff of the Department of Basic Animal and Veterinary Sciences, KVL, Denmark, Lars Johansson for conveying my luggage to Denmark and Jan Nilsson, the IT expert in the Department of Animal Environment and Health, SLU Skara, who was always there to assist in IT-related problems. Finally, I thank the head of the Department, Stefan Gunnarsson and all the staff of the Department of Animal Environment and Health, Swedish University of Agricultural Sciences SLU, Skara for their friendliness and support.