faculty productivity in the
TRANSCRIPT

FACULTY PRODUCTIVITY ISSUES INTHE
STATE UNIVERSITIES
SUBMITTED BY:
MGT OF AMERICA, INC.2123 CENTRE POINTE BOULEVARD
TALLAHASSEE, FLORIDA 32308

JOHN M. MCKAY TOM FEENEY President Speaker
THE FLORIDA LEGISLATURE
COUNCIL FOR EDUCATION POLICY,
RESEARCH AND IMPROVEMENT Philip Morgaman, Chairman
Akshay Desai, Vice Chairman Diane Leone Robert Taylor Bob McIntyre Pat Telson Edwin Moore Jacob Stuart
July 16, 2002 The Honorable Jeb Bush Governor Office of the Governor The Capitol Tallahassee, Florida 32399 Dear Governor Bush: The 2001 Legislature, in its General Appropriations Act, directed the Postsecondary Education Planning Commission to conduct the following assignment:
By December 1, 2001, the results of an evaluation of issues related to the productivity of faculty and other instructional positions and the impact on resource allocation at each university. The analysis shall include, but not be limited to:
(a) The use of resources budgeted for faculty positions for regular faculty, part-time faculty, graduate assistants and other purposes.
(b) An identification of the fiscal impact of the conversion of funds from the Salaries and Benefits expenditure category to support non-faculty instructional positions.
(c) An identification of the average number of courses taught, the average and median class size of these courses, and the number of student credit hours produced by level per faculty member and other instructional teaching positions.
(d) Purposes and outcomes of non-teaching assignments.
(e) An identification of the percent of lower level and upper level courses taught by faculty, by rank, and for other instructional positions, by type.
(f) Alternative approaches used in other states to address and to increase faculty productivity.
William B. Proctor, Executive Director Room 574 Claude Pepper Building, 111 W. Madison Street, Tallahassee, Florida 32399-1400
Telephone (850) 488-7894 FAX (850) 922-5388
September 27, 2002 Page 2
(g) An analysis of longitudinal trends in the productivity of faculty and other instructional positions.
(h) Additional information needed to support the zero-based budgeting process.
Study Context and Implications The 2001 Legislature assigned this study to the Postsecondary Education Planning Commission prior to the reorganization of the state’s education system, which began through the Florida Education Governance Reorganization Act of 2000 and continues in transition through a series of evolutionary changes enacted by the Legislature. As part of the restructuring, the Commission was reconstituted as the Council for Education Policy, Research and Improvement. It is important to note that the research and analysis conducted by the MGT of America, Inc. consultants (See Appendix A) was done within the long-standing, state education governance and funding structure, and the findings and recommendations in the report were developed within the context of the traditional higher education structures of the State University System. The United Faculty of Florida (UFF) provided testimony to the Council and a UFF position paper, not endorsed by the Council, appears in Appendix B. The Board of Regents, the governing board for the state universities has been abolished and a new Florida Board of Education now oversees a seamless, K-20 educational system designed to foster an integrated continuum of kindergarten through graduate school education for Florida’s citizens. In a coordinated fashion, the FBOE now governs the state universities, as one entity among all levels of public and independent education delivery in the State. Local boards of trustees now control the day-to-day operation of the individual universities. University Governance A primary tenet of the restructuring of the State’s education governance system is the devolution of decision-making and responsibility to the individual universities and their newly established boards of trustees. The university boards serve as the institution’s legal owner, with final authority to set policy and make critical decisions affecting each university, including financial and human resource matters. The local boards are able to hire and fire presidents, submit budget requests to the Florida Board of Education, create or eliminate undergraduate and graduate programs and set tuition rates within certain limits. In general, the boards focus on the efficient and effective use of resources at their institution. As the devolution process continues in the new governance structure, decisions relating to faculty workload and productivity will, increasingly, be made at the campus level. In many states, assessments of faculty activities involve input from current students, graduating students, alumni and employers, and have provided useful feedback on outcomes. In such a process, faculty productivity measures are included as part of an institution-wide assessment that evaluates all programs and services.

September 27, 2002 Page 3 Performance Measures At the state level, with the enactment of the education governance reorganization legislation, the future evaluation of faculty productivity issues will primarily occur through the implementation of K-20 Performance Plans. The legislation calls for the Florida Board of Education (FBOE) to establish accountability standards for existing legislative performance goals and to maintain an accountability system that measures student progress toward specific goals stated in the legislation. The FBOE has initiated a K-20 Accountability Project to direct the development of K-20 performance measures, standards, measurements, reporting and rewards and sanctions linked to performance. The FBOE appointed a statewide K-20 Accountability Advisory Council that is currently working to propose a list of measures at all education levels that relate to the system’s identified goals. At this point in its work, the Advisory Council is working with the measures of faculty productivity that have been identified by the Legislature as a part of its Performance-Based Program Budget. In the 2002-03 State budget, Agency Performance Measures and Standards include the following indices for the “Education and General Activities Program” that relate to faculty productivity:
• Externally generated research and training grant funds (federal, state, local, business and industry) per state-funded ranked faculty full-time equivalent.
• Average number of articles in Institute for Scientific Information Publication Count per
ranked faculty.
• Of the total instructional effort by level, the percent of effort provided by faculty: lower level, upper level and graduate.
• Of total faculty effort allocated for public service, the percent devoted to public schools.
Concurrently, the enacting legislation for CEPRI calls for the Council to “prepare and submit for approval by the Florida Board of Education a long-range performance plan for K-20 education in Florida, and annually review and recommend improvement in the implementation of the plan.” Educational goals, standards and accountability measures will be established for the assessment of the performance of institutions, faculty and students. Recommendations in this report on faculty productivity will provide a broad framework for the development of performance measures for faculty in the Council’s K-20 Performance Plan.
Implementation
The Council’s report: Faculty Productivity Issues in the State Universities will provide a framework to guide each university board in the development of a process, within the unique mission of the university that identifies faculty productivity benchmarks, adopts performance measures and determines their utility. Within the new K-20 education system, faculty work should focus on solving the critical State and national needs (Research), adding value to student learning and matriculation (Teaching), and being active contributors in local community and school issues (Public service). The Council recommends the following points to guide the implementation of the recommendations in this report:
• Faculty workload and productivity at each university should become a high priority of each of the university’s board of trustees.

September 27, 2002 Page 4
• While productivity measures for faculty work will continue to be a part of the Florida Board of Education’s K-20 Performance Plan and the Legislature’s performance-based budgeting guidelines, each university must identify performance measures that are consistent with and address its distinctive mission.
• Faculty productivity measures and institutional data compiled for these measures should
be the focus of universities and their boards of trustees with similar missions.
• Institutional goals and objectives identified by each board of trustees will enable the board to recommend performance benchmarks with the appropriate mix of teaching, research and service activities for its faculty. State universities that have a national doctoral/research mission will demonstrate a distinctive mix of faculty workload and instructional activity different from universities that have a regional teaching, economic development and research mission.
• Each state university, in conjunction with the Florida Board of Education, should
establish a list of national peer institutions. Peer analysis of faculty workload and instructional activity can provide a meaningful evaluation of faculty and institution productivity.
• Within the new K-20 education system, each state university should develop innovative
faculty productivity measures that identify distinctive benchmarks based on the institution’s unique mission, and should not be limited to existing national indices of faculty activity and instructional workload. The following are examples of faculty activity that will promote a seamless educational delivery system:
Research: - that addresses critical public school problems (low performing students and low
performing schools); - that addresses critical state and national needs; - that advances educational technology. Teaching and Advisement: - that produce success to graduation for college preparatory students, transfer
students, disadvantaged students; - that increase the supply of teachers in critical shortage areas; - that link academic major fields of study to workforce needs; - that increase the use of distance learning programs and services; - that promote professional and graduate education. Public Service: - that provides assistance to low performing elementary and secondary school
students and low performing schools; - that advances university, community college, public school partnerships; - that promotes economic development and partnering with business and industry.
In Florida’s restructured education system, the work of all levels of faculty will continue to be evaluated for effectiveness and efficiency. The primary evaluator of faculty workload and instructional activity at each university will be the university board of trustees. For this role to

September 27, 2002 Page 5 be consistent and comprehensive, the Council supports the need for a statewide, trustee-training program to be overseen by the Florida Board of Education. As directed in statute, CEPRI will be developing a long-range performance plan for K-20 education that will flow from the Council’s Master Plan for Florida Education and will include educational goals, standards and accountability measures for the performance of institutions, faculty and students. Recommendations contained in this report will assist the Council in the development of performance measures for faculty. Additionally, CEPRI has identified the “Status of the Teaching Profession” as one of five initial strategic imperatives needed for Florida’s K-20 Education System to achieve its goals. As part of its master planning work, a CEPRI Committee on the Teaching Profession has undertaken a review of how all levels of teaching personnel are trained, employed and compensated and advanced. These efforts will include an exploration of new paradigms for how university faculty are employed, compensated and evaluated. Very truly yours,
Philip E. Morgaman Chairman PM/jr/ca Enclosures Cc: Members, Council for Education Policy, Research, and Improvement

TABLE OF CONTENTS
1.0 INTRODUCTION................................................................................................. 1-1
1.1 Project Background and Understanding ................................................. 1-11.2 Objectives of Study................................................................................. 1-31.3 Methodology and Work Plan................................................................... 1-31.4 Overview of Florida’s State Universities.................................................. 1-41.5 Overview of Remaining Chapters ........................................................... 1-71.6 Acknowledgements................................................................................. 1-7
2.0 THE NATIONAL ISSUE OF FACULTY PRODUCTIVITY IN HIGHEREDUCATION....................................................................................................... 2-1
2.1 Introduction and Context......................................................................... 2-12.2 Issues in Defining and Measuring Faculty Productivity...............................2-22.3 Existing Research and Studies of Faculty
Workload and Productivity ...................................................................... 2-62.4 Facing the Challenges of Faculty Productivity ...................................... 2-132.5 Summary and Recommendations......................................................... 2-15
3.0 NATIONAL RESPONSES ON FACULTY PRODUCTIVITY FROM SELECTEDSTATE
SYSTEMS OF HIGHER EDUCATION................................................................ 3-1
3.1 Summaries of Interviews with SHEEOs.................................................. 3-23.2 Summary of Faculty Workload Policies/Measures Used in Other
Key States ............................................................................................ 3-14
4.0 FLORIDA'S PUBLIC UNIVERSITY RESPONSES TO MEASURINGFACULTY PRODUCTIVITY ...................................................................................... 4-1
4.1 Introduction ............................................................................................. 4-14.2 The 12-Hour Law ........................................................................................4-24.3 State University Accountability Reporting .............................................. 4-34.4 Institutional Approaches to the Issue of Faculty Productivity .................. 4-54.4 Summary of Institutional Approaches to Measuring Faculty Productivity........................................................................................... 4-23
5.0 ANALYSIS OF FACULTY PRODUCTIVITY ................................................................ 5-1
5.1 Introduction ............................................................................................. 5-1

5.2 An Analysis of Faculty Teaching Productivity .............................................5-45.3 Teaching Productivity in Selected Disciplines ...................................... 5-275.4 Purposes and Outcomes of Non-Teaching Assignments ..................... 5-365.5 Conclusions .......................................................................................... 5-43
6.0 POSITION CONVERSIONS ...................................................................................... 6-1
6.1 Overview of Funding System and Position Conversions ........................ 6-16.2 Expenditures by Program Component........................................................6-26.3 Expenditures by Appropriation Category ............................................. 6-126.4 Conclusions .......................................................................................... 6-18
7.0 CONCLUSIONS AND RECOMMENDATIONS................................................... 7-1
7.1 Summary of Key Issues Relating to Faculty Productivity ........................ 7-17.2 Overview of Faculty Productivity at Florida's Public Universities ................7-37.3 Overview of the Position Conversion Issue in Florida's
Public Universities ................................................................................. 7-57.4 Recommendations.................................................................................. 7-67.5 Future Issues in Faculty Productivity ...................................................... 7-7

MGT of America, Inc. Page 1-1
1.0 INTRODUCTION
The following report provides an analysis of the issue of faculty productivity from
both a national perspective and from a detailed examination of ten public universities in
Florida. Using detailed longitudinal data for the past ten academic years, as provided by
these universities and by the Division of Colleges and Universities, this legislatively
mandated report attempts to simplify, to the extent possible, the accounting of faculty
workload within the context of the unique mission and goals of each university.
1.1 Project Background and Understanding
Throughout the years, the issue of faculty productivity has continued to resurface
throughout American higher education. A number of factors contribute to the continuing
interest in this topic:
! Faculty salaries comprise the largest item in the budget of mostcolleges and universities, making overall institutional costs sensitiveto changes in faculty productivity.
! The nature of faculty work makes it difficult to monitor and is thussubject to misinterpretation.
! Higher education leaders have failed to communicate effectively withthe public regarding faculty productivity.
! Relatively few states have developed and maintained an effectivemethodology for regularly assessing and reporting faculty workloaddata.
! Pressures created from population growth, faltering economies,rising educational costs, and competition for state funding from otherpublic agencies and special interest groups continue to demandgreater efficiencies in service delivery.
The convergence of rapid enrollment growth and much slower growth in state revenues
has caused a need to examine issues related to the productivity of faculty in the state’s

Introduction
MGT of America, Inc. Page 1-2
ten public universities.1 To address this need, the following directive was included as
proviso language in the General Appropriations Act passed by the 2001 Florida
Legislature:
The Postsecondary Education Planning Commission, in consultationwith the State Board of Community Colleges, the Department ofEducation and the Board of Regents or their successors shall submit tothe Governor, the Speaker of the House of Representatives, and thePresident of the Senate, the following reports: . . . By December 1, 2001,the results of an evaluation of issues related to the productivity of facultyand other instructional positions and the impact on resource allocation ateach university. The analysis shall include, but not be limited to:
(a) The use of resources budgeted for faculty positions for regularfaculty, part-time faculty, graduate assistants and other purposes.
(b) An identification of the fiscal impact of the conversion of fundsfrom the Salaries and Benefits expenditure category to the OtherPersonal Services expenditure category to support non-facultyinstructional positions.
(c) An identification of the average number of courses taught, theaverage and median class size of these courses, and the numberof student credit hours produced by level per faculty member andother instructional teaching positions.
(d) Purposes and outcomes of non-teaching assignments.
(e) An identification of the percent of lower level and upper levelcourses taught by faculty, by rank, and for other instructionalpositions, by type.
(f) Alternative approaches used in other states to address and toincrease faculty productivity.
(g) An analysis of longitudinal trends in the productivity of facultyand other instructional positions.
(h) Additional information needed to support the zero-basedbudgeting process.
1 The 2001 Legislature established New College-USF as a freestanding institution effective July 1, 2001.Although New College has become the 11th public university in the state, no separate data on facultyproductivity for it are available for the period covered in the study. Instead, New College data are included inUSF numbers.

Introduction
MGT of America, Inc. Page 1-3
The Council for Education Policy Research and Improvement (CEPRI, formerly
PEPC) contracted with MGT of America to provide assistance in conducting this
assigned study of faculty productivity.
1.2 Objectives of Study
This study has five interrelated objectives:
1. to ensure a complete understanding of the current state of facultyworkload/productivity measurement and research;
2. to determine university workload policies and/or measures in place in Floridapublic universities in support of effective management of faculty resources;
3. to identify those workload policies and/or measures in place in other states thatwould likely be helpful in establishing guidelines for best practices;
4. to identify longitudinal trends in the productivity of state university faculty andother instructional positions; and
5. to evaluate trends in assigning faculty teaching, research, and serviceresponsibilities.
1.3 Methodology and Work Plan
MGT’s methodology and work plan included the following key components:
! to meet with Legislative and CEPRI representatives to gain a morecomplete understanding of the background of the study, findingsfrom prior analyses of related concerns, and specific expectations forthis current study;
! to compile and review reports on faculty productivity that have beenpublished over the past decade and to write a literature reviewfocusing on terms and concepts of productivity;
! to conduct a telephone survey of selected State Higher EducationExecutive Officers (SHEEO) to identify faculty productivity issues inother states;
! to develop a longitudinal database of faculty workload, as providedin information contained in the E&G budget, by institution, includingtrends in:

Introduction
MGT of America, Inc. Page 1-4
− the distribution of teaching and other academic assignments byrank, college, and department,
− position conversions,
− teaching load as measured by credit hours and course sections,and
− research and other nonteaching assignments.
! to analyze the initial database and identify areas for furtherinvestigation;
! to conduct telephone and on-campus interviews with universityprovosts to clarify existing data, discuss approaches to managingfaculty resources, and gain information on additional issues.
! to present periodic status reports to staff to coincide with the meetingschedule for the newly created Council for Education PolicyResearch and Improvement (CEPRI); and
! to prepare a draft final report, which specifically addresses eachstudy topic and is in a format suitable for incorporation into Council’sown report.
1.4 Overview of Florida’s State Universities
Prior to July 2001, Florida’s ten public universities comprised the State University
System of Florida and were governed by a 13 member Board of Regents. The role of the
Board was to serve as the statewide governing body for approving and implementing
university programs, missions, and fiscal operations in the most responsible manner for
Florida’s residents. In this capacity, budgets were developed and distributed to the
universities, and master and strategic plans and goals were established for the system
and individual universities.
Effective July 1, 2001, the Board of Regents was abolished and the Governor
appointed a separate Board of Trustees for each university. Although statutorily limited
in their ability to fully operate until the 2002 Legislature delegates additional authority to
them, Boards are responsible for overseeing the operations of their institution and for

Introduction
MGT of America, Inc. Page 1-5
establishing goals and objectives to which the institutions they oversee will aspire to
achieve.
There is currently a State University System Strategic Plan in place effective for
1998–2003. This document was created by the former Board of Regents. There is also
an overarching Master Plan for all of higher education prepared by the Postsecondary
Education Planning Commission, now the Council for Education Policy Research and
Improvement (CEPRI), effective for the same time period. Each of these five-year plans
addresses the important issue of identifying the distinctive mission of each institution and
focusing their resources on identified strengths and priorities. Both plans identify
increasing access to students as a top state priority.
The 1998–2003 State University System Strategic Plan notes that while the
missions of all universities encompass the three traditional roles of teaching, research,
and service, varying degrees of emphasis on the mix of these activities among faculty
members should be recognized. The Carnegie Commission on Policy Studies in Higher
Education developed a system to classify institutions according to mission focus in the
early 1970s that is used widely today. It is the framework in which institutional
distinctions in U.S. higher education are commonly described.
Six of the ten public state universities in Florida fall into a Doctoral/Research
category. University of Florida, Florida State University, University of South Florida, and
Florida International University awarded 50 or more doctoral degrees per year across at
least 15 disciplines, classifying them as Doctoral/Research – Extensive. Florida Atlantic
University and University of Central Florida awarded 20 or more doctoral degrees per
year, or at least ten doctoral degrees per year across three or more disciplines,
classifying them as Doctoral/Research – Intensive. The remaining four institutions
included in this study—Florida Agricultural and Mechanical University, Florida Gulf Coast

Introduction
MGT of America, Inc. Page 1-6
University, University of North Florida, and University of West Florida—are classified as
Master’s Colleges and Universities I, having awarded 40 or more master’s degrees per
year across three or more disciplines. A complete explanation of these categories is
included in Appendix 1A, the Carnegie Classification of Institutions of Higher Education.
One of the most relevant aspects of these classifications for purposes of reviewing
faculty productivity was noted by PEPC in its 1998 Master Plan Challenges and Choices
referenced above. With six of the ten universities classified as Doctoral, and the
remaining four as Master’s Colleges and Universities I, Florida’s university system “has
grown in mission and scope to be somewhat similar to the University of California
model.” What is missing in Florida are public four-year “teaching” institutions.
The advantages of a “state college system” for providing access versusa “research university model” are lower operating costs, increasedemphasis on faculty teaching, a primary focus on undergraduateeducation, and a limited institutional mission without doctoral programsor a heavy concentration on research.” (p. 8)
It is not being suggested that the ten public universities evaluated in this report are
generating insignificant or insufficient amounts of instructional contact hours and student
credit hours. However, for at least six of the institutions, research is both expected and
required for successful tenure within the academic community. As such, we would
expect to find lower teaching loads for tenure and tenure-earning faculty at universities
with significant research requirements, most notably those six institutions with the
Carnegie Classification of Doctoral, and somewhat higher instructional loads in Master’s
Colleges and Universities I. The highest teaching loads for tenure and tenure-earning
faculty would be expected in the “Baccalaureate Colleges."

Introduction
MGT of America, Inc. Page 1-7
1.5 Overview of Remaining Chapters
This report comprises six chapters, including this Chapter. The remaining chapters
are:
! Chapter 2.0 The National Issue of Faculty Productivity inHigher Education. This chapter provides a comprehensive literaturereview of faculty workload and productivity issues and provides acontext for defining and measuring its various component parts.
! Chapter 3.0 Approaches to Faculty Productivity Issues inSelected State Systems of Higher Education. This chapterprovides information on alternative approaches used in other statesto address and increase faculty productivity, as described ininterviews with selected SHEEO agencies.
! Chapter 4.0 Florida’s Public University Responses onMeasuring Their Faculty Productivity. This chapter providesinformation collected from Florida’s public universities relating to themeasurement of university productivity and standards ofachievement.
! Chapter 5.0 Detailed Analysis of University Productivity Data.This chapter presents detailed information on measures of facultyproductivity identified in legislative proviso.
! Chapter 6.0 Position Conversions. This chapter providesinformation on the fiscal impact of the conversion of funds from theiroriginal allocation categories to other categories and componentswithin the universities' operating budget.
! Chapter 7.0 Summary and Conclusions. This chaptersummarizes the faculty productivity issue and provides generalconclusions based upon the study results.
1.6 Acknowledgements
The MGT project team would like to thank the staff in the Division of Colleges and
Universities of the Florida Department of Education for the considerable time and effort
they expended in providing the detailed budget and instructional data files used in this
study. Special thanks to Ms. Anne Blankenship and Mr. George Perkins of the Budget
Office and Ms. Shirley Roddenberry and Ms. Charlene Coles of the Information
Resource Management Office.

MGT of America, Inc. Page 2-1
2.0 THE NATIONAL ISSUE OF FACULTY PRODUCTIVITY INHIGHER EDUCATION
2.1 Introduction and Context
One of the more highly charged and controversial topics pertaining to public higher
education has been the issue of faculty workload and productivity. Powerful external
constituencies—governors, legislators, governing board members, business people, and
the general public—see the productivity of the academic enterprise as the key in
evaluating higher education's claim on scarce resources. As a result, many state
legislatures and policy makers in the early 1990s mandated reports on faculty workload as
well as more substantive teaching load requirements for public college and university
faculty. Hines and Higham (1996) found that by 1995, 24 states had enacted mandates
on faculty workload. Seventeen of these mandates originated from state legislatures, and
seven originated from state higher education agencies. Since that time, legislative interest
in faculty workload and productivity has declined. A recent study showed that by 2000,
other faculty issues (e.g., instructional technology and faculty as a human resource for the
state) were among the highest priority faculty issues in the state, whereas workload and
productivity was of moderate interest (Russell, 2000). In this more recent study, 34 states
reported a mandate on faculty workload, yet the majority (24) of those mandates were
from state higher education agencies rather than legislatures.
There are two primary reasons why faculty work and faculty productivity have
been in the spotlight in recent years. First, increases in state funding for higher
education—the major source of funding for public institution operating expenses—have
waned in recent years due largely to increased demands from other state-funded
services on already tight state budgets. Second, there is a continuing interest in
“accountability” of higher education at state and national levels. The common theme

The National Issue of Faculty Productivity in Higher Education
MGT of America, Inc. Page 2-2
among these accountability issues is an increased emphasis on quality, outcomes, and
product, primarily in the area of undergraduate instruction. Since faculty productivity is a
complex issue, this literature review will cover four broad areas:
! issues in defining and measuring faculty workload and productivity;
! existing research and ongoing studies of faculty workload andproductivity;
! challenges being addressed by recent research and ongoing studiesof faculty workload and productivity; and
! summary and recommendations.
2.2 Issues in Defining and Measuring Faculty Productivity
Faculty workload is generally defined as “time spent on professionally appropriate
activities” (Meyer, 1998, p. 30). Yet this simple definition belies the complexities of
productivity in the academic setting. There are three interrelated issues that must be
considered in approaching the topic of defining and measuring faculty productivity:
! the fundamental differences between academic and industrialsettings;
! the content of faculty work; and
! conceptual measurement issues.
2.2.1 Differences Between Academic and Industrial Settings
At the broadest level, productivity refers to the way in which an organization
transforms inputs (e.g., labor and capital) into outputs (Hopkins, 1990). In industrial
settings, productivity is relatively easy to define and measure. One need only take a
selected output for a firm and divide by the input of choice (e.g., per worker).
Colleges and universities, however, are not steel mills or auto plants. Although
some inputs are quantifiable (e.g., number of students, faculty time), "outcomes are
diffuse, and difficult to measure" in higher education (Mingle and Lenth, 1989, p. 13). It is

The National Issue of Faculty Productivity in Higher Education
MGT of America, Inc. Page 2-3
not unlike measuring the productivity of a surgeon, whose workload cannot be assessed
simply by the number of hours spent in the operating room. A number of other inputs,
including research, diagnosis, and preparation, require significant time prior to the
surgery. Additionally, the results of the surgery (i.e., the outcome) is often difficult to
quantify.
Middaugh (2001) argued that those performance measures already in place in a
number of states measure neither performance nor productivity. He also highlighted the
need for better communication with important constituencies regarding faculty
productivity issues. “Unfortunately, colleges and universities have done a horrible job of
communicating to external publics, particularly parents and legislators, what faculty are
expected to do, what they actually do, and how well they do it.” (Middaugh, 2001. p. xv)
Clearly, a critical need exists to develop a set of effective productivity measures
that are agreed on by legislative and university representatives, to collect data regularly
on these measures, and to report the findings periodically to legislators and the general
public.
2.2.2 The Content of Faculty Work
The content of faculty work has come under increased scrutiny in recent years.
Some constituencies have posed the question: What is it that faculty do? Historically,
faculty work has been comprised of instruction, research, and public service activities.
! Instruction – While teaching usually occurs in the classroom setting,faculty spend considerable outside time in support of theirinstructional responsibilities, including preparing for lectures,evaluating student performance, advising students, and conductingrelated administrative tasks (e.g., supervising teaching assistants,preparing student progress reports, or writing reference letters forstudents). Furthermore, faculty may be asked to design newcourses or curricula, adapt existing courses or curricula to newtechnology, and serve on a variety of ad hoc academic committees(e.g., internal program review for accreditation).

The National Issue of Faculty Productivity in Higher Education
MGT of America, Inc. Page 2-4
! Research – Many faculty, particularly those at research or doctoraluniversities, are also required to conduct a program of researchrelated to their discipline or specialty area, to seek external fundingto support the costs associated with that research, and to publishtheir findings.
! Public Service – In addition to disseminating knowledge to students,faculty members sometimes serve as experts or resource persons tobenefit local communities, their state, or the nation. Additionally,they often serve their disciplines by taking leadership roles inprofessional organizations (e.g., president or journal editor), anhonor that also reflects well on their institutions.
Beyond these responsibilities, some faculty also serve on university committees (e.g.,
strategic planning, tenure review) or fill administrative roles such as department chair,
which may also require a significant or ongoing time commitment.
2.2.3 Conceptual Measurement Issues
Beyond these distinctive work issues, there are various measurement issues to be
considered. The major consideration is related to the types of inputs and outputs present
in higher education settings. Hopkins (1990) points out that for institutions of higher
education there are both tangible and intangible inputs and outputs. Tangible inputs
include such things as the number of new students, faculty time and effort, library
holdings, and equipment. Intangible inputs include the quality of new students, the quality
of the faculty, and so on. Tangible outputs include student enrollment in courses, the
number of degrees awarded, and the number of scholarly works produced by the faculty.
Intangible outputs include the quality of instruction provided in courses, the knowledge
gained by students during their college career, and the quality of faculty scholarship.
Because of these intangible aspects of academic productivity, Hopkins notes that
"all efforts to date at specifying and estimating the higher education production function
have provided only partial results" (1990, p. 13). Thus, while we may be able to identify
certain inputs and outputs in higher education (i.e., the tangible), at this time it is unlikely

The National Issue of Faculty Productivity in Higher Education
MGT of America, Inc. Page 2-5
that productivity in its entirety can be captured and measured as some joint result of the
tangible and intangible. While it can be said that firms in the private sector also must deal
with the qualitative aspects of production, it could be argued that it is much less of a
measurement issue for the private firm given its primary focus on such quantifiable
aspects as unit cost and profit maximization.
The problem of being able to measure only tangible activities is further complicated
by the fact that faculty often jointly produce the primary activities of most institutions of
higher education (instruction, research, and service). Therefore, evaluating one specific
aspect of production (e.g., contact hours in undergraduate courses) without controlling for
the other activities engaged in by the faculty provides an incomplete picture of faculty
productivity. Further, increasing the production of one of these activities may come at the
expense of the other. For example, assuming no increase in faculty resources, increasing
faculty productivity in undergraduate education may result in decreased productivity in
graduate education and research activities. In fact, one empirical study found that there
was a significant tradeoff between teaching productivity and research productivity (Gilmore
and To, 1992).1
2.3 Existing Research and Studies of Faculty Workload and Productivity
Concerns about the hazards and shortfalls of defining and measuring productivity
notwithstanding, a number of approaches have been used to measure faculty workload
and productivity. These approaches include faculty activity studies, instructional work-
load studies, and noninstructional activity studies (Layzell, 1996).
1Some economists have hypothesized that if the production of one service supports another, then the jointproduction of each may be more efficient than producing each one separately - "economies of scope"(Halstead, 1991). Brinkman (1990) notes that there have been few studies of this issue, although there issome evidence that economies of scope do exist for instruction and research.

The National Issue of Faculty Productivity in Higher Education
MGT of America, Inc. Page 2-6
2.3.1 Faculty Activity Studies
Faculty activity studies have been done since 1919 and have shown fairly
consistent patterns of total hours worked and distribution between the traditional tripartite
model (instruction, research, and public service). Exhibit 2-1 provides data from the
National Survey of Postsecondary Faculty, a longitudinal study that has been
administered in 1988, 1993, and 1999. These data show that, over this 12-year period,
the percentage of time devoted to instruction has remained relatively constant.
However, variations occur predictably according to institutional type. For example,
faculty at research universities spend more time than average in research activities, and
faculty at comprehensive and two-year institutions spend more time than average in
teaching activities.
EXHIBIT 2-1DISTRIBUTION OF FACULTY ACTIVITY BY TYPE OF PUBLIC INSTITUTION
RESEARCH DOCTORAL COMPREHENSIVE TWO-YEAR
1988 1993 1999 1988 1993 1999 1988 1993 1999 1988 1993 1999
TEACHING 43.6% 40.4% 45.9% 47.8% 46.8% 47.4% 63.5% 60.2% 63.1% 73.3% 68.7% 71.9%
RESEARCH 30.1% 31.5% 25.9% 22.8% 23.8% 19.4% 12.3% 14.0% 11.1% 4.2% 4.5% 3.8%
ADMINISTRATIONb 13.9% 12.9% 13.1% 14.7% 13.2% 15.2% 12.8% 12.0% 12.8% 10.9% 12.0% 11.5%
PUBLIC SERVICE/OTHERc12.3% 15.2% 15.1% 14.7% 16.1% 18.0% 11.4% 13.7% 13.0% 11.6% 14.6% 12.9%
Source: 1988, 1993, 1999 National Study of Postsecondary Faculty, National Center for Education Statisticsa Full-time instructional faculty and staff only.b Includes department or institutionwide meetings or committee work.c Includes public service, professional growth, outside consulting, and noncategorized.
FACULTYa ACTIVITY
INSTITUTION TYPE
In other studies that have addressed faculty activities, Byrd (1994) strongly advocated
the academic department as the standard unit of analysis due to the collaborative nature
of most faculty work. In addition, Colbeck (1998) reported that faculty workload studies
that ask faculty to report mutually exclusive time spent on teaching, research, or service

The National Issue of Faculty Productivity in Higher Education
MGT of America, Inc. Page 2-7
result in an underestimation of time spent on all activities. Therefore, the study
concluded that increases in faculty productivity, especially at comprehensive
universities, may be more likely to occur when faculty are encouraged to integrate
multiple activities.
2.3.2 Instructional Workload Studies
Another type of faculty productivity analysis focuses on the instructional workload
of faculty. Typically, these studies examine such measures as average course loads,
contact hours, and credit loads. Significant variance according to type of institution,
academic discipline, and faculty rank is often observed. “Classroom contact hours” are
the number of hours spent teaching group instruction courses, while “student contact
hours” are the number of hours spent teaching group instruction courses multiplied by
the numbers of students enrolled in those courses.
Middaugh (1996) described a method of measuring faculty workload whereby the
credit value of a course is multiplied by the head count enrollment and then divided by
the total student credit hours per department or program. These measures can then
enable a university to examine the instructional productivity and cost ratios among the
disciplines on campus. According to Middaugh, when this method was applied to the
ongoing Delaware Study of Instructional Costs and Productivity consortium (established
in 1992), it served to contradict the notion that faculty, particularly those who are tenured
or tenure track, do very little teaching. As expected, the Delaware Study also showed
that faculty instructional workloads were lightest at research universities.
2.3.3 Productivity in NonInstructional Activities
Much of what is known about faculty productivity in noninstructional activities is
descriptive and is confined to research activities. However, given the tradeoff between
The National Issue of Faculty Productivity in Higher Education
MGT of America, Inc. Page 2-8
faculty instructional and noninstructional activities described earlier in this report, these
measurements are useful (and necessary) in providing a fuller context for evaluating
faculty instructional activities.
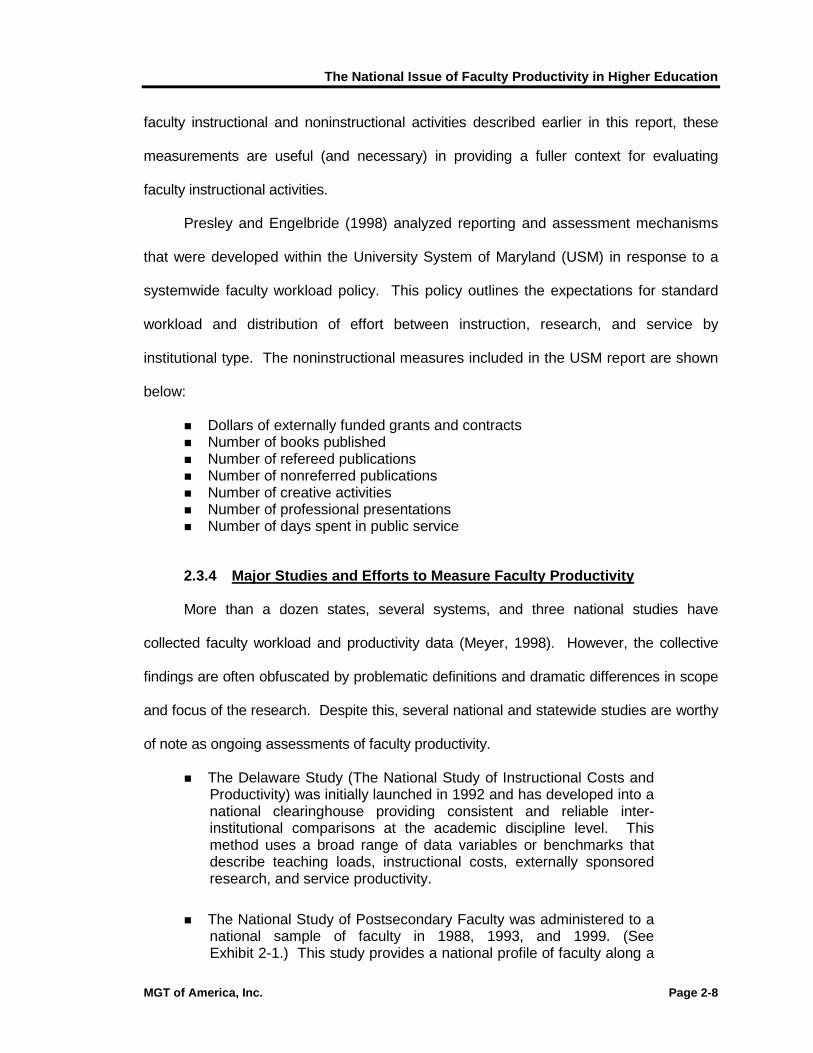
Presley and Engelbride (1998) analyzed reporting and assessment mechanisms
that were developed within the University System of Maryland (USM) in response to a
systemwide faculty workload policy. This policy outlines the expectations for standard
workload and distribution of effort between instruction, research, and service by
institutional type. The noninstructional measures included in the USM report are shown
below:
! Dollars of externally funded grants and contracts! Number of books published! Number of refereed publications! Number of nonreferred publications! Number of creative activities! Number of professional presentations! Number of days spent in public service
2.3.4 Major Studies and Efforts to Measure Faculty Productivity
More than a dozen states, several systems, and three national studies have
collected faculty workload and productivity data (Meyer, 1998). However, the collective
findings are often obfuscated by problematic definitions and dramatic differences in scope
and focus of the research. Despite this, several national and statewide studies are worthy
of note as ongoing assessments of faculty productivity.
! The Delaware Study (The National Study of Instructional Costs andProductivity) was initially launched in 1992 and has developed into anational clearinghouse providing consistent and reliable inter-institutional comparisons at the academic discipline level. Thismethod uses a broad range of data variables or benchmarks thatdescribe teaching loads, instructional costs, externally sponsoredresearch, and service productivity.
! The National Study of Postsecondary Faculty was administered to anational sample of faculty in 1988, 1993, and 1999. (SeeExhibit 2-1.) This study provides a national profile of faculty along a

The National Issue of Faculty Productivity in Higher Education
MGT of America, Inc. Page 2-9
number of data elements (e.g., demographic variables,responsibilities, workload, compensation, benefits, careersatisfaction). The goal of this ongoing series of studies is to providelongitudinal data for analysis of faculty and their work environment.Thus far, the data for public institutions show that instruction andresearch levels have remained relatively consistent over the yearswithin institutional type (refer to Exhibit 2-1). This consistency overthe years tempers the criticism that self-reporting is a majorlimitation of these data. However, these data concentrateexclusively on input measures (the number of hours worked invarious activities) to the neglect of outcomes measures that resultfrom faculty activities.
! The Joint Commission on Accountability Reporting (JCAR) is anaccountability effort developed by representatives of three majorhigher education associations (the National Association of StateUniversities and Land Grant Colleges, the American Association ofState Colleges and Universities, and the American Association ofCommunity Colleges). It focuses on placement rates, graduationrates, student charges and costs, and faculty activity, which isquantified according to “service months” spent in teaching, research,and service activities. A major shortcoming of this approach is theabsence of outcome measures to assess faculty productivity withresearch and service activities.
! The South Carolina State Mandated Faculty Performance Standardsare a widely publicized set of performance standards centered onmission focus, quality of faculty, instructional quality, andachievements of graduates. Funding decisions in the state of SouthCarolina are based on these productivity measures. Although thisapproach makes an attempt to address outcomes or the product offaculty activities, the method lacks a comprehensive framework andgenerally uses descriptor variables that are nebulous and do notrelate to what they purport to measure. This method does introducethe thought that achievement of graduates should be considered inassessing faculty productivity.
! University System of Maryland – The University System of Maryland(USM) developed an annual reporting and assessment mechanismin response to a systemwide faculty workload policy that outlines theexpectations for standard workload and distribution of effort betweeninstruction, research, and service by institutional type. It alsostipulates the formula for converting traditional courses and othergraded experiences into a standardized measure. Thesemechanisms are unique in that they are mission sensitive andinvolve data on noninstructional as well as instructionalproductivity—factors that account for the inherent differencesbetween institutional types. Individual faculty members are the unitof analysis within the USM; therefore, statistics in the USM reportaccount for the number and proportion of faculty teaching at the

The National Issue of Faculty Productivity in Higher Education
MGT of America, Inc. Page 2-10
standard load, exceeding the standard load, and teaching below thestandard load. There are two categories of exceptions to thestandard teaching load, including instructional related activities (e.g.,course preparation or large classes) and externally funded researchsupport. Those faculty who are granted appropriate exceptions areincluded in the category of faculty who are teaching at the standardload. Faculty on sabbatical in a given year are not included in thecalculations.
! University of North Carolina – In 1995, the North Carolina GeneralAssembly directed the Board of Governors for the University ofNorth Carolina to “design and implement a system to monitor facultyteaching workloads on the campuses of the constituent institutions.”The subsequent policy was designed to provide information tocampus academic administrators for managing teaching workloadsefficiently and equitably. It sets up an expectation for standardannual course loads by type of institution and requires an annualreport from each department as well as a summary for eachinstitution. The institution report must provide data showing thestandard teaching load of each department, faculty credit hourproduction by type of faculty and level of course, and a count offaculty who taught more or less than the standard load for thedepartment. For those teaching less than the standard load, thereasons must be identified. Courseload reductions can be grantedfor appropriate professional activities as justified on a case-by-casebasis. In addition, faculty can receive credit hour equivalents forextra contact hours with students (e.g., independent study, thesisand dissertation, internships). Also required by the GeneralAssembly, the Board of Governors developed a policy to rewardfaculty who teach more than a standard academic load.
! Iowa Board of Regents Annual Report of Faculty Activity is acomprehensive statewide report related to workload andproductivity. Although criticized for relying on self-reported data, thisannual reporting mechanism includes the following measures:faculty effort and activities (average hourly workload and percentageof effort by colleges and rank); faculty instructional workload; facultyproductivity (number of majors each fall, number of degrees, andsponsored research); faculty portfolios; and peer institution studies.
2.3.5 Weaknesses of Current Workload and Productivity Analyses
Some of the more traditional ways of analyzing faculty workload and productivity
examined here have a number of drawbacks. First, as noted previously, there is the
problem of capturing the intangible inputs and outputs. Measuring the hours spent in a
classroom or the number of journal articles produced tells us little about the quality of

The National Issue of Faculty Productivity in Higher Education
MGT of America, Inc. Page 2-11
instruction provided or the quality of the scholarship. Another weakness, related
specifically to measures of instructional workload, is the fact that such measures as
average classroom contact hours do not account for the time spent by faculty in
preparing for that class, time spent with students outside of the classroom, or other
instruction-related activities. A weakness relating to faculty activity studies is their
reliance on self-reported data. Although some researchers argue that consistency in
findings establishes validity of such data over time, critics outside the academy tend to
give low weight to the validity of self-reported data.
2.3.6 National Patterns of Faculty Productivity
Research has not indicated that faculty are working any less now than before;
however, there is some evidence that there is less time being spent overall in
instructional activities, specifically at the undergraduate level (Jordan, 1994). Massy and
Zemsky (1994) found that research university departments prefer smaller teaching loads
more so than departments in liberal arts colleges. While not surprising, this finding
reinforces the notion that research institutions seek to maximize time for noninstructional
activities (e.g., research and scholarship) through decreased teaching loads. Massy
(1990) developed an explanation for why faculty instructional productivity may be
declining—termed simply "the ratchet." In short, "the ratchet" works as follows for any
given academic department (assuming constant or declining enrollments):
! Increases in the number of faculty in a department or in the leveragingof faculty time with lower cost teaching assistants or part-timeinstructional staff lead to a broader and more specialized curriculararray for the department. They also lead to smaller classes becauseexisting enrollments are spread out over a larger number of courseofferings.
! This leads to a lower average teaching load for the faculty.
! The lowered average faculty teaching load leads to increased timespent in other noninstructional activities.

The National Issue of Faculty Productivity in Higher Education
MGT of America, Inc. Page 2-12
Massy and Robert Zemsky (1994) tested this concept using data collected from four
liberal arts colleges and two research universities. Among their findings was that
"research university departments prefer smaller teaching loads more fervently than do
departments in the liberal arts colleges" (p. 20). Although this is hardly surprising, it
does reinforce the popular notion that faculty at research institutions seek to maximize
their discretionary time available for noninstructional activities (e.g., research and
scholarship) through lowered teaching loads.
2.4 Facing the Challenges of Faculty Productivity
As efforts to measure faculty productivity have become more refined over the
years, researchers have confronted some of the challenges that have historically
plagued such research. In particular, recent studies have addressed:
! definitions of faculty included in workload and productivity analyses;
! the transition from a focus on input measures to a focus on outputmeasures; and
! development of measures related to quality in addition to those thatare quantitative in nature.
2.4.1 Defining “Faculty” for the Purposes of Workload and ProductivityStudies
Defining the term “faculty” is a critical part of a successful productivity study. The
1996 Joint Commission on Accountability Reporting (JACR) defined four categories of
faculty that should be considered and distinguished in faculty assignment reporting:
! Tenured and tenure track faculty includes tenured faculty and thoseeligible for tenure after a probationary period at the reportinginstitution. Administrators who hold tenured positions and teachcourses are also included.
! Recurring nontenure track faculty includes instructors, lecturers,multiple-year limited-term appointees, one-year appointees, orpermanent part-time teaching personnel.

The National Issue of Faculty Productivity in Higher Education
MGT of America, Inc. Page 2-13
! Temporary Faculty includes individuals with nonrecurring, limited-term appointments, or nontenured individuals whose primaryinstitutional responsibility is other than teaching, research, orscholarship and service. Part-time adjunct faculty, nontenuredadministrators who teach, and contributed service personnel areusually included in this definition.
! Teaching Assistants include students at the institution who are listedas the instructor of record for a course or courses.
These categories of faculty definitions are comprehensive, thus enabling analysis of the
extent to which all types of faculty and instructional staff are utilized in classroom
instruction.
2.4.2 Broadening the Focus from Input Measures to Output Measures
Recent research has been broadening the scope of data collection to include
output measures as well as the more traditional input measures. Examples of both
types of measures are outlined below.
2.4.2.1 Input Measures
! mean number of hours worked per week;
! percentage of time spent with teaching, research, administrative,and other activities;
! mean number of classroom hours per week and mean number ofstudent contact hours per term; and
2.4.2.2 Output Measures
! per three-year time period, the mean number of
− -refereed or juried publications− -reviews and nonreferred publications− -books and book chapters− -monographs and technical reports− -presentations and exhibits− -patents, copyrights, and software.
! student and peer evaluations;
! post-tenure reviews;

The National Issue of Faculty Productivity in Higher Education
MGT of America, Inc. Page 2-14
! achievement of graduates including
− graduation rates
− employment rates
− employer feedback on graduates
− performance of graduates on professional, graduate, oremployment-related
− examinations and certification tests
− number of graduates pursuing postbaccalaureate education; and
− credit hours earned by graduates.
! The number of degrees awarded by the institution.
2.4.3 Developing Both Quantitative and Qualitative Measures
One of the criticisms of faculty workload and productivity studies is that they focus
on quantitative measures without taking into account quality of the inputs and outputs.
The Delaware Study, the culmination of nearly ten years of research related to faculty
productivity, includes both types of measures. According to Middaugh (2001), a number
of quantitative and quality measures are used and recommended for benchmarking
purposes, including those in Exhibit 2-2.
2.5 Summary and Recommendations
In summary, the literature indicates that there is no one “best” mechanism, but
rather some standard ways that workload and productivity measurement may be
employed by an institution or a system. The following recommendations have emerged
from the literature.
! Productivity is a function of inputs, processes, and outcomes, and anyattempts at measuring or assessing faculty productivity should includeall three components, even if the focus is shifting to outcomes.

The National Issue of Faculty Productivity in Higher Education
MGT of America, Inc. Page 2-15
EXHIBIT 2-2QUANTITATIVE AND QUALITY MEASURES OF PRODUCTIVITY INCLUDED IN THE
DELAWARE STUDY
QUANTITATIVE MEASURES-- Proportion of lower-division student credit hours taught by tenured and tenure track faculty;
-- Proportion of lower-division organized class sections taught by tenured and tenure track faculty;
-- Proportion of undergraduate student credit hours taught by tenured and tenure track faculty;
-- Proportion of undergraduate class sections taught by tenured and tenure track faculty;
-- Undergraduate student credit hours per FTE tenured and tenure track faculty;
-- Undergraduate organized class sections per FTE tenured and tenure track faculty;
-- Total student credit hours per FTE tenured and tenure track faculty;
-- Total organized class section per FTE tenured and tenure track faculty;
-- Direct instructional expense per student credit hour taught; and
-- Direct separately budgeted research and service expenditures combined, per FTE tenured and tenure track faculty.
QUALITATIVE MEASURES-- Number of refereed publications within past 36 months;
-- Number of textbooks, reference books, novels, or volumes of collected works within past 36 months;
-- Number of edited volumes within past 36 months;
-- Number of editorial positions held within past 36 months;
-- Number of externally funded contracts and grants received within past 36 months;
-- Number of professional conference papers and presentations within past 36 months;
-- Number of nonrefereed publications within past 36 months;
-- Number of active memberships in professional associations and/or honor societies within past 36 months;
-- Number of faculty engaged in faculty development or curriculum development activities as part of their assigned workload;
-- Five-year undergraduate persistence and graduation rates for most recent cohort;
-- Most recent average student satisfaction scores for-quality of academic advisement-out of class availability of faculty-overall quality of interaction with faculty;
-- Proportion of most recent graduating class finding curriculum-related employment within 12 months of commencement;
-- Proportion of students passing licensing, certification, or accreditation examinations related to academic major;
-- Proportion of most recent graduating class continuing to pursue further graduate or professional education;
-- Number of students engaged in undergraduate research with faculty mentor within past 12 months;
-- Number of students engaged in internship or practica under direct supervision of faculty over past 12 months;
-- Number of students who author or co-author with a faculty mentor an article or chapter over past 36 months; and
-- Number of students presenting or co-presenting with a faculty mentor a paper at a professional meeting.
! Productivity improvement strategies should be developedcollaboratively among all institutional stakeholders—faculty,administrators, and students—and have clear expectations.
! Productivity improvement strategies should be linked directly to therole and mission of the institution as well as to the institutionalincentive structure.
! Productivity improvement strategies are an iterative process thatrequires continuous measurement, assessment, and reassessment.
! The focus of faculty workload and productivity should be at theuniversity departmental level, not the individual faculty member level.

The National Issue of Faculty Productivity in Higher Education
MGT of America, Inc. Page 2-16
! Productivity measurement should encompass both quantitative andqualitative aspects of faculty work, and should attempt to capture thejoint production of faculty activities where possible.
! Faculty work and productivity issues need to be communicated to theexternal public in a manner that is clear, unambiguous, andnondefensive.
Finally, establishing successful models that assess faculty work productivity must be
accomplished through appropriate comparisons among peer institutions. In light of the
fact that faculty activities differ greatly across institutional types, it would be imprudent to
compare all institutions, regardless of type, to a single standard. Therefore, peer
institutions must be selected and agreed upon by legislative and institutional
representatives in order to make appropriate and useful comparisons.

The National Issue of Faculty Productivity in Higher Education
MGT of America, Inc. Page 2-17
Bibliography of Literature Reviewed
American Association of University Professors. “The Politics of Intervention: ExternalRegulation of Academic Activities and Workloads in Public Higher Education.”Academe, 82(1), pp.46-52, 1996.
Byrd, Lloyd., Jr. “Practical Considerations and Suggestions for Measuring FacultyWorkload”, in “Analyzing Faculty Workload,” J.F. Wergin, Ed. New Directions forInstitutional Research Report No. 83, pp. 71-83. San Francisco: Jossey-Bass, 1994.
Colbeck, Carol L. “Merging in a Seamless Blend: How Faculty Integrate Teaching andResearch,” Journal of Higher Education, Vol. 69, No. 6, pp. 647-671.
Gilmore, Jeffrey and Duc To. "Evaluating Academic Productivity and Quality," in“Containing Costs and Improving Productivity in Higher Education,” C. Hollins, Ed. NewDirections for Institutional Research Report No. 75, pp. 35-47. San Francisco: Jossey-Bass, 1992.
Glazer, G., and Henry, M. S. “Approaches to Conducting Faculty Workload Studies: ACase Study at Kent State University,” in Analyzing Faculty Workload, J.F. Wergin, Ed.New Directions for Institutional Research Report No. 83, pp. 39-55. San Francisco:Jossey-Bass, 1994.
Hines, E. R., & Higham, R., III. “State Policy and Faculty Workload.” Normal, Illinois:Center for Higher Education and Educational Finance, 1996.
Halstead, Kent. “Higher Education Revenues and Expenditures: A Study of InstitutionalCosts.” Washington, D.C.: Research Associates of Washington, 1991.
Hicks, John W. "Faculty Workload - An Overview," in “Faculty Workload: A ConferenceReport,” Kevin Bunnell, Ed., pp. 3-11. Washington, D.C.: American Council on Education,1960.
Hopkins, David. "The Higher Education Production Function: Theoretical Foundationsand Empirical Findings," in “The Economics of American Universities,” S. Hoenack and E.Collins, Eds., pp. 11-32. Albany, New York: SUNY Press, 1990.
Johnstone, D. Bruce. "Learning Productivity: A New Imperative for American HigherEducation," SUNY Studies in Public Higher Education, No. 3. Albany: State Universityof New York, April 1993.
Jordan, Stephen M. "What We Have Learned About Faculty Workload: The BestEvidence" in “Analyzing Faculty Workload,” J.F. Wergin, Ed. New Directions forInstitutional Research Report No. 83, pp. 15-24. San Francisco: Jossey-Bass, 1994.
Layzell, Daniel. T. “Faculty Workload and Productivity: Recurrent Issues with NewImperatives” in The Review of Higher Education, 19(3), pp. 267-281, 1996.

The National Issue of Faculty Productivity in Higher Education
MGT of America, Inc. Page 2-18
Massy, William. "The Dynamics of Academic Productivity," In The Dynamics of AcademicProductivity, Proceedings from a SHEEO Seminar, pp. 1-27, Denver: State HigherEducation Executive Officers, March 1990.
Massy, William F. and Robert Zemsky. "Faculty Discretionary Time: Departments and the'Academic Ratchet’," The Journal of Higher Education, 65:1, pp. 1-22, January/February1994.
Meyer, Katrina A. “Faculty Workload Studies: Perspectives, Needs, and FutureDirections.” Washington, D.C.: Association for the Study of Higher Education, 1998.
Middaugh, Michael and David Hollowell. "Examining Academic and AdministrativeProductivity Measures," in “Containing Costs and Improving Productivity in HigherEducation,” C. Hollins, Ed. New Directions for Institutional Research Report No. 75, pp.61-76. San Francisco, Jossey-Bass, 1992.
Middaugh, Michael. F. “Closing in on Faculty Productivity Measures” in Planning forHigher Education, 24(2), pp. 1-12, 1996.
Middaugh, Michael. F. “How Much Do Faculty Really Teach?” in Planning for HigherEducation, 27, pp. 1-11, 1998.
Middaugh, Michael. F. “University of Delaware National Study of Instructional Costs andProductivity” on line at www.udel.edu/IR/cost/brochure, 1999.
Middaugh, Michael F. “Understanding Faculty Productivity.” Jossey-Bass: SanFrancisco, 2001.
Miller, Margaret A. "Pressures to Measure Faculty Work," in “Analyzing Faculty Workload,”J.F. Wergin, Ed. New Directions for Institutional Research Report No. 83, pp. 5-14. SanFrancisco: Jossey-Bass, 1994.
Mingle, James. "Faculty Work and the Costs/Quality/Access Collision." AAHE Bulletin,45:7, pp. 3-6, 13, March 1993.
Mingle, James and Charles Lenth. "A New Approach to Accountability and Productivity inHigher Education." Denver: State Higher Education Executive Officers, 1989.
National Center for Education Statistics. National Survey of Postsecondary Faculty, 1988,1993, 1999.
Presley, Jennifer B., and Engelbride, Edward. “Accounting for Faculty Productivity in theResearch University”, in The Review of Higher Education, 22(1), pp. 17-37, 1998.
Russell, Alene Bycer. “State Perspectives on Higher Education Faculty Issues.”Denver: State Higher Education Executive Officers, July 2000.
Soliman, I., and Soliman, H. “Academic Workload and Quality,” in Assessment andEvaluation in Higher Education, 22(2), pp. 135-157, 1997.

MGT of America, Inc. Page 3-1
3.0 APPROACHES TO FACULTY PRODUCTIVITY ISSUESIN SELECTED STATE SYSTEMS OF HIGHER EDUCATION
This chapter presents findings from a review of faculty productivity issues
addressed by selected state systems of higher education. In order to identify relevant
faculty workload policies and issues in other states, MGT, in consultation with officials
from the Council for Educational Policy Research and Improvement (CEPRI), targeted a
few key states for in-depth interviews. MGT then scheduled and conducted telephone
interviews with State Higher Education Executive Officers (SHEEOs) from the following
states:
! Arizona! California! North Carolina! Texas! Virginia
These states were selected based on their general reputation for higher education and
by referral as being representative of national trends and approaches to measurement of
faculty productivity.
Following a summary of telephone interview comments, this chapter presents a
synthesis of how these states have generally addressed the following issues:
! measures commonly used to analyze faculty productivity;
! extent of peer institution comparisons of faculty productivity;
! use of national benchmarks or standards of faculty productivity;
! challenges typically faced in measuring faculty productivity; and
! measures of institutional effectiveness and learner-centeredoutcomes.

Approaches To Faculty Productivity Issues In Selected State Systems Of Higher Education
MGT of America, Inc. Page 3-2
The chapter concludes with a summary listing of broad findings and suggestions that
may be useful in the development of best practice guidelines to measure faculty
productivity in Florida.
3.1 Summaries of Interviews with SHEEOs
This section provides responses to questions discussed with SHEEOs during
teleconference interviews. SHEEO representatives were asked to generally address
the following questions:
! Does your state/system have a model or framework to analyzefaculty productivity among four-year institutions?
! How is “faculty productivity” defined? How is faculty productivitymeasured?
! How is “faculty member" defined for the purposes of facultyproductivity measurement?
! What specific measures are in place for your state/system?
! How were these faculty productivity measures developed? How arethey used?
! Are comparisons of the data from these measures made amonginstitutions within the state? With peer institutions in other states? Ifso, how are these comparison institutions selected?
! What obstacles or challenges has your state/system faced inanalyzing faculty productivity?
Responses to these questions are provided in a state-by-state summary.
Arizona
Framework/Model
In 1988, considerable interest in faculty productivity issues was apparent in
Arizona. This resulted in formation of the Higher Education Research Advisory Board
that initiated a faculty workload study involving all faculty at the three public universities.
The Legislature instituted an incentive program whereby salary increases were to be

Approaches To Faculty Productivity Issues In Selected State Systems Of Higher Education
MGT of America, Inc. Page 3-3
offered to faculty who increased their teaching loads. Measures of teaching loads were
taken only during the fall terms, resulting in unbalanced teaching loads that were
excessive in fall and then diminished in spring. This problem was later corrected by
requiring reporting for both terms.
Among the three public universities in the state, this faculty teaching load incentive
program resulted in increased teaching load at one institution, little change at another,
and a slight decrease in average teaching load at the third institution, at which average
load exceeded that of the other two institutions prior to implementation of the program.
Implementation of the program resulted in an average faculty teaching load of 6 credit
hours per term at all three universities. The salary increases awarded to those faculty
who increased teaching load subsequently became embedded in base funding, and the
annual reporting initially required by this incentive program is no longer done. The
universities never embraced the program, and the legislators who developed it are no
longer in office.
Since the early 1990s, the Board of Regents and the Legislature have been
interested in assessing student access to faculty and outcome measures of institutional
effectiveness rather than specific faculty workload or productivity. An Undergraduate
Consolidated Accountability Report was developed in the late 1990s and has been
refined in recent years. It is intended to measure outcomes related to “Learner Centered
Education,” a framework developed by the BOR to assess the objectives of increased
student access to faculty and pursuit of outcome measures of institutional performance.
These measures are listed in Appendix 3-A. The BOR’s current version of the
Undergraduate Consolidated Accountability Report includes four categories of outcome
measures listed below.

Approaches To Faculty Productivity Issues In Selected State Systems Of Higher Education
MGT of America, Inc. Page 3-4
! General Education and Lower Division: 10 outcome measures suchas the percentage of lower-division students with two or moreclasses taught by ranked faculty;
! Academic Major and Graduation Progress: 10 outcome measuressuch as the percentage of students who began as freshmen andgraduated within six years;
! Supporting the Learning Environment: nine outcome measures suchas the percentage of graduating seniors who rate their overalluniversity experience as excellent; and
! Information and Monitoring: six outcome measures such as theaverage cumulative hours at graduation for students who began asfreshmen.
Measurement data are gathered through graduating senior, alumni, and employer
surveys. However, this method does not include a direct measure of research or public
service productivity.
Defining Faculty for Productivity Measurement
Faculty are defined as tenured or tenure-track (holding the rank of assistant,
associate, or full professor), or nontenured faculty with administrative or emeritus
professor status who teach courses.
Institutional Comparisons
Faculty productivity comparisons are not made between institutions, departments,
or colleges. Some comparative analyses were made with other states using the
Delaware Study; but shortly thereafter, the BOR moved toward a focus on outcome
measures. As a result, these previous comparison practices have been discontinued.
Future Directions
In view of a shift in focus toward outcome measures and away from input
measures, the State Legislature is currently uncertain about the future direction of faculty
productivity measures. Efforts continue to refine outcome measures, which are intended

Approaches To Faculty Productivity Issues In Selected State Systems Of Higher Education
MGT of America, Inc. Page 3-5
to provide general feedback in support of an emphasis on “Learner Based Education.”
This legislative interest in outcome measures appears to be motivated by concerns that
students all too often cannot graduate within the traditionally expected period of time
(four years) because of a shortage of available required classes. This concern is often
fueled by impressions of individual legislators based on anecdotal data.
Obstacles and Challenges
Every department within each institution is required to develop mechanisms to
assess learning outcomes and to incorporate the results of these assessments into
departmental objectives. These assessments, though, are not uniform and do not fully
gauge the extent of student learning in all areas. Also problematic, departmental level
assessments may not relate directly to previously mentioned institutionwide outcome
measures included in the systemwide Undergraduate Accountability Report (Appendix 3-
A).
California
Framework/Model
The two four-year systems in California University of California (UC) and
California State University (CSU) approach the issue of faculty productivity differently.
! UC has issued annual reports based on annual surveys of facultyinstructional activities from 1990–1991 through 1999–2000.
! CSU does not report faculty workload or productivity data since thebulk of their faculty are unionized and faculty workload is establishedby contract (specifying the number of credit hours and coursesrequired). Faculty unions define teaching loads for faculty accordingto requirements set forth in collective bargaining contracts.
For the past nine years (1990–1991 through 1999–2000), an annual survey of
instructional activities has been conducted at the University of California in response to

Approaches To Faculty Productivity Issues In Selected State Systems Of Higher Education
MGT of America, Inc. Page 3-6
legislative inquiries regarding faculty teaching activity. Results are published as the UC
Undergraduate Instruction and Faculty Teaching Activities Report. This survey assesses
the following regular-rank faculty (defined in following section) instructional workload
measures:
! primary classes (regularly scheduled, unit-bearing offerings ofclasses, usually known as lectures or seminars) per faculty FTE;
! independent study enrollments per faculty FTE;
! total student credit hours per faculty FTE;
! class size (weighting factor is applied for larger classes);
! number of seminar classes offered;
! number of thesis/dissertation units supervised;
! student/faculty ratio;
! number of academic majors per regular-rank faculty member; and
! number of degrees conferred.
Defining Ranked Faculty for Productivity Measurement
Examinations of teaching activity are aimed at regular-rank faculty, which include
general campus instructional and research appointments in professorial titles excluding
those in visiting, emeritus, and recalled titles. Appendix 3-B provides a complete list of
these faculty titles.
Institutional Comparisons
The University of California Undergraduate Instruction and Faculty Teaching
Activities Report provides feedback to help ensure that teaching practices are consistent
with policy in the context of a continuous quest for greater efficiency while maintaining
educational integrity.

Approaches To Faculty Productivity Issues In Selected State Systems Of Higher Education
MGT of America, Inc. Page 3-7
Expectations for faculty teaching loads were developed through comparison with
universities that UC also uses for salary comparison purposes. UC has queried these
universities about teaching load expectations for the past 15 years. They include:
! Harvard University! Yale University! Stanford University! University of Illinois at Urbana-Champaign! The University of Michigan-Ann Arbor! University of Virginia! SUNY-Buffalo! Massachusetts Institute of Technology
University of California teaching load expectations for faculty by discipline are
presented below in terms of quarter courses required per year:
! Biological Sciences—three quarter courses (i.e., one course perterm)
! Engineering and Computer Science—three to four quarter courses;! Physical Sciences—three to four quarter courses;! Humanities—four to five quarter courses;! Social Sciences—four to five quarter courses ;and! Mathematics—four to five quarter courses.
In the case of UC-Berkeley, quarter courses are weighted by a factor of 1.5 to
convert to semester courses. Engineering, Biological Sciences, and Physical Sciences
policies generally require fewer courses than other disciplines, since these courses
typically include laboratory sessions that meet for long hours and require extensive
supervision of students and teaching assistants. Other conditions that may justify
reduced teaching load include:
! administrative assignments;! first-term assistant professors;! engagement in new course development or program revision; and! special service such as heading an association or major national
commission.

Approaches To Faculty Productivity Issues In Selected State Systems Of Higher Education
MGT of America, Inc. Page 3-8
Future Directions
Some state officials have expressed concern that degree production is lacking,
pointing to California’s low production of degrees relative to national averages (includes
UC and CSU institutions.) This has generated a considerable amount of rhetoric, but
little specific action.
The recent Governor’s Compact with higher education was intended to require
satisfactory demonstration of progress in relation to performance measures in return for
financial incentives. Although not all institutions have shown such progress, incentives
have still been distributed. These “awards” have been somewhat less than anticipated,
due primarily to budget constraints rather than poor performance by institutions. Hence,
no direct link between performance and funding has been established.
Obstacles and Challenges
A faculty productivity study was conducted at UC 30 years ago and was more
extensive in nature than the current reports. However, it was never published due to
concerns that the data might cause divisiveness and misunderstanding.
Other studies in the state have underscored the importance of clearly defining
faculty productivity to include all relevant activities (e.g., office hours or advising and
mentoring students).
North Carolina
Framework/Model
The Legislature directed the Board of Governors to study teaching workload in
1995. As a result, each institution was required to develop a teaching workload policy
that included departmental-level participation in data collection.
A reporting format for faculty productivity was developed in 1995 for use in 1996
and beyond. Currently, the state system is transitioning toward national benchmarking

Approaches To Faculty Productivity Issues In Selected State Systems Of Higher Education
MGT of America, Inc. Page 3-9
by university department and academic discipline through participation in the Delaware
Study. State officials consider this the best model available. Also, the Delaware Study
enables inclusion of distance learning enrollments in departmental faculty workload.
Previous models to measure faculty productivity in the state did not capture these
enrollments.
North Carolina officials are not concerned about class size as it relates to quality
of instruction. Student surveys of sophomores are conducted biannually to gauge
student attitudes about quality of the educational experience. According to student
survey findings, some large classes exist, but do not appear to hinder the education
process.
North Carolina’s methods were modeled on the University System of Maryland.
Maryland conducted faculty productivity analyses for four years, at which time these
studies were discontinued due to convincing evidence that faculty were teaching an
adequate number of courses that compared well nationally with other Research I
Institutions.
Defining Faculty for Productivity Measurement
Faculty productivity is generally measured as “teaching productivity,” although
faculty clearly have other assignments that contribute to the overall mission and goals of
the institution. Teaching productivity assessments and faculty definitions are focused on
those types of faculty teaching undergraduate student credit hours: tenure-track, faculty
administrators, nontenured teaching, graduate students, or other adjunct faculty. Faculty
productivity is measured by student credit hours produced per FTE faculty, as defined in
the categories mentioned above. Universities are required to define “teaching workload
standard” by department, which is considered the most meaningful unit of measurement.

Approaches To Faculty Productivity Issues In Selected State Systems Of Higher Education
MGT of America, Inc. Page 3-10
Institutional Comparisons
State level officials are pleased with the move toward department comparisons of
faculty productivity against national peers through participation in the Delaware Study.
Currently, universities select peers for salary comparison purposes using the National
Center for Higher Education Management Systems (NCHEMS) process. Generally,
each institution selects about 15 peers that are reviewed and approved by the UNC
General Administration Office. Officials are hopeful that these peer institutions will
participate in the Delaware Study, as comparisons would then be standardized.
Future Directions
North Carolina is implementing participation in the Delaware Study. Policy
development implications of this method to compare performance measures on a more
national scale are still in the formative stages.
Obstacles and Challenges
An evaluation of faculty productivity revealed that a high proportion of teaching is
done by nontenure-track and part-time adjuncts. This led to a legislative request to study
this issue.
The most significant obstacle encountered in measuring faculty productivity is
defining the faculty population and determining which criteria to measure (such things
vary greatly from institution to institution and between states and systems). Some
progress has been made in measuring research productivity by creating a Sponsored
Grant and Contract file of college information containing information on Principal
investigator; dollar amount of grant; and Classification of Instructional Program (CIP)
code and Standard Industry Code (SIC).

Approaches To Faculty Productivity Issues In Selected State Systems Of Higher Education
MGT of America, Inc. Page 3-11
Texas
Framework /Model
Faculty workload is reported by all four-year state institutions according to
institution-specific reporting procedures and quantifiers of instructional activity (Appendix
3-C). Self-reporting combined with lack of a consistent and uniform reporting
methodology brings to question the accuracy of reported data and reliability of resulting
analyses. Shortcomings of this reporting process include:
! Not all faculty activities are adequately accounted for (e.g.administrative duties, research, and service).
! No suitable method exists to assess faculty activities other thanclassroom instructional activities. As a result, teaching load receivesthe major focus in measuring faculty productivity (time spent inthesis and dissertation oversight is included).
! Current methods focus almost exclusively on input measures (to theneglect of outcome measures) of organized instructional activities(e.g., hours spent teaching, number of courses taught, SCHproduced). These provide only a limited indication of what facultyaccomplish, although this is the Legislature’s metric of interestcurrently.
Measures of organized instruction are the principal focus largely because they are
easiest to obtain and analyze. Such measures focus primarily on inputs as opposed to
outcomes—again, due to the difficulty in measuring the latter. These measures, which
are reported annually by public institutions, include (see Appendix3-C for additional
detail):
Instructional Activities
! undergraduate minimum and normal teaching load per facultymember (e.g. SCHs per semester, workload credits per semester,work units per week, clock hours of instructional activities per week).
! graduate teaching load equivalent;! large class adjustment;! laboratory adjustment;! special performance or activity adjustment;! independent study instruction;! thesis or dissertation hours; and! practice/internship supervision.

Approaches To Faculty Productivity Issues In Selected State Systems Of Higher Education
MGT of America, Inc. Page 3-12
Administrative Assignments (results in reduced teaching load assignment)
! chair or unit head;! academic advisement; and! other administrative duties.
Other Special Assignments (results in reduced teaching load assignment)
! research and creative work;! university service; and! other service.
Other Policies
! overloads; and! accrual policy.
Faculty are categorized according to rank, tenure status, and salary level. Data
for each faculty member (courses and sections taught, salary level, and number of
students taught via individual study) are computed using enrollment data by course
sections. Clarification of the specific “teacher of record” for each course is considered
an important clarification that is addressed in this process. Some comparison of faculty
productivity at the department/discipline level has been attempted, but not refined to any
extent.
The Texas Legislature considers the proportion of tenured faculty teaching
undergraduate courses a highly important metric to be reported and monitored.
Defining Ranked Faculty for Productivity Measurement
Three categories of faculty are defined as follows:
! tenure or tenure track professors, associate professors, assistantprofessors, and instructors;
! other nontenure track faculty, including but not limited to adjunct,special visiting, emeritus, or lecturer; and
! teaching assistants who assist a faculty member in teaching a classor lab.
Separate productivity indicators are reported for each faculty category.

Approaches To Faculty Productivity Issues In Selected State Systems Of Higher Education
MGT of America, Inc. Page 3-13
Institutional Comparisons
Formal comparisons of data are not made among state institutions; however, at
least one institution recently attempted to compare with other Texas institutions in
support of an objective to increase faculty productivity. (The additional revenues
garnered from an increase in productivity were promised to fund faculty salary
increases.) Larger institutions in the state tend to prefer national benchmarking
comparisons rather than comparisons with other Texas institutions.
Future Directions
Legislators are interested in categorizing faculty workload according to the
Carnegie higher education institution taxonomy, although this has not yet occurred.
Faculty productivity measures were developed over the past 10 to 15 years in
response to legislative interest in faculty teaching load. These measures are relatively
basic. The Legislature did not initiate or request any revision or improvement of this
process during the most recent session. However, a state task force has begun work to
refine this reporting methodology to include faculty activities such as research and
service.
Faculty activity data are reported by institutions in fall and spring semesters only,
although there has been some discussion of eliminating spring reporting due to the
added burden (a time and resource intensive procedure).
At this time, faculty productivity issues do not appear to be a primary focus of
higher education policy. Interest in this topic has diminished to some extent in the Texas
over the past five or six years.

Approaches To Faculty Productivity Issues In Selected State Systems Of Higher Education
MGT of America, Inc. Page 3-14
Obstacles and Challenges
Data regarding faculty productivity—other than aggregate faculty/student ratio—
are rarely published, due to the unreliability of data at the institutional level. State
officials are confident that aggregate faculty productivity measures—at least of
organized instructional activities—are reasonably accurate. A state task force is
developing strategies intended to improve accuracy of information reported by
institutions.
In general, acquiring accurate data from institutions has been a constant
challenge. Additionally, a faculty productivity reporting mechanism for Texas institutions
specializing in health/medicine programs does not exist.
Interviewees expressed concern that a faculty productivity system that is too
detailed and complex (i.e., faculty feel as though they are punching a time clock) will
demoralize faculty and impede ability to compete for quality faculty on a national scale.
Other challenges have included:
! achieving an appropriate balance between a reporting methodologythat is overly simplistic versus one that is overly complex anddetailed; and
! a lack of statewide uniformity in the manner in which individualinstitutions currently report faculty productivity data.
Virginia
Framework/Model
A statewide system for measuring faculty workload is not in place at the present
time. However, some institutions measure workload on an individual basis as part of
program reviews. The state uses some proxy measurements, although interest in
faculty productivity at the state system level has diminished in the past four or five years.

Approaches To Faculty Productivity Issues In Selected State Systems Of Higher Education
MGT of America, Inc. Page 3-15
Current interest is focused on institutional effectiveness measures, and
systemwide measures have been developed to assess this outcome objective. A
complete list of these measures is provided on page 3-16 and 3-17.
Overall institutional effectiveness measurements consist of the following
components:
! a mission statement detailing the purpose and scope of theinstitution;
! institutional profiles including: student demographics, tuition andfees, grade point averages and SAT scores of incoming freshmen,acceptance rates, graduation rates, faculty credentials, numbers andtypes of degrees awarded, programs offered by degree level,admissions and enrollment rates, revenues and expenditures, andthe number of students awarded financial aid;
! a total of 14 systemwide outcome measures listed on page 3-16;and 3-17
! institution-specific measures, which vary according to institution andare intended to provide elaboration on the intent of the 14systemwide measures (e.g., service learning opportunities or studyabroad opportunities).
This reporting system resulted from the Governor’s Blue Ribbon Commission on
Higher Education directing the State Council of Higher Education to adopt and
implement performance measures intended to measure academic quality and
institutional efficiency.
The State Council of Higher Education for Virginia surveyed public institution
faculty in 1990 and 1996 concerning time spent in teaching, research, and service
activity. The following productivity measures were used in this survey:
Teaching
! formal contact hours;! other contact hours;! course preparation and evaluation;! pedagogical development; and! advising and counseling.

Approaches To Faculty Productivity Issues In Selected State Systems Of Higher Education
MGT of America, Inc. Page 3-16
Research
! scholarship; and! professional development.
Service
! formal administrative activities;! professional service; and! unpaid public service.
The Council discontinued this faculty productivity survey after the 1996 effort. This
is indicative of diminished interest in faculty productivity measures that has occurred in
this state within the last five years. Focus has shifted and is now centered on assessing
outcome measures of overall institutional effectiveness.
Defining Ranked Faculty for Productivity Measurement
Virginia distinguishes between traditional categories of faculty (e.g.,
tenure/nontenure track and traditional ranks). For purposes of the Integrated
Postsecondary Educational Data System (IPEDS) reporting, these traditional categories
are used and are listed in Appendix C.
Future Direction
Interest in faculty productivity measures has diminished at the state system level
over the past five years. As noted earlier, current interest is focused on institutional
effectiveness. In response to the Governor’s Blue Ribbon Commission on Higher
Education, the State Council on Higher Education developed the following measures of
academic quality and institutional efficiency:
! freshmen to sophomore retention rate;
! number of transfer students enrolled from two-year colleges;
! class size (below 20 and over 50);
! percentage of lower division courses taught by full-time faculty;

Approaches To Faculty Productivity Issues In Selected State Systems Of Higher Education
MGT of America, Inc. Page 3-17
! six-year graduation rate;
! average time to degree;
! percentage of living alumni who donate annually;
! classroom and laboratory space utilization;
! percentage of state education and general funding spent oninstruction and academic support;
! percentage of state management standards met;
! percentage of professionally accredited programs;
! debt service to expenditure ratio;
! research and public service expenditures per full-time faculty; and
! total SCHs taught per FTE faculty.
Reports on institutional effectiveness will be published annually as of this year to
provide institution-specific feedback to legislators, employers, and higher education
consumers. Though not directly related to funding by design, these reports are intended
to guide policymakers with information to support effectively crafted policies that promote
continuous improvement and accountability.
Institutional Comparisons
Peer comparisons are not done at the state level. Some institutions do this
individually, but there is no formal systemwide procedure or policy for developing peer
group comparisons.
Obstacles/Challenges
Institutions have not embraced institutional effectiveness reporting due to
concerns that unfair comparisons may occur resulting in penalization of institutions for
less than optimum performance. Additional revisions are still being considered to
establish clear definitions of institutional effectiveness and productivity, as this has been

Approaches To Faculty Productivity Issues In Selected State Systems Of Higher Education
MGT of America, Inc. Page 3-18
an ongoing challenge. Continuous refinements have been pursued in an effort to
compare institutions with similar missions and goals so that comparisons are fair.
3.2 Summary of Faculty Workload Policies/Measures Used in Other KeyStates
Several general themes emerged from in-depth interviews with SHEEOs in other
key states.
! Interest in outcome measures relative to institutional effectivenessand learner-centered education is emerging.
! Interest in faculty productivity is generally centered on instructionalactivities at the expense of research and service activities.
! Some states are currently exploring the use of peer institutional ornational benchmarking data, a valuable but time and resourceintensive endeavor.
Specifics of these and other general themes are discussed in the following sections.
3.2.1 Weighting/Factoring the Three Main Functions: Teaching, Research,and Service
Other states that we reviewed do not use a model to weight or factor teaching,
research, and service. Of those that are still specifically focused on assessing faculty
productivity, the metric of interest is instructional activity with little attempt to encompass
research or service activities. In general, legislative interest and understanding in other
states appears to be focused on models that monitor faculty time spent in classroom
teaching activities or, more recently, on institutional effectiveness.
3.2.2 Specific Measures Used to Analyze Faculty Productivity
As noted above, among the states we interviewed, attempts to measure faculty
productivity are limited largely to teaching activities. Of the five states reviewed, the
more comprehensive models for assessing faculty instruction activities are used in

Approaches To Faculty Productivity Issues In Selected State Systems Of Higher Education
MGT of America, Inc. Page 3-19
California and Texas. The California model is based on an annual survey of instructional
activities (University of California Instruction and Faculty Teaching Activities Report) and
includes specific measures listed on page 3-6.
The model used in Texas focuses on measures of organized instruction. This
model includes categories for research and service, but lacks a uniform manner by
which to measure these activities. Specific components of this model (instructional
activities, administrative assignments, other special assignments, and other policies) are
listed in detail on page 3-11 and 3-12.
3.2.3 Use and Dissemination of Faculty Productivity Data
In general, interest in faculty productivity has diminished somewhat in the past five
years among states that we interviewed. The extent of interest that remains is focused
on monitoring teaching activities. Some interviewees mentioned reluctance on the part of
their state systems to publish or widely disseminate faculty productivity data for fear that
this would lead to misunderstanding and divisiveness, thereby causing more harm than
good. An exception is the University of California Undergraduate Instruction and Faculty
Teaching Activities Report (page 3-6) which provides feedback to help ensure that
teaching practices are consistent with policy in the context of a continuous quest for
greater efficiency while maintaining educational integrity. Also, the emerging interest in
outcome measures of institutional effectiveness appears to be linked more directly to
policy development.
As noted earlier, some states (e.g., Arizona and Virginia) have shifted focus from
faculty productivity measures to assessment of institutional effectiveness and outcome
measures of “Learner Based Education.” These measures tend to be published widely to
provide feedback to legislatures, employers, and consumers. In Virginia, these reports
are not tied directly to funding, but are intended to guide decision makers with

Approaches To Faculty Productivity Issues In Selected State Systems Of Higher Education
MGT of America, Inc. Page 3-20
information to support effectively crafted policies that promote continuous improvement
and accountability.
3.2.3 Extent of Peer Institution Comparisons and Use of NationalBenchmarks of Faculty Productivity
Some states are currently exploring the use of peer institution or national
benchmarking data for comparison of faculty productivity. One example is the University
of California, which conducts annual peer comparisons of faculty teaching load
expectations developed through comparisons with eight selected out-of-state institutions
over the past 15 years. These same comparison institutions are also used for annual
faculty salary comparisons.
State Higher Education Executive Officers described the Delaware Study as the
premier model or initiative for the use of national benchmarks of faculty productivity.
North Carolina is implementing systemwide participation in the Delaware Study
database, which is widely recognized as a source of national benchmarking data by
department and discipline according to Carnegie classification. Some officials
mentioned that individual institutions in their states seek national benchmark
comparisons of faculty productivity in the absence of a state-based, systemwide
approach to monitoring this issue.
3.2.4 Challenges Typically Faced in Measuring Faculty Productivity
Challenges mentioned by State Higher Education Executive Officers in measuring
faculty productivity included the following:
! Teaching activities are more easily quantified and measured thanresearch and service activities. This path of least resistance is oftenchosen in assessing faculty productivity.
! Some interviewees commented on the challenge of achieving anappropriate reporting methodology that is not overly simplistic oroverly detailed.

Approaches To Faculty Productivity Issues In Selected State Systems Of Higher Education
MGT of America, Inc. Page 3-21
! Obtaining accurate self-reported data is a widely reported challenge.
! Achieving a consistent statewide uniform reporting methodology is afrequently mentioned challenge.
! Accommodating departmental objectives, institutional objectives,and systemwide objectives is mentioned as a frequent challenge.
! Although the current focus is on measuring institutionaleffectiveness, it may be difficult to sell institutions on this conceptdue to concerns about inappropriate comparisons or being penalizedfor less than optimum performance.
3.2.5 Measures of Institutional Effectiveness and Learner-CenteredOutcomes
As previously noted, SHEEO interviews generally indicated an emerging interest
in measures of institutional effectiveness and learner-centered outcomes. Arizona has
developed categories of outcome measures centered on assessment of “Learner Based
Education.” A complete listing of these outcome measures is included in Appendix 3-A.
Fourteen measures of institutional effectiveness and academic quality comprise the
Virginia model. These are listed on pages 3-16 and 3-17.
3.2.6 Implications for Establishing Guidelines or “Best Practices” forFlorida
Considerable information can be derived from the SHEEO interviews to develop
best practice guidelines for measuring faculty productivity in the State of Florida. In view
of trends and practices in other states, the following issues should be considered in
refining a faculty productivity model for Florida.
! National faculty performance benchmarks (such as the DelawareStudy) should be systematically applied by all institutions. Otherwise,statewide performance data are limited in usefulness.
! National benchmarking should involve peer institution comparisonsby academic discipline and department level, as recommended inthe Delaware Study.
! Analysis of instructional activities alone provides an incompletepicture of faculty activities. Research and service activities, with a

Approaches To Faculty Productivity Issues In Selected State Systems Of Higher Education
MGT of America, Inc. Page 3-22
focus on outcomes, should be included in analyses of facultyproductivity.
! Outcome assessments involving input from current students,graduating students, alumni, and employers have provided usefulfeedback in other states concerning outcomes resulting from facultyactivities.
! The most innovative approaches to faculty productivity that weobserved involved embedding faculty productivity within outcomemeasures of institutional effectiveness. The focus on overallinstitutional effectiveness outcome measures is intended to promoteaccountability and effectively communicate objectives andaccomplishments of higher education to all key constituents(students, legislators, parents, employers, and others).
! Published reports on institutional effectiveness can serve to guidepolicymakers with information to support effective crafting or revisingof policies to promote continuous improvement and accountability.

4.0 FLORIDA'S PUBLICUNIVERSITY RESPONSES TO
MEASURING FACULTYPRODUCTIVITY
Florida's Public University Responses to Measuring faculty Productivity
Page 4-1
4.0 FLORIDA'S PUBLIC UNIVERSITY RESPONSES TOMEASURING FACULTY PRODUCTIVITY
4.1 Introduction
This chapter provides summary information relating to the measurement of faculty
productivity and standards of achievement within each university included in this study.
Information about procedures at each institution for collecting faculty activity data and
the reporting and use thereof was gathered through on-campus interviews with
university provosts and/or staff at each respective institution. The outline of this chapter
is as follows:
♦ Overview of current statutes and guidelines governing the reportingof faculty activity. A description of Florida's "12-Hour" law, which definesthe standard for classroom teaching at Florida's public universities, as wellas an overview of the current interpretation of that law.
♦ Outline of State University Accountability Reporting Efforts. Adescription of the current accountability reporting procedure as it relates tothe issue of faculty productivity.
♦ University Measures of Faculty Productivity. An outline of theprocedures in place at each institution for collecting, reporting, and utilizingdata relating to faculty productivity.
♦ Summary of Institutional Approaches to Measuring FacultyProductivity. A discussion of the procedures used by Florida's publicuniversities in the context of establishing an effective system formeasuring faculty productivity.
4.2 The 12-Hour Law
Chapter 240.243(2), F.S. delineates Florida's standard for classroom teaching. It
states that:
"Each full-time equivalent teaching faculty member at a University who ispaid wholly from state funds shall teach a minimum of twelve classroomcontact hours per week at such university."

Florida's Public University Responses to Measuring faculty Productivity
Page 4-2
According to additional language included in 240.243(2), the minimum twelve-
hour classroom teaching load may be reduced when faculty members are assigned
other professional responsibilities by appropriate university administrators. In such
instances, faculty members are to teach "a minimum number of classroom contact hours
in proportion to 12 classroom hours per week as such especially assigned
aforementioned duties bear to 12 classroom contact hours per week."
Chancellor’s Memorandum (CM) 87-17.2 was developed by the former Board of
Regents in 1987 to provide guidance to the universities in implementing the 12-hour law.
Information posted on the web site of the Division of Colleges and Universities states
that this CM is currently under revision. However, according to Division staff, the
guidelines in effect at this time are provided in CM-C-12.06/99, pursuant to a June 22,
1999 transmittal memo from Adam Herbert, then Chancellor of the State University
System. These guidelines provide an “Academic Activity Reporting Guide”, and include
instructions, definitions, and formats for reporting academic activities. Definitions are
provided to the universities for the following terms:
♦ Contact Hours: a standard one-hour (minimum 50 minutes) classroom period.
♦ Contact Hour Equivalencies: to allow for assignment of time for “other thanclassroom instruction” hours.
♦ Academic Position: all persons who perform credit generating activities for theuniversity.
♦ Designated Effort: percent of time available spent on activities
♦ Maximum Calculated Effort: the largest percentage of time that can beassigned for a position designated effort.
♦ Total Effort: the sum of the academic position’s efforts for all activities.
For purposes of reporting actual activities, academic assignments are designated
either as "credit generating" or "non-credit generating." Credit generating activities
include the following:

Florida's Public University Responses to Measuring faculty Productivity
Page 4-3
♦ Classroom Instruction♦ Thesis/Dissertation Supervision♦ Directed Individual Study♦ Supervision of Student Interns♦ Supervision of Teaching/Research♦ Instructional contact hour modifiers/credit generating♦ Graduate laboratory assistants.
Of these, only the first, "Classroom Instruction," is assigned contact hours, which are
broadly defined as the number of hours the section meets each week. The term
"classroom instruction" is narrowly defined as regularly scheduled classroom meetings
or laboratories that result in the production of student credit hours. Other credit
generating activities are assigned contact hour equivalencies in accordance with the
guidelines specified in CM 87-17.2.
Non-credit generating activities that are reported in compliance of the 12-Hour law
are listed below:
♦ Graduate assistant course graders♦ Secondary instructional site travel♦ Other instructional effort – would provide for reporting efforts to develop new
curricula or evaluate existing programs♦ Supervision of cooperative education♦ Clinical instruction♦ Research♦ Public service♦ Academic administration♦ University governance♦ Leave of absences with pay♦ Release time under the United Faculty of Florida (UFF) collective bargaining
agreement.
All non-credit generating instructional activities are assigned contact hour
equivalencies.
4.3 State University Accountability Reporting
There have been a number of accountability measures and reports required by
the Legislature since the early 1990’s. Between 1991 and 2001, numerous goals and

Florida's Public University Responses to Measuring faculty Productivity
Page 4-4
objectives have been put forward to provide the Legislature and general pubic with a
better understanding of what the higher education delivery systems produce for the
resources that are expended. With the focus on performance-based budgeting in the
mid-1990s, specific, measurable goals were required as a condition of performance
funding. The current emphasis on zero-based budgeting also requires accountability for
the programs and services being produced to ensure appropriate resource allocation.
As noted above, various accountability measures have been articulated within
statute over the past decade and reports have been submitted which provided data in
fulfillment of these requirements. The most recent set of measures directing Florida
public university reporting are contained in the 2001 General Appropriations Act and
Implementing Bill. The Florida Board of Education is soon to release the State
University System Accountability Report, which includes 24 measures drawn from
performance measures outlined in the General Appropriations Act and Implementing Bill.
These measures focus upon output and outcome measures relating to the
instruction, research, and public service functions of the state universities. The
Accountability report provides performance-related data on a broad range of issues
relating to university performance, of which faculty productivity is but one small part.
Four of the outcome measures detailed in the Board of Education Accountability Report
are similar to those presented in Chapter 5 of this productivity analysis. They are as
follows:
♦ Of the total lower level instructional effort by level, the percentage of effortprovided by faculty;
♦ Of the total upper level instructional effort by level, the percentage of effortprovided by faculty;
♦ Of the total graduate level instructional effort by level, the percentage ofeffort provided by faculty; and
♦ Externally generated research and training grant funds per state-fundedfaculty member

Florida's Public University Responses to Measuring faculty Productivity
Page 4-5
The corresponding measures used in this analysis are presented in Exhibits 5-4
and 5-20 in Chapter 5.0.1
4.4 Institutional Approaches to the Issue of Faculty Productivity
In order to obtain information about how individual institutions deal with the issue
of faculty productivity, a Survey on Faculty Productivity Policies and Practices was
conducted. University provosts or their staff were asked to respond generally to the
following questions:
1. How do you measure faculty productivity at your institution?♦ What specific factors do you include in your analysis?♦ How are the three main functions (teaching, research, and service) weighted
and factored into faculty workload calculations and how was the decision madeabout how to do this?
♦ Where do the data come from? How is measurement done?♦ How often is the analysis done?♦ How are the results used?♦ Who routinely sees the results?♦ What are the best measures for determining faculty productivity?♦ Do you use any national benchmarks or standards for comparison of faculty
productivity? If yes, what are these?
2. Do you compare yourself with other institutions on measures of productivity? If so,with whom and for what reason?
3. Is there a standard teaching load at your institution? How is the 12-hour lawimplemented? At what level is teaching load determined – department? College?Other?
4. What is the best way to quantify faculty work activities? What is the role of thefaculty (individual, department, and/or university) in this process? Do faculty haveinput or review authority at any level or is it a “top-down” process?
5. If starting anew, how would you design an annual study of faculty productivity, andwith whom would you compare your institution?
1 Please note that while these measures are similar to those presented in the Board of Educationreport, they are not identical. For instance, whereas the Board of Education AccountabilityReport provides the percentage of total instructional effort provided by all regular facultymembers, the corresponding measure in Chapter 5 of this report defines the population of facultyin a more restrictive manner. Differences between the two reports with respect to thesemeasures are due to differences in the definition of faculty.

Florida's Public University Responses to Measuring faculty Productivity
Page 4-6
Salient details of the Universities' responses to these questions, as well as
information drawn from additional materials supplied by the institutions, are presented
below.
4.4.1 The University of Florida
Measures of Faculty Productivity. Measures of faculty productivity at the University of
Florida (UF) include a host of indicators relating to the core faculty functions of teaching,
research, and service. The following specific measures are employed for purposes of
assessing faculty productivity:
! Semester and annual fundable student credit hours produced by level;
! Course sections taught by level and type of course section;
! Headcount enrollment by level;
! FTE effort by type of faculty and type of activity;
! Quality of instruction as measured by peer and student evaluations;
! Contracts and grants generated;
! Private and other funds raised; and
! Election of faculty to major academies and leadership positions in professionalsocieties.
Individual faculty members are assigned duties in accordance with the 12-Hour
law and all UF faculty members are in compliance of that statute. Assignments are
made via Semester Faculty Assignment Reports, which capture data regarding the
percentage of instructional assignment devoted to the various levels and types of
instruction, as well as the assignment of faculty FTE effort to other activities (e.g.
research, public service). A copy of the UF Semester Faculty Assignment Form and
accompanying instructions is provided in Appendix 4-B.

Florida's Public University Responses to Measuring faculty Productivity
Page 4-7
Benchmarking and Comparison with Other Institutions. UF has in place a
benchmarking procedure that requires colleges and departments within the institution to
compare themselves on resources, teaching, and research with equivalent units at the
Ohio State University, the University of Minnesota, and the University of Illinois. These
three institutions have been selected as most appropriate for these comparisons; they
are of similar size and academic scope. Also, UF feels they are models of excellent
quality and productivity that provide more than adequate standards of comparison.
In addition to these three core comparators, each academic unit has added others
from among those American Association of Universities (AAU) institutions that have
excellent programs. Hence, benchmarks are provided for all units across the institution
as well as for specific disciplines at UF. These benchmarking procedures are conducted
on a three-year rotation for each college and academic unit at the university. This
procedure began in 1994-95 with approximately one-third of the colleges collecting
benchmarking data; an additional one-third followed suit each subsequent year.
Purposes and Use of Productivity Data. The provost conducts annual program
reviews with the dean of each college for purposes of reviewing not only the college
benchmarking data, but also data collected on the productivity of ranked faculty in such
areas as the production of student credit hours, headcount enrollment, degrees
awarded, and sponsored research. In addition, the program reviews provide an
assessment of the progress of the individual colleges over the course of several years.
UF also uses faculty productivity data for purposes of resource allocation. Known
as the "Bank", the model employed for this purpose is designed to reconcile university
costs, resources, and productivity by determining which departments or academic units
are net "contributors" and which consume more resources than they generate. These
surpluses and deficits are then translated into decisions about resource allocation for
individual departments.

Florida's Public University Responses to Measuring faculty Productivity
Page 4-8
The procedures in place at the University of Florida for measuring and reporting
faculty activity and productivity were developed with faculty involvement; the university is
satisfied with the process currently in place and feels that it has served the institution
well in assessing the productivity and performance of their programs.
4.4.2 Florida State University
Measures of Faculty Productivity. As with the University of Florida, Florida State
University (FSU) measures faculty productivity in the areas of teaching, research, and
service, as well as faculty assignments. Teaching productivity data are collected each
semester, while research and service data are collected annually. Among those
measures employed to assess productivity are the following:
! Direct Instructional Activities
" Total student credit hours" Total students taught, by level" Formal courses taught, by type of course section" Student evaluations
! Graduate Education/Research
" MS students directed" Ph.D. students directed" Graduate committees
! Direct Research
" Publications" Performances" Citations" Reviews" Proposals submitted" Grants awarded

Florida's Public University Responses to Measuring faculty Productivity
Page 4-9
! Service Activities
" Departmental and university committees" State service" National service
These data are derived from the Instruction and Research Data Files maintained
by the Florida Division of Colleges and Universities (DCU), as well as from federal and
state agencies. Other organizations, such as the National Center for Education
Statistics' Integrated Postsecondary Education Data System (IPEDS) and the Institute
for Scientific Information, also provide information.
In addition to the many commonly used quantitative measures of productivity, FSU
devotes significant attention to the issue of teaching quality. The State University
System Student Assessment of Instruction (SUSSAI) is administered in every course
each semester in order to capture student evaluations of the quality of the instruction
received.
Faculty assignments are made according to the dictates of the 12-Hour law.
Nevertheless, assignments are made in recognition of the fact that differences across
disciplines, career status of the faculty member in question, and the needs of the
university are important considerations. Hence, the weights assigned to teaching,
research, and service activities vary according to individual faculty members.
Benchmarks and Comparison with Other Institutions. At the university level, FSU
sets performance benchmarks based upon comparisons among 50 National Public
Research I institutions that have been carefully selected according to size, mission,
budget, and other relevant distinctions.2 The university compares itself to these
institutions on the measures previously described.
2 Appendix 4-A contains lists of peer institutions for those institutions that provided such lists.

Florida's Public University Responses to Measuring faculty Productivity
Page 4-10
In addition to this diverse set of national research institutions, FSU uses the
National Study of Instructional Costs and Productivity, commonly referred to as the
"Delaware" study, for purposes of comparison on a variety of indicators specific to the
issue of faculty productivity. This study allows for comparison to national data on such
measures as student credit hour production, courses taught, and class size, among
others.
Purposes and Use of Productivity Data. Productivity data are available to and
reviewed by the university president, provost, college deans, and department
chairpersons. The data are used primarily for purposes of resource allocation or
reduction, and review of individual faculty members for purposes of granting tenure. FSU
has taken care to tailor its process of measuring productivity to its unique needs and
mission and feels that the system in place is sufficient.
4.4.3 The University of South Florida
Measures of Faculty Productivity. The University of South Florida (USF) has a highly
developed system both for tracking faculty activity and for utilizing these data for
purposes of resource allocation and tenure review. Faculty productivity is measured at
the aggregate level and for individual faculty members. Specific aggregate level factors
involved in the analysis of productivity at USF include student/faculty ratios at the
university and college levels, retention and graduation rates, private fundraising and
student credit hour production. At the individual level, USF provided the following list of
specific factors included in their analysis:
! Quality and quantity of teaching as measured by student evaluations,syllabi, peer evaluation, advising, supervision of student activities, as well as

Florida's Public University Responses to Measuring faculty Productivity
Page 4-11
standard measures of student credit hours produced, course sections taught,students taught, classroom contact hours, etc;
! Research productivity and creative activity as measured by number ofpublications, presentations, number and amount of grant awards, professionalhonors and awards, and other activities that serve to "advance the body ofknowledge or creative expression" in individual faculty members' fields;
! Service to the profession in advancement of the discipline, service to thecommunity, and other indicators of national and/or international recognition.
USF believes that the best indicators of faculty productivity are tenure and
promotion to the rank of professor, as these indicators provide a measure of
accomplishment in all areas of faculty activity that reflect achievement over the course of
several years.
Productivity at USF is measured annually and throughout faculty members'
careers. Each year, department chairpersons and faculty evaluation committees review
faculty; tenure-earning faculty are reviewed annually in terms of progress toward tenure.
Once having acquired tenure, faculty members undergo post-tenure review every seven
years.
At the aggregate level, data are obtained from a variety of sources, including the
DCU Instruction and Research Data File (This serves as the source of data for USF's
InfoMart system, which provides online access to faculty productivity and other
institutional performance data), the Sponsored Research Annual Report, Performance
Incentive Reports, strategic plan goals, departmental profiles, and departmental
enhancement goals. External data sources such as IPEDS and the National Science
Foundation (NSF) also provide aggregate level data.
Individual level data are obtained from self-reporting instruments such as activity
reports and annual reports of accomplishments. The Sponsored Research Annual
Report, InfoMart, and Performance Incentive Reports include data for individual faculty
members, as well.

Florida's Public University Responses to Measuring faculty Productivity
Page 4-12
Faculty assignments are made in consideration of a number of factors. Included
in the determination of individual faculty weightings of teaching, research, and service
duties are the terms of the United Faculty of Florida (UFF) Collective Bargaining
Agreement that governs faculty contracts; departmental practices with respect to such
factors as tenure status, external funding record, and non-instructional productivity; and
program mix and curriculum, e.g. the existence of undergraduate, masters and doctoral
programs as well as departmental staffing needs.
While individual faculty members may be assigned variable loads, the university
has minimum levels of teaching, research, and service that are expected from all faculty
members; these standards are governed by internal workload policies established at the
institutional level.
Benchmarking and Comparison with Other Institutions. USF uses a number of
benchmarks to measure its performance in the area of faculty productivity and
institutional effectiveness. Among these are IPEDS, NSF, the American Association of
University Professors, and the Metropolitan University Group Data Exchange. USF also
uses a peer comparison group consisting of ten institutions deemed similar in size,
scope, mission, and demographics. It complements this group of institutions with a set
of three aspirational peers. Departments and colleges also select peers that closely
match the profile of the college or department in question.
Purposes and Use of Productivity Data. Faculty productivity data are used for
purposes of planning program expansions/contractions, identification of programmatic
priorities, progress on departmental plans, and in program reviews for budgetary
purposes with respect to resource allocation. In addition, evaluative productivity data
are made available to faculty members' supervisors, e.g. department chairpersons and
deans, who may use them to make faculty personnel decisions regarding merit salary
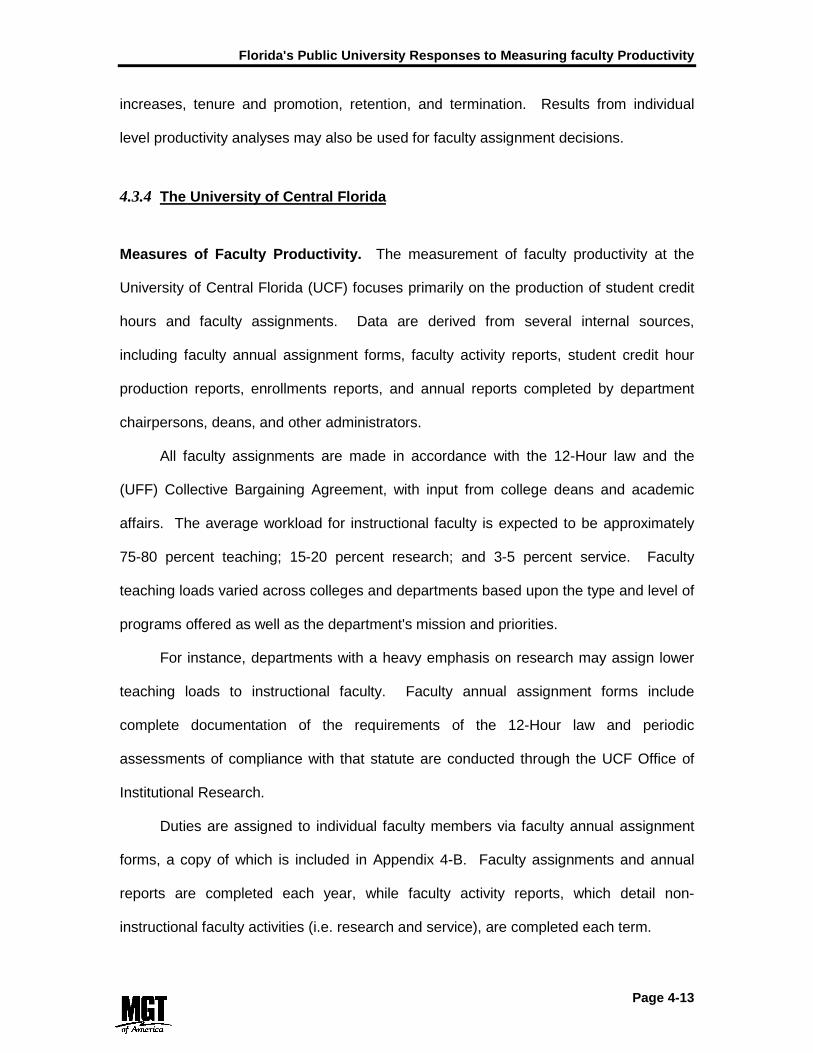
Florida's Public University Responses to Measuring faculty Productivity
Page 4-13
increases, tenure and promotion, retention, and termination. Results from individual
level productivity analyses may also be used for faculty assignment decisions.
4.3.4 The University of Central Florida
Measures of Faculty Productivity. The measurement of faculty productivity at the
University of Central Florida (UCF) focuses primarily on the production of student credit
hours and faculty assignments. Data are derived from several internal sources,
including faculty annual assignment forms, faculty activity reports, student credit hour
production reports, enrollments reports, and annual reports completed by department
chairpersons, deans, and other administrators.
All faculty assignments are made in accordance with the 12-Hour law and the
(UFF) Collective Bargaining Agreement, with input from college deans and academic
affairs. The average workload for instructional faculty is expected to be approximately
75-80 percent teaching; 15-20 percent research; and 3-5 percent service. Faculty
teaching loads varied across colleges and departments based upon the type and level of
programs offered as well as the department's mission and priorities.
For instance, departments with a heavy emphasis on research may assign lower
teaching loads to instructional faculty. Faculty annual assignment forms include
complete documentation of the requirements of the 12-Hour law and periodic
assessments of compliance with that statute are conducted through the UCF Office of
Institutional Research.
Duties are assigned to individual faculty members via faculty annual assignment
forms, a copy of which is included in Appendix 4-B. Faculty assignments and annual
reports are completed each year, while faculty activity reports, which detail non-
instructional faculty activities (i.e. research and service), are completed each term.

Florida's Public University Responses to Measuring faculty Productivity
Page 4-14
UCF feels that the best measures for measuring the productivity of faculty include
the following:
! Student credit hour production;! External dollars generated per faculty member;! Total external funding received;! Number of faculty who received teaching, research, and service awards;! Number of peer-reviewed publications per faculty member; and! Number of academic presentations per faculty member.
Benchmarking and Comparison with Other Institutions. Comparisons with peer
institutions at UCF are not specific to the topic of faculty productivity. The institution
compares itself to a number of different peer groups on a multitude of variables. UCF
also compares itself on some variables to certain other Florida public institutions. In
addition to the public DCU institutions, UCF has selected a host of institutions, divided
into different peer groups, for purposes of comparison on specific institutional
characteristics.
Purposes and Use of Productivity Data. Faculty productivity data are used for
purposes of faculty assignment, estimating faculty work load, enrollment management,
student advising needs, development of new programs, and a variety of other university,
college, and departmental needs. In addition to these uses, however, UCF has
developed a sophisticated system of resource allocation called the "Pegasus" Funding
Model.
Pegasus allocates resources to each of the university's principal funding units
based upon that unit's production of student credit hours in the previous year. These
credit hours are translated into annualized (12-month) full-time equivalent faculty
positions via the use of productivity factors for each unit and instructional level (lower,
upper, graduate classroom, and thesis/dissertation). These productivity factors were
derived from the average credit hour productivity of faculty in the ten universities of the

Florida's Public University Responses to Measuring faculty Productivity
Page 4-15
Florida State University System. Faculty lines may then be allocated to each
department in a systematic manner according to its productivity with respect to student
credit hours.
4.4.5 Florida International University
Measures of Faculty Productivity. Florida International University (FIU) employs a
variety of factors weighted against the 12-Hour law to measure faculty productivity. The
typical course load for instructional faculty at FIU varies according to faculty type and the
type of assignments they have. Instructors are expected to carry a 4/4 course load (i.e.
they teach four courses per term); the average ranked faculty member is expected to
carry a 3/3 course load; tenured faculty members heavily involved with research, as well
as administrative faculty, often carry a load of only two courses per term.
The Office of Institutional Planning and Effectiveness has implemented a
Departmental Planning Indicator model for each academic unit at FIU. This model
includes the following specific factors for each department:
! Fall headcount enrollment;! Degrees awarded;! FTE student enrollment by level and per FTE faculty member;! Actual and planned student credit hour production (fundable SCH only);! Direct discipline instructional cost by instructional level;! Graduate satisfaction survey results;! Accreditation status;! Instructional effort by faculty category;! Educational and General (E&G) research expenditures; and! Contracts and grants awards.
Administrator and faculty access to these data is provided on the FIU web site.
Analyses are completed annually using a three-year running average for university,
department, college, and per-faulty measures of productivity. FIU believes that utilizing
Florida's Public University Responses to Measuring faculty Productivity
Page 4-16
a three-year average compensates for anomalies or non-routine factors that may occur
in specific academic years.
Faculty work assignments are based upon guidelines issued by the university
administration as well as college deans, who have leeway to alter individual faculty
assignments according to the circumstances of the department and the faculty member
in question.
Teaching assignments are weighted based upon such considerations as class
size, preparation time, campus location of course sections, number of in-class contact
hours per week, repetition of the assigned course over several academic terms, teaching
assistants assigned to the class, and other similar factors.
Benchmarking and Comparison with Other Institutions. Although FIU is aware of
other studies and factors commonly utilized for measuring faculty productivity, they have
constructed their model to reflect the particular goals and situation facing their institution.
FIU does not currently use peer institutions for purposes of comparison on faculty
productivity measures, although such peers are used for other types of comparisons
related to institutional performance (for instance, enrollment levels, staffing, etc.).
Purposes and Use of Productivity Data. Productivity data are used for purposes of
budgeting and allocation of faculty lines and resources. Patterns of productivity are
monitored for several years, after which decisions about budget allocation are made.
FIU has an Enrollment Management Plan derived from specific student credit
hour goals and objectives set for the university, each campus, and each academic unit.
Their budget allocation model, known informally as the "Panther" model, is based on
these goals and objectives, using productivity data to track SCH production down to the
academic department level. Like the UCF "Pegasus" model, from which the Panther

Florida's Public University Responses to Measuring faculty Productivity
Page 4-17
model was partially derived, average SCH productivity factors for the state university
system are used to provide a standard for decision makers to allocate budget resources.
4.4.6 Florida Atlantic University
Measures of Faculty Productivity. Measurement of faculty productivity at Florida
Atlantic University is similar in most respects to the procedures in place at FIU. For
instance, FAU tracks student credit hour production and FTE faculty assignment at the
university, college, department and program levels. The model, which has evolved over
time, presently accounts for such factors as class size, location, preparation time, course
repetition, etc.
The 12-Hour law and the UFF Collective Bargaining Agreement govern the
assignment of faculty duties. The typical instructional teaching load at FAU is expected
to be 4/4 (four "3-hour" courses per term) for those faculty with only teaching
assignments, 3/3 for those with other assignments in research or service, and lower for
administrative faculty.
Data are derived from faculty productivity reports, class assignments, and
enrollment and student credit hour reports. These reports are produced each semester,
with a review of the data being conducted annually using a three-year time period for
comparison (FIU employs the same technique). FAU believes that their model is well
suited to meet their needs.
Benchmarking and Comparisons with Other Institutions. Although FAU is aware of
the prominent models currently employed to measure faculty productivity nationally (e.g.
The Delaware Study), they do not currently utilize them for purposes of comparison or
benchmarking. FAU compares progress internally in order to identify overachieving and
underachieving programs. The institution has developed lists of peer institutions for

Florida's Public University Responses to Measuring faculty Productivity
Page 4-18
other purposes, although the comparator institutions vary according to the type of
comparison being made.
Purposes and Use of Productivity Data. Deans and department chairs use the data
for purposes of meeting productivity goals consistent with the university strategic plan
and enrollment management objectives. They have the leeway to allocate resources in
their academic units in order to meet or exceed these goals. The data are also used to
make decisions relative to individual faculty productivity and evaluation. Productivity
data are made available online to deans and department chairpersons as well as faculty
members.
4.4.7 Florida Agricultural and Mechanical University
Measures of Faculty Productivity. Faculty productivity at Florida Agricultural and
Mechanical University (FAMU) is measured primarily by adherence to the 12-Hour law.
Specifically, the university uses an Assignment of Responsibility Form, which is divided
into two broad categories of activity: those that generate credit hours and those that do
not. To ensure that faculty members meet the statutory requirements of the 12-Hour
law, an average of 80 percent FTE effort must be devoted to credit generating activities.
The remaining 20 percent is devoted to non-credit generating activities, such as
research, service, administration, and any other duties that may be assigned.
Department chairpersons, in consultation with individual faculty members, make written
assignments based on the needs of the program and the university. Such assignments
reflect the expected performance of all instructional and research duties.
Faculty assignment data are compiled into an instruction and research database,
allowing for analysis of student credit hours and contact hours per FTE faculty member.
Teaching load data are derived from class schedule data files. Such analyses are made

Florida's Public University Responses to Measuring faculty Productivity
Page 4-19
each academic term, with a complete review of productivity measures for the full year
compiled annually.
Benchmarking and Comparison to Other Institutions. FAMU does not compare itself
to peer institutions, either within Florida or out-of-state, on measures of faculty
productivity. As a comprehensive multipurpose land-grant institution, FAMU feels that it
is essentially different in mission and goals from other public institutions in Florida.
Purposes and Use of Productivity Data. FAMU identified three central tasks
addressed by the collection and reporting of productivity data. Specifically, such
information is collected for purposes of:
! making institutional decisions relative to meeting established universityaccountability measures;
! verifying the productivity of individual faculty members, thus enablingsupervisors to better counsel them on matters relating to promotion, tenure,research, and other factors that contribute to faculty welfare; and
! determining faculty members' eligibility for teaching incentive awards thatmay be established by the state or university.
Results of faculty productivity analyses are most often distributed to, and used by,
department chairpersons, college deans, other university administrators, and more
recently by the university Board of Trustees.
4.4.8 The University of North Florida
Measures of Faculty Productivity. The 12-Hour law is the basis of assessing faculty
productivity at the University of North Florida (UNF). Approximately 95 percent of faculty
are expected to follow a 3/3 course load (three courses per term); the remainder are
those faculty members who are heavily involved in research or grant solicitation.
Teaching activity is intended to account for about 75 percent of faculty workload. The
other 25 percent are to be devoted to either research or service.

Florida's Public University Responses to Measuring faculty Productivity
Page 4-20
Department chairpersons work closely with individual faculty members to assign
research and service activities in satisfaction of the 25 percent requirement for such
duties. Accomplishment of these objectives is evaluated during faculty annual reviews;
the most telling measure of accomplishment and productivity at UNF is promotion and
tenure.
UNF also closely monitors teaching quality as measured by student evaluations
such as the SUSSAI or SIRS (Student Instructional Rating System). Productivity data
are compiled and published annually. Separate published reports are produced for
faculty service and research activities.
Benchmarking and Comparison with Other Institutions. UNF does not currently
make use of any external benchmarks or peer institutions to evaluate faculty
productivity, although they are interested in doing so. UNF expressed interest in
comparisons with a set of aspirational institutions, although the institution notes that
comparisons with other public DCU institutions should be made in cognizance of the
inherent difference in the challenges and situation of each institution.
Purposes and Use of Productivity Data. Deans and executive administrators use
productivity data to monitor overall departmental and institutional quality and progress
toward goals. Results of productivity analyses may also be used to justify awarding
funds in support of faculty presentations at conferences.
4.4.9 The University of West Florida
Measures of Faculty Productivity. The system in place at The University of West
Florida (UWF) is essentially the same as that at UNF. The 12-Hour law is the primary
standard by which productivity is assessed and faculty assignments are made.

Florida's Public University Responses to Measuring faculty Productivity
Page 4-21
Individual faculty members are assigned a 3/3 course load, with the remaining portion of
their effort assigned to research, public service, curriculum development, administration,
and other instruction-related activities.
Data are collected via Faculty Assignment Forms at the beginning of the term
and via Faculty Activity Reports at the end of the term. An automated Faculty Activity
Reporting System (FARS) retrieves information from Student Data Course Files,
Instructional Activity Files, and Payroll Files and compares actual contact hours to
assigned contact hours. The accomplishments of other assigned activities are reported
by individual faculty and certified by the chairs, the deans, and the provost. All of this
information is fed into the Instruction and Research Data File for reporting and analysis
purposes and is eventually fed into the annual Expenditure Analysis which demonstrates
university-wide workload information. If faculty members do not demonstrate satisfactory
progress in fulfillment of assigned duties, course load modifications may be made based
upon a 4/4 teaching load maximum (This is equivalent to 100 percent FTE effort).
Benchmarking and Comparison to Other Institutions. UWF has developed a
relationship with peer institutions and aspirational institutions for purposes of comparing
a number of measures, including faculty productivity. UWF routinely participates in the
Delaware Study (See Chapter 2), and is developing a formal procedure for
benchmarking and comparison of faculty productivity data. .
Purposes and Use of Productivity Data. Productivity data are used for purposes of
faculty evaluation with respect to promotion and tenure decisions and for monitoring and
assessing overall departmental and institutional performance and quality. Also,
longitudinal productivity models are used by the provost for allocations of faculty
positions, allocations of operating budgets, and allocations of other resources.
Florida's Public University Responses to Measuring faculty Productivity
Page 4-22
4.4.10 Florida Gulf Coast University
Measures of Faculty Productivity. In order to receive additional funding under the
current university funding formulas, Florida Gulf Coast University (FGCU) is heavily
focused on expanding enrollments to reach target levels. Hence, its attention to the
issue of faculty productivity is restricted primarily to the generation of student credit
hours. As a comprehensive institution, instruction is the main function of faculty at
FGCU. Hence, teaching makes up 75 percent of ranked faculty assignment and 100
percent of instructors' and lecturers' duties. The remaining time is assigned at the
discretion of the faculty member in consultation with his/her supervisor. Faculty interest
and the needs of the academic unit dictate service assignments.
Faculty productivity data are obtained both from instructional assignments
recorded by the Office of the Registrar and non-instructional assignments outlined in
Faculty Activity Reports and submitted to the Office of the Provost. These data are input
and made available to the provost and college deans each semester.
Benchmarking and Comparison with Other Institutions. FGCU is concerned about
comparisons with other institutions within Florida, both public and private. The university
is still trying to reach a fixed level of enrollment for budgetary purposes and many of their
programs are not yet fully developed. Hence, the overwhelming majority of faculty effort
has been directed toward teaching, with an emphasis on developing both classroom
based courses and distance education offerings.
Due to these factors, FGCU has neither developed a list of peer institutions nor
attempted to benchmark its performance with respect to faculty productivity. The
provost is currently in the process of identifying a new set of appropriate "peer"
institutions for management, operational, and academic comparisons.

Florida's Public University Responses to Measuring faculty Productivity
Page 4-23
Purposes and Use of Productivity Data. FGCU uses student credit hour data to make
decisions relative to the assignment of faculty for upcoming semesters and to ensure
that performance goals are being met. These data also allow the institution to evaluate
whether faculty workload is distributed in an equitable manner and to assess and make
adjustments to course enrollment caps. Deans are evaluated on their ability to manage
faculty productivity.
4.5 Summary of Institutional Approaches to Measuring Faculty Productivity
The most immediately apparent conclusion to be drawn from the information
presented in this chapter is that all of the public DCU institutions have in place a system
by which faculty productivity and effectiveness are monitored and evaluated. Although
the methods employed may vary to some degree across universities, a few notable
points about these procedures are evident:
! The measurement of faculty productivity at all of the institutionsdevolves from the application of the 12-Hour law. Faculty assignmentsat each of the universities begin with the premise that faculty are to carry a4/4 course load (assuming 3-credit hour courses), to be reduced according tothe research and/or service expectations inherent in each institution oracademic unit.
! Measures of productivity are specifically tailored to each institution.Most of the institutions expressed the concern that all of the public DCUinstitutions face different challenges and have different goals. Given that,each institution has developed a system of faculty evaluation that addressesits unique needs. Many institutions have selected peer and aspirationalinstitutions for the purpose of benchmarking performance at both theinstitution and academic unit levels.
! Measures of faculty productivity focus on all aspects of faculty activity.Because of the primacy of the 12-Hour law in the development andimplementation of institutional policies regarding faculty productivity, most,though not all, of the universities evaluate productivity in all three areas offaculty activity (teaching, research, and service). The 12-Hour lawspecifically provides for the assignment of such duties; many of theuniversities have made performance in these areas a part of their evaluationof faculty productivity.

Florida's Public University Responses to Measuring faculty Productivity
Page 4-24
! Faculty Productivity is a crucial element of the review process forindividual faculty. Deans and department chairpersons at each institutionare provided with evaluative data on a regular basis for purpose of reviewand adjustment to individual faculty members' assignments. Progress andsatisfactory completion of assignments and productivity goals are in manycases the linchpin in decisions regarding tenure and/or promotion as well asin the post-tenure review process.
! Measures of productivity are used to rationally allocate institutionalresources. In addition to assessing individual faculty for purposes of tenurereview and promotion, the majority of the institutions indicated that these dataare used to inform the process by which budgeting decisions are made.Some of the institutions (most notably UF, USF, UCF, UWF, and FIU) havedeveloped formal models intended to standardize the allocation of facultylines and budgetary resources to the various academic units within theuniversity.
Most of the institutions are satisfied with the procedures that they currently use to
assess faculty productivity. The universities all indicated that productivity data are
crucial in decisions about assignments, promotion, and/or tenure. As models for
internally allocating resources among academic units and for reviewing faculty members
at the individual level, the procedures in place appear to be quite effective.
Each institution has developed a unique model for evaluating faculty productivity
by employing different types of specific quantitative and qualitative measures, many of
which are not published or reported outside of the institutions. As noted in Chapter 3,
the development of best practice guidelines for monitoring faculty productivity should
involve national peer performance benchmarks. Currently, several public DCU
institutions have their own unique systems of peer benchmarking, and some conduct no
peer benchmarking of any kind.
The emphasis at some of the institutions is placed heavily on quantitative metrics
of instructional productivity, typically as measured by student credit hours produced. An
effective system of monitoring overall faculty productivity should include not only these,
but also adequate measures of research and service activities, as well as outcome

Florida's Public University Responses to Measuring faculty Productivity
Page 4-25
measures that capture information about the quality of faculty activities. Examples of
some of these types of measures are provided in Chapter 2 of this report.
The Florida Board of Education's Accountability Report (discussed in Section 4.3)
provides an effective framework for reporting productivity data. That report provides an
evaluation of overall system-wide effectiveness, including measures of faculty
productivity, that can be effectively utilized to communicate to external publics, such as
the State Legislature, data regarding the performance of the institutions. As noted in
Chapter 2 of this report, several other states have shifted emphasis to this type of
framework. If employed by the individual public DCU institutions, such a system of
reporting could serve to facilitate institutional accountability while providing the
universities latitude in developing a system of measuring productivity that best suits their
needs.

5.0 ANALYSIS OF FACULTYPRODUCTIVITY

Analysis of Faculty Productivity
Page 5-2
5.0 ANALYSIS OF FACULTY PRODUCTIVITY
5.1 Introduction
This chapter presents detailed information on specific measures of faculty
productivity as required by the Florida legislature. It should be noted, however, that
comprehensive measurements of faculty productivity include many more measures than
are identified here (See discussion in Chapter 2.0). The timeline and legislative proviso
for this project directed an evaluation of the topic that was narrowly tailored in scope and
subject. However, several of the universities included in this study have spent
considerable time developing comprehensive measures of productivity within their own
institutions in order to respond to, and participate in, this national conversation. These
data are then used not only to develop a more comprehensive picture of “what faculty
do”, but also “how well they do it” and “how much of it they do” compared to their peers
nationally.
As noted in earlier chapters, higher education organizations, university
consortiums, identified peer groups, and aspirational peer groups all contribute data to
various collection points and in different amounts of detail. An evaluation of these data
can then be used to provide institutions with information by which they can compare their
productivity and outputs to meaningful national benchmarks. A number of the more
established and well-known productivity study groups are identified in Chapter 2.0.

Analysis of Faculty Productivity
Page 5-3
For purposes of this study, legislative proviso directed a review of:
! Average number of courses taught, average class size, and number of studentcredit hours produced by level per faculty member and other instructionalteaching positions.
! Lower and upper level courses taught by faculty, by rank, and for otherinstructional positions, by course type.
! Analysis of longitudinal trends in the productivity of faculty and otherinstructional positions.
! Purposes and outcomes of non-teaching assignments.
The proviso also required a review of resources budgeted for faculty positions for
regular faculty, part-time faculty, graduate assistants and other positions, and an
identification of the fiscal impact of the conversion of funds from the “salaries and
benefits” expenditure category to support non-faculty instructional positions. Because
these data are not relevant to a national evaluation of “faculty productivity” but deal
primarily with a unique budgeting formula and methodology for allocating funds to
universities in Florida, this analysis will be provided in a separate chapter.
Data addressing the issues described above are provided for each of the ten state
universities included in the study. We have made no attempt to compare institutions
within the state and we encourage readers to do likewise. As explained in Chapter 2.0,
comparisons of faculty workload data across institutional types are not particularly
relevant. In order to account for differences in mission, many institutions and state
systems use peer analyses to assess faculty productivity. A number of the universities
surveyed have spent considerable time researching and developing lists of national peer
institutions to which they can be appropriately compared. In some cases, to more
accurately evaluate productivity, national peer department lists are also used.1 It is not
clear if these lists have, or need, official approval. In some cases, the Board of Regents
1 These lists were discussed in Chapter 4 of this report. They are included in Appendix 4-A.

Analysis of Faculty Productivity
Page 5-4
approved comparison peer institutional lists for certain purposes, usually involving
comparisons of salaries. Universities that have not yet developed appropriate peer lists
(FGCU, for example, due to its newness and growth patterns) should be encouraged to
do so. Without external benchmarks and standards for comparison, it is difficult to
measure progress towards goals.
5.2 An Analysis of Faculty Teaching Productivity
The analysis of faculty teaching productivity that follows attempts to separately
address each of the issues outlined in proviso for the ten public institutions included in
this study. Although the endnotes to this chapter2 should clarify the population included
in this analysis, a few points are critical to understanding the data.
5.2.1 Defining Faculty
Faculty and other instructional staff are grouped into four categories for the
purposes of these analyses:
♦ Tenured and Tenure Earning – This category includes permanent tenured ortenure earning faculty. These are professors, associate professors, andassistant professors including those faculty members with formal administrativefunctions. Additionally, faculty members who were classified as GraduateResearch Professors, Distinguished Professors, Regents Professors, orEminent Scholars were categorized as professors. Please see endnote (c) inAppendix 5-A for a discussion of the term "tenured and tenure earning."
♦ Non-Tenure Earning -- This category includes instructors, lecturers, and OPSfaculty.
♦ Graduate Student Instructors – All student faculty and non-faculty with anyinstructional or research duties appear in this group.
♦ Others – If an individual did not fall into any of the above categories, he/shewas placed into this group. The overwhelming majority of individuals in thiscategory were non-ranked regular faculty, e.g. faculty classified as "AssistantIn."
2 Endnotes are provided in Appendix 5-A.
Analysis of Faculty Productivity
Page 5-5
These groupings are consistent with prominent national studies dealing with faculty
productivity. See Chapter 2 (page 2-13) for a more comprehensive discussion of this
topic.
5.2.2 Types of Analyses
Pursuant to legislative proviso, trends in faculty productivity were analyzed; the
data spanned nine academic years from in 1991-92 through 1999-00. The volume of
data generated, however, precludes the presentation of the full nine years of data in
most of the exhibits that follow. Hence, data are typically displayed only for 1991-92
and 1999-00 or as an average for the nine-year period. Additionally, for the sake of
brevity and clarity, the following discussion does not consider each institution
individually. Instead, an effort has been made to identify and discuss the broad issues
involved in teaching productivity among all of the institutions. For those readers requiring
access to detailed data by university for each separate year, the full data set is provided
in Appendix 5-B.
The analyses that follow include data only for the fall and spring semesters of
each academic year. While large numbers of faculty may teach during the summer and
generate a significant number of student credit hours, the contract period for the majority
of faculty in the Florida Division of Colleges and Universities (DCU) is nine months.
There is no guarantee of summer employment and a full-time faculty member is
considered to have a .75 annual FTE assignment. Hence, no summer data are
included; unless otherwise noted, data from both the fall and spring terms in each
academic year have been combined.

Analysis of Faculty Productivity
Page 5-6
5.2.3 Distribution of FTE Instructional Staff by Type
As discussed, instructional staff are grouped into four categories for purposes of
analysis. Exhibit 5-1 depicts the portion of FTE instructional staff comprised of each of
these groups in 1999-00 at the ten institutions under examination. Across all of the
institutions, tenured and tenure track faculty comprised only slightly more than half of
instructional staff (54.7%); non-tenure track faculty and Graduate Student Instructors
made up 16.8 percent and 19.7 percent, respectively, of all instructional FTE. The
remaining nine percent were composed of various other types of instructional staff
categorized as “other”.
EXHIBIT 5-1DISTRIBUTION OF FTE INSTRUCTIONAL STAFF/a AT PUBLIC DCU INSTITUTIONS
BY TYPE OF STAFF: 1999-00/b
0%
10%
20%
30%
40%
50%
60%
70%
80%
90%
100%
OTHER 13.3% 1.8% 4.5% 5.2% 11.0% 9.6% 10.1% 1.2% 12.4% 3.2% 8.8%
GRADUATE STUDENT INSTRUCTORS 4.4% 15.5% 0.0% 15.1% 32.0% 18.9% 26.0% 0.3% 20.5% 1.7% 19.7%
NON-TENURE TRACK 17.3% 23.5% 26.4% 24.5% 5.7% 24.4% 7.0% 32.9% 18.6% 34.5% 16.8%
TENURED AND TENURE TRACK \c 65.0% 59.2% 69.1% 55.2% 51.2% 47.1% 56.9% 65.6% 48.5% 60.5% 54.7%
FAMU FAU FGCU FIU FSU UCF UF UNF USF UWFFL
DCU
Source: Instruction and Research Data File (IRDF)
The distribution of instructional staff varied to some extent between institutions.
While tenured and tenure-earning faculty comprised the majority of instructional staff at
eight of the ten institutions, utilization of other instructional staff differed significantly

Analysis of Faculty Productivity
Page 5-7
according to institutional type. Because the mission of doctoral/research institutions
includes training graduate students to become faculty members at colleges and
universities, Graduate Student Instructors comprised a greater proportion of instructional
staff at these universities. As such, both FSU and UF utilized OPS faculty, instructors,
and lecturers (non-tenure track faculty) to a much lesser extent than did the other
institutions.
5.2.4 Number of Course Sections Taught and Student Credit Hours Produced byCourse Section Type
During the 1999-00 fall and spring terms, the ten public Florida Division of
Colleges and Universities’ (DCU) Institutions together taught more than 80,000 course
sections and produced 4.6 million student credit hours. Almost half of the student credit
hours produced were at the upper level (48.6%); lower level courses accounted for
about two-fifths (41.1%) and graduate courses about ten percent. Approximately the
same distribution is found when each institution is examined individually (See Appendix
5-C).
Exhibit 5-2 demonstrates that organized class lectures were the predominant
method of instruction at all levels, accounting for 66 percent of both lower and upper
level course sections and almost half of graduate courses (47.3%).
Although formal classroom instruction (class lectures, discussions, and
laboratories) accounted for the majority of courses taught at public DCU institutions,
individualized instruction also played a significant role. Directed study sections
accounted for 8.8 percent of all course sections taught in 1999-00, and theses and
dissertations together accounted for more than 15 percent of all course sections offered
at the graduate level.

Analysis of Faculty Productivity
Page 5-8
Despite the fact that class lectures constituted only 60 percent of all course
sections taught in 1999-00, the overwhelming majority of student credit hours were
produced in class lectures (86.5%). Although many of the other course section types
accounted for a significant share of course sections taught, they typically produced a
proportionately smaller percentage of the total student credit hours generated. For
instance, laboratories, directed study sections, and discussion sections together
accounted for 21.5 percent of course sections, yet they contributed only 6.5 percent of
the student credit hours generated in 1999-00.

Analysis of Faculty Productivity
Page 5-9
EXHIBIT 5-2NUMBER AND PERCENT OF COURSE SECTIONS TAUGHT AT PUBLIC DCU INSTITUTIONS (1999-00/b) BY COURSE
SECTION TYPE
LOWER UPPER GRADUATE TOTAL
SECTION TYPE NU
MB
ER
OF
S
EC
TIO
NS
% O
F T
OT
AL
S
EC
TIO
NS
# O
F S
TU
DE
NT
C
RE
DIT
HO
UR
S
% O
F T
OT
AL
S
TU
DE
NT
C
RE
DIT
HO
UR
S
NU
MB
ER
OF
S
EC
TIO
NS
% O
F T
OT
AL
S
EC
TIO
NS
# O
F S
TU
DE
NT
C
RE
DIT
HO
UR
S
% O
F T
OT
AL
S
TU
DE
NT
C
RE
DIT
HO
UR
S
NU
MB
ER
OF
S
EC
TIO
NS
% O
F T
OT
AL
S
EC
TIO
NS
# O
F S
TU
DE
NT
C
RE
DIT
HO
UR
S
% O
F T
OT
AL
S
TU
DE
NT
C
RE
DIT
HO
UR
S
NU
MB
ER
OF
S
EC
TIO
NS
% O
F T
OT
AL
S
EC
TIO
NS
# O
F S
TU
DE
NT
C
RE
DIT
HO
UR
S
CLASS LECTURE 13,346.1 66.4% 1,653,285.0 92.3% 22,561.9 66.1% 1,953,601.8 86.9% 12,343.4 47.3% 412,804.4 67.8% 48,251.4 60.0% 4,019,691.2
DISCUSSION 1,491.5 7.4% 18,760.0 1.0% 1,319.2 3.9% 34,437.1 1.5% 885.5 3.4% 21,146.6 3.5% 3,696.2 4.6% 74,343.7
DISSERTATION 0.0 0.0% 0.0 0.0% 0.0 0.0% 0.0 0.0% 2,032.9 7.8% 32,002.0 5.3% 2,032.9 2.5% 32,002.0
INTERNSHIP 17.0 0.1% 96.8 0.0% 1,753.5 5.1% 81,511.8 3.6% 1,108.6 4.2% 25,966.2 4.3% 2,879.1 3.6% 107,574.8
LABORATORY 3,386.3 16.8% 76,866.2 4.3% 2,647.6 7.8% 63,844.8 2.8% 453.5 1.7% 7,792.2 1.3% 6,487.4 8.1% 148,503.2
MEDICAL CLINICAL PROFESSIONAL 0.0 0.0% 0.0 0.0% 0.0 0.0% 0.0 0.0% 1.6 0.0% 67.5 0.0% 1.6 0.0% 67.5
OTHER 324.5 1.6% 20,710.0 1.2% 1,263.7 3.7% 57,399.9 2.6% 1,625.0 6.2% 44,389.2 7.3% 3,213.3 4.0% 122,499.1
PERFORMANCE 1,524.0 7.6% 15,122.4 0.8% 1,262.3 3.7% 11,636.2 0.5% 571.1 2.2% 3,945.5 0.6% 3,357.4 4.2% 30,704.1
SUPERVISED RESEARCH 0.0 0.0% 0.0 0.0% 158.2 0.5% 2,123.8 0.1% 780.3 3.0% 5,721.6 0.9% 938.5 1.2% 7,845.4
SUPERVISOR TEACHING 0.0 0.0% 0.0 0.0% 58.0 0.2% 1,368.0 0.1% 337.5 1.3% 2,260.0 0.4% 395.5 0.5% 3,628.0
THESIS 0.0 0.0% 0.0 0.0% 0.0 0.0% 0.0 0.0% 2,010.6 7.7% 19,750.2 3.2% 2,010.6 2.5% 19,750.2
CORRESPONDENCE STUDY COURSE 0.5 0.0% 482.1 0.0% 0.6 0.0% 393.0 0.0% 0.0 0.0% 0.0 0.0% 1.1 0.0% 875.1
DIRECTED STUDY 21.9 0.1% 5,355.3 0.3% 3,129.1 9.2% 41,008.9 1.8% 3,942.5 15.1% 33,002.3 5.4% 7,093.5 8.8% 79,366.5
TOTAL 20,111.8 100.0% 1,790,677.8 100.0% 34,154.2 100.0% 2,247,325.3 100.0% 26,092.5 100.0% 608,847.7 100.0% 80,358.4 100.0% 4,646,850.8
Source: IRDF

Analysis of Faculty Productivity
Page 5-10
5.2.5 Average Size of Class Sections by Level
The average size of class meetings at all but one of the ten Florida institutions has
declined since 1991-92. Only the University of Central Florida has seen an increase in
class size since the beginning of the decade. This reduction in class size is at least
partially the result of significant legislative interest in the topic beginning in the 1984-85
academic year. During that year, increased funding was directed toward reducing class
sizes in English, math, and foreign languages to a ratio of approximately 1 to 22 at the
undergraduate level.
Exhibit 5-3 shows that across institutions and instructional levels, there were on
average about 33 students per class meeting in 1999-00, this number having decreased
from 34.5 in 1991-92 (-3.8%). At all institutions and instructional levels, the median
class size of 24 students in 1999-00 was lower than the mean, indicating that the latter
figure was pushed upwards by a small number of much larger than average class
meetings. About 70 percent of class meetings were at or below the mean class size.
As would be expected, undergraduate classes were, on average, larger than
graduate level classes. The mean undergraduate class meeting size in 1999-00 was
36.6, whereas graduate level courses averaged about 15 students per class meeting.
Despite the larger size of undergraduate courses, graduate level courses saw a greater
decline in average size between 1991-92 and 1999-00 (-6.9%).

Analysis of Faculty Productivity
Page 5-11
EXHIBIT 5-3ESTIMATED AVERAGE CLASS MEETING TIME SIZE* AT PUBLIC DCU
INSTITUTIONS: 1991-92 AND 1999-00/b, WITH PERCENT CHANGE
91-92 99-00 CHANGEMEAN MEDIAN MEAN MEDIAN MEAN MEDIAN
UG 33.2 30.0 34.2 28.0 3.1% -6.7%G 11.0 8.0 13.3 7.0 21.3% -12.5%ALL 32.1 29.0 31.9 27.0 -0.5% -6.9%
UG 36.1 28.0 29.5 22.0 -18.3% -21.4%G 12.9 11.0 10.4 8.0 -19.8% -27.3%ALL 32.2 25.0 26.6 21.0 -17.4% -16.0%
UG - - 18.7 18.0 - -G - - 11.3 11.0 - -ALL - - 17.9 17.0 - -
UG 33.7 28.0 33.0 26.0 -2.2% -7.1%G 13.3 10.0 13.1 9.0 -1.4% -10.0%ALL 30.0 25.0 29.6 24.0 -1.1% -4.0%
UG 41.6 28.0 39.0 25.0 -6.3% -10.7%G 15.0 9.0 13.7 8.0 -8.3% -11.1%ALL 35.5 24.0 33.5 23.0 -5.4% -4.2%
UG 39.6 31.0 42.6 29.0 7.6% -6.5%G 15.5 14.0 15.3 13.0 -1.2% -7.1%ALL 37.0 30.0 39.6 28.0 7.3% -6.7%
UG 45.0 30.0 43.2 26.0 -4.0% -13.3%G 22.2 13.0 22.9 13.0 3.1% 0.0%ALL 40.4 27.0 39.6 25.0 -2.0% -7.4%
UG 34.0 28.0 31.6 26.0 -7.0% -7.1%G 18.9 17.0 14.5 12.0 -23.3% -29.4%ALL 32.0 27.0 29.9 25.0 -6.5% -7.4%
UG 35.9 27.0 35.1 26.0 -2.4% -3.7%G 15.0 13.0 13.6 11.0 -9.1% -15.4%ALL 32.1 25.0 31.4 24.0 -2.1% -4.0%
UG 27.3 25.0 25.8 23.0 -5.6% -8.0%G 14.2 12.0 11.4 9.0 -19.6% -25.0%ALL 25.9 24.0 24.2 22.0 -6.9% -8.3%
UG 38.3 29.0 36.6 26.0 -4.3% -10.3%G 16.6 11.0 15.4 10.0 -6.9% -9.1%ALL 34.5 26.0 33.2 24.0 -3.8% -7.7%
UNF
FAMU
USF
UWF
FL DCU
LEVEL
FAU
FGCU
FIU
FSU
UCF
UF
* Class meeting time size refers to the number of headcount students receiving instruction in a givenclassroom at a given time. Class meeting times may consist of multiple class sections in some cases. OnlyLectures, Discussions, and Laboratories were included in this calculation.
Source: IRDF

Analysis of Faculty Productivity
Page 5-12
5.2.6 Percentage of Instructional Effort Provided by E&G Instructional Staff
Almost without exception, the majority of instructional effort at public DCU
institutions was provided by tenured and tenure earning faculty. Although the figures
varied by institution, on average faculty were responsible for approximately 60 percent of
instructional effort.
However, Exhibit 5-4 shows that tenured and tenure-earning faculty effort has
focused primarily on the upper and graduate levels of instruction. Faculty provided
about 31 percent of lower level instructional effort in 1999-00, although this number
tended to be higher at the four comprehensive institutions than at the doctoral/research
universities. Non-tenure track faculty and Graduate Student Instructors each provided
about a third of lower level instructional effort in 1999-00.
In contrast, tenured and tenure-earning faculty provided the majority of upper and
graduate level instructional effort in 1999-00, which were responsible for approximately
60 and 84 percent of instructional effort at these levels, respectively. Non-tenure track
faculty contributed about 30 percent of upper level effort and 12.7 percent of graduate
level effort. On average, Graduate Student Instructors provided very little instructional
effort at the upper level and, as would be expected, almost none at the graduate level.
Exhibit 5-4 also shows that of the total instructional effort provided by any
instructional staff, the portion provided by tenured and tenure earning faculty declined
about 10 percent between 1991-92 and 1999-00 at all instructional levels. Most of this
portion of effort was absorbed by non-tenure track faculty, who saw a 9.6 percent
increase in the portion of instructional effort contributed.
It is not necessarily the case, however, that because faculty contributed a smaller
share of the total instructional effort at the end of the decade than at the beginning, they

Analysis of Faculty Productivity
Page 5-13
EXHIBIT 5-4PERCENTAGE OF TOTAL INSTRUCTIONAL EFFORT CONTRIBUTED BY E&G
INSTRUCTIONAL STAFF/a AT PUBLIC DCU INSTITUTIONS: 1991-92 & 1999-00/b
91-92 99-00 CHANGE SINCE 91-92
LO
WE
R
UP
PE
R
GR
AD
AL
L
LE
VE
LS
LO
WE
R
UP
PE
R
GR
AD
AL
L
LE
VE
LS
LO
WE
R
UP
PE
R
GR
AD
AL
L
LE
VE
LS
TENURED AND TENURE TRACK 64.0% 74.3% 81.4% 71.1% 61.1% 70.8% 91.3% 71.7% -2.9% -3.5% 10.0% 0.5%NON-TENURE TRACK 32.3% 18.8% 10.5% 23.1% 30.7% 21.5% 5.0% 21.3% -1.6% 2.8% -5.5% -1.7%GRADUATE STUDENT INSTRUCTORS 0.0% 0.0% 0.0% 0.0% 2.6% 0.0% 0.0% 0.9% 2.6% 0.0% 0.0% 0.9%OTHER 3.7% 6.9% 8.2% 5.8% 5.5% 7.6% 3.7% 6.1% 1.9% 0.7% -4.5% 0.3%TOTAL 100.0% 100.0% 100.0% 100.0% 100.0% 100.0% 100.0% 100.0%TENURED AND TENURE TRACK 52.3% 75.3% 92.2% 77.6% 30.1% 54.8% 82.7% 54.1% -22.1% -20.4% -9.6% -23.5%NON-TENURE TRACK 40.5% 18.7% 6.7% 17.7% 38.5% 39.0% 16.1% 34.4% -2.0% 20.3% 9.4% 16.6%GRADUATE STUDENT INSTRUCTORS 6.3% 5.5% 0.3% 4.0% 31.4% 5.8% 0.6% 11.2% 25.1% 0.2% 0.3% 7.1%OTHER 1.0% 0.5% 0.7% 0.6% 0.0% 0.4% 0.6% 0.3% -1.0% -0.1% -0.2% -0.3%TOTAL 100.0% 100.0% 100.0% 100.0% 100.0% 100.0% 100.0% 100.0%TENURED AND TENURE TRACK 0.0% 0.0% 0.0% 0.0% 38.7% 67.7% 75.6% 61.6% 38.7% 67.7% 75.6% 61.6%NON-TENURE TRACK 0.0% 0.0% 0.0% 0.0% 58.6% 30.7% 21.9% 36.4% 58.6% 30.7% 21.9% 36.4%GRADUATE STUDENT INSTRUCTORS 0.0% 0.0% 0.0% 0.0% 0.0% 0.0% 0.0% 0.0% 0.0% 0.0% 0.0% 0.0%OTHER 0.0% 0.0% 0.0% 0.0% 2.7% 1.6% 2.5% 2.1% 2.7% 1.6% 2.5% 2.1%TOTAL 0.0% 0.0% 0.0% 0.0% 100.0% 100.0% 100.0% 100.0%TENURED AND TENURE TRACK 36.2% 69.0% 87.5% 68.4% 26.0% 56.2% 78.0% 53.0% -10.2% -12.8% -9.5% -15.3%NON-TENURE TRACK 44.1% 24.6% 11.3% 24.4% 50.7% 35.2% 18.9% 35.6% 6.6% 10.6% 7.6% 11.2%GRADUATE STUDENT INSTRUCTORS 18.3% 5.5% 0.7% 6.3% 20.2% 6.3% 1.3% 9.0% 1.9% 0.9% 0.6% 2.7%OTHER 1.3% 0.9% 0.5% 0.9% 3.1% 2.3% 1.8% 2.4% 1.8% 1.4% 1.3% 1.5%TOTAL 100.0% 100.0% 100.0% 100.0% 100.0% 100.0% 100.0% 100.0%TENURED AND TENURE TRACK 26.5% 65.3% 93.0% 64.7% 26.7% 59.4% 88.7% 59.4% 0.2% -5.9% -4.3% -5.3%NON-TENURE TRACK 8.6% 11.2% 4.8% 8.6% 8.3% 15.4% 5.3% 10.1% -0.3% 4.2% 0.5% 1.5%GRADUATE STUDENT INSTRUCTORS 63.0% 19.8% 0.1% 23.9% 59.4% 17.1% 0.6% 23.9% -3.6% -2.7% 0.5% 0.0%OTHER 1.9% 3.6% 2.1% 2.8% 5.7% 8.1% 5.4% 6.5% 3.7% 4.5% 3.3% 3.8%TOTAL 100.0% 100.0% 100.0% 100.0% 100.0% 100.0% 100.0% 100.0%TENURED AND TENURE TRACK 37.4% 69.0% 91.9% 67.4% 27.9% 52.0% 74.5% 49.7% -9.5% -16.9% -17.4% -17.7%NON-TENURE TRACK 43.5% 23.6% 7.1% 24.2% 54.1% 43.1% 22.0% 42.0% 10.6% 19.5% 14.9% 17.8%GRADUATE STUDENT INSTRUCTORS 18.9% 4.8% 0.4% 6.5% 17.8% 3.5% 0.7% 7.0% -1.0% -1.3% 0.3% 0.5%OTHER 0.2% 2.6% 0.6% 1.8% 0.2% 1.3% 2.8% 1.3% -0.1% -1.3% 2.2% -0.5%TOTAL 100.0% 100.0% 100.0% 100.0% 100.0% 100.0% 100.0% 100.0%TENURED AND TENURE TRACK 34.6% 70.1% 92.2% 68.2% 25.2% 70.7% 89.3% 65.4% -9.4% 0.6% -2.9% -2.8%NON-TENURE TRACK 8.9% 6.7% 4.8% 6.7% 12.2% 10.2% 7.1% 9.6% 3.3% 3.5% 2.3% 3.0%GRADUATE STUDENT INSTRUCTORS 54.9% 20.6% 0.9% 22.9% 60.4% 16.1% 1.4% 22.5% 5.5% -4.5% 0.4% -0.5%OTHER 1.5% 2.6% 2.1% 2.2% 2.1% 3.0% 2.2% 2.5% 0.6% 0.4% 0.1% 0.3%TOTAL 100.0% 100.0% 100.0% 100.0% 100.0% 100.0% 100.0% 100.0%TENURED AND TENURE TRACK 40.1% 73.3% 87.0% 69.0% 41.7% 63.7% 85.5% 59.5% 1.6% -9.6% -1.5% -9.6%NON-TENURE TRACK 22.2% 8.2% 2.6% 10.0% 56.4% 35.5% 14.4% 39.5% 34.2% 27.3% 11.8% 29.5%GRADUATE STUDENT INSTRUCTORS 4.7% 0.5% 0.1% 1.3% 1.3% 0.0% 0.0% 0.4% -3.4% -0.5% -0.1% -0.9%OTHER 33.0% 18.0% 10.3% 19.6% 0.6% 0.8% 0.0% 0.6% -32.4% -17.2% -10.2% -19.0%TOTAL 100.0% 100.0% 100.0% 100.0% 100.0% 100.0% 100.0% 100.0%TENURED AND TENURE TRACK 31.8% 66.1% 85.9% 65.6% 29.3% 54.7% 77.5% 54.3% -2.5% -11.4% -8.4% -11.2%NON-TENURE TRACK 24.0% 20.5% 11.9% 18.8% 30.7% 31.9% 18.7% 28.1% 6.7% 11.4% 6.8% 9.3%GRADUATE STUDENT INSTRUCTORS 42.5% 11.6% 0.4% 13.9% 37.1% 11.6% 1.8% 15.4% -5.4% -0.1% 1.4% 1.6%OTHER 1.8% 1.7% 1.8% 1.7% 2.9% 1.8% 2.0% 2.2% 1.2% 0.1% 0.3% 0.4%TOTAL 100.0% 100.0% 100.0% 100.0% 100.0% 100.0% 100.0% 100.0%TENURED AND TENURE TRACK 36.1% 65.3% 76.4% 62.9% 30.3% 58.4% 73.3% 54.6% -5.8% -6.9% -3.1% -8.2%NON-TENURE TRACK 47.5% 30.7% 19.8% 31.2% 62.3% 39.0% 22.5% 41.3% 14.7% 8.3% 2.8% 10.1%GRADUATE STUDENT INSTRUCTORS 10.5% 1.5% 1.0% 2.8% 6.9% 0.8% 0.2% 2.2% -3.6% -0.6% -0.7% -0.6%OTHER 5.9% 2.6% 2.8% 3.2% 0.5% 1.8% 3.9% 1.9% -5.3% -0.8% 1.1% -1.3%TOTAL 100.0% 100.0% 100.0% 100.0% 100.0% 100.0% 100.0% 100.0%TENURED AND TENURE TRACK 37.9% 69.0% 89.5% 67.8% 31.2% 59.7% 83.6% 58.0% -6.6% -9.3% -6.0% -9.8%NON-TENURE TRACK 23.6% 17.6% 7.9% 16.3% 33.2% 29.1% 12.7% 26.0% 9.6% 11.5% 4.8% 9.6%GRADUATE STUDENT INSTRUCTORS 35.2% 10.1% 0.5% 12.8% 32.9% 8.3% 1.0% 13.2% -2.2% -1.8% 0.5% 0.4%OTHER 3.3% 3.3% 2.1% 3.0% 2.6% 2.9% 2.7% 2.8% -0.7% -0.4% 0.6% -0.2%TOTAL 100.0% 100.0% 100.0% 100.0% 100.0% 100.0% 100.0% 100.0%
US
FU
WF
FL
DC
UF
SU
UC
FU
FU
NF
FA
MU
FA
UF
GC
U \c
FIU
Source: IRDF

Analysis of Faculty Productivity
Page 5-14
were less productive in 1999-00 than nine years earlier. These measures do not speak
directly to the issue of faculty productivity at an individual level. They merely highlight
who is doing the teaching, and it is clear that faculty are doing the bulk of it. The decline
may be best explained, not by a reduction in the teaching workload of faculty members
or a shift away from instruction (i.e. they are teaching less because they are doing more
of other things), but by slower growth in the number of faculty relative to enrollments.
Exhibit 5-5 shows that since 1991-92, annual FTE enrollments at public DCU
institutions have grown by 32.7 percent whereas the number of FTE faculty has
increased only 19.9 percent. While the disparity may seem small at the system-wide
level, enrollment growth at some institutions has far outpaced growth in the ranks of
faculty. Those institutions with the greatest decline in faculty share of instructional effort
typically had the greatest disparity between growth of FTE students and FTE faculty.
The only institution at which faculty share of instructional effort grew between 1991-92
and 1999-00 was FAMU, whose faculty ranks grew faster than enrollments.
Rather than increasing the numbers of tenured and tenure track faculty to
accommodate expanding enrollments, most institutions have increased their use of non-
tenure track faculty and Graduate Student Instructors. Both in absolute numbers and as
a percentage of all instructional staff, instructors, lecturers, and OPS faculty have
increased dramatically since the beginning of the decade. Together, they provided 26.0
percent of total instructional effort at public DCU institutions in 1999-00, this number
having increased from only 16.3 percent in 1991-92.

Analysis of Faculty Productivity
Page 5-15
It is clear that when additional instructional staff have been required throughout
the decade, institutions typically met this demand with non tenure-track faculty. In
addition to allowing institutions to acquire more instructors without bearing the burden of
tenured and tenure track faculty salaries, such instructional staff may offer the
universities more flexibility to accommodate potential budgetary fluctuations.
EXHIBIT 5-5PERCENT GROWTH IN ANNUAL FTE ENROLLMENTS vs. FTE TENURED AND
TENURE-TRACK FACULTY/a: PUBLIC DCU INSTITUTIONS
1991-92 FTE 1999-00 FTE
# %Student /
Staff Ratio # %Student /
Staff Ratio
TENURED & TENURE EARNING /c 5691.3 65.2% 18.5 6821.5 54.7% 20.7 19.9%
NON TENURE-EARNING 943.4 10.8% 111.9 2096.6 16.8% 67.4 122.2%
GRADUATE STUDENT INSTRUCTORS 1360.4 15.6% 77.6 2458.8 19.7% 57.5 80.7%
OTHER 736.8 8.4% 143.3 1103.5 8.8% 128.2 49.8%
ALL INSTRUCTIONAL STAFF 8732.0 100.0% 12.1 12480.4 100.0% 11.3 42.9%
FTE ENROLLMENTS 105,569 - - 141,412 - - 32.7%
% CHANGE
100,000
105,000
110,000
115,000
120,000
125,000
130,000
135,000
140,000
145,000
1991-92 1992-93 1993-94 1994-95 1995-96 1996-97 1997-98 1998-99 1999-00
FT
E E
NR
OL
LM
EN
TS
5,700.0
6,200.0
6,700.0
7,200.0
7,700.0
8,200.0
8,700.0
9,200.0
9,700.0
FT
E F
AC
UL
TY
FTE ENROLLMENTS
FTE FACULTY
Source: IRDF and DCU 1999-00 Fact Book

Analysis of Faculty Productivity
Page 5-16
5.2.7 Percentage of Total Student Credit Hours Produced by E&G Faculty andOther Instructional Positions
Exhibit 5-6 depicts the percentage of total student credit hours generated by all
types of instructional staff for both 1991-92 and 1999-00. The distribution of student
credit hours across staff categories essentially mirrors the distribution of instructional
effort as depicted in Exhibit 5-4. Tenured and tenure earning faculty produced the
majority of student credit hours in both years displayed (64.5% in 1991-92 and 55% in
1999-00); non-tenure track faculty produced approximately 20 percent of the total credit
hours in 1991-92 and about 30 percent in 1999-00. The portion of total student credit
hours generated by Graduate Student Assistants and other instructional staff remained
essentially constant throughout the decade.

Analysis of Faculty Productivity
Page 5-17
EXHIBIT 5-6PERCENTAGE OF TOTAL STUDENT CREDIT HOURS GENERATED BY E&G
INSTRUCTIONAL STAFF\a, \c AT PUBLIC DCU INSTITUTIONS: 1991-92 & 1999-00\b
91-92 99-00 CHANGE SINCE 1991-92LOWER UPPER GRAD TOTAL LOWER UPPER GRAD TOTAL LOWER UPPER GRAD TOTAL
TENURED AND TENURE TRACK 57.6% 74.1% 82.9% 66.3% 55.5% 72.5% 89.9% 65.0% -2.1% -1.6% 7.0% -1.2%NON TENURE-TRACK 40.8% 20.7% 14.7% 30.5% 39.3% 21.5% 7.5% 29.6% -1.5% 0.7% -7.3% -0.8%GRADUATE STUDENT INSTRUCTORS 0.0% 0.0% 0.0% 0.0% 1.7% 0.0% 0.0% 0.9% 1.7% 0.0% 0.0% 0.9%OTHER 1.6% 5.1% 2.3% 3.3% 3.4% 6.0% 2.6% 4.4% 1.9% 0.9% 0.3% 1.2%TOTAL 100.0% 100.0% 100.0% 100.0% 100.0% 100.0% 100.0% 100.0% 0.0% 0.0% 0.0% 0.0%TENURED AND TENURE TRACK 65.2% 71.0% 87.2% 71.8% 39.4% 52.1% 79.9% 50.8% -25.8% -18.8% -7.3% -21.0%NON TENURE-TRACK 29.3% 23.4% 11.5% 23.1% 46.9% 43.8% 18.9% 42.2% 17.6% 20.4% 7.4% 19.1%GRADUATE STUDENT INSTRUCTORS 5.0% 4.9% 0.2% 4.3% 13.7% 3.8% 0.7% 6.8% 8.7% -1.1% 0.5% 2.5%OTHER 0.5% 0.7% 1.1% 0.7% 0.0% 0.3% 0.6% 0.2% -0.5% -0.4% -0.6% -0.5%TOTAL 100.0% 100.0% 100.0% 100.0% 100.0% 100.0% 100.0% 100.0% 0.0% 0.0% 0.0% 0.0%TENURED AND TENURE TRACK 0.0% 0.0% 0.0% 0.0% 40.2% 65.4% 79.6% 58.7% 40.2% 65.4% 79.6% 58.7%NON TENURE-TRACK 0.0% 0.0% 0.0% 0.0% 57.4% 33.0% 18.1% 39.3% 57.4% 33.0% 18.1% 39.3%GRADUATE STUDENT INSTRUCTORS 0.0% 0.0% 0.0% 0.0% 0.0% 0.0% 0.0% 0.0% 0.0% 0.0% 0.0% 0.0%OTHER 0.0% 0.0% 0.0% 0.0% 2.4% 1.6% 2.3% 1.9% 2.4% 1.6% 2.3% 1.9%TOTAL 0.0% 0.0% 0.0% 0.0% 100.0% 100.0% 100.0% 100.0% 100.0% 100.0% 100.0% 100.0%TENURED AND TENURE TRACK 35.5% 65.1% 79.4% 60.8% 30.1% 51.7% 67.9% 45.6% -5.4% -13.4% -11.6% -15.2%NON TENURE-TRACK 50.7% 28.6% 19.1% 31.9% 60.1% 43.6% 29.1% 48.0% 9.4% 15.0% 10.0% 16.1%GRADUATE STUDENT INSTRUCTORS 12.8% 4.5% 0.8% 5.7% 8.1% 3.1% 1.8% 4.8% -4.7% -1.4% 0.9% -0.9%OTHER 1.0% 1.9% 0.7% 1.5% 1.7% 1.6% 1.2% 1.6% 0.7% -0.3% 0.6% 0.0%TOTAL 100.0% 100.0% 100.0% 100.0% 100.0% 100.0% 100.0% 100.0% 0.0% 0.0% 0.0% 0.0%TENURED AND TENURE TRACK 43.6% 65.3% 88.5% 62.2% 32.3% 55.0% 85.1% 50.1% -11.3% -10.3% -3.5% -12.1%NON TENURE-TRACK 11.2% 11.7% 7.8% 10.9% 12.7% 17.1% 9.1% 14.1% 1.5% 5.3% 1.3% 3.1%GRADUATE STUDENT INSTRUCTORS 43.2% 19.8% 0.0% 23.9% 45.6% 19.3% 0.4% 27.3% 2.4% -0.5% 0.4% 3.4%OTHER 2.0% 3.2% 3.7% 2.9% 9.4% 8.7% 5.5% 8.5% 7.4% 5.5% 1.8% 5.6%TOTAL 100.0% 100.0% 100.0% 100.0% 100.0% 100.0% 100.0% 100.0% 0.0% 0.0% 0.0% 0.0%TENURED AND TENURE TRACK 45.1% 64.7% 87.8% 61.5% 35.8% 57.4% 72.6% 50.5% -9.3% -7.4% -15.2% -11.1%NON TENURE-TRACK 43.5% 30.7% 11.6% 32.4% 57.1% 40.5% 25.3% 45.5% 13.6% 9.8% 13.8% 13.1%GRADUATE STUDENT INSTRUCTORS 11.4% 3.2% 0.3% 5.1% 7.0% 1.6% 0.6% 3.6% -4.4% -1.5% 0.3% -1.5%OTHER 0.1% 1.4% 0.3% 1.0% 0.1% 0.6% 1.4% 0.5% 0.0% -0.9% 1.1% -0.5%TOTAL 100.0% 100.0% 100.0% 100.0% 100.0% 100.0% 100.0% 100.0% 0.0% 0.0% 0.0% 0.0%TENURED AND TENURE TRACK 53.6% 71.7% 92.6% 68.3% 51.1% 73.8% 87.1% 67.8% -2.4% 2.1% -5.5% -0.6%NON TENURE-TRACK 5.2% 9.2% 5.3% 7.1% 14.3% 12.6% 9.4% 12.7% 9.2% 3.4% 4.1% 5.5%GRADUATE STUDENT INSTRUCTORS 40.1% 16.4% 0.4% 22.6% 32.6% 10.1% 1.4% 16.9% -7.5% -6.3% 1.0% -5.6%OTHER 1.2% 2.7% 1.7% 2.0% 2.0% 3.4% 2.1% 2.6% 0.8% 0.8% 0.4% 0.7%TOTAL 100.0% 100.0% 100.0% 100.0% 100.0% 100.0% 100.0% 100.0% 0.0% 0.0% 0.0% 0.0%TENURED AND TENURE TRACK 52.5% 76.2% 84.9% 71.6% 50.9% 68.5% 86.9% 62.8% -1.6% -7.7% 2.0% -8.8%NON TENURE-TRACK 17.6% 8.3% 3.4% 9.9% 45.4% 31.1% 13.0% 35.5% 27.8% 22.8% 9.7% 25.6%GRADUATE STUDENT INSTRUCTORS 4.0% 0.5% 0.1% 1.3% 3.2% 0.0% 0.0% 1.3% -0.8% -0.5% -0.1% 0.0%OTHER 25.9% 15.0% 11.5% 17.2% 0.5% 0.3% 0.0% 0.4% -25.4% -14.7% -11.5% -16.8%TOTAL 100.0% 100.0% 100.0% 100.0% 100.0% 100.0% 100.0% 100.0% 0.0% 0.0% 0.0% 0.0%
TENURED AND TENURE TRACK 42.0% 65.9% 82.6% 63.1% 34.4% 54.8% 73.4% 50.2% -7.6% -11.1% -9.2% -12.9%NON TENURE-TRACK 29.6% 23.1% 16.2% 23.5% 39.6% 34.0% 24.0% 34.7% 10.0% 11.0% 7.7% 11.1%GRADUATE STUDENT INSTRUCTORS 27.0% 9.3% 0.4% 11.9% 22.9% 9.0% 0.9% 12.8% -4.1% -0.3% 0.5% 0.9%OTHER 1.3% 1.7% 0.8% 1.5% 3.0% 2.2% 1.8% 2.4% 1.7% 0.4% 1.0% 0.9%TOTAL 100.0% 100.0% 100.0% 100.0% 100.0% 100.0% 100.0% 100.0% 0.0% 0.0% 0.0% 0.0%TENURED AND TENURE TRACK 37.8% 61.8% 73.9% 58.3% 36.7% 57.9% 75.2% 52.4% -1.1% -4.0% 1.4% -6.0%NON TENURE-TRACK 46.1% 35.1% 24.0% 36.0% 57.5% 40.6% 21.4% 44.4% 11.4% 5.5% -2.6% 8.4%GRADUATE STUDENT INSTRUCTORS 10.8% 1.0% 0.9% 3.0% 5.4% 0.8% 0.9% 2.4% -5.4% -0.2% 0.1% -0.6%OTHER 5.3% 2.1% 1.3% 2.7% 0.4% 0.8% 2.5% 0.8% -4.9% -1.3% 1.2% -1.8%TOTAL 100.0% 100.0% 100.0% 100.0% 100.0% 100.0% 100.0% 100.0% 0.0% 0.0% 0.0% 0.0%
TENURED AND TENURE TRACK 48.4% 67.6% 86.6% 64.5% 40.2% 60.0% 80.4% 55.0% -8.2% -7.6% -6.1% -9.5%NON TENURE-TRACK 24.1% 20.4% 11.0% 20.3% 36.3% 30.1% 16.2% 30.6% 12.2% 9.6% 5.2% 10.4%GRADUATE STUDENT INSTRUCTORS 25.3% 9.1% 0.3% 12.7% 20.6% 7.0% 0.9% 11.4% -4.8% -2.1% 0.6% -1.2%OTHER 2.2% 2.8% 2.1% 2.6% 3.0% 2.9% 2.4% 2.9% 0.8% 0.1% 0.3% 0.3%TOTAL 100.0% 100.0% 100.0% 100.0% 100.0% 100.0% 100.0% 100.0% 0.0% 0.0% 0.0% 0.0%
UN
FF
AM
UU
SF
UW
FF
L D
CU
FACULTY TYPE
FA
UF
GC
U /c
FIU
FS
UU
CF
UF
Source: IRDF

Analysis of Faculty Productivity
Page 5-18
5.2.8 Average Number of Courses Taught and Student Credit Hours Produced byE&G Faculty and Other Instructional Positions
Although the data discussed in the previous section served to identify who was
teaching students at the various instructional levels, it did not directly address faculty
instructional productivity at the individual level. For that, the average workload of faculty
and other instructional staff as measured by courses taught and student credit hours
produced per FTE instructional staff member were examined.
Courses per FTE Instructional Staff. As discussed in Section 5.2.2, formal group
instruction comprised only a portion of all courses taught at public DCU institutions.
Moreover, since 1991-92, individualized and other non-classroom course sections
increased sharply as a percentage of total course sections. Consequently, it is vital that
measures of faculty course load capture the full range of activities that qualify as
instruction.
Alternatively, there is value in reporting the average formal course load among
faculty and other instructional staff, i.e. the average number of organized class sections
in which group instruction occurs at a specified time and place. These course sections
reflect the traditional notion of a “class”. Hence, both measures are reported here.
Exhibit 5-7 depicts the number of course sections per FTE tenured and tenure
track faculty member, including all classroom and other course sections. These include
all forms of group instruction (i.e. lectures, laboratories, and discussions) as well as all
types of individual instruction (e.g. directed study, performance, theses, or
dissertations).3 Exhibit 5-8 shows similar statistics for non-tenure track faculty. Tenured
and tenure track faculty at all public DCU institutions taught on average a total of 7.3
courses during the 1999-00 fall and spring terms. At the majority of the institutions, this

Analysis of Faculty Productivity
Page 5-19
measure of workload has either remained about the same or increased since 1991-92.
Because the data reflect courses taught in both fall and spring terms in any given year,
the number of courses taught per semester is roughly half of the depicted number.
EXHIBIT 5-7NUMBER OF COURSES (ALL COURSE TYPES) PER FTE TENURED AND TENURE
TRACK FACULTY MEMBER/a , /c AT PUBLIC DCU INSTITUTIONS: 1991-92 AND1999-00/b
0.0
2.0
4.0
6.0
8.0
10.0
12.0
91-92 6.3 5.8 0.0 6.4 10.4 7.6 6.4 6.2 6.0 8.0 7.2
99-00 6.2 5.1 5.6 7.5 10.3 7.1 6.9 6.8 6.6 10.0 7.3
FAMU FAU FGCU FIU FSU UCF UF UNF USF UWF FL DCU
Source: IRDF
3 Exhibit 5-2 provides a complete listing of all course section types offered in 1999-00.

Analysis of Faculty Productivity
Page 5-20
EXHIBIT 5-8NUMBER OF COURSES (ALL COURSE TYPES) PER FTE NON TENURE-TRACKFACULTY MEMBER/a, /c AT PUBLIC DCU INSTITUTIONS: 1991-92 AND 1999-00/b
0.0
2.0
4.0
6.0
8.0
10.0
12.0
91-92 10.4 8.7 0.0 9.4 10.9 11.2 6.9 5.1 8.4 9.8 9.2
99-00 7.8 7.9 7.4 11.3 10.3 8.5 7.3 8.1 8.1 9.3 8.8
FAMU FAU FGCU FIU FSU UCF UF UNF USF UWF FL DCU
Source: IRDF
Non-tenure track faculty typically had heavier course loads than did tenured and
tenure earning faculty, although this was not the case at every institution. In 1999-00,
non-tenure track faculty across all public DCU institutions taught on average about 1.2
course sections for every course section taught by tenured and tenure earning faculty.
This, however, is not unexpected, since non-tenure track faculty are primarily hired for
instructional purposes only, while tenured and tenure-track faculty have a multitude of
other duties including research and public service, which are essential functions of their
positions. It would be unreasonable to assume that faculty with such additional duties
would be expected to teach as much as instructors without them. In fact, in 1999-00
non-tenure track faculty reported that about 80 percent of their effort was devoted to
credit-generating instruction, whereas tenured and tenure track faculty reported an
average of 55 percent.

Analysis of Faculty Productivity
Page 5-21
Moreover, many tenured and tenure track faculty carry formal administrative
functions which occupy a portion of their time. Included among the faculty ranks in most
colleges and departments are Deans, Department Chairs, and Program Directors.
Often, university presidents and provosts continue to carry some instructional duties in
addition to their administrative function. Adjunct and other non-tenure track faculty rarely
occupy such administrative positions.
Unlike the trend among tenured and tenure track faculty, however, average course
load among non-tenure track faculty has declined somewhat since the beginning of the
decade. Those institutions at which this figure declined, however, have expanded the
ranks of non-tenure track faculty at a much higher rate than enrollment. Hence student-
staff ratios for these instructors have declined sharply, leading to smaller classes and
fewer course sections per FTE staff.
Exhibits 5-9 and 5-10 depict the number of formal classroom course sections per
FTE tenured and tenure earning faculty member (Exhibit 5-9) and non-tenure track
faculty member (Exhibit 5-10). For purposes of this measure, formal classroom courses
include only class lectures, seminars (discussions), and laboratories. The trend for this
subset of course sections was generally the same as that seen in Exhibits 5-7 and 5-8,
which included all course section types. On average, tenured and tenure track faculty
across all institutions taught the same number of formal course sections (4.8) in 1999-00
as in 1991-92.
Because class lectures, seminars, and laboratories comprised the majority of
courses taught by non-tenure track faculty in both 1991-92 and 1999-00, the average
formal course load (Exhibit 5-10) among this group of faculty was only slightly less than
the average total course load (Exhibit 5-8).

Analysis of Faculty Productivity
Page 5-22
EXHIBIT 5-9FORMAL CLASSROOM COURSE SECTIONS PER FTE TENURED AND TENURETRACK FACULTY MEMBER/a, /c AT PUBLIC DCU INSTITUTIONS: 1991-92 AND
1999-00/b
0.0
1.0
2.0
3.0
4.0
5.0
6.0
91-92 5.5 4.5 0.0 4.8 5.1 4.6 4.8 5.0 4.4 4.6 4.8
99-00 5.1 4.0 4.2 5.0 5.3 4.5 4.7 5.7 3.9 5.0 4.8
FAMU FAU FGCU FIU FSU UCF UF UNF USF UWF FL DCU
EXHIBIT 5-10FORMAL CLASSROOM COURSE SECTIONS PER FTE NON-TENURE TRACK
FACULTY MEMBER/a, /c AT PUBLIC DCU INSTITUTIONS: 1991-92 AND 1999-00/b
0.0
2.0
4.0
6.0
8.0
10.0
12.0
91-92 10.0 7.5 0.0 8.7 9.1 8.9 5.4 4.0 7.1 7.4 7.8
99-00 7.6 7.1 6.2 10.3 9.6 7.1 5.7 7.1 6.5 7.1 7.5
FAMU FAU FGCU FIU FSU UCF UF UNF USF UWF FL DCU
Source: IRDF
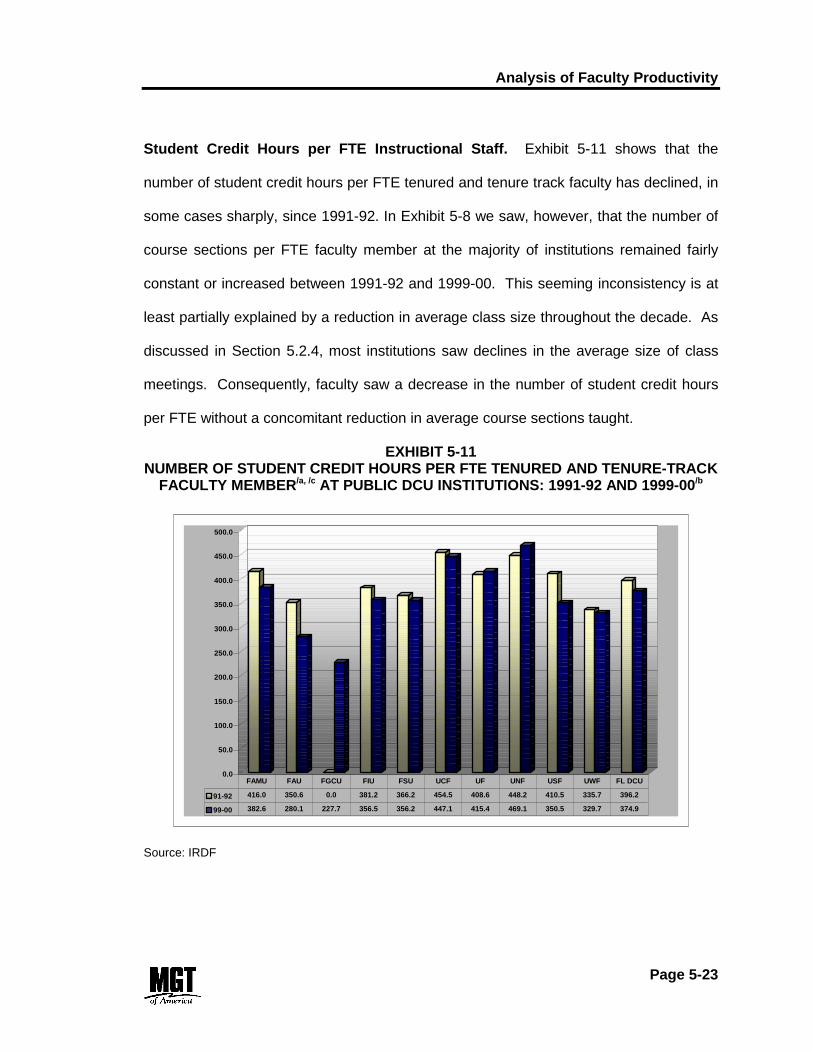
Analysis of Faculty Productivity
Page 5-23
Student Credit Hours per FTE Instructional Staff. Exhibit 5-11 shows that the
number of student credit hours per FTE tenured and tenure track faculty has declined, in
some cases sharply, since 1991-92. In Exhibit 5-8 we saw, however, that the number of
course sections per FTE faculty member at the majority of institutions remained fairly
constant or increased between 1991-92 and 1999-00. This seeming inconsistency is at
least partially explained by a reduction in average class size throughout the decade. As
discussed in Section 5.2.4, most institutions saw declines in the average size of class
meetings. Consequently, faculty saw a decrease in the number of student credit hours
per FTE without a concomitant reduction in average course sections taught.
EXHIBIT 5-11NUMBER OF STUDENT CREDIT HOURS PER FTE TENURED AND TENURE-TRACK
FACULTY MEMBER/a, /c AT PUBLIC DCU INSTITUTIONS: 1991-92 AND 1999-00/b
0.0
50.0
100.0
150.0
200.0
250.0
300.0
350.0
400.0
450.0
500.0
91-92 416.0 350.6 0.0 381.2 366.2 454.5 408.6 448.2 410.5 335.7 396.2
99-00 382.6 280.1 227.7 356.5 356.2 447.1 415.4 469.1 350.5 329.7 374.9
FAMU FAU FGCU FIU FSU UCF UF UNF USF UWF FL DCU
Source: IRDF

Analysis of Faculty Productivity
Page 5-24
5.2.9 Contact Hours and Equivalencies per FTE Tenured and Tenure EarningFaculty Member
As discussed in Chapter 4, Florida's 12-Hour Law mandates that all full-time
equivalent faculty members who are paid wholly from state (E&G) funds must teach a
minimum of twelve classroom contact hours per week.
The law further stipulates that when a faculty member is assigned professional
duties in furtherance of the academic mission of the university for which he/she works,
the minimum number of contact hours may be reduced in proportion to the 12 classroom
contact hours per week as such especially assigned duties and responsibilities bear to
12 classroom contact hours per week. These "other" assignments and duties include
the myriad research, service, and administrative duties that are an indispensable part of
the typical faculty member's workload. Whereas scheduled credit generating
instructional activities4 are reported as classroom contact hours, all non-classroom credit
generating instruction as well as all non-credit-generating activities are reported as
contact hour equivalencies.5
Although applied to different types of faculty activity, contact hours and contact
hour equivalencies represent the same unit of measurement. As implemented by the
institutions themselves, one contact hour or equivalency corresponds to 3.3 clock hours
per week. Twelve contact hours, therefore, are equivalent to 40 clock hours per week.
Exhibit 5-12 depicts the number of classroom contact hours and contact hour
equivalencies per FTE E&G tenured and tenure earning faculty member at each of the
4 i.e. class lectures, discussion sections, and laboratories.5 Credit generating non-classroom instructional activities (e.g. directed study, performancesections) and non-credit-generating activities (e.g. research, public service, advising, universitygovernance) are assigned contact hour equivalencies according to the criteria stipulated in CM-87-17.2.

Analysis of Faculty Productivity
Page 5-25
public DCU institutions. The figures shown represent the total number of contact hour
and equivalencies for both the fall and spring terms in each academic year (divide by
two to obtain the number of contact hours per semester). Activities that did not generate
any contact hours are not included in this exhibit.
On average, tenured and tenure earning faculty members at the ten public DCU
institutions generated contact hours and equivalencies in excess of the 12 hour-per-term
minimum (Exhibit 5-12). The same is true when each institution is examined individually.
The total number of contact hours per FTE declined in the early part of the decade, from
30.3 in 1991-92 to about 29 in 1995-96 and 1999-00.
In each of the three years displayed, credit generating instructional activities
comprised approximately two-thirds of the total number of contact hours and
equivalencies generated by tenured and tenure earning faculty members at all public
DCU institutions. This figure varied somewhat between institutions; instructional
activities comprised a substantially greater portion of total contact hours and
equivalencies at UNF (75 percent in 1999-00) than at the other institutions.

Analysis of Faculty Productivity
Page 5-26
EXHIBIT 5-12CLASSROOM CONTACT HOURS/EQUIVALENCIES PER FTE E&G TENURED AND
TENURE EARNING FACULTY MEMBER/a, /c AT PUBLIC DCU INSTITUTIONS:1991-92, 1995-96, AND 1999-00/b
CREDIT GENERATING NON-CREDIT GENERATING
LO
WE
R
UP
PE
R
GR
AD
GR
AD
III
TO
TA
L, C
RE
DIT
G
EN
ER
AT
ING
SU
PE
RV
ISIO
N O
F C
OO
P.
ED
UC
AT
ION
CL
INIC
AL
INS
TR
UC
TIO
N
INS
TR
UC
TIO
N
EF
FO
RT
/SE
CO
ND
AR
Y S
ITE
T
RA
VE
L
RE
SE
AR
CH
OR
GA
NIZ
ED
RE
SE
AR
CH
OT
HE
R IN
ST
RU
CT
ION
AL
E
FF
OR
T
PU
BL
IC S
ER
VIC
E
AG
RIC
UL
TU
RA
L
EX
TE
NS
ION
SE
RV
ICE
CL
INIC
AL
SE
RV
ICE
ST
AT
E M
AN
DA
TE
D
SE
RV
ICE
AC
AD
EM
IC A
DV
ISIN
G
AC
AD
EM
IC
AD
MIN
IST
RA
TIO
N
UN
IVE
RS
ITY
GO
VE
RN
AN
CE
LE
AV
E O
F A
BS
EN
CE
WIT
H
PA
Y
RE
LE
AS
E T
IME
TO
TA
L, N
ON
-CR
EID
T
GE
NE
RA
TIN
G
TO
TA
L, A
LL
AC
TIV
ITIE
S
FAMU 6.1 9.9 1.9 - 17.9 - - - 2.4 - 1.5 0.7 - - - 2.4 4.1 0.7 0.6 0.0 12.4 30.3
FAU 1.6 9.3 6.9 - 17.7 - - - 6.1 - 0.8 0.5 - - - 1.8 2.4 0.7 0.4 - 12.7 30.4
FGCU - - - - - - - - - - - - - - - - - - - - - -
FIU 1.4 10.3 5.5 - 17.2 0.0 - 0.0 5.9 - 0.3 1.1 - - - 1.1 1.9 0.6 0.7 0.0 11.6 28.8
FSU 1.7 7.9 8.5 - 18.0 - - - 7.6 - 0.7 0.8 - - - 0.7 2.8 0.5 - 0.0 13.1 31.1
UCF 1.7 11.3 4.8 - 17.8 - - 0.0 5.1 - 0.5 0.7 - - - 1.2 3.1 1.4 0.6 0.0 12.7 30.5
UF 1.9 7.0 7.6 0.0 16.5 - 0.0 - 6.9 - 0.9 0.9 0.0 - - 0.7 2.0 1.1 - - 12.7 29.2
UNF 2.3 11.9 3.8 - 18.0 - - - 3.3 - 0.2 1.0 - - - 0.4 2.7 1.1 0.5 0.1 9.3 27.3
USF 1.7 11.1 7.1 - 19.9 0.0 - 0.0 5.9 - 0.9 0.9 - - - 1.0 2.8 0.5 0.6 0.1 12.8 32.7
UWF 1.7 12.4 4.5 - 18.5 0.1 - - 4.4 - 1.3 0.6 - - - 1.8 3.2 0.4 - - 11.7 30.2
FL DCU 2.0 9.4 6.5 0.0 17.9 0.0 0.0 0.0 6.0 - 0.8 0.8 0.0 - - 1.1 2.6 0.8 0.3 0.0 12.5 30.3
FAMU 5.4 11.5 3.6 - 20.5 - - - 2.1 - 1.8 0.1 - - - 3.1 3.2 0.3 0.8 0.1 11.5 32.0
FAU 1.2 9.6 4.3 - 15.2 - - - 3.1 - 0.7 0.3 - - - 1.3 2.1 1.0 0.3 0.1 8.9 24.0
FGCU - - - - - - - - - - - - - - - - - - - - - -
FIU 1.5 10.5 6.5 - 18.5 - - 0.0 5.9 - 0.5 0.7 - - - 1.3 1.9 0.5 0.7 0.1 11.5 30.0
FSU 1.8 8.3 9.1 - 19.1 - - - 5.0 - 1.7 0.4 - - - 1.9 1.4 0.3 0.1 0.1 10.8 30.0
UCF 1.6 11.7 6.2 - 19.4 - - 0.1 4.2 0.2 1.1 0.4 - - - 1.5 2.8 0.7 0.6 0.0 11.6 31.0
UF 2.1 7.6 8.0 0.0 17.6 - 0.0 0.1 3.1 1.2 2.1 0.6 0.0 - - 1.2 1.4 0.8 0.5 0.0 11.1 28.7
UNF 3.5 12.0 4.0 - 19.5 - - - 2.8 - 0.7 0.5 - - - 0.6 2.1 0.9 0.9 0.1 8.6 28.1
USF 1.6 9.7 7.1 0.0 18.4 - - 0.0 3.9 0.9 1.4 0.8 - - - 0.8 1.8 0.5 0.9 0.1 11.1 29.5
UWF 2.0 12.5 4.9 - 19.4 0.0 - - 1.2 - 1.4 0.2 - - - 2.2 2.1 0.1 0.6 - 7.9 27.3
FL DCU 2.0 9.6 6.8 0.0 18.4 0.0 0.0 0.0 3.8 0.4 1.4 0.5 0.0 - - 1.5 1.9 0.6 0.6 0.1 10.7 29.2
FAMU 5.4 8.5 4.6 - 18.5 - - - 0.8 - 3.7 0.4 - - 0.2 3.3 3.4 0.2 0.4 0.0 12.3 30.8
FAU 1.8 7.3 3.9 - 13.0 - - - 3.7 0.3 0.9 0.2 - - 0.1 1.1 2.5 1.5 0.8 0.0 11.2 24.2
FGCU 2.4 9.0 3.5 - 15.0 0.0 - - 2.1 - 1.5 1.4 - - 0.3 0.7 3.3 1.1 0.1 0.1 10.5 25.5
FIU 2.4 9.2 7.3 - 18.9 - - - 5.1 - 1.4 0.4 - - 0.0 1.0 2.0 0.5 0.6 0.1 11.1 30.0
FSU 2.8 7.4 9.6 - 19.8 - - - 4.7 1.2 1.4 0.5 - - - 1.1 1.5 0.2 0.2 0.0 10.9 30.8
UCF 2.5 9.0 5.8 - 17.3 - - 0.0 2.8 0.0 4.0 0.3 - - - 1.4 2.4 0.5 0.5 0.0 12.0 29.4
UF 1.7 7.2 9.0 0.1 18.0 - 0.1 0.0 3.3 1.1 2.6 0.4 0.0 0.1 0.0 1.0 1.7 0.9 0.4 0.0 11.4 29.4
UNF 5.3 12.5 4.7 - 22.6 - - - 2.5 0.1 1.2 0.5 - 0.0 0.1 0.4 1.3 0.9 0.3 0.1 7.4 30.0
USF 2.1 7.3 5.8 0.0 15.2 0.0 - 0.0 4.9 1.0 0.8 0.7 - 0.0 0.1 0.6 1.8 0.8 0.8 0.0 11.5 26.8
UWF 2.8 11.7 5.8 - 20.3 0.0 - - 2.7 - 0.6 0.4 - - 0.2 2.0 3.0 0.5 1.7 - 11.2 31.5
FL DCU 2.6 8.2 6.9 0.0 17.7 0.0 0.0 0.0 3.6 0.6 2.0 0.5 0.0 0.0 0.1 1.2 2.1 0.7 0.5 0.0 11.2 29.0
91-9
295
-96
99-0
0
Source: IRDF

Analysis of Faculty Productivity
Page 5-27
5.3 Teaching Productivity in Selected Disciplines
To this point, we have discussed teaching productivity at the institutional and
division levels only. Although such treatment of the subject is useful in order to ascertain
the overall level of faculty productivity at Florida's public universities, it masks the
differences in roles, methods, and type of instruction in individual disciplines.
This section will provide a broad overview of faculty productivity in several key
disciplines, assessed according to the same quantitative measures as presented in the
preceding section. This section is not intended as an exhaustive reference on each of
the presented measures of faculty productivity. The discussion that follows does not
treat each institution separately, nor does it attempt to provide data for every discipline in
which instruction was given. Instead, several of those disciplines demonstrating distinct
differences in the distribution of faculty effort, teaching load, research, and method of
course delivery, have been selected in order to highlight the principle that the character
of faculty activity and student instruction varies according to discipline. For those readers
wishing to examine productivity measures for all disciplines and institutions, the full set
of data are presented in Appendix 5-B.
5.3.1 Distribution of Courses Taught and Student Credit Hours Produced inSelected Disciplines, by Course Section Type and Level
The disciplines selected for discussion, together with the percentage of courses
taught and student credit hours produced in each, are presented in Exhibit 5-13. It is
immediately evident that distinct differences in the predominant method of course
delivery exist across these disciplines. Instruction in Business Management and
Computer & Information Sciences was delivered almost exclusively via class lectures
(93.2% and 95.5% of course sections, respectively). This is in marked contrast to the

Analysis of Faculty Productivity
Page 5-28
distribution of Engineering, Physical Science, and Visual/Performing Arts course
sections. The physical sciences utilized laboratory instruction to a much greater extent
than the other disciplines. Because a large proportion of lab sections are taught by
Graduate Student Instructors, this effects some measures of faculty productivity (for
instance, the percentage of total instructional effort contributed by tenured and tenure
earning faculty).
Naturally, performance sections comprised a substantial percentage of course
sections in the Visual and Performing Arts (12.5%). Again, this impacts upon specific
measures of faculty productivity in this discipline. For instance, because these sections
are typically individualized instruction, one would expect faculty members in the Visual
and Performing Arts to carry a relatively higher than average course load and an
average or lower than average output of student credit hours.
The differences in methods of course delivery across these disciplines is even
more apparent when one examines the distribution of student credit hours by course
section type. Whereas almost 80 percent of the student credit hours in Business
Management were generated in class lectures, only 34 percent of student credit hours in
the Physical Sciences and 37 percent in Visual/Performing Arts, were produced in class
lectures.

Analysis of Faculty Productivity
Page 5-29
EXHIBIT 5-13PERCENTAGE DISTRIBUTION OF COURSE SECTIONS TAUGHT AND STUDENT CREDITS HOURS PRODUCED IN
SELECTED DISCIPLINES AT PUBLIC DCU INSTITUTIONS, BY COURSE SECTION TYPE: 1999-00/b
BUSINESSMANAGEMENT
COM PUTER AND INFORMATION SCIENCES
ENGINEERINGPHYSICALSCIENCES
VISUAL AND PERFORMING ARTS
COURSE SECTION TYPE
% C
OU
RS
E
SE
CT
ION
S
% S
TU
DE
NT
C
RE
DIT
HO
UR
S
% C
OU
RS
E
SE
CT
ION
S
% S
TU
DE
NT
C
RE
DIT
HO
UR
S
% C
OU
RS
E
SE
CT
ION
S
% S
TU
DE
NT
C
RE
DIT
HO
UR
S
% C
OU
RS
E
SE
CT
ION
S
% S
TU
DE
NT
C
RE
DIT
HO
UR
S
% C
OU
RS
E
SE
CT
ION
S
% S
TU
DE
NT
C
RE
DIT
HO
UR
S
CLASS LECTURE 93.2% 79.7% 95.5% 69.1% 84.8% 60.8% 80.7% 33.8% 69.7% 37.1%
DISCUSSION 2.4% 5.7% 0.1% 3.0% 0.2% 3.6% 0.6% 8.4% 1.9% 2.6%
DISSERTATION 0.1% 1.6% 0.2% 1.5% 2.1% 3.2% 1.5% 4.7% 0.3% 0.9%
INTERNSHIP 0.4% 2.6% 0.1% 0.5% 0.1% 0.6% 0.1% 0.3% 0.7% 1.1%
LABORATORY 0.3% 0.4% 0.7% 8.4% 4.1% 10.3% 13.7% 32.9% 8.8% 7.0%
OTHER 3.1% 3.9% 1.8% 3.0% 3.5% 5.7% 1.1% 1.4% 3.7% 3.6%
PERFORMANCE 0.0% 0.1% 0.0% 0.1% 0.0% 0.1% 0.0% 0.0% 12.5% 38.2%
SUPERVISED RESEARCH 0.0% 0.3% 0.1% 1.4% 0.2% 0.9% 0.3% 2.4% 0.1% 0.7%
SUPERVISED TEACHING 0.0% 0.0% 0.0% 0.2% 0.0% 0.1% 0.1% 1.1% 0.1% 0.3%
THESIS 0.0% 0.0% 0.7% 4.2% 2.4% 5.2% 0.6% 3.6% 0.3% 0.9%
DIRECTED STUDY 0.5% 5.8% 0.8% 8.6% 2.6% 9.6% 1.3% 11.4% 1.9% 7.4%
TOTAL 100.0% 100.0% 100.0% 100.0% 100.0% 100.0% 100.0% 100.0% 100.0% 100.0%
% OF COURSES BY LEVEL (ALL SECTION TYPES)
LOWER 9.4% 14.7% 24.4% 35.2% 3.5% 8.3% 52.8% 81.7% 35.2% 48.9%
UPPER 65.4% 73.6% 43.7% 55.3% 47.1% 66.9% 16.1% 10.8% 43.3% 43.6%
GRAD 25.2% 11.7% 31.9% 9.5% 49.4% 24.9% 31.1% 7.5% 21.5% 7.6%
TOTAL 100.0% 100.0% 100.0% 100.0% 100.0% 100.0% 100.0% 100.0% 100.0% 100.0%
Source: IRDF

Analysis of Faculty Productivity
Page 5-30
Exhibit 5-13 also depicts the distribution of course sections and student credit
hours by level. Once again, distinct differences appear that bear directly upon the issue
of faculty productivity in these disciplines. More than half of all course sections in the
physical sciences were at the lower level in 1999-00, as were approximately one-third of
course sections in the Visual and Performing Arts. Engineering and Business
Management had substantially fewer lower level courses (3.5 and 9.4%, respectively).
Consequently, one would expect a much greater share of tenured and tenure earning
faculty effort to be devoted to lower level instruction in the former disciplines than in the
latter.
5.3.2 Average Size of Class Meeting Times in Selected Disciplines
In Exhibit 5-3, we saw that the mean class meeting-time size at public DCU
institutions was approximately 33 students in 1999-00. Class size was not uniform
across disciplines, however. Exhibit 5-14 makes evident the degree to which class size
varied between disciplines.
Among those disciplines depicted, the largest classes were taught in Business
Management: the mean class size in 1999-00 was more than 45 students per class
meeting. Median class size in this discipline was 36 students. Of the depicted
disciplines, Engineering and the Visual and Performing Arts had the smallest mean class
sizes (22.9 and 23.3 students per class meeting, respectively).

Analysis of Faculty Productivity
Page 5-31
EXHIBIT 5-14AVERAGE CLASS MEETING TIME SIZE IN SELECTED DISCIPLINES AT PUBLIC
DCU INSTITUTIONS: 1999-00/b
UNDERGRAD GRAD TOTALDISCIPLINE Mean Median Mean Median Mean Median
Com puter and Inform ation Sciences 42.9 32.0 14.1 9.0 38.2 30.0Engineering 27.3 20.0 11.6 8.0 22.9 16.0Physical Sciences 45.6 24.0 9.4 7.0 40.7 21.0Visual and Perform ing Arts 26.6 18.0 6.8 4.0 23.3 16.0Business Managem ent 48.9 39.0 27.6 24.0 45.2 36.0
Source: IRDF
5.3.3 Percentage of Instructional Effort Provided by E&G Instructional Staff inSelected Disciplines
The percentage of instructional effort provided by tenured and tenure earning
faculty across all disciplines and instructional levels was 58 percent in 1999-00. In the
five disciplines displayed in Exhibit 5-15, this figure varied considerably, from a minimum
of 46 percent (Computer and Information Sciences) to a maximum of 76 percent
(Engineering).
A similar variation between disciplines is observed in the percentage of
instructional effort provided by tenured and tenure earning faculty at the lower and upper
levels of instruction. Whereas faculty provided only 20 percent of lower level instructional
effort in Computer and Information Sciences, they were responsible for almost half of the
lower level instructional effort in the Visual and Performing Arts and almost two-thirds in
Engineering. The average across all disciplines was 31.2 percent.
Faculty in each of the five disciplines shown in Exhibit 5-15 contributed a greater
share of instructional effort at the upper level than at the lower level, although the same
variation across disciplines is evident at both levels.
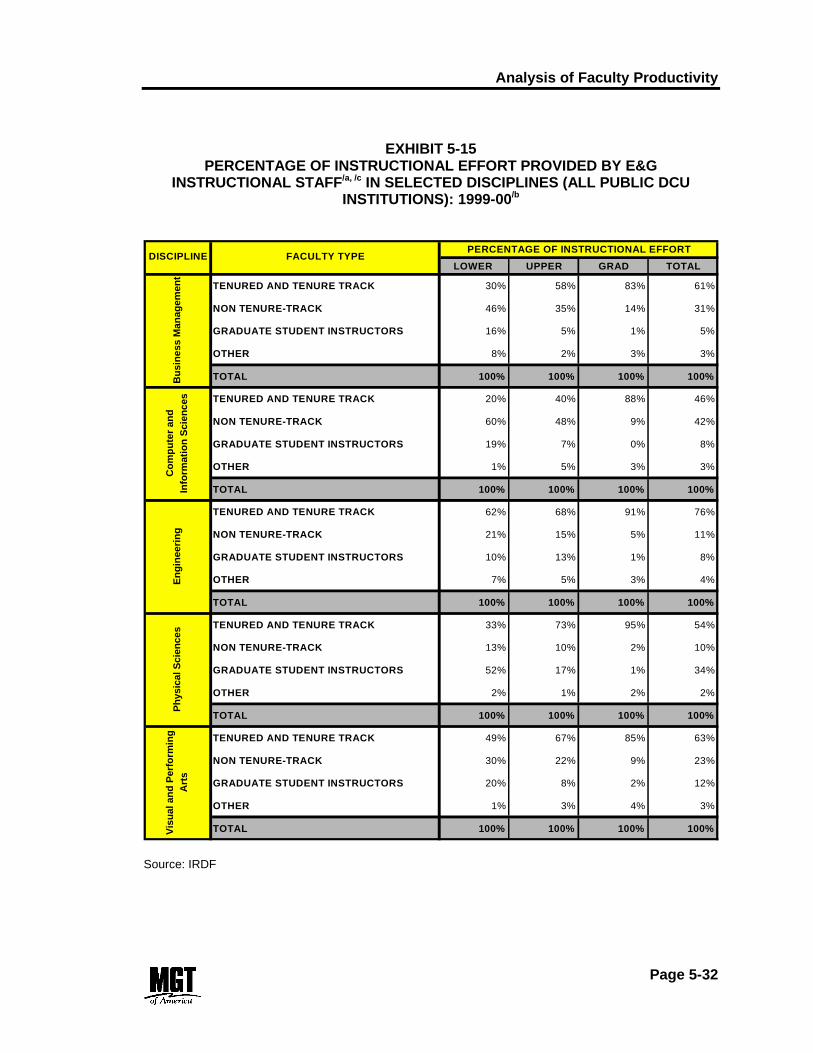
Analysis of Faculty Productivity
Page 5-32
EXHIBIT 5-15PERCENTAGE OF INSTRUCTIONAL EFFORT PROVIDED BY E&G
INSTRUCTIONAL STAFF/a, /c IN SELECTED DISCIPLINES (ALL PUBLIC DCUINSTITUTIONS): 1999-00/b
PERCENTAGE OF INSTRUCTIONAL EFFORT
LOWER UPPER GRAD TOTAL
TENURED AND TENURE TRACK 30% 58% 83% 61%
NON TENURE-TRACK 46% 35% 14% 31%
GRADUATE STUDENT INSTRUCTORS 16% 5% 1% 5%
OTHER 8% 2% 3% 3%
TOTAL 100% 100% 100% 100%
TENURED AND TENURE TRACK 20% 40% 88% 46%
NON TENURE-TRACK 60% 48% 9% 42%
GRADUATE STUDENT INSTRUCTORS 19% 7% 0% 8%
OTHER 1% 5% 3% 3%
TOTAL 100% 100% 100% 100%
TENURED AND TENURE TRACK 62% 68% 91% 76%
NON TENURE-TRACK 21% 15% 5% 11%
GRADUATE STUDENT INSTRUCTORS 10% 13% 1% 8%
OTHER 7% 5% 3% 4%
TOTAL 100% 100% 100% 100%
TENURED AND TENURE TRACK 33% 73% 95% 54%
NON TENURE-TRACK 13% 10% 2% 10%
GRADUATE STUDENT INSTRUCTORS 52% 17% 1% 34%
OTHER 2% 1% 2% 2%
TOTAL 100% 100% 100% 100%
TENURED AND TENURE TRACK 49% 67% 85% 63%
NON TENURE-TRACK 30% 22% 9% 23%
GRADUATE STUDENT INSTRUCTORS 20% 8% 2% 12%
OTHER 1% 3% 4% 3%
TOTAL 100% 100% 100% 100%Vis
ual
an
d P
erfo
rmin
g
Art
s
DISCIPLINE FACULTY TYPE
Bu
sin
ess
Man
agem
ent
Co
mp
ute
r an
d
Info
rmat
ion
Sci
ence
sE
ng
inee
rin
gP
hys
ical
Sci
ence
s
Source: IRDF

Analysis of Faculty Productivity
Page 5-33
5.3.4 Average Number of Courses Taught and Student Credit Hours Produced byE&G Faculty and Other Instructional Positions in Selected Disciplines
Differences across disciplines with respect to measures of faculty productivity on
an individual level are especially evident. The following measures of average faculty
workload highlight the impact of discipline specific factors, such as the importance or
prevalence of research activity to faculty in a specific discipline, or the role of
individualized instruction.
Courses per FTE Instructional Staff in Selected Disciplines. Exhibit 5-16 and 5-17
show the number of course sections per FTE for both tenured and tenure earning faculty
and for non-tenure track faculty. The former displays this statistic including all course
section types, whereas the latter includes only formal classroom course sections. The
reasoning for showing faculty workload in both ways is manifest (See Section 5.2.8) in
these exhibits. Although many perceive "formal" classroom instruction to be of greater
value or ubiquity than other methods of course delivery, measurements of faculty
workload that fail to capture the great variety of other instructional methods used in
some disciplines arbitrarily penalize these disciplines.
For instance, a significant portion of instruction in the Visual Arts and Sciences
occurs in the form of individualized performance instruction. This is due simply to the
nature of artistic instruction. Hence, while the average "formal" classroom course load of
tenured and tenure-track faculty members in this discipline is only 5.0 per FTE, the total
course load is more than eleven sections per FTE.6 A similar difference between these
two measures is seen in the other depicted disciplines, although to a lesser extent.
6 Please note the distinction between "formal" course load, which includes only scheduled groupinstruction sections (class lectures, discussions, and laboratories only) and "total" course load,which includes all course sections irrespective of type. A more detailed discussion of this topic isfound in section 5.2.7.

Analysis of Faculty Productivity
Page 5-34
EXHIBIT 5-16NUMBER OF COURSES (ALL COURSE SECTION TYPES) PER FTE E&G FACULTYMEMBER/a AT PUBLIC DCU INSTITUTIONS: SELECTED DISCIPLINES IN 1999-00/b
0.0
2.0
4.0
6.0
8.0
10.0
12.0
14.0
TENURED AND TENURE TRACK /c 5.5 7.8 8.8 6.3 11.2
NON TENURE-TRACK 7.5 9.7 10.2 10.0 12.1
BUSINESS MANAGEMENT
COMPUTER & INFORMATION
SCIENCESENGINEERING
PHYSICAL SCIENCES
VISUAL & PERFORMING
ARTS
Source: IRDFEXHIBIT 5-17
FORMAL CLASSROOM COURSE SECTIONS PER FTE E&G FACULTY MEMBER /a
AT PUBLIC DCU INSTITUTIONS: SELECTED DESCIPLINES IN 1999-00/b
0.0
1.0
2.0
3.0
4.0
5.0
6.0
7.0
8.0
9.0
10.0
TENURED AND TENURE TRACK 4.5 5.3 6.2 3.8 5.0
NON TENURE-TRACK 7.1 9.3 9.6 9.5 5.9
BUSINESS MANAGEMENT
COMPUTER & INFORMATION
SCIENCESENGINEERING
PHYSICAL SCIENCES
VISUAL & PERFORMING
ARTS
Source: IRDF

Analysis of Faculty Productivity
Page 5-35
Student Credit Hours per FTE Instructional Staff. In three of the five depicted
disciplines (Exhibit 5-18), student credit hour production per FTE tenured and tenure
track faculty member was at or above the average for all disciplines in 1999-00 (374.9).
Average student credit hour production in the visual and performing arts (294.5 per FTE)
was lower than average because of the high proportion of individual performance
sections taught by faculty. Because of the high student/faculty ratio and small average
class sizes in Engineering, faculty in this discipline tended to produce fewer student
credit hours per FTE than the average for all disciplines.
EXHIBIT 5-18NUMBER OF STUDENT CREDIT HOURS PER FTE E&G FACULTY MEMBER/a AT
PUBLIC DCU INSTITUTION: SELECTED DISCIPLINES IN 1999-00/b
0.0
200.0
400.0
600.0
800.0
1000.0
1200.0
TENURED AND TENURE TRACK /c 555.3 375.1 265.8 386.0 284.5
NON TENURE-TRACK 851.6 1007.1 525.1 806.4 430.3
BUSINESS MANAGEMENT
COMPUTER & INFORMATION
SCIENCESENGINEERING
PHYSICAL SCIENCES
VISUAL & PERFORMING
ARTS
Source: IRDF
5.4 Purposes and Outcomes of Non-Teaching Assignments
Faculty responsibilities at Florida's public universities extend well beyond
teaching. Although undergraduate instruction is a vitally important component of the

Analysis of Faculty Productivity
Page 5-36
institutional mission at each of these universities, it is but one of the central functions of
higher education. Faculty members are expected to devote a significant portion of their
effort to the myriad research and service activities that inform and enhance the
instructional process and enrich the communities of which they are a part.
Educational and legislative leaders in Florida have long acknowledged the
importance of research and service in the state universities. According to the State
University System 1998-2003 Strategic Plan, "the mission of all universities
encompasses the three traditional roles of teaching, research, and public service." And
as previously mentioned, Florida's 12-Hour Law, which mandates that full-time
equivalent faculty teach a minimum of twelve classroom contact hours each term, allows
for a reduction in this number when faculty members are assigned research and/or
service duties. Moreover, as discussed in Chapter 4, many of the ten public DCU
institutions have procedures for reporting and measuring these types of activities, and
use them as part of the procedure by which eligibility for faculty tenure is determined.
Despite their importance, however, there is little uniformity or consistency in
reporting procedures for faculty research and service activities. It is difficult to capture
meaningful data about what faculty members do and what the purposes and outcomes
of these types of activities are. The simplest measures of productivity are expressed
quantitatively; however, most research and service activities provide benefits and result
in outcomes that are difficult to directly quantify.
Hence, this section offers some data indicating the importance and scope of
research and service activities at Florida's public universities, but readers should note
that these measures fail to capture the outcomes of most such activities. As was the
case with many of the previously discussed quantitative measures of teaching
productivity, the quality or usefulness of faculty research activities cannot be simply

Analysis of Faculty Productivity
Page 5-37
expressed as a function of the number of contract dollars generated or the volume of
publications produced by faculty. Nonetheless, such measures do offer at least a proxy
measure of the importance of these activities to the university system.
5.4.1 Faculty Research Activities
As one of the core functions of Florida's public universities, research plays an
invaluable role in the vitality of both the institutions themselves and society at large.
Faculty members engaged in active research contribute to the extension of the frontiers
of knowledge and innovation in our state. Perhaps more importantly to the process of
education at the undergraduate level, universities that actively support vital research
attract top faculty members whose expertise and talents are then available to the entire
body of students who attend those institutions.
Moreover, although the term "instruction" is often a reference to undergraduate
education leading to the production of baccalaureate degrees, it must also be noted that
all of the ten public DCU institutions offer degree programs at the graduate level. At the
post-baccalaureate level, research is not necessarily an activity separate from
instruction: it often is a vital part of the instructional process itself. In fact, as noted in
Chapter 2 of this report, the Delaware Study of Instructional Costs and Productivity
recognizes the central role that research plays in graduate education. It recommends
several qualitative measures of faculty productivity that relate directly to this issue.
Among these are the following:
! Number of students who author or co-author with a faculty mentor an article orchapter over past 36 months;
! Number of students presenting or co-presenting with a faculty mentor a paperat a professional meeting.
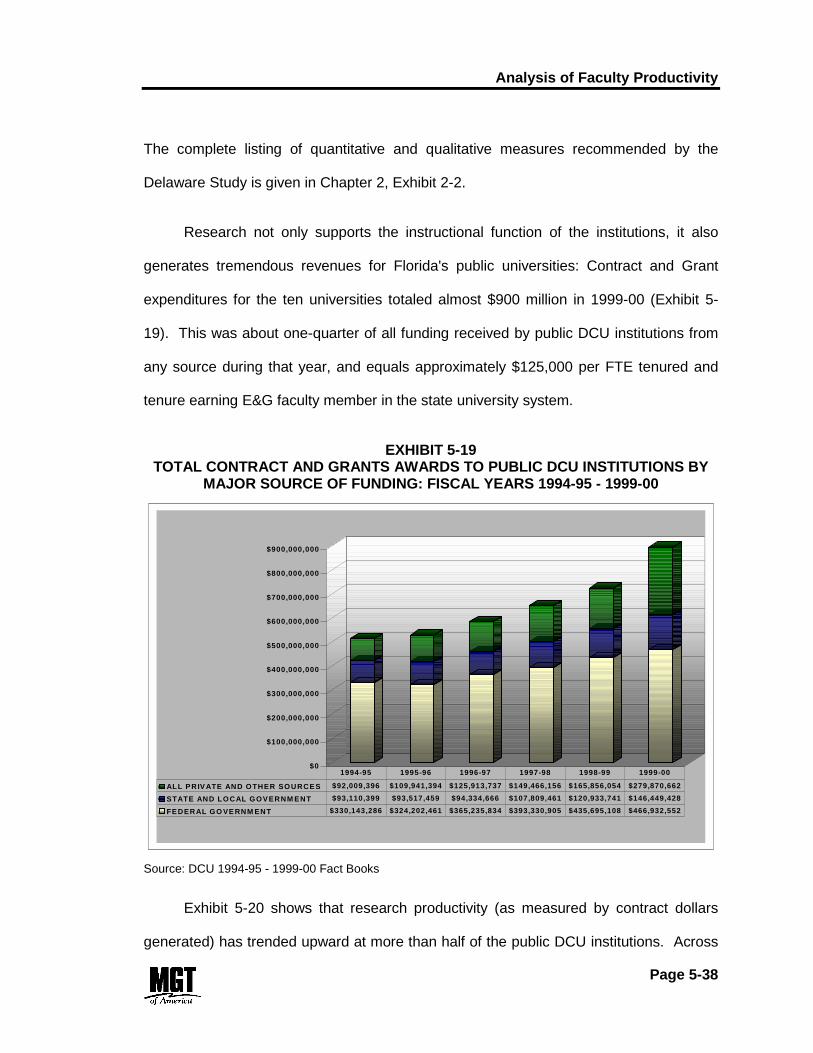
Analysis of Faculty Productivity
Page 5-38
The complete listing of quantitative and qualitative measures recommended by the
Delaware Study is given in Chapter 2, Exhibit 2-2.
Research not only supports the instructional function of the institutions, it also
generates tremendous revenues for Florida's public universities: Contract and Grant
expenditures for the ten universities totaled almost $900 million in 1999-00 (Exhibit 5-
19). This was about one-quarter of all funding received by public DCU institutions from
any source during that year, and equals approximately $125,000 per FTE tenured and
tenure earning E&G faculty member in the state university system.
EXHIBIT 5-19TOTAL CONTRACT AND GRANTS AWARDS TO PUBLIC DCU INSTITUTIONS BY
MAJOR SOURCE OF FUNDING: FISCAL YEARS 1994-95 - 1999-00
$0
$100,000,000
$200,000,000
$300,000,000
$400,000,000
$500,000,000
$600,000,000
$700,000,000
$800,000,000
$900,000,000
ALL PRIVATE AND OTHER SOURCES $92,009,396 $109,941,394 $125,913,737 $149,466,156 $165,856,054 $279,870,662
STATE AND LOCAL GOVERNM ENT $93,110,399 $93,517,459 $94,334,666 $107,809,461 $120,933,741 $146,449,428
FEDERAL GO VERNM ENT $330,143,286 $324,202,461 $365,235,834 $393,330,905 $435,695,108 $466,932,552
1994-95 1995-96 1996-97 1997-98 1998-99 1999-00
Source: DCU 1994-95 - 1999-00 Fact Books
Exhibit 5-20 shows that research productivity (as measured by contract dollars
generated) has trended upward at more than half of the public DCU institutions. Across

Analysis of Faculty Productivity
Page 5-39
all institutions, constant dollars per FTE E&G tenured and tenure earning faculty
member increased approximately one-third between 1994-95 and 1999-00. As would be
expected, faculty at the three research institutions (UF, FSU, and USF) generated
significantly more research dollars, on average, than faculty at the other public DCU
universities.
EXHIBIT 5-20CONTRACT AND GRANT AWARDS PER FTE E&G TENURED AND TENURE
EARNING FACULTY MEMBER/a IN CONSTANT 2000 DOLLARS (1994-95 - 1999-00)
$0
$50,000
$100,000
$150,000
$200,000
$250,000
1994-95 $93,137 $45,144 $0 $36,266 $70,377 $70,710 $182,844 $28,515 $108,039 $90,825
1995-96 $86,220 $43,821 $0 $43,229 $78,432 $56,968 $175,116 $25,252 $116,391 $65,526
1996-97 $81,013 $42,535 $0 $41,540 $85,795 $60,283 $208,119 $25,588 $118,955 $55,873
1997-98 $86,684 $42,558 $22,518 $49,871 $86,008 $56,509 $216,901 $18,138 $147,155 $51,737
1998-99 $93,421 $53,663 $23,996 $59,642 $95,635 $54,195 $178,451 $15,307 $174,835 $53,764
1999-00 $77,262 $55,103 $34,211 $74,237 $105,627 $69,305 $235,246 $23,046 $179,500 $76,427
FAM U FAU FGCU FIU FSU UCF UF UNF USF U W F
Source: DCU 1994-95 - 1999-00 Fact Books & IRDF
The increase in total contract and grant awards to public DCU institutions is
reflective of the rapid expansion of faculty research activity between 1994-95 and 1999-
00. Exhibit 5-21 shows that the number of active research projects has increased by
almost one third during that period; the number of proposals submitted to prospective
funding agencies has increased by about 25 percent; and the number of contract or
grant awards received has grown approximately 17 percent. Increased faculty research

Analysis of Faculty Productivity
Page 5-40
activity has, in turn, led to an increase in innovation: the number of U.S. patents granted
to public DCU institutions more than doubled between 1994-95 and 1999-00.
EXHIBIT 5-21SPONSORED RESEARCH ACTIVITIES AT PUBLIC DCU INSTITUTIONS:
1994-95 - 1999-00
PR
OP
OS
AL
S S
UB
MIT
TE
D
TO
PR
OS
PE
CT
IVE
FU
ND
ING
AG
EN
CIE
S
NE
W C
ON
TR
AC
TS
OR
GR
AN
TS
AW
AR
DS
RE
CE
IVE
D
EX
TE
NS
ION
S, R
EN
EW
AL
S,
CO
NT
INU
AT
ION
S O
R
SU
PP
LE
ME
NT
S O
F
EX
IST
ING
PR
OJE
CT
S
TO
TA
L P
RO
JEC
TS
AC
TIV
E D
UR
ING
FIS
CA
L Y
EA
R
US
PA
TE
NT
S
GR
AN
TE
D
FY 1994-95 7,832 4,017 3,910 9,496 44
FY 1995-96 7,494 3,889 4,949 9,897 61
FY 1996-97 8,355 3,591 5,913 10,830 77
FY 1997-98 8,549 3,862 6,332 11,226 100
FY 1998-99 9,036 4,471 5,624 11,697 103
FY 1999-00 9,821 4,703 5,483 12,624 92
% CHANGE 25.4% 17.1% 40.2% 32.9% 109.1%
Source: DCU 1994-95 - 1999-00 Fact Books
5.4.2 Faculty Service Activities
Although Florida's public universities typically identify public service as one of
their central functions, such activities are a distant third compared to the emphasis
placed upon instruction and research. Of the total funds spent on educational
operations in the state university system in 1999-00, only four percent was allocated for
public service. This compares to 31 percent for instruction and 16 percent for research.
Consequently, the portion of FTE effort devoted to public service by tenured and tenure-

Analysis of Faculty Productivity
Page 5-41
earning faculty is significantly less than that devoted to instruction or research activities
(Exhibit 5-22).
EXHIBIT 5-22PORTION OF FTE EFFORT DEVOTED TO INSTRUCTION, RESEARCH, AND
PUBLIC SERVICE BY FTE TENURED AND TENURE EARNING E&G FACULTY/a:1991-92 - 1999-00/b
0.0%
10.0%
20.0%
30.0%
40.0%
50.0%
60.0%
70.0%
PO
RT
ION
OF
FT
E E
FF
OR
T
INSTRUCTION 51.7% 52.2% 53.9% 55.6% 56.6% 57.0% 56.7% 55.8% 55.1%
RESEARCH 23.3% 22.5% 20.5% 18.8% 17.4% 17.4% 16.9% 17.9% 17.1%
PUBLIC SERVICE 3.3% 3.5% 3.3% 2.8% 2.0% 1.9% 2.0% 2.0% 2.1%
91-92 92-93 93-94 94-95 95-96 96-97 97-98 98-99 99-00
Source: IRDF
As noted in the introduction to this section, many aspects of faculty productivity
are difficult to quantify. This is especially true of faculty service activities. Public service
can include such activities as university and community leadership, membership in
professional and civic organizations, and service provided to community agencies.
Some institutions define public service explicitly as they relate to the mission of the
institution. Faculty at UNF, for instance, are assigned service duties in accordance with
four broad priorities:
! Strengthening K-12 Education;
! Strengthening Government Agencies;

Analysis of Faculty Productivity
Page 5-42
! Enhancing Community/Economic Development; and
! Strengthening Professional Disciplines/Organizations.
Such activities do not typically result in the production of any tangible product;
consequently, the outcome of faculty public service activities are not easily documented
or reported.
This is not to say, however, that the institutions do not track such activities. In the
above example of UNF faculty service duties, the institution produces a report of such
activities for each academic year. As with teaching and research duties, public service
activities are assigned to individual faculty members as a portion of their total FTE effort.
Also, pursuant to CM-87-17.2, assigned service activities are covered under the 12-Hour
law and generate contact hour equivalencies. All of the institutions track and report on
such things as the portion of faculty effort devoted to service, primarily for purposes of
budgeting and tenure review.
However, these measures do not speak to the issue of what outcomes or benefits
accrue to the institution or to the community as a result of faculty service activities.
Some of the public DCU institutions attempt to quantify faculty service activities by
measuring such things as the number of active memberships in professional or service
organizations, the number of days spent in service, or the number of leadership
positions occupied by faculty members (See Chapter 4). These measures are not
standard across all of the institutions, however, and there is no requirement that they be
regularly reported in a uniform or consistent manner.
5.5 Conclusions
Perhaps the most striking feature of the data presented in this chapter is the
breadth and variety of measures that can be used to evaluate the productivity of faculty
and other instructional staff. And, as pointed out in the introduction to the chapter, the

Analysis of Faculty Productivity
Page 5-43
measures presented herein are not comprehensive; many prominent studies of this
issue have recommended and implemented additional measures in an effort to more
accurately assess what faculty do and how well they are dong it.
Before presenting the conclusions that can be drawn from the data presented in
this chapter, the discussed measures of productivity must be put into context. First,
most of the employed measures focus upon inputs. Even those few that address
outputs are limited in their ability to describe the quality of instruction, research, or
service activities being performed. For instance, while one may be able to assess how
many student credit hours the average faculty member produces, such a figure does not
necessarily indicate whether faculty members are effective teachers. Such criticism is
common of many attempts to analyze faculty productivity.
Second, these data are essentially meaningless without some benchmark against
which to compare. Although identifying how much and what faculty members are doing
is of some value in providing baseline information and trend analyses within institutions,
the useful application of such data requires some comparison with appropriate peers in
order to determine whether they can or should be producing more.
As noted in several areas of this report, comparison across institutions within the
Florida university system is generally neither appropriate nor productive, since each
institution faces its own unique challenges, has unique goals, and acts to further its own
unique mission. In chapter 4, it was made clear that most institutions have developed
lists of peer institutions against which they can be usefully compared on a host of
indicators, including faculty productivity.
Finally, there is a dearth of useful and consistent data regarding faculty activities
in research and public service. While a great deal of information is gathered and

Analysis of Faculty Productivity
Page 5-44
periodically reported regarding teaching productivity, many measures of these other
faculty activities are not properly addressed.
Despite these factors, this chapter provides a great deal of information, not only
about what faculty are doing, but more broadly about the character of instruction being
delivered by Florida's public universities. Most notably, the data make clear the
following:
! Tenured and tenure earning faculty provided the majority ofinstructional effort and generated the bulk of the student credithours at public DCU institutions in all years examined. Contrary tothe perception held by some external publics, adjunct faculty, non-ranked faculty, graduate student instructors, and other types ofinstructional staff together provide less than half of the total instructionaleffort at Florida's public universities.
! Average class size has declined since the early 1990s. The meanclass meeting-time size was about four percent smaller in 1999-00 thanin 1991-92. Moreover, about 70 percent of all class meetings in 1999-00were less than or equal to the mean class size of 33 students.
! Tenured and tenure earning faculty taught an average of 7 coursesections per FTE during the 1999-00 academic year.7 This equalsroughly 3.5 course sections per term, which is in excess of the 3/3course load typically expected of faculty members at public DCUinstitutions. Of this number, 4.5 courses (2.25 per term) were "formalcourse sections", i.e. organized group instruction sections.
! Tenured and tenure earning faculty spent approximately 9classroom contact hours per week in credit generating instruction.This is equivalent to about 29 clock hours per week, or almost 74percent of FTE effort.
! In 1999-00, faculty at public DCU institutions generated almost$900 million in Contracts and Grants expenditures. This equalsabout $125,000 per FTE tenured and tenure earning faculty member.8
Although these points are encouraging, they tell only half the story. Also
presented in this chapter were data detailing the trend in each of the discussed
7 Excluding the summer terms.8 Tenured and tenure earning faculty members were not necessary responsible for generating allcontract dollars received by the institutions. This average is provided merely to provide someindication of the average research productivity of DCU faculty members.

Analysis of Faculty Productivity
Page 5-45
measures of productivity. Between 1991-92 and 1999-00, the trend was generally
downward on some key measures.
For instance, of the total instructional effort provided by all instructional staff, the
percentage provided by tenured and tenure earning faculty declined about ten percent.
Also, the number of student credit hours per FTE faculty member declined significantly.
In contrast, the number of course sections per FTE marginally increased during the
same period and Contracts and Grants (C&G) awards per FTE rose dramatically during
the years for which data were presented.
Determining whether faculty productivity had declined or improved over the
course of the decade would seem to depend, then, on the measure examined. If one
were to point to the decline in the percentage of total instructional effort provided by
tenured and tenure earning faculty, it would seem as though productivity had declined.
However, this measure does not directly address faculty productivity at the individual
level. As such, the aforementioned decline is more reflective of changes in staffing than
in the productivity of ranked faculty.
As noted in Section 5.2.6, the demand created by expanding enrollments
throughout the decade was accommodated by hiring additional non-tenure track faculty,
presumably to avoid the high salary burden of new tenured and tenure earning faculty
and to provide some flexibility for potential budgetary fluctuations.
Therefore, this decline is unrelated to faculty productivity per se. In fact, the
portion of total instructional effort provided by tenured and tenure earning faculty
declined in approximately the same proportion as did the percentage of total instructional
staff they represented. In other words, in 1991-92, tenured and tenure earning faculty
provided about 68 percent of total instructional effort and also comprised about 65

Analysis of Faculty Productivity
Page 5-46
percent of all instructional staff. In 1999-00, these figures had declined to 58 and 55
percent, respectively.
Turning to those measures that do indeed bear on individual faculty productivity, if
one were to define productivity only in terms of student credit hour production, then once
again, tenured and tenure track faculty members appear to have been less productive in
1999-00 than at the beginning of the decade. However, such a facile conclusion masks
the fact that none of these measures exist in a vacuum.
For instance, although credit hour production declined, course sections per FTE
remained essentially constant, indicating that the decline in the former measure was due
to smaller class sizes rather than less faculty effort devoted toward instruction. Because
class size reduction was a topic of great legislative and public interest in the early part of
the decade, and itself ostensibly represents an improvement in the quality of instruction
at Florida's public institutions, one should not generally conclude that faculty productivity
has declined based solely upon the single measure of student credit hour production.
In truth, when considered together, the data in this chapter suggest that faculty
members were more productive in 1999-00 than in 1991-92. As noted, the average
course load remained the same or increased at most institutions; research productivity
increased sharply (as measured by C&G dollars generated); and classroom contact
hours per FTE remained essentially constant over the nine-year period.9
9 Notably, this figure was higher than the 12 hour minimum prescribed by the 12-Hour Law.

CHAPTER 6.0:
POSITION CONVERSIONS

Position Conversions
Page 6-1
6.0 POSITION CONVERSIONS
This section identifies the fiscal impact of the conversion of funds by Florida's
public universities from their original allocations by appropriation category and program
component to other categories and components. Utilizing the 2001 operating budget
data files for these institutions, we conducted an analysis of the patterns and dispersions
of estimated and actual expenditures. The university operating budget data were
provided to MGT by the Office of Information Resource Management within the Florida
Board of Education, Division of Colleges and Universities (DCU). A synopsis of the
analyses that are included in this chapter follows:
! Overview of Funding System and Position Conversions:Explanation of the process by which funds are allocated to andsubsequently distributed by the universities.
! Expenditures by Program Component: Comparisons of estimatedand actual expenditures demonstrate the total dollar-magnitude ofconversions of funds across program components.
! Expenditures by Appropriation Category: An examination ofestimated and actual expenditures by appropriation category allowsfor the isolation of the specific destinations of converted funds.
! Conclusions: Assessment of the fiscal impact of positionconversions and suggestions for possible alternatives to the currentfunding system.
6.1 Overview of Funding System and Position Conversions
Under Florida's current system of budgeting for its public universities, each
university prepares and submits a budget to the Florida Board of Education, Governor,
and Legislature for review and approval. Educational and General (E & G) funding rates
are guided by a process that generally allocates dollars according to the number of
students but also provides funds for non-enrollment-related activities. Current
procedures do not provide adjustments in funding rates to compensate for cost

Position Conversions
Page 6-2
increases resulting from inflationary pressures for any appropriation category besides
Salaries and Benefits. Thus, universities unavoidably face increasing costs in the other
categories (e.g., Operating Expenses, Other Capital Outlay, etc.) without any explicit
means of additional funding. The loophole-remedy to this problem that has naturally
developed within the funding system is known as "position conversions".
Essentially, the universities receive a lump sum of funds based on the budget
requests submitted to the legislature. Once received, the lump sum funds can be
distributed as necessary by the individual universities across appropriation categories
and program components. Since the Salaries and Wages category is the only
appropriation category that can receive an increase pursuant to salary and benefits
increase policies developed each year by the legislature, it is in the universities' best
interests to budget over-estimations of expenditures for this category. This allows for
cost-of-living increases, and the subsequent distribution of these funds (formerly
classified within the Salaries and Benefits category) across non-salary categories, as
needed. Thus, funds budgeted to positions via the Salary and Benefits category are
converted to other expenditure functions, hence the term "position conversions".
As it is understood that the universities operate under a lump sum funding model,
the issues that arise as a result of position conversions are related to the maximization
of appropriations under the current funding model. As increases in expenses other than
salaries are unavoidable, the position conversion issue can not be addressed without
dealing with the entire scope of the funding process for universities.
6.2 Expenditures by Program Component
The reallocations resulting from position conversions become apparent when
comparing estimated expenditures (as submitted to the legislature the prior year and

Position Conversions
Page 6-3
published in the current year's operating budget) and actual expenditures (as published
in the following year's operating budget as prior year expenditures). In terms of shifts of
funds across program components, over-estimations of universities' Instruction and
Research (I & R) components are common, as faculty salaries are the major expense in
this function. Specifically examining the Salaries and Benefits appropriation category,
we observe in Exhibit 6-1 that large portions of funds are also redistributed within I & R
between salary and non-salary functions at most of the universities. However, since it is
a lump sum funding system, there is no way to track the specific dollars converted from
one program component to another. As dollars are not tied to specific functions, we
simply must observe the budgets prior to and after conversions of funds and make
assumptions based on any differences.
In addition to the realization of the conversion issue, we see in this exhibit that
public DCU E & G funding estimates exceed actual expenditures by less than $50
million. As a proportion of the total budget of nearly $2 billion, this figure amounts to
2.5% of total E & G funds. Universities typically carry any surplus funds forward, as a
reserve, in order to compensate for any funding shortfalls in current or successive years.
It is important to note that estimated expenditures do not necessarily equate to total
revenues realized. For example, the fluctuation of tuition and fees revenues (resulting
from shifts in enrollments), can greatly alter the actual funds available to the universities.
As such, the $50 million figure is not an explicit representation of the total surplus at the
universities, as shortfalls or excesses of other revenues could either bolster or detract
from total available funds.

Position Conversions
Page 6-4
EXHIBIT 6-1FLORIDA DCU* SALARY AND NON-SALARY E & G EXPENDITURES**
ESTIMATED AND ACTUAL DOLLARS BY PROGRAM COMPONENTFY 2000-2001
EXPENDITURES DIFFERENCE
PROGRAM COMPONENT ESTIMATED1 ACTUAL2 NUMERIC PERCENT
SALARY EXPENDITURES010000 Instruction and Research $1,043,905,345 $898,517,883 ($145,387,462) -13.9%020000 Institutes and Research Centers $9,092,961 $8,379,174 ($713,787) -7.8%030000 Radio/TV $3,149,492 $3,173,999 $24,507 0.8%040000 Library/AV $46,417,910 $40,625,476 ($5,792,434) -12.5%050000 Museums and Galleries $9,658,886 $8,161,033 ($1,497,853) -15.5%070000 Administrative Direct. and Support Services $153,031,280 $141,308,602 ($11,722,678) -7.7%080000 Physical Plant Management $81,169,121 $72,165,614 ($9,003,507) -11.1%090000 Student Services $61,491,045 $57,662,457 ($3,828,588) -6.2%
TOTAL, ALL COMPONENTS $1,407,916,040 $1,229,994,239 ($177,921,801) -12.6%NON-SALARY EXPENDITURES
010000 Instruction and Research $269,047,607 $359,163,440 $90,115,833 33.5%020000 Institutes and Research Centers $17,673,932 $11,738,026 ($5,935,906) -33.6%030000 Radio/TV $1,067,836 $2,371,297 $1,303,461 122.1%040000 Library/AV $53,722,735 $59,223,690 $5,500,955 10.2%050000 Museums and Galleries $2,156,974 $4,306,307 $2,149,333 99.6%070000 Administrative Direct and Support Services $50,340,451 $62,462,056 $12,121,604 24.1%080000 Physical Plant Management $96,781,159 $109,705,390 $12,924,231 13.4%090000 Student Services $78,423,105 $89,064,053 $10,640,948 13.6%
TOTAL, ALL COMPONENTS $569,213,799 $698,034,259 $128,820,460 22.6%TOTAL EXPENDITURES
010000 Instruction and Research $1,312,952,952 $1,257,681,323 ($55,271,629) -4.2%020000 Institutes and Research Centers $26,766,893 $20,117,201 ($6,649,692) -24.8%030000 Radio/TV $4,217,328 $5,545,296 $1,327,968 31.5%040000 Library/AV $100,140,645 $99,849,166 ($291,479) -0.3%050000 Museums and Galleries $11,815,860 $12,467,339 $651,479 5.5%070000 Administrative Direct and Support Services $203,371,731 $203,770,658 $398,926 0.2%080000 Physical Plant Management $177,950,280 $181,871,005 $3,920,725 2.2%090000 Student Services $139,914,150 $146,726,510 $6,812,360 4.9%
TOTAL, ALL COMPONENTS $1,977,129,839 $1,928,028,497 ($49,101,342) -2.5%
Source: Florida Board of Education, Division of Colleges and Universities, FY 2000-01 and 2001-02Operating Budget data files.
*Excludes the UF Health Sciences Center, IFAS, and the USF Health Sciences Center, as well as system-wide administrative budgets.
**Salary expenditures defined as those falling under Appropriation Category "010000 Salaries and Benefits".1FY 2000-01 Estimated (Current Year) Expenditures per the 2000-01 Operating Budget2FY 2000-01 Actual (Prior Year) Expenditures per the 2001-02 Operating Budget
Exhibits 6-2 and 6-3 graphically illustrate the discrepancies between estimated
and actual salary and non-salary expenditures across Florida's public universities in FY
2000-01. Exhibit 6-2 examines I & R expenditures, specifically, while Exhibit 6-3
examines the remaining program components within the university operating budgets.

Position Conversions
Page 6-5
Data for individual institutions (equivalent to Exhibits 6-1 through 6-3) are provided at the
end of this report in Appendix 6-A.
EXHIBIT 6-2FLORIDA DCU* SALARY AND NON-SALARY E & G EXPENDITURES**
ESTIMATED AND ACTUAL I & R EXPENDITURESFY 2000-2001
$1,043,905,345
$898,517,883
$269,047,607
$359,163,440
$0
$200,000,000
$400,000,000
$600,000,000
$800,000,000
$1,000,000,000
$1,200,000,000
$1,400,000,000
$1,600,000,000
Estimated Instruction &Research Expenditures
Actual Instruction &Research Expenditures
Non-Salaries & Benefits Expenditures
Salaries & Benefits Expenditures
Source: Florida Board of Education, Division of Colleges and Universities, FY 2000-01 and 2001-02Operating Budget data files.
*Excludes the UF Health Sciences Center, IFAS, and the USF Health Sciences Center, as well as system-wide administrative budgets.
**Salary expenditures defined as those falling under Appropriation Category "010000 Salaries and Benefits".

Position Conversions
Page 6-6
EXHIBIT 6-3FLORIDA DCU* SALARY AND NON-SALARY E & G EXPENDITURES**
ESTIMATED AND ACTUAL EXPENDITURES BY PROGRAM COMPONENTEXCLUDING INSTRUCTION & RESEARCH, FY 2000-2001
SERIES
Institutes and Research Centers Radio / TV Library / AV
Museums and Galleries
Administrative Direct and Support Services
Physical Plant Management
Student Services
Est. Non-Salaries & Benefits Expenditures $17,673,932 $1,067,836 $53,722,735 $2,156,974 $50,340,451 $96,781,159 $78,423,105
Est. Salaries & Benefits Expenditures $9,092,961 $3,149,492 $46,417,910 $9,658,886 $153,031,280 $81,169,121 $61,491,045
Act. Non-Salaries & Benefits Expenditures $11,738,026 $2,371,297 $59,223,690 $4,306,307 $62,462,056 $109,705,390 $89,064,053
Act. Salaries & Benefits Expenditures $8,379,174 $3,173,999 $40,625,476 $8,161,033 $141,308,602 $72,165,614 $57,662,457
$0
$50,000,000
$100,000,000
$150,000,000
$200,000,000
$250,000,000
Estimated Non-Salaries & Benefits Expenditures
Estimated Salaries & Benefits Expenditures
ES
TIM
AT
ED
& A
CT
UA
L E
XP
EN
DIT
UR
ES
Actual Non-Salaries & Benefits Expenditures
Actual Salaries & Benefits Expenditures
Source: Florida Board of Education, Division of Colleges and Universities, FY 2000-01 and 2001-02Operating Budget data files.
*Excludes the UF Health Sciences Center, IFAS, and the USF Health Sciences Center, as well as system-wide administrative budgets.
**Salary expenditures defined as those falling under Appropriation Category "010000 Salaries and Benefits".
WIthin these exhibits, we observe that estimations of Salary and Benefits
expenditures exceed actual expenditures by about $177.9 million, or 12.6 percent,
primarily due to the overestimation within the I & R program component ($145.4 million).

Position Conversions
Page 6-7
In fact, across the DCU, Salary and Benefits expenditures are overestimated in each of
the program components except for Radio/TV.
Alternately, in accord with the position conversion issue previously outlined, we
see that non-Salary and Benefits expenditures fall well short of estimations ($128.8
million, or a 22.6% underestimation). Within these non-salary expenditures, we see that
all program components besides Institutes and Research Centers (IRC) are
underestimated. This is clear evidence that funds originally allocated to Salary and
Benefits expenditures are actually being utilized to cover other costs by the universities.
As a majority of salaries and benefits expenditures occur within the I & R component
(where faculty salaries are reported), the resulting effect is that the I & R component is
typically overestimated by universities, and the excess funds are used to cover shortfalls
in other program components and appropriation categories. It is interesting to note that
a large portion of the excess I & R salary funds appear to be converted within I & R , to
non-salary funds. This is primarily due to conversions of funds towards the Other
Personal Services (OPS) expenditure category, an issue that is discussed in further
detail in Section 6.3.
Exhibits 6-4 through 6-6 display the differences between estimated/actual and
salary/non-salary expenditures, by program component, at the individual public
universities within the DCU. In these exhibits, we see a general trend of overestimation
of salaries and benefits expenditures at the institutions (particularly within I & R) and a
corresponding underestimation of non-Salary and Benefits expenditures. We see that,
in addition to the conversion to non-salary funds within I & R, significant portions of the
converted funds appear to cover costs within the Library/AV, Administrative Direction
and Support Services (ADSS), Physical Plant Management, and Student Services
program components.

Position Conversions
6-8
EXHIBIT 6-4ESTIMATED AND ACTUAL SALARY AND BENEFITS E & G EXPENDITURES**
BY INSTITUTION AND PROGRAM COMPONENTFL DCU UNIVERSITIES*, FY 2000-2001
PROGRAM DATA EXPENDITURES BY INSTITUTION (IN THOUSANDS) DCUCOMPONENT TYPE UF* FSU FAMU UCF USF* FAU UWF FIU UNF FGCU TOTAL*
Instruction and Estimated $247,075 $183,876 $67,248 $112,998 $139,631 $78,029 $31,833 $126,965 $38,937 $17,313 $1,043,905Research Actual $207,391 $145,282 $61,195 $103,932 $125,744 $75,033 $29,690 $97,631 $35,573 $17,047 $898,518
Difference $39,684 $38,594 $6,054 $9,066 $13,887 $2,996 $2,143 $29,334 $3,363 $266 $145,387Institutes and Estimated $3,077 $0 $129 $2,541 $932 $384 $504 $1,008 $389 $128 $9,093Research Centers Actual $2,292 $0 $250 $2,571 $894 $358 $504 $967 $415 $128 $8,379
Difference $785 $0 ($121) ($29) $38 $26 ($0) $41 ($26) ($0) $714Radio / TV Estimated $1,006 $835 $0 $0 $886 $0 $259 $0 $0 $164 $3,149
Actual $1,034 $841 $0 $0 $887 $0 $270 $0 $0 $143 $3,174Difference ($27) ($6) $0 $0 ($0) $0 ($11) $0 $0 $20 ($25)
Library / AV Estimated $11,012 $6,024 $2,735 $4,549 $6,103 $4,993 $1,840 $5,858 $2,077 $1,226 $46,418Actual $10,067 $4,639 $2,541 $4,323 $5,086 $4,523 $1,697 $4,651 $2,086 $1,013 $40,625Difference $946 $1,385 $194 $227 $1,018 $470 $143 $1,207 ($9) $213 $5,792
Museums and Estimated $5,042 $2,987 $87 $0 $0 $0 $0 $1,543 $0 $0 $9,659Galleries Actual $4,520 $2,770 $85 $0 $0 $0 $0 $786 $0 $0 $8,161
Difference $522 $217 $2 $0 $0 $0 $0 $757 $0 $0 $1,498Administrative Direction Estimated $22,920 $23,525 $10,971 $15,928 $24,018 $13,558 $9,259 $18,571 $10,033 $4,249 $153,031and Support Services Actual $22,556 $23,287 $9,840 $14,441 $21,345 $12,562 $6,084 $17,579 $9,138 $4,477 $141,309
Difference $364 $237 $1,131 $1,488 $2,673 $996 $3,175 $992 $895 ($228) $11,723Physical Plant Estimated $16,803 $12,233 $7,429 $7,307 $14,635 $3,928 $4,913 $8,913 $4,004 $1,005 $81,169Management Actual $14,514 $12,724 $6,503 $6,399 $13,086 $3,430 $3,943 $6,959 $3,597 $1,011 $72,166
Difference $2,289 ($491) $926 $908 $1,549 $498 $970 $1,954 $407 ($6) $9,004Student Services Estimated $9,990 $9,394 $3,831 $6,135 $8,628 $7,144 $3,513 $7,509 $3,333 $2,015 $61,491
Actual $9,465 $9,608 $3,711 $6,315 $7,508 $6,376 $3,222 $6,562 $2,992 $1,903 $57,662Difference $526 ($214) $120 ($180) $1,120 $768 $290 $947 $340 $112 $3,829
Total, Estimated $316,927 $238,873 $92,430 $149,459 $194,833 $108,037 $52,120 $170,366 $58,771 $26,100 $1,407,916All Components Actual $271,838 $199,151 $84,125 $137,980 $174,549 $102,283 $45,410 $135,134 $53,802 $25,723 $1,229,994
Difference $45,089 $39,722 $8,305 $11,479 $20,284 $5,754 $6,710 $35,232 $4,969 $377 $177,922
Sal
arie
s &
Ben
efit
s**
Source: Florida Board of Education, Division of Colleges and Universities, FY 2000-01 and 2001-02 Operating Budget data files.
*The UF Health Sciences Center, IFAS, the USF Health Sciences Center, and system-wide administrative budgets are excluded from these calculations.
**Salary expenditures defined as those falling under Appropriation Category "010000 Salaries and Benefits".

Position Conversions
6-9
EXHIBIT 6-5ESTIMATED AND ACTUAL NON-SALARY AND BENEFITS E & G EXPENDITURES**
BY INSTITUTION AND PROGRAM COMPONENTFL DCU UNIVERSITIES*, FY 2000-2001
PROGRAM DATA EXPENDITURES BY INSTITUTION (IN THOUSANDS) DCUCOMPONENT TYPE UF* FSU FAMU UCF USF* FAU UWF FIU UNF FGCU TOTAL*
Instruction and Estimated $56,174 $58,857 $12,301 $43,606 $44,736 $19,604 $3,112 $17,342 $10,008 $3,307 $269,048Research Actual $71,286 $76,993 $15,405 $58,331 $58,284 $21,925 $6,569 $35,637 $11,197 $3,536 $359,163
Difference ($15,112) ($18,135) ($3,104) ($14,725) ($13,548) ($2,321) ($3,457) ($18,295) ($1,189) ($229) ($90,116)Institutes and Estimated $13,341 $1,507 $1 $899 $1,192 $168 $52 $231 $131 $153 $17,674Research Centers Actual $7,722 $1,536 $48 $680 $920 $230 $56 $284 $200 $63 $11,738
Difference $5,619 ($29) ($47) $219 $271 ($62) ($3) ($53) ($69) $90 $5,936Radio / TV Estimated $150 $768 $0 $0 $82 $0 $68 $0 $0 $0 $1,068
Actual $861 $1,354 $0 $0 $72 $0 $85 $0 $0 $0 $2,371Difference ($711) ($586) $0 $0 $10 $0 ($17) $0 $0 $0 ($1,303)
Library / AV Estimated $11,592 $8,832 $2,526 $7,053 $6,293 $6,184 $1,611 $5,914 $2,136 $1,581 $53,723Actual $12,930 $10,666 $3,699 $6,608 $6,140 $5,935 $1,751 $7,745 $2,196 $1,553 $59,224Difference ($1,338) ($1,833) ($1,173) $445 $153 $249 ($140) ($1,831) ($60) $27 ($5,501)
Museums and Estimated $1,203 $571 $16 $0 $0 $0 $0 $366 $0 $0 $2,157Galleries Actual $2,608 $596 $75 $0 $0 $0 $0 $1,027 $0 $0 $4,306
Difference ($1,405) ($25) ($59) $0 $0 $0 $0 ($660) $0 $0 ($2,149)Administrative Direction Estimated $4,613 $10,689 $3,672 $7,205 $4,825 $4,397 $3,239 $6,315 $3,704 $1,683 $50,340and Support Services Actual $5,661 $9,489 $4,888 $9,587 $4,761 $5,662 $3,796 $13,282 $4,094 $1,241 $62,462
Difference ($1,048) $1,199 ($1,216) ($2,382) $63 ($1,266) ($557) ($6,967) ($390) $442 ($12,122)Physical Plant Estimated $19,736 $17,783 $6,946 $6,518 $17,941 $8,239 $3,490 $10,519 $3,372 $2,237 $96,781Management Actual $21,683 $24,360 $8,359 $6,639 $17,566 $8,421 $3,746 $12,688 $4,041 $2,202 $109,705
Difference ($1,947) ($6,576) ($1,413) ($121) $375 ($182) ($257) ($2,169) ($670) $36 ($12,924)Student Services Estimated $12,522 $13,875 $8,965 $7,642 $14,638 $6,797 $1,309 $8,915 $2,423 $1,337 $78,423
Actual $12,846 $19,662 $9,927 $7,276 $15,489 $7,485 $1,516 $10,208 $3,048 $1,606 $89,064Difference ($325) ($5,787) ($962) $366 ($851) ($688) ($207) ($1,293) ($624) ($269) ($10,641)
Total, Estimated $119,331 $112,883 $34,427 $72,922 $89,706 $45,388 $12,882 $49,601 $21,775 $10,298 $569,214All Components Actual $135,598 $144,656 $42,401 $89,120 $103,233 $49,658 $17,520 $80,870 $24,776 $10,201 $698,034
Difference ($16,267) ($31,773) ($7,974) ($16,198) ($13,527) ($4,270) ($4,639) ($31,269) ($3,001) $96 ($128,820)
No
n-S
alar
ies
& B
enef
its*
*
Source: Florida Board of Education, Division of Colleges and Universities, FY 2000-01 and 2001-02 Operating Budget data files.
*The UF Health Sciences Center, IFAS, the USF Health Sciences Center, and system-wide administrative budgets are excluded from these calculations.
**Salary expenditures defined as those falling under Appropriation Category "010000 Salaries and Benefits".

Position Conversions
6-10
EXHIBIT 6-6ESTIMATED AND ACTUAL TOTAL E & G EXPENDITURES
BY INSTITUTION AND PROGRAM COMPONENTFL DCU UNIVERSITIES*, FY 2000-2001
PROGRAM DATA EXPENDITURES BY INSTITUTION (IN THOUSANDS) DCUCOMPONENT TYPE UF* FSU FAMU UCF USF* FAU UWF FIU UNF FGCU TOTAL*
Instruction and Estimated $303,249 $242,734 $79,549 $156,604 $184,367 $97,633 $34,945 $144,307 $48,945 $20,620 $1,312,953Research Actual $278,678 $222,274 $76,600 $162,263 $184,028 $96,959 $36,259 $133,267 $46,771 $20,583 $1,257,681
Difference $24,572 $20,459 $2,949 ($5,659) $339 $674 ($1,314) $11,039 $2,175 $37 $55,272Institutes and Estimated $16,418 $1,507 $130 $3,440 $2,124 $552 $556 $1,239 $519 $281 $26,767Research Centers Actual $10,014 $1,536 $298 $3,250 $1,815 $588 $560 $1,251 $615 $191 $20,117
Difference $6,404 ($29) ($168) $190 $309 ($36) ($4) ($12) ($95) $90 $6,650Radio / TV Estimated $1,156 $1,602 $0 $0 $968 $0 $327 $0 $0 $164 $4,217
Actual $1,894 $2,194 $0 $0 $958 $0 $355 $0 $0 $143 $5,545Difference ($738) ($592) $0 $0 $10 $0 ($28) $0 $0 $20 ($1,328)
Library / AV Estimated $22,604 $14,857 $5,261 $11,602 $12,396 $11,177 $3,451 $11,771 $4,213 $2,807 $100,141Actual $22,997 $15,305 $6,240 $10,931 $11,226 $10,458 $3,449 $12,396 $4,282 $2,567 $99,849Difference ($392) ($449) ($979) $672 $1,170 $719 $3 ($624) ($69) $240 $291
Museums and Estimated $6,246 $3,558 $103 $0 $0 $0 $0 $1,909 $0 $0 $11,816Galleries Actual $7,128 $3,366 $161 $0 $0 $0 $0 $1,812 $0 $0 $12,467
Difference ($882) $192 ($58) $0 $0 $0 $0 $97 $0 $0 ($651)Administrative Direction Estimated $27,533 $34,213 $14,643 $23,133 $28,842 $17,955 $12,498 $24,886 $13,737 $5,932 $203,372and Support Services Actual $28,217 $32,776 $14,728 $24,027 $26,106 $18,224 $9,880 $30,861 $13,232 $5,719 $203,771
Difference ($684) $1,437 ($85) ($894) $2,736 ($269) $2,618 ($5,976) $505 $214 ($399)Physical Plant Estimated $36,539 $30,016 $14,375 $13,825 $32,576 $12,167 $8,402 $19,432 $7,375 $3,242 $177,950Management Actual $36,196 $37,084 $14,862 $13,038 $30,652 $11,852 $7,689 $19,647 $7,638 $3,212 $181,871
Difference $343 ($7,068) ($487) $787 $1,924 $316 $713 ($215) ($263) $30 ($3,921)Student Services Estimated $22,512 $23,269 $12,797 $13,777 $23,266 $13,941 $4,822 $16,424 $5,756 $3,352 $139,914
Actual $22,311 $29,270 $13,638 $13,592 $22,997 $13,861 $4,739 $16,770 $6,040 $3,509 $146,727Difference $201 ($6,001) ($842) $185 $269 $80 $83 ($346) ($284) ($157) ($6,812)
Total, Estimated $436,258 $351,756 $126,857 $222,381 $284,539 $153,425 $65,002 $219,968 $80,546 $36,398 $1,977,130All Components Actual $407,435 $343,807 $126,527 $227,100 $277,782 $151,941 $62,930 $216,004 $78,578 $35,924 $1,928,028
Difference $28,823 $7,950 $331 ($4,719) $6,757 $1,484 $2,071 $3,963 $1,968 $473 $49,101
To
tal F
un
ds
Source: Florida Board of Education, Division of Colleges and Universities, FY 2000-01 and 2001-02 Operating Budget data files.
*The UF Health Sciences Center, IFAS, the USF Health Sciences Center, and system-wide administrative budgets are excluded from these calculations.

Position Conversions
6-11
It is apparent from these analyses that no significant patterns exist between the
universities when we examine total estimated and actual expenditures by program
component (Exhibit 6-6). The more significant discrepancies between estimated and
actual expenditures become apparent when we make the delineation between Salary
and Benefits and non-Salary and Benefits expenditures, according to appropriation
category (Exhibits 6-4 and 6-5). Specifically, we observe that:
! Eight of ten institutions overestimated total I & R expenditures, butno more than six institutions over- or underestimated any otherparticular program component, with respect to total expenditures.
! At least eight of ten institutions overestimated Salary and Benefitsexpenditures within I & R, Library/AV, ADSS, Physical PlantManagement, and Student Services.
! Seven or more institutions underestimated non-Salary and Benefitsexpenditures within I & R, ADSS, Physical Plant Management, andStudent Services.
! Each of the ten institutions overestimated total Salary and Benefitsexpenditures, while nine of ten institutions underestimated non-Salary and Benefits expenditures.
Regarding expenditures by program component, these trends illustrate that the
largest share of fund conversions occur within the I & R component, where faculty
salaries (the largest salary component at universities) are reported. Otherwise,
conversions are observed across many of the other program components, varying
somewhat by institution. The conversions are made evident through analysis by
appropriation category, dividing between Salary and Benefits and non-Salary and
Benefits expenditures. Analyses by appropriation category are explored further in the
section that follows.

Position Conversions
6-12
6.3 Expenditures by Appropriation Category
The operating budgets are set up according to a matrix of many variables,
including program component and expenditure category. In the previous section we
examined expenditures across each of the program components, but simply controlled
for the expenditure category variable according to Salary and Benefits and non-Salary
and Benefits expenditures. In this section, we analyze the non-salary expenditure
categories in further detail to reveal the specific estimated and actual destinations of
these funds. Exhibit 6-7 displays total E & G expenditures by program component and
expenditure category for all public universities in the DCU system.
In the majority of program components, we observe that Salaries and Benefits
represent the largest destination of funds across the expenditure categories. Among
other categories, Expenses and OPS represent the 2nd and 3rd largest components of
actual total E & G expenditures, respectively. As previously observed, we see that
Salary and Benefits expenditures are overestimated, while these other major categories
are substantially underestimated.

Position Conversions
6-13
EXHIBIT 6-7FLORIDA DCU** EXPENDITURES BY APPROPRIATION CATEGORY AND PROGRAM COMPONENT
FY 2000-2001
APPROPRIATION 010000 020000 030000 040000 050000 070000 080000 090000CATEGORY I & R IRC Radio/TV Library/AV Msms & Gall ADSS Plant Mgt Stu Svc TOTAL
Expenses $123,779,328 $10,844,838 $235,567 $4,671,386 $1,561,848 $31,414,897 $90,652,170 $18,888,891 $282,048,925Fee Waivers $8,829,110 $0 $0 $0 $0 $0 $0 $472,550 $9,301,660Library Resources $841,277 $1,063,528 $0 $44,234,931 $0 $0 $0 $0 $46,139,736Operating Capital Outlay $20,369,520 $1,648,613 $729,530 $2,073,101 $81,000 $1,862,812 $976,299 $538,306 $28,279,181Other Personal Services $102,043,987 $610,056 $102,739 $2,692,312 $514,126 $6,061,255 $2,804,764 $6,595,284 $121,424,523Plant Maintenance $0 $0 $0 $0 $0 $0 $2,273,581 $0 $2,273,581Regional Data Centers-DCU $5,206,440 $2,000,000 $0 $51,005 $0 $3,312,372 $1,000 $1,744,415 $12,315,232Risk Management Insurance $603,221 $0 $0 $0 $0 $7,230,168 $73,345 $89,455 $7,996,189Salaries And Benefits $1,043,905,345 $9,092,961 $3,149,492 $46,417,910 $9,658,886 $153,031,280 $81,169,121 $61,491,045 $1,407,916,040Scholarships $85,000 $0 $0 $0 $0 $0 $0 $8,062,806 $8,147,806Student Financial Aid $0 $0 $0 $0 $0 $0 $0 $40,813,305 $40,813,305Other** $7,289,725 $1,506,897 $0 $0 $0 $458,947 $0 $1,218,093 $10,473,662Total, All Categories $1,312,952,952 $26,766,893 $4,217,328 $100,140,645 $11,815,860 $203,371,731 $177,950,280 $139,914,150 $1,977,129,839
Expenses $131,998,442 $4,279,238 $381,338 $5,646,743 $2,310,756 $35,573,547 $99,643,971 $20,906,870 $300,740,905Fee Waivers $10,878,594 $0 $0 $0 $0 $0 $0 $472,550 $11,351,144Library Resources $0 $938,897 $0 $47,918,078 $0 $376 $0 $0 $48,857,351Operating Capital Outlay $53,246,750 $1,735,210 $1,910,366 $1,898,134 $166,219 $5,743,602 $2,659,951 $1,025,683 $68,385,914Other Personal Services $148,661,666 $694,073 $79,593 $3,760,744 $1,829,332 $7,958,446 $4,572,644 $8,300,906 $175,857,404Plant Maintenance $73 $0 $0 $0 $0 $0 $2,769,362 $0 $2,769,435Regional Data Centers-DCU $4,488,106 $2,540,000 $0 $0 $0 $3,959,202 $278 $1,868,790 $12,856,376Risk Management Insurance $469,043 $0 $0 $0 $0 $8,728,232 $59,184 $69,514 $9,325,973Salaries And Benefits $898,517,883 $8,379,174 $3,173,999 $40,625,476 $8,161,033 $141,308,602 $72,165,614 $57,662,457 $1,229,994,239Scholarships $160,167 $0 $0 $0 $0 $80,000 $0 $8,375,138 $8,615,305Student Financial Aid $1,674,280 $0 $0 $0 $0 $5,000 $0 $46,690,670 $48,369,950Other** $7,586,320 $1,550,609 $0 ($8) $0 $413,650 $0 $1,353,931 $10,904,502Total, All Categories $1,257,681,323 $20,117,201 $5,545,296 $99,849,166 $12,467,339 $203,770,658 $181,871,005 $146,726,510 $1,928,028,497
Expenses ($8,219,115) $6,565,600 ($145,771) ($975,357) ($748,908) ($4,158,649) ($8,991,801) ($2,017,980) ($18,691,980)Fee Waivers ($2,049,484) $0 $0 $0 $0 $0 $0 $0 ($2,049,484)Library Resources $841,277 $124,631 $0 ($3,683,147) $0 ($376) $0 $0 ($2,717,615)Operating Capital Outlay ($32,877,230) ($86,597) ($1,180,836) $174,967 ($85,219) ($3,880,790) ($1,683,652) ($487,377) ($40,106,733)Other Personal Services ($46,617,679) ($84,017) $23,146 ($1,068,432) ($1,315,206) ($1,897,191) ($1,767,880) ($1,705,622) ($54,432,881)Plant Maintenance ($73) $0 $0 $0 $0 $0 ($495,781) $0 ($495,854)Regional Data Centers-DCU $718,334 ($540,000) $0 $51,005 $0 ($646,830) $722 ($124,375) ($541,144)Risk Management Insurance $134,178 $0 $0 $0 $0 ($1,498,064) $14,161 $19,941 ($1,329,784)Salaries And Benefits $145,387,462 $713,787 ($24,507) $5,792,434 $1,497,853 $11,722,678 $9,003,507 $3,828,588 $177,921,801Scholarships ($75,167) $0 $0 $0 $0 ($80,000) $0 ($312,332) ($467,499)Student Financial Aid ($1,674,280) $0 $0 $0 $0 ($5,000) $0 ($5,877,365) ($7,556,645)Other** ($296,595) ($43,712) $0 $8 $0 $45,297 $0 ($135,838) ($430,840)Total, All Categories $55,271,629 $6,649,692 ($1,327,968) $291,479 ($651,479) ($398,926) ($3,920,725) ($6,812,360) $49,101,342
ES
TIM
AT
ED
AC
TU
AL
DIF
FE
RE
NC
E
Source: Florida Board of Education, Division of Colleges and Universities, FY 2000-01 and 2001-02 Operating Budget data files.
*The UF Health Sciences Center, IFAS, the USF Health Sciences Center, and system-wide administrative budgets are excluded from these calculations.
**This category includes a total of 25 expenditure categories primarily comprised of special centers, institutes, and grant programs.

Position Conversions
6-14
Within the DCU totals depicted in Exhibit 6-7, we see the following discrepancies
between estimated and actual non-Salary & Benefits expenditures:
! Expenses are underestimated by $18.6 million (6.6%);
! Other Capital Outlay (OCO) expenditures are underestimated by$40.1 million (141.8%), the largest proportionate underestimateamong major expenditure categories;
! OPS expenditures were underestimated by $54.4 million (44.8%);and,
! Student Financial Aid expenditures were underestimated by $7.6million (18.5%).
The majority of the funding reallocations occur within the I & R component (which
represents about two-thirds of the total E & G budget), particularly in the Salaries and
Benefits category, as we have noted. Besides the differences observed within the
Salaries and Benefits category, estimations of several other expenditure categories were
different by at least $2 million across the public DCU universities, including:
! Expenses were underestimated within I & R by $8.2 million (6.6%),ADSS by $4.2 million (13.2%), Plant Management by $9.0 million(9.9%), and Student Services by $2.0 million (10.7%);
! Expenses were overestimated within the IRC component ($6.6million, 60.5%);
! Fee Waivers were underestimated within I & R ($2.0 million, 23.2%);
! OCO expenditures were underestimated within I & R ($32.9 million,161.4%) and ADSS ($3.9 million, 208.3%);
! OPS expenditures were underestimated within I & R ($46.6 million,45.7%); and,
! Student Financial Aid was underestimated within the StudentServices component ($5.9 million, 14.4%).
Exhibit 6-8 displays E & G expenditures by appropriation category at the individual
DCU universities. Each of the institutions overestimated Salaries and Benefits, by an
average magnitude of 12.6 percent, as observed previously.

Position Conversions
6-15
EXHIBIT 6-8FLORIDA DCU* EXPENDITURES BY APPROPRIATION CATEGORY
ALL PROGRAM COMPONENTS, FY 2000-2001
EXPENDITURES BY INSTITUTION AND APPROPRIATION CATEGORY
APPROPRIATION UF* FSU FAMU UCF USF* FAU UWF FIU UNF FGCU FL DCU*CATEGORY TOTAL TOTAL TOTAL TOTAL TOTAL TOTAL TOTAL TOTAL TOTAL TOTAL TOTAL
Expenses $55,011,581 $62,439,077 $15,153,281 $36,002,807 $43,126,024 $22,029,728 $8,370,682 $23,145,525 $11,270,851 $5,499,369 $282,048,925Fee Waivers $1,415,510 $7,612,339 $0 $0 $0 $0 $0 $0 $273,811 $0 $9,301,660Library Resources $11,137,659 $7,115,507 $2,996,273 $5,174,674 $5,627,109 $4,124,202 $1,527,555 $5,284,890 $1,901,327 $1,250,540 $46,139,736Operating Capital Outlay $5,272,111 $2,815,686 $2,089,719 $9,156,932 $1,900,136 $1,701,272 $54,387 $3,704,572 $1,375,275 $209,091 $28,279,181Other Personal Services $30,369,701 $19,194,083 $6,834,953 $16,450,638 $20,979,654 $11,251,202 $2,062,930 $7,182,429 $4,415,438 $2,683,495 $121,424,523Plant Maintenance $0 $0 $0 $185,491 $400,125 $0 $0 $1,347,965 $340,000 $0 $2,273,581Regional Data Centers-DCU $5,769,269 $1,113,673 $307,030 $165,810 $2,457,258 $598,625 $0 $1,550,488 $325,579 $27,500 $12,315,232Risk Management Insurance $893,129 $1,179,987 $962,350 $861,763 $1,132,754 $1,037,792 $296,458 $1,198,133 $359,287 $74,536 $7,996,189Salaries And Benefits $316,927,004 $238,873,064 $92,430,351 $149,458,708 $194,833,139 $108,037,019 $52,120,044 $170,366,200 $58,770,802 $26,099,709 $1,407,916,040Scholarships $2,635,751 $0 $0 $0 $5,317,055 $37,500 $47,500 $0 $110,000 $0 $8,147,806Student Financial Aid $5,270,621 $9,165,072 $5,622,248 $4,874,765 $2,699,769 $4,593,335 $499,989 $6,161,544 $1,378,333 $547,629 $40,813,305Other** $1,555,836 $2,247,617 $461,247 $49,382 $6,066,165 $14,646 $22,194 $25,913 $25,000 $5,662 $10,473,662Total, All Categories $436,258,172 $351,756,105 $126,857,452 $222,380,970 $284,539,188 $153,425,321 $65,001,738 $219,967,659 $80,545,703 $36,397,531 $1,977,129,839
Expenses $56,287,419 $60,401,305 $18,513,001 $40,022,494 $44,557,686 $22,495,887 $9,044,141 $33,516,316 $10,537,667 $5,364,989 $300,740,905Fee Waivers $1,415,459 $8,590,721 $0 $0 $0 $0 $0 $1,071,153 $273,811 $0 $11,351,144Library Resources $11,111,511 $9,392,807 $3,246,280 $5,174,668 $5,627,109 $4,003,271 $1,436,284 $5,734,793 $1,832,612 $1,298,016 $48,857,351Operating Capital Outlay $13,346,837 $15,161,857 $3,492,876 $15,432,690 $10,074,156 $1,735,851 $1,698,783 $4,708,486 $2,221,528 $512,850 $68,385,914Other Personal Services $36,747,998 $31,543,646 $9,146,473 $20,487,511 $24,498,509 $14,659,882 $4,427,481 $25,420,970 $6,591,765 $2,333,168 $175,857,404Plant Maintenance $0 $0 $0 $185,125 $237,919 $0 $0 $1,347,695 $998,696 $0 $2,769,435Regional Data Centers-DCU $6,086,800 $1,295,770 $275,000 $104,063 $2,453,703 $954,232 $0 $1,350,848 $324,105 $11,856 $12,856,376Risk Management Insurance $1,040,097 $1,374,161 $1,120,709 $1,003,570 $1,318,939 $1,206,186 $345,241 $1,395,291 $418,409 $103,370 $9,325,973Salaries And Benefits $271,837,567 $199,150,848 $84,125,421 $137,980,160 $174,548,848 $102,282,984 $45,409,895 $135,134,037 $53,801,711 $25,722,768 $1,229,994,239Scholarships $2,710,751 $90,000 $40,000 $35,000 $5,382,055 $40,167 $45,000 $85,000 $167,332 $20,000 $8,615,305Student Financial Aid $5,270,621 $14,515,072 $6,090,927 $6,629,848 $2,699,769 $4,536,885 $499,989 $6,200,877 $1,378,333 $547,629 $48,369,950Other** $1,580,214 $2,290,381 $475,882 $45,159 $6,383,023 $26,078 $23,545 $38,766 $32,000 $9,455 $10,904,502Total, All Categories $407,435,273 $343,806,567 $126,526,568 $227,100,287 $277,781,716 $151,941,422 $62,930,360 $216,004,232 $78,577,970 $35,924,102 $1,928,028,497
Expenses ($1,275,838) $2,037,772 ($3,359,720) ($4,019,687) ($1,431,662) ($466,159) ($673,460) ($10,370,791) $733,184 $134,380 ($18,691,980)Fee Waivers $51 ($978,382) $0 $0 $0 $0 $0 ($1,071,153) $0 $0 ($2,049,484)Library Resources $26,148 ($2,277,300) ($250,007) $6 $0 $120,931 $91,271 ($449,903) $68,715 ($47,476) ($2,717,615)Operating Capital Outlay ($8,074,726) ($12,346,171) ($1,403,157) ($6,275,758) ($8,174,020) ($34,579) ($1,644,397) ($1,003,914) ($846,253) ($303,759) ($40,106,733)Other Personal Services ($6,378,297) ($12,349,563) ($2,311,520) ($4,036,873) ($3,518,855) ($3,408,680) ($2,364,551) ($18,238,541) ($2,176,327) $350,327 ($54,432,881)Plant Maintenance $0 $0 $0 $366 $162,206 $0 $0 $270 ($658,696) $0 ($495,854)Regional Data Centers-DCU ($317,531) ($182,097) $32,030 $61,747 $3,555 ($355,607) $0 $199,640 $1,474 $15,644 ($541,144)Risk Management Insurance ($146,968) ($194,174) ($158,359) ($141,807) ($186,185) ($168,394) ($48,783) ($197,158) ($59,122) ($28,834) ($1,329,784)Salaries And Benefits $45,089,437 $39,722,216 $8,304,930 $11,478,548 $20,284,291 $5,754,035 $6,710,149 $35,232,163 $4,969,091 $376,941 $177,921,801Scholarships ($75,000) ($90,000) ($40,000) ($35,000) ($65,000) ($2,667) $2,500 ($85,000) ($57,332) ($20,000) ($467,499)Student Financial Aid $0 ($5,350,000) ($468,679) ($1,755,083) $0 $56,450 $0 ($39,333) $0 $0 ($7,556,645)Other** ($24,378) ($42,764) ($14,635) $4,223 ($316,858) ($11,432) ($1,351) ($12,853) ($7,000) ($3,793) ($430,840)Total, All Categories $28,822,899 $7,949,538 $330,884 ($4,719,317) $6,757,472 $1,483,899 $2,071,378 $3,963,427 $1,967,733 $473,429 $49,101,342
ES
TIM
AT
ED
AC
TU
AL
DIF
FE
RE
NC
E
Source: Florida Board of Education, Division of Colleges and Universities, FY 2000-01 and 2001-02 Operating Budget data files.
*The UF Health Sciences Center, IFAS, the USF Health Sciences Center, and system-wide administrative budgets are excluded from these calculations.
**This category includes a total of 25 expenditure categories primarily comprised of special centers, institutes, and grant programs.

Position Conversions
6-16
Several general patterns occur among the institutions, across these appropriation
categories. In addition to the consistent overestimation of Salaries and Benefits, we also
see that:
! seven of the ten institutions underestimated Expenses;
! all of the institutions underestimated OCO expenditures;
! nine of ten institutions underestimated OPS expenditures;
! all of the institutions underestimated Risk Management Insurance;and,
! nine of ten institutions underestimated Scholarships expenditures,though by a relatively small amount (an average of $467,000);
The Expenses, OCO, and OPS appropriation categories appear to be the primary
destinations of the overestimated Salary and Benefits funds. Descriptions of these
appropriation categories, as provided within the 2001 Florida Statutes, and possible
explanations for increasing costs within them, appear below.
Expenses: The Florida Statutes defines the Expenses appropriation category as
those expenditures that are:
used to fund the usual, ordinary, and incidental expenditures by anagency... including such items as contractual services, commodities, andsupplies of a consumable nature, current obligations, and fixed charges,and excluding expenditures classified as operating capital outlay.Payments to other funds or local, state, or federal agencies may beincluded in this category.
As such a broad category, it is not surprising that certain costs among these
expenditures have increased significantly, necessitating the need for extended funding
within this category. For instance, during the "energy crisis" experienced in 2000-01, the
cost of utilities increased significantly. Furthermore, as this particular event spurred
more broad-based inflationary pressures throughout the economy, it is likely that costs
within many other aspects of this category experienced significant increases, as well. As
the public university funding process has no automated mechanism for adjusting the

Position Conversions
6-17
funding rates within this category accordingly, universities are able to use funds
converted from the salaries and benefits category to cover these burdens. If excess
funds had not been included within the salary and benefits category (that received a
compensatory annual increase), no funding increases would have been received, and
the universities could have faced significant budget shortfalls.
Operating Capital Outlay (OCO): Items included within this appropriation
category are limited to those:
used to fund equipment, fixtures, and other tangible personal property ofa non-consumable and non-expendable nature... the value or cost ofwhich is $1,000 or more and the normal expected life of which is 1 year ormore, and hardback-covered bound books that are circulated to studentsor the general public, the value or cost of which is $25 or more, andhardback-covered bound books, the value or cost of which is $250 ormore.
Similar to the expenses category, commodities included within OCO could be
subject to cost changes on a broad-based level. As capital and commodity markets are
subject to national as well as international market forces, costs within this category
(especially library subscriptions) could change significantly on an annual basis. With no
internal means of adjustment within this category, universities rely on funding increases
provided within the Salaries and Benefits category to compensate for any shortfalls.
Other Personal Services (OPS): This category encompasses all expenditures
that are:
used to fund the compensation for services rendered by a person who isnot filling an established position. This definition includes, but is notlimited to, services of temporary employees, student or graduateassistants, persons on fellowships, part-time academic employees, boardmembers, and consultants and other services specifically budgeted byeach agency, or by the judicial branch, in this category. In distinguishingbetween payments to be made from salaries and benefits appropriationsand other-personal-services appropriations:
1. Those persons filling established positions shall be paid from salariesand benefits appropriations and those persons performing services for a

Position Conversions
6-18
state agency or for the judicial branch, but who are not filling establishedpositions, shall be paid from other-personal-services appropriations.
2. Those persons paid from salaries and benefits appropriations shall bestate officers or employees and shall be eligible for membership in a stateretirement system and those paid from other-personal-servicesappropriations shall not be eligible for such membership.
Thus, though OPS expenditures are subject to labor market pressures that are
quite similar to those of Salaries and Benefits expenditures, no mechanism exists that
compensates for tighter labor markets. As universities must compete with other
institutions and organizations within their vicinity for scarce labor resources, they must
compensate employees at competitive rates. The legislative increases to Salaries and
Benefits funds provide necessary adjustments for regular positions, but no such
provision exists for OPS positions. Of significance also is the need to address
unforeseen circumstances that are likely to occur during the year. For example, faculty
may receive research grants that essentially "buy out" their state funded time. In such
cases, the university would transfer the salary dollars to the OPS category to be able to
temporarily hire a qualified individual to pick up the teaching obligation. Normal attrition
(e.g., deaths, retirements, resignations) over the course of the year would also
necessitate this action. The universities therefore must also rely on legislatively
mandated Salaries and Benefits increases to keep pace with economic markets in this
respect, and convert funds between these categories as necessary.
6.4 Conclusions
The existence of overestimations within the Salaries and Benefits appropriation
category and underestimations within other appropriation categories is the systemic
result of a funding system that does not account for changes in price levels or standard
practices that occur within many facets of higher education beyond Salaries and
Position Conversions
6-19
Benefits. The system of lump sum funding that currently exists allows the universities
discretion as to the allocation of funds across program components.
The issue that arises from this practice is an inconsistency between the estimated
expenditures submitted to and approved by the legislature and the actual allocations of
expenditures by the universities. Thus, the approved operating budget is never entirely
representative of the intended or actual budget. Within the instruction and research
program component, salary dollars are overestimated while non-salary dollars are
underestimated, resulting in an overall overestimation of budgeted funds within this
component.
These excess funds are distributed across several other program components in
which salary dollars are not as prominent; as with the I & R component, the same
overestimation and underestimation in salary and non-salary dollars, respectively, is
evident in these program components. Overall, the net effect of the conversions is
minimal, with the difference between estimated and actual total expenditures amounting
to approximately 2.5% across all E&G funds and public DCU institutions.

7.0 CONCLUSIONS ANDRECOMMENDATIONS

Conclusions and Recommendations
Page 7-1
7.0 CONCLUSIONS AND RECOMMENDATIONS
The topic of faculty productivity is vast and complex. This study has produced
data and information regarding not only the specifics of faculty activity and workload at
Florida's public universities, but also the efforts to measure and address faculty
productivity both nationally and in selected other states and the various approaches and
challenges to these efforts.
This chapter presents conclusions and policy recommendations for consideration
by CEPRI regarding study findings. Specifically, this chapter includes a discussion of
the following:
! a summary of the key issues involved in measuring faculty productivity;
! an overview of the data detailing faculty productivity at Florida's publicuniversities;
! discussion of the position conversions issue in Florida's publicuniversities;
! recommendations; and
! future issues in faculty productivity.
7.1 Summary of Key Issues Relating to Faculty Productivity
A review of the pertinent literature on the topic, in tandem with interviews of
several state systems of higher education, revealed a number of key characteristics of
past and present efforts to assess faculty productivity:
! Efforts have varied considerably in their methods and scope. They haveranged from faculty activity studies, which attempt to assess thedistribution of faculty activities across different functions (i.e. instruction,research, and service), to evaluations of faculty instructional workload ormeasures of non-instructional activities.
! The national debate has shifted away from the measurement of inputs tothe measurement of outcomes. In many cases, states have shiftedfocus toward accountability systems in which measures of overall

Conclusions and Recommendations
Page 7-2
"institutional effectiveness" play the central role; measures of facultyproductivity are typically subsumed within this larger framework.
! Less emphasis is given to individual faculty members' productivity thanto departmental or university-wide measures of productivity. This isperhaps reflective of the shift toward the broader framework noted in thepreceding bullet point.
! Faculty productivity often focuses on measures of instructional activitiesat the expense of measuring research or service productivity. This islikely due to the fact that data about such activities are easier to collectand quantify than those for research or service activities.
! State and national efforts to measure faculty productivity continue tomove toward the use of peer institutions and national benchmarkingdata in order to provide meaningful comparative data.
In recent years, several prominent studies have attempted to provide
standards for measuring productivity. Among these are the National Study of
Instructional Costs and Productivity (the "Delaware" study) and the National Study of
Postsecondary Faculty (NSOPF). These efforts have attempted to address some of the
challenges and shortcomings inherent in many prior faculty productivity studies.
Specifically, they treat the topic at the national level, providing standard methods of
comparison for purposes of benchmarking performance.
The Delaware study in particular was often identified by State Higher
Education Executive Officers as the premiere study of its kind. That effort collects
productivity data at the program discipline level from a host of participating institutions
across the country. In addition to providing a valuable benchmarking resource for
individual state systems and institutions, it specifically includes a host of measures of
both inputs and outcomes of all three major faculty work functions (See Exhibit 2-2), thus
addressing one of the frequent oversights of many evaluations of faculty productivity.
Finally, as noted several times throughout this report, significant differences
exist across institutional types with regard to mission and goals; consequently, faculty
activity is distributed differently across institutional types as well. Exhibit 2-1 showed

Conclusions and Recommendations
Page 7-3
that the aggregate distribution of faculty activity across the teaching, research, and
service continuum varied considerably between research, doctoral and comprehensive
institutions. Faculty activity at research and doctoral institutions was distributed more
evenly between the teaching and research functions than at comprehensive and two-
year institutions, at which only a minimal amount of effort was directed toward non-
instructional activities.
7.2 Overview of Faculty Productivity at Florida's Public Universities
This section outlines the major findings relating to faculty productivity as
discussed in Chapter 5 of this report, specifically addressing those topics identified in the
legislative proviso authorizing this study. It must be noted here that each of the ten
public universities included in this study appear to have adequate procedures in place
for monitoring and evaluating faculty productivity. These procedures vary considerably
across institutions in their complexity and comprehensiveness. Nevertheless, they serve
to address the specific goals and needs of each institution. All institutions appear to be
fully compliant with the 12-Hour Law and, in many cases, have structured their
evaluations of faculty productivity around the framework established by that law.
Major findings relative to the productivity of faculty at Florida's public universities
are as follows:
! Across all of the institutions, tenured and tenure track facultycomprised slightly more than half of all university instructionalstaff (54.7%) in 1999-00, having declined about ten percent since1991-92. Non-tenure track faculty accounted for 16.8% of FTEinstructional staff and Graduate Student Instructors accounted for 19.7%of FTE instructional staff. The distribution of Graduate StudentInstructors was primarily across UF, FSU and USF, the three majorresearch institutions within the public state system during the nine yeartime frame covered by this study (FIU was awarded comparableresearch status during the last year). The distribution of non-tenure trackfaculty (instructors, lecturers, adjuncts, etc) was among the remainingseven institutions. (Exhibit 5-1).

Conclusions and Recommendations
Page 7-4
! Class Lectures comprised 60% of total class sections offered in1999-00. Nevertheless, this form of instruction accounted for 86.5% ofstudent credit hours generated. Individualized instruction accounted fora significant portion of total course sections offered, but generatedrelatively few credit hours (Exhibit 5-2). The data show an averageteaching assignment of 7 course sections per academic year. Of thisnumber, 4.5 courses were "formal course sections," i.e. organized groupinstruction sections. These figures remained essentially unchangedover the nine-year period examined (Exhibits 5-7 through 5-10).
! Tenured and tenure-earning faculty provided the majority ofinstructional effort and generated more than half of the studentcredit hours over the last nine years. Contrary to the perception heldby some, adjunct faculty, non-ranked faculty, graduate studentinstructors, and other types of instructional staff together provide lessthan half of the total instructional effort at Florida’s public universities(Exhibits 5-4 and 5-6).
! Average class size declined slightly between 1991-92 and 1999-00.Although during that same period enrollments increased dramatically(32% between 1991-92 and 1999-00), class size was closely controlled.At certain points beginning in the mid 80’s, legislative focus was directedtoward the issue of reducing class size and some funding was providedto encourage this outcome. About 70 percent of class meetings were ator below the mean class size of 33, indicating a small minority of largeclasses (Exhibit 5-3).
! Lower level instructional effort was primarily provided by staffother than tenured or tenure earning faculty. Depending on theinstitutions, lower level instruction was typically provided by either nontenure-earning faculty or Graduate Student Instructors. Tenured andtenure earning faculty taught about 30 percent of such courses acrossall of the institutions. However, upper and graduate level courses werepredominantly taught by tenured and tenure earning faculty (Exhibit 5-4).
! Tenured and tenure-earning faculty produced in 1999-00 almost375 student credit hours per FTE across all of the institutions. Thisaverage, however, was down from more than 396 student credit hoursper FTE in 1991-92 (-5.4%). The reduction in average student credithour production without a concomitant reduction in average number ofcourse sections taught is reflective of the reduction in mean class sizeand a shift toward more individualized instruction that occurred between1991-92 and 1999-00 (Exhibit 5-11).
! In 1999-00, tenured and tenure earning faculty spent almost two-thirds (61%) of classroom contact hours and equivalencies incredit generating instruction. All institutions were in compliance of the12-Hour Law. The average number of classroom contact hours spent incredit generating instruction across all institutions was almost nine perterm. This translates into approximately a 3/3 course load (three

Conclusions and Recommendations
Page 7-5
courses per term) assuming three credit hour course sections. Theinstitutions varied by type in the proportion of contact hours orequivalencies devoted to instruction and research. Research anddoctoral institutions typically had a smaller share of contact hours ininstruction and a larger share of hours in research than thecomprehensive institutions. This distribution and course load remainedessentially constant across the nine-year period under examination.1
! Contract and Grant expenditures for the ten universities totaledalmost $900 million in 1999-00. This was equivalent to about$125,000 per FTE tenured and tenure earning faculty member in thestate university system. Controlling for inflation, the average contractand grant award increased almost 30 percent between 1994-95 and1999-00. The number of active research projects at FL public DCUinstitutions likewise increased about 30 percent during the same period.Along with this increase, the number of contact hours of creditgenerating instruction and course sections taught per tenured andtenure track faculty member remained essentially constant, indicating arelative increase in overall productivity among this group of faculty.
7.3 Overview of the Position Conversion Issue in Florida's Public Universities
Under the current funding model, Salary and Benefits expenditures are the only
appropriation category that routinely receives annual funding increases. As a result, the
universities tend to overestimate these Salaries and Benefits expenditures in the
budgets they submit to the State for approval, allowing for the coverage of funding
shortfalls in other (non-salary) categories that do not receive increases to compensate
for inflationary pressures. This issue is known as "position conversions", and results in
discrepancies between estimated and actual expenditures in salary versus non-salary
appropriation categories, as salary dollars are typically overestimated, while non-salary
dollars are typically underestimated. The net effect of these under- and overestimations
is insignificant, as the excess funds drawn from the Salary and Benefits category are
transferred into other categories to cover funding shortfalls resulting from increasing
costs in non-salary expenses.
1 See discussion in section 7.5, "Future Issues in Faculty Productivity," for a discussion of theissue as it pertains to Florida Gulf Coast University.

Conclusions and Recommendations
Page 7-6
! In Exhibit 6-2, the position conversions issue is illustrated within theInstruction and Research (I & R) program component, as salary dollarsare over-estimated, while non-salary dollars are under-estimated. Theresult is an overall overestimation of funds budgeted within this programcomponent.
! Exhibit 6-3 illustrates the excess funds within I & R distributed acrossseveral other program components where salary dollars are not quite asprominent. Across all components, we generally see the respectiveunder- and overestimations between non-salary and salaryexpenditures.
! The net effect of position conversions is relatively insignificant, asestimated total and actual total expenditures differ by about 2.5% acrossall Educational and General (E & G) funds among Florida's publicuniversities.
7.4 Recommendations
! Productivity measurement should encompass both qualitative andquantitative aspects of faculty work, and should include the threemajor faculty assignments – teaching, research, and service. Asthe national debate has shifted from the measure of inputs to themeasure of outcomes measures of productivity, to be meaningful, mustrecognize the quality of the service provider (Exhibit 2-2).
! Productivity improvement strategies should be developedcollaboratively among all institutional stakeholders – faculty,administrators, and students – and have clear expectations.
! Measurement and focus of faculty productivity, to be meaningful,must be at the individual departmental level within each institution.
! Productivity improvement strategies should be linked directly tothe role and mission of the institution as well as to the institutionalincentive structure. One would expect a rewards structure tied to moredirect involvement in research activities at the Research and Doctoralinstitutions and less so at the comprehensive institutions.
! Each university should be encouraged to select peer institutionsagainst which to compare themselves for the establishment ofproductivity benchmarks. Establishing successful models that assessfaculty work productivity, accomplished through appropriatecomparisons among peer institutions, recognizes that faculty activitiesand outputs differ greatly across institutional types.
! If the evaluation of faculty productivity continues to be an issue atthe statewide level, faculty performance benchmarks (such as the

Conclusions and Recommendations
Page 7-7
Delaware Study) should be systematically applied by allinstitutions in relation to their distinctive peer groups. Otherwise, areview at the statewide level will be inconsistent and less meaningful.
7.5 Future Issues in Faculty Productivity
The discussion in this study of Florida's public universities has made frequent
reference to the inherent differences between those institutions, noting that the
characteristics of faculty work and institutional mission vary considerably across the
research, doctoral, and comprehensive institutions. Thus categorizing the universities
according to their Carnegie classifications provides a simple mechanism for
distinguishing them according to salient characteristics.
However, it also potentially masks the fact that many additional factors must be
considered when assessing a particular institution's performance with regard to faculty
productivity. A notable example of this is seen in Florida Gulf Coast University (FGCU).
That institution, which offered it's first classes in fall 1997, is so new that it faces many
challenges that distinguish it even from the other comprehensive universities in the state.
Moreover, FGCU is unique in that it is the only state university in Florida that has no
faculty tenure system. Instead, faculty members are employed on the basis of multi-year
contracts. This, in tandem with its status as a comprehensive university emphasizing
the production of baccalaureate degrees, tends to suggest that faculty would be heavily
focused on teaching as opposed to research activity. Presumably, measures of faculty
workload and productivity would indicate heavier course loads, higher than average
student credit hour production, and so forth.
However, as shown on a number of indicators depicted in chapter 5 of this report,
FGCU does not fit this pattern. Average class size at FGCU is about half that of the
public DCU systemwide average. Consequently, average course load, average student

Conclusions and Recommendations
Page 7-8
credit hour production, and other metrics of faculty productivity are significantly lower
than one might expect.
As noted, FGCU is quite new. In order to prepare for expected enrollment
growth, the university has acquired resources, including faculty resources, that exceed
current needs. This is typical of new institutions and new programs within existing
institutions. As a result, however, measures of faculty productivity are heavily impacted.
The high ratio of students to faculty leads to lower than expected average workload and
teaching productivity for faculty members
Hence, the data provided for FGCU in this study may not necessarily reflect the
future nature of faculty instructional productivity as the university matures and satisfies
other priorities, including the attainment of enrollment targets. Consequently, it will be of
significant value to monitor the institution's progress with respect to this issue in the
coming years in order to properly evaluate faculty productivity at FGCU.
Another issue to be considered concerns the inclusion of institutions not
addressed by this study. Due to limited time and budget, it was determined in
consultation with CEPRI staff that only Florida's public universities were to be included in
this analysis of faculty productivity issues. However, these institutions comprise only a
portion of the total population of postsecondary institutions in the state. Also crucial to
the delivery of high-quality education at the postsecondary level are Florida's community
colleges and independent colleges and universities.
These institutions play a vital role in higher education in Florida. A majority of the
independent colleges and universities in Florida are united through the Independent
Colleges and Universities of Florida, Inc. (ICUF). ICUF has grown to 27 member
institutions, which together enroll 28 percent of the students attending four-year

Conclusions and Recommendations
Page 7-9
institutions in Florida and produce 31 percent of the baccalaureate, master's, doctoral,
and professional degrees awarded in the state each year.
Florida’s 28 locally governed public community colleges were established to serve
the citizens of the State by offering the first two years of a baccalaureate degree,
vocational education and adult continuing education. The community colleges operate
over 90 campuses and centers and over 2,000 other off-campus, educational sites. The
system enrolls over 900,000 students annually in all postsecondary, vocational and adult
programs. While governed by local boards of trustees, the colleges are now coordinated
under the jurisdiction of the Florida Board of Education.
A robust treatment of the issue of faculty productivity in Florida should include
discussion of the topic as it relates to all of Florida's postsecondary institutions. Future
efforts to assess and discuss productivity at the statewide level would benefit from the
inclusion of relevant data from both the ICUF institutions and the public community
college system.
Because some CEPRI council members have recently expressed interest in this
topic, summary data detailing the average number of full-time faculty class hours and
student semester hours, provided by the Florida's Community College System, are
presented in Exhibit 7-1. Exhibits 7-2 and 7-3 respectively provide data detailing
undergraduate teaching loads and percentage of undergraduate courses taught by
faculty at ICUF institutions. However, it must be noted that this topic falls outside of the
scope of the current study and are provided only in response to specific interest by
CEPRI council members. These data have not been analyzed or verified. They were
provided to CEPRI by both the Florida Community Colleges and ICUF, and are provided
here as they were submitted.

Conclusions and Recommendations
Page 7-10
EXHIBIT 7-1CLASS HOURS AND STUDENT SEMESTER HOURS PER FULL-TIMEREGULAR FACULTY MEMBER AT FLORIDA'S PUBLIC COMMUNITY
COLLEGES (SYSTEMWIDE): FALL TERM, 2000-2001
TYPE OF INSTRUCTIONHEADCOUNT
FACULTY (TOTAL)
STUDENT SEMESTER HOURS
(TOTAL)
CLASS HOURS PER HEADCOUNT
(AVERAGE)
ADVANCED AND PROFESSIONAL EDUCATION 2,855 916,128.5 14.0
POSTSECONDARY VOCATIONAL EDUCATION 1,520 298,042.0 12.3
POSTSECONDAY ADULT VOCATIONAL 303 50,263.2 17.4
SUPPLEMENTARY VOCATIONAL 99 2,390.3 1.8
COLLEGE PREPARATORY 623 138,323.6 10.1
VOCATIONAL PREPARATORY 6 494.3 21.0
ADULT BASIC 39 10,681.5 17.9
ADULT SECONDARY AND GED PREPARATORY 53 10,874.0 18.4
TOTAL 4,477 1,427,197.4 16.1
Note: Total headcount faculty is not a sum of the individual instructional programs listedunder "type of instruction." Headcount may be duplicated across instructional types.
Source: Florida Community Colleges 2000-01 Student and Personnel Databases
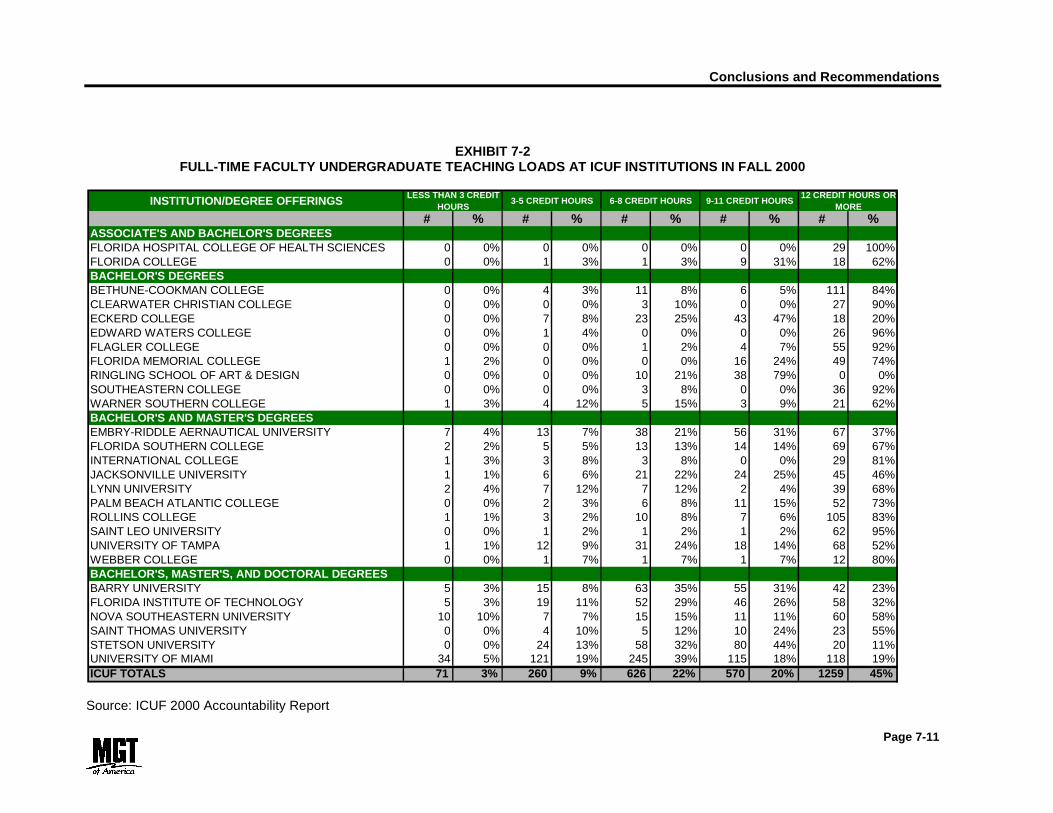
Conclusions and Recommendations
Page 7-11
EXHIBIT 7-2FULL-TIME FACULTY UNDERGRADUATE TEACHING LOADS AT ICUF INSTITUTIONS IN FALL 2000
INSTITUTION/DEGREE OFFERINGS LESS THAN 3 CREDIT HOURS
3-5 CREDIT HOURS 6-8 CREDIT HOURS 9-11 CREDIT HOURS12 CREDIT HOURS OR
MORE
# % # % # % # % # %ASSOCIATE'S AND BACHELOR'S DEGREESFLORIDA HOSPITAL COLLEGE OF HEALTH SCIENCES 0 0% 0 0% 0 0% 0 0% 29 100%FLORIDA COLLEGE 0 0% 1 3% 1 3% 9 31% 18 62%BACHELOR'S DEGREESBETHUNE-COOKMAN COLLEGE 0 0% 4 3% 11 8% 6 5% 111 84%CLEARWATER CHRISTIAN COLLEGE 0 0% 0 0% 3 10% 0 0% 27 90%ECKERD COLLEGE 0 0% 7 8% 23 25% 43 47% 18 20%EDWARD WATERS COLLEGE 0 0% 1 4% 0 0% 0 0% 26 96%FLAGLER COLLEGE 0 0% 0 0% 1 2% 4 7% 55 92%FLORIDA MEMORIAL COLLEGE 1 2% 0 0% 0 0% 16 24% 49 74%RINGLING SCHOOL OF ART & DESIGN 0 0% 0 0% 10 21% 38 79% 0 0%SOUTHEASTERN COLLEGE 0 0% 0 0% 3 8% 0 0% 36 92%WARNER SOUTHERN COLLEGE 1 3% 4 12% 5 15% 3 9% 21 62%BACHELOR'S AND MASTER'S DEGREESEMBRY-RIDDLE AERNAUTICAL UNIVERSITY 7 4% 13 7% 38 21% 56 31% 67 37%FLORIDA SOUTHERN COLLEGE 2 2% 5 5% 13 13% 14 14% 69 67%INTERNATIONAL COLLEGE 1 3% 3 8% 3 8% 0 0% 29 81%JACKSONVILLE UNIVERSITY 1 1% 6 6% 21 22% 24 25% 45 46%LYNN UNIVERSITY 2 4% 7 12% 7 12% 2 4% 39 68%PALM BEACH ATLANTIC COLLEGE 0 0% 2 3% 6 8% 11 15% 52 73%ROLLINS COLLEGE 1 1% 3 2% 10 8% 7 6% 105 83%SAINT LEO UNIVERSITY 0 0% 1 2% 1 2% 1 2% 62 95%UNIVERSITY OF TAMPA 1 1% 12 9% 31 24% 18 14% 68 52%WEBBER COLLEGE 0 0% 1 7% 1 7% 1 7% 12 80%BACHELOR'S, MASTER'S, AND DOCTORAL DEGREESBARRY UNIVERSITY 5 3% 15 8% 63 35% 55 31% 42 23%FLORIDA INSTITUTE OF TECHNOLOGY 5 3% 19 11% 52 29% 46 26% 58 32%NOVA SOUTHEASTERN UNIVERSITY 10 10% 7 7% 15 15% 11 11% 60 58%SAINT THOMAS UNIVERSITY 0 0% 4 10% 5 12% 10 24% 23 55%STETSON UNIVERSITY 0 0% 24 13% 58 32% 80 44% 20 11%UNIVERSITY OF MIAMI 34 5% 121 19% 245 39% 115 18% 118 19%ICUF TOTALS 71 3% 260 9% 626 22% 570 20% 1259 45%
Source: ICUF 2000 Accountability Report

Conclusions and Recommendations
Page 7-12
EXHIBIT 7-3PERCENTAGE OF UNDERGRADUATE COURSE SECTIONS TAUGHT BY FACULTY AT ICUF INSTITUTIONS IN FALL 2000
INSTITUTION/DEGREE OFFERINGS FULL-TIME FACULTY PART-TIME AND OTHER FACULTYFULL
PROFESSORASSOCIATE
PROFESSORASSISTANT
PROFESSORINSTRUCTOR/LECTURE
TOTALOTHER
REGULAR SUPPLEMENTAL
FACULTYASSOCIATE'S AND BACHELOR'S DEGREESFLORIDA HOSPITAL COLLEGE OF HEALTH SCIENCES 21% 33% 8% 8% 70% 30% 0%FLORIDA COLLEGE FACULTY ARE NOT RANKED 85% NA 15%BACHELOR'S DEGREESBETHUNE-COOKMAN COLLEGE 11% 8% 38% 20% 76% 0% 24%CLEARWATER CHRISTIAN COLLEGE 30% 42% 11% 0% 83% 0% 17%ECKERD COLLEGE 25% 23% 30% 0% 78% 2% 19%EDWARD WATERS COLLEGE 9% 11% 27% 5% 52% 12% 36%FLAGLER COLLEGE 15% 15% 29% 6% 65% 6% 28%FLORIDA MEMORIAL COLLEGE 4% 17% 39% 4% 64% 4% 32%RINGLING SCHOOL OF ART & DESIGN FACULTY ARE NOT RANKED 59% NA 41%SOUTHEASTERN COLLEGE 32% 19% 27% 0% 79% 0% 21%WARNER SOUTHERN COLLEGE 23% 13% 13% 12% 61% 0% 39%BACHELOR'S AND MASTER'S DEGREESEMBRY-RIDDLE AERNAUTICAL UNIVERSITY 20% 25% 21% 8% 74% 0% 26%FLORIDA SOUTHERN COLLEGE 18% 13% 24% 2% 57% 10% 33%INTERNATIONAL COLLEGE 36% 24% 11% 2% 74% 26% 0%JACKSONVILLE UNIVERSITY 22% 12% 22% 0% 56% 0% 44%LYNN UNIVERSITY 17% 16% 12% 4% 49% 13% 38%PALM BEACH ATLANTIC COLLEGE 9% 18% 23% 5% 55% 1% 43%ROLLINS COLLEGE 26% 16% 13% 0% 54% 7% 39%SAINT LEO UNIVERSITY 4% 9% 6% 1% 21% 0% 79%UNIVERSITY OF TAMPA 20% 25% 15% 6% 65% <1% 35%WEBBER COLLEGE 9% 20% 48% 0% 77% 0% 23%BACHELOR'S, MASTER'S, AND DOCTORAL DEGREESBARRY UNIVERSITY 8% 15% 22% 4% 49% 1% 50%FLORIDA INSTITUTE OF TECHNOLOGY 16% 27% 26% 15% 84% 0% 16%NOVA SOUTHEASTERN UNIVERSITY 5% 15% 14% 7% 40% 4% 57%SAINT THOMAS UNIVERSITY 16% 17% 25% 7% 65% 0% 35%STETSON UNIVERSITY 24% 26% 17% 11% 79% 7% 14%UNIVERSITY OF MIAMI 20% 17% 8% 30% 76% 10% 14%ICUF TOTALS 15% 16% 18% 9% 60% 4% 35%
Source: ICUF 2000 Accountability Report

Conclusions and Recommendations
Page 7-13