faculty of health sciences, programme of professional
TRANSCRIPT
Model photo: Colourbox.com
0
Faculty of health sciences, Programme of professional study in medicine
Pulmonary complications in patients undergoing neurointensive care Master’s Thesis in medicine [MED-3950] – June 2018 —
Øyvind Øygard Skodvin (medical student, MK-13)
Supervisor: Consultant, PhD Shirin K. Frisvold Co-supervisor: Professor Emeritus, Dr. Med. Lars J. Bjertnæs
Author’s name and last name
Master’s thesis in [study program] … Month Year
Faculty of Science and Technology
Department of Computer Science
Deep Learning: From Data Extraction to Large-Scale Analysis
—
Mike Voets
INF-3990 Master’s thesis in Computer Science May 2018

Master’s Thesis in medicine [MED-3950] Page i of v
Foreword The purpose of this thesis is to provide data that could be used to optimize respiratory care for
the intubated neurointensive patient. To do so, we wanted both to assess the incidence of
pulmonary complications in this group of patients at our hospital, and to assess different
ventilator variables used during their stay in the intensive care unit, such as tidal volumes and
positive end-expiratory pressures.
The idea behind this project came from my supervisor, who had a long-lasting desire to improve
care for the critically ill and brain-injured patient. When looking for a project for my master’s
thesis, I saw this as an opportunity to learn something from a field of medicine that I had little
prior knowledge of. In that respect, I found the combination of respiratory care and brain injury
particularly compelling.
A special thank you to Shirin Frisvold, my supervisor, for your valuable time, excellent
supervision, interesting discussions and for always being positive though facing different
challenges throughout the work with this thesis. And thanks to Lars Bjertnæs, my co-supervisor,
who has made crucial contributions both concerning academic content and writing, and even
provided very valuable feedback while being on vacation to his mountain cabin.
I also want to address a word of thanks to the University of Tromsø for their financial
contributions that made supervision and data collection possible.
Tromsø, June 2018
Øyvind Øygard Skodvin
Model photo on front page: Colourbox.com

Master’s Thesis in medicine [MED-3950] Page ii of v
Table of Contents
Abstract ........................................................................................................................................... iv
Abbreviations ................................................................................................................................... v
1 Introduction ............................................................................................................................. 1
1.1 Acute brain injury (ABI) .............................................................................................................................. 1 1.1.1 Subarachnoid hemorrhage (SAH) ......................................................................................................................1 1.1.2 Traumatic brain injury (TBI)................................................................................................................................2
1.2 Acute respiratory failure in ICU patients ................................................................................................ 4 1.2.1 Ventilator-associated pneumonia .....................................................................................................................4 1.2.2 Acute respiratory distress syndrome (ARDS) ...................................................................................................4 1.2.3 Atelectasis .............................................................................................................................................................5 1.2.4 Ventilator-induced lung injury (VILI) .................................................................................................................7 1.2.5 Pulmonary complications in the neurointensive patient ..............................................................................7
1.3 Mechanical ventilation strategies in acute respiratory failure .......................................................... 9
1.4 Mechanical ventilation strategies in ABI ..............................................................................................11 1.4.1 Role of mechanical ventilation in ABI ............................................................................................................ 11 1.4.2 Relationship between ventilator settings and ICP ....................................................................................... 12
1.5 Aims of the thesis .....................................................................................................................................13
2 Materials and methods .......................................................................................................... 14
2.1 Study design and population ..................................................................................................................14
2.2 Data collection...........................................................................................................................................14
2.3 Data analysis and statistics .....................................................................................................................15 3 Results .................................................................................................................................... 16
3.1 Patients .......................................................................................................................................................16 3.2 Incidence of respiratory failure ..............................................................................................................16
3.3 PEEP values ................................................................................................................................................18
3.4 Tidal volumes.............................................................................................................................................19 4 Discussion ............................................................................................................................... 20
4.1 Limitations .................................................................................................................................................23 5 Conclusion .............................................................................................................................. 24
6 References .............................................................................................................................. 25
7 GRADE evaluations ................................................................................................................. 30

Master’s Thesis in medicine [MED-3950] Page iii of v
List of Tables
Table 1. The Berlin definition of acute respiratory distress syndrome ................................................ 5Table 2. ARDS Network mechanical ventilation protocol..................................................................... 10Table 3. Patient characteristics ................................................................................................................ 16
List of Figures
Figure 1. Scandinavian guidelines for initial management of minimal, mild and moderate head
injuries in adults ........................................................................................................................................... 4Figure 2. Injured alveolus in the acute phase of the acute respiratory distress syndrome (ARDS) . 6Figure 3. Ventilator-induced lung injury (VILI) ......................................................................................... 8Figure 4. Clinical diagnosis of pulmonary complications during ICU stay ......................................... 17Figure 5. Severity of lung injury ............................................................................................................... 18Figure 6. Distribution of FiO2 values ....................................................................................................... 19Figure 7. Tidal volumes per actual body weight .................................................................................... 19Figure 8. Tidal volumes per predicted body weight ............................................................................. 20
Master’s Thesis in medicine [MED-3950] Page iv of v
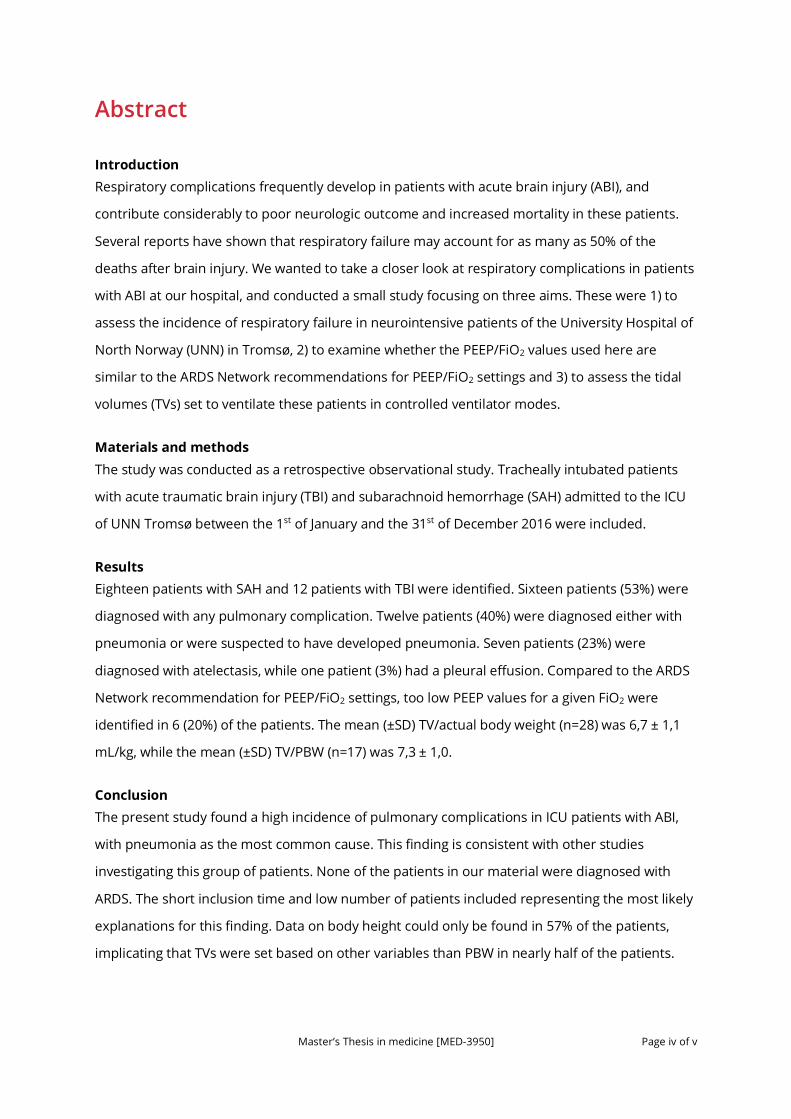
Abstract
Introduction Respiratory complications frequently develop in patients with acute brain injury (ABI), and
contribute considerably to poor neurologic outcome and increased mortality in these patients.
Several reports have shown that respiratory failure may account for as many as 50% of the
deaths after brain injury. We wanted to take a closer look at respiratory complications in patients
with ABI at our hospital, and conducted a small study focusing on three aims. These were 1) to
assess the incidence of respiratory failure in neurointensive patients of the University Hospital of
North Norway (UNN) in Tromsø, 2) to examine whether the PEEP/FiO2 values used here are
similar to the ARDS Network recommendations for PEEP/FiO2 settings and 3) to assess the tidal
volumes (TVs) set to ventilate these patients in controlled ventilator modes.
Materials and methods The study was conducted as a retrospective observational study. Tracheally intubated patients
with acute traumatic brain injury (TBI) and subarachnoid hemorrhage (SAH) admitted to the ICU
of UNN Tromsø between the 1st of January and the 31st of December 2016 were included.
Results Eighteen patients with SAH and 12 patients with TBI were identified. Sixteen patients (53%) were
diagnosed with any pulmonary complication. Twelve patients (40%) were diagnosed either with
pneumonia or were suspected to have developed pneumonia. Seven patients (23%) were
diagnosed with atelectasis, while one patient (3%) had a pleural effusion. Compared to the ARDS
Network recommendation for PEEP/FiO2 settings, too low PEEP values for a given FiO2 were
identified in 6 (20%) of the patients. The mean (±SD) TV/actual body weight (n=28) was 6,7 ± 1,1
mL/kg, while the mean (±SD) TV/PBW (n=17) was 7,3 ± 1,0.
Conclusion The present study found a high incidence of pulmonary complications in ICU patients with ABI,
with pneumonia as the most common cause. This finding is consistent with other studies
investigating this group of patients. None of the patients in our material were diagnosed with
ARDS. The short inclusion time and low number of patients included representing the most likely
explanations for this finding. Data on body height could only be found in 57% of the patients,
implicating that TVs were set based on other variables than PBW in nearly half of the patients.

Master’s Thesis in medicine [MED-3950] Page v of v
Abbreviations ABI Acute brain injury
ALI Acute lung injury
ARDS Acute respiratory distress syndrome
CBF Cerebral blood flow
CPAP Continuous positive airway pressure
CPP Cerebral perfusion pressure
CT Computed tomography
DAI Diffuse axonal injury
FiO2 Fraction of inspired oxygen
GCS Glasgow coma scale
ICP Intracranial pressure
ICU Intensive care unit
ISS Injury severity score
MAP Mean arterial pressure
OLA Open lung approach
PaCO2 Partial pressure of carbon dioxide in arterial blood
PaO2 Partial pressure of oxygen in arterial blood
PEEP Positive end-expiratory pressure
PBW Predicted body weight
RM Recruitment maneuver
RR Risk ratio
SAH Subarachnoid hemorrhage
TBI Traumatic brain injury
TV Tidal volume
UNN University Hospital of North Norway in Tromsø
VAP Ventilator-associated pneumonia
VILI Ventilator-induced lung injury

Master’s Thesis in medicine [MED-3950] Page 1 of 35
1 Introduction Respiratory complications frequently develop in victims of acute brain injury (ABI) and contribute
considerably to the poor neurological outcome and increased mortality. Several reports have
shown that pulmonary alterations may account for as many as 50% of the deaths after brain
injury.1 Common pulmonary complications in these patients include ventilator-associated
pneumonia (VAP), acute respiratory distress syndrome (ARDS), atelectasis, pleural effusions,
pulmonary edema and pulmonary embolism.2 Prevention of hypoxemia resulting from lung
injury is essential, as hypoxemia may induce secondary brain injury. In a large, prospectively
collected data set from the Traumatic Coma Data Bank, hypoxemia in patients with severe
traumatic brain injury was associated with significant increases in morbidity and mortality.3 In
spite of a high incidence of pulmonary complications, the optimal strategy for mechanical
ventilation of these patients is still unsettled.
1.1 Acute brain injury (ABI)
This study will be focusing on patients with ABI due to subarachnoid hemorrhage (SAH) or
traumatic brain injury (TBI). Therefore, in the following emphasize will be put on defining these
two disorders.
1.1.1 Subarachnoid hemorrhage (SAH)
Subarachnoid hemorrhage (SAH) is a devastating condition that refers to bleeding in the
subarachnoid space, which is located between the arachnoid mater and the pia mater. Despite
being a rare condition, accounting for approximately 5% of strokes, the young age of those
affected and the high morbidity and mortality makes its effect on years of life lost similar to that
of the more common types of stroke, i.e. ischemic stroke and intracerebral hemorrhage.4 SAH
without a preceding trauma is in 80% of cases caused by rupture of an intracranial aneurysm,
while causes like vascular malformations and vasculitis are more uncommon.5 The worldwide
incidence of SAH has been estimated to 9,1 per 100 000 person-years.6 European Standard
Population (ESP) standardized incidence of SAH from a ruptured intracranial aneurysm in Norway
was estimated to 8,7 per 100 000 person-years between 1984 and 2007.7 Treatment can be
achieved either by an open surgical approach or endovascularly by means of an intra-arterial
catheter. The open surgical approach requires opening of the skull (craniotomy) and application
of a titanium clip on the neck of the aneurysm, while the endovascular approach involves
navigation of the intraarterial catheter to the aneurysm site from a peripheral artery. By applying

Master’s Thesis in medicine [MED-3950] Page 2 of 35
the latter procedure, platinum coils are delivered and packed into the lumen of the aneurysm,
which slows or prevents blood flow into the aneurysm and leads to thrombus formation.5
The brain injury from SAH occurs in two phases.8 Early brain injury is caused by transient
global ischemia and toxic effects of subarachnoid blood. Direct destruction of brain tissue by an
intracerebral hemorrhage can also contribute to the damage. The second phase of brain injury
typically occurs from 4 to 14 days after rupture of the aneurysm, and involves a clinical syndrome
of focal neurologic deficits that develop in one third of the patients.5 This syndrome is called
delayed cerebral ischemia and is a major cause of death and disability after SAH. In 70% of
patients, narrowing of angiographically visible cerebral arteries—vasospasms—is found. The
process generally starts 3 to 4 days after aneurysm rupture, peaks at 7 to 10 days, and resolves
by 14 to 21 days. Vasospasm has been considered the cause of delayed cerebral ischemia, but its
exact role is controversial.9 Recent evidence suggest that a variety of vascular and neural changes
that take place after SAH may contribute to its pathogenesis. Moreover, delayed cerebral
ischemia develops in half of the patients with angiographic vasospasm, and ischemia does not
occur consistently in the territory supplied by the vessel undergoing spasm.8
In two Norwegian cohorts, 40% of the patients had died 6 months after SAH caused by
rupture of an intracranial aneurysm.7 One year after SAH, about 50% of survivors were reported
to have sequelae requiring long-term care and rehabilitation.10 Modifiable risk factors for SAH
include smoking, hypertension and excess alcohol intake, which all roughly double the risk
individually.8 Non-modifiable risk factors include increasing age, female sex, family history, and
previous history of SAH.
1.1.2 Traumatic brain injury (TBI)
Traumatic brain injury (TBI) is a heterogenous disorder with different forms of presentation. The
unifying factor is that brain damage results from external forces, as a consequence of direct
impact, rapid acceleration or deceleration, a penetrating object or blast waves from an
explosion.11 Traditionally, TBI is graded as mild, moderate or severe based on Glasgow coma
scale (GCS) after resuscitation.12 Mild TBI with a GCS score of 13-15 is in most cases a concussion,
which is followed by full neurological recovery, although many of these patients experience
short-term difficulties with memory and concentration. In moderate TBI (GCS 9-13), the patient is
lethargic or stuporous. In severe TBI (GCS 3-8) the patient is comatose. Approximately 10-15% of
patients with TBI have serious injuries, requiring specialist care.11 In Scandinavian countries, the
incidence of hospital admission due to TBI has been estimated to 200 per 100 000 person-
years.13 TBI is the leading cause of mortality and disability among young individuals in high-
Master’s Thesis in medicine [MED-3950] Page 3 of 35
income countries.11
TBI can be divided into primary and secondary injury. Primary injury occurs as a
consequence of the initial physical insult, while different pathophysiological mechanisms may
account for the secondary injury arising hours and days after the initial injury.11 Primary brain
injuries include contusions, intracranial hematomas, cerebral edema, traumatic SAH and diffuse
axonal injury (DAI).14 DAI is characterized by multiple small lesions in white-matter tracts, and
often lead to a poor outcome.11 Secondary brain injury may arise from a multitude of factors
such as hypotension, hypoxemia, cerebral ischemia, hydrocephalus, increased intracranial
pressure (ICP), hypoglycemia and infection.3,15
The most severely affected patients require neurocritical care in an intensive care unit
(ICU), where a major focus is to prevent and limit ongoing brain damage and to provide the best
conditions for natural brain recovery by reducing brain swelling and raised ICP. As in general
intensive care, optimum cerebral perfusion, oxygenation, nutrition as well as glycemic control
and temperature controls is also essential.
The Scandinavian Neurotrauma Committee (SMC) has published evidence-based guidelines for
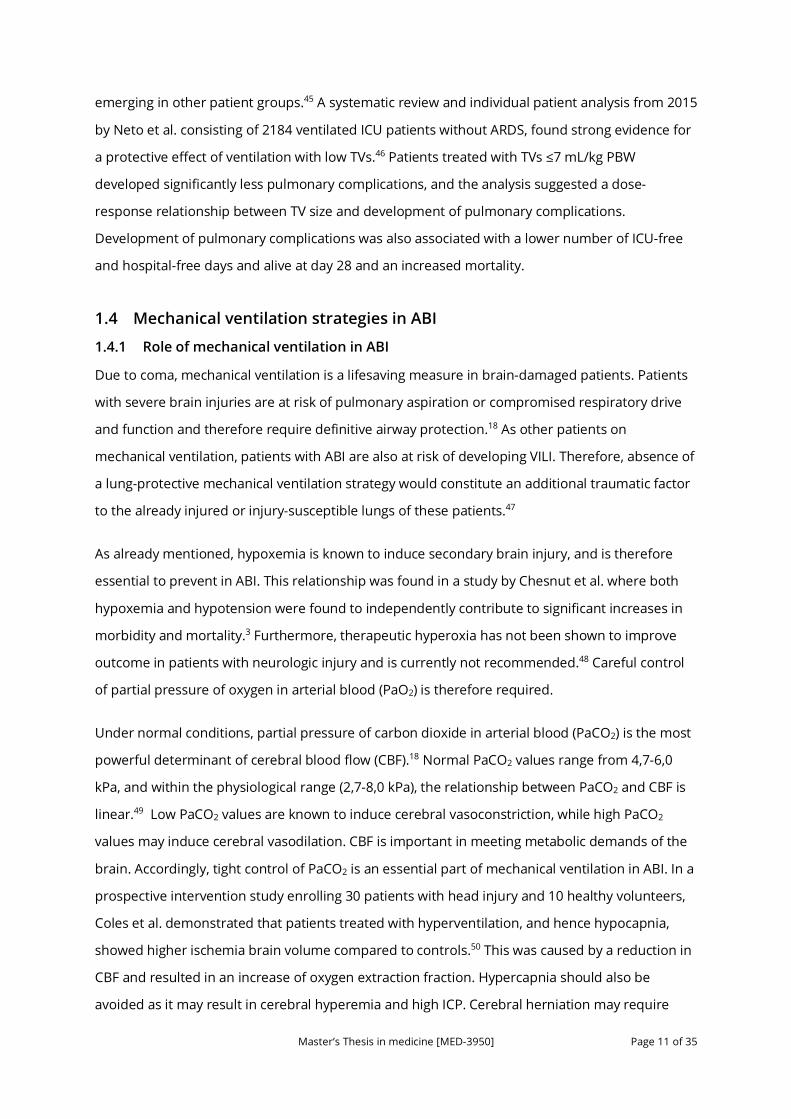
initial management of minimal, mild and moderate head injuries in adults (Figure 1).16 The aim of
these guidelines is both to identify patients requiring neurosurgical intervention, and to avoid
exposure to ionizing radiation from unnecessary computed tomography (CT) scans. Scandinavian
evidence-based guidelines for the pediatric population have also been published.17 In the 2013
update of the adult guidelines, the brain biomarker S100B was introduced for the first time.
Using a low cut-off of 0,10 µg/L, the biomarker has shown considerable ability to predict the
absence of CT pathology and injuries requiring neurosurgical intervention.16 The pediatric
guidelines do so far not include the S100B analysis, as the current evidence available for this
population has been considered too low.17
Regarding severe traumatic brain injuries, evidence-based management guidelines are
published by Brain Trauma Foundation.18 The 4th version of the guidelines was published in 2016,
available online at https://www.braintrauma.org/coma/guidelines. As the authors state, they do
not intend to produce a 5th version of the guidelines, as they are moving to a model of
continuous monitoring of the literature, rapid updates to the evidence review, and revisions to
the recommendation as the evidence warrants—a so-called Living Guidelines model.

Master’s Thesis in medicine [MED-3950] Page 4 of 35
Figure 1. Scandinavian guidelines for initial management of minimal, mild and moderate head injuries in adults. Adopted from Ingebrigtsen T, Romner B, Kock-Jensen C. Scandinavian guidelines for initial management of minimal, mild, and moderate head injuries. J Trauma. 2000;48(4):760-766.
1.2 Acute respiratory failure in ICU patients
1.2.1 Ventilator-associated pneumonia
Ventilator-associated pneumonia (VAP) is a nosocomial pneumonia developing 48 hours or more
after tracheal intubation of the patient.19 The condition often has an early onset and is associated
with community-acquired microorganisms. Mechanisms involved in the pathogenesis of VAP are
microaspirations of colonized oropharyngeal, tracheobronchial (from a colonized endotracheal
tube), or gastric secretions, leading to development of lung microabscesses.
1.2.2 Acute respiratory distress syndrome (ARDS)
Acute respiratory distress syndrome (ARDS) is a severe progressive clinical condition
characterized by acute onset of dyspnea and hypoxemia with the appearance of radiographic
infiltrates on chest radiography.20 Due to several limitations of the 1994 Definition of the
American-European Consensus Conference on ARDS, an updated definition was proposed in
Berlin in 2012 (Table 1).21 Importantly, the former “acute lung injury” (ALI) term was removed in
the 2012 Berlin Definition, and replaced with a comparable term—“mild ARDS”.
��
�
�� �������$�!�����������$��!!����� !�"�!��� ��
• ������!���! ���&���������� ����������� �� ��!����!����!�������������"�&�
����
�
�
������"�!���!���! �$�!���������(����������������!����������"�&�+�� �5*/3,�$�!����02���"� �������"�&�
���
� � ������� �/3�
�
�
�
���� ���������� ��#�!����702���"� ��
• ��� �������� "�!�!����$�!����"�� "������• �����!���������"�������������)����� �+70�����! ,���!������!����
�
���
��
����������������������������������������
��������������������������������� ������������
�
������������
������������
�
����������
�
�����������
�
����������
�����������
�
��������������������������
�
�����������������������
���
• ��� ��������� ���������� ��#�!����7/0���"� ���!������"�&�� ������!����!�#����!����
����
��
��������������������
����
• ��� ��������� ���������� ��#�!����7/0���"� ���!������"�&�� ������!����!�#����!����
�
�������
� ������"�*�� ���
��� �/2*/3�������
• ��������743�&��� �������!�*���!���!�������!����
• �����
•�
���
��
���
�
��������
�������
����������� ��
/..���
• ��64��� ���!������"�&(� ������ ��"������ /..������& � �
• ��74��� (��%!�������������"�&������� /..��� �"��#�������(�������
/..�
����
��
���
� ������*�� ���
��� �/2*/3�����
�• �� !!��"��!��� ��'"�� �
�
• ��������"����������������! ���
• ��������� ��� ��������� �������� ��� �"�������!"����
• �"�!*!���!����&���������" ��
• �������"!�����!�����"��!�����������"��!������ ����� �
��
���
� ����$*�� ���
��� �/2��
�������
�� �/3������
• " ���!��)������������ ������� ���" �� ��
• �����!���#���!��� +70��� ��� ,
���
����������� �5*/1�
�
��
• "��
•
�
���
•
• ��
• ����
• �
•
•
•
���
Scandinavian guidelines for initial managementof minimal, mild and moderate head injuries inadults: an evidence and consensus-based updateUndén et al.
Undén et al. BMC Medicine 2013, 11:50http://www.biomedcentral.com/1741-7015/11/50 (25 February 2013)
Master’s Thesis in medicine [MED-3950] Page 5 of 35
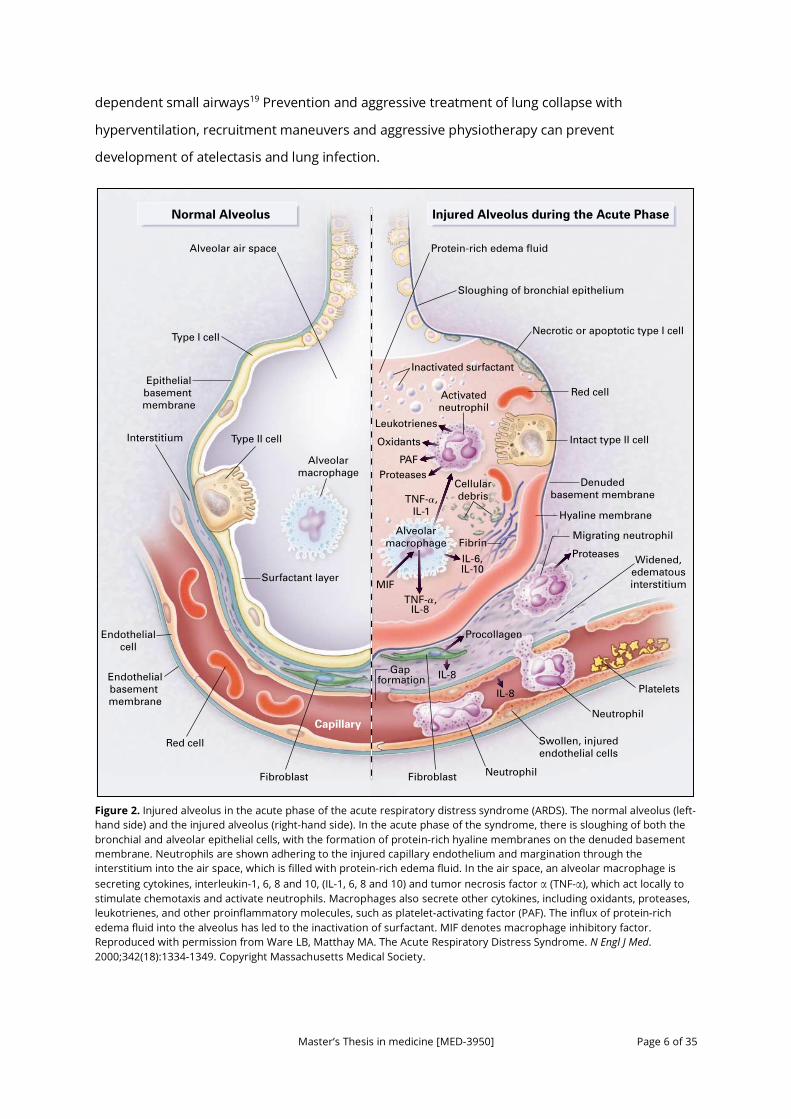
The clinical picture of ARDS is a manifestation of the alveolar degradation and flooding with a
protein-rich edema and cellular debris and a subsequent increases in pulmonary vascular
resistance.20 A complex array of endothelial injury, epithelial injury, neutrophil-mediated damage,
cytokine-mediated inflammation and injury, oxidant-mediated injury, ventilator-induced lung
injury, and dysregulation of the coagulation and fibrinolytic pathways are all implicated in the
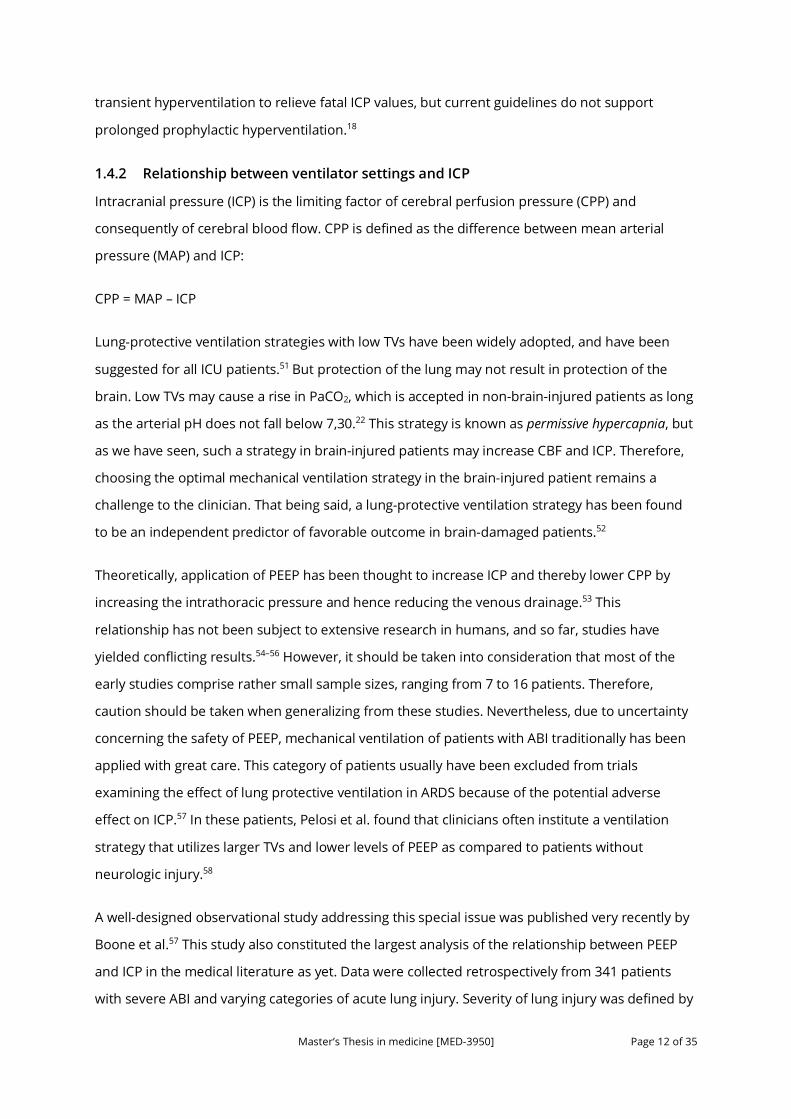
development of ARDS (Figure 2). A pro-inflammatory milieu emerges in the pulmonary
environment, thus leading to direct parenchymal injury and clinical deterioration. Severe
traumatic injury is the epitome of the pro-inflammatory state, and consequently, ARDS occurs
with increased incidence in the traumatically injured patient.20 The major causes of death in
ARDS are sepsis and multi organ failure.19
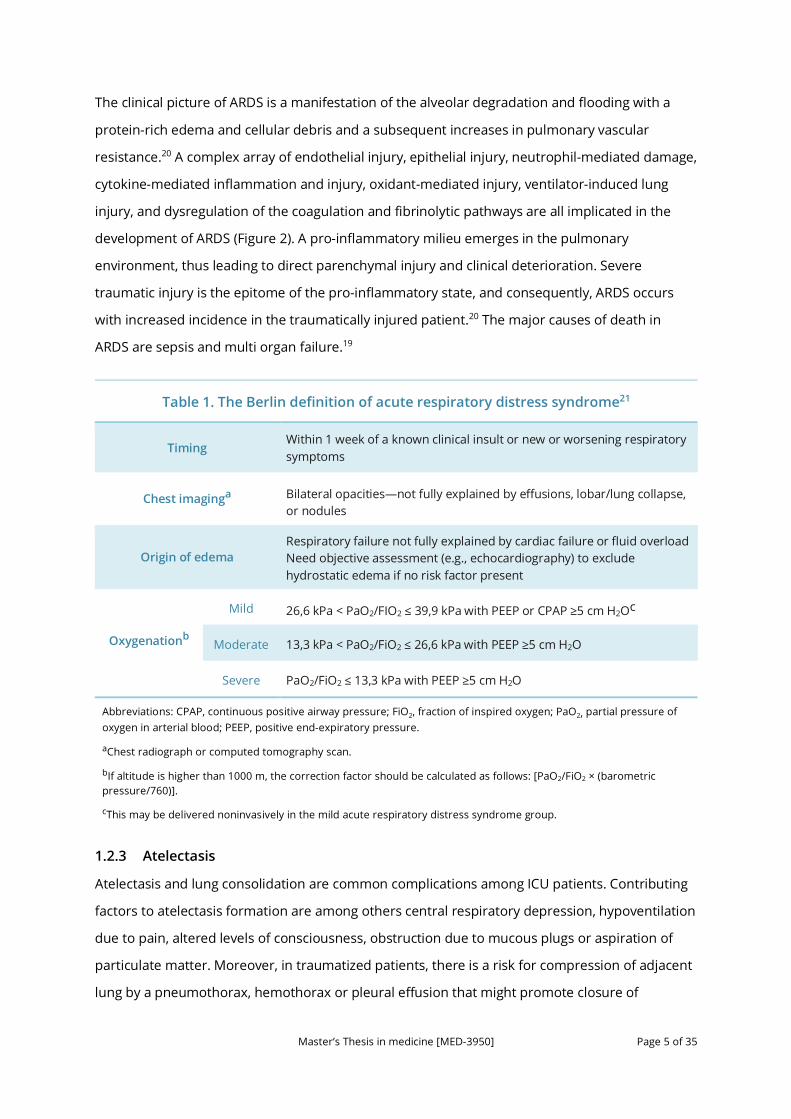
Table 1. The Berlin definition of acute respiratory distress syndrome21
Table 1. The Berlin definition of acute respiratory distress syndrome21
Timing Within 1 week of a known clinical insult or new or worsening respiratory symptoms
Chest imaginga Bilateral opacities—not fully explained by effusions, lobar/lung collapse, or nodules
Origin of edema Respiratory failure not fully explained by cardiac failure or fluid overload Need objective assessment (e.g., echocardiography) to exclude hydrostatic edema if no risk factor present
Oxygenationb
Mild 26,6 kPa < PaO2/FIO2 ≤ 39,9 kPa with PEEP or CPAP ≥5 cm H2Oc
Moderate 13,3 kPa < PaO2/FiO2 ≤ 26,6 kPa with PEEP ≥5 cm H2O
Severe PaO2/FiO2 ≤ 13,3 kPa with PEEP ≥5 cm H2O
Abbreviations: CPAP, continuous positive airway pressure; FiO2, fraction of inspired oxygen; PaO2, partial pressure of oxygen in arterial blood; PEEP, positive end-expiratory pressure.
aChest radiograph or computed tomography scan.
bIf altitude is higher than 1000 m, the correction factor should be calculated as follows: [PaO2/FiO2 × (barometric pressure/760)].
cThis may be delivered noninvasively in the mild acute respiratory distress syndrome group.
1.2.3 Atelectasis
Atelectasis and lung consolidation are common complications among ICU patients. Contributing
factors to atelectasis formation are among others central respiratory depression, hypoventilation
due to pain, altered levels of consciousness, obstruction due to mucous plugs or aspiration of
particulate matter. Moreover, in traumatized patients, there is a risk for compression of adjacent
lung by a pneumothorax, hemothorax or pleural effusion that might promote closure of
Master’s Thesis in medicine [MED-3950] Page 6 of 35
dependent small airways19 Prevention and aggressive treatment of lung collapse with
hyperventilation, recruitment maneuvers and aggressive physiotherapy can prevent
development of atelectasis and lung infection.
Figure 2. Injured alveolus in the acute phase of the acute respiratory distress syndrome (ARDS). The normal alveolus (left-hand side) and the injured alveolus (right-hand side). In the acute phase of the syndrome, there is sloughing of both the bronchial and alveolar epithelial cells, with the formation of protein-rich hyaline membranes on the denuded basement membrane. Neutrophils are shown adhering to the injured capillary endothelium and margination through the interstitium into the air space, which is filled with protein-rich edema fluid. In the air space, an alveolar macrophage is secreting cytokines, interleukin-1, 6, 8 and 10, (IL-1, 6, 8 and 10) and tumor necrosis factor α (TNF-α), which act locally to stimulate chemotaxis and activate neutrophils. Macrophages also secrete other cytokines, including oxidants, proteases, leukotrienes, and other proinflammatory molecules, such as platelet-activating factor (PAF). The influx of protein-rich edema fluid into the alveolus has led to the inactivation of surfactant. MIF denotes macrophage inhibitory factor. Reproduced with permission from Ware LB, Matthay MA. The Acute Respiratory Distress Syndrome. N Engl J Med. 2000;342(18):1334-1349. Copyright Massachusetts Medical Society.
1339
Type II cell
Type I cell
Fibroblast Fibroblast
Capillary
Alveolar!macrophage
Alveolar!macrophage
Epithelial!basement !membrane
Necrotic or apoptotic type I cell
Intact type II cell
Sloughing of bronchial epithelium
Endothelial!basement !membrane
Endothelial!cell
Surfactant layer
Inactivated surfactant
Activated!neutrophil
Alveolar air space Protein-rich edema fluid
Normal Alveolus Injured Alveolus during the Acute Phase
Denuded!basement membrane
Widened,!edematous!interstitium
Interstitium
Neutrophil
Neutrophil
Swollen, injured!endothelial cells
Migrating neutrophil
Gap !formation
Hyaline membrane
Oxidants
Proteases
Proteases
Procollagen!!
Leukotrienes
Cellular!debris
PAF
Red cell
Red cell
Fibrin
MIF
IL-6,IL-10
IL-8
IL-8
IL-8
TNF-a,!IL-1!
TNF-a,
Platelets
The New England Journal of Medicine Downloaded from nejm.org at NORWEGIAN INSTITUTE OF PUBLIC HEALTH on May 29, 2018. For personal use only. No other uses without permission.
Copyright © 2000 Massachusetts Medical Society. All rights reserved.
Master’s Thesis in medicine [MED-3950] Page 7 of 35
1.2.4 Ventilator-induced lung injury (VILI)
In the early days of mechanical ventilation, large tidal volumes (TVs) were applied to prevent
atelectasis.22 Physiological TVs during spontaneous breathing are in the range of 5 to 7 mL/kg of
predicted body weight (PBW), while TVs of 10 to 15 mL/kg of PBW became standard during
mechanical ventilation. It was later discovered that such high inflation volumes, rather than high
inflation pressures, were injurious to the lung causing an inflammatory condition termed
ventilator-induced lung injury (VILI).23 Recent research has shown that too large TVs might induce
volutrauma, whereas too small TVs might provoke atelectrauma. Barotrauma occurs following
excessive inflation of alveoli, resulting in alveolar rupture and air leaks causing pneumothorax,
pneumomediastinum, pneumoperitoneum and subcutaneous emphysema. The term
barotrauma can be misleading, as the critical variable leading to air leaks is regional lung over-
distension, not high airway pressures per se.24 In contrast, atelectrauma is associated with a fall
in functional residual capacity and closure of dependent small airways at the end of expiration in
parallel with a decrease in lung compliance. These changes occur typically in pulmonary edema
and ARDS.22 Atelectrauma can be mitigated by the use of positive end-expiratory pressure (PEEP).
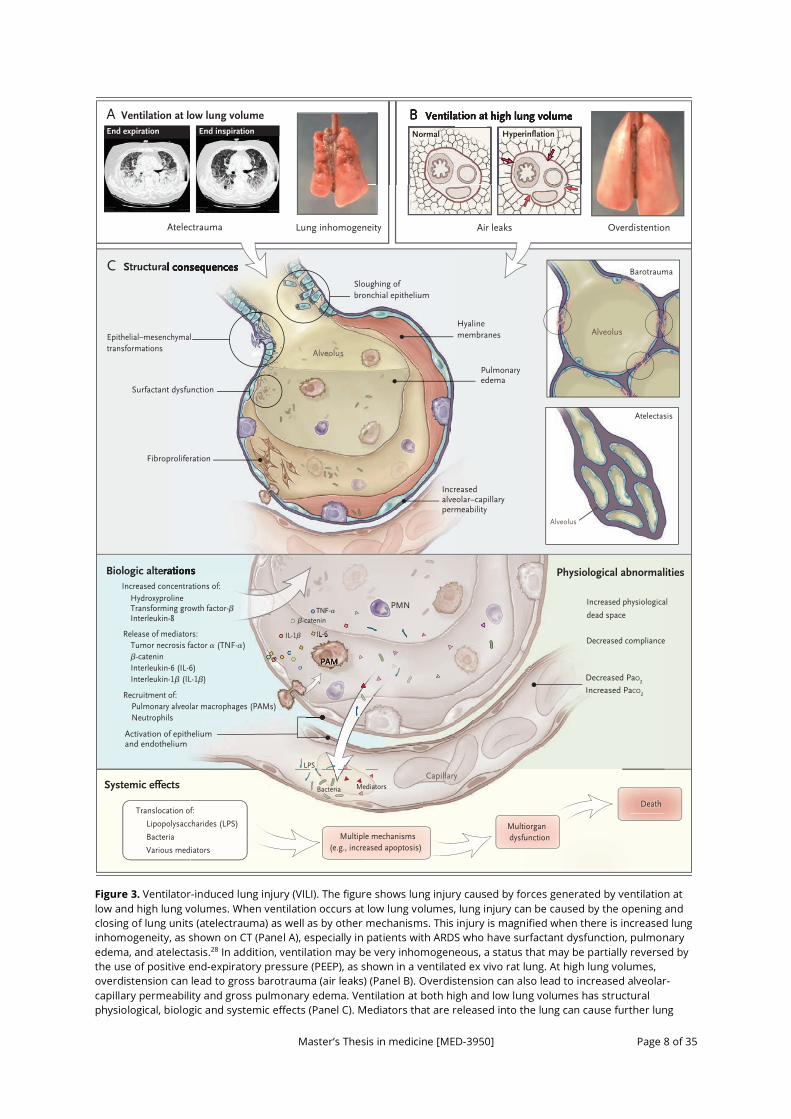
Repetitive opening and closing of small airways during positive pressure ventilation can damage
the airway epithelium by generating excessive shear stress. “Stress” is defined as force per unit of
area. The associated deformation of the structure is called “strain”, which is defined as the
change in size of the lungs. Injurious ventilation affects extracellular matrix and causes
fragmentation of components of lung parenchyma, such as hyaluronic acid, which is a well-
known trigger of Toll-like receptor (TLR) 4. The latter activates transcription factor NF-Кß, which
induces mitochondrial production of cytokines, such as TNF-α. This has the ability to create
damage, not only locally in the lungs, but also in remote organs.25 Thus, changes in ventilation
mechanics can activate mediator release both from epithelial and endothelial cells, matrix
components and inflammatory cells like polymorphonuclear leucocytes and pulmonary
macrophages. This adds still another dimension to the pathophysiological picture of VILI, termed
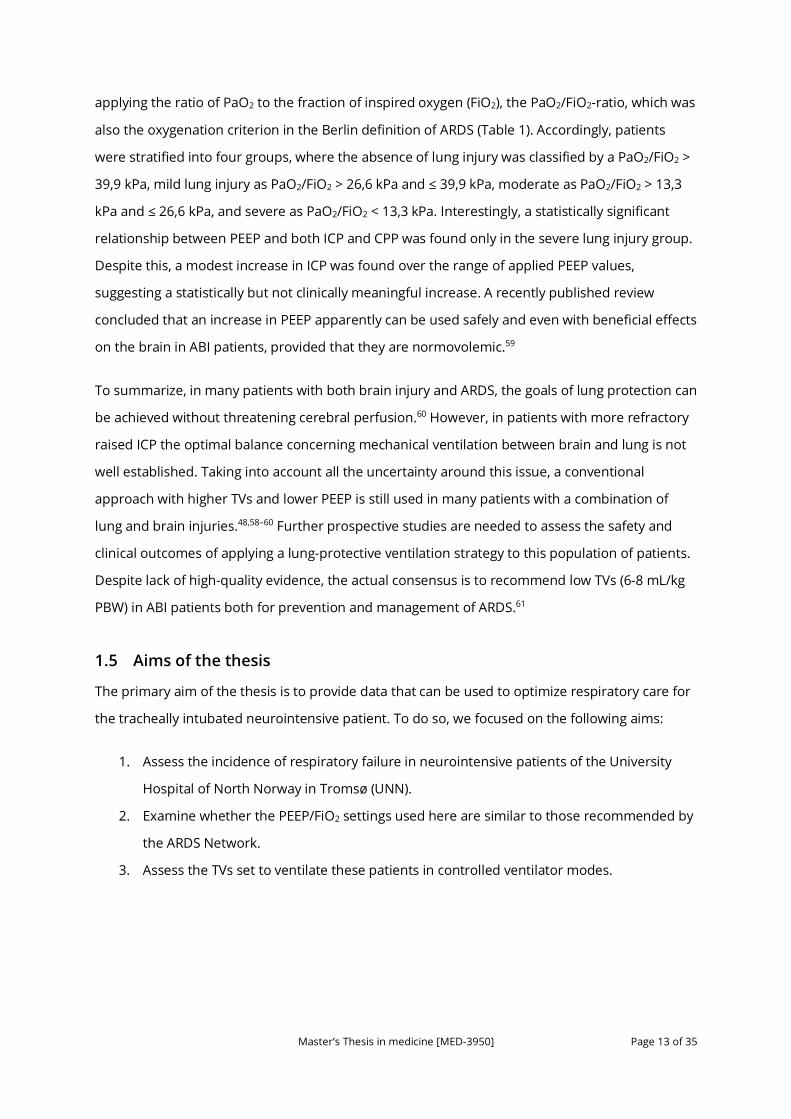
biotrauma (Figure 3).24
1.2.5 Pulmonary complications in the neurointensive patient
Pulmonary complications are very common in patients with ABI. In an observational cohort of 60
Canadian patients with severe TBI, 45% of them developed VAP26—a number far higher than in
the general ICU population.27 The development of VAP was associated with significant morbidity
including a longer duration of mechanical ventilation, longer ICU and hospital length of stay,
more frequent tracheostomy, and a greater severity of non-neurological organ dysfunction. In
Master’s Thesis in medicine [MED-3950] Page 8 of 35
Figure 3. Ventilator-induced lung injury (VILI). The figure shows lung injury caused by forces generated by ventilation at low and high lung volumes. When ventilation occurs at low lung volumes, lung injury can be caused by the opening and closing of lung units (atelectrauma) as well as by other mechanisms. This injury is magnified when there is increased lung inhomogeneity, as shown on CT (Panel A), especially in patients with ARDS who have surfactant dysfunction, pulmonary edema, and atelectasis.28 In addition, ventilation may be very inhomogeneous, a status that may be partially reversed by the use of positive end-expiratory pressure (PEEP), as shown in a ventilated ex vivo rat lung. At high lung volumes, overdistension can lead to gross barotrauma (air leaks) (Panel B). Overdistension can also lead to increased alveolar-capillary permeability and gross pulmonary edema. Ventilation at both high and low lung volumes has structural physiological, biologic and systemic effects (Panel C). Mediators that are released into the lung can cause further lung
Biologic alterations Physiological abnormalities
Systemic effects
C Structural consequences
A Ventilation at low lung volume
Atelectrauma Lung inhomogeneity
B Ventilation at high lung volume
Air leaks Overdistention
Increased physiological
dead space
Biologic alterations
Hydroxyproline Transforming growth factor-β Interleukin-8
Increased concentrations of:
Tumor necrosis factor α (TNF-α) β-catenin Interleukin-6 (IL-6) Interleukin-1β (IL-1β)
Release of mediators:
Decreased PaO2
Increased PaCO2
Activation of epithelium and endothelium
Capillary
Decreased compliance
Recruitment of: Pulmonary alveolar macrophages (PAMs) Neutrophils
PAM
Translocation of:
Lipopolysaccharides (LPS)
Bacteria
Various mediators
Multiple mechanisms (e.g., increased apoptosis)
Multiorgan dysfunction
Death
TNF-α
β-catenin
MediatorsBacteria
IL-6
LPS
IL-1β
Structural consequences
Alveolus
Epithelial–mesenchymal transformations
Surfactant dysfunction
Pulmonaryedema
Increased alveolar–capillarypermeability
Fibroproliferation
Hyaline membranes
Sloughing of bronchial epithelium
Atelectasis
Barotrauma
Alveolus
Alveolus
PAM
IL-6IL-1β
PMN
B Ventilation at high lung volumeVentilation at high lung volumeVentilation at high lung volume
Normal Hyperinflation
CT Image CT Image
End expiration End inspiration
2
11/8/13Draft 7The New England Journal of Medicine
Downloaded from nejm.org at NORWEGIAN INSTITUTE OF PUBLIC HEALTH on May 24, 2018. For personal use only. No other uses without permission. Copyright © 2013 Massachusetts Medical Society. All rights reserved.
Master’s Thesis in medicine [MED-3950] Page 9 of 35
injury, recruit neutrophils to the lung, or set the stage for the development of pulmonary fibrosis. In addition, the increased alveolar-capillary permeability associated with VILI can lead to multiple-organ dysfunction and death. PaCO2 denotes partial pressure of carbon dioxide in arterial blood, PaO2 partial pressure of oxygen in arterial blood and PMN polymorphonuclear leucocytes. Reproduced with permission from Slutsky AS, Ranieri VM. Ventilator-Induced Lung Injury. N Engl J Med. 2013;369(22):2126-2136. Copyright Massachusetts Medical Society.
patients with severe TBI, concomitant thoracic injury, coma upon admission, high injury severity
scores (ISS) and advanced age have all been suggested as risk factors.29
The incidence of ARDS has also been found to be very high in patients with SAH or severe
TBI. Kahn et al. found an incidence of 27% in a retrospective cohort of 620 patients with
aneurysmal SAH,30 and similar figures are also seen in severe TBI.31–33 Based on the Berlin
definition of ARDS, Aisiku et al. found an incidence of 26% in patients with severe TBI,32 and in an
earlier study, development of what was then called ALI resulted in significantly higher mortality,
38% in the ALI group and 15% in the non-ALI group (p = 0,004).31 Patients with ALI had
significantly higher ISS, a greater number of days on the ventilator, and a worse neurologic
outcome for those who survived their hospitalization.
In summary, pulmonary complications occur with high incidences in patients with ABI and
are independent predictors of poor outcome.
1.3 Mechanical ventilation strategies in acute respiratory failure
Mechanical ventilation is an essential part of life support in acute respiratory failure.
Nevertheless, mechanical ventilation may cause or even perpetuate lung injury if alveolar over-
distention and repeated alveolar collapse and re-expansion occurs with each breath (ventilator-
induced lung injury (VILI)).34
Following two landmark randomized controlled trials published around the
millennium,35,36 lung-protective ventilation has been an essential part of ARDS treatment.20 These
trials demonstrated a reduced mortality in patients ventilated with small TVs and low plateau
pressures. The application of PEEP as a means of protecting the lung has also been found to
increase alveolar recruitment and improve oxygenation.37 A systematic review and meta-analysis
published in 2010 by Briel et al. confirmed the significant reduction in mortality associated with
higher PEEP levels compared with lower PEEP levels in ARDS patients without ABI.38 The
mainstays of lung-protective ventilation strategies are therefore (1) to limit TV and driving
pressure; (2) limit end-expiratory plateau pressure (Pplat); and (3) provide adequate PEEP.39 PEEP
improves oxygenation by increasing functional residual capacity; thereby recruiting small airways
and collapsed alveoli and promoting fluid movement from the alveolar to the interstitial space.40
The best current and practice emphasizes lung protective ventilation with a TV target of 6 mL/kg

Master’s Thesis in medicine [MED-3950] Page 10 of 35
PBW in ARDS.41 The rationale for using PBW in these calculations, is that PBW, a calculation based
on body height and sex, rather than actual body weight, better reflects the size of the lung. If
instead TV/kg actual body weight were used, it could produce excessive TVs in obese patients or
inadequate TVs in underweight patients.
The lower PEEP/higher FiO2 strategy of the ARDS Network (Table 2) has been a well-established
protocol since the ALVEOLI study was published in 2004.42 In experimental studies, the so-called
“open lung approach” (OLA) using higher PEEP values has shown promising results suggesting a
reduction in VILI.43 The OLA aims to achieve high levels of lung aeration in patients with ARDS by
first conducting recruitment maneuvers (RMs) to reverse atelectasis and then applying high levels
of PEEP to keep recruited alveoli open. Different RMs are in use, but they typically involve a
ventilatory approach that transiently increases pulmonary airway pressure to reopen recruitable
lung areas. For example, a RM can be conducted by raising inspiratory airway pressures to 50 cm
of H2O for 1 to 2 minutes. Despite promising experimental results, four large randomized trials of
higher PEEP and RMs have failed to demonstrate improved clinical outcomes. The last trial was
published very recently by the Writing Group for the Alveolar Recruitment for Acute Respiratory
Distress Syndrome Trial (ART) Investigators and is the largest trial so far.44 This randomized trial
was conducted in 120 intensive care units from 9 countries and enrolled 1013 patients with
moderate to severe ARDS, 501 to the OLA group and 512 to the low-PEEP strategy. In this trial the
OLA was associated with a significantly higher 28-day mortality and 6-month morality. Thus,
these findings do not support the routine use of lung RMs and PEEP titration in these patients.
Table 2. ARDS Network mechanical ventilation protocol42
Whether a mechanical ventilation strategy with low TVs also should be used in patients without
ARDS is still unclear, but evidence for harm from ventilation with a too large TV is rapidly
Table 2. ARDS Network mechanical ventilation protocol42
Lower PEEP/Higher FiO2
FiO2 0,3 0,4 0,4 0,5 0,5 0,6 0,7 0,7 0,7 0,8 0,9 0,9 0,9 1,0
PEEP (cm H2O) 5 5 8 8 10 10 10 12 14 14 14 16 18 18-24
Higher PEEP/Lower FiO2
FiO2 0,3 0,3 0,3 0,3 0,3 0,4 0,4 0,5 0,5 0,5-0,8 0,8 0,9 1,0 1,0
PEEP (cm H2O) 5 8 10 12 14 14 16 16 18 20 22 22 22 24
Adopted from the ARDS Clinical Network Mechanical Ventilation Protocol.42
Master’s Thesis in medicine [MED-3950] Page 11 of 35
emerging in other patient groups.45 A systematic review and individual patient analysis from 2015
by Neto et al. consisting of 2184 ventilated ICU patients without ARDS, found strong evidence for
a protective effect of ventilation with low TVs.46 Patients treated with TVs ≤7 mL/kg PBW
developed significantly less pulmonary complications, and the analysis suggested a dose-
response relationship between TV size and development of pulmonary complications.
Development of pulmonary complications was also associated with a lower number of ICU-free
and hospital-free days and alive at day 28 and an increased mortality.
1.4 Mechanical ventilation strategies in ABI
1.4.1 Role of mechanical ventilation in ABI
Due to coma, mechanical ventilation is a lifesaving measure in brain-damaged patients. Patients
with severe brain injuries are at risk of pulmonary aspiration or compromised respiratory drive
and function and therefore require definitive airway protection.18 As other patients on
mechanical ventilation, patients with ABI are also at risk of developing VILI. Therefore, absence of
a lung-protective mechanical ventilation strategy would constitute an additional traumatic factor
to the already injured or injury-susceptible lungs of these patients.47
As already mentioned, hypoxemia is known to induce secondary brain injury, and is therefore
essential to prevent in ABI. This relationship was found in a study by Chesnut et al. where both
hypoxemia and hypotension were found to independently contribute to significant increases in
morbidity and mortality.3 Furthermore, therapeutic hyperoxia has not been shown to improve
outcome in patients with neurologic injury and is currently not recommended.48 Careful control
of partial pressure of oxygen in arterial blood (PaO2) is therefore required.
Under normal conditions, partial pressure of carbon dioxide in arterial blood (PaCO2) is the most
powerful determinant of cerebral blood flow (CBF).18 Normal PaCO2 values range from 4,7-6,0
kPa, and within the physiological range (2,7-8,0 kPa), the relationship between PaCO2 and CBF is
linear.49 Low PaCO2 values are known to induce cerebral vasoconstriction, while high PaCO2
values may induce cerebral vasodilation. CBF is important in meeting metabolic demands of the
brain. Accordingly, tight control of PaCO2 is an essential part of mechanical ventilation in ABI. In a
prospective intervention study enrolling 30 patients with head injury and 10 healthy volunteers,
Coles et al. demonstrated that patients treated with hyperventilation, and hence hypocapnia,
showed higher ischemia brain volume compared to controls.50 This was caused by a reduction in
CBF and resulted in an increase of oxygen extraction fraction. Hypercapnia should also be
avoided as it may result in cerebral hyperemia and high ICP. Cerebral herniation may require
Master’s Thesis in medicine [MED-3950] Page 12 of 35
transient hyperventilation to relieve fatal ICP values, but current guidelines do not support
prolonged prophylactic hyperventilation.18
1.4.2 Relationship between ventilator settings and ICP
Intracranial pressure (ICP) is the limiting factor of cerebral perfusion pressure (CPP) and
consequently of cerebral blood flow. CPP is defined as the difference between mean arterial
pressure (MAP) and ICP:
CPP = MAP – ICP
Lung-protective ventilation strategies with low TVs have been widely adopted, and have been
suggested for all ICU patients.51 But protection of the lung may not result in protection of the
brain. Low TVs may cause a rise in PaCO2, which is accepted in non-brain-injured patients as long
as the arterial pH does not fall below 7,30.22 This strategy is known as permissive hypercapnia, but
as we have seen, such a strategy in brain-injured patients may increase CBF and ICP. Therefore,
choosing the optimal mechanical ventilation strategy in the brain-injured patient remains a
challenge to the clinician. That being said, a lung-protective ventilation strategy has been found
to be an independent predictor of favorable outcome in brain-damaged patients.52
Theoretically, application of PEEP has been thought to increase ICP and thereby lower CPP by
increasing the intrathoracic pressure and hence reducing the venous drainage.53 This
relationship has not been subject to extensive research in humans, and so far, studies have
yielded conflicting results.54–56 However, it should be taken into consideration that most of the
early studies comprise rather small sample sizes, ranging from 7 to 16 patients. Therefore,
caution should be taken when generalizing from these studies. Nevertheless, due to uncertainty
concerning the safety of PEEP, mechanical ventilation of patients with ABI traditionally has been
applied with great care. This category of patients usually have been excluded from trials
examining the effect of lung protective ventilation in ARDS because of the potential adverse
effect on ICP.57 In these patients, Pelosi et al. found that clinicians often institute a ventilation
strategy that utilizes larger TVs and lower levels of PEEP as compared to patients without
neurologic injury.58
A well-designed observational study addressing this special issue was published very recently by
Boone et al.57 This study also constituted the largest analysis of the relationship between PEEP
and ICP in the medical literature as yet. Data were collected retrospectively from 341 patients
with severe ABI and varying categories of acute lung injury. Severity of lung injury was defined by
Master’s Thesis in medicine [MED-3950] Page 13 of 35
applying the ratio of PaO2 to the fraction of inspired oxygen (FiO2), the PaO2/FiO2-ratio, which was
also the oxygenation criterion in the Berlin definition of ARDS (Table 1). Accordingly, patients
were stratified into four groups, where the absence of lung injury was classified by a PaO2/FiO2 >
39,9 kPa, mild lung injury as PaO2/FiO2 > 26,6 kPa and ≤ 39,9 kPa, moderate as PaO2/FiO2 > 13,3
kPa and ≤ 26,6 kPa, and severe as PaO2/FiO2 < 13,3 kPa. Interestingly, a statistically significant
relationship between PEEP and both ICP and CPP was found only in the severe lung injury group.
Despite this, a modest increase in ICP was found over the range of applied PEEP values,
suggesting a statistically but not clinically meaningful increase. A recently published review
concluded that an increase in PEEP apparently can be used safely and even with beneficial effects
on the brain in ABI patients, provided that they are normovolemic.59
To summarize, in many patients with both brain injury and ARDS, the goals of lung protection can
be achieved without threatening cerebral perfusion.60 However, in patients with more refractory
raised ICP the optimal balance concerning mechanical ventilation between brain and lung is not
well established. Taking into account all the uncertainty around this issue, a conventional
approach with higher TVs and lower PEEP is still used in many patients with a combination of
lung and brain injuries.48,58–60 Further prospective studies are needed to assess the safety and
clinical outcomes of applying a lung-protective ventilation strategy to this population of patients.
Despite lack of high-quality evidence, the actual consensus is to recommend low TVs (6-8 mL/kg
PBW) in ABI patients both for prevention and management of ARDS.61
1.5 Aims of the thesis
The primary aim of the thesis is to provide data that can be used to optimize respiratory care for
the tracheally intubated neurointensive patient. To do so, we focused on the following aims:
1. Assess the incidence of respiratory failure in neurointensive patients of the University
Hospital of North Norway in Tromsø (UNN).
2. Examine whether the PEEP/FiO2 settings used here are similar to those recommended by
the ARDS Network.
3. Assess the TVs set to ventilate these patients in controlled ventilator modes.

Master’s Thesis in medicine [MED-3950] Page 14 of 35
2 Materials and methods
2.1 Study design and population
The study was designed and conducted as a retrospective case observation study of
neurointensive patients. Tracheally intubated patients with acute traumatic brain injury (TBI) and
subarachnoid hemorrhage (SAH) admitted to the ICU of the University Hospital of North Norway
in Tromsø (UNN) between the 1st of January and the 31st of December 2016 were included. Some
of the patients were transferred to or from intensive care units of community hospitals within an
up-take area stretching itself from Mosjøen in the South to Longyearbyen on Spitsbergen Islands
in the North. However, only data from their stay in the ICU of UNN were collected.
2.2 Data collection
Data were collected by accessing the patients’ electronic health records at UNN. Clinical and
ventilator variables were found in handwritten and scanned ICU charts, while other clinical data
were identified by going through medical records and x-ray data. All necessary clinical variables
and documentation from admission to discharge from the ICU were collected. Some notes from
different prehospital care providers notes were also read to assess TBI severity based on
Glasgow come scale (GCS) values. The data collection procedure of clinical and ventilator
variables was conducted as follows:
TV, ventilator mode, PaO2, FiO2 and PEEP values 3 hours after admission to the ICU were
collected. Subsequently, TV and ventilator mode from every 12 hours of the stay were noted. To
find the lowest PaO2/FiO2-ratio in the course of the day, the lowest PaO2 value that day was first
identified. The PEEP value used at the highest FiO2 during every day was also collected.
In addition to the latter variables, the lowest oxygen saturation value determined with the pulse
oximeter (SpO2) as well as MAP, ICP and CPP in the course of a day were noted. Correspondingly,
respiratory rate and ventilator pressures such as peak inspiratory pressure, plateau pressure and
driving pressure were noted at fixed intervals every 12 hours. Rough estimates on length of ICU
stay and days on ventilator were based on intensive care charts.
Respiratory failure was defined as any pulmonary complication during the ICU stay. Clinical
diagnosis of pulmonary complications was identified through medical record and x-ray data. In
addition, severity of lung injury was classified by PaO2/FiO2-ratio as done in the aforementioned
study by Boone et al.57 Here, the oxygenation criterion of the Berlin definition of ARDS (Table 1)
Master’s Thesis in medicine [MED-3950] Page 15 of 35
was applied in all patients, independent of whether the patient was diagnosed with ARDS or not.
Classifying patients this way serves to quantify the degree of oxygenation failure. Accordingly, the
absence of lung injury was classified by a PaO2/FiO2 >39,9 kPa, mild lung injury as PaO2/FiO2
>26,6 and ≤39,9 kPa, moderate as PaO2/FiO2 >13,3 and ≤26,6 kPa, and severe as PaO2/FiO2
<13,3 kPa. Patients with at least one PaO2/FiO2 value >26,6 and ≤39,9 kPa were therefore
classified as having developed mild lung injury independent of clinical diagnosis found in medical
notes. Accordingly, patients with at least one PaO2/FiO2 value >13,3 and ≤26,6 kPa were
classified as having developed moderate lung injury, and so forth.
Concerning PEEP values, we were interested in identifying PEEP values that were too low
for a given FiO2 value, as these are the clinically important values to identify. The ARDS Network
recommendation for PEEP/FiO2 settings, which was also reflected in our established protocol,
was used as a golden standard (Table 2).42
TVs were divided both by actual body weight and predicted body weight (PBW).
Prior to commencing data collection, the project was accepted by the Data Protection Official at
UNN.
2.3 Data analysis and statistics
Data are presented as mean ± SD and proportions using descriptive statistical methods. The
analyses were performed using SPSS for Mac, version 25 (IBM Corporation, Armonk, NY) and
Microsoft Excel for Mac, version 16.13 (Microsoft Corporation, Redmond, WA).

Master’s Thesis in medicine [MED-3950] Page 16 of 35
3 Results Table 3. Patient characteristics 3.1 Patients
Eighteen patients with SAH and 12
patients with TBI were included in
the study. Patient characteristics
are described in Table 3. Patients
with TBI were subclassified into
groups of TBI severity based on
GCS values before tracheal
intubation.12 Of all TBI patients
included, 17% of them were
classified as having mild TBI, 33%
as having moderate TBI and 50%
as having severe TBI. Ten (56%)
patients with SAH and 1 (8%)
patient with TBI died during the
stay at UNN or were transferred to
their local hospital for terminal
care.
Data on body height were only
found in 17 (57%) of the patients.
Consequently, in nearly half of the
patients, we were unable to
calculate PBW. The calculations of
the length of ICU stay and days on
ventilator are rough estimates
based on intensive care charts.
3.2 Incidence of
respiratory failure
In the group of patients with TBI, 4 (33% had developed acute pulmonary complications in the
prehospital setting. Two patients were diagnosed with small traumatic pneumothorax, one
Table 3. Patient characteristics
Age at admission, mean (SD), y
SAH patients
TBI patients
52,6 (18,3)
55,4 (16,4)
48,3 (20,9)
Women, No. (%)
SAH patients
TBI patients
18 (60%)
14 (78%)
4 (22%)
Diagnosis, No. (%)
SAH
TBI
Mild TBI (GCS 13-15)
Moderate TBI (GCS 9-13)
Severe TBI (GCS ≤8)
18 (60%)
12 (40%)
2 (17%)
4 (33%)
6 (50%)
Mortality during hospitalisation, No. (%)
SAH patients
TBI patients
11 (37%)
10 (56%)
1 (8%)
Body weight, mean (SD), kg
Actual body weight (n=28 (93%))
Predicted body weight (PBW)a (n=17 (57%))
77,0 (20,1)
63,4 (10,9)
Length of ICU stay, mean (SD), days
SAH patients
TBI patients
6,2 (7,2)
4,2 (5,1)
9,1 (8,9)
Ventilator days, mean (SD)
SAH patients
TBI patients
5,4 (6,7)
3,6 (4,9)
8,1 (8,1)
Abbreviations: SD, standard deviation; SAH, subarachnoid hemorrhage; TBI, traumatic brain injury; ICU, intensive care unit. aPredicted body weight of male patients was calculated as equal to 50+0.91(centimeters of height–152.4); that of female patients was calculated as equal to 45.5+0.91(centimeters of height–152.4).36

Master’s Thesis in medicine [MED-3950] Page 17 of 35
patient was diagnosed with pulmonary contusion, and one patient with both pneumo- and
hemothorax in addition to pulmonary contusion. Apart from these four patients, none of the
other patients were diagnosed with any acute pulmonary complications on admission.
Figure 4. Clinical diagnosis of pulmonary complications during the stay in the ICU.
The number of patients diagnosed with different pulmonary complications during their stay in
the ICU is shown in Figure 4. Of all the patients, 16 (53%) were diagnosed with any pulmonary
complication. Twelve patients (40%) were diagnosed either with pneumonia or were suspected to
have developed pneumonia. Seven patients (23%) were diagnosed with atelectasis, while one
patient (3%) had a pleural effusion. Comprising a smaller number of patients, pulmonary
complications were observed in 67% of patients with TBI versus 44% of patients with SAH.
Five patients (17%) displayed both pneumonia and other pulmonary complications such as
atelectasis and pleural effusion. A patient who developed both pneumonia and atelectasis
therefore was included both in the number of patients with pneumonia and in the number of
patients with atelectasis. Fourteen patients (47%) were not diagnosed with any pulmonary
complication during their stay in the ICU at UNN.
Independent of clinical diagnosis of pulmonary complications, severity of lung injury was also
classified by applying the lowest PaO2/FiO2 ratio registered during the stay. The result of this
classification is shown in Figure 5.
6
3
6
4
10
2
4
6
8
10
12
14
P N E U M O N I A O R S U S P E C T E D P N E U M O N I A
A T E L E C T A S I S P L E U R A L E F F U S I O N
CLINICAL DIAGNOSIS OF PULMONARY COMPLICATIONS
SAH patients TBI patients

Master’s Thesis in medicine [MED-3950] Page 18 of 35
Figure 5. Severity of lung injury. Absence of lung injury was classified by a PaO2/FiO2 >39,9 kPa, mild lung injury as PaO2/FiO2 >26,6 and ≤39,9 kPa, moderate as PaO2/FiO2 >13,3 and ≤26,6 kPa, and severe as PaO2/FiO2 <13,3 kPa.
Of all the patients, 25 (83%) of them were registred with a PaO2/FiO2 ratio below 39,9 kPa at least
once during their stay in the ICU. Consequently, only 5 patients (17%), all belonging to the SAH
group, had PaO2/FiO2 ratios exclusively >39,9 kPa. Mild lung injury was found in 17 patients (57%),
more frequently in the TBI group (75%) than in the SAH group (44%). Moderate lung injury was
found in 7 patients (23%). We suspected one patient of having pneumonia, who was later
classified with severe lung injury due to a PaO2/FiO2 ratio <13,3 kPa. Of all the 7 patients we
classified as having moderate lung injury, 3 (43%) of them suffered from pneumonia. We
suspected one patient of both pneumonia and atelectasis combined, and one patient to have
atelectasis only. In the moderate lung injury group, one patient died within one day of admission,
but the clinical diagnosis of the respiratory failure was not made.
3.3 PEEP values
Compared to the ARDS Network recommendation for PEEP/FiO2 settings, too low PEEP values for
a given FiO2 were identified in 6 (20%) of the patients. Of all the collected PEEP values, only 11 of
them (5,6%) were found to be too low for the given FiO2 value. The distribution of all collected
FiO2 values is shown in Figure 6. A relatively small proportion of collected FiO2 values were in the
higher ranges. Totally, we found 14,9% between 0,4 and 0,49 and 6,9% >0,5, respectively.
5
8
4
1
9
3
0
2
4
6
8
10
12
14
16
18
N O L U N G I N J U R Y M I L D L U N G I N J U R Y M O D E R A T E L U N G I N J U R Y
S E V E R E L U N G I N J U R Y
SEVERITY OF LUNG INJURY
SAH patients TBI patients
Master’s Thesis in medicine [MED-3950] Page 19 of 35
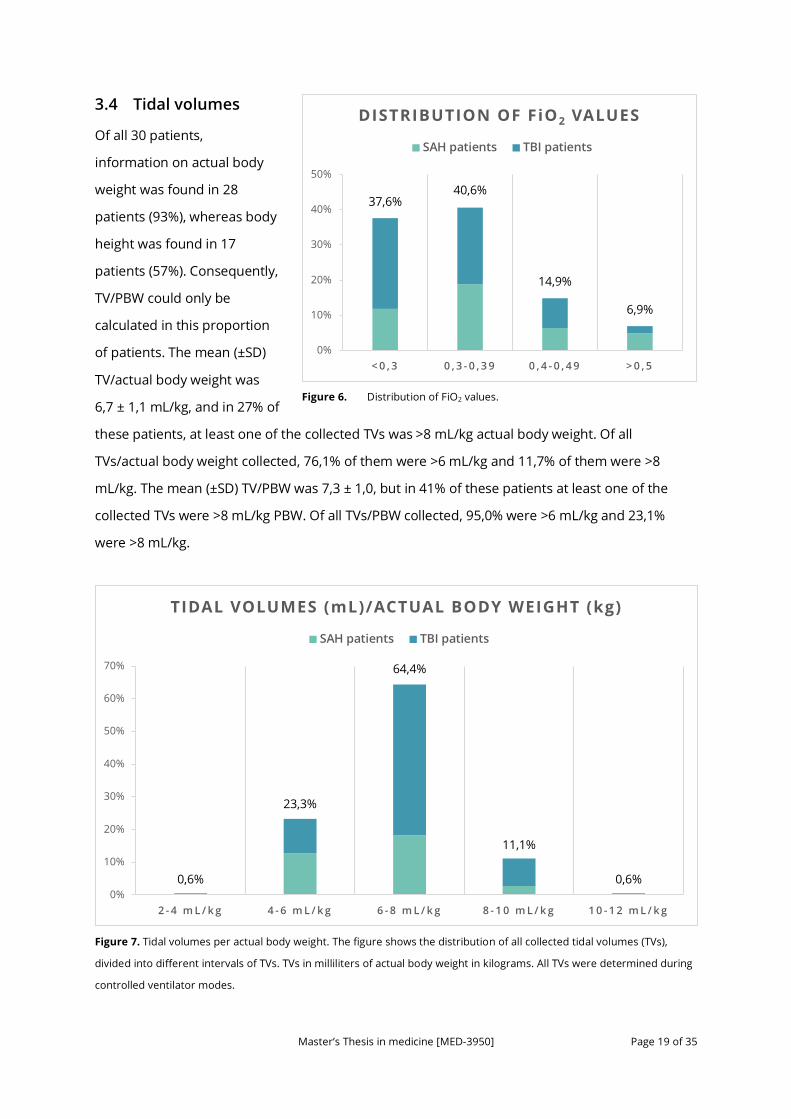
3.4 Tidal volumes
Of all 30 patients,
information on actual body
weight was found in 28
patients (93%), whereas body
height was found in 17
patients (57%). Consequently,
TV/PBW could only be
calculated in this proportion
of patients. The mean (±SD)
TV/actual body weight was
6,7 ± 1,1 mL/kg, and in 27% of
these patients, at least one of the collected TVs was >8 mL/kg actual body weight. Of all
TVs/actual body weight collected, 76,1% of them were >6 mL/kg and 11,7% of them were >8
mL/kg. The mean (±SD) TV/PBW was 7,3 ± 1,0, but in 41% of these patients at least one of the
collected TVs were >8 mL/kg PBW. Of all TVs/PBW collected, 95,0% were >6 mL/kg and 23,1%
were >8 mL/kg. Figure 6. Distrib uti on of FiO2 valu es
Figure 7. Tidal volumes per actual body weight. The figure shows the distribution of all collected tidal volumes (TVs),
divided into different intervals of TVs. TVs in milliliters of actual body weight in kilograms. All TVs were determined during
controlled ventilator modes.
Figure 6. Distribution of FiO 2 v aluesDistribution of FiO2 values.
37,6%40,6%
14,9%
6,9%
0%
10%
20%
30%
40%
50%
< 0 , 3 0 , 3 - 0 , 3 9 0 , 4 - 0 , 4 9 > 0 , 5
DISTRIBUTION OF FiO2 VALUES
SAH patients TBI patients
0,60% 0,60%0,6%
23,3%
64,4%
11,1%
0,6%0%
10%
20%
30%
40%
50%
60%
70%
2 - 4 m L / k g 4 - 6 m L / k g 6 - 8 m L / k g 8 - 1 0 m L / k g 1 0 - 1 2 m L / k g
TIDAL VOLUMES (mL)/ACTUAL BODY WEIGHT (kg)
SAH patients TBI patients
Master’s Thesis in medicine [MED-3950] Page 20 of 35
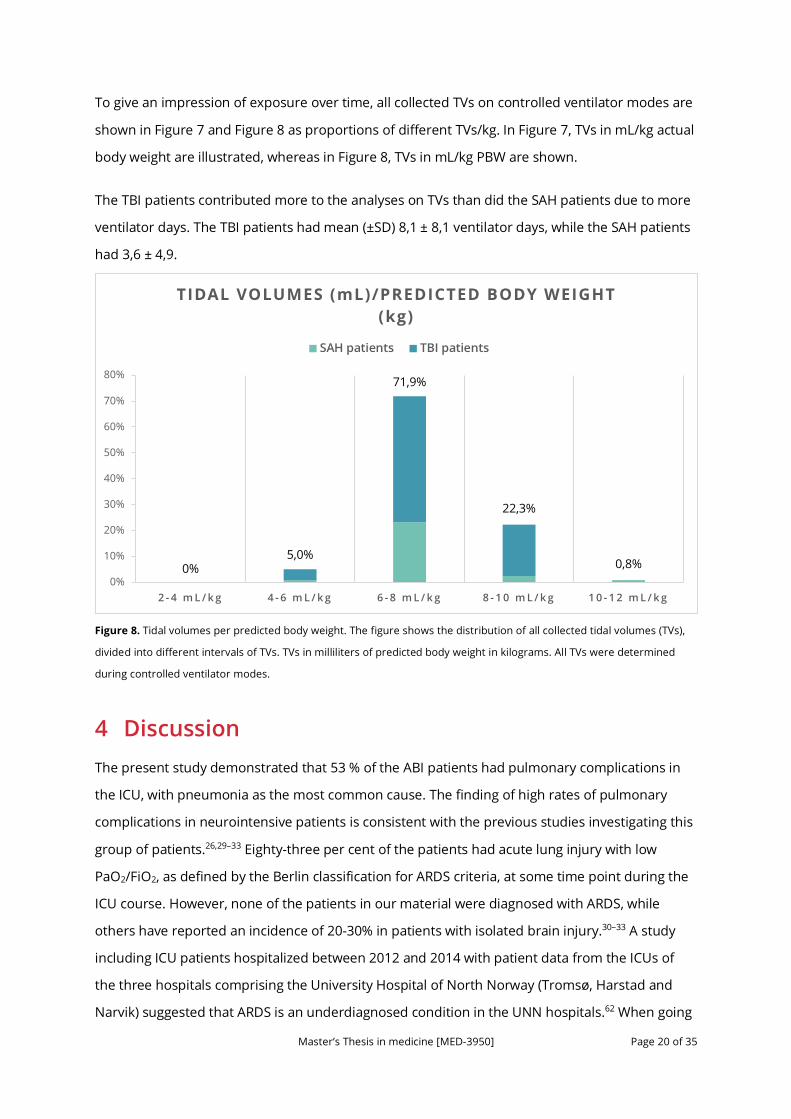
To give an impression of exposure over time, all collected TVs on controlled ventilator modes are
shown in Figure 7 and Figure 8 as proportions of different TVs/kg. In Figure 7, TVs in mL/kg actual
body weight are illustrated, whereas in Figure 8, TVs in mL/kg PBW are shown.
The TBI patients contributed more to the analyses on TVs than did the SAH patients due to more
ventilator days. The TBI patients had mean (±SD) 8,1 ± 8,1 ventilator days, while the SAH patients
had 3,6 ± 4,9.
Figure 8. Tidal volumes per predicted body weight. The figure shows the distribution of all collected tidal volumes (TVs),
divided into different intervals of TVs. TVs in milliliters of predicted body weight in kilograms. All TVs were determined
during controlled ventilator modes.
4 Discussion The present study demonstrated that 53 % of the ABI patients had pulmonary complications in
the ICU, with pneumonia as the most common cause. The finding of high rates of pulmonary
complications in neurointensive patients is consistent with the previous studies investigating this
group of patients.26,29–33 Eighty-three per cent of the patients had acute lung injury with low
PaO2/FiO2, as defined by the Berlin classification for ARDS criteria, at some time point during the
ICU course. However, none of the patients in our material were diagnosed with ARDS, while
others have reported an incidence of 20-30% in patients with isolated brain injury.30–33 A study
including ICU patients hospitalized between 2012 and 2014 with patient data from the ICUs of
the three hospitals comprising the University Hospital of North Norway (Tromsø, Harstad and
Narvik) suggested that ARDS is an underdiagnosed condition in the UNN hospitals.62 When going
0,00% 0,80%0%5,0%
71,9%
22,3%
0,8%0%
10%
20%
30%
40%
50%
60%
70%
80%
2 - 4 m L / k g 4 - 6 m L / k g 6 - 8 m L / k g 8 - 1 0 m L / k g 1 0 - 1 2 m L / k g
TIDAL VOLUMES (mL)/PREDICTED BODY WEIGHT (kg)
SAH patients TBI patients
Master’s Thesis in medicine [MED-3950] Page 21 of 35
through x-ray data and clinical documentation of the patients included, none of them were found
to meet all the criteria in the Berlin definition of ARDS, specifically bilateral opacities on chest
imaging. The short inclusion time might represent the most likely explanation for fewer patients
diagnosed with ARDS in our study as compared with the corresponding results of larger studies.
When considering the PEEP/FiO2 settings observed, it is close at mind to take a closer a look at
the distribution of all collected FiO2 values (Figure 6). Only a small portion of the patients in our
material needed FiO2 values > 0,4. This study could therefore not demonstrate many PEEP/FiO2
ratios different from the ARDS Network recommendations for PEEP/FiO2 settings as presented in
Table 2. Consequently, based on these results, no conclusions can be drawn with respect to our
second aim regarding the PEEP/FiO2 settings. Other studies, though, have described low PEEP in
ABI, even in the presence of acute respiratory failure. Pelosi et al. conducted a study comparing
552 mechanically ventilated patients with 4030 mixed patients who were ventilated for non-
neurologic reasons.58 They found that more than 80% of the neurologic patients were ventilated
with a PEEP of ≤ 5 cm H2O, despite the fact that a PEEP level of 5 cm H2O generally is considered
the minimum PEEP level during invasive mechanical ventilation.45
Concerning TVs, we were only able to calculate TV/PBW in 57% of the patients as information on
body height was missing in nearly half of the patients. This may indicate that in many of the
patients, the chosen TV was set based on other variables than PBW. This contrasts the
recommendation that TVs be set on the basis of PBW because lung size correlate better with
body height and sex than actual body weight. Furthermore, the studies investigating the optimal
TV in ARDS and other causes of respiratory failure have used TV calculations applying PBW.35,36,46
Whether body height and PBW was actually assessed and accounted for without writing it down
is not known. We can only ascertain that in nearly half of the patients, information on body
height was neither found in the ICU chart, the medication chart nor anywhere else in the medical
record. In some patients, data on body height was only found by looking at medication charts
related to a different admission. If the patient’s PBW and corresponding TVs were actually written
on the intensive care chart, that could enhance attention to TVs/PBW. As an example, a 183 cm
high man would have a PBW of 77,8 kg. The corresponding TV at 6 mL/PBW is 467 mL, while it is
623 mL at a level of 8 mL/PBW. During the work with this thesis, the team at MDCalc, an online
medical calculator, was contacted to request the PBW calculator to be included in the collection
of available calculators. The MDCalc calculator is available both online at mdcalc.com and as a
smartphone app, and is considered the by far most popular online medical calculator.63 The PBW
calculator, if added, would make calculations on PBW easier in a busy clinical practice without

Master’s Thesis in medicine [MED-3950] Page 22 of 35
having to find the actual formula.
In 41% of the patients where calculations on PBW could be made, at least one of the
collected TVs were >8 mL/kg PBW. Of all TVs/PBW collected, 95,0% of the values were >6 mL/kg
and 23,1% were >8 mL/kg. This is not surprising, as the conventional ventilation strategy in
patients with ABI uses higher TVs than in non-neurologic patients, and since achievement of
desirable PaCO2 values may be challenging using small TVs.48,59,60 There is a discussion whether
all patients receiving mechanical ventilation should receive low TVs around 6 mL/kg PBW. A 2012
meta-analysis synthesizing data from 20 studies involving almost 3000 patients without ARDS
found large risk ratios (RRs) favoring lower TVs in terms of lung injury development (RR, 0,33; 95%
CI, 0,23-0,47), pulmonary infection (RR, 0,45; 95% CI, 0,22-0,92), and mortality (RR, 0,64; 95% CI,
0,46-0,98).64 Although these results seem compelling, they must be interpreted with caution. Of
the 20 studies included in the meta-analysis, 5 of them were observational (in which inferences of
causality may be problematic) and accounted for approximately 85% of both the total number of
patients and events in the primary analysis of lung injury prevention.51 Moreover, the
randomized trials included had limitations related to quality and many of them focused on short-
term intraoperative ventilation during anesthesia. Generalizability to other clinical situations may
therefore be poor. In summary, these findings are not definitive, but rather hypothesis
generating and support the need to conduct large randomized trials.
Observational data have found a lung-protective ventilation strategy to be an independent
predictor of favorable outcome in brain-damaged patients.52 But the safety and efficacy of a lung-
protective ventilation strategy in patients with ABI also need to be assessed through randomized
trials. The medical literature has many examples in which physiological rationale, meta-analyses
of small or low-quality studies, or both suggested benefit followed by large trials that refuted
these findings or even showed harm.51 An example of this is steroids for TBI, which had been
used to treat head injuries for more than 30 years prior to the so-called CRASH trial.65 In that
large trial enrolling 10 008 adults with head injury, patient recruitment had to be stopped as
there was seen an increased mortality in the corticosteroid arm.
Future trials also need to address the safety of PEEP in patients with ABI, and how PEEP
affect ICP. In addition, factors contributing to the high number of patients with ABI developing
pulmonary complications need to be further explored, and preventing factors need to be
elucidated.

Master’s Thesis in medicine [MED-3950] Page 23 of 35
4.1 Limitations
This study comprises a small group of patients from only one center covering a short time span.
In addition, retrospective studies like this have inherent limitations concerning evidence quality.
Consequently, reliable conclusions cannot be drawn from this study alone.
A major limitation of the analyses of PEEP values is the data collection procedure, which
consisted in reading scanned handwritten hospital charts. Therefore, these results should be
interpreted with caution. As the primary focus of the data collection was to identify the lowest
PaO2/FiO2 ratio during the course of the day, the lowest PaO2 value was first identified, and
subsequently the corresponding FiO2 value was noted. The PEEP value identified was the PEEP
value at the highest FiO2 throughout the day, and not necessarily the same FiO2 value as noticed
in the former step. Accordingly, some of the PEEP values do not correspond in time to the FiO2
values. In retrospect, we would maybe have identified even lower PaO2/FiO2 ratios by collecting
these values the other way around, i.e. by first identifying the highest FiO2 value and then
calculating the PaO2/FiO2 ratio by using the corresponding PaO2 value. Then we would also be
certain that the PEEP value at the highest FiO2 value during the day corresponded in time. All in
all, this seems like a better approach. That being said, the analyses on PEEP values are not totally
in vain. The observed PEEP values on the ICU charts were generally set to the same value
throughout the day, so the probability that the PEEP and FiO2 values after all do correspond in
time, is high.
Another limitation of the data collection procedure is the manual punching of data from
handwritten ICU charts. This procedure could perhaps cause errors in the data set that were not
detected. Moreover, some of the handwritten numbers were not easy to interpret, constituting
an additional source of potential errors. The fact that TVs only were collected for every 12 hours
and other variables only once during the course of a day imply that our data are snapshots of all
the actual variables used throughout the ICU stay. Consequently, we cannot be certain that the
distribution of observed FiO2 values shown in Figure 6 and the distribution of TVs in Figure 7 and
Figure 8 actually represent the true distribution. Nonetheless, it is plausible to presume that the
true distribution lies close to the observed distribution through the snapshots of our material.
The time-consuming data collection procedure related to this study underlines the potential of a
digitalized intensive care chart, where study variables more easily can be extracted and analyzed.
That would have made both data collection and conduction of studies as a whole more feasible.

Master’s Thesis in medicine [MED-3950] Page 24 of 35
The inclusion of patients was based on a list provided by the ICU staff. This list was supposed to
include all patients with ABI admitted to the ICU of UNN Tromsø, but by using this method, it is
conceivable that some patients that should have been included were not identified.
Another limitation of this study is that we were not able to draw any conclusions with regard to
causality between ventilator settings and pulmonary complications. This is both due to the small
number of patients included and the observational nature of the study.
5 Conclusion This study found a high incidence of pulmonary complications in ICU patients with ABI, with
pneumonia as the most common cause. This finding is consistent with other studies investigating
this group of patients. None of the patients in our material were diagnosed with ARDS. The short
inclusion time and the low number of patients included representing the most likely explanations
for this finding. The mean (±SD) TV/actual body weight (n=28) was 6,7 ± 1,1 mL/kg, while the
mean (±SD) TV/PBW (n=17) was 7,3 ± 1,0. Data on body height could only be found in 57% of the
patients, implicating that TVs were set based on other variables than PBW in nearly half of the
patients. Randomized trials assessing the safety and efficacy of low TVs and PEEP ventilation in
ABI are warranted.
Master’s Thesis in medicine [MED-3950] Page 25 of 35
6 References 1. Pelosi P, Severgnini P, Chiaranda M. An integrated approach to prevent and treat
respiratory failure in brain-injured patients. Curr Opin Crit Care. 2005;11(1):37-42.
2. Borsellino B, Schultz MJ, Gama de Abreu M, Robba C, Bilotta F. Mechanical ventilation in neurocritical care patients: a systematic literature review. Expert Rev Respir Med. 2016;10(10):1123-1132. doi:10.1080/17476348.2017.1235976
3. Chesnut RM, Marshall LF, Klauber MR, et al. The role of secondary brain injury in determining outcome from severe head injury. J Trauma. 1993;34(2):216-222. http://europepmc.org/abstract/MED/8459458.
4. Johnston SC, Selvin S, Gress DR. The burden, trends, mortality from and demographics of subarachnoid hemorrhage. Neurology. 1998;50:1413-1418.
5. Lawton MT, Vates GE. Subarachnoid hemorrhage. N Engl J Med. 2017;377(3):257-266. doi:10.1056/NEJMcp1605827
6. De Rooij NK, Linn FHH, Van Der Plas JA, Algra A, Rinkel GJE. Incidence of subarachnoid haemorrhage: A systematic review with emphasis on region, age, gender and time trends. J Neurol Neurosurg Psychiatry. 2007;78(12):1365-1372. doi:10.1136/jnnp.2007.117655
7. Sandvei MS, Mathiesen EB, Vatten LJ, et al. Incidence and mortality of aneurysmal subarachnoid hemorrhage in two Norwegian cohorts, 1984-2007. Neurology. 2011;77(20):1833-1839. doi:10.1212/WNL.0b013e3182377de3
8. Macdonald RL, Schweizer TA. Spontaneous subarachnoid haemorrhage. Lancet. 2017;389(10069):655-666. doi:10.1016/S0140-6736(16)30668-7
9. Lucke-Wold BP, Logsdon AF, Manoranjan B, et al. Aneurysmal subarachnoid hemorrhage and neuroinflammation: A comprehensive review. Int J Mol Sci. 2016;17(4):1-17. doi:10.3390/ijms17040497
10. Hackett ML, Anderson CS. Health outcomes 1 year after subarachnoid hemorrhage: An international population-based study. The Australian Cooperative Research on Subarachnoid Hemorrhage Study Group. Neurology. 2000;55:658-662.
11. Maas AI, Stocchetti N, Bullock R. Moderate and severe traumatic brain injury in adults. Lancet Neurol. 2008;7(8):728-741. doi:10.1016/S1474-4422(08)70164-9
12. Ghajar J. Traumatic brain injury. Lancet. 2000;356(9233):923-929. doi:10.1016/S0140-6736(00)02689-1
13. Ingebrigtsen T, Romner B, Kock-Jensen C. Scandinavian guidelines for initial management of minimal, mild, and moderate head injuries. J Trauma. 2000;48(4):760-766. doi:10.1097/00005373-200004000-00029
14. Dinsmore J. Traumatic brain injury: an evidence-based review of management. Contin Educ Anaesthesia, Crit Care Pain. 2013;13(6):189-195. doi:10.1093/bjaceaccp/mkt010
15. Dombovy ML. Traumatic brain injury. Contin Lifelong Learn Neurol. 2011;17(3):584-605.
Master’s Thesis in medicine [MED-3950] Page 26 of 35
doi:10.1212/01.CON.0000399074.07686.76
16. Undén J, Ingebrigtsen T, Romner B, Committee N. Scandinavian guidelines for initial management of minimal , mild and moderate head injuries in adults : an evidence and consensus-based update Scandinavian guidelines for initial management of minimal , mild and moderate head injuries in adults : an evide. BMC Med. 2013;11(1):50. doi:10.1186/1741-7015-11-50
17. Astrand R, Rosenlund C, Undén J, et al. Scandinavian guidelines for initial management of minor and moderate head trauma in children. BMC Med. 2016;14(1). doi:10.1186/s12916-016-0574-x
18. Carney N, Totten AM, OʼReilly C, et al. Guidelines for the management of severe traumatic brain injury, fourth edition. Neurosurgery. 2016;24(Suppl 1.):244. doi:10.1227/NEU.0000000000001432
19. Rozet I, Domino KB. Respiratory care. Best Pract Res Clin Anaesthesiol. 2007;21(4):465-482. doi:http://doi.org/10.1016/j.bpa.2007.07.001
20. Bakowitz M, Bruns B, McCunn M. Acute lung injury and the acute respiratory distress syndrome in the injured patient. Scand J Trauma Resusc Emerg Med. 2012;20(1):54. doi:10.1186/1757-7241-20-54
21. The ARDS Definition Task Force. Acute respiratory distress syndrome: The Berlin Definition. JAMA. 2012;307(23):2526-2533. doi:10.1001/jama.2012.5669
22. Marino PL. Chapter 25: Positive pressure ventilation. In: Marino’s The ICU Book. 4th ed. Philadelphia: Lippincott Williams & Wilkins; 2014:487-503.
23. Dreyfuss D, Soler P, Basset G, Saumon G. High Inflation Pressure Pulmonary Edema: Respective Effects of High Airway Pressure, High Tidal Volume, and Positive End-expiratory Pressure. Am Rev Respir Dis. 1988;137(5):1159-1164. doi:10.1164/ajrccm/137.5.1159
24. Slutsky AS, Ranieri VM. Ventilator-induced lung injury. N Engl J Med. 2013;369(22):2126-2136. doi:10.1056/NEJMra1208707
25. Pelosi P, Rocco PR. Effects of mechanical ventilation on the extracellular matrix. Intensive Care Med. 2008;34(4):631-639. doi:10.1007/s00134-007-0964-9
26. Zygun DA, Zuege DJ, Boiteau PJE, et al. Ventilator-associated pneumonia in severe traumatic brain injury. Neurocrit Care. 2006;5:108-114. doi:10.1385/ncc:5:2:108
27. Barbier F, Andremont A, Wolff M, Bouadma L. Hospital-acquired pneumonia and ventilator-associated pneumonia: Recent advances in epidemiology and management. Curr Opin Pulm Med. 2013;19(3):216-228. doi:10.1097/MCP.0b013e32835f27be
28. Ware LB, Matthay MA. The Acute Respiratory Distress Syndrome. N Engl J Med. 2000;342(18):1334-1349. doi:10.1056/NEJM200005043421806
29. Jovanovic B, Milan Z, Markovic-Denic L, et al. Risk factors for ventilator-associated pneumonia in patients with severe traumatic brain injury in a Serbian trauma centre. Int J Infect Dis. 2015;38:e46-e51. doi:10.1016/j.ijid.2015.07.005

Master’s Thesis in medicine [MED-3950] Page 27 of 35
30. Kahn JM, Caldwell EC, Deem S, Newell DW, Heckbert SR, Rubenfeld GD. Acute lung injury in patients with subarachnoid hemorrhage: incidence, risk factors and outcome. Crit Care Med. 2006;34. doi:10.1097/01.CCM.0000194540.44020.8E
31. Holland MC, Mackersie RC, Morabito D, et al. The development of acute lung injury is associated with worse neurologic outcome in patients with severe traumatic brain injury. J Trauma. 2003;55(1):106-111. doi:10.1097/01.TA.0000071620.27375.BE
32. Aisiku IP, Yamal JM, Doshi P, et al. The incidence of ARDS and associated mortality in severe TBI using the Berlin definition. J Trauma Acute Care Surg. 2016;80(2):308-312. doi:10.1097/TA.0000000000000903
33. Hendrickson CM, Howard BM, Kornblith LZ, et al. The acute respiratory distress syndrome following isolated severe traumatic brain injury. J Trauma Acute Care Surg. 2016;80(6):989-997. doi:10.1097/TA.0000000000000982
34. Dreyfuss D, Saumon G. Ventilator-induced lung Injury. Am J Respir Crit Care Med. 1998;157(1):294-323. doi:10.1164/ajrccm.157.1.9604014
35. Amato MBP, Barbas CSV, Medeiros DM, et al. Effect of a protective-ventilation strategy on mortality in the acute respiratory distress syndrome. N Engl J Med. 1998;338(6):347-354. doi:10.1056/NEJM199802053380602
36. ARDS Network. Ventilation with lower tidal volumes as compared with traditional tidal volumes for acute lung injury and the acute respiratory distress syndrome. N Engl J Med. 2000;342(18):1301-1308. doi:10.1056/NEJM200005043421801
37. Richard J-C, Brochard L, Vandelet P, et al. Respective effects of end-expiratory and end-inspiratory pressures on alveolar recruitment in acute lung injury. Crit Care Med. 2003;31(1). doi:10.1097/01.CCM.0000037960.70104.1E
38. Briel M, Meade M, Mercat A, Al E. Higher vs lower positive end-expiratory pressure in patients with acute lung injury and acute respiratory distress syndrome: Systematic review and meta-analysis. JAMA. 2010;303(9):865-873. doi:10.1001/jama.2010.218
39. Chen H, Xu M, Yang Y-L, et al. Effects of increased positive end-expiratory pressure on intracranial pressure in acute respiratory distress syndrome: a protocol of a prospective physiological study. BMJ Open. 2016;6(11). doi:10.1136/bmjopen-2016-012477
40. Lou M, Xue F, Chen L, Xue Y, Wang K. Is high PEEP ventilation strategy safe for acute respiratory distress syndrome after severe traumatic brain injury? Brain Inj. 2012;26(6):887-890. doi:10.3109/02699052.2012.660514
41. Linares-Perdomo O, East TD, Brower R, Morris AH. Standardizing predicted body weight equations for mechanical ventilation tidal volume settings. Chest. 2015;148(1):73-78. doi:10.1378/chest.14-2843
42. and Blood Institute ARDS Clinical Trials Network TNHL. Higher versus lower positive end-expiratory pressures in patients with the acute respiratory distress syndrome. N Engl J Med. 2004;351(4):327-336. doi:10.1056/NEJMoa032193
43. Sahetya SK, Brower RG. Lung recruitment and titrated PEEP in moderate to severe ARDS:
Master’s Thesis in medicine [MED-3950] Page 28 of 35
Is the door closing on the open lung? JAMA. 2017;318(14):1327-1329. doi:10.1001/jama.2017.13695
44. Writing Group for the Alveolar Recruitment for Acute Respiratory Distress Syndrome Trial (ART) Investigators. Effect of lung recruitment and titrated positive end-expiratory pressure (PEEP) vs low PEEP on mortality in patients with acute respiratory distress syndrome: A randomized clinical trial. JAMA. 2017;318(14):1335-1345. doi:10.1001/jama.2017.14171
45. Neto AS, Schultz MJ. Optimizing the settings on the ventilator: High PEEP for all? JAMA. 2017;317(14):1413-1414. http://dx.doi.org/10.1001/jama.2017.2570.
46. Neto AS, Simonis FD, Barbas CS V., et al. Lung-protective ventilation with low tidal volumes and the occurrence of pulmonary complications in patients without acute respiratory distress syndrome. Crit Care Med. 2015;43(10):2155-2163. doi:10.1097/CCM.0000000000001189
47. Mascia L. Acute lung injury in patients with severe brain injury: A double hit model. Neurocrit Care. 2009;11(3):417-426. doi:10.1007/s12028-009-9242-8
48. Swain A, Bhagat H, Sahni N, Salunke P. Mechanical ventilation in neurological and neurosurgical patients. Neurol India. 2016;64(3). doi:10.4103/0028-3886.181585
49. Ngubane T. Mechanical ventilation and the injured brain. South African J Anaesth Analg. 2011;17(1):76-80. doi:10.1080/22201173.2011.10872737
50. Coles JP, Fryer TD, Coleman MR, et al. Hyperventilation following head injury: Effect on ischemic burden and cerebral oxidative metabolism. Crit Care Med. 2007;35(2):568-578. doi:10.1097/01.CCM.0000254066.37187.88
51. Ferguson ND. Low tidal volumes for all? JAMA. 2012;308(16):1689. doi:10.1001/jama.2012.14509
52. Elmer J, Hou P, Wilcox SR, et al. Acute respiratory distress syndrome after spontaneous intracerebral hemorrhage. Crit Care Med. 2013;41(8):1992-2001. doi:10.1097/CCM.0b013e31828a3f4d
53. Koutsoukou A, Katsiari M, Orfanos SE, et al. Respiratory mechanics in brain injury: A review. World J Crit care Med. 2016;5(1):65-73. doi:10.5492/wjccm.v5.i1.65
54. Frost EAM. Effects of positive end-expiratory pressure on intracranial pressure and compliance in brain-injured patients. J Neurosurg. 1977;47(2):195-200. doi:10.3171/jns.1977.47.2.0195
55. Shapiro HM, Marshall LF. Intracranial pressure responses to PEEP in head-injured patients. J Trauma Acute Care Surg. 1978;18(4).
56. Burchiel KJ, Steege TD, Wyler AR. Intracranial pressure changes in brain-injured patients requiring positive end-expiratory pressure ventilation. Neurosurgery. 1981;8(4).
57. Boone MD, Jinadasa SP, Mueller A, et al. The effect of positive end-expiratory pressure on intracranial pressure and cerebral hemodynamics. Neurocrit Care. 2017;26(2):174-181. doi:10.1007/s12028-016-0328-9

Master’s Thesis in medicine [MED-3950] Page 29 of 35
58. Pelosi P, Ferguson ND, Frutos-Vivar F, et al. Management and outcome of mechanically ventilated neurologic patients. Crit Care Med. 2011;39(6). doi:10.1097/CCM.0b013e31821209a8
59. Asehnoune K, Roquilly A, Cinotti R. Respiratory Management in Patients with Severe Brain Injury. Crit Care. 2018;22(1):76. doi:10.1186/s13054-018-1994-0
60. Lowe GJ, Ferguson ND. Lung-protective ventilation in neurosurgical patients. Curr Opin Crit Care. 2006;12(1):3-7.
61. Oddo M, Citerio G. ARDS in the brain-injured patient: what’s different? Intensive Care Med. 2016;42(5):790-793. doi:10.1007/s00134-016-4298-3
62. Moholt A, Hansen HD. Incidence, treatment and survival of ARDS in Northern Norway: preliminary findings [Master's thesis in medicine]. Tromsø: UiT – The Arctic University of North Norway; 2016. 52 pp.
63. Maurer D. MDCalc app, the best online medical calculator is now an app [Internet]. iMedicalApps; published 2016 [accessed May 30, 2018]. Available from: https://www.imedicalapps.com/2016/03/mdcalc-medical-calculator-app/
64. Serpa Neto A, Cardoso SO, Manetta JA, et al. Association between use of lung-protective ventilation with lower tidal volumes. JAMA. 2012;308(16):1651-1659. doi:10.1001/jama.2012.13730
65. Olldashi F, Muzha I, Filipi N, et al. Effect of intravenous corticosteroids on death within 14 days in 10008 adults with clinically significant head injury (MRC CRASH trial): Randomised placebo-controlled trial. Lancet. 2004;364(9442):1321-1328. doi:10.1016/S0140-6736(04)17188-2
66. Villar J, Suárez-Sipmann F, Kacmarek RM. Should the ART trial change our practice? J Thorac Dis. 2017;9(12):4871-4877. doi:10.21037/jtd.2017.11.01
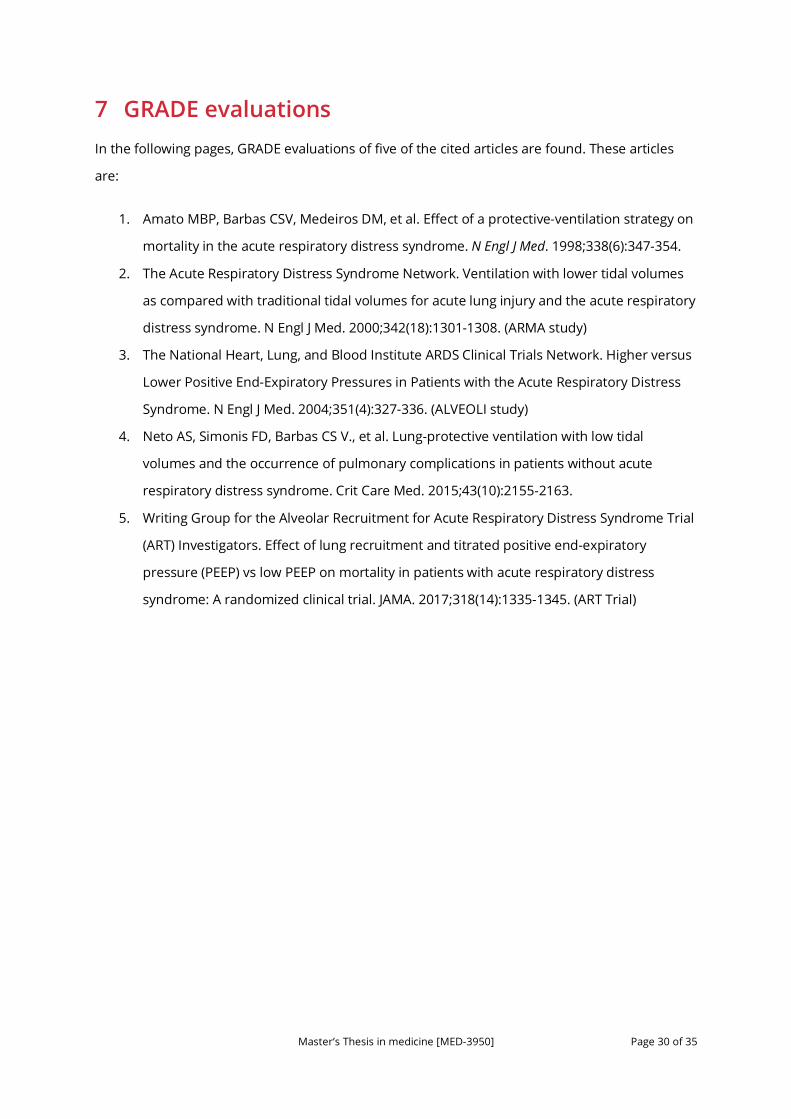
Master’s Thesis in medicine [MED-3950] Page 30 of 35
7 GRADE evaluations In the following pages, GRADE evaluations of five of the cited articles are found. These articles
are:
1. Amato MBP, Barbas CSV, Medeiros DM, et al. Effect of a protective-ventilation strategy on
mortality in the acute respiratory distress syndrome. N Engl J Med. 1998;338(6):347-354.
2. The Acute Respiratory Distress Syndrome Network. Ventilation with lower tidal volumes
as compared with traditional tidal volumes for acute lung injury and the acute respiratory
distress syndrome. N Engl J Med. 2000;342(18):1301-1308. (ARMA study)
3. The National Heart, Lung, and Blood Institute ARDS Clinical Trials Network. Higher versus
Lower Positive End-Expiratory Pressures in Patients with the Acute Respiratory Distress
Syndrome. N Engl J Med. 2004;351(4):327-336. (ALVEOLI study)
4. Neto AS, Simonis FD, Barbas CS V., et al. Lung-protective ventilation with low tidal
volumes and the occurrence of pulmonary complications in patients without acute
respiratory distress syndrome. Crit Care Med. 2015;43(10):2155-2163.
5. Writing Group for the Alveolar Recruitment for Acute Respiratory Distress Syndrome Trial
(ART) Investigators. Effect of lung recruitment and titrated positive end-expiratory
pressure (PEEP) vs low PEEP on mortality in patients with acute respiratory distress
syndrome: A randomized clinical trial. JAMA. 2017;318(14):1335-1345. (ART Trial)

Master’s Thesis in medicine [MED-3950] Page 31 of 35
Reference: Amato MBP, Barbas CSV, Medeiros DM, et al. Effect of a protective-ventilation strategy on mortality in the acute respiratory distress syndrome. N Engl J Med. 1998;338(6):347-354. doi:10.1056/NEJM199802053380602
Design: RCT
Evidence level Ib
GRADE
MODERATE
Aim Materials and methods Results Discussion/comments
To determine whether a ventilatory strategy de- signed to minimize lung injuries could reduce not only pulmonary complications but also mortality at 28 days in patients with the acute respiratory distress syndrome.
53 patients with early acute respiratory distress syndrome, all of whom were receiving identical hemodynamic and general support, were randomly assigned to either conventional or protective mechanical ventilation. Conventional ventilation was based on the strategy of maintaining the lowest positive end-expiratory pressure (PEEP) for acceptable oxygenation, with a tidal volume of 12 ml per kilogram of body weight and normal arterial carbon dioxide levels (35 to 38 mm Hg). Protective ventilation involved end-expiratory pressures above the lower inflection point on the static pressure–volume curve, a tidal volume of less than 6 ml per kilogram, driving pressures of less than 20 cm of water above the PEEP value, permissive hypercapnia, and preferential use of pressure-limited ventilatory modes. The primary end point was survival at 28 days. The secondary end points were survival to hospital discharge, occurrence of clinically detectable barotrauma, and weaning rate adjusted for APACHE II score (Acute Physiology and Chronic Health Evaluation).
After 28 days, 11 of 29 patients (38 percent) in the protective-ventilation group had died, as compared with 17 of 24 (71 percent) in the conventional-ventilation group (P<0.001). The rates of weaning from mechanical ventilation were 66 percent in the protective-ventilation group and 29 percent in the conventional-ventilation group (P=0.005); the rates of clinical barotrauma were 7 percent and 42 percent, respectively (P=0.02), despite the use of higher PEEP and mean airway pressures in the protective-ventilation group. The difference in survival to hospital discharge was not significant; 13 of 29 patients (45 percent) in the protective-ventilation group died in the hospital, as compared with 17 of 24 in the conventional-ventilation group (71 percent, P=0.37).
Checklist • Did the trial address a clearly focused issue? Yes • Was the assignment of patients to treatments
randomised? Yes • Were patients, health workers and study personnel
‘blind’ to treatment? Unclear/impossible to blind attending physcicians
• Were the groups similar at the start of the trial? Yes, no significant diffrences between groups
• Aside from the experimental intervention, were the groups treated equally? Yes
• Were all of the patients who entered the trial properly accounted for at its conclusion? Yes
• How large and how precise was the treatment effect? Large difference in 28-day mortality, favoring the protective ventilation group (38% vs 71%, p>0,001), non-significant difference in survival to hospital discharge (p=0,37)
• Can the results be applied to the local population, or in your context? Yes
• Were all clinically important outcomes considered? Yes • Are the benefits worth the harms and costs? Yes
Strengths: Large and significant difference in 28-day mortality. Limitations: Small study sample, not impossible to blind attending physicians, minor protocol violations in five patients. Non-significant difference in survival to hospital discharge.
Conclusion
As compared with conventional ventilation, the protective strategy was associated with improved survival at 28 days, a higher rate of weaning from mechanical ventilation, and a lower rate of barotrauma in patients with the acute respiratory distress syndrome. Protective ventilation was not as- sociated with a higher rate of survival to hospital dis- charge.
Countries
Brazil
Years of data collection
1990 – 1995
Figure 1. Actuarial 28-Day Survival among 53 Patients with the Acute Respiratory Distress SyndromeAssigned to Protective or Conventional Mechanical Ventilation.
The data are based on an intention-to-treat analysis. The P value indicates the effect of ventilatorytreatment as estimated by the Cox regression model, with the risk of death associated with the adjust-ed base-line score on APACHE II included as a covariate.
0
20
40
60
80
100
0 10 20 30
Days after Randomization
Protective
P!0.001
Conventional
NO. AT RISK
ProtectiveConventional
2924
2511
209
187
Su
rviv
al (%
)
The New England Journal of Medicine Downloaded from nejm.org at NORWEGIAN INSTITUTE OF PUBLIC HEALTH on April 23, 2017. For personal use only. No other uses without permission.
Copyright © 1998 Massachusetts Medical Society. All rights reserved.
����

Master’s Thesis in medicine [MED-3950] Page 32 of 35
Reference: The Acute Respiratory Distress Syndrome Network. Ventilation with lower tidal volumes as compared with traditional tidal volumes for acute lung injury and the acute respiratory distress syndrome. N Engl J Med. 2000;342(18):1301-1308. doi:10.1056/NEJM200005043421801 (ARMA study)
Design: RCT
Evidence level Ib
GRADE
MODERATE
Aim Materials and methods Results Discussion/comments
To determine whether ventilation with lower tidal volumes would improve the clinical outcome in patients with acute lung injury and the acute respiratory distress syndrome.
Patients with acute lung injury and the acute respiratory distress syndrome were enrolled in a multicenter, randomized trial. The trial compared traditional ventilation treatment, which involved an initial tidal volume of 12 ml per kilogram of predicted body weight and an airway pressure measured after a 0.5-second pause at the end of inspiration (plateau pressure) of 50 cm of water or less, with ventilation with a lower tidal volume, which involved an initial tidal volume of 6 ml per kilogram of predicted body weight and a plateau pressure of 30 cm of water or less. The first primary outcome was death before a patient was discharged home and was breathing without assistance. The second primary outcome was the number of days without ventilator use from day 1 to day 28.
The trial was stopped after the enrollment of 861 patients because mortality was lower in the group treated with lower tidal volumes than in the group treated with traditional tidal volumes (31.0 percent vs. 39.8 percent, P=0.007), and the number of days without ventilator use during the first 28 days after randomization was greater in this group (mean [±SD], 12±11 vs. 10±11; P=0.007). The mean tidal volumes on days 1 to 3 were 6.2±0.8 and 11.8±0.8 ml per kilogram of predicted body weight (P<0.001), respectively, and the mean plateau pressures were 25±6 and 33±8 cm of water (P<0.001), respectively.
Checklist • Did the trial address a clearly focuse issue? Yes • Was the assignment of patients to treatments
randomised? Yes • Were patients, health workers and study personnel
‘blind’ to treatment? Unclear/impossible to blind attending physicians
• Were the groups similar at the start of the trial? Yes, apart from slightly but significantly higher minute ventilation in the lower tidal volume group (p=0,01)
• Aside from the experimental intervention, were the groups treated equally? Yes, apart from higher plateau pressures in the high tidal volume group and higher PEEP in the low tidal volume group
• Were all of the patients who entered the trial properly accounted for at its conclusion? Unclear
• How large was the treatment effect? 22% reduced mortality
• How precise was the estimate of the treatment effect? Statistically significant mortality reduction, but relatively wide confidence interval for difference between groups (p=0,007, 95% CI 2,4–15,3%)
• Can the results be applied to the local population, or in your context? Yes
• Were all clinically important outcomes considered? Yes • Are the benefits worth the harms and costs? Yes
Strengths: Large multi-center randomized trial, significant mortality reduction. Limitations: Inconsistency with previous trials, but plausible reasons are given. Risk of performance bias due to unclear blinding procedure.
Conclusion
In this group of patients, mechanical ventilation with a lower tidal volume than is traditionally used results in decreased mortality and increases the number of days without ventilator use.
Country
USA
Years of data collection
1996 – 1999
1306
Figure 1. Probability of Survival and of Being Discharged Homeand Breathing without Assistance during the First 180 Days af-ter Randomization in Patients with Acute Lung Injury and theAcute Respiratory Distress Syndrome.
The status at 180 days or at the end of the study was known forall but nine patients. Data on these 9 patients and on 22 addi-tional patients who were hospitalized at the time of the fourthinterim analysis were censored.
0.0
1.0
0 180
0.1
0.2
0.3
0.4
0.5
0.6
0.7
0.8
0.9
20 40 60 80 100 120 140 160
Days after Randomization
Pro
po
rtio
n o
f P
ati
en
ts
Lower tidal volumes!mmnSurvival!mmnDischarge!Traditional tidal volumes!mmnSurvival!mmnDischarge
The New England Journal of Medicine Downloaded from nejm.org at NORWEGIAN INSTITUTE OF PUBLIC HEALTH on April 23, 2017. For personal use only. No other uses without permission.
Copyright © 2000 Massachusetts Medical Society. All rights reserved.
����
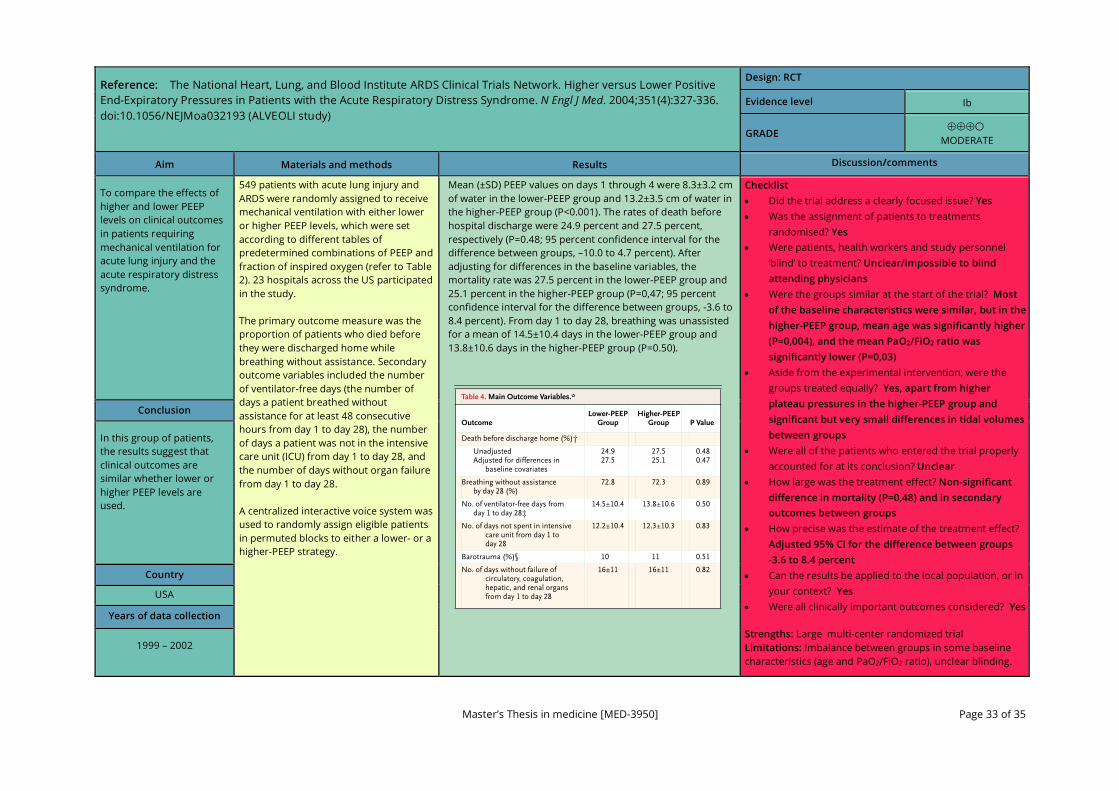
Master’s Thesis in medicine [MED-3950] Page 33 of 35
Reference: The National Heart, Lung, and Blood Institute ARDS Clinical Trials Network. Higher versus Lower Positive End-Expiratory Pressures in Patients with the Acute Respiratory Distress Syndrome. N Engl J Med. 2004;351(4):327-336. doi:10.1056/NEJMoa032193 (ALVEOLI study)
Design: RCT
Evidence level Ib
GRADE
MODERATE
Aim Materials and methods Results Discussion/comments
To compare the effects of higher and lower PEEP levels on clinical outcomes in patients requiring mechanical ventilation for acute lung injury and the acute respiratory distress syndrome.
549 patients with acute lung injury and ARDS were randomly assigned to receive mechanical ventilation with either lower or higher PEEP levels, which were set according to different tables of predetermined combinations of PEEP and fraction of inspired oxygen (refer to Table 2). 23 hospitals across the US participated in the study. The primary outcome measure was the proportion of patients who died before they were discharged home while breathing without assistance. Secondary outcome variables included the number of ventilator-free days (the number of days a patient breathed without assistance for at least 48 consecutive hours from day 1 to day 28), the number of days a patient was not in the intensive care unit (ICU) from day 1 to day 28, and the number of days without organ failure from day 1 to day 28. A centralized interactive voice system was used to randomly assign eligible patients in permuted blocks to either a lower- or a higher-PEEP strategy.
Mean (±SD) PEEP values on days 1 through 4 were 8.3±3.2 cm of water in the lower-PEEP group and 13.2±3.5 cm of water in the higher-PEEP group (P<0.001). The rates of death before hospital discharge were 24.9 percent and 27.5 percent, respectively (P=0.48; 95 percent confidence interval for the difference between groups, –10.0 to 4.7 percent). After adjusting for differences in the baseline variables, the mortality rate was 27.5 percent in the lower-PEEP group and 25.1 percent in the higher-PEEP group (P=0,47; 95 percent confidence interval for the difference between groups, -3.6 to 8.4 percent). From day 1 to day 28, breathing was unassisted for a mean of 14.5±10.4 days in the lower-PEEP group and 13.8±10.6 days in the higher-PEEP group (P=0.50).
Checklist • Did the trial address a clearly focused issue? Yes • Was the assignment of patients to treatments
randomised? Yes • Were patients, health workers and study personnel
‘blind’ to treatment? Unclear/impossible to blind attending physicians
• Were the groups similar at the start of the trial? Most of the baseline characteristics were similar, but in the higher-PEEP group, mean age was significantly higher (P=0,004), and the mean PaO2/FiO2 ratio was significantly lower (P=0,03)
• Aside from the experimental intervention, were the groups treated equally? Yes, apart from higher plateau pressures in the higher-PEEP group and significant but very small differences in tidal volumes between groups
• Were all of the patients who entered the trial properly accounted for at its conclusion? Unclear
• How large was the treatment effect? Non-significant difference in mortality (P=0,48) and in secondary outcomes between groups
• How precise was the estimate of the treatment effect? Adjusted 95% CI for the difference between groups -3.6 to 8.4 percent
• Can the results be applied to the local population, or in your context? Yes
• Were all clinically important outcomes considered? Yes Strengths: Large multi-center randomized trial Limitations: Imbalance between groups in some baseline characteristics (age and PaO2/FiO2 ratio), unclear blinding.
Conclusion
In this group of patients, the results suggest that clinical outcomes are similar whether lower or higher PEEP levels are used.
Country
USA
Years of data collection
1999 – 2002
Appen-between
group.study
acutedif-
ven-organ-failure–
ysome
chance)we
stud-to
char-ad-
* Plus–minus values are means ±SD.
Table 4. Main Outcome Variables.*
OutcomeLower-PEEP
GroupHigher-PEEP
Group P Value
Death before discharge home (%)†
UnadjustedAdjusted for differences in
baseline covariates
24.927.5
27.525.1
0.480.47
Breathing without assistance by day 28 (%)
72.8 72.3 0.89
No. of ventilator-free days from day 1 to day 28‡
14.5±10.4 13.8±10.6 0.50
No. of days not spent in intensive care unit from day 1 to day 28
12.2±10.4 12.3±10.3 0.83
Barotrauma (%)§ 10 11 0.51
No. of days without failure of circulatory, coagulation, hepatic, and renal organs from day 1 to day 28
16±11 16±11 0.82
The New England Journal of Medicine Downloaded from nejm.org at NORWEGIAN INSTITUTE OF PUBLIC HEALTH on May 20, 2018. For personal use only. No other uses without permission.
Copyright © 2004 Massachusetts Medical Society. All rights reserved.
����
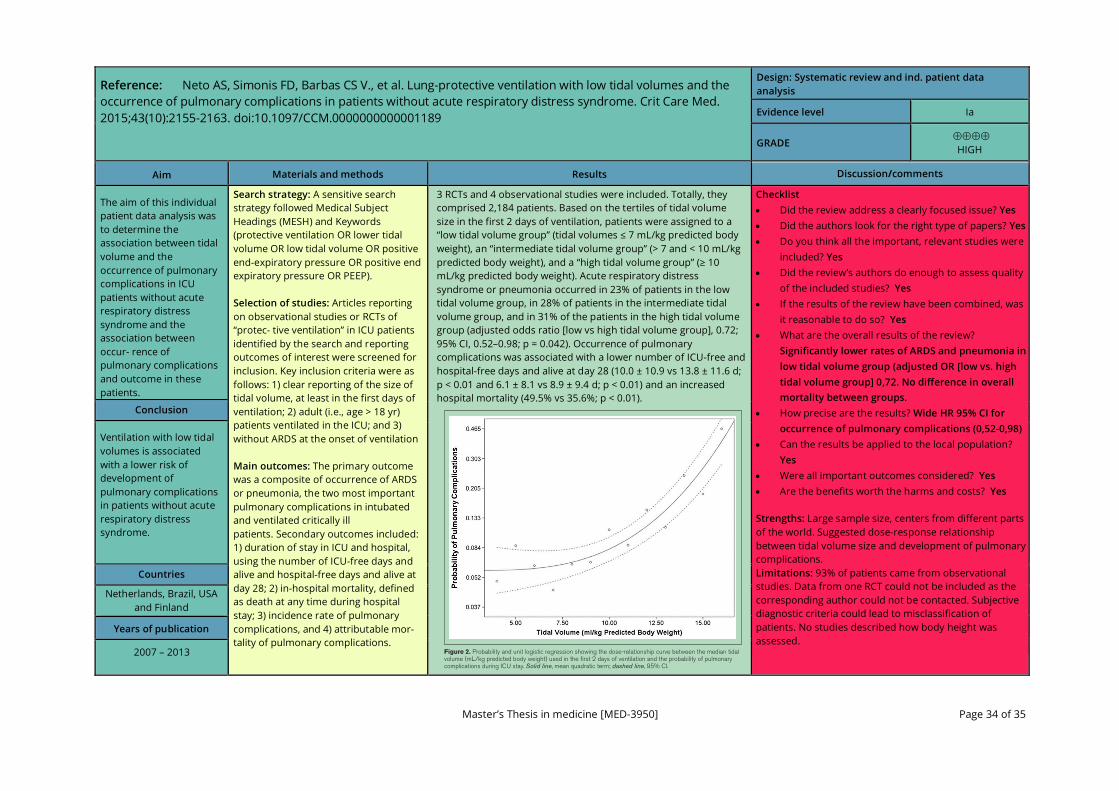
Master’s Thesis in medicine [MED-3950] Page 34 of 35
Reference: Neto AS, Simonis FD, Barbas CS V., et al. Lung-protective ventilation with low tidal volumes and the occurrence of pulmonary complications in patients without acute respiratory distress syndrome. Crit Care Med. 2015;43(10):2155-2163. doi:10.1097/CCM.0000000000001189
Design: Systematic review and ind. patient data analysis
Evidence level Ia
GRADE
HIGH
Aim Materials and methods Results Discussion/comments
The aim of this individual patient data analysis was to determine the association between tidal volume and the occurrence of pulmonary complications in ICU patients without acute respiratory distress syndrome and the association between occur- rence of pulmonary complications and outcome in these patients.
Search strategy: A sensitive search strategy followed Medical Subject Headings (MESH) and Keywords (protective ventilation OR lower tidal volume OR low tidal volume OR positive end-expiratory pressure OR positive end expiratory pressure OR PEEP). Selection of studies: Articles reporting on observational studies or RCTs of “protec- tive ventilation” in ICU patients identified by the search and reporting outcomes of interest were screened for inclusion. Key inclusion criteria were as follows: 1) clear reporting of the size of tidal volume, at least in the first days of ventilation; 2) adult (i.e., age > 18 yr) patients ventilated in the ICU; and 3) without ARDS at the onset of ventilation Main outcomes: The primary outcome was a composite of occurrence of ARDS or pneumonia, the two most important pulmonary complications in intubated and ventilated critically ill patients. Secondary outcomes included: 1) duration of stay in ICU and hospital, using the number of ICU-free days and alive and hospital-free days and alive at day 28; 2) in-hospital mortality, defined as death at any time during hospital stay; 3) incidence rate of pulmonary complications, and 4) attributable mor- tality of pulmonary complications.
3 RCTs and 4 observational studies were included. Totally, they comprised 2,184 patients. Based on the tertiles of tidal volume size in the first 2 days of ventilation, patients were assigned to a “low tidal volume group” (tidal volumes ≤ 7 mL/kg predicted body weight), an “intermediate tidal volume group” (> 7 and < 10 mL/kg predicted body weight), and a “high tidal volume group” (≥ 10 mL/kg predicted body weight). Acute respiratory distress syndrome or pneumonia occurred in 23% of patients in the low tidal volume group, in 28% of patients in the intermediate tidal volume group, and in 31% of the patients in the high tidal volume group (adjusted odds ratio [low vs high tidal volume group], 0.72; 95% CI, 0.52–0.98; p = 0.042). Occurrence of pulmonary complications was associated with a lower number of ICU-free and hospital-free days and alive at day 28 (10.0 ± 10.9 vs 13.8 ± 11.6 d; p < 0.01 and 6.1 ± 8.1 vs 8.9 ± 9.4 d; p < 0.01) and an increased hospital mortality (49.5% vs 35.6%; p < 0.01).
Checklist • Did the review address a clearly focused issue? Yes • Did the authors look for the right type of papers? Yes • Do you think all the important, relevant studies were
included? Yes • Did the review’s authors do enough to assess quality
of the included studies? Yes • If the results of the review have been combined, was
it reasonable to do so? Yes • What are the overall results of the review?
Significantly lower rates of ARDS and pneumonia in low tidal volume group (adjusted OR [low vs. high tidal volume group] 0,72. No difference in overall mortality between groups.
• How precise are the results? Wide HR 95% CI for occurrence of pulmonary complications (0,52-0,98)
• Can the results be applied to the local population? Yes
• Were all important outcomes considered? Yes • Are the benefits worth the harms and costs? Yes
Strengths: Large sample size, centers from different parts of the world. Suggested dose-response relationship between tidal volume size and development of pulmonary complications. Limitations: 93% of patients came from observational studies. Data from one RCT could not be included as the corresponding author could not be contacted. Subjective diagnostic criteria could lead to misclassification of patients. No studies described how body height was assessed.
Conclusion
Ventilation with low tidal volumes is associated with a lower risk of development of pulmonary complications in patients without acute respiratory distress syndrome.
Countries
Netherlands, Brazil, USA and Finland
Years of publication
2007 – 2013
� /CTOBER������s�6OLUME����s�.UMBER���
Figure 2. Probability and unit logistic regression showing the dose-relationship curve between the median tidal volume (mL/kg predicted body weight) used in the first 2 days of ventilation and the probability of pulmonary complications during ICU stay. Solid line, mean quadratic term; dashed line, 95% CI.
����

Master’s Thesis in medicine [MED-3950] Page 35 of 35 NB! Siste side!
Reference: Writing Group for the Alveolar Recruitment for Acute Respiratory Distress Syndrome Trial (ART) Investigators. Effect of lung recruitment and titrated positive end-expiratory pressure (PEEP) vs low PEEP on mortality in patients with acute respiratory distress syndrome: A randomized clinical trial. JAMA. 2017;318(14):1335-1345. doi:10.1001/jama.2017.14171 (ART Trial)
Design: RCT
Evidence level Ib
GRADE
MODERATE
Aim Materials and methods Results Discussion/comments
To determine if lung recruitment associated with PEEP titration according to the best respiratory-system compliance decreases 28-day mortality of patients with moderate to severe ARDS compared with a conventional low-PEEP strategy.
A multicenter, randomized trial conducted at 120 intensive care units (ICUs) from 9 countries, enrolling adults with moderate to severe ARDS. Interventions: An experimental strategy with a lung recruitment maneuver and PEEP titration according to the best respiratory–system compliance (n = 501; experimental group) or a control strategy of low PEEP (n = 509). All patients received volume-assist control mode until weaning. Main outcomes and measures: The primary outcomewas all-cause mortality until 28 days. Secondary outcomeswere length of ICU and hospital stay; ventilator-free days through day 28; pneumothorax requiring drainage within 7 days; barotrauma within 7 days; and ICU, in-hospital, and 6-month mortality.
A total of 1010 patients (37.5% female; mean [SD] age, 50.9 [17.4] years) were enrolled and followed up. At 28 days, 277 of 501 patients (55.3%) in the experimental group and 251 of 509 patients (49.3%) in the control group had died (hazard ratio [HR], 1.20; 95% CI, 1.01 to 1.42; P =0.041). Compared with the control group, the experimental group strategy increased 6-month mortality (65.3%vs 59.9%; HR, 1.18; 95%CI, 1.01 to 1.38; P =0.04), decreased the number of mean ventilator-free days (5.3 vs 6.4; difference, −1.1; 95%CI, −2.1 to −0.1; P = .03), increased the risk of pneumothorax requiring drainage (3.2%vs 1.2%; difference, 2.0%; 95%CI,0.0%to 4.0%; P = .03), and the risk of barotrauma (5.6%vs 1.6%; difference, 4.0%; 95%CI, 1.5%to 6.5%; P = .001). There were no significant differences in the length of ICU stay, length of hospital stay, ICU mortality, and in-hospital mortality.
Checklist • Did the trial address a clearly focused issue? Yes • Was the assignment of patients to treatments
randomised? Yes • Were patients, health workers and study personnel
‘blind’ to treatment? No, participants, clinicians and outcome assessors were awere of the assigned treatment.
• Were the groups similar at the start of the trial? Yes • Aside from the experimental intervention, were the
groups treated equally? Yes, apart from higher rate of neuromuscular blocker use in experimental group
• Were all of the patients who entered the trial properly accounted for at its conclusion? Yes, three patients were excluded from the analysis due to withdrawal of consent
• How large was the treatment effect? Adjusted hazard ratio for 28-day mortality in experimental group was 1,22
• How precise was the estimate of the treatment effect? Wide HR 95% CI for 28-day mortality in experimental group (1,01 to 1,42)
• Can the results be applied to the local population, or in your context? Yes
• Were all clinically important outcomes considered? Yes Strengths: Large multi-center randomized trial. Bias was controlled using concealed allocation, intention-to-treat analysis, and by avoiding losses to follow-up. Limitations: Not feasible to blind participants, clinicians and outcome assessors. Concerns with study design, methodology, data analyses and results have been raised.66
Conclusion
In patients with moderate to severe ARDS, a strategy with lung recruitment and titrated PEEP compared with low PEEP increased 28-day all-cause mortality. These findings do not support the routine use of lung recruitment maneuver and PEEP titration in these patients.
Countries
Brazil, Argentina, Colombia, Italy, Poland, Portugal,
Malaysia, Spain and Uruguay
Years of data collection
2011 – 2017
er-
distri-
ed
tions
sub-
50
of
tion
xplor-
i-
e
per
earlier
g
Figure 2. 28-DayMortality in the Lung RecruitmentManeuver
With Titrated PEEP Group vs the Low-PEEP Group
80
60
40
20
0
509
501
4
423
397
8
378
340
12
343
303
16
312
276
24
264
233
20
286
254
28
260
225
Mo
rtal
ity,
%
Days After Randomization
No. at risk
Low PEEP
Low PEEP
Lung recruitmentand titrated PEEP
Lung recruitmentand titrated PEEP
Hazard ratio, 1.20 (95% CI, 1.01-1.42); P = .0410
PEEP indicates positive end-expiratory pressure.
Downloaded From: by a Norwegian Institute of Public Health User on 04/22/2018
����