factsheet may 31st, 2019
TRANSCRIPT

FACTSHEETMay 31st, 2019

Index
ABOUT FEW SCHEMES OF CANARA ROBECO MUTUAL FUND
PERFORMANCE
DIVIDEND HISTORY
MARKETS & BEYOND
SIP RETURNS
HOW TO READ A FACTSHEET
ECONOMIC INDICATORS .............................................................................................................................. 03
EQUITY MARKET REVIEW & DEBT MARKET REVIEW ............................................................................................. 04
SNAPSHOT OF EQUITY SCHEMES / DEBT SCHEMES / HYBRID & OTHER SCHEMES ........................................................... 05
CANARA ROBECO EQUITY DIVERSIFIED FUND (CREDF)........................................................................................... 06
CANARA ROBECO BLUE CHIP EQUITY FUND (CRBCEF) ........................................................................................... 07
CANARA ROBECO EMERGING EQUITIES (CREE).................................................................................................... 08
CANARA ROBECO SMALL CAP FUND (CRSCF) ...................................................................................................... 09
CANARA ROBECO INFRASTRUCTURE (CRI)......................................................................................................... 10
CANARA ROBECO CONSUMER TRENDS FUND (CRCTF) ........................................................................................... 11
CANARA ROBECO EQUITY TAX SAVER FUND (CRETSF) ........................................................................................... 12
CANARA ROBECO LIQUID FUND (CRL).............................................................................................................. 13
CANARA ROBECO ULTRA SHORT TERM FUND (CRUSTF).......................................................................................... 14
CANARA ROBECO SAVINGS FUND (CRSF)........................................................................................................... 15
CANARA ROBECO SHORT DURATION FUND (CRSDF) .............................................................................................. 16
CANARA ROBECO INCOME FUND (CRINC) .......................................................................................................... 17
CANARA ROBECO DYNAMIC BOND FUND (CRDBF) ................................................................................................ 18
CANARA ROBECO CORPORATE BOND FUND (CRCBF)............................................................................................. 19
CANARA ROBECO GILT FUND (CRGILT) ............................................................................................................. 20
CANARA ROBECO CONSERVATIVE HYBRID FUND (CRCHF) ....................................................................................... 21
CANARA ROBECO EQUITY HYBRID FUND (CREHF) ................................................................................................ 22
CANARA ROBECO GOLD EXCHANGE TRADED FUND (CRGETF) .................................................................................. 23
CANARA ROBECO GOLD SAVINGS FUND (CRGSF) ................................................................................................ 24
PERFORMANCE AT A GLANCE ....................................................................................................................... 25
SCHEME PERFORMANCE - FUND MANAGER WISE ................................................................................................. 29
SIP RETURNS........................................................................................................................................... 31
DIVIDEND HISTORY ................................................................................................................................... 35
HOW TO READ A FACTSHEET ........................................................................................................................ 37
DEFINITIONS & DISCLAIMERS ....................................................................................................................... 38
DEFINITIONS & DISCLAIMERS ....................................................................................................................... 39
SCHEME PERFORMANCE - FUND MANAGER WISE
DEFINITION
DISCLAIMERS

%
%
%
%
%
%
%
%
%
%
%
%
%
%
%
%
Economic Indicators (as on May 31, 2019)
3
Inflation in India
CPI increased to 2.92% in Apr'19 from 2.86% in Mar'19 to a six month high. The uptick was because of increase in food inflation led by higher prices of vegetables, meat and fish. The current level of inflation is well below the RBI's inflation target of 4%. Wholesale inflation declined to 3.07% in Apr'19 from 3.18% in Mar'19 due to slowdown in cost of fuel and manufactured products.
Indian Business Indicators - PMI
The Nikkei India Manufacturing PMI increased from 51.8 in Apr'19 to 52.7 in May'19 which showcases more than 50 point mark that seperates expansion from contraction because of improved output and improvement in manufacturing activity which was aided by growth in new orders amid strengthening demand conditions. Since the election in out of the way, Indian goods producers expect their output to rise further. PMI Services dropped to 50.2 in May'19 from 51 in Apr'19, showing the slowest growth in one year. The decline was becuase of disruption due to elections which hampered the business activity and new work.
Equity Markets - India & US
Bellweather Indian Equity Index - Nifty 50 remained volatile and closed at 11,922 levels in the month of May'19. Though during the month of May'19, markets touched an all time high amidst election outcome, investors remain cautious because of weak global cues and unfavourable macro economic data as GDP and unemplyement data showed a negative picture. U.S.markets declined in the month of May'19 as U.S. president annouced new tariffs Mexican imports to restrain illigal immigration to the U.S.
India GDP Growth Rate
India’s Real GDP came in at 5.8% for Q4 FY19 way below expectation and lower than the 6.6% witnessed in the previous quarter. This reduction was beacause of weaker consumer demand. It is the lowest growth in five years. The key manufacturing sector showed signs of sluggishness compared to previous quarter.
India Industrial Production
IIP contracted by 0.1% in Mar'19 because of slowdown in manufacturing, capital goods and consumer durable sector. Growth in mining also muted. This was the slowest growth in the last twenty one months. Overall, twelve out of twenty three industry groups in manufacturing sector showed a positive growth during the month of Mar'18.
USD INR & Brent Crude Movement
Crude Oil prices declined from $72.8/barrel in end of Apr'19 to $64.49/barrel towards the end of May'19 due to trade tension between U.S. and other countries, increased supply and perception of slowing demand growth. INR stood at 69.69 in end of May'19 against the greenback due to fall in global crude price and gains in domestic equity market.
Interest Rate Movement (%) - India & US
RBI lowered the Repo rate to 5.75% and inflation print being within RBI's acceptable levels, the Indian 10-year G-Sec yields showcased a similar trend during the month. Yields were seen wrapping the month at 7.032% in the end of May'19 vs 7.4% in the end of Apr'19, because of reduction in crude oil prices and the election results increased foreign inflows. Treasury yeilds declined to 2.12% during month end May'19 due to weak global cues. This was the lowest yield since Sep'17.
India Current Account Balance (%GDP)
India's current account deficit widened to USD 16.9 billion or 2.42% of the GDP in the third quarter of 2018 from USD 13.7 billion a year earlier (2.1% of the GDP) mainly on the back of higher trade deficit.
Source: Bloomberg
%
%
%
%
%
%
%
%
%
%
%
%
%
%
%
%
%
%
%
%%
%
%%
%
%
%
%
%
%
%
%
%
%
%
%
%
%

Equity Market Update**
Outlook:
Source:
During the month of May'19, Indian Equity markets witnessed high volatility, in line with the sentiments surrounding the general elections. While the markets were nervous during election phases, the exit polls itself created a positive momentum for markets by predicting victory for ruling coalition. The markets further cheered the outcome of a comfortable majority for BJP itself and indices (Sensex & Nifty) both making new highs on day of election outcome. The victory for BJP led coalition is quite interesting as it is the first back-to-back majority for any party since 1984.
The government in its 2nd term is expected to continue to move forward its economic reform agenda. The key reforms in 1st tenure being streamlining of GST, credit discipline (Insolvency and Bankruptcy Code), economic inclusion of weaker class (schemes like Affordable Housing, Electricity & Gas connection, Clean Water & Home Toilets, Medical Insurance etc), Real Estate Regulatory, improving ease of doing business in India (attract FDI) & job creation. As a part of first policy move, government announced extending the PM-KISAN scheme to include all eligible farmer families irrespective of the size of land holdings and also announced a pension scheme for non-salaried
segment (shopkeepers, retail traders and self-employed persons).
The key economic data released during the month, GDP for Q4 FY19 at 5.80% and retail inflation at 2.92% for Apr'19 created hopes for a renewed easing by RBI and change in stance towards supporting growth. India's GDP growth came in at 5.8% for Q4 FY19 lowest in the last five years as compared to 6.6% growth witnessed in the previous quarter as a result of weaker consumptions and investment growth. Growth in sectors like services remained comfortable while agriculture and industry witnessed a substantial slowdown. A closer look at macro and micro environment offers new challenges mainly on economic growth front (Q4 FY19 GDP at 5.80% and full year FY19 likely at around 6.80%) and associated challenges like job creation, asset quality issues in NBFCs and infrastructure & real estate. The Q4FY19 GDP at 5.8% can partly be attributed to slowdown in government activities due to elections but it also conveys a need to fill up the credit lending gap created post NBFCs crises after ILFS issues. Fortunately, with inflation under control and US Fed expected to be back on easing path, RBI has some room for easing the monetary policy to support growth. Already, RBI has done a reasonable easing (rate cuts, liquidity through OMOs and removal of some banks from PCA list).
Globally, the key event was a sudden turn by USA in the ongoing global trade tensions between the USA and China with US President announcing increase in tariffs on Chinese imports worth $200 billion to 25% and further tariffs on another $325 billion imports soon. The change in trade discussion is clearly a negative for global growth and financial market sentiments. Brent Crude prices too declined in the month of May'19 as a reaction to the worries over global growth despite the increasing tension between Iran and USA.
Bellwether indices, Nifty 50 and S&P BSE Sensex were seen trading positive during the month of May'19 at 1.49% and 1.75% respectively. S&P BSE Midcap and S&P BSE Small cap indices further showcased confidence in the mid and small cap stocks with indices showcasing positive performance during the month, up by 1.39% and 1.66% respectively. On the sectoral front, S&P BSE Capital Goods, S&P BSE India Realty, S&P BSE India Banex & S&P BSE Consumer Durables were amongst the sectors which rose by 10.59%, 9.56%, 5.81%, & 3.46% respectively during May'19. However, S&P BSE India Teck, S&P BSE Infotech, S&P BSE India Metal & S&P BSE Healthcare were amongst the sectors which fell by 2.66%, 2.96%, 6.57% &7.39% respectively during the month.
Globally, financial markets were impacted by a sudden escalation of tariff war between USA& China. While expectations were building since 2-3 months in favor of resolutions, USA surprised markets by announcing an increase in tariffs. Crude oil prices, a very important factor for Indian economy, remains fluctuating between global growth worries (lower prices) and increasing geo-politics tension (issues between USA & Iran).
Indian equity markets continue to rally on the back of rising FII flows. FIIs have invested nearly 10.5 bn$ in CY19 (5 months). It is expected that quite a few global investors who were waiting for the election outcome, would now resume their investment plans (both FDI as well as FII) for Indian economy and markets. The attractiveness of India as investment destination improves on optimism that the government would continue with the previous reform measures & focus on more structural reforms and job creation to support the growth trajectory.
The Q4FY19 earnings have been weaker than expected with slowdown in discretionary consumption impacting growth and earnings. While expectations for FY20 are strong at nearly 25% earnings growth for NIFTY companies, they are essentially driven by large corporate banks which are likely to come out of the pains of asset quality experienced in past 2-3 years. Overall the market looks reasonably priced at 19-20 PE on FY20 and earnings boost that can come from expected change in RBI's policy stance, growth-oriented budget (July 2019) and improvement in consumer sentiments.
With the sentiment driven event of elections behind us, the market focus would be back on growth. RBI's monetary policy in June and Union Budget in July along with other policy measures to be announced by government are likely to lay down the path to economic recovery and growth. Markets would continue to focus on both actual growth numbers as well as the expectations created on policy initiatives. While near term growth and valuations appear finely balanced, the medium to long term, growth prospects for India remains strong and equity markets offer investors an opportunity to participate in the economic growth.
**ICRA MFI Explorer, Bloomberg
Equity Market Review (as on May 31, 2019)
4
Mr. Krishna Sanghavi
Head - Equities
Debt Market Review (as on May 31, 2019)
Fixed Income Market update**
Outlook:
Source:
Indian 10-year benchmark yields softened in the month of May'19 amidst OMO purchases conducted RBI and the significant reduction in crude price. In line with the expectations, the MPC reduced repo by 25 bps and shifted its policy stance to 'accommodative' from 'neutral'. The MPC reiterated its commitment to achieve the medium-term target for headline inflation of 4% within a band of +/- 2%, while supporting growth. During the month of May'19, global market remained volatile on the back of weak economic data, a non-conclusive US-China trade negotiation as well as the continued tension in the political landscape of Eurozone. Brent crude prices recovered during May'19, supported by OPEC and its allies' signal of extending their production cut plan to support oil prices. India 10-year yields reduced by 38bp to 7.03% (new benchmark) as on 31st May'19. India's economy slowed to sharply to 5.8% in Q4FY19 from 6.6% in the previous quarter. The growth of the economy thus slowed down for the entire fiscal, came in at 6.8%, slower than the growth of 7.2% in the previous fiscal. While inflation has remained subdued, and other key macros have not been supportive with growth and export numbers both disappointing., The forecast of a delayed but near-normal monsoon rainfall this year coupled with slower growth will likely keep inflation under control, opening room for at least one more rate cut.
4Further the MPC highlighted number of factors affecting growth and thought that inflation was well under control. The next big event for the market would be the Union Budget in Jul'19. Markets would also eagerly wait for the announcement of the liquidity framework by the RBI.
4Domestically, a near normal monsoon is expected to keep food inflation benign in near future whilst fall in oil prices is likely to ease pressure on inflation. RBI's will continue to keep a close watch on the macroeconomic and financial developments in the coming months and this year's monsoon has become critical for the overall prospects of the economy.
4The market reacted positively to the MPC outcome with 10Y rallying to 6.87% (from previous close of 7.02%) as the change in stance to “accommodative” was a bit of surprise to markets. Going forward we expect the 10Y to remain in a range of 6.75%-7.00% with a downward bias. Looking towards the marked improvement in system liquidity and monetary loosening driven by RBI, the Government intends to provide stimulus by way of tax cut and economy could improve.
4We continue to favour short term corporate bond space, as a combination of further anticipated rate cuts and improving liquidity would likely lead to continued downward movement in the 2-5-year high quality corporate bonds. Further FII flows should also support bonds in the short end of the curve. Investment in CR Low Duration, CR Short Duration and CR Corporate bond fund can be made in line with investment horizon
**ICRA MFI Explorer, Bloomberg
Mr. Avnish Jain
Head - Fixed Income

Snapshot of Equity Schemes / Debt Schemes / Hybrid & Other Schemes (as on May 31, 2019)
Canara Robeco Canara Robeco Canara Robeco Canara Robeco Canara Robeco Canara Robeco Canara Robeco Canara Robeco Liquid Fund Ultra Short Savings Fund Short Duration Income Fund Dynamic Corporate Gilt Fund
Term Fund Fund Bond Fund Bond Fund
Liquid Fund Ultra Short Low Short Medium to Long Dynamic Fund Corporate Gilt FundDuration Fund Duration Fund Duration Fund Duration Fund Bond Fund
1,005.55 142.18 1,020.05 298.63 103.40 108.55 172.45 79.49
0.05 0.42 0.89 1.77 7.76 9.11 3.57 10.58
6.87 6.98 7.33 7.59 7.80 7.62 7.85 7.25
0.04 0.38 0.70 1.48 5.12 6.01 2.63 6.94
Crisil Liquid Fund Index CRISIL Ultra CRISIL Short CRISIL Composite Bond Fund Index Crisil Dynamic Short Term Term Bond Gilt Fund IndexDebt Index Fund Index
Mr. Girish Hisaria, Ms. Suman Prasad Ms. Suman Prasad Mr. Avnish Jain Mr. Girish Hisaria Mr. Avnish Jain Mr. Girish Hisaria
Nil Nil Nil Nil 1% - if redeemed/ -If redeemed / For any redemption Nilswitched out switched out / switch out upto
within 12 months within six 10% of units withinfrom the date months from 1 Year from theof allotment the date of date of allotment
allotment: 0.50% - Nil-If redeemed / For any redemptionswitched out / switch out more
after six than 10% of unitsmonths from within 1 Year fromthe date of the date of
allotment: Nil allotment - 1%For any redemption
/switch out after1 Year from the
date of allotment- Nil
Exit Load
Category
AUM (Crs)
Average Maturity(Yrs)
Yield to Maturity(%)
Modified Duration(Yrs)
Benchmark
Fund Manager
DEBT SCHEMES
Canara Robeco Conservative Canara Robeco Equity Hybrid Fund Canara Robeco Gold Canara Robeco Gold Savings FundHybrid Fund Exchange Traded Fund
HYBRID &OTHER SCHEMES
Conservative Hybrid Fund Aggressive Hybrid Fund ETF Fund of Fund (Domestic)
198.59 2,242.08 35.84 34.66
4.77 10.69 - -
1.09 1.09 - -
0.30 0.65 - -
0.79 0.89 - -
- - 0.07 -
1.56 3.73 - -
5.03 - 0.00 0.01
7.93 - - -
3.52 - - -
CRISIL Hybrid 85+15-Conservative Index CRISIL Hybrid 35+65 - Aggressive Index Domestic Price of gold Domestic Price of gold
Mr. Miyush Gandhi (Equities), Mr. Shridatta Bhandwaldar (Equities), Mr. Avnish Jain, Ms. Suman Prasad Mr. Avnish Jain (Fixed Income) Mr. Krishna Sanghavi (Equities),
Mr. Avnish Jain (Fixed Income)
For any redemption / switch out upto 10% of units within Nil for redemption of the 2%- If redeemed or switched out on or 1 Year from the date of allotment - Nil units through Stock Exchange. before completion of 1 year from the date
For any redemption / switch out more than 10% of units within CDSC – Nil of allotment of units, Nil - If redeemed or 1 Year from the date of allotment - 1% switched out after the completion of 1 year
For any redemption/switch out after 1 Year from the date of allotment - Nil from the date of allotment of units
Category
AUM (Crs)
Standard Deviation
Beta
Sharpe
R-Squared
Annualised Tracking Error
Portfolio Turnover Ratio
Average Maturity(Yrs)
Yield to Maturity(%)
Modified Duration(Yrs)
Benchmark
Fund Manager
Exit Load
5
Canara Robeco Equity Canara Robeco Canara Robeco Canara Robeco Canara Robeco Canara Robeco Diversified Fund Blue Chip Equity Fund Emerging Equities Infrastructure Consumer Trends Fund Small Cap Fund Tax Saver Fund
Canara Robeco Equity
Multi Cap Fund Large Cap Fund Large & Mid Thematic - Thematic- Small Cap Fund ELSS
1,265.41 199.48 4,890.39 122.10 334.82 294.89 982.77
14.70 14.44 17.42 18.87 17.54 - 15.10
0.98 0.98 1.07 0.80 1.13 - 1.01
0.67 0.58 0.65 0.23 0.60 - 0.61
0.87 0.87 0.89 0.71 0.78 - 0.84
0.88 0.96 0.83 0.89 1.24 0.2 1.77
S&P BSE 200 TRI S&P BSE 100 TRI S&P BSE India S&P BSE 100 TRI Nifty Smallcap S&P BSE 100 TRI
ConsumptionCap Fund Infrastructure & Finance Theme
NIFTY Large Midcap 250 TRI Infrastructure TRI 250 Index TRI
Mr. Shridatta Mr. Shridatta Mr. Miyush Gandhi Mr. Shridatta Ms. Cheenu Gupta Mr. Krishna Sanghavi Ms. Cheenu GuptaBhandwaldar Bhandwaldar Mr. Krishna Sanghavi Bhandwaldar Mr. Krishna Sanghavi Ms. Cheenu Gupta Mr. Krishna Sanghavi
Mr. Krishna Sanghavi Mr. Krishna Sanghavi Mr. Krishna Sanghavi
1% - if redeemed/switched out within 1 year from the date of allotment. NilNil – if redeemed / switched out after 1 year from the date of allotment.
Exit Load
EQUITY SCHEMES
Category
AUM (Crs)
Standard Deviation
Beta
Sharpe
R-Squared
Portfolio Turnover Ratio
Benchmark
Fund Manager

$Source ICRA MFI Explorer = # Monthend AUM as on 31.05.2019= ^The expense ratios mentioned for the schemes includes GST on investment management fees.
=*As on date the said facility is available only in offline mode.= Please refer page no. 39 for disclaimers.
PRODUCT POSITIONING
Canara Robeco Equity Diversified Fund is an open ended multi cap fund and follows a predominantly bottom-up investment approach with a focus on fundamentally sound companies which are likely to deliver superior capital appreciation over the long-term. The fund also takes Top-down approach to identify sectoral themes based on the available opportunities. The fund is a market agnostic fund and take exposure across large, mid and small cap companies having high conviction ideas. The fund provides a blend of ‘Growth’ and ‘Value’ style of investing.
PORTFOLIO
Name of the Instruments % to NAV
Equities 94.94Listed 94.94Banks 28.21HDFC Bank Ltd 8.14ICICI Bank Ltd 7.29Axis Bank Ltd 4.39State Bank of India 3.68Kotak Mahindra Bank Ltd 2.22City Union Bank Ltd 1.30RBL Bank Ltd 1.19
Construction Project 9.60Larsen & Toubro Ltd 6.30KEC International Ltd 1.20Ashoka Buildcon Ltd 1.07Engineers India Ltd 1.03
Software 7.98Infosys Ltd 4.36Tech Mahindra Ltd 1.61Tata Consultancy Services Ltd 1.25Larsen & Toubro Infotech Ltd 0.76
Consumer Non Durables 6.57ITC Ltd 3.12Hindustan Unilever Ltd 1.91Asian Paints Ltd 1.54
Petroleum Products 5.18Reliance Industries Ltd 4.26Hindustan Petroleum Corporation Ltd 0.92
Finance 4.37Housing Development Finance Corporation Ltd 2.20ICICI Prudential Life Insurance Com Ltd 1.20Mahindra & Mahindra Financial Services Ltd 0.97
Cement 3.88Century Textiles & Industries Ltd 1.25The Ramco Cements Ltd 1.19Ultratech Cement Ltd 0.81Shree Cement Ltd 0.63
Consumer Durables 3.47Voltas Ltd 1.05
Titan Company Ltd 1.02Whirlpool Of India Ltd 0.74Havells India Ltd 0.66
Industrial Capital Goods 3.32Siemens Ltd 1.36Honeywell Automation India Ltd 1.15ISGEC Heavy Engineering Ltd 0.81
Pharmaceuticals 3.13Divi’s Laboratories Ltd 1.41IPCA Laboratories Ltd 1.16Jubilant Life Sciences Ltd 0.56
Power 2.83NTPC Ltd 1.79Cesc Ltd 1.04
Industrial Products 2.11Schaeffler India Ltd 0.97AIA Engineering Ltd 0.66Bharat Forge Ltd 0.48
Auto 2.03Maruti Suzuki India Ltd 1.22Mahindra & Mahindra Ltd 0.81
Transportation 2.00TCI Express Ltd 1.06Transport Corporation of India Ltd 0.94
Chemicals 1.99Atul Ltd 1.04Solar Industries India Ltd 0.95
Gas 1.97Gujarat Gas Ltd 0.99GAIL (India) Ltd 0.98
Auto Ancillaries 1.92Balkrishna Industries Ltd 1.04Endurance Technologies Ltd 0.88
Telecom - Services 1.61Bharti Airtel Ltd 1.61
Ferrous Metals 1.27Tata Steel Ltd 1.27Hotels, Resorts And Other Recreational Activities 1.22The Indian Hotels Co Ltd 1.22
Textile Products 0.28Page Industries Ltd 0.28
Money Market Instruments 5.72Tri-party repo 5.72
Net Current Assets -0.66
Grand Total ( Net Asset) 100.00
CANARA ROBECO EQUITY DIVERSIFIED FUND (CREDF)
lCapital appreciation over long term
lInvestment in equity and equity related instruments across large cap, mid cap, small cap stocks
This product is suitable for investors who are seeking*:
*Investors should consult their financial advisers if in doubt about whether the product is suitable for them.Investors understand that their principal
will be at Moderately High Risk
$QUANTITATIVE INFORMATION
Standard Deviation 14.70
Portfolio Beta 0.98
Portfolio Turnover Ratio 0.88 times
R-Squared 0.87
Sharpe Ratio 0.67
FUND INFORMATION
CATEGORY/TYPE: Multi Cap Fund - An open-ended equity scheme investing across large cap, mid cap, small cap stocks
SCHEME OBJECTIVE: To generate capital appreciation by investing in equity and equity related securities. However, there can be no assurance that the investment objective of the scheme will be realized.
NAV: (as on May 31, 2019)Direct Plan - Dividend Option ` 51.50Regular Plan - Dividend Option ` 36.64Direct Plan - Growth Option ` 143.53Regular Plan - Growth Option ` 138.19
DATE OF ALLOTMENT: September 16, 2003
ASSET ALLOCATION:
Equity & Equity Related Instruments - 65% to 100% (Risk- High)Debt and money- market instruments - 0% to 35% (Risk- Low to medium)Reits/Invits- 0% to 10% (Risk- Medium to High)
MINIMUM INVESTMENT: ` 5000 and in multiples of ̀ 1 thereafterSubsequent purchases: Minimum amount of ` 1000 and multiples of ̀ 1 thereafterSIP: For Any date*/monthly frequency – ` 1000 and in multiples of ̀ 1 thereafterFor quarterly frequency – ̀ 2000 and in multiples of ̀ 1 thereafter STP: For Daily/Weekly/Monthly frequency – ` 1000 and in multiples of ̀ 1 thereafterFor quarterly frequency – ̀ 2000 and in multiples of ̀ 1 thereafterSWP: For monthly frequency – ` 1000 and in multiples of ̀ 1 thereafterFor quarterly frequency – ̀ 2000 and in multiples of ̀ 1 thereafter
PLANS / OPTIONS :
Regular Plan- Growth Option Regular Plan- Dividend Reinvestment Option/ Payout Option
Direct Plan- Growth OptionDirect Plan- Dividend Reinvestment Option/ Payout Option
ENTRY LOAD: Nil
EXPENSE RATIO^:
Regular Plan : 2.45%
Direct Plan : 1.55%
BENCHMARK: S&P BSE 200 TRI
FUND MANAGER: 1) Mr. Shridatta Bhandwaldar2) Mr. Krishna Sanghavi
TOTAL EXPERIENCE: 1) 11 Years2) 23 Years
MANAGING THIS FUND: 1) Since 5-July-162) Since 16-Oct-18
#Monthend AUM : 1,265.41 Crores
Monthly AVG AUM : ` 1,194.53 Crores
EXIT LOAD:
1% - if redeemed/switched out within 1 year from the date of allotment.
Nil – if redeemed / switched out after 1 year from the date of allotment.
`
(as on May 31, 2019)
RISKOMETER
6
MARKET CAPITALIZATION
Large Cap 69.00%
Mid Cap 19.83%
Small Cap 6.11%
Debt, Cash & Others 5.06%

$ Monthend AUM as on 31.05.2019= ^The expense ratios mentioned for the schemes includes GST on investment management fees. =*As on date the said facility is available only in offline mode. = Please refer page no. 39 for disclaimers.
Source ICRA MFI Explorer = #
PRODUCT POSITIONING
Canara Robeco Bluechip Equity Fund is an open ended large cap fund which will invest in Top 100 companies based on their Market capitalization. The fund provides a blend of 'Growth' and 'Value' style of investing. The fund aims to benefit from the growing Indian economy by investing in large cap stocks as they have a potential to grow in tandem with Indian economy.
PORTFOLIO Name of the Instruments % to NAV
Equities 94.98Listed 94.98Banks 28.88HDFC Bank Ltd 9.06ICICI Bank Ltd 7.02Axis Bank Ltd 4.93State Bank of India 4.36Kotak Mahindra Bank Ltd 3.51
Consumer Non Durables 9.89ITC Ltd 4.04Asian Paints Ltd 2.14Hindustan Unilever Ltd 2.05Nestle India Ltd 1.66
Software 7.79Infosys Ltd 4.09Tata Consultancy Services Ltd 2.24Tech Mahindra Ltd 1.46
Construction Project 6.87Larsen & Toubro Ltd 6.87
Petroleum Products 6.38Reliance Industries Ltd 5.16Hindustan Petroleum Corporation Ltd 1.22
Pharmaceuticals 5.37Abbott India Ltd 2.37Dr Reddy’s Laboratories Ltd 1.61Divi’s Laboratories Ltd 1.39
Gas 5.31Gujarat Gas Ltd 2.36GAIL (India) Ltd 1.74Indraprastha Gas Ltd 1.21
Cement 4.70Century Textiles & Industries Ltd 1.75Grasim Industries Ltd 1.67Ultratech Cement Ltd 1.28
Finance 4.54Housing Development Finance Corporation Ltd 3.12ICICI Prudential Life Insurance Com Ltd 1.42
Consumer Durables 3.87Whirlpool Of India Ltd 1.10Havells India Ltd 1.00Titan Company Ltd 0.91Voltas Ltd 0.86
Industrial Capital Goods 3.08Siemens Ltd 1.67Thermax Ltd 1.41
Auto 2.74Maruti Suzuki India Ltd 1.41Mahindra & Mahindra Ltd 1.33
Power 2.50NTPC Ltd 2.50
Telecom - Services 1.73Bharti Airtel Ltd 1.73
Ferrous Metals 1.33Tata Steel Ltd 1.33
Money Market Instruments 5.55Tri-party repo 5.55
Net Current Assets -0.53
Grand Total ( Net Asset) 100.00
lCapital appreciation over long term
lInvesting predominantly in equities and equity related instruments of large cap companies
This product is suitable for investors who are seeking*:
*Investors should consult their financial advisers if in doubt about whether the product is suitable for them.
Investors understand that their principalwill be at Moderately High Risk
$QUANTITATIVE INFORMATION
Standard Deviation 14.44
Portfolio Beta 0.98
Portfolio Turnover Ratio 0.96 times
R-Squared 0.87
Sharpe Ratio 0.58
FUND INFORMATION
CATEGORY/TYPE : Large Cap Fund - An open ended equity scheme predominantly investing in large cap stocks
SCHEME OBJECTIVE :
The Investment Objective of the fund is to provide capital appreciation by predominantly investing in companies having a large market capitalization. However, there can be no assurance that the investment objective of the scheme will be realized.
NAV: (as on May 31, 2019)Direct Plan - Dividend Option ` 24.81Regular Plan - Dividend Option ` 17.00Direct Plan - Growth Option ` 27.14Regular Plan - Growth Option ` 25.53
DAT E OF ALLOTMENT : August 20, 2010
ASSET ALLOCATION :
Large Cap equity and equity related instruments* - 80% to 100% (Risk- High)
Other Equity and equity related instruments - 0% to 20% (Risk- Low)
Debt and Money Market Instruments - 0% to 20% (Risk- Low to Medium)
Reits/Invits- 0% to 10% (Risk- Medium to High)
*As defined by SEBI Circular No. SEBI / HO / IMD / DF3 / CIR / P / 2017 / 114 dated October 06, 2017 and SEBI/HO/IMD/DF3/CIR/P/2017/126 dated December 04, 2017 and as amended from time to time (currently it defines Large Cap Companies as those which are ranked from 1 to 100 based on their full market capitalization).
MINIMUM INVESTMENT:
` 5000 and in multiples of ̀ 1 thereafterSubsequent purchases: Minimum amount of ` 1000 and multiples of ̀ 1 thereafterSIP: For Any date*/monthly frequency – ` 1000 and in multiples of ̀ 1 thereafterFor quarterly frequency – ` 2000 and in multiples of ̀ 1 thereafter STP: For Daily/Weekly/Monthly frequency – ` 1000 and in multiples of ̀ 1 thereafterFor quarterly frequency – ̀ 2000 and in multiples of ̀ 1 thereafterSWP: For monthly frequency – ` 1000 and in multiples of ̀ 1 thereafterFor quarterly frequency – ` 2000 and in multiples of ̀ 1 thereafter
PLANS / OPTIONS : Regular Plan- Growth Option Regular Plan- Dividend Reinvestment Option/ Payout Option
Direct Plan- Growth OptionDirect Plan- Dividend Reinvestment Option/ Payout Option
ENTRY LOAD: Nil
#Monthend AUM : ` 199.48 Crores
Monthly AVG AUM : ` 188.74 Crores
EXIT LOAD:
1% - if redeemed/switched out within 1 year from the date of allotment.
Nil – if redeemed / switched out after 1 year from the date of allotment
RISKOMETER
CANARA ROBECO BLUE CHIP EQUITY FUND (CRBCEF) (as on May 31, 2019)
EXPENSE RATIO^:
Regular Plan : 2.70%Direct Plan : 1.49%
BENCHMARK : S&P BSE 100 TRI
FUND MANAGER : 1) Mr. Shridatta Bhandwaldar 2) Krishna Sanghavi
TOTAL EXPERIENCE : 1) 11 Years2) 23 Years
MANAGING THIS FUND : 1) Since 5-July-162) Since 16-Oct-18
7
MARKET CAPITALIZATION
Large Cap 83.92%
Mid Cap 11.06%
Debt, Cash & Others 5.02%

MARKET CAPITALIZATION
Large Cap 51.89%
Mid Cap 38.83%
Small Cap 6.35%
Debt, Cash & Others 2.93%
$ Monthend AUM as on 31.05.2019=̂The expense ratios mentioned for the schemes includes GST on investment management fees.
=*As on date the said facility is available only in offline mode.= Please refer page no. 39 for disclaimers.
Source ICRA MFI Explorer = #
CANARA ROBECO EMERGING EQUITIES (CREE)
PRODUCT POSITIONING
Canara Robeco Emerging Equities being an open
ended large & mid cap fund, follows a bottom-up
approach to predominantly invest in a well
diversified portfolio of companies within large &
mid cap universe. The fund endeavours to identify
the stars of tomorrow within the segment.
PORTFOLIO Name of the Instruments % to NAV
Equities 97.07Listed 97.07Banks 28.92ICICI Bank Ltd 6.13HDFC Bank Ltd 5.90Axis Bank Ltd 4.07State Bank of India 3.35Kotak Mahindra Bank Ltd 2.94The Federal Bank Ltd 2.52RBL Bank Ltd 1.99City Union Bank Ltd 1.10Bank of Baroda 0.76AU Small Finance Bank Ltd 0.16Software 7.32Infosys Ltd 2.97Tech Mahindra Ltd 1.77Tata Consultancy Services Ltd 1.49Larsen & Toubro Infotech Ltd 1.09Pharmaceuticals 5.71Divi’s Laboratories Ltd 1.80IPCA Laboratories Ltd 1.47Syngene International Ltd 1.06Jubilant Life Sciences Ltd 0.88Hikal Ltd 0.50Construction Project 5.11Larsen & Toubro Ltd 4.20Ashoka Buildcon Ltd 0.91Auto Ancillaries 4.53Balkrishna Industries Ltd 1.50Minda Industries Ltd 1.29Sundram Fasteners Ltd 0.87Exide Industries Ltd 0.87Consumer Non Durables 4.43ITC Ltd 3.15Britannia Industries Ltd 1.28Cement 4.30Grasim Industries Ltd 1.45Century Textiles & Industries Ltd 1.43The Ramco Cements Ltd 1.42Chemicals 3.64Atul Ltd 1.95
Navin Fluorine International Ltd 0.88Solar Industries India Ltd 0.81Industrial Capital Goods 3.61Siemens Ltd 1.11Honeywell Automation India Ltd 1.05ISGEC Heavy Engineering Ltd 0.76Bharat Electronics Ltd 0.62The Anup Engineering Ltd 0.07Industrial Products 3.59AIA Engineering Ltd 1.48Schaeffler India Ltd 1.18Bharat Forge Ltd 0.93Petroleum Products 3.39Reliance Industries Ltd 3.39Gas 3.08Gujarat Gas Ltd 1.12Indraprastha Gas Ltd 1.01GAIL (India) Ltd 0.95Finance 2.99Mahindra & Mahindra Financial Services Ltd 1.96Creditaccess Grameen Ltd 1.03Consumer Durables 2.75Whirlpool Of India Ltd 1.44Voltas Ltd 1.31Retailing 2.05Aditya Birla Fashion and Retail Ltd 1.05Arvind Fashions Ltd 0.61Spencers Retail Ltd 0.39Auto 1.94Maruti Suzuki India Ltd 1.01Mahindra & Mahindra Ltd 0.93Hotels, Resorts And Other Recreational Activities 1.73The Indian Hotels Co Ltd 1.73Power 1.48Cesc Ltd 1.48Services 1.44Dalmia Bharat Ltd 1.44Transportation 1.20Transport Corporation of India Ltd 0.65TCI Express Ltd 0.55Telecom - Services 1.15Bharti Airtel Ltd 1.15Ferrous Metals 1.00Tata Steel Ltd 1.00Media & Entertainment 0.91Sun TV Network Ltd 0.91Fertilisers 0.80Coromandel International Ltd 0.80Money Market Instruments 3.11Tri-party repo 3.11
Net Current Assets -0.18
Grand Total ( Net Asset) 100.00
lCapital appreciation over long term
lInvesting predominantly in equities and equity related instruments of both large cap and mid cap companies
This product is suitable for investors who are seeking*:
*Investors should consult their financial advisers if in doubt about whether the product is suitable for them.Investors understand that their principal
will be at Moderately High Risk
$QUANTITATIVE INFORMATION
Standard Deviation 17.42
Portfolio Beta 1.07
Portfolio Turnover Ratio 0.83 times
R-Squared 0.89
Sharpe Ratio 0.65
(as on May 31, 2019)
FUND INFORMATION
CATEGORY/TYPE: Large & Mid Cap Fund - An open ended equity scheme investing in both large cap and mid cap stocks
SCHEME OBJECTIVE: To generate capital appreciation by investing in a diversified portfolio of large and mid-cap stocks. However, there can be no assurance that the investment objective of the scheme will be realized.
NAV: (as on May 31, 2019)Direct Plan - Dividend Option ` 62.09Regular Plan - Dividend Option ` 45.12Direct Plan - Growth Option ` 102.44Regular Plan - Growth Option ` 95.90
DATE OF ALLOTMENT: March 11, 2005
ASSET ALLOCATION: Large Cap equity and equity related instruments* - 35% to 65%. (Risk- High)Mid Cap equity and equity related instruments* - 35% to 65% (Risk- High)Other equity and equity related instruments, debt and money market instruments - 0% to 30% (Risk- Low to Medium)Reits/Invits- 0% to 10%.(Risk- Medium to High)*As defined by SEBI Circular No. SEBI / HO / IMD / DF3 / CIR / P / 2017 / 114 dated October 06, 2017 and SEBI/HO/IMD/DF3/CIR/P/2017/126 dated December 04, 2017 as amended from time to time. (Currently it defines Large Cap Companies as those which are ranked from 1 to 100 and Mid Cap Companies as those which are ranked from 101 to 250 based on their full market capitalization.)
MINIMUM INVESTMENT:
` 5000 and in multiples of ̀ 1 thereafterSubsequent purchases: Minimum amount of ` 1000 and multiples of ̀ 1 thereafterSIP: For Any date*/monthly frequency – ` 1000 and in multiples of ̀ 1 thereafterFor quarterly frequency – ` 2000 and in multiples of ̀ 1 thereafter STP: For Daily/Weekly/Monthly frequency – ` 1000 and in multiples of ̀ 1 thereafterFor quarterly frequency – ̀ 2000 and in multiples of ̀ 1 thereafterSWP: For monthly frequency – ` 1000 and in multiples of ̀ 1 thereafterFor quarterly frequency – ` 2000 and in multiples of ̀ 1 thereafter
PLANS / OPTIONS : Regular Plan- Growth Option Regular Plan- Dividend Reinvestment Option/ Payout OptionDirect Plan- Growth OptionDirect Plan- Dividend Reinvestment Option/ Payout Option
ENTRY LOAD: Nil
EXPENSE RATIO^:
Regular Plan : 1.87%Direct Plan : 0.82%
BENCHMARK : NIFTY Large Midcap 250 TRI
#Monthend AUM : ` 4,890.39 Crores
Monthly AVG AUM : ` 4,679.51 Crores
EXIT LOAD : 1% - If redeemed/switched out within 1 year from the date of allotmentNil - if redeemed/switched out after 1 year from the date of allotment
FUND MANAGER: 1) Mr. Miyush Gandhi2) Krishna Sanghavi
TOTAL EXPERIENCE: 1) 10 Years2) 23 Years
MANAGING THIS FUND: 1) Since 5-April-182) Since 16-Oct-18
RISKOMETER
8
$ Monthend AUM as on 31.05.2019 = ^The expense ratios mentioned for the schemes includes GST on investment management fees.=*As on date the said facility is available only in offline mode.= Please refer page no. 39 for disclaimers.
Source ICRA MFI Explorer = #
PORTFOLIO
Name of the Instruments % to NAV
Equities 93.70Listed 93.70Finance 9.70ICICI Prudential Life Insurance Com Ltd 2.47Can Fin Homes Ltd 1.84Multi Commodity Exchange Of India Ltd 1.67Equitas Holdings Ltd 1.65Central Depository Services (India) Ltd 1.27Creditaccess Grameen Ltd 0.80Pharmaceuticals 8.34Dishman Carbogen Amcis Ltd 2.52JB Chemicals & Pharmaceuticals Ltd 2.15Hikal Ltd 1.65Laurus Labs Ltd 1.21Jubilant Life Sciences Ltd 0.81Construction 7.84Cera Sanitaryware Ltd 2.07KNR Constructions Ltd 1.66Ahluwalia Contracts (India) Ltd 1.59ITD Cementation India Ltd 1.34Prestige Estates Projects Ltd 1.18Cement 6.27Century Textiles & Industries Ltd 3.97JK Cement Ltd 2.30Banks 6.03The Federal Bank Ltd 2.37Karur Vysya Bank Ltd 1.32The Karnataka Bank Ltd 1.31RBL Bank Ltd 1.03Auto Ancillaries 5.94Automotive Axles Ltd 1.74Subros Ltd 1.50Asahi India Glass Ltd 1.38Apollo Tyres Ltd 1.32Consumer Non Durables 5.88Coffee Day Enterprises Ltd 2.10Balrampur Chini Mills Ltd 1.99Dcm Shriram Ltd 1.13Bajaj Consumer Care Ltd 0.66
lCapital appreciation over long term
lInvesting predominantly in equities and equity related instruments of small cap companies
This product is suitable for investors who are seeking*:
*Investors should consult their financial advisers if in doubt about whether the product is suitable for them.Investors understand that their principal
will be at Moderately High Risk
FUND INFORMATION
CATEGORY/TYPE: Small Cap Fund -An open-ended equity scheme predominantly investing in small cap stocks.
SCHEME OBJECTIVE: The investment objective of the Scheme is to generate capital appreciation by investing predominantly in Small Cap stocks. However, there can be no assurance that the investment objective of the scheme will be realized.
NAV: (as on May 31, 2019)Direct Plan - Dividend Option ` 10.42Regular Plan - Dividend Option ` 10.37Direct Plan - Growth Option ` 10.42Regular Plan - Growth Option ` 10.37
DATE OF ALLOTMENT: February 15, 2019
ASSET ALLOCATION:
Equity and Equity-related Instruments of Smallcap companies* 65% to 100% (High)
Equity and Equity-related Instruments of companies other than Smallcap companies 0% to 35% (High)
Debt and Money Market Instruments 0% to 35% (Low to Medium)
Units issued by REITs and InvITs 0% to 10% (Medium to High)
*Investment universe of "Small Cap": The investment universe of "Small Cap" shall comprise companies as defined by SEBI from time to time. In terms of SEBI circular SEBI/ HO/ IMD/ DF3/ CIR/ P/ 2017/ 114 dated October 6, 2017, the universe of "Small Cap" shall consist of 251st company onwards in terms of full market capitalization
MINIMUM INVESTMENT: ` 5000 and in multiples of ̀ 1 thereafterSubsequent purchases: Minimum amount of ` 1000 and multiples of ̀ 1 thereafterSIP: For Any date*/monthly frequency – ` 1000 and in multiples of ̀ 1 thereafterFor quarterly frequency – ` 2000 and in multiples of ̀ 1 thereafter STP: For Daily/Weekly/Monthly frequency – ` 1000 and in multiples of ̀ 1 thereafterFor quarterly frequency – ̀ 2000 and in multiples of ̀ 1 thereafterSWP: For monthly frequency – ` 1000 and in multiples of ̀ 1 thereafterFor quarterly frequency – ` 2000 and in multiples of ̀ 1 thereafter
PLANS / OPTIONS : Regular Plan- Growth Option Regular Plan- Dividend: Reinvestment/ PayoutDirect Plan- Growth OptionDirect Plan- Dividend: Reinvestment/ Payout
ENTRY LOAD: Nil
#Monthend AUM : ` 294.89 Crores
Monthly AVG AUM : ` 272.05 Crores
EXIT LOAD: In respect of each purchase / switch-in of units,1% - if Units are redeemed / switched-out within 1 year from the date of allotment. Nil – if redeemed / switched out after 1 year from the date of allotment.
EXPENSE RATIO^:
Regular Plan : 2.38%Direct Plan : 0.72%
BENCHMARK: Nifty Smallcap 250 Index TRI
FUND MANAGER : 1) Mr. Krishna Sanghavi2) Ms. Cheenu Gupta
TOTAL EXPERIENCE : 1) 23 Years2) 12 Years
MANAGING THIS FUND : 1) Since 15-February-192) Since 15-February-19
CANARA ROBECO SMALL CAP FUND (CRSCF) (as on May 31, 2019)
RISKOMETER
Construction Project 5.80Engineers India Ltd 2.25KEC International Ltd 1.96Ashoka Buildcon Ltd 1.59Consumer Durables 5.26Orient Electric Ltd 1.35VIP Industries Ltd 1.25Greenply Industries Ltd 1.23Greenlam Industries Ltd 0.80Century Plyboards (India) Ltd 0.63Industrial Capital Goods 5.05ISGEC Heavy Engineering Ltd 1.74The Anup Engineering Ltd 1.33BEML Ltd 1.19Action Construction Equipment Ltd 0.79Software 4.84NIIT Ltd 1.90CESC Ventures Ltd 1.65Tech Mahindra Ltd 1.29Transportation 4.02TCI Express Ltd 1.43Future Supply Chain Solutions Ltd 1.35Spicejet Ltd 1.24Power 3.57Kalpataru Power Transmission Ltd 2.08JSW Energy Ltd 1.49Chemicals 3.38Deepak Nitrite Ltd 1.75Galaxy Surfactants Ltd 1.63Industrial Products 3.36Polycab India Ltd 1.09NRB Bearing Ltd 0.86KSB Ltd 0.80Orient Refractories Ltd 0.61Fertilisers 3.30EID Parry India Ltd 1.78Gujarat State Fertilizers & Chemicals Ltd 1.52Hotels, Resorts And Other Recreational Activities 1.93The Indian Hotels Co Ltd 1.25Delta Corp Ltd 0.68Paper 1.28JK Paper Ltd 1.28Retailing 0.98Spencers Retail Ltd 0.98Textile Products 0.39Siyaram Silk Mills Ltd 0.39Ferrous Metals 0.37Kirloskar Ferrous Industries Ltd 0.37Media & Entertainment 0.17Hathway Cable & Datacom Ltd 0.17Money Market Instruments 6.29Tri-party repo 6.29
Net Current Assets 0.01
Grand Total ( Net Asset) 100.00
PRODUCT POSITIONING
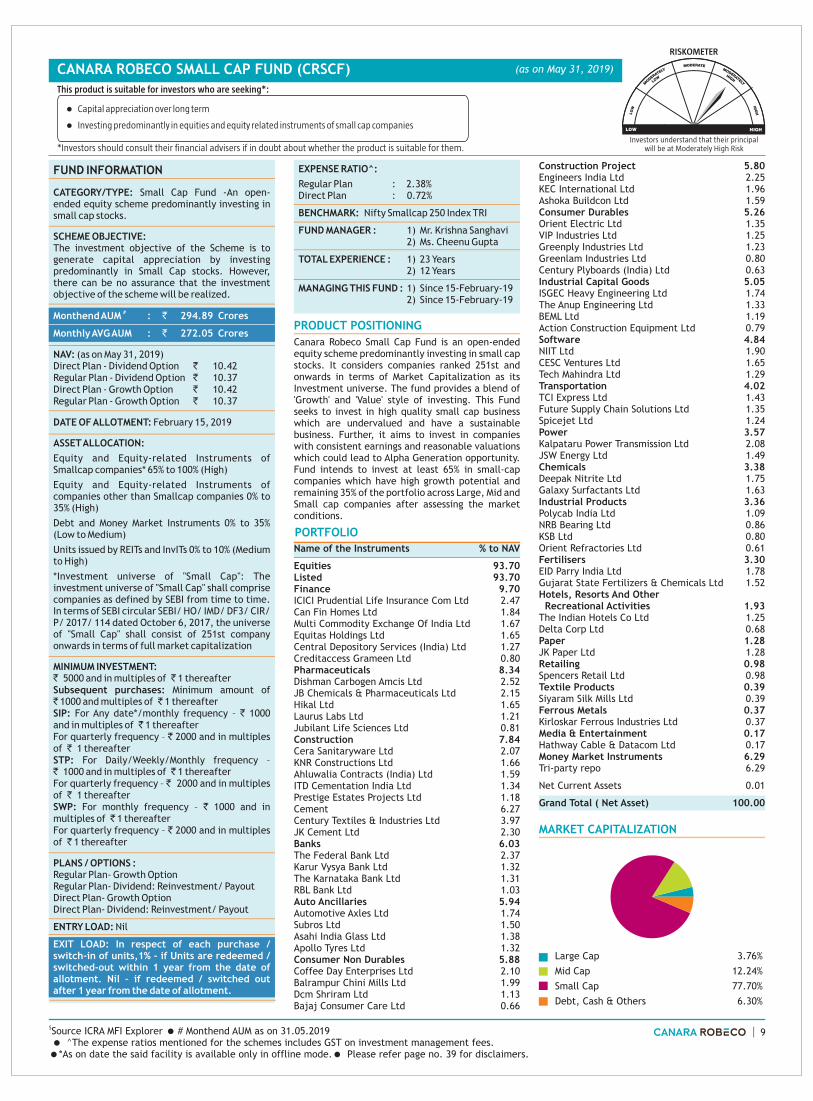
Canara Robeco Small Cap Fund is an open-ended equity scheme predominantly investing in small cap stocks. It considers companies ranked 251st and onwards in terms of Market Capitalization as its Investment universe. The fund provides a blend of 'Growth' and 'Value' style of investing. This Fund seeks to invest in high quality small cap business which are undervalued and have a sustainable business. Further, it aims to invest in companies with consistent earnings and reasonable valuations which could lead to Alpha Generation opportunity. Fund intends to invest at least 65% in small-cap companies which have high growth potential and remaining 35% of the portfolio across Large, Mid and Small cap companies after assessing the market conditions.
MARKET CAPITALIZATION
Large Cap 3.76%
Mid Cap 12.24%
Small Cap 77.70%
Debt, Cash & Others 6.30%
9

$ Monthend AUM as on 31.05.2019= ^The expense ratios mentioned for the schemes includes GST on investment management fees.
=*As on date the said facility is available only in offline mode.= Please refer page no. 39 for disclaimers.
Source ICRA MFI Explorer = #
CANARA ROBECO INFRASTRUCTURE (CRI)
Canara Robeco Infrastructure is an open ended
thematic fund which endeavours to capture
opportunities in the Indian infrastructure space.
The fund follows a thematic approach towards
Infrastructure with a 'Growth' style of investing. The
fund aims to have concentrated holdings on high
conviction ideas.
PRODUCT POSITIONING
PORTFOLIO Name of the Instruments % to NAV
Equities 96.12Listed 96.12Construction Project 20.33Larsen & Toubro Ltd 9.86Ashoka Buildcon Ltd 4.59KEC International Ltd 3.79Engineers India Ltd 2.09
Banks 16.45ICICI Bank Ltd 6.73State Bank of India 5.56Axis Bank Ltd 4.16
Power 12.85NTPC Ltd 4.82Power Grid Corporation Of India Ltd 3.87Cesc Ltd 2.43Tata Power Company Ltd 1.73
Industrial Capital Goods 8.24Siemens Ltd 4.10ISGEC Heavy Engineering Ltd 1.62The Anup Engineering Ltd 1.52Thermax Ltd 1.00
Gas 6.82GAIL (India) Ltd 2.63Gujarat Gas Ltd 2.49Petronet LNG Ltd 1.70
Cement 6.70The Ramco Cements Ltd 2.39Ultratech Cement Ltd 2.26Grasim Industries Ltd 2.05
Construction 6.01Ahluwalia Contracts (India) Ltd 2.11PNC Infratech Ltd 2.06ITD Cementation India Ltd 1.84
Transportation 5.89TCI Express Ltd 2.96Transport Corporation of India Ltd 2.93
Industrial Products 5.10Schaeffler India Ltd 2.11KSB Ltd 1.67AIA Engineering Ltd 1.32
Petroleum Products 4.87Reliance Industries Ltd 2.88Hindustan Petroleum Corporation Ltd 1.99
Telecom - Services 2.86Bharti Airtel Ltd 2.86
Money Market Instruments 4.77Tri-party repo 4.77
Net Current Assets -0.89
Grand Total ( Net Asset) 100.00
lCapital appreciation over long term
lInvesting in equities and equity related instruments of companies following the Infrastructure Theme
This product is suitable for investors who are seeking*:
*Investors should consult their financial advisers if in doubt about whether the product is suitable for them.Investors understand that their principal
will be at High Risk
$QUANTITATIVE INFORMATION
Standard Deviation 18.87
Portfolio Beta 0.80
Portfolio Turnover Ratio 0.89 times
R-Squared 0.71
Sharpe Ratio 0.23
(as on May 31, 2019)
RISKOMETER
FUND INFORMATION
CATEGORY/TYPE: Thematic - Infrastructure - An open-ended equity scheme fol lowing infrastructure theme
SCHEME OBJECTIVE: To generate income / capital appreciation by investing in equities and equity related instruments of companies in the infrastructure sector. However, there can be no assurance that the investment objective of the scheme will be realized.
NAV: (as on May 31, 2019)Direct Plan - Dividend Option ` 33.40Regular Plan - Dividend Option ` 25.50Direct Plan - Growth Option ` 49.26Regular Plan - Growth Option ` 46.91
DATE OF ALLOTMENT: December 2, 2005
ASSET ALLOCATION:
Equity and equity related instruments of companies in the Infrastructure sector including derivatives of such companies - 80% to 100% (Risk- High)
Debt and Money Market instruments - 0% to 20% (Risk- Low to Medium)
Reits/Invits- 0% to 10% (Risk- Medium to High)
MINIMUM INVESTMENT:
` 5000 and in multiples of ̀ 1 thereafterSubsequent purchases: Minimum amount of ` 1000 and multiples of ̀ 1 thereafterSIP: For Any date*/monthly frequency – ` 1000 and in multiples of ̀ 1 thereafterFor quarterly frequency – ̀ 2000 and in multiples of ̀ 1 thereafter STP: For Daily/Weekly/Monthly frequency – ` 1000 and in multiples of ̀ 1 thereafterFor quarterly frequency – ̀ 2000 and in multiples of ̀ 1 thereafterSWP: For monthly frequency – ` 1000 and in multiples of ̀ 1 thereafterFor quarterly frequency – ̀ 2000 and in multiples of ̀ 1 thereafter
PLANS / OPTIONS : Regular Plan- Growth Option Regular Plan- Dividend Reinvestment Option/ Payout OptionDirect Plan- Growth OptionDirect Plan- Dividend Reinvestment Option/ Payout Option
ENTRY LOAD: Nil
EXPENSE RATIO^:Regular Plan : 2.53%Direct Plan : 1.66%
BENCHMARK: S&P BSE India Infrastructure TRI
#Monthend AUM : ` 122.10 Crores
Monthly AVG AUM : ` 115.44 Crores
EXIT LOAD: 1% - if redeemed/switched out within 1 year from the date of allotment.Nil – if redeemed / switched out after 1 year from the date of allotment
FUND MANAGER: 1) 2) Mr. Krishna Sanghavi
TOTAL EXPERIENCE: 1) 11 Years2) 23 Years
MANAGING THIS FUND: 1) Since 29-Sept-182) Since 16-Oct-18
Mr. Shridatta Bhandwaldar
MARKET CAPITALIZATION
Large Cap 55.47%
Mid Cap 13.47%
Small Cap 27.18%
Debt, Cash & Others 3.88%
10

Investors understand that their principalwill be at High Risk
PRODUCT POSITIONING
Canara Robeco Consumer Trends Fund is an open ended thematic fund predominantly investing in companies which directly or indirectly benefit from the growing consumption demand in India and looks for opportunity to invest in companies which benefit from aspirational consumption and financial penetration theme. The fund will invest in stocks across the Market Capitalisation range and will look to follow 'Growth' style of investing.
PORTFOLIO
Name of the Instruments % to NAV
Equities 97.83Listed 97.83Consumer Non Durables 31.93Hindustan Unilever Ltd 6.71Dabur India Ltd 3.20Nestle India Ltd 3.00Balrampur Chini Mills Ltd 2.73Asian Paints Ltd 2.62Kansai Nerolac Paints Ltd 2.48Berger Paints India Ltd 2.39ITC Ltd 2.06Dcm Shriram Ltd 1.64Godrej Consumer Products Ltd 1.54Bajaj Consumer Care Ltd 1.38Britannia Industries Ltd 1.25Jubilant Foodworks Ltd 0.93
Banks 25.42ICICI Bank Ltd 7.57HDFC Bank Ltd 7.32Axis Bank Ltd 3.81State Bank of India 3.67Kotak Mahindra Bank Ltd 3.05
Consumer Durables 15.69Voltas Ltd 3.78Titan Company Ltd 3.76VIP Industries Ltd 3.37Havells India Ltd 1.87Orient Electric Ltd 1.46Whirlpool Of India Ltd 1.45
Petroleum Products 5.63Reliance Industries Ltd 2.34Hindustan Petroleum Corporation Ltd 2.32Bharat Petroleum Corporation Ltd 0.97
Finance 4.53Bajaj Finance Ltd 2.45Housing Development Finance Corporation Ltd 1.25Mahindra & Mahindra Financial Services Ltd 0.83
Chemicals 2.94Pidilite Industries Ltd 2.94
Gas 2.82Gujarat Gas Ltd 2.82
Telecom - Services 2.31Bharti Airtel Ltd 2.31
Textile Products 1.95Page Industries Ltd 1.06Siyaram Silk Mills Ltd 0.89
Construction 1.75Cera Sanitaryware Ltd 1.75
Pharmaceuticals 1.19IPCA Laboratories Ltd 1.19
Cement 0.92Century Textiles & Industries Ltd 0.92Hotels, Resorts And Other Recreational Activities 0.75Delta Corp Ltd 0.75
Money Market Instruments 3.71Tri-party repo 3.71
Net Current Assets -1.54
Grand Total ( Net Asset) 100.00
lCapital appreciation over long term
lInvesting in equity and equity related securities of companies following the Consumption and Financial Theme
This product is suitable for investors who are seeking*:
*Investors should consult their financial advisers if in doubt about whether the product is suitable for them.
$QUANTITATIVE INFORMATION
Standard Deviation 17.54
Portfolio Beta 1.13
Portfolio Turnover Ratio 1.24 times
R-Squared 0.78
Sharpe Ratio 0.60
FUND INFORMATION
CATEGORY/TYPE : Thematic - Consumption & Finance Theme - An open ended equity scheme following the consumption and financial theme
SCHEME OBJECTIVE: To provide long-term capital appreciation by primarily investing in equity and equity related securities of companies which directly or indirectly benefit from the growing consumer demand in India. However, there can be no assurance that the investment objective of the scheme will be realized.
NAV: (as on May 31, 2019)
Direct Plan - Dividend Option ` 39.12Direct Plan - Growth Option ` 42.14Regular Plan - Dividend Option ` 23.21Regular Plan - Growth Option ` 39.67
DATE OF ALLOTMENT: September 14, 2009
ASSET ALLOCATION:
Equity and equity related instruments of companies which directly or indirectly benefit from the growing consumer demand in India - 80% to 100%. (Risk- High)
Other Equity and equity related instruments - 0% to 20%. (Risk- High)
Debt and Money Market instruments - 0% to 20%. (Risk- Medium to Low)
Reits/Invits- 0% to 10% (Risk-medium to High)
MINIMUM INVESTMENT :` 5000 and in multiples of ̀ 1 thereafterSubsequent purchases: Minimum amount of ` 1000 and multiples of ̀ 1 thereafterSIP: For Any date*/monthly frequency – ` 1000 and in multiples of ̀ 1 thereafterFor quarterly frequency – ` 2000 and in multiples of ̀ 1 thereafter STP: For Daily/Weekly/Monthly frequency – ` 1000 and in multiples of ̀ 1 thereafterFor quarterly frequency – ̀ 2000 and in multiples of ̀ 1 thereafterSWP: For monthly frequency – ` 1000 and in multiples of ̀ 1 thereafterFor quarterly frequency – ` 2000 and in multiples of ̀ 1 thereafter
PLANS / OPTIONS :
Regular Plan - Growth Regular Plan - Dividend Reinvestment Regular Plan - Dividend Payout
Direct Plan- Growth OptionDirect Plan- Dividend Reinvestment Option/ Payout Option
ENTRY LOAD: Nil
EXPENSE RATIO^:Regular Plan : 2.61%Direct Plan : 1.33%
BENCHMARK : S&P BSE 100 TRI
#Monthend AUM : ` 334.82 Crores
Monthly AVG AUM : ` 322.20 Crores
EXIT LOAD :
1% - If redeemed/switched out within 1 year from the date of allotment.
Nil - if redeemed/switched out after 1 year from the date of allotment
FUND MANAGER: 1)2) Mr. Krishna Sanghavi
TOTAL EXPERIENCE: 1) 12 Years2) 23 Years
MANAGING THIS FUND: 1) Since 15-June-182) Since 16-Oct-18
Ms. Cheenu Gupta
RISKOMETER
$ Monthend AUM as on 31.05.2019=̂The expense ratios mentioned for the schemes includes GST on investment management fees.=*As on date the said facility is available only in offline mode.= Please refer page no. 39 for disclaimers.
Source ICRA MFI Explorer = #
CANARA ROBECO CONSUMER TRENDS FUND (CRCTF) (as on May 31, 2019)
MARKET CAPITALIZATION
Large Cap 69.46%
Mid Cap 14.40%
Small Cap 13.97%
Debt, Cash & Others 2.17%
11

$ Monthend AUM as on 31.05.2019= ^The expense ratios mentioned for the schemes includes GST on investment management fees.
=*As on date the said facility is available only in offline mode. = Please refer page no. 39 for disclaimers.
Source ICRA MFI Explorer = #
PRODUCT POSITIONING
Canara Robeco Equity Tax Saver Fund is an open ended ELSS with a 3 year lock-in period providing Tax Benefits under Sec 80 C of Income Tax Act. The fund benefits from long term investing due to its lock-in and benefits from power of compounding. The fund would invest in both large and mid cap stocks with a 'Growth' style of investing.
PORTFOLIO
Name of the Instruments % to NAV
Equities 98.14Listed 98.14Banks 25.82ICICI Bank Ltd 7.98HDFC Bank Ltd 7.56State Bank of India 4.89Axis Bank Ltd 4.22The Karnataka Bank Ltd 1.17
Consumer Non Durables 8.95Hindustan Unilever Ltd 2.98Balrampur Chini Mills Ltd 1.76Asian Paints Ltd 1.64Berger Paints India Ltd 1.14Dcm Shriram Ltd 0.92Nestle India Ltd 0.51
Construction Project 7.41Larsen & Toubro Ltd 6.60Ashoka Buildcon Ltd 0.81
Consumer Durables 7.16VIP Industries Ltd 2.81Voltas Ltd 2.15Havells India Ltd 1.24Titan Company Ltd 0.96
Industrial Capital Goods 6.05Honeywell Automation India Ltd 2.25Siemens Ltd 1.92BEML Ltd 1.01Action Construction Equipment Ltd 0.87
Petroleum Products 5.67Reliance Industries Ltd 4.77Hindustan Petroleum Corporation Ltd 0.90
Cement 4.71ACC Ltd 1.48Shree Cement Ltd 1.25JK Lakshmi Cement Ltd 1.03Ultratech Cement Ltd 0.48Century Textiles & Industries Ltd 0.47
Software 4.36Infosys Ltd 1.81Larsen & Toubro Infotech Ltd 1.33Tata Consultancy Services Ltd 1.22
Pharmaceuticals 4.29Divi’s Laboratories Ltd 2.88
Dishman Carbogen Amcis Ltd 1.41
Chemicals 4.05Aarti Industries Ltd 2.20Atul Ltd 0.95Solar Industries India Ltd 0.90
Construction 3.64Ahluwalia Contracts (India) Ltd 1.39KNR Constructions Ltd 1.35ITD Cementation India Ltd 0.90
Power 3.35NTPC Ltd 2.32Kalpataru Power Transmission Ltd 1.03
Finance 2.96Bajaj Finance Ltd 1.92Housing Development Finance Corporation Ltd 1.04
Industrial Products 2.85Schaeffler India Ltd 1.12KEI Industries Ltd 0.92Orient Refractories Ltd 0.81
Auto Ancillaries 1.72Endurance Technologies Ltd 0.88Apollo Tyres Ltd 0.84
Gas 1.68Gujarat Gas Ltd 1.68
Transportation 1.56Transport Corporation of India Ltd 1.56
Telecom - Services 1.55Bharti Airtel Ltd 1.55
Textile Products 0.36Page Industries Ltd 0.36
Money Market Instruments 2.55Tri-party repo 2.55
Net Current Assets -0.69
Grand Total ( Net Asset) 100.00
lCapital appreciation over long term
lInvestment in equity and equity related securities with a statutory lock in of 3 years and tax benefit
This product is suitable for investors who are seeking*:
*Investors should consult their financial advisers if in doubt about whether the product is suitable for them.Investors understand that their principal
will be at Moderately High Risk
$QUANTITATIVE INFORMATION
Standard Deviation 15.10
Portfolio Beta 1.01
Portfolio Turnover Ratio 1.77 times
R-Squared 0.84
Sharpe Ratio 0.61
FUND INFORMATION
CATEGORY/TYPE: ELSS - An open ended equity linked saving scheme with a statutory lock in of 3 years and tax benefit
SCHEME OBJECTIVE:
ELSS seeking to provide long term capital appreciation by predominantly investing in equities to facilitate the subscribers to seek tax benefits as provided under Section 80 C of the Income Tax Act, 1961. However, there can be no assurance that the investment objective of the scheme will be realized.
NAV: (as on May 31, 2019)Direct Plan - Dividend Option ` 40.15Regular Plan - Dividend Option ` 26.72Direct Plan - Growth Option ` 70.49Regular Plan - Growth Option ` 67.80
DATE OF ALLOTMENT: March 31, 1993
ASSET ALLOCATION:
Equity and equity related instruments - 80% to 100% (Risk- High)
Money Market instruments- 0% to 20% (Risk- Low)
MINIMUM INVESTMENT:
` 500 and in multiples of ̀ 1 thereafterSubsequent purchases: Minimum amount of ` 500 and multiples of ̀ 1 thereafterSIP: For Any date*/monthly frequency – ̀ 500 and in multiples of ̀ 1 thereafterFor quarterly frequency – ` 1000 and in multiples of ̀ 1 thereafter STP: For Daily/Weekly/Monthly frequency – ` 500 and in multiples of ̀ 1 thereafterFor quarterly frequency – ̀ 1000 and in multiples of ̀ 1 thereafterSWP: For monthly frequency – ` 500 and in multiples of ̀ 1 thereafterFor quarterly frequency – ` 1000 and in multiples of ̀ 1 thereafter
PLANS / OPTIONS :
Regular Plan- Growth Option Regular Plan- Dividend OptionDirect Plan- Growth OptionDirect Plan- Dividend Option
ENTRY LOAD: Nil
EXPENSE RATIO^:
Regular Plan : 2.32%Direct Plan : 1.41%
BENCHMARK: S&P BSE 100 TRI
FUND MANAGER : 1) Ms. Cheenu Gupta2) Mr. Krishna Sanghavi
TOTAL EXPERIENCE : 1) 12 Years2) 23 Years
MANAGING THIS FUND : 1) Since 12-March-182) Since 16-Oct-18
#Monthend AUM : ` 982.77 Crores
Monthly AVG AUM : ` 941.16 Crores
EXIT LOAD: Nil
CANARA ROBECO EQUITY TAX SAVER FUND (CRETSF) (as on May 31, 2019)
RISKOMETER
MARKET CAPITALIZATION
Large Cap 63.47%
Mid Cap 14.92%
Small Cap 19.75%
Debt, Cash & Others 1.86%
12

CANARA ROBECO LIQUID FUND (CRL)
$ Monthend AUM as on 31.05.2019= ^The expense ratios mentioned for the schemes includes GST on investment management fees.= Please refer page no. 39 for disclaimers.
Source ICRA MFI Explorer = #
PRODUCT POSITIONING
Canara Robeco Liquid Fund is an open ended debt scheme investing in only short-term money market instruments with a residual maturity upto 91 days. The fund aims to provide liquidity at all the time. The fund is suitable for investments with very short term horizon & to park surplus money.
QUANTITATIVE INFORMATION $
Yield to Maturity 6.87%
Modified Duration 0.04 Years
Average Maturity 0.05 Years
MATURITY PROFILE
% Allocation
Net Current Assets 0.11%
0 to 3 Months 99.89%
PORTFOLIO
Name of the Instruments Rating % to NAV
Money Market Instruments 97.18Aditya Birla Finance Ltd A1+(ICRA) 7.45IDFC First Bank Ltd A1+(ICRA) 4.97Century Textiles & Industries Ltd A1+(CRISIL) 4.97ICICI Bank Ltd A1+(ICRA) 4.96L & T Finance Ltd A1+(CARE) 4.95The Ramco Cements Ltd A1+(ICRA) 4.95NTPC Ltd A1+(CRISIL) 4.95Manappuram Finance Ltd A1+(CRISIL) 4.89Godrej Industries Ltd A1+(ICRA) 3.97Aditya Birla Fashion and Retail Ltd A1+(CRISIL) 3.97Hinduja Leyland Finance Ltd A1+(CARE) 2.49National Bank For Agriculture & Rural Development A1+(ICRA) 2.49Bank of Baroda A1+(IND) 2.49Berger Paints India Ltd A1+(CRISIL) 2.49Chennai Petroleum Corporation Ltd A1+(CRISIL) 2.49LIC Housing Finance Ltd A1+(ICRA) 2.48Bajaj Finance Ltd A1+(CRISIL) 2.48Andhra Bank A1+(CARE) 2.48IDFC First Bank Ltd A1+(ICRA) 2.48Bank of Baroda A1+(CARE) 2.48IndusInd Bank Ltd A1+(CRISIL) 2.48Axis Bank Ltd A1+(CRISIL) 2.48Axis Bank Ltd A1+(ICRA) 2.48The Ramco Cements Ltd A1+(ICRA) 2.48Godrej Industries Ltd A1+(ICRA) 2.48Indian Oil Corporation Ltd A1+(IND) 2.48Indian Oil Corporation Ltd A1+(IND) 2.48NTPC Ltd A1+(CARE) 2.48Manappuram Finance Ltd A1+(CRISIL) 2.46
Debt Instruments 0.99Indian Railway Finance Corporation Ltd AAA(CRISIL) 0.99
Tri-party repo 1.73
Other Current Assets 0.10
Grand Total ( Net Asset) 100.00
lIncome/ Capital appreciation while maintaining a level of high liquidity
lInvestment in a mix of Debt and Money Market instruments with maturity of upto 91 days only
This product is suitable for investors who are seeking*:
*Investors should consult their financial advisers if in doubt about whether the product is suitable for them.
FUND INFORMATIONCATEGORY/TYPE: Liquid Fund - An open ended liquid schemeSCHEME OBJECTIVE: The scheme has been formulated with the objective of enhancement of income, while maintaining a level of high liquidity, through investment in a mix of Money Market Instruments & Debt Securities. However, there can be no assurance that the investment objective of the Scheme will be realized.
NAV: (as on May 31, 2019)Direct Plan - Daily Divi. Reinvestment Option ` 1,005.5000Direct Plan - Dividend Option ` 1,635.9293Direct Plan - Growth Option ` 2,285.0978Unclaimed Redmp & Dividend Plan-Direct Growth ` 1,242.1154Direct Plan - Monthly Dividend Option ` 1,000.4974Regular Plan - Daily Dividend Reinvestment Option ` 1,005.5000Regular Plan - Growth Option ` 2,278.9792Regular Plan - Monthly Dividend Option ` 1,000.4963Regular Plan - Weekly Dividend Option ` 1,000.4957Direct Plan - Weekly Dividend Option ` 1,000.4968DATE OF ALLOTMENT: Retail Plan : January 15, 2002Institutional Plan : May 31, 2004Regular Plan : July 15, 2008ASSET ALLOCATION: Money Market Instruments / call money - 65% to 100% (Risk- Low)Debt (including securitized debt) - 0% to 35% (Risk- Medium)MINIMUM INVESTMENT : ` 5000 and in multiple of ̀ 1 thereafterSubsequent purchases: Minimum amount of ` 1000 and multiples of ̀ 1 thereafterSTP: For Daily/Weekly/Monthly frequency – ` 1000 and in multiples of ̀ 1 thereafterFor quarterly frequency – ` 2000 and in multiples of ̀ 1 thereafterSWP: For monthly frequency – ` 1000 and in multiples of ̀ 1 thereafterFor quarterly frequency – ` 2000 and in multiples of ̀ 1 thereafterPLANS / OPTIONS :Regular Plan - Growth OptionRegular Plan - Daily Dividend ReinvestmentRegular Plan - Weekly Dividend ReinvestmentRegular Plan - Weekly Dividend payoutRegular Plan - Monthly Dividend ReinvestmentRegular Plan - Monthly Dividend PayoutDirect Plan - Growth OptionDirect Plan -Daily Dividend ReinvestmentDirect Plan - Weekly Dividend ReinvestmentDirect Plan - Weekly Dividend payoutDirect Plan - Monthly Dividend ReinvestmentDirect Plan - Monthly Dividend PayoutDirect Plan - Dividend PayoutUnclaimed Redmp & Dividend Plan-Direct Growth
ENTRY LOAD: Nil
EXPENSE RATIO^:Regular Plan : 0.11%Direct Plan : 0.08%BENCHMARK: Crisil Liquid Fund Index
#Monthend AUM : ` 1,005.55 CroresMonthly AVG AUM : ` 1,109.40 Crores
EXIT LOAD: Nil
FUND MANAGER: 1) Mr. Girish Hisaria 2) Ms. Suman Prasad
TOTAL EXPERIENCE: 1) 14 Years 2) 19 Years
MANAGING THIS FUND: 1) Since 24-Aug-142) Since 18-Mar-11
(as on May 31, 2019)
RATING PROFILE (% to net assets) ASSET ALLOCATION
Investors understand that their principalwill be at Low Risk
RISKOMETER
Tri-party repo/REPO/ 1.84Current Assets
%Reverse Repo & Net AAA & Equivalent 0.99%A1+ & Equivalent 97.16%
Tri-party repo/REPO/ 1.84%Reverse Repo & Net Current Assets
%%
NCDs/Bonds 0.99%
Certificate Of Deposit 27.31Commercial Paper 69.86
13

$ Monthend AUM as on 31.05.2019= ^The expense ratios mentioned for the schemes includes GST on investment management fees.
= Please refer page no. 39 for disclaimers.
Source ICRA MFI Explorer = #
CANARA ROBECO ULTRA SHORT TERM FUND (CRUSTF)
l Income/ Capital appreciation over ultra-short term through a low risk strategy
lInvestment in a mix of Debt and Money Market instruments such that the Macaulay duration of the portfolio is between 3 months and 6 months
This product is suitable for investors who are seeking*:
*Investors should consult their financial advisers if in doubt about whether the product is suitable for them.
(as on May 31, 2019)
Investors understand that their principalwill be at Low Risk
RISKOMETER
ASSET ALLOCATION
RATING PROFILE (% to net assets)
PORTFOLIO Name of the Instruments Rating % to NAV
Money Market Instruments 39.56HDB Financial Services Ltd A1+(CRISIL) 8.40IndusInd Bank Ltd A1+(CRISIL) 7.02Aditya Birla Fashion and Retail Ltd A1+(CRISIL) 7.02Axis Bank Ltd A1+(ICRA) 6.95Indian Bank A1+(IND) 6.67Coromandel International Ltd A1+(CRISIL) 3.50
Debt Instruments 43.74National Bank For Agriculture & Rural Development AAA(CRISIL) 7.07Power Grid Corporation of India Ltd AAA(CRISIL) 7.07Housing Development Finance Corporation Ltd AAA(CRISIL) 7.03Larsen & Toubro Ltd AAA(CRISIL) 3.56Bajaj Finance Ltd AAA(IND) 3.53Indian Railway Finance Corporation Ltd AAA(CRISIL) 3.52Mahindra & Mahindra Financial Services Ltd AAA(IND) 3.52Power Finance Corporation Ltd AAA(CRISIL) 3.51LIC Housing Finance Ltd AAA(CRISIL) 3.50L&T Housing Finance Ltd AAA(ICRA) 1.43Tri-party repo 11.50Treasury Bills 3.48Other Current Assets 1.72
Grand Total ( Net Asset) 100.00
QUANTITATIVE INFORMATION $
Yield to Maturity 6.98%
Modified Duration 0.38 Years
Average Maturity 0.42 Years
Canara Robeco Ultra Short Term Fund is an open ended ultra-short term debt scheme which seeks to provide consistent income and liquidity through investments made primarily in money market and debt securities following a low risk strategy. The portfolio duration of the fund tends to be slightly higher than a liquid fund but investments are made in debt instruments in a way that the Macaulay duration of the portfolio is between 3 months and 6 months.
FUND INFORMATION
CATEGORY/TYPE : Ultra Short Duration Fund - An open ended ultra-short term debt scheme investing in debt & money market instruments such that the Macaulay duration of the portfolio is between 3 months and 6 months
SCHEME OBJECTIVE:
To generate returns by investing in a wide range of debt securities and money market instruments of various maturities and risk profile. However, there is no assurance that the objective of the Fund will be realised.
NAV: (as on May 31, 2019)Direct Plan - Daily Dividend Reinvestment Option ` 1,240.7100Direct Plan - Dividend Option ` 1,645.3311Direct Plan - Growth Option ` 2,873.3230Direct Plan - Monthly Dividend Option ` 1,002.4342Regular Plan - Dividend Payout Option ` 1,148.0066Regular Plan - Daily Dividend Reinvestment Option ` 1,240.7100Regular Plan - Growth Option ` 2,794.5043Regular Plan - Monthly Dividend Option ` 1,002.4061Regular Plan - Weekly Dividend Option ` 1,241.4773Direct Plan - Weekly Dividend Option ` 1,241.5112
DATE OF ALLOTMENT: Retail Plan : September 16, 2003Institutional Plan : August 21, 2007Regular Plan : July 14, 2008
ASSET ALLOCATION:Debt and Money Market instruments- 0% to 100% (Risk- Low to Medium)Reits / Invits- 0% to 10% (Risk- Medium to High)
MINIMUM INVESTMENT : ` 500 and in multiples of ̀ 1 thereafter.Subsequent purchases:Minimum amount of ` 500 and multiples of ` 1 thereafter.SIP : Minimum installment amount - ` 500 and in multiples of ` 1 thereafter for Monthly and Quarterly frequency respectivelySTP: The minimum amount for STP will be subject to the minimum investment amount as detailed in switch-in schemeSWP: ̀ 100 and in multiples of ̀ 1 thereafter
PLANS / OPTIONS :Regular Plan - Growth OptionRegular Plan - Daily Dividend ReinvestmentRegular Plan - Weekly Dividend ReinvestmentRegular Plan - Weekly Dividend PayoutRegular Plan - Monthly Dividend ReinvestmentRegular Plan - Monthly Dividend PayoutRegular Plan - Dividend PayoutDirect Plan - Growth OptionDirect Plan - Daily Dividend ReinvestmentDirect Plan - Weekly Dividend ReinvestmentDirect Plan - Weekly Dividend Payout
#Monthend AUM : ` 142.18 Crores
Monthly AVG AUM : ` 140.77 Crores
Direct Plan - Monthly Dividend ReinvestmentDirect Plan - Monthly Dividend PayoutDirect Plan - Dividend Payout
ENTRY LOAD: Nil
EXPENSE RATIO^:
Regular Plan : 0.95%
Direct Plan : 0.43%
BENCHMARK: Crisil Liquid Fund Index
FUND MANAGER: 1) Mr. Girish Hisaria2) Ms. Suman Prasad
TOTAL EXPERIENCE: 1) 14 Years2) 19 Years
MANAGING THIS FUND: 1) Since 24-Aug-142) Since 12-Apr-11
EXIT LOAD: Nil
Tri-party repo/REPO/ 13.22%Reverse Repo & Net Current AssetsAAA & Equivalent 43.74%A1+ & Equivalent 39.56%Treasury Bills/Sovereign 3.48%
Tri-party repo/REPO/ 13.22%Reverse Repo & Net Current AssetsCertificate Of Deposit 20.64%Commercial Paper 18.92%NCDs/Bonds 43.74%Treasury Bills/ Sovereign 3.48%
MATURITY PROFILE
% Allocation
Net Current Assets 1.71%
0 to 3 Months 58.42%
3 to 6 Months 10.60%
6 to 12 Months 20.76%
1 -2 years 3.51%
More Than 2 Years 4.99%
14

$ Monthend AUM as on 31.05.2019= ^The expense ratios mentioned for the schemes includes GST on investment management fees.=*As on date the said facility is available only in offline mode.= Please refer page no. 39 for disclaimers.
Source ICRA MFI Explorer = #
Investors understand that their principalwill be at Moderately Low Risk
RISKOMETER
FUND INFORMATION
PORTFOLIO Name of the Instruments Rating % to NAV
Money Market Instruments 60.92Andhra Bank A1+(CARE) 6.98Bank of Baroda A1+(IND) 6.97Axis Bank Ltd A1+(CRISIL) 4.73HDFC Bank Ltd A1+(IND) 4.65Housing Development Finance Corporation Ltd A1+(ICRA) 4.64Small Industries Development Bank Of India A1+(CARE) 2.45Bandhan Bank Ltd A1+(ICRA) 2.44Axis Bank Ltd A1+(CRISIL) 2.37IndusInd Bank Ltd A1+(CRISIL) 2.36Kotak Mahindra Bank Ltd A1+(CRISIL) 2.36Axis Bank Ltd A1+(CRISIL) 2.36ICICI Bank Ltd A1+(ICRA) 2.36Indian Bank A1+(IND) 2.33National Bank For Agriculture & Rural Development A1+(CRISIL) 2.33ICICI Bank Ltd A1+(ICRA) 2.32Housing Development Finance Corporation Ltd A1+(ICRA) 2.32National Bank For Agriculture & Rural Development A1+(IND) 2.32Small Industries Development Bank Of India A1+(CARE) 2.32Small Industries Development Bank Of India A1+(CARE) 2.31Debt Instruments 36.43Mahindra & Mahindra Financial Services Ltd AAA(IND) 3.64Power Finance Corporation Ltd AAA(CRISIL) 2.94Indian Railway Finance Corporation Ltd AAA(CRISIL) 2.45Sundaram Finance Ltd AAA(CRISIL) 2.45Gruh Finance Ltd AAA(CRISIL) 2.45IDFC First Bank Ltd AA+(BWR) 2.44IDFC First Bank Ltd AA+(CARE) 2.44L & T Finance Ltd AAA(CARE) 2.43Housing Development Finance Corporation Ltd AAA(CRISIL) 2.43Reliance Industries Ltd AAA(CRISIL) 1.93NTPC Ltd AAA(CRISIL) 1.50Indiabulls Housing Finance Ltd AAA(CARE) 1.47Power Finance Corporation Ltd AAA(CRISIL) 0.99National Bank For Agriculture & Rural Development AAA(CRISIL) 0.99LIC Housing Finance Ltd AAA(CRISIL) 0.99Larsen & Toubro Ltd AAA(CRISIL) 0.99Indiabulls Housing Finance Ltd AAA(CARE) 0.98REC Ltd AAA(CRISIL) 0.97Reliance Industries Ltd AAA(CRISIL) 0.97LIC Housing Finance Ltd AAA(CRISIL) 0.49Indiabulls Housing Finance Ltd AAA(CARE) 0.49Tri-party repo 1.25Other Current Assets 1.40
Grand Total ( Net Asset) 100.00
l Income / Capital appreciation through a low duration strategy
lInvestment in debt & money market instruments such that the Macaulay duration of the portfolio is between 6 months and 12 months
This product is suitable for investors who are seeking*:
*Investors should consult their financial advisers if in doubt about whether the product is suitable for them.
CATEGORY/TYPE : Low Duration Fund - An open-ended low duration debt scheme investing in debt & money market instruments such that the Macaulay duration of the portfolio is between 6 months and 12 months
SCHEME OBJECTIVE:To generate income / capital appreciation by investing in a portfolio comprising of low duration debt instruments and money market instruments. However, there can be no assurance that the investment objective of the scheme will be realized.
NAV : Regular Plan - Daily Dividend Reinvestment Option ` 10.2600Direct Plan - Daily Dividend Reinvestment Option ` 10.2600Direct Plan - Dividend Option ` 26.8372Regular Plan - Dividend Option ` 26.5354Direct Plan - Growth Option ` 29.9572Regular Plan - Growth Option ` 29.6245Direct Plan - Monthly Dividend Option ` 10.2691Regular Plan - Monthly Dividend Option ` 10.2691Regular Plan - Weekly Dividend Option ` 10.2691Direct Plan - Weekly Dividend Option ` 10.2692
DATE OF ALLOTMENT : March 4, 2005
ASSET ALLOCATION:Debt & Money Market Instruments- 0% to 100% (Risk- Low to Medium)Reits/Invits- 0% to 10% (Risk- Medium to High)
MINIMUM INVESTMENT :
PLANS / OPTIONS :Regular Plan-Growth OptionRegular Plan- Dividend Reinvestment / Payout Option Regular Plan-Daily Dividend Reinvestment OptionRegular Plan-Weekly Dividend Payout/ Reinvestment OptionRegular Plan- Monthly Dividend Payout/ Reinvestment OptionDirect Plan-Growth OptionDirect Plan- Dividend Reinvestment / Payout OptionDirect Plan-Daily Dividend Reinvestment OptionDirect Plan-Weekly Dividend Payout/ Reinvestment OptionDirect Plan- Monthly Dividend Payout/ Reinvestment Option
ENTRY LOAD: Nil
#Monthend AUM : ` 1,020.05 Crores
Monthly AVG AUM : ` 1,003.20 Crores
(as on May 31, 2019)
` 5000 and in multiples of ̀ 1 thereafterSubsequent purchases: Minimum amount of ` 1000 and multiples of ̀ 1 thereafterSIP: For Any date*/monthly frequency – ` 1000 and in multiples of ̀ 1 thereafterFor quarterly frequency – ̀ 2000 and in multiples of ̀ 1 thereafter STP: For Daily/Weekly/Monthly frequency – ` 1000 and in multiples of ̀ 1 thereafterFor quarterly frequency – ̀ 2000 and in multiples of ̀ 1 thereafterSWP: For monthly frequency – ` 1000 and in multiples of ̀ 1 thereafterFor quarterly frequency – ̀ 2000 and in multiples of ̀ 1 thereafter
EXPENSE RATIO^:Regular Plan : 0.55% = Direct Plan : 0.31%
EXIT LOAD: Nil
BENCHMARK: CRISIL Ultra Short Term Debt Index
FUND MANAGER: 1) Mr. Girish Hisaria2) Ms. Suman Prasad
TOTAL EXPERIENCE: 1) 2) 19 Years
MANAGING THIS FUND: 1) Since 24-Aug-142) Since 12-Apr-11
14 Years
PRODUCT POSITIONING
Canara Robeco Savings Fund an open-ended low duration debt scheme aiming at primarily generating accrual income from investments in money market and debt securities. The Scheme is ideally suited for investors looking at a comparatively lower risk strategy short term debt fund with a Macaulay duration between 6 months and 12 months.
CANARA ROBECO SAVINGS FUND (CRSF) (as on May 31, 2019)
ASSET ALLOCATION
Tri-party repo/REPO/ 2.65
%%%
%Reverse Repo & Net Current AssetsCertificate Of Deposit 53.98Commercial Paper 6.96NCDs/Bonds 36.42
15
RATING PROFILE (% to net assets)
Tri-party repo/REPO/ 2.65%Reverse Repo & Net Current AssetsAAA & Equivalent 31.54%AA+ & Equivalent 4.88%A1+ & Equivalent 60.94%
QUANTITATIVE INFORMATION$
Yield to Maturity 7.33%Modified Duration 0.70 YearsAverage Maturity 0.89 Years
MATURITY PROFILE
% AllocationNet Current Assets 1.40%0 to 3 Months 12.02%3 to 6 Months 2.94%6 to 12 Months 64.85%1 -2 years 10.44%More Than 2 Years 8.35%

$ Monthend AUM as on 31.05.2019= ^The expense ratios mentioned for the schemes includes GST on investment management fees.
=*As on date the said facility is available only in offline mode.= Please refer page no. 39 for disclaimers.
Source ICRA MFI Explorer = #
CANARA ROBECO SHORT DURATION FUND (CRSDF)
PRODUCT POSITIONINGCanara Robeco Short Duration Fund is suitable for investors having short to medium term investment horizon with low volatility. The fund generates income predominantly from accrual yields on high quality Money Market Instruments, while an active trading strategy is followed for generating Alpha.
PORTFOLIO
Name of the Instruments RATING % to NAV
Money Market Instruments 20.59Axis Bank Ltd A1+(CRISIL) 7.94Small Industries Development Bank Of India A1+(CARE) 7.89Indian Bank A1+(IND) 4.76Debt Instruments 69.38Housing Development Finance Corporation Ltd AAA(CRISIL) 5.43NTPC Ltd AAA(CRISIL) 5.11LIC Housing Finance Ltd AAA(CRISIL) 5.01Aditya Birla Finance Ltd AAA(ICRA) 4.98National Bank For Agriculture & Rural Development AAA(CRISIL) 3.40Larsen & Toubro Ltd AAA(CRISIL) 3.39Larsen & Toubro Ltd AAA(CRISIL) 3.37IDFC First Bank Ltd AA+(CARE) 3.35Mahindra & Mahindra Financial Services Ltd AAA(IND) 3.33Kotak Mahindra Prime Ltd AAA(CRISIL) 3.32Reliance Industries Ltd AAA(CRISIL) 3.32UltraTech Cement Ltd AAA(CRISIL) 3.31Reliance Industries Ltd AAA(CRISIL) 3.29Power Grid Corporation of India Ltd AAA(CRISIL) 2.39National Bank For Agriculture & Rural Development AAA(CRISIL) 1.72Indian Railway Finance Corporation Ltd AAA(CRISIL) 1.71Power Grid Corporation of India Ltd AAA(CRISIL) 1.71Tata Motors Ltd AA(CARE) 1.69Housing Development Finance Corporation Ltd AAA(CRISIL) 1.68NHPC Ltd AAA(CARE) 1.68Indiabulls Housing Finance Ltd AAA(CARE) 1.67Mahindra & Mahindra Financial Services Ltd AAA(IND) 1.67IDFC First Bank Ltd AA+(CARE) 1.67LIC Housing Finance Ltd AAA(CRISIL) 0.67ICICI Home Finance Company Ltd AAA(CARE) 0.44Blue Dart Express Ltd AA(ICRA) 0.07Government Securities 4.148.49% PUNJAB SDL UDAY 31-MAR-22 Sovereign 1.728.27% RAJASTHAN SDL UDAY 23-JUN-22 Sovereign 1.718.21% RAJASTHAN SDL UDAY 31-MAR-21 Sovereign 0.617.86% KARNATAKA SDL 15-MAR-27 Sovereign 0.10Tri-party repo 3.11
Other Current Assets 2.78
Grand Total ( Net Asset) 100.00
ASSET ALLOCATION
lIncome / capital appreciation over short term
lInvestment in debt & money market instruments such that the Macaulay duration of the portfolio is between 1 year and 3 years
This product is suitable for investors who are seeking*:
*Investors should consult their financial advisers if in doubt about whether the product is suitable for them.
FUND INFORMATION
CATEGORY/TYPE: Short Duration Fund - An open ended short term debt scheme investing in debt & money market instruments such that the Macaulay duration of the portfolio is between 1 year and 3 years
SCHEME OBJECTIVE : To generate returns by investing in a wide range of debt securities and money market instruments of various maturities and risk profile. However, there is no assurance that the objective of the Fund will be realised.
NAV : (as on May 31, 2019)Direct Plan - Growth Option ` 18.6516Regular Plan - Growth Option ` 17.7575Direct Plan - Monthly Dividend Option ` 15.9775Regular Plan - Monthly Dividend Option ` 14.8206Regular Plan - Quarterly Dividend Option ` 14.5750Direct Plan - Quarterly Dividend Option ` 15.4355
DAT E OF ALLOTMENT : 25 April, 2011
ASSET ALLOCATION :Debt and Money Market instruments- 0% to 100% (Risk- Low to Medium)Reits / Invits- 0% to 10% (Risk- Medium to High)
MINIMUM INVESTMENT :` 5000 and in multiples of ̀ 1 thereafterSubsequent purchases: Minimum amount of ` 1000 and multiples of ̀ 1 thereafterSIP: For Any date*/monthly frequency – ` 1000 and in multiples of ̀ 1 thereafterFor quarterly frequency – ` 2000 and in multiples of ̀ 1 thereafter STP: For Daily/Weekly/Monthly frequency – ` 1000 and in multiples of ̀ 1 thereafterFor quarterly frequency – ̀ 2000 and in multiples of ̀ 1 thereafterSWP: For monthly frequency – ` 1000 and in multiples of ̀ 1 thereafterFor quarterly frequency – ` 2000 and in multiples of ̀ 1 thereafter
PLANS/OPTIONS : Regular Plan- Growth OptionRegular Plan- Monthly Dividend Payout / Reinvestment OptionRegular Plan- Quarterly Dividend Payout/ Reinvestment Option
Direct Plan- Growth OptionDirect Plan- Monthly Dividend Payout / Reinvestment OptionDirect Plan- Quarterly Dividend Payout/ Reinvestment Option
ENTRY LOAD: Nil
EXPENSE RATIO^:Regular Plan : 1.25%Direct Plan : 0.51%
BENCHMARK: CRISIL Short Term Bond Fund Index
FUND MANAGER : Ms. Suman Prasad
TOTAL EXPERIENCE : 19 Years
MANAGING THIS FUND : Since 16-Sep-12
#Monthend AUM : ` 298.63 Crores
Monthly AVG AUM : ` 286.53 Crores
EXIT LOAD: Nil
(as on May 31, 2019)
RISKOMETER
MATURITY PROFILE
% Allocation
Net Current Assets 2.75%
0 to 3 Months 3.11%
3 to 6 Months 7.21%
6 to 12 Months 25.63%
1 -2 years 23.97%
More Than 2 Years 37.33%
RATING PROFILE (% to net assets)
Tri-party repo/REPO/ 5.86Reverse Repo & Net Current AssetsAAA & Equivalent 62.63%AA+ & Equivalent 5.01%AA & Equivalent 1.76%A1+ & Equivalent 20.60%Treasury Bills/Sovereign 4.14%
%Tri-party repo/REPO/ 5.86%Reverse Repo & Net Current AssetsCertificate Of Deposit 20.60%NCDs/Bonds 69.40%Treasury Bills/ Sovereign 4.14%
Investors understand that their principalwill be at Moderately Low Risk
16
QUANTITATIVE INFORMATION $
Yield to Maturity 7.59%
Modified Duration 1.48 Years
Average Maturity 1.77 Years

Investors understand that their principalwill be at Moderate Risk
$ Monthend AUM as on 31.05.2019= ^The expense ratios mentioned for the schemes includes GST on investment management fees.=*As on date the said facility is available only in offline mode. = Please refer page no. 39 for disclaimers.
Source ICRA MFI Explorer = #
CANARA ROBECO INCOME FUND (CRINC)
PORTFOLIO
Name of the Instruments Rating % to NAV
Tri-party repo
Debt Instruments 59.78NTPC Ltd AAA(CRISIL) 9.92IDFC First Bank Ltd AA+(CARE) 9.63Housing Development Finance Corporation Ltd AAA(CRISIL) 5.06LIC Housing Finance Ltd AAA(CRISIL) 4.99Indian Railway Finance Corporation Ltd AAA(CRISIL) 4.98Reliance Industries Ltd AAA(CRISIL) 4.92Power Finance Corporation Ltd AAA(CRISIL) 4.79Tata Motors Ltd AA(CARE) 4.79Reliance Industries Ltd AAA(CRISIL) 4.76Indian Railway Finance Corporation Ltd AAA(CRISIL) 3.97National Bank For Agriculture & Rural Development AAA(CRISIL) 1.97
Government Securities 34.897.17% GOI 08-JAN-28 Sovereign 14.507.95% GOI 28-AUG-32 Sovereign 10.227.57% GOI 17-JUN-33 Sovereign 4.987.26% GOI 14-JAN-29 Sovereign 4.918.47% MAHARASHTRA SDL 10-FEB-26 Sovereign 0.28
2.38
Other Current Assets 2.95
Grand Total ( Net Asset) 100.00
PRODUCT POSITIONING
Canara Robeco Income Fund is an open ended medium term debt scheme investing in debt & money market instruments such that the Macaulay duration of the portfolio is between 4 years –7 years. However, the Portfolio Macaulay duration under anticipated adverse situation may be between 1 year and 7 years. Fund manager takes an active view of the interest rate movements. Based on the interest rate view, the duration of the portfolio will be decided along with the asset allocation pattern between sovereign & corporate bonds. As majority of the portfolio gets invested in high quality debt papers, which provides consistent accrual income to the portfolio.
RATING PROFILE (% to net assets)
ASSET ALLOCATION
lIncome / Capital appreciation over Medium to Long term
lInvestment in debt & money market instruments such that the Macaulay duration of the portfolio is between 4 years and 7 years (Portfolio Macaulay duration under anticipated adverse situation is 1 year to 7 years)
This product is suitable for investors who are seeking*:
*Investors should consult their financial advisers if in doubt about whether the product is suitable for them.
QUANTITATIVE INFORMATION $
Yield to Maturity 7.80%
Modified Duration 5.12 Years
Average Maturity 7.76 Years
MATURITY PROFILE
% Allocation
Net Current Assets 2.96%
0 to 3 Months 2.38%
6 to 12 Months 9.63%
1 -2 years 4.79%
More Than 2 Years 80.23%
FUND INFORMATION
CATEGORY/TYPE: Medium To Long Duration Fund - An open ended medium term debt scheme investing in debt & money market instruments such that the Macaulay duration of the portfolio is between 4 years – 7 years.(Portfolio Macaulay duration under anticipated adverse situation is 1 year to 7 years)
SCHEME OBJECTIVE: The Scheme seeks to generate income and capital
appreciation through a portfolio constituted of
medium to long term debt and money market
securities and issuers of different risk profiles.
However, there can be no assurance that the
investment objective of the scheme will be
realized.
NAV: (as on May 31, 2019)Direct Plan - Quarterly Divi. Option ` 15.6085Regular Plan - Quarterly Divi. Option ` 14.8139Direct Plan - Growth Option ` 41.0956Regular Plan - Growth Option ` 39.2347
DATE OF ALLOTMENT: September 19, 2002
ASSET ALLOCATION: Debt and Money Market instruments- 0% to 100%
(Risk- Low to Medium)
Reits/Invits- 0% to 10% (Risk- Medium to High)
MINIMUM INVESTMENT: ` 5000 and in multiples of ̀ 1 thereafterSubsequent purchases: Minimum amount of ` 1000 and multiples of ̀ 1 thereafterSIP: For Any date*/monthly frequency – ` 1000 and in multiples of ̀ 1 thereafterFor quarterly frequency – ` 2000 and in multiples of ̀ 1 thereafter STP: For Daily/Weekly/Monthly frequency – ` 1000 and in multiples of ̀ 1 thereafterFor quarterly frequency – ̀ 2000 and in multiples of ̀ 1 thereafterSWP: For monthly frequency – ` 1000 and in multiples of ̀ 1 thereafterFor quarterly frequency – ` 2000 and in multiples of ̀ 1 thereafter
PLANS / OPTIONS : Regular Plan- Growth Option Regular Plan - Quarterly Dividend Reinvestment Option/Payout Option Direct Plan- Growth OptionDirect Plan - Quarterly Dividend Reinvestment Option/Payout Option
ENTRY LOAD: Nil
EXPENSE RATIO^:
Regular Plan : 1.90%Direct Plan : 0.87%
BENCHMARK: CRISIL Composite Bond Fund Index
FUND MANAGER: Mr. Avnish Jain
TOTAL EXPERIENCE: 23 Years
MANAGING THIS FUND: Since 25-June-14
#Monthend AUM : ` 103.40 Crores
Monthly AVG AUM : ` 101.43 Crores
EXIT LOAD:
1% - if redeemed/switched out within 12
months from the date of allotment
(as on May 31, 2019)
RISKOMETER
Tri-party repo/REPO/ 5.34%Reverse Repo & Net Current AssetsAAA & Equivalent 45.35%AA+ & Equivalent 9.63%AA & Equivalent 4.79%Treasury Bills/Sovereign 34.88%
Tri-party repo/REPO/ 5.34
%%
%Reverse Repo & Net Current AssetsNCDs/Bonds 59.77Treasury Bills/ Sovereign 34.88
17

$ Monthend AUM as on 31.05.2019= ^The expense ratios mentioned for the schemes includes GST on investment management fees.
=*As on date the said facility is available only in offline mode.= Please refer page no. 39 for disclaimers.
Source ICRA MFI Explorer = #
CANARA ROBECO DYNAMIC BOND FUND (CRDBF)
PRODUCT POSITIONING
Canara Robeco Dynamic Bond Fund intends to invest and trade in G-secs and Corporate Debt by identifying mispriced opportunities & capturing volatility trends. The fund aims at generating Alpha through free-style duration management depending on the interest rate view. At the same time it endeavours to capture accruals in the form of portfolio running yields on high-quality debt instruments.
PORTFOLIO
Name of the Instruments Rating % to NAV
Debt Instruments 43.08LIC Housing Finance Ltd AAA(CRISIL) 9.51NTPC Ltd AAA(CRISIL) 9.45Food Corporation Of India AAA(SO)(CRISIL) 4.89Reliance Industries Ltd AAA(CRISIL) 4.77Small Industries Development Bank Of India AAA(CARE) 4.75REC Ltd AAA(CRISIL) 4.66IDFC First Bank Ltd AA+(CARE) 4.59Power Finance Corporation Ltd AAA(CRISIL) 0.46
Government Securities 53.827.57% GOI 17-JUN-33 Sovereign 16.607.17% GOI 08-JAN-28 Sovereign 13.817.26% GOI 14-JAN-29 Sovereign 12.638.38% GUJARAT SDL 27-FEB-29 Sovereign 9.617.95% GOI 28-AUG-32 Sovereign 0.976.68% GOI 17-SEP-31 Sovereign 0.20
Tri-party repo 0.27
Other Current Assets 2.83
Grand Total ( Net Asset) 100.00
QUANTITATIVE INFORMATION $
Yield to Maturity 7.62%
Modified Duration 6.01 Years
Average Maturity 9.11 Years
lIncome/ Capital appreciation by dynamically managing duration
lInvestment in Debt and Money Market securities across duration
This product is suitable for investors who are seeking*:
*Investors should consult their financial advisers if in doubt about whether the product is suitable for them.Investors understand that their principal
will be at Moderate Risk
ASSET ALLOCATION
RATING PROFILE (% to net assets)
% Allocation
Net Current Assets 2.84%
0 to 3 Months 0.73%
6 to 12 Months 4.59%
More Than 2 Years 91.85%
MATURITY PROFILE
FUND INFORMATION
CATEGORY/TYPE: Dynamic Bond - An open ended dynamic debt scheme investing across duration
SCHEME OBJECTIVE: The objective of the fund is to seek to generate income from a portfolio of debt and money market securities. However, there can be no assurance that the investment objective of the scheme will be realized and the Fund does not assure or guarantee any returns.
NAV: (as on May 31, 2019)Direct Plan - Dividend Option ` 14.5287Direct Plan - Growth Option ` 21.8106Regular Plan - Dividend Option ` 13.9288Regular Plan - Growth Option ` 21.0356
DATE OF ALLOTMENT: May 29, 2009
ASSET ALLOCATION: Government of India & Corporate Debt Securities (including Securitised Debt)* - 0% to 100% (Risk- Low to Medium)Money Market Instruments - 0% to 100% (Risk- Low)* Excluding Debt/GOI Securities with initial maturity of less than one year and Treasury bills
MINIMUM INVESTMENT : ` 5000 and in multiples of ̀ 1 thereafterSubsequent purchases: Minimum amount of ` 1000 and multiples of ̀ 1 thereafterSIP: For Any date*/monthly frequency – ` 1000 and in multiples of ̀ 1 thereafterFor quarterly frequency – ` 2000 and in multiples of ̀ 1 thereafter STP: For Daily/Weekly/Monthly frequency – ` 1000 and in multiples of ̀ 1 thereafterFor quarterly frequency – ̀ 2000 and in multiples of ̀ 1 thereafterSWP: For monthly frequency – ` 1000 and in multiples of ̀ 1 thereafterFor quarterly frequency – ` 2000 and in multiples of ̀ 1 thereafter
PLANS / OPTIONS :Regular Plan - GrowthRegular Plan - Dividend ReinvestmentRegular Plan - Dividend PayoutDirect Plan- Growth OptionDirect Plan- Dividend Reinvestment Option/ Payout Option
ENTRY LOAD: Nil
EXPENSE RATIO^:
Regular Plan : 1.75%Direct Plan : 0.94%
BENCHMARK: CRISIL Composite Bond Fund Index
FUND MANAGER: Mr. Girish Hisaria
TOTAL EXPERIENCE: 14 Years
MANAGING THIS FUND: Since 24-Aug-14
#Monthend AUM : ` 108.55 Crores
Monthly AVG AUM : ` 105.49 Crores
EXIT LOAD:-if redeemed / switched out within six months from the date of allotment: 0.50%-if redeemed / switched out after six months from the date of allotment: Nil
(as on May 31, 2019)
RISKOMETER
Tri-party repo/REPO/ 3.10%Reverse Repo & Net Current AssetsAAA & Equivalent 38.49%AA+ & Equivalent 4.59%Treasury Bills/Sovereign 53.82%
Tri-party repo/REPO/ 3.10
%%
%Reverse Repo & Net Current AssetsNCDs/Bonds 43.08Treasury Bills/ Sovereign 53.82
18

$ Monthend AUM as on 31.05.2019= ^The expense ratios mentioned for the schemes includes GST on investment management fees.=*As on date the said facility is available only in offline mode.= Please refer page no. 39 for disclaimers.
Source ICRA MFI Explorer = #
CANARA ROBECO CORPORATE BOND FUND (CRCBF)
PRODUCT POSITIONING
Canara Robeco Coroprate Bond Fund endeavours to generate accrual income by investing in High quality debt papers. The fund looks to benefit from the mispriced opportunities in the markets and a possible upgrade of rating of the instruments in which investments are made. The fund is suitable for investors who have a medium to long term investment horizon & a moderate risk appetite.
ASSET ALLOCATION
PORTFOLIO
Name of the Instruments % to NAV
Debt Instruments 86.90Tata Motors Ltd AA(CARE) 8.79Small Industries Development Bank Of India AAA(CARE) 8.73Aditya Birla Finance Ltd AAA(ICRA) 7.53LIC Housing Finance Ltd AAA(CRISIL) 6.08NTPC Ltd AAA(CRISIL) 5.90National Bank For Agriculture & Rural Development AAA(CRISIL) 5.89L & T Finance Ltd AAA(ICRA) 5.78Mahindra & Mahindra Financial Services Ltd AAA(IND) 5.77Power Grid Corporation of India Ltd AAA(CRISIL) 3.09Housing Development Finance Corporation Ltd AAA(CRISIL) 3.03Reliance Industries Ltd AAA(CRISIL) 3.00NTPC Ltd AAA(CRISIL) 2.97Power Grid Corporation of India Ltd AAA(CRISIL) 2.95Housing Development Finance Corporation Ltd AAA(CRISIL) 2.94Power Finance Corporation Ltd AAA(CRISIL) 2.92Mahindra & Mahindra Financial Services Ltd AAA(IND) 2.90LIC Housing Finance Ltd AAA(CRISIL) 2.88Reliance Industries Ltd AAA(CRISIL) 2.88Power Finance Corporation Ltd AAA(CRISIL) 2.87
Government Securities 8.897.57% GOI 17-JUN-33 Sovereign 2.988.27% RAJASTHAN SDL UDAY 23-JUN-22 Sovereign 2.977.26% GOI 14-JAN-29 Sovereign 2.94
Tri-party repo 1.21
Other Current Assets 3.00
Grand Total ( Net Asset) 100.00
Rating
RATING PROFILE (% to net assets)
QUANTITATIVE INFORMATION $
Yield to Maturity 7.85%
Modified Duration 2.63 Years
Average Maturity 3.57 Years
MATURITY PROFILE% Allocation
Net Current Assets 2.98%
0 to 3 Months 1.21%
6 to 12 Months 20.35%
1 -2 years 20.30%
More Than 2 Years 55.16%
lIncome / capital appreciation through a low credit risk strategy
lInvestment in a portfolio constituted predominantly of AA+ and above rated corporate bonds
This product is suitable for investors who are seeking*:
*Investors should consult their financial advisers if in doubt about whether the product is suitable for them.Investors understand that their principal
will be at Moderate Risk
(as on May 31, 2019)
FUND INFORMATION
CATEGORY/TYPE : Corporate Bond Fund - An open ended debt scheme predominantly investing in AA+ and above rated corporate bonds.
SCHEME OBJECTIVE : The Scheme seeks to generate income and capital appreciation through a portfolio constituted predominantly of AA+ and above rated Corporate Debt across maturities. However, there can be no assurance that the investment objective of the scheme will be realized
NAV : Direct Plan - Dividend Option 11.9207Regular Plan - Dividend Option ` 11.5389Direct Plan - Growth Option ` 15.5567Regular Plan - Growth Option ` 15.1078
DAT E OF ALLOTMENT : 7th February, 2014
ASSET ALLOCATION : AA+ and above rated Corporate Debt of varying maturities - 80% to 100% (Risk- Low to Medium)Other Debt (including government securities) and Money Market Instruments - 0% to 20% (Risk- Low to Medium)Reits/Invits- 0% to 10% (Risk- Medium to High)
MINIMUM INVESTMENT:
` 5000 and in multiples of ̀ 1 thereafterSubsequent purchases: Minimum amount of ` 1000 and multiples of ̀ 1 thereafterSIP: For Any date*/monthly frequency – ` 1000 and in multiples of ̀ 1 thereafterFor quarterly frequency – ` 2000 and in multiples of ̀ 1 thereafter STP: For Daily/Weekly/Monthly frequency – ` 1000 and in multiples of ̀ 1 thereafterFor quarterly frequency – ̀ 2000 and in multiples of ̀ 1 thereafterSWP: For monthly frequency – ` 1000 and in multiples of ̀ 1 thereafterFor quarterly frequency – ` 2000 and in multiples of ̀ 1 thereafter
PLANS / OPTIONS : Regular Plan- Growth Option Regular Plan- Dividend Reinvestment Option/ Payout Option
Direct Plan- Growth OptionDirect Plan- Dividend Reinvestment Option/Payout Option
ENTRY LOAD: Nil
EXPENSE RATIO^:Regular Plan : 1.25%Direct Plan : 0.48%
BENCHMARK : CRISIL Composite Bond Fund Index
FUND MANAGER : Mr. Avnish Jain
23 Years
#Monthend AUM : ` 172.45 Crores
Monthly AVG AUM : ` 170.71 Crores
EXIT LOAD: For any redemption / switch out upto 10% of units within 1 Year from the date of allotment - Nil
For any redemption / switch out more than 10% of units within 1 Year from the date of allotment - 1%
For any redemption/switch out after 1 Year from the date of allotment - Nil
(as on May 31, 2019)`
TOTAL EXPERIENCE:
MANAGING THIS FUND: Since 7-Feb-14
RISKOMETER
Tri-party repo/REPO/
%AA & Equivalent 8.79%
%
4.19Reverse Repo & Net Current AssetsAAA & Equivalent 78.12
Treasury Bills/Sovereign 8.90
%
Tri-party repo/REPO/ 4.19
%%
%Reverse Repo & Net Current AssetsNCDs/Bonds 86.91Treasury Bills/ Sovereign 8.90
19

$ Monthend AUM as on 31.05.2019= ^The expense ratios mentioned for the schemes includes GST on investment management fees.
=*As on date the said facility is available only in offline mode.= Please refer page no. 39 for disclaimers.
Source ICRA MFI Explorer = #
CANARA ROBECO GILT FUND (CRGILT)
PRODUCT POSITIONING
Canara Robeco Gilt Fund invests in G-Secs of varying
maturity issued by Reserve Bank of India (RBI).
Being invested in sovereign papers, the fund does
not expose its investors to Credit Risk as in the case
of other bond funds.
QUANTITATIVE INFORMATION $
Yield to Maturity 7.25%
Modified Duration 6.94 Years
Average Maturity 10.58 Years
MATURITY PROFILE% Allocation
Net Current Assets 2.64%
0 to 3 Months 1.09%
More Than 2 Years 96.27%
PORTFOLIO
Name of the Instruments Rating % to NAV
Government Securities 96.277.26% GOI 14-JAN-29 Sovereign 27.477.57% GOI 17-JUN-33 Sovereign 22.667.17% GOI 08-JAN-28 Sovereign 21.038.38% GUJARAT SDL 27-FEB-29 Sovereign 13.128.30% GUJARAT SDL 13-MAR-29 Sovereign 6.537.95% GOI 28-AUG-32 Sovereign 5.328.13% GOI 22-JUN-45 Sovereign 0.14
Tri-party repo 1.09
Other Current Assets 2.64
Grand Total ( Net Asset) 100.00
RATING PROFILE & ASSET ALLOCATION (% to net assets)
lRisk free return (except interest rate risk) and long term capital appreciation
l Investment in government securities across maturity
This product is suitable for investors who are seeking*:
*Investors should consult their financial advisers if in doubt about whether the product is suitable for them.Investors understand that their principal
will be at Moderate Risk
FUND INFORMATION
CATEGORY/TYPE: Gilt Fund - An open-ended debt scheme investing in government securities across maturity
SCHEME OBJECTIVE: To provide risk free return (except interest rate risk) while maintaining stability of capital and liquidity. Being a dedicated Gilt Scheme, the funds will be invested in securities as defined under Sec. 2 (2) of Public Debt Act, 1944. However, there can be no assurance that the investment objective of the Scheme will be realized.
NAV: (as on May 31, 2019)Direct Plan - Dividend Option ` 15.3548Regular Plan - Dividend Option ` 14.7988Direct Plan - Growth Option ` 53.6974Regular Plan - Growth Option ` 52.0287
DATE OF ALLOTMENT: December 29, 1999
ASSET ALLOCATION: Govt. Securities - 80% to 100% (Risk- Low)Money Market Instruments - 0% to 20% (Risk- Low to Medium)
MINIMUM INVESTMENT: ` 5000 and in multiples of ̀ 1 thereafterSubsequent purchases: Minimum amount of ` 1000 and multiples of ̀ 1 thereafterSIP: For Any date*/monthly frequency – ` 1000 and in multiples of ̀ 1 thereafterFor quarterly frequency – ` 2000 and in multiples of ̀ 1 thereafter STP: For Daily/Weekly/Monthly frequency – ` 1000 and in multiples of ̀ 1 thereafterFor quarterly frequency – ̀ 2000 and in multiples of ̀ 1 thereafterSWP: For monthly frequency – ` 1000 and in multiples of ̀ 1 thereafterFor quarterly frequency – ` 2000 and in multiples of ̀ 1 thereafter
PLANS / OPTIONS : Regular Plan- Growth Option Regular Plan- Dividend Reinvestment Option/ Payout Option
Direct Plan- Growth OptionDirect Plan- Dividend Reinvestment Option/ Payout Option
ENTRY LOAD: Nil
EXPENSE RATIO^:
Regular Plan : 1.25%
Direct Plan : 0.60%
BENCHMARK: Crisil Dynamic Gilt Fund Index
FUND MANAGER: Mr. Girish Hisaria
TOTAL EXPERIENCE: 14 Years
MANAGING THIS FUND: Since 24-Aug-14
#Monthend AUM : ` 79.49 Crores
Monthly AVG AUM : ` 69.26 Crores
EXIT LOAD : Nil
(as on May 31, 2019)
RISKOMETER
Tri-party repo/REPO/ 3.73%Reverse Repo & Net Current AssetsTreasury Bills/Sovereign 96.27%
20

$ Monthend AUM as on 31.05.2019= ^The expense ratios mentioned for the schemes includes GST on investment management fees. =*As on date the said facility is available only in offline mode.= Please refer page no. 39 for disclaimers.
Source ICRA MFI Explorer = #
CANARA ROBECO CONSERVATIVE HYBRID FUND (CRCHF)
PRODUCT POSITIONINGCanara Robeco Conservative Hybrid Fund is an open -ended h yb r i d s c heme i n ve s t i n g predominantly in debt instruments. Fund also takes small expsoure in equity markets which endeavours to boost portfolio returns.
PORTFOLIO Name of the Instruments % to NAV
Equities 24.45Listed 24.45Banks 8.64HDFC Bank Ltd 2.69ICICI Bank Ltd 1.48Kotak Mahindra Bank Ltd 1.44Axis Bank Ltd 1.28State Bank of India 1.15City Union Bank Ltd 0.60Software 2.30Tata Consultancy Services Ltd 1.02Infosys Ltd 1.00CESC Ventures Ltd 0.28Consumer Non Durables 2.25ITC Ltd 0.94Nestle India Ltd 0.81Hindustan Unilever Ltd 0.50Construction Project 1.80Larsen & Toubro Ltd 1.52Ashoka Buildcon Ltd 0.28Pharmaceuticals 1.45Divi’s Laboratories Ltd 0.80IPCA Laboratories Ltd 0.47Hikal Ltd 0.18Petroleum Products 1.22Reliance Industries Ltd 1.22Cement 1.00Grasim Industries Ltd 0.71The Ramco Cements Ltd 0.29Auto 1.00Maruti Suzuki India Ltd 1.00Finance 0.97Creditaccess Grameen Ltd 0.53Bajaj Finance Ltd 0.44Auto Ancillaries 0.85Minda Industries Ltd 0.52Balkrishna Industries Ltd 0.33Transportation 0.78Transport Corporation of India Ltd 0.39TCI Express Ltd 0.39Industrial Capital Goods 0.64The Anup Engineering Ltd 0.64Ferrous Metals 0.49Tata Steel Ltd 0.49Consumer Durables 0.37Titan Company Ltd 0.37
lIncome / Capital appreciation over medium term to long term
lInvestment predominantly in debt and money market instruments and small portion in equity
This product is suitable for investors who are seeking*:
*Investors should consult their financial advisers if in doubt about whether the product is suitable for them.Investors understand that their principal
will be at Moderately High Risk
QUANTITATIVE INFORMATION $
Yield to Maturity 7.93%
Modified Duration 3.52 Years
Average Maturity 5.03 Years
(as on May 31, 2019)
RISKOMETER
Chemicals 0.35Atul Ltd 0.35Retailing 0.19Spencers Retail Ltd 0.19Industrial Products 0.15Bharat Forge Ltd 0.15Debt Instruments 58.26LIC Housing Finance Ltd 7.79Indian Railway Finance Corporation Ltd 5.16NTPC Ltd 5.12IDFC First Bank Ltd 5.03Aditya Birla Finance Ltd 4.99Power Finance Corporation Ltd 4.98REC Ltd 4.95Reliance Industries Ltd 4.93Housing Development Finance Corporation Ltd 2.63Reliance Industries Ltd 2.61Tata Motors Ltd 2.54Tata Motors Ltd 2.54IDFC First Bank Ltd 2.51Power Finance Corporation Ltd 2.48Government Securities 14.277.17% GOI 08-JAN-28 7.548.49% PUNJAB SDL UDAY 31-MAR-22 4.147.57% GOI 17-JUN-33 2.597.72% GOI 26-OCT-55 0.00
Tri-party repo 1.01
Other Current Assets 2.01
Grand Total ( Net Asset) 100.00
MATURITY PROFILE% Allocation
0 to 3 Months 1.01%
3 to 6 Months 5.03%
6 to 12 Months 5.05%
1 -2 years 7.54%
More Than 2 Years 54.96%
FUND INFORMATIONCATEGORY/TYPE: Conservative Hybrid Fund - An open-ended hybr id scheme invest ing predominantly in debt instrumentsSCHEME OBJECTIVE: To generate income by investing in a wide range of Debt Securities and Money Market instruments of various maturities and small portion in equities and Equity Related Instruments. However, there can be no assurance that the investment objective of the scheme will be realized.
NAV: (as on May 31, 2019)Direct Plan - Growth Option ` 61.2173Regular Plan - Growth Option ` 57.3319Direct Plan - Monthly Divi. Option ` 14.8846Regular Plan - Monthly Divi. Option ` 13.7739Regular Plan - Quarterly Divi. Option ` 13.2746Direct Plan - Quarterly Divi. Option ` 14.4211DATE OF ALLOTMENT: April 24, 1988ASSET ALLOCATION: Equity and equity related instruments- 10% - 25% (Risk- High)Debt securities (including Securitized debt) with Money Market Instruments - 75% - 90% (Risk- Medium)MINIMUM INVESTMENT: ` 5000 and in multiples of ̀ 1 thereafterSubsequent purchases: Minimum amount of ` 1000 and multiples of ̀ 1 thereafterSIP: For Any date*/monthly frequency – ` 1000 and in multiples of ̀ 1 thereafterFor quarterly frequency – ` 2000 and in multiples of ̀ 1 thereafter STP: For Daily/Weekly/Monthly frequency – ` 1000 and in multiples of ̀ 1 thereafterFor quarterly frequency – ̀ 2000 and in multiples of ̀ 1 thereafterSWP: For monthly frequency – ` 1000 and in multiples of ̀ 1 thereafterFor quarterly frequency – ` 2000 and in multiples of ̀ 1 thereafterPLANS / OPTIONS : Regular Plan- Growth OptionRegular Plan - Monthly Dividend Payout / Reinvestment OptionRegular Plan- Quarterly Dividend Payout/ Reinvestment OptionDirect Plan- Growth OptionDirect Plan - Monthly Dividend Payout / Reinvestment OptionDirect Plan- Quarterly Dividend Payout/ Reinvestment OptionENTRY LOAD: Nil
EXPENSE RATIO^: Regular Plan : 2.23% Direct Plan : 1.20%
BENCHMARK: CRISIL Hybrid 85+15-Conservative IndexFUND MANAGER :1) Mr. Avnish Jain (For Debt Portfolio )2) Mr. Miyush Gandhi (For Equity Portfolio )TOTAL EXPERIENCE : 1) 23 Years 2) 10 YearsMANAGING THIS FUND: 1) Since 7-Oct-13
2) Since 15-June-18
#Monthend AUM : ` 198.59 CroresMonthly AVG AUM : ` 196.65 Crores
EXIT LOAD: For any redemption / switch out upto 10% of units within 1 Year from the date of allotment - NilFor any redemption / switch out more than 10% of units within 1 Year from the date of allotment - 1%For any redemption / switch out after 1 Year from the date of allotment - Nil
21
RATING PROFILE (% to net assets)
Tri-party repo/REPO/ 3.92Reverse Repo & Net Current AssetsAAA & Equivalent 60.46%AA+ & Equivalent 9.98%AA & Equivalent 6.73%Treasury Bills/Sovereign 18.91%
%
ASSET ALLOCATION
Tri-party repo/REPO/ 2.96%Reverse Repo & Net Current AssetsNCDs/Bonds 58.30%Treasury Bills/Sovereign 14.28%Equity 24.46%

$ Monthend AUM as on 31.05.2019= ^The expense ratios mentioned for the schemes includes GST on investment management fees.
=*As on date the said facility is available only in offline mode.= Please refer page no. 39 for disclaimers.
Source ICRA MFI Explorer = #
CANARA ROBECO EQUITY HYBRID FUND (CREHF)
PRODUCT POSITIONINGCanara Robeco Equity Hybrid Fund aims to generating long term capital appreciation through a prudent mix of equity and debt portfolio, making it more suitable for the average investor as it takes away the burden of focusing on asset allocation between equity & debt. The fund invests in a careful blend of select stocks and debt securities which effectively spreads the risk.
PORTFOLIO
ASSET ALLOCATION
l Income/capital appreciation over long term
lInvestment predominantly in equity and equity related instruments and a small portion in debt and money market instruments
This product is suitable for investors who are seeking*:
*Investors should consult their financial advisers if in doubt about whether the product is suitable for them.Investors understand that their principal
will be at Moderately High Risk
$QUANTITATIVE INFORMATION
Standard Deviation 10.69Portfolio Beta 1.09Portfolio Turnover Ratio 3.73 timesR-Squared 0.89Sharpe Ratio 0.65
(as on May 31, 2019)
RISKOMETER
FUND INFORMATIONCATEGORY/TYPE: Aggressive Hybrid Fund - An open-ended hybr id scheme invest ing predominantly in equity and equity related instrumentsSCHEME OBJECTIVE: To seek to generate long term capital appreciation and/or income from a portfolio constituted of equity and equity related securities as well as fixed income securities (debt and money market securities). However, there can be no assurance that the investment objective of the scheme will be realized
NAV: Direct Plan - Monthly Divi. Option ` 86.75Regular Plan - Monthly Divi. Option ` 80.17Direct Plan - Growth Option ` 170.70Regular Plan - Growth Option ` 162.12DATE OF ALLOTMENT: February 1, 1993ASSET ALLOCATION: Equity and equity related instruments- 65% - 80%. (Risk- High)Debt and money market instruments 20% to 35%. (Risk- Low to Medium)REITs/ InvITs – 0%-10% (Risk- Medium to High)MINIMUM INVESTMENT: ` 5000 and in multiples of ̀ 1 thereafterSubsequent purchases: Minimum amount of ` 1000 and multiples of ̀ 1 thereafter SIP: For Any date*/monthly frequency – ` 1000 and in multiples of ` 1 thereafter. For quarterly frequency – ` 2000 and in multiples of ` 1 thereafter STP: For Daily/Weekly/Monthly frequency – ` 1000 and in multiples of ` 1 thereafter. For quarterly frequency – ` 2000 and in multiples of ̀ 1 thereafter SWP: For monthly frequency – ` 1000 and in multiples of ` 1 thereafter. For quarterly frequency – ` 2000 and in multiples of ̀ 1 thereafterPLANS / OPTIONS : Regular Plan- Growth Option Regular Plan - Monthly Dividend Option (Payout and Reinvestment)Direct Plan- Growth OptionDirect Plan - Monthly Dividend Option (Payout and Reinvestment)ENTRY LOAD: Nil
EXPENSE RATIO^: Regular Plan : 2.14%Direct Plan : 1.01%
BENCHMARK : CRISIL Hybrid 35+65 - Aggressive IndexFUND MANAGER :For Equity Portfolio 1) Mr. Shridatta Bhandwaldar
2) Mr. Krishna SanghaviFor Debt Portfolio 3) Mr. Avnish Jain TOTAL EXPERIENCE : 1) 11 Years 2) 23 Years 3) 23 YearsMANAGING THIS FUND: 1) Since 5-July-16 2) Since 16-Oct-18 3) Since 7-Oct-13
#Monthend AUM : ` 2,242.08 Crores
Monthly AVG AUM : ` 2,154.02 Crores
EXIT LOAD: For any redemption / switch out upto 10% of units within 1 Year from the date of allotment – Nil. For any redemption / switch out more than 10% of units within 1 Year from the date of allotment - 1%. For any redemption / switch out after 1 Year from the date of allotment - Nil
(as on May 31, 2019)
Tri-party repo/REPO/ 4.55%Reverse Repo & Net Current AssetsCertificate Of Deposit 2.45%Commercial Paper 4.46%NCDs/Bonds 15.02%Treasury Bills/ Sovereign 3.29%Equity 70.24%
Name of the Instruments % to NAV
Equities 69.97Listed 69.97Banks 20.09HDFC Bank Ltd 5.45ICICI Bank Ltd 4.77State Bank of India 3.14Axis Bank Ltd 2.93Kotak Mahindra Bank Ltd 2.08City Union Bank Ltd 0.93RBL Bank Ltd 0.79Construction Project 5.85Larsen & Toubro Ltd 4.48Ashoka Buildcon Ltd 0.86Engineers India Ltd 0.51Software 5.84Infosys Ltd 3.01Tata Consultancy Services Ltd 1.07Tech Mahindra Ltd 0.81Larsen & Toubro Infotech Ltd 0.66CESC Ventures Ltd 0.29Consumer Non Durables 4.81ITC Ltd 1.95Hindustan Unilever Ltd 1.54Asian Paints Ltd 1.32Petroleum Products 4.40Reliance Industries Ltd 3.67Hindustan Petroleum Corporation Ltd 0.73Finance 3.46Housing Development Finance Corporation Ltd 1.87ICICI Prudential Life Insurance Com Ltd 0.88Mahindra & Mahindra Financial Services Ltd 0.71Consumer Durables 2.91Titan Company Ltd 0.90Whirlpool Of India Ltd 0.69Havells India Ltd 0.68Voltas Ltd 0.64Industrial Products 2.52Schaeffler India Ltd 0.82Polycab India Ltd 0.69AIA Engineering Ltd 0.64Bharat Forge Ltd 0.37Power 2.51Kalpataru Power Transmission Ltd 0.87NTPC Ltd 0.84Cesc Ltd 0.80Chemicals 2.31Atul Ltd 0.84Navin Fluorine International Ltd 0.81Solar Industries India Ltd 0.66Pharmaceuticals 2.19Divi’s Laboratories Ltd 0.93IPCA Laboratories Ltd 0.79Jubilant Life Sciences Ltd 0.47Gas 1.99GAIL (India) Ltd 0.91Indraprastha Gas Ltd 0.57Gujarat Gas Ltd 0.51Industrial Capital Goods 1.72Siemens Ltd 0.96Honeywell Automation India Ltd 0.76Auto 1.65Maruti Suzuki India Ltd 0.99Mahindra & Mahindra Ltd 0.66Cement 1.53Ultratech Cement Ltd 0.84Shree Cement Ltd 0.69Auto Ancillaries 1.47Endurance Technologies Ltd 0.74Balkrishna Industries Ltd 0.73Hotels, Resorts And Other Recreational Activities 1.05The Indian Hotels Co Ltd 1.05Telecom - Services 0.88Bharti Airtel Ltd 0.88Ferrous Metals 0.85Tata Steel Ltd 0.85Transportation 0.72Transport Corporation of India Ltd 0.72Construction 0.56Ahluwalia Contracts (India) Ltd 0.56Retailing 0.36Spencers Retail Ltd 0.36Textile Products 0.30Page Industries Ltd 0.30
22
Debt Instruments 14.95Power Finance Corporation Ltd 1.32REC Ltd 1.13Reliance Industries Ltd 0.90Indian Railway Finance Corporation Ltd 0.73Indian Railway Finance Corporation Ltd 0.68Small Industries Development Bank Of India 0.67REC Ltd 0.66Power Finance Corporation Ltd 0.66Reliance Industries Ltd 0.65Sundaram Finance Ltd 0.58National Bank For Agriculture & Rural Development 0.54LIC Housing Finance Ltd 0.46Housing Development Finance Corporation Ltd 0.46NTPC Ltd 0.46Power Finance Corporation Ltd 0.45Indiabulls Housing Finance Ltd 0.44National Bank For Agriculture & Rural Development 0.44Tata Motors Ltd 0.44REC Ltd 0.31Power Finance Corporation Ltd 0.30Indian Railway Finance Corporation Ltd 0.23Power Grid Corporation of India Ltd 0.23Power Grid Corporation of India Ltd 0.23REC Ltd 0.22LIC Housing Finance Ltd 0.22REC Ltd 0.22Power Finance Corporation Ltd 0.22Bharat Petroleum Corporation Ltd 0.22Tata Motors Ltd 0.22IDFC First Bank Ltd 0.22Power Finance Corporation Ltd 0.21Housing Development Finance Corporation Ltd 0.13National Bank For Agriculture & Rural Development 0.05Reliance Industries Ltd 0.05Money Market Instruments 11.34Tri-party repo 4.24Chennai Petroleum Corporation Ltd 3.33Andhra Bank 1.11ICICI Bank Ltd 1.11National Bank For Agriculture & Rural Development 1.11Treasury Bills 0.22Bank of Baroda 0.22Government Securities 3.067.17% GOI 08-JAN-28 0.897.95% GOI 28-AUG-32 0.707.57% GOI 17-JUN-33 0.698.24% GOI 15-FEB-27 0.248.15% GOI 24-NOV-26 0.237.40% GOI 09-SEP-35 0.227.42% MAHARASHTRA SDL 11-MAY-22 0.09Net Current Assets 0.68
Grand Total ( Net Asset) 100.00
MARKET CAPITALIZATION
Large Cap 50.79%Mid Cap 13.51%Small Cap 5.67%Debt, Cash & Others 30.03%

$ Monthend AUM as on 31.05.2019= ^The expense ratios mentioned for the schemes includes GST on investment management fees.= Please refer page no. 39 for disclaimers.
Source ICRA MFI Explorer = #
CANARA ROBECO GOLD EXCHANGE TRADED FUND (CRGETF)
lCapital appreciation over long term that are in line with the performance of gold, subject to tracking errors
lInvestment predominantly in Gold bullion of 0.995 fineness
This product is suitable for investors who are seeking*:
*Investors should consult their financial advisers if in doubt about whether the product is suitable for them.Investors understand that their principal
will be at Moderately High Risk
(as on May 31, 2019)
PORTFOLIO
Name of the Instruments % to NAV
GOLD 995 1KG BAR 98.78
Tri-party repo 1.16
Other Current Assets 0.06
Grand Total ( Net Asset) 100.00
GOLD
PRODUCT POSITIONING
Canara Robeco Gold Exchange Traded Fund is for investors who want to benefit from movement in gold prices without holding physical gold. It follows passive investment strategy and is benchmarked to price of physical gold. It endeavours to track and provide returns similar to its benchmark ie. prices of domestic gold through investment in physical gold and money market instruments
RATING PROFILE (% to net assets) FUND INFORMATION
CATEGORY/TYPE : ETF - An open ended scheme tracking domestic price of gold
SCHEME OBJECTIVE : The investment objective of the Scheme is to generate returns that are in line with the performance of gold, subject to tracking errors. However, there can be no assurance that the investment objective of the Scheme will be achieved
NAV : (as on May 31, 2019) : 2,964.3974
DAT E OF ALLOTMENT : 19th March 2012
ASSET ALLOCATION :Physical Gold- 95% - 100% (Risk- Medium)Debt & Money Market Instruments (including Cash & Cash equivalents)- 0% - 5% (Risk- Low)
MINIMUM INVESTMENT: Authorised Participants :Application for subscription of CRGETF units directly with the Fund in Creation Unit Size at applicable NAV and applicable charges, if any, in exchange of physical gold of defined purity (fineness) and quantity and/or cash component, value of which is equivalent to Creation Unit Size. The Cash Component is to be settled with the AMC by means of RTGS/NEFT or Funds Transfer Letter of a bank where the scheme has a collection accountLarge Investors:Application for subscription of CRGETF Units directly with the Fund in Creation Unit Size at NAV based prices by payment of requisite Cash as determined by the AMC only by means of payment instruction of Real Time Gross Settlement (RTGS)/National Electronic Funds Transfer (NEFT) or Funds Transfer Letter of a bank where the Scheme has a collection account.
PLANS / OPTIONS : Nil
Exchange Listed : National Stock Exchange / BSE
ENTRY LOAD: Nil
EXPENSE RATIO^:Regular Plan : 0.50%Direct Plan : NA
BENCHMARK : Domestic Price of gold
FUND MANAGER : 1) Mr. Avnish Jain2) Ms. Suman Prasad
23 Years
#Monthend AUM : ` 35.84 CroresMonthly AVG AUM : ` 35.85 Crores
EXIT LOAD: Exit Load: Nil for Creation of Unit Size by Authorised Participants or by Large Investors directly with the fund in Creation Unit Size. For other investors: The units of the Scheme are compulsorily traded in dematerialized form, and hence, there shall be no entry/exit load for the units purchased or sold through stock exchanges. However, the investor shall have to bear costs in form of bid/ask spread and brokerage or such other cost as charged by his broker for transacting in units of the Scheme through secondary market.
`
TOTAL EXPERIENCE: 1)2) 19 Years
MANAGING THIS FUND: 1) Since 24-June-142) Since 14-May-18
RISKOMETER
TRACKING ERROR
Annualised Tracking error for Gold ETF as of 2019 is 0.07 (Period: May 2013 to May 2019).
Source: Internal Calculation, Domestic Price of Gold- Nova Scotia Bank
May
MATURITY PROFILE
% Allocation
Net Current Assets 0.06%
Tri-party repo/REPO/ 100.00Reverse Repo & Net Current Assets
%
Tri-party repo/REPO/ 1.22
%
%Reverse Repo & Net Current AssetsGold ETFs 98.78
ASSET ALLOCATION
23
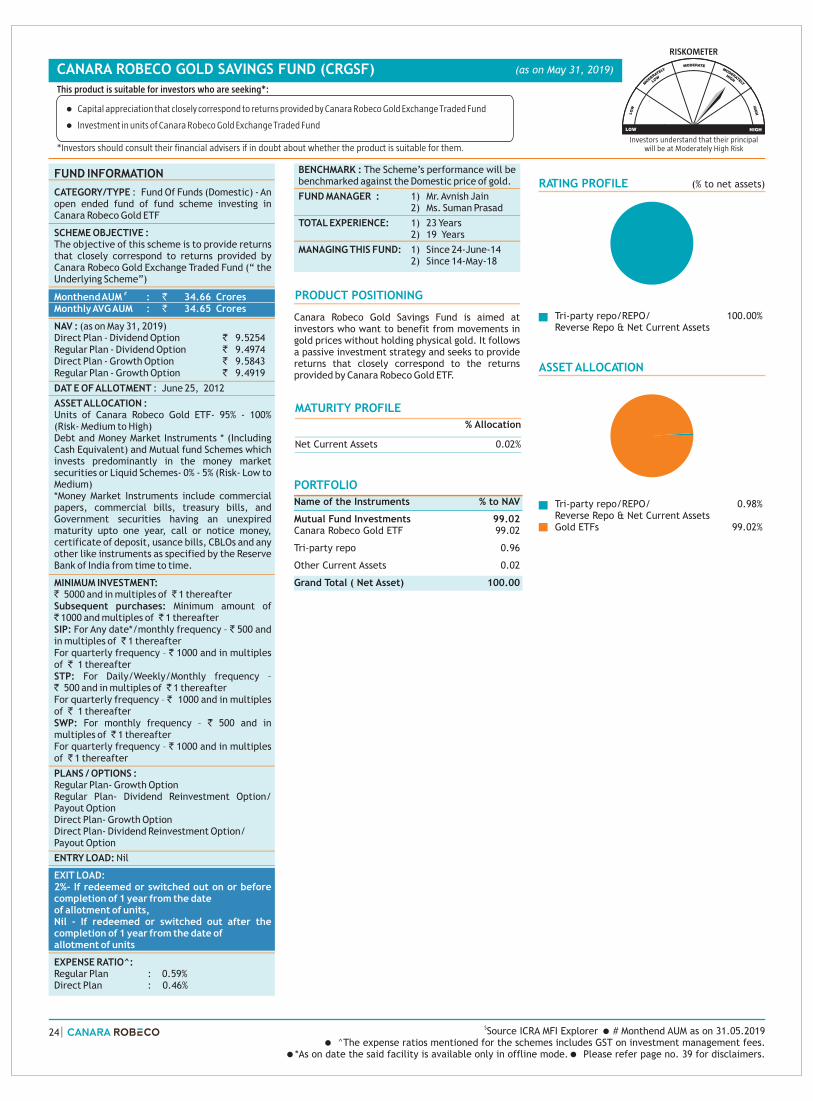
Tri-party repo/REPO/ 100.00Reverse Repo & Net Current Assets
%
CANARA ROBECO GOLD SAVINGS FUND (CRGSF)
RATING PROFILE (% to net assets)
lCapital appreciation that closely correspond to returns provided by Canara Robeco Gold Exchange Traded Fund
lInvestment in units of Canara Robeco Gold Exchange Traded Fund
This product is suitable for investors who are seeking*:
*Investors should consult their financial advisers if in doubt about whether the product is suitable for them.Investors understand that their principal
will be at Moderately High Risk
(as on May 31, 2019)
FUND INFORMATION
CATEGORY/TYPE : Fund Of Funds (Domestic) - An open ended fund of fund scheme investing in Canara Robeco Gold ETF
SCHEME OBJECTIVE : The objective of this scheme is to provide returns that closely correspond to returns provided by Canara Robeco Gold Exchange Traded Fund (“ the Underlying Scheme”)
NAV : Direct Plan - Dividend Option ` 9.5254Regular Plan - Dividend Option ` 9.4974Direct Plan - Growth Option ` 9.5843Regular Plan - Growth Option ` 9.4919
DAT E OF ALLOTMENT : June 25, 2012
ASSET ALLOCATION : Units of Canara Robeco Gold ETF- 95% - 100% (Risk- Medium to High)Debt and Money Market Instruments * (Including Cash Equivalent) and Mutual fund Schemes which invests predominantly in the money market securities or Liquid Schemes- 0% - 5% (Risk- Low to Medium)*Money Market Instruments include commercial papers, commercial bills, treasury bills, and Government securities having an unexpired maturity upto one year, call or notice money, certificate of deposit, usance bills, CBLOs and any other like instruments as specified by the Reserve Bank of India from time to time.
MINIMUM INVESTMENT: ` 5000 and in multiples of ̀ 1 thereafterSubsequent purchases: Minimum amount of ` 1000 and multiples of ̀ 1 thereafterSIP: For Any date*/monthly frequency – ̀ 500 and in multiples of ̀ 1 thereafterFor quarterly frequency – ` 1000 and in multiples of ̀ 1 thereafter STP: For Daily/Weekly/Monthly frequency – ` 500 and in multiples of ̀ 1 thereafterFor quarterly frequency – ̀ 1000 and in multiples of ̀ 1 thereafterSWP: For monthly frequency – ` 500 and in multiples of ̀ 1 thereafterFor quarterly frequency – ` 1000 and in multiples of ̀ 1 thereafter
PLANS / OPTIONS : Regular Plan- Growth Option Regular Plan- Dividend Reinvestment Option/ Payout OptionDirect Plan- Growth OptionDirect Plan- Dividend Reinvestment Option/Payout Option
ENTRY LOAD: Nil
EXPENSE RATIO^:Regular Plan : 0.59%Direct Plan : 0.46%
#Monthend AUM : ` 34.66 CroresMonthly AVG AUM : ` 34.65 Crores
EXIT LOAD:2%- If redeemed or switched out on or before completion of 1 year from the dateof allotment of units,Nil - If redeemed or switched out after the completion of 1 year from the date ofallotment of units
(as on May 31, 2019)
BENCHMARK : The Scheme’s performance will be benchmarked against the Domestic price of gold.
FUND MANAGER : 1) Mr. Avnish Jain2) Ms. Suman Prasad
23 Years TOTAL EXPERIENCE: 1)2) 19 Years
MANAGING THIS FUND: 1) Since 24-June-142) Since 14-May-18
RISKOMETER
PORTFOLIO
Name of the Instruments % to NAV
Mutual Fund Investments 99.02Canara Robeco Gold ETF 99.02
Tri-party repo 0.96
Other Current Assets 0.02
Grand Total ( Net Asset) 100.00
PRODUCT POSITIONING
Canara Robeco Gold Savings Fund is aimed at investors who want to benefit from movements in gold prices without holding physical gold. It follows a passive investment strategy and seeks to provide returns that closely correspond to the returns provided by Canara Robeco Gold ETF.
MATURITY PROFILE
% Allocation
Net Current Assets 0.02%
$ Monthend AUM as on 31.05.2019= ^The expense ratios mentioned for the schemes includes GST on investment management fees.
=*As on date the said facility is available only in offline mode.= Please refer page no. 39 for disclaimers.
Source ICRA MFI Explorer = #
ASSET ALLOCATION
Tri-party repo/REPO/ 0.98
%
%Reverse Repo & Net Current AssetsGold ETFs 99.02
24

PERFORMANCE AT A GLANCE
EQUITY SCHEMES
# # #Scheme Benchmark = Additional Benchmark Load is not taken into consideration for computation of returns. Returns of dividend option under the scheme for the investor would be net of distribution tax as applicable.
=
CANARA ROBECO EQUITY DIVERSIFIED FUND Fund Manager: Mr. Shridatta Bhandwaldar/ Mr. Krishna Sanghavi
The past performance may or may not be sustained in the future. Returns are based on growth NAV of Regular plan and are calculated on compounded annualized basis for a period of more than (or equal to) a year and absolute basis for a period less than a year. Inception Date: September 16, 2003 . Different plans have a different expense structure. The current fund managers Mr. Shridatta Bhandwaldar is managing the scheme since 5-July-16 and Mr. Krishna Sanghavi is managing the scheme since 16-October-18.
Period Returns (%) Current Value of Standard Investment of ` 10000
Scheme Scheme
9.97% 8.41 13.70 10997 10841 11370
15.75 14.59 15.65 15508 15046 15470
12.02 12.54 11.91 17647 18064 17566
# ## #S&P BSE 200 TRI S&P BSE SENSEX TRI S&P BSE 200 TRI ##S&P BSE SENSEX TRI
Last 1 Year % %
Last 3 Years % % %
Last 5 Years % % %
Since Inception (CAGR) 18.19% 16.29% 17.99% 138190 107134 134517
CANARA ROBECO INFRASTRUCTURE Fund Manager: Mr. Shridatta Bhandwaldar/ Mr. Krishna Sanghavi
The past performance may or may not be sustained in the future. Returns are based on growth NAV of Regular plan and are calculated on compounded annualized basis for a period of more than (or equal to) a year and absolute basis for a period less than a year. Inception Date: December 2, 2005 . Different plans have a different expense structure. The current fund managers Mr. Shridatta Bhandwaldar is managing the scheme since 29-September-18 and Mr. Krishna Sanghavi is managing the scheme since 16-October-18.
Period Returns (%) Current Value of Standard Investment of ` 10000
Scheme Scheme
-1.43 -2.86 13.70 9857 9714 11370
8.95 13.16 15.65 12934 14490 15470
10.21 6.87 11.91 16271 13947 17566
S&P BSE India ## ##S&P BSE SENSEX TRI S&P BSE India S&P BSE SENSEX TRI# #Infrastructure TRI Infrastructure TRI
Last 1 Year % % %
Last 3 Years % % %
Last 5 Years % % %
Since Inception (CAGR) 12.13% -. 14.76% 46910 -. 64166
Fund Manager: Ms. Cheenu Gupta / Mr. Krishna SanghaviCANARA ROBECO EQUITY TAX SAVER FUND
The past performance may or may not be sustained in the future. Returns are based on growth NAV of Regular plan and are calculated on compounded annualized basis for a period of more than (or equal to) a year and absolute basis for a period less than a year. Inception Date: March 31, 1993. Different plans have a different expense structure. The current fund managers Ms. Cheenu Gupta is managing the scheme since 12-March-18 and Mr. Krishna Sanghavi is managing the scheme since 16-October-18.
Period Returns (%) Current Value of Standard Investment of ` 10000
Scheme Scheme
12.33 10.42 13.70 11233 11042 11370
14.98 14.83 15.65 15202 15140 15470
13.11 11.91 11.91 18530 17566 17566
# #S&P BSE 100 TRI S&P BSE 100 TRI## ##S&P BSE SENSEX TRI S&P BSE SENSEX TRI
Last 1 Year % % %
Last 3 Years % % %
Last 5 Years % % %
Since Inception (CAGR) 19.92% 17.23% 16.91% 65255 51634 50214
CANARA ROBECO EMERGING EQUITIES Fund Manager: Mr. Miyush Gandhi / Mr. Krishna Sanghavi
The past performance may or may not be sustained in the future. Returns are based on growth NAV of Regular plan and are calculated on compounded annualized basis for a period of more than (or equal to) a year and absolute basis for a period less than a year. Inception Date: March 11, 2005. Different plans have a different expense structure. The current fund managers Mr. Miyush Gandhi is managing the scheme since 05-April-18 and Mr. Krishna Sanghavi is managing the scheme since 16-October-18.
Period Returns (%) Current Value of Standard Investment of ` 10000
#Scheme NIFTY Large Midcap 250 TRI Scheme
2.32 3.46 13.70 10232 10346 11370
16.78 14.72 15.65 15925 15096 15470
19.99 14.03 11.91 24903 19298 17566
## # ##S&P BSE SENSEX TRI NIFTY Large Midcap 250 TRI S&P BSE SENSEX TRI
Last 1 Year % % %
Last 3 Years % % %
Last 5 Years % % %
Since Inception (CAGR) 17.22% N.A. 16.12% 95900 N.A. 83900
CANARA ROBECO CONSUMER TRENDS FUND Fund Manager: Ms. Cheenu Gupta / Mr. Krishna Sanghavi
The past performance may or may not be sustained in the future. Returns are based on growth NAV and are calculated on compounded annualized basis for a period of more than (or equal to) a year and absolute basis for a period less than a year. Inception Date: September 14, 2009. Different plans have a different expense structure. The current fund managers Ms. Cheenu Gupta is managing the scheme since 15-June-18 and Mr. Krishna Sanghavi is managing the scheme since 16-October-18.
Period Returns (%) Current Value of Standard Investment of ` 10000
Scheme Scheme
4.45 10.42 13.70 10445 11042 11370
15.90 14.83 15.65 15569 15140 15470
16.09 11.91 11.91 21101 17566 17566
#S&P BSE 100 TRI ## # ##S&P BSE SENSEX TRI S&P BSE 100 TRI S&P BSE SENSEX TRI
Last 1 Year % % %
Last 3 Years % % %
Last 5 Years % % %
Since Inception (CAGR) 15.24% 8.75% 13.92% 39670 22592 35464
(as on May 31, 2019)
25

INCOME / DEBT SCHEMES
PERFORMANCE AT A GLANCE
EQUITY SCHEMES
# # #Scheme Benchmark = Additional Benchmark Load is not taken into consideration for computation of returns. Returns of dividend option under the scheme for the investor would be net of distribution tax as applicable.
=
CANARA ROBECO BLUE CHIP EQUITY FUND Fund Manager: Mr. Shridatta Bhandwaldar / Mr. Krishna Sanghavi
The past performance may or may not be sustained in the future. Returns are based on growth NAV of Regular plan and are calculated on compounded annualized basis for a period of more than (or equal to) a year and absolute basis for a period less than a year. Inception Date: August 20, 2010. Different plans have a different expense structure. The current fund managers Mr. Shridatta Bhandwaldar is managing the scheme ince 5-July-16 and Mr. Krishna Sanghavi is managing the scheme since 16-October-18.
s
Period Returns (%) Current Value of Standard Investment of ` 10000
Scheme Scheme
9.90 10.42 13.70 10990 11042 11370
14.03 14.83 15.65 14826 15140 15470
Last 5 Years 11.83 11.91 11.91 17498 17566 17566
# #S&P BSE 100 TRI S&P BSE 100 TRI## ##S&P BSE SENSEX TRI S&P BSE SENSEX TRI
Last 1 Year % % %
Last 3 Years % % %
% % %
Since Inception (CAGR) 11.26% 11.02% 13.85% 25530 25054 31248
CANARA ROBECO EQUITY HYBRID FUND Fund Manager: Mr. Avnish Jain / Mr. Shridatta Bhandwaldar / Mr. Krishna Sanghavi
The past performance may or may not be sustained in the future. Returns are based on growth NAV of Regular plan and are calculated on compounded annualized basis for a period of more than (or equal to) a year and absolute basis for a period less than a year. Inception Date: February 1, 1993. Different plans have a different expense structure. The current fund managers Mr. Shridatta Bhandwaldar managing the scheme since 5-July-16 , Mr. Krishna Sanghavi is managing the scheme since 16-October-18. and managing the scheme since
isMr. Avnish Jain is 07-Oct-13.
Period Returns (%) Current Value of Standard Investment of ` 10000
Scheme Scheme
8.80 9.42 13.70 10880 10942 11370
13.00 12.42 15.65 14427 14208 15470
13.23 11.51 11.91 18622 17253 17566
CRISIL Hybrid 35+65 - CRISIL Hybrid 35+65 -# #Aggressive Index Aggressive Index
Last 1 Year % % %
Last 3 Years % % %
Last 5 Years % % %
Since Inception (CAGR) 11.15% 0.00% 12.42% 162120 - 218273
## ##S&P BSE SENSEX TRI S&P BSE SENSEX TRI
CANARA ROBECO CONSERVATIVE HYBRID FUND Fund Manager: Mr. Miyush Gandhi / Mr. Avnish Jain
Period Returns (%) Current Value of Standard Investment of ` 10000
Scheme Scheme
8.65 10.46 12.20 10865 11046 11220
7.58 9.03 6.75 12451 12960 12165
7.74 9.63 8.23 14525 15845 14859
CRISIL Hybrid 85+15 - CRISIL Hybrid 85+15 - Conservative Index Conservative Index
CRISIL 10 Year CRISIL 10 Year ## ##Gilt Index Gilt Index
Last 1 Year % % %
Last 3 Years % % %
Last 5 Years % % %
Since Inception (CAGR) 10.43% 8.96% 6.30% 51790 41504 27522
# #
CANARA ROBECO SHORT DURATION FUND Fund Manager: Ms. Suman Prasad
The past performance may or may not be sustained in the future. Returns are based on growth NAV of Regular plan and are calculated on compounded annualized basis for a period of more than (or equal to) a year and absolute basis for a period less than a year. Inception Date: April 25, 2011. Different plans have a different expense structure. The current fund manager is managing the scheme s
Ms. Suman Prasad ince 16-Sep-12. As per the provisions of SEBI circular dated April 12, 2018 (Performance disclosure post consolidation/ Merger of Schemes), the past performance of aforesaid scheme is based on the historical
NAV of Canara Robeco Short Duration Fund (erstwhile Canara Robeco Yield Advantage Fund) and hence may not be comparable.
Period Returns (%) Current Value of Standard Investment of ` 10000
Scheme Scheme
8.04 9.24 12.20 10804 10924 11220
7.46 7.64 6.75 12409 12470 12165
Last 5 Years 7.08 8.25 8.23 14084 14874 14859
CRISIL Short Term Bond Fund Index Bond Fund Index
CRISIL 10 Year CRISIL 10 Year ## # ##Gilt Index Gilt Index
Last 1 Year % % %
Last 3 Years % % %
% % %
Since Inception (CAGR) 7.33% 8.50% 7.07% 17758 19365 17397
CRISIL Short Term #
(as on May 31, 2019)
The past performance may or may not be sustained in the future. Returns are based on growth NAV of Regular plan and are calculated on compounded annualized basis for a period of more than (or equal to) a year and absolute basis for a period less than a year. Inception Date: April 24, 1988. Different plans have a different expense structure. The current fund managers is managing the scheme since 15-June-18 and Mr. Avnish Jain is managing the scheme since 7-Oct-13. As per the provisions of SEBI circular dated April 12, 2018 (Performance disclosure post consolidation/ Merger of Schemes), the past performance of aforesaid scheme is based on the historical NAV of Canara Robeco Income Saver Fund (erstwhile Canara Robeco Monthly Income Plan) and hence may not be comparable.
Mr. Miyush Gandhi
26

CANARA ROBECO INCOME FUND Fund Manager: Mr. Avnish Jain
The past performance may or may not be sustained in the future. Returns are based on growth NAV of Regular plan and are calculated on compounded annualized basis for a period of more than (or equal to) a year and absolute basis for a period less than a year. Inception Date: September 19, 2002. Different plans have a different expense structure. The current fund manager is managing the scheme
Mr. Avnish Jain since 25-June-14
Period Returns (%) Current Value of Standard Investment of ` 10000
Scheme CRISIL Composite Bond Scheme
9.54 10.68 12.20 10954 11068 11220
7.55 7.95 6.75 12440 12579 12165
8.12 8.98 8.23 14784 15377 14859
CRISIL 10 Year CRISIL Composite Bond CRISIL 10 Year # ## # ##Fund Index Gilt Index Fund Index Gilt Index
Last 1 Year % % %
Last 3 Years % % %
Last 5 Years % % %
Since Inception (CAGR) 8.53% 6.97% 6.43% 39235 30831 28323
PERFORMANCE AT A GLANCE INCOME / DEBT SCHEMES
CANARA ROBECO LIQUID FUND Fund Manager: Mr. Girish Hisaria /Ms. Suman Prasad
The past performance may or may not be sustained in the future. Returns are based on growth NAV and are calculated on compounded annualized basis for a period of more than (or equal to) a year and Simple annualized basis for a period less than a year. Inception Date: Retail Plan : January 15, 2002 .Institutional Plan : May 31, 2004 . Regular Plan : July 15, 2008. The face value was changed to ̀ 1000 w.e.f Aug 20, 2011. Different plans have a different expense structure. The current fund managers is managing the scheme s is managing the scheme sMr. Girish Hisaria ince 24-Aug-14 and Ms. Suman Prasad ince 18-Mar-11
Period Returns (%) Current Value of Standard Investment of ` 10000
#Scheme Index Scheme
7.43 7.73 8.32 10743 10773 10832
7.01 7.19 7.47 12252 12316 12412
7.56 7.65 7.88 14401 14465 14620
# # ##Crisil Liquid Fund CRISIL Money Market Index Crisil Liquid Fund Index CRISIL Money Market Index
Last 1 Year % % %
Last 3 Years % % %
Last 5 Years % % %
Since Inception (CAGR) 7.86% 7.58% 7.86% 22790 22143 22792
Last 7 Days 6.82% 7.59% 8.77% 10013 10015 10017
Last 14 Days 7.06% 7.97% 9.31% 10029 10033 10038
Last 30 Days 6.96% 8.06% 9.07% 10059 10068 10077
#
CANARA ROBECO ULTRA SHORT TERM FUND Fund Manager: Mr. Girish Hisaria /Ms. Suman Prasad
The past performance may or may not be sustained in the future. Returns are based on growth NAV and are calculated on compounded annualized basis for a period of more than (or equal to) a year and absolute basis for a period less than a year. Inception Date: Retail Plan : September 16, 2003 . Institutional Plan : August 21, 2007 . Regular Plan : July 14, 2008. The face value was changed to ̀ 1000 w.e.f Aug 20, 2011. Different plans have a different expense structure. The current fund managers is managing the scheme s is managing the scheme sMr. Girish Hisaria ince 24-Aug-14 and Ms. Suman Prasad ince 12-Apr-11
Period Returns (%) Current Value of Standard Investment of ` 10000
Scheme Scheme
6.57 7.73 8.32 10657 10773 10832
6.24 7.19 7.47 11990 12316 12412
7.14 7.65 7.88 14126 14465 14620
# ## # ##Crisil Liquid Fund Index CRISIL Money Market Index Crisil Liquid Fund Index CRISIL Money Market Index
Last 1 Year % % %
Last 3 Years % % %
Last 5 Years % % %
Since Inception (CAGR) 7.74% 7.58% 7.86% 27945 22149 22796
# # #Scheme Benchmark = Additional Benchmark Load is not taken into consideration for computation of returns. Returns of dividend option under the scheme for the investor would be net of distribution tax as applicable.
=
CANARA ROBECO DYNAMIC BOND FUND Fund Manager: Mr. Girish Hisaria
The past performance may or may not be sustained in the future. Returns are based on growth NAVof Regular plan and are calculated on compounded annualized basis for a period of more than (or equal to) a year and absolute basis for a period less than a year. Inception Date: May 29, 2009. Different plans have a different expense structure. The current fund manager is managing the scheme Mr. Girish Hisaria since 24-Aug-14
Period Returns (%) Current Value of Standard Investment of ` 10000
#Scheme Crisil Scheme
8.62 10.68 12.20 10862 11068 11220
7.53 7.95 6.75 12432 12579 12165
8.30 8.98 8.23 14907 15377 14859
## # ##Composite Bond Fund Index CRISIL 10 Year Gilt Index Crisil Composite Bond Fund Index CRISIL 10 Year Gilt Index
Last 1 Year % % %
Last 3 Years % % %
Last 5 Years % % %
Since Inception (CAGR) 7.71% 7.76% 6.05% 21036 21125 18002
(as on May 31, 2019)
27
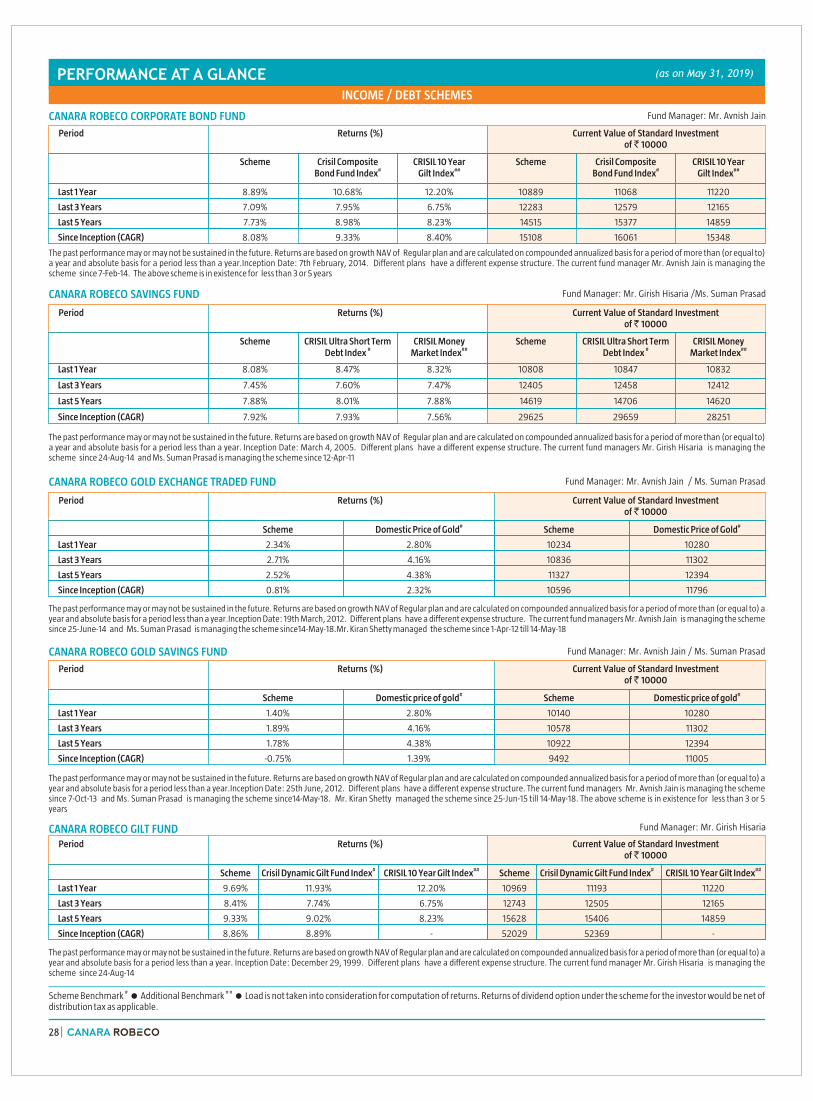
PERFORMANCE AT A GLANCE INCOME / DEBT SCHEMES
# # #Scheme Benchmark = Additional Benchmark Load is not taken into consideration for computation of returns. Returns of dividend option under the scheme for the investor would be net of distribution tax as applicable.
=
(as on May 31, 2019)
CANARA ROBECO SAVINGS FUND Fund Manager: Mr. Girish Hisaria /Ms. Suman Prasad
The past performance may or may not be sustained in the future. Returns are based on growth NAV of Regular plan and are calculated on compounded annualized basis for a period of more than (or equal to) a year and absolute basis for a period less than a year. Inception Date: March 4, 2005. Different plans have a different expense structure. The current fund managers is managing the scheme is managing the scheme s
Mr. Girish Hisaria since 24-Aug-14 and Ms. Suman Prasad ince 12-Apr-11
Period Returns (%) Current Value of Standard Investment of ` 10000
Scheme Scheme
8.08 8.47 8.32 10808 10847 10832
7.45 7.60 7.47 12405 12458 12412
7.88 8.01 7.88 14619 14706 14620
CRISIL Ultra Short Term CRISIL Money CRISIL Ultra Short Term CRISIL Money # ## # ##Debt Index Market Index Debt Index Market Index
Last 1 Year % % %
Last 3 Years % % %
Last 5 Years % % %
Since Inception (CAGR) 7.92% 7.93% 7.56% 29625 29659 28251
CANARA ROBECO GOLD EXCHANGE TRADED FUND Fund Manager: Mr. Avnish Jain / Ms. Suman Prasad
The past performance may or may not be sustained in the future. Returns are based on growth NAV of Regular plan and are calculated on compounded annualized basis for a period of more than (or equal to) a year and absolute basis for a period less than a year.Inception Date: 19th March, 2012. Different plans have a different expense structure. The current fund managers is managing the scheme s is managing the scheme s managed the scheme s
Mr. Avnish Jain ince 25-June-14 and Ms. Suman Prasad ince14-May-18.Mr. Kiran Shetty ince 1-Apr-12 till 14-May-18
Period Returns (%) Current Value of Standard Investment of ` 10000
Scheme Scheme
2.34 2.80 10234 10280
2.71 4.16 10836 11302
2.52 4.38 11327 12394
# #Domestic Price of Gold Domestic Price of Gold
Last 1 Year % %
Last 3 Years % %
Last 5 Years % %
Since Inception (CAGR) 0.81% 2.32% 10596 11796
CANARA ROBECO GOLD SAVINGS FUND Fund Manager: Mr. Avnish Jain / Ms. Suman Prasad
The past performance may or may not be sustained in the future. Returns are based on growth NAV of Regular plan and are calculated on compounded annualized basis for a period of more than (or equal to) a year and absolute basis for a period less than a year.Inception Date: 25th June, 2012. Different plans have a different expense structure. The current fund managers is managing the scheme
is managing the scheme s managed the scheme sMr. Avnish Jain
since 7-Oct-13 and Ms. Suman Prasad ince14-May-18. Mr. Kiran Shetty ince 25-Jun-15 till 14-May-18. The above scheme is in existence for less than 3 or 5 years
Period Returns (%) Current Value of Standard Investment of ` 10000
Scheme Scheme
1.40 2.80 10140 10280
1.89 4.16 10578 11302
Last 5 Years 1.78 4.38 10922 12394
# #Domestic price of gold Domestic price of gold
Last 1 Year % %
Last 3 Years % %
% %
Since Inception (CAGR) -0.75% 1.39% 9492 11005
CANARA ROBECO GILT FUND Fund Manager: Mr. Girish Hisaria
The past performance may or may not be sustained in the future. Returns are based on growth NAV of Regular plan and are calculated on compounded annualized basis for a period of more than (or equal to) a year and absolute basis for a period less than a year. Inception Date: December 29, 1999. Different plans have a different expense structure. The current fund manager is managing the scheme
Mr. Girish Hisaria since 24-Aug-14
Period Returns (%) Current Value of Standard Investment of ` 10000
#Scheme Crisil Dynamic Gilt Fund Index Scheme
9.69 11.93 12.20 10969 11193 11220
8.41 7.74 6.75 12743 12505 12165
9.33 9.02 8.23 15628 15406 14859
#CRISIL 10 Year Gilt Index # # ##Crisil Dynamic Gilt Fund Index CRISIL 10 Year Gilt Index
Last 1 Year % % %
Last 3 Years % % %
Last 5 Years % % %
Since Inception (CAGR) 8.86% 8.89% - 52029 52369 -
CANARA ROBECO CORPORATE BOND FUND Fund Manager: Mr. Avnish Jain
The past performance may or may not be sustained in the future. Returns are based on growth NAV of Regular plan and are calculated on compounded annualized basis for a period of more than (or equal to) a year and absolute basis for a period less than a year.Inception Date: 7th February, 2014. Different plans have a different expense structure. The current fund manager is managing the scheme
Mr. Avnish Jain since 7-Feb-14. The above scheme is in existence for less than 3 or 5 years
Period Returns (%) Current Value of Standard Investment of ` 10000
Scheme Scheme
8.89 10.68 12.20 10889 11068 11220
7.09 7.95 6.75 12283 12579 12165
Crisil Composite CRISIL 10 Year Crisil Composite CRISIL 10 Year # ## # ##Bond Fund Index Gilt Index Bond Fund Index Gilt Index
Last 1 Year % % %
Last 3 Years % % %
Last 5 Years 7.73% 8.98% 8.23% 14515 15377 14859
Since Inception (CAGR) 8.08% 9.33% 8.40% 15108 16061 15348
28

Fund Manager: Mr. Krishna Sanghavi
Scheme Names CAGR (%)
1 Year Return 3 Years Return 5 Years Return Since Inception
Scheme Benchmark# # # #Scheme Benchmark Scheme Benchmark Scheme Benchmark
CANARA ROBECO EQUITY DIVERSIFIED FUND 9.97% 8.41% 15.75% 14.59% 12.02% 12.54% 18.19% 16.29%
CANARA ROBECO BLUE CHIP EQUITY FUND 9.90% 10.42% 14.03% 14.83% 11.83% 11.91% 11.26% 11.02%
CANARA ROBECO EQUITY HYBRID FUND 8.80% 9.42% 13.00% 12.42% 13.23% 11.51% 11.15% 0.00%
CANARA ROBECO INFRASTRUCTURE -1.43% -2.86% 8.95% 13.16% 10.21% 6.87% 12.13% -.
CANARA ROBECO CONSUMER TRENDS FUND 4.45% 10.42% 15.90% 14.83% 16.09% 11.91% 15.24% 8.75%
CANARA ROBECO EMERGING EQUITIES 2.32% 3.46% 16.78% 14.72% 19.99% 14.03% 17.22% N.A.
CANARA ROBECO EQUITY TAX SAVER FUND 12.33% 10.42% 14.98% 14.83% 13.11% 11.91% 19.92% 17.23%
CANARA ROBECO SMALL CAP FUND* N.A. N.A. N.A. N.A. N.A. N.A. 3.70% 14.39%(Date of Allotment – 15.02.2019)
Note:
a. Mr. Krishna Sanghavi manages 8 open-ended schemes of Canara Robeco Mutual Fund .
b. Period for which scheme’s performance has been provided is computed basis last day of the month-end preceding the date of advertisement
c. Different plans shall have a different expense structure. The performance details provided herein are of Regular plan - Growth Option.
d. Past performance may or may not be sustained in the future.
e. *The performance of Canara Robeco Small Cap fund is based on absolute returns as the tenure of the scheme is less than 1 year.
Scheme Performance - Fund Manager wise (as on May 31, 2019)
#For scheme benchmark please refer page no 25-28 Load is not taken into consideration for computation of returns. Returns of dividend option under the scheme for the investor would be net of distribution tax as applicable. In case the number of schemes managed by a fund manager is more than six, performance data of schemes including top 3 and bottom 3 schemes managed by fund manager is provided.
=
=
Fund Manager: Mr. Shridatta Bhandwaldar
Scheme Names CAGR (%)
1 Year Return 3 Years Return 5 Years Return Since Inception
Scheme Benchmark# # # #Scheme Benchmark Scheme Benchmark Scheme Benchmark
CANARA ROBECO EQUITY DIVERSIFIED FUND 9.97% 8.41% 15.75% 14.59% 12.02% 12.54% 18.19% 16.29%
CANARA ROBECO BLUE CHIP EQUITY FUND 9.90% 10.42% 14.03% 14.83% 11.83% 11.91% 11.26% 11.02%
CANARA ROBECO EQUITY HYBRID FUND 8.80% 9.42% 13.00% 12.42% 13.23% 11.51% 11.15% 0.00%
CANARA ROBECO INFRASTRUCTURE -1.43% -2.86% 8.95% 13.16% 10.21% 6.87% 12.13% -.
Note:
a. Mr. Shridatta Bhandwaldar manages 4 open-ended schemes of Canara Robeco Mutual Fund .
b. Period for which scheme’s performance has been provided is computed basis last day of the month-end preceding the date of advertisement
c. Different plans shall have a different expense structure. The performance details provided herein are of Regular plan - Growth Option.
d. Past performance may or may not be sustained in the future.
Fund Manager: Mr. Miyush Gandhi
Scheme Names CAGR (%)
1 Year Return 3 Years Return 5 Years Return Since Inception
Scheme Benchmark
CANARA ROBECO CONSERVATIVE HYBRID FUND 8.65 10.46 7.58 9.03 7.74 9.63 10.43 8.96
# # # #Scheme Benchmark Scheme Benchmark Scheme Benchmark
CANARA ROBECO EMERGING EQUITIES 2.32 3.46 16.78 14.72 19.99 14.03 17.22 N.A.% % % % % % %
% % % % % % % %
Note:a. Mr. Miyush Gandhi manages 2 open-ended schemes of Canara Robeco Mutual Fund .b. Period for which scheme’s performance has been provided is computed basis last day of the month-end preceding the date of advertisementc. Different plans shall have a different expense structure.
The performance details provided herein are of Regular Plan – Growth Option d. As per the provisions of SEBI circular dated April 12, 2018 (Performance disclosure post consolidation/ Merger of Schemes), the past performance of aforesaid scheme is based on the historical NAV of
Canara Robeco Income Saver Fund (erstwhile Canara Robeco Monthly Income Plan) and hence may not be comparable.e. Past performance may or may not be sustained in the future.
Fund Manager: Ms. Cheenu Gupta
Scheme Names CAGR (%)
1 Year Return 3 Years Return 5 Years Return Since Inception
Scheme Benchmark
CANARA ROBECO CONSUMER TRENDS FUND 4.45% 10.42% 15.90% 14.83% 16.09% 11.91% 15.24% 8.75%
CANARA ROBECO SMALL CAP FUND* N.A. N.A. N.A. N.A. N.A. N.A. 3.70% 14.39%(Date of Allotment – 15.02.2019)
# # # #Scheme Benchmark Scheme Benchmark Scheme Benchmark
CANARA ROBECO EQUITY TAX SAVER FUND 12.33% 10.42% 14.98% 14.83% 13.11% 11.91% 19.92% 17.23%
Note:a. Ms. Cheenu Gupta manages 3 open-ended schemes of Canara Robeco Mutual Fund .b. Period for which scheme’s performance has been provided is computed basis last day of the month-end preceding the date of advertisementc. Different plans shall have a different expense structure. The performance details provided herein are of Regular plan - Growth Optiond. Past performance may or may not be sustained in the future.e. *The performance of Canara Robeco Small Cap fund is based on absolute returns as the tenure of the scheme is less than 1 year.
29

Scheme Performance - Fund Manager wise (as on May 31, 2019)
Fund Manager: Mr. Avnish Jain
Scheme Names CAGR (%)
1 Year Return 3 Years Return 5 Years Return Since Inception#Scheme Benchmark # # #Scheme Benchmark Scheme Benchmark Scheme Benchmark
CANARA ROBECO EQUITY HYBRID FUND* 8.80% 9.42% 13.00% 12.42% 13.23% 11.51% 11.15% 0.00%
CANARA ROBECO CONSERVATIVE HYBRID FUND* 8.65% 10.46% 7.58% 9.03% 7.74% 9.63% 10.43% 8.96%
CANARA ROBECO INCOME FUND 9.54% 10.68% 7.55% 7.95% 8.12% 8.98% 8.53% 6.97%
CANARA ROBECO GOLD EXCHANGE TRADED FUND 2.34% 2.80% 2.71% 4.16% 2.52% 4.38% 0.81% 2.32%
CANARA ROBECO GOLD SAVINGS FUND 1.40% 2.80% 1.89% 4.16% 1.78% 4.38% -0.75% 1.39%
CANARA ROBECO CORPORATE BOND FUND 8.89% 10.68% 7.09% 7.95% 7.73% 8.98% 8.08% 9.33%
Note:
a. Mr. Avnish Jain manages 6 open-ended schemes of Canara Robeco Mutual Fund .
b. Period for which scheme’s performance has been provided is computed basis last day of the month-end preceding the date of advertisement
c. Different plans shall have a different expense structure. The performance details provided herein are of Regular plan - Growth Option.
d. *Managing the portfolio only for debt allocation
e As per the provisions of SEBI circular dated April 12, 2018 (Performance disclosure post consolidation/ Merger of Schemes), the past performance of aforesaid scheme is based on the historical NAV of Canara Robeco Income Saver Fund (erstwhile Canara Robeco Monthly Income Plan) and hence may not be comparable.
f. Past performance may or may not be sustained in the future.
Fund Manager: Mr. Girish Hisaria
Scheme Names CAGR (%)
1 Year Return 3 Years Return 5 Years Return Since Inception#Scheme Benchmark # # #Scheme Benchmark Scheme Benchmark Scheme Benchmark
CANARA ROBECO GILT FUND 9.69% 11.93% 8.41% 7.74% 9.33% 9.02% 8.86% 8.89%
CANARA ROBECO LIQUID FUND 7.43% 7.73% 7.01% 7.19% 7.56% 7.65% 7.86% 7.58%
CANARA ROBECO ULTRA SHORT TERM FUND 6.57% 7.73% 6.24% 7.19% 7.14% 7.65% 7.74% 7.58%
CANARA ROBECO DYNAMIC BOND FUND 8.62% 10.68% 7.53% 7.95% 8.30% 8.98% 7.71% 7.76%
CANARA ROBECO SAVINGS FUND 8.08% 8.47% 7.45% 7.60% 7.88% 8.01% 7.92% 7.93%
Note:
a. Mr. Girish Hisaria manages 5 open-ended schemes of Canara Robeco Mutual Fund .
b. Period for which scheme’s performance has been provided is computed basis last day of the month-end preceding the date of advertisement
c. Different plans shall have a different expense structure.The performance details provided herein are of Regular plan - Growth Option.
d. Past performance may or may not be sustained in the future.
Fund Manager: Ms. Suman Prasad
Scheme Names CAGR (%)
1 Year Return 3 Years Return 5 Years Return Since Inception#Scheme Benchmark # # #Scheme Benchmark Scheme Benchmark Scheme Benchmark
CANARA ROBECO SHORT DURATION FUND 8.04% 9.24% 7.46% 7.64% 7.08% 8.25% 7.33% 8.50%
CANARA ROBECO LIQUID FUND 7.43% 7.73% 7.01% 7.19% 7.56% 7.65% 7.86% 7.58%
CANARA ROBECO ULTRA SHORT TERM FUND 6.57% 7.73% 6.24% 7.19% 7.14% 7.65% 7.74% 7.58%
CANARA ROBECO SAVINGS FUND 8.08% 8.47% 7.45% 7.60% 7.88% 8.01% 7.92% 7.93%
CANARA ROBECO GOLD EXCHANGE TRADED FUND 2.34% 2.80% 2.71% 4.16% 2.52% 4.38% 0.81% 2.32%
CANARA ROBECO GOLD SAVINGS FUND 1.40% 2.80% 1.89% 4.16% 1.78% 4.38% -0.75% 1.39%
Note:
a. Ms. Suman Prasad manages 6 open-ended schemes of Canara Robeco Mutual Fund .
b. Period for which scheme’s performance has been provided is computed basis last day of the month-end preceding the date of advertisement
c. Different plans shall have a different expense structure. The performance details provided herein are of Regular plan - Growth Option.
d As per the provisions of SEBI circular dated April 12, 2018 (Performance disclosure post consolidation/ Merger of Schemes), the past performance of aforesaid scheme is based on the historical NAV of Canara Robeco Short Duration Fund (erstwhile Canara Robeco Yield Advantage Fund) and hence may not be comparable.
e. Past performance may or may not be sustained in the future.
#For scheme benchmark please refer page no 25-28 Load is not taken into consideration for computation of returns. Returns of dividend option under the scheme for the investor would be net of distribution tax as applicable. In case the number of schemes managed by a fund manager is more than six, performance data of schemes including top 3 and bottom 3 schemes managed by fund manager is provided.
=
=
30
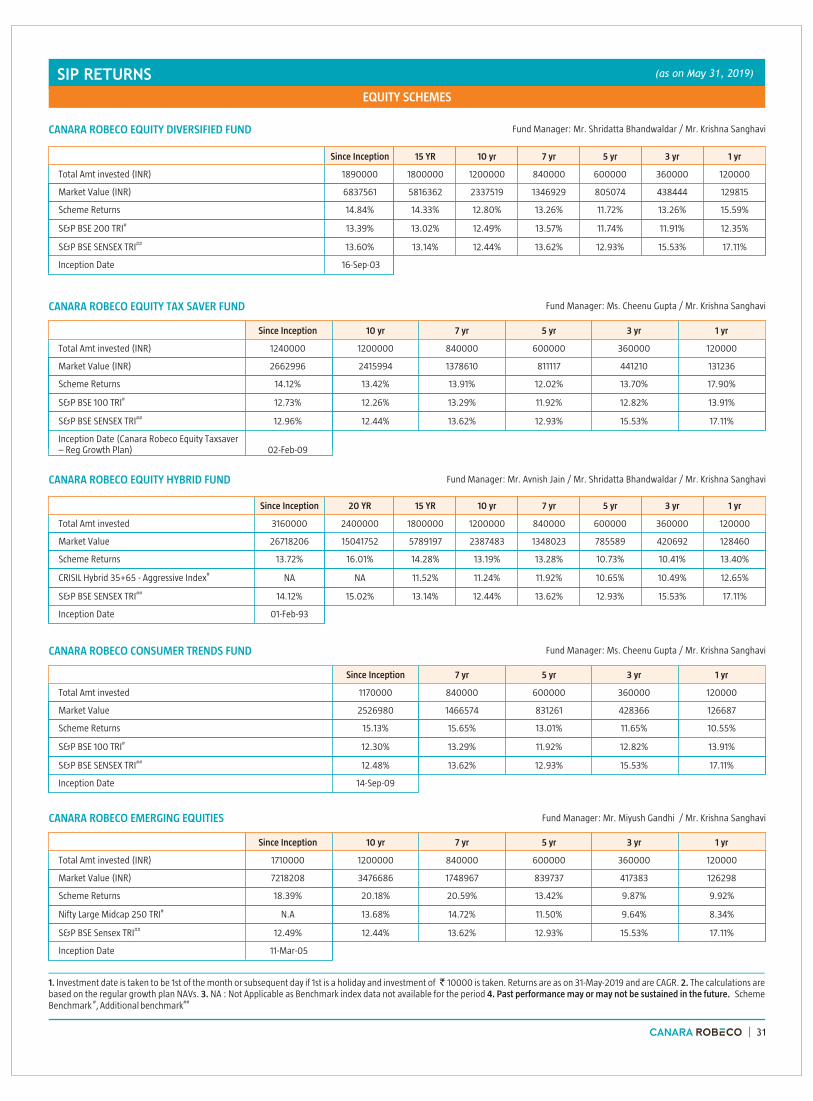
SIP RETURNS
EQUITY SCHEMES
1. Investment date is taken to be 1st of the month or subsequent day if 1st is a holiday and investment of ̀ 10000 is taken. Returns are as on 31-May- and are CAGR. 2. The calculations are based on the regular growth plan NAVs. 3. NA : Not Applicable as Benchmark index data not available for the period 4. Past performance may or may not be sustained in the future. Scheme
# ##Benchmark , Additional benchmark
2019
CANARA ROBECO EQUITY DIVERSIFIED FUND Fund Manager: Mr. Shridatta Bhandwaldar / Mr. Krishna Sanghavi
CANARA ROBECO EQUITY TAX SAVER FUND Fund Manager: Ms. Cheenu Gupta / Mr. Krishna Sanghavi
CANARA ROBECO EMERGING EQUITIES Fund Manager: Mr. Miyush Gandhi / Mr. Krishna Sanghavi
Since Inception 10 yr 7 yr 5 yr 3 yr 1 yr
Total Amt invested (INR) 1710000 1200000 840000 600000 360000 120000
Market Value (INR) 7218208 3476686 1748967 839737 417383 126298
Scheme Returns 18.39% 20.18% 20.59% 13.42% 9.87% 9.92%
Nifty Large Midcap 250 TRI N.A 13.68% 14.72% 11.50% 9.64% 8.34%
S&P BSE Sensex TRI 12.49% 12.44% 13.62% 12.93% 15.53% 17.11%
Inception Date
#
##
11-Mar-05
CANARA ROBECO EQUITY HYBRID FUND Fund Manager: Mr. Avnish Jain / Mr. Shridatta Bhandwaldar / Mr. Krishna Sanghavi
Since Inception 20 YR 15 YR 10 yr 7 yr 5 yr 3 yr 1 yr
Total Amt invested 3160000 2400000 1800000 1200000 840000 600000 360000 120000
Market Value 26718206 15041752 5789197 2387483 1348023 785589 420692 128460
Scheme Returns 13.72% 16.01% 14.28% 13.19% 13.28% 10.73% 10.41% 13.40%
CRISIL Hybrid 35+65 - Aggressive Index NA NA 11.52% 11.24% 11.92% 10.65% 10.49% 12.65%
S&P BSE SENSEX TRI 14.12% 15.02% 13.14% 12.44% 13.62% 12.93% 15.53% 17.11%
Inception Date 01-Feb-93
#
##
CANARA ROBECO CONSUMER TRENDS FUND Fund Manager: Ms. Cheenu Gupta / Mr. Krishna Sanghavi
Since Inception 7 yr 5 yr 3 yr 1 yr
Total Amt invested 1170000 840000 600000 360000 120000
Market Value 2526980 1466574 831261 428366 126687
Scheme Returns 15.13% 15.65% 13.01% 11.65% 10.55%
S&P BSE 100 TRI 12.30% 13.29% 11.92% 12.82% 13.91%
S&P BSE SENSEX TRI 12.48% 13.62% 12.93% 15.53% 17.11%
#
##
Inception Date 14-Sep-09
(as on May 31, 2019)
15 YR 10 yr 7 yr 5 yr 3 yr 1 yr
Total Amt invested (INR) 1890000 1800000 1200000 840000 600000 360000 120000
Market Value (INR) 6837561 5816362 2337519 1346929 805074 438444 129815
Scheme Returns 14.84% 14.33% 12.80% 13.26% 11.72% 13.26% 15.59%
#S&P BSE 200 TRI 13.39% 13.02% 12.49% 13.57% 11.74% 11.91% 12.35%
S&P BSE SENSEX TRI 13.60% 13.14% 12.44% 13.62% 12.93% 15.53% 17.11%
Since Inception
##
Inception Date 16-Sep-03
Since Inception 10 yr 7 yr 5 yr 3 yr 1 yr
Total Amt invested (INR) 1240000 1200000 840000 600000 360000 120000
Market Value (INR) 2662996 2415994 1378610 811117 441210 131236
Scheme Returns 14.12% 13.42% 13.91% 12.02% 13.70% 17.90%
S&P BSE 100 TRI 12.73% 12.26% 13.29% 11.92% 12.82% 13.91%
S&P BSE SENSEX TRI 12.96% 12.44% 13.62% 12.93% 15.53% 17.11%
#
##
Inception Date (Canara Robeco Equity Taxsaver – Reg Growth Plan) 02-Feb-09
31
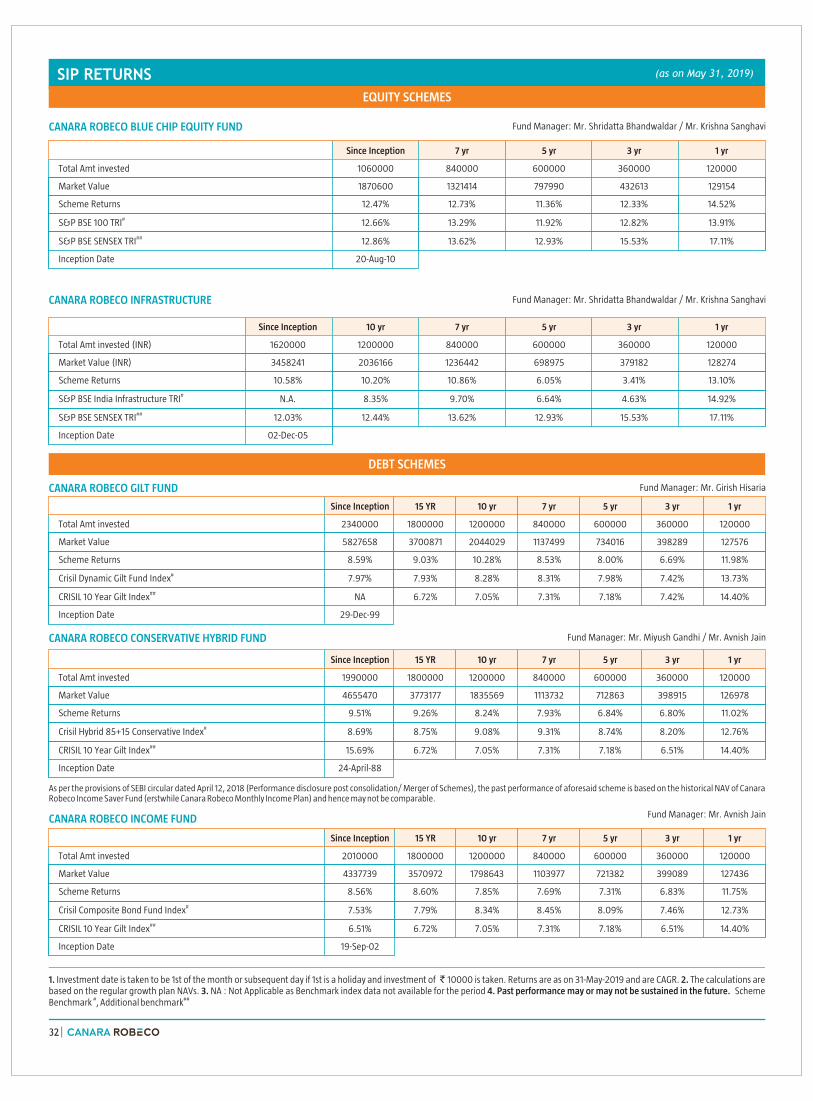
CANARA ROBECO BLUE CHIP EQUITY FUND Fund Manager: Mr. Shridatta Bhandwaldar / Mr. Krishna Sanghavi
Since Inception 7 yr 5 yr 3 yr 1 yr
Total Amt invested 1060000 840000 600000 360000 120000
Market Value 1870600 1321414 797990 432613 129154
Scheme Returns 12.47% 12.73% 11.36% 12.33% 14.52%
S&P BSE 100 TRI 12.66% 13.29% 11.92% 12.82% 13.91%
S&P BSE SENSEX TRI 12.86% 13.62% 12.93% 15.53% 17.11%
#
##
Inception Date 20-Aug-10
SIP RETURNS
EQUITY SCHEMES
CANARA ROBECO INFRASTRUCTURE Fund Manager: Mr. Shridatta Bhandwaldar / Mr. Krishna Sanghavi
DEBT SCHEMES
CANARA ROBECO GILT FUND Fund Manager: Mr. Girish Hisaria
Since Inception 15 YR 10 yr 7 yr 5 yr 3 yr 1 yr
Total Amt invested 2340000 1800000 1200000 840000 600000 360000 120000
Market Value 5827658 3700871 2044029 1137499 734016 398289 127576
Scheme Returns 8.59% 9.03% 10.28% 8.53% 8.00% 6.69% 11.98%
Crisil Dynamic Gilt Fund Index 7.97% 7.93% 8.28% 8.31% 7.98% 7.42% 13.73%
CRISIL 10 Year Gilt Index NA 6.72% 7.05% 7.31% 7.18% 7.42% 14.40%
Inception Date
#
##
29-Dec-99
CANARA ROBECO INCOME FUND Fund Manager: Mr. Avnish Jain
CANARA ROBECO CONSERVATIVE HYBRID FUND Fund Manager: Mr. Miyush Gandhi / Mr. Avnish Jain
Since Inception 10 yr 7 yr 5 yr 3 yr 1 yr
Total Amt invested (INR) 1620000 1200000 840000 600000 360000 120000
Market Value (INR) 3458241 2036166 1236442 698975 379182 128274
Scheme Returns 10.58% 10.20% 10.86% 6.05% 3.41% 13.10%
S&P BSE India Infrastructure TRI N.A. 8.35% 9.70% 6.64% 4.63% 14.92%
S&P BSE SENSEX TRI 12.03% 12.44% 13.62% 12.93% 15.53% 17.11%
#
##
Inception Date 02-Dec-05
(as on May 31, 2019)
As per the provisions of SEBI circular dated April 12, 2018 (Performance disclosure post consolidation/ Merger of Schemes), the past performance of aforesaid scheme is based on the historical NAV of Canara Robeco Income Saver Fund (erstwhile Canara Robeco Monthly Income Plan) and hence may not be comparable.
1. Investment date is taken to be 1st of the month or subsequent day if 1st is a holiday and investment of ̀ 10000 is taken. Returns are as on 31-May- and are CAGR. 2. The calculations are based on the regular growth plan NAVs. 3. NA : Not Applicable as Benchmark index data not available for the period 4. Past performance may or may not be sustained in the future. Scheme
# ## Benchmark , Additional benchmark
2019
Since Inception 15 YR 10 yr 7 yr 5 yr 3 yr 1 yr
Total Amt invested 1990000 1800000 1200000 840000 600000 360000 120000
Market Value 4655470 3773177 1835569 1113732 712863 398915 126978
Scheme Returns 9.51% 9.26% 8.24% 7.93% 6.84% 6.80% 11.02%
Crisil Hybrid 85+15 Conservative Index 8.69% 8.75% 9.08% 9.31% 8.74% 8.20% 12.76%
CRISIL 10 Year Gilt Index 15.69% 6.72% 7.05% 7.31% 7.18% 6.51% 14.40%
#
##
Inception Date 24-April-88
Since Inception 15 YR 10 yr 7 yr 5 yr 3 yr 1 yr
Total Amt invested 2010000 1800000 1200000 840000 600000 360000 120000
Market Value 4337739 3570972 1798643 1103977 721382 399089 127436
Scheme Returns 8.56% 8.60% 7.85% 7.69% 7.31% 6.83% 11.75%
Crisil Composite Bond Fund Index 7.53% 7.79% 8.34% 8.45% 8.09% 7.46% 12.73%
CRISIL 10 Year Gilt Index 6.51% 6.72% 7.05% 7.31% 7.18% 6.51% 14.40%
#
##
Inception Date 19-Sep-02
32

SIP RETURNS
DEBT SCHEMES
CANARA ROBECO ULTRA SHORT TERM FUND Fund Manager: Mr. Girish Hisaria /Ms. Suman Prasad
CANARA ROBECO SAVINGS FUND Fund Manager: Mr. Girish Hisaria /Ms. Suman Prasad
Since Inception 10 yr 7 yr 5 yr 3 yr 1 yr
Total Amt invested 1710000 1200000 840000 600000 360000 120000
Market Value 3140232 1826080 1111042 726468 402531 125411
Scheme Returns 8.09% 8.14% 7.87% 7.59% 7.41% 8.51%
Crisil Liquid Fund Index 7.52% 7.82% 7.69% 7.40% 7.34% 7.70%
CRISIL Money Market Index 7.88% 8.08% 7.92% 7.68% 7.68% 8.37%
Inception Date
#
##
04-Mar-05
CANARA ROBECO DYNAMIC BOND FUND Fund Manager: Mr. Girish Hisaria
1. Investment date is taken to be 1st of the month or subsequent day if 1st is a holiday and investment of ̀ 10000 is taken. Returns are as on 31-May- and are CAGR. 2. The calculations are based on the regular growth plan NAVs. 3. NA : Not Applicable as Benchmark index data not available for the period 4. Past performance may or may not be sustained in the future. Scheme
# ## Benchmark , Additional benchmark
2019
(as on May 31, 2019)
CANARA ROBECO GOLD SAVINGS FUND Fund Manager: Ms. Suman PrasadMr. Avnish Jain /
Since Inception 5 yr 3 yr 1 yr
Total Amt invested 840000 600000 360000 120000
Market Value 880548 644405 375315 122268
Scheme Returns 1.33% 2.82% 2.73% 3.54%
Domestic Price of Gold (Per KG) 3.41% 4.81% 4.45% 5.14%#
Inception Date 25-Jun-12
CANARA ROBECO SHORT DURATION FUND Fund Manager: Ms. Suman Prasad
As per the provisions of SEBI circular dated April 12, 2018 (Performance disclosure post consolidation/ Merger of Schemes), the past performance of aforesaid scheme is based on the historical NAV of Canara Robeco Short Duration Fund (erstwhile Canara Robeco Yield Advantage Fund) and hence may not be comparable.
Since Inception 10 yr 7 yr 5 yr 3 yr 1 yr
Total Amt invested 1310000 1200000 840000 600000 360000 120000
Market Value 2010717 1771971 1080716 708223 395653 124359
Scheme Returns 7.59% 7.57% 7.09% 6.57% 6.24% 6.84%
Crisil Ultra Short Term Debt Index 8.23% 8.26% 8.07% 7.81% 7.80% 8.54%
CRISIL Money Market Index 8.03% 8.08% 7.92% 7.68% 7.68% 8.37%
Inception Date 14-July-08
#
##
Since Inception 10 yr 7 yr 5 yr 3 yr 1 yr
Total Amt invested 1210000 1200000 840000 600000 360000 120000
Market Value 1840495 1819460 1108758 719046 395272 126776
Scheme Returns 8.06% 8.07% 7.81% 7.18% 6.18% 10.69%
Crisil Composite Bond Fund Index 8.33% 8.34% 8.45% 8.09% 7.46% 12.73%
CRISIL 10 Year Gilt Index 7.03% 7.05% 7.31% 7.18% 6.51% 14.40%
#
##
Inception Date 29-May-09
Since Inception 7 yr 5 yr 3 yr 1 yr
Total Amt invested 980000 840000 600000 360000 120000
Market Value 1322977 1083484 717867 399920 125641
Scheme Returns 7.20% 7.16% 7.11% 6.97% 8.88%
CRISIL Short-Term Bond Fund Index 8.27% 8.15% 7.82% 7.51% 10.02%
CRISIL 10 Year Gilt Index 7.31% 7.31% 7.18% 6.51% 14.40%
Inception Date 25-Apr-11
#
##
33

SIP RETURNS
DEBT SCHEMES
CANARA ROBECO CORPORATE BOND FUND Fund Manager: Mr. Avnish Jain
1. Investment date is taken to be 1st of the month or subsequent day if 1st is a holiday and investment of ̀ 10000 is taken. Returns are as on 31-May- and are CAGR. 2. The calculations are based on the regular growth plan NAVs. 3. NA : Not Applicable as Benchmark index data not available for the period 4. Past performance may or may not be sustained in the future. Scheme
# ## Benchmark , Additional benchmark
2019
(as on May 31, 2019)
Since Inception 5 yr 3 yr 1 yr
Total Amt invested 640000 600000 360000 120000
Market Value 778813 719105 399470 126511
Scheme Returns 7.29% 7.18% 6.89% 10.27%
Crisil Composite Bond Fund Index 8.27% 8.09% 7.46% 12.73%
CRISIL 10 Year Gilt Index 7.36% 7.18% 6.51% 14.40%
#
##
Inception Date 07-Feb-15
34

Canara Robeco Infrastructure
28.08.2015 1.65 25.91
28.08.2016 2.04 26.79
24.08.2017 1.75 29.22
31.08.2018 1.50 27.25
Direct Plan
22.08.2014 1.30 24.73
31.08.2018 2.00 35.54
Regular Plan
Date ofdeclaration (Record Date)
Dividend Distribution
per unit*
NAV as on the date
of declaration
DIVIDEND HISTORY
* On face value of ̀ 10. = For Daily, Weekly & Monthly dividend history of Canara Robeco Liquid Fund, Canara Robeco Ultra Short Term Fund & Canara Robeco Savings Fund Visit : www.canararobeco.com. = The dividend amount is before tax calculation.
Past performance may or may not be sustained in the future. Pursuant to payment of dividend, the NAV of the dividend option of the scheme would fall to the extent of payout and statutory levy (if applicable).
Date ofdeclaration (Record Date)
Dividend Distribution
per unit*
NAV as on the date
of declaration
Canara Robeco Consumer Trends Fund
31.07.2015 1.30 22.4700
29.07.2016 1.20 21.8600
28.07.2017 1.50 25.7300
23.03.2018 2.50 24.1800
27.07.2018 1.40 24.1100
Regular Plan
Canara Robeco Conservative Hybrid Fund(Monthly Dividend Option)
Date ofdeclaration (Record Date)
Dividend Distribution
per unit*
NAV as on the date
of declaration
29.12.2017 0.10 14.3693
25.01.2018 0.10 14.3173
23.02.2018 0.10 13.9882
23.03.2018 0.10 13.8193
27.04.2018 0.10 13.9453
25.05.2018 0.10 13.8158
29.06.2018 0.10 13.7547
20.07.2018 0.10 13.7901
31.08.2018 0.10 13.9409
28.09.2018 0.10 13.5063
26.10.2018 0.10 13.2603
30.11.2018 0.10 13.6120
28.12.2018 0.10 13.5943
25.01.2019 0.10 13.5129
22.02.2019 0.10 13.4247
29.03.2019 0.10 13.7262
26.04.2019 0.10 13.6047
31.05.2019 0.10 13.7739
Direct Plan
29.12.2017 0.10 15.2263
25.01.2018 0.10 15.1926
23.02.2018 0.10 14.8582
23.03.2018 0.10 14.6956
27.04.2018 0.10 14.8462
25.05.2018 0.10 14.7254
29.06.2018 0.10 14.6807
20.07.2018 0.10 14.7341
31.08.2018 0.10 14.9074
28.09.2018 0.10 14.4585
26.10.2018 0.10 14.2106
30.11.2018 0.10 14.6064
28.12.2018 0.10 14.6060
25.01.2019 0.10 14.5372
22.02.2019 0.10 14.4600
29.03.2019 0.10 14.8052
26.04.2019 0.10 14.6818
31.05.2019 0.10 14.8846
Quarterly Dividend Option
Regular Plan
29.12.2017 0.30 14.8541
23.03.2018 0.30 14.2967
22.06.2018 0.30 14.2640
28.09.2018 0.30 13.9872
28.12.2018 0.30 14.0881
29.03.2019 1.20 14.2357
Direct Plan
29.12.2017 0.30 15.7403
23.03.2018 0.30 15.2024
22.06.2018 0.30 15.2201
28.09.2018 0.30 14.9712
28.12.2018 0.30 15.1334
29.03.2019 1.20 15.3505
Regular Plan
Date ofdeclaration (Record Date)
Dividend Distribution
per unit*
NAV as on the date
of declaration
Canara Robeco Equity Tax Saver Fund
Regular Plan
10.11.2017 1.00 26.59
23.02.2018 1.00 26.27
30.11.2018 1.00 26.10
22.02.2019 1.00 24.70
Direct Plan
23.02.2018 1.50 39.08
30.11.2018 1.50 39.05
22.02.2019 1.50 37.03
Date ofdeclaration (Record Date)
Dividend Distribution
per unit*
NAV as on the date
of declaration
Canara Robeco Emerging Equities
28.11.2014 2.70 35.38
27.11.2015 2.20 37.54
25.11.2016 2.50 36.68
24.11.2017 2.50 49.33
30.11.2018 2.60 44.15
Direct Plan
25.11.2016 0.75 46.04
24.11.2017 3.00 66.22
30.11.2018 3.50 60.36
Regular Plan
Date ofdeclaration (Record Date)
Dividend Distribution
per unit*
NAV as on the date
of declaration
Canara Robeco Equity Hybrid Fund
Regular Plan
30.11.2018 0.67 78.12
28.12.2018 0.69 77.67
25.01.2019 0.68 76.63
22.02.2019 0.67 75.93
29.03.2019 0.69 79.89
26.04.2019 0.69 79.05
31.05.2019 0.69 80.17
Monthly Dividend Option -
30.11.2018 0.60 83.28
28.12.2018 0.60 82.98
25.01.2019 0.60 82.09
22.02.2019 0.60 81.55
29.03.2019 0.60 86.02
26.04.2019 0.60 85.31
31.05.2019 0.60 86.75
Monthly Dividend Option -
Direct Plan
Date ofdeclaration (Record Date)
Dividend Distribution
per unit*
NAV as on the date
of declaration
Canara Robeco Income Fund
Regular Plan
23.12.2016 0.20 14.9144
24.03.2017 0.20 14.7903
23.06.2017 0.20 15.0888
22.09.2017 0.20 14.9541
29.12.2017 0.20 14.6528
23.03.2018 0.20 14.5217
22.06.2018 0.20 14.3763
28.09.2018 0.20 14.3125
28.12.2018 0.20 14.5783
29.03.2019 0.25 14.7482
Quarterly Dividend Option - Direct Plan
23.12.2016 0.20 15.3087
24.03.2017 0.20 15.2147
23.06.2017 0.20 15.5573
22.09.2017 0.20 15.4593
29.12.2017 0.20 15.1902
23.03.2018 0.20 15.0911
22.06.2018 0.20 14.9803
28.09.2018 0.20 14.9586
28.12.2018 0.20 15.2789
29.03.2019 0.25 15.5008
Quarterly Dividend Option -
Date ofdeclaration (Record Date)
Dividend Distribution
per unit*
NAV as on the date
of declaration
Canara Robeco Equity Diversified Fund
28.10.2016 2.70 34.26
27.10.2017 3.00 37.91
26.10.2018 3.00 33.56
Direct Plan
27.10.2017 4.00 52.37
26.10.2018 4.00 46.79
Regular Plan
35

DIVIDEND HISTORY
Date ofdeclaration (Record Date)
Dividend Distribution
per unit*
NAV as on the date
of declaration
Canara Robeco Gilt Fund
20.12.2013 0.37 12.3226
20.06.2014 0.35 12.8805
31.12.2014 0.40 13.6628
26.06.2015 0.40 13.5912
23.12.2015 0.40 13.7057
24.06.2016 0.40 13.9683
23.12.2016 0.45 15.1684
23.06.2017 0.45 15.4644
29.12.2017 0.45 14.7729
22.06.2018 0.45 14.3774
28.12.2018 0.40 14.5640
Direct Plan
20.12.2013 0.37 12.3426
20.06.2014 0.35 12.9282
31.12.2014 0.40 13.7442
26.06.2015 0.40 13.7047
23.12.2015 0.40 13.8634
24.06.2016 0.40 14.1721
23.12.2016 0.45 15.4471
23.06.2017 0.45 15.7997
29.12.2017 0.45 15.1532
22.06.2018 0.45 14.8012
28.12.2018 0.40 15.0561
Regular Plan
Date ofdeclaration (Record Date)
Dividend Distribution
per unit*
NAV as on the date
of declaration
Canara Robeco Dynamic Bond Fund
20.12.2013 0.37 12.2913
20.06.2014 0.35 12.6800
31.12.2014 0.39 13.3433
26.06.2015 0.40 13.2629
23.12.2015 0.40 13.3071
24.06.2016 0.40 13.4407
23.12.2016 0.40 14.3270
23.06.2017 0.45 14.5633
29.12.2017 0.40 13.9791
22.06.2018 0.40 13.6557
28.12.2018 0.40 13.7272
Direct Plan
20.12.2013 0.37 12.3200
20.06.2014 0.35 12.7361
31.12.2014 0.39 13.4389
26.06.2015 0.40 13.4008
23.12.2015 0.40 13.4853
24.06.2016 0.40 13.6734
23.12.2016 0.40 14.6341
23.06.2017 0.45 14.9225
29.12.2017 0.40 14.3862
22.06.2018 0.40 14.1043
28.12.2018 0.40 14.2548
Regular Plan
Date ofdeclaration (Record Date)
Dividend Distribution
per unit*
NAV as on the date
of declaration
Canara Robeco Corporate Bond Fund
29.05.2015 0.30 11.1100
27.11.2015 0.30 11.2040
27.05.2016 0.34 11.3020
25.11.2016 0.35 11.7103
26.05.2017 0.35 11.5525
24.11.2017 0.35 11.5473
25.05.2018 0.35 11.2798
30.11.2018 0.35 11.3015
31.05.2019 0.35 11.5389
Direct Plan
29.05.2015 0.30 11.1324
27.11.2015 0.30 11.2594
27.05.2016 0.34 11.4032
25.11.2016 0.35 11.8578
26.05.2017 0.35 11.7398
24.11.2017 0.35 11.7801
25.05.2018 0.35 11.5522
30.11.2018 0.35 11.6246
31.05.2019 0.35 11.9207
Regular Plan
Date ofdeclaration (Record Date)
Dividend Distribution
per unit*
NAV as on the date
of declaration
Canara Robeco Short Duration Fund
23.02.2018 0.06 14.4501
23.03.2018 0.06 14.4907
27.04.2018 0.06 14.4416
25.05.2018 0.06 14.3961
29.06.2018 0.06 14.4311
20.07.2018 0.06 14.4480
31.08.2018 0.06 14.4833
28.09.2018 0.06 14.4109
26.10.2018 0.06 14.4294
30.11.2018 0.06 14.5196
28.12.2018 0.06 14.5666
25.01.2019 0.06 14.6041
22.02.2019 0.06 14.6280
29.03.2019 0.06 14.7336
26.04.2019 0.06 14.6911
31.05.2019 0.06 14.8206
Direct Plan
23.02.2018 0.06 15.3715
23.03.2018 0.06 15.4265
27.04.2018 0.06 15.3880
25.05.2018 0.06 15.3514
29.06.2018 0.06 15.4037
20.07.2018 0.06 15.4326
31.08.2018 0.06 15.4891
28.09.2018 0.06 15.4254
26.10.2018 0.06 15.4588
30.11.2018 0.06 15.5709
28.12.2018 0.06 15.6343
25.01.2019 0.06 15.6875
22.02.2019 0.06 15.7259
29.03.2019 0.06 15.8544
26.04.2019 0.06 15.8215
31.05.2019 0.06 15.9775
Quarterly Dividend Option - Regular Plan
29.12.2017 0.18 14.8360
23.03.2018 0.18 14.8298
22.06.2018 0.18 14.7649
28.09.2018 0.18 14.7550
28.12.2018 0.18 14.9175
29.03.2019 0.72 15.0917
Quarterly Dividend Option - Direct Plan
29.12.2017 0.18 15.4661
23.03.2018 0.18 15.4917
22.06.2018 0.18 15.4589
28.09.2018 0.18 15.4906
28.12.2018 0.18 15.6998
29.03.2019 0.72 15.9204
Monthly Dividend Option
Regular Plan
* On face value of ̀ 10. = For Daily, Weekly & Monthly dividend history of Canara Robeco Liquid Fund, Canara Robeco Ultra Short Term Fund & Canara Robeco Savings Fund Visit : www.canararobeco.com. = The dividend amount is before tax calculation.
Past performance may or may not be sustained in the future. Pursuant to payment of dividend, the NAV of the dividend option of the scheme would fall to the extent of payout and statutory levy (if applicable).
Date ofdeclaration (Record Date)
Dividend Distribution
per unit*
NAV as on the date
of declaration
Canara Robeco Blue Chip Equity Fund
27.11.2015 1.25 15.81
25.11.2016 1.32 14.90
24.11.2017 1.35 17.42
30.11.2018 1.30 16.87
Direct Plan
30.11.2018 1.90 24.49
Regular Plan
36

Fund ManagerAn employee of the asset management company who manages investments of the scheme. He is usually part of a larger team of fund managers and research analysts.
Minimum Application Amount for Fresh SubscriptionThis is the minimum investment amount for a new investor in a mutual fund scheme
Application Amount for Fresh SubscriptionThis is the minimum investment amount for a new investor in a mutual fund scheme.
Minimum Additional AmountThis is the minimum investment amount for an existing investor in a mutual fund scheme.
Yield to MaturityThe Yield to Maturity or the YTM is the rate of return anticipated on a bond if held until Maturity. YTM is expressed as an annual rate. The YTM factors in the bond's current market price, par value, coupon interest rate a d time to maturity.
SIPSIP or systematic investment plan works on the principle of making periodic investments of a fixed sum. It works similar to a recurring bank deposit. For instance, an investor may opt for an SIP that invests Rs. 500 every 15th of the month in an equity fund for a period of three years.
NAVThe NAV or the net asset value is the total asset value per unit of the mutual fund after deducting all related and permissible expenses. The NAV is calculated at the end of every business day. It is the value at which the investor enters or exits the mutual fund.
BenchmarkA group of securities, usually a market index, whose performance is used as a standard or benchmark to measure investment performance of mutual funds, among other investments. Some typical benchmarks include the Nifty, Sensex, BSE200, BSE500, 10 –Year Gsec.
Entry LoadA mutual fund may have a sales charge or load at the time of entry and/or exit to compensate the distributor/agent.
Entry load is charged at the time an investor purchases the units of a mutual find. The entry load is added to the prevailing NAV at the time of investment. For instance, if the NAV is Rs. 100 and the exit load is 1%, the investor will enter the fund at Rs. 101.
Exit LoadExit load is charged at the time an investor redeems the units of mutual fund. The exit load is reduced from the prevailing NAV at the time of redemption. The investor will receive redemption proceed at net value of NAV less Exit Load. For instance if the NAV is Rs. 100 and the exit load is 1% the investor will receive Rs. 99
Modified DurationModified duration is the price sensitivity and the percentage change in price for a unit changes in yield.
Standard DeviationStandard Deviation is a statistical measure of the range of an investment's performance. When a mutual fund has a high standard deviation, its means its range of performance is wide, implying greater volatility.
Sharpe Ratio The Sharpe Ratio, named after its founder, the Nobel Laureate William Sharpe, is a measure of risk-adjusted returns. It is calculated using standard deviation and excess return to determine reward per unit or risk.
BetaBeta is a measure of an investment's volatility vis-à-vis the market. Beta of less than 1 means that the security will be less volatile than the market. A beta of greater than 1 implies that the security's price will be more volatile than the market.
AUMAUM or assets under management refers to recent / updated cumulative market value of investments of a scheme managed by the mutual fund.
HoldingsThe holdings or the portfolio is a mutual fund's latest or updated reported statement of investments/securities. These are usually displayed in terms of percentage to net assets or the rupee value or both. The objective is to give investors an idea of where their money is being invested by the fund manager.
Nature of SchemeThe investment objective and underlying investments determine the nature of the mutual fund scheme. For instance, a mutual fund that aims at generating capital appreciation by investing in stock markets is an equity fund or growth fund. Likewise, a mutual fund that aims at capital preservation by investing in debt markets is a debt fund or income fun. Each of these categories may have sub-categories.
Rating ProfileMutual funds invest in securities after evaluating their creditworthiness a disclosed by the ratings. A depiction of the mutual fund in various investments based on their ratings becomes the rating profile of the fund. Typically, this is a feature of debt funds.
HOW TO READ A FACTSHEET
37

Total Expense RatioExpressed as an annualized percentage, it is the ratio of all the expenses of the fund to the total assets of the fund and includes the fund management fees paid to the asset management company for managing the fund's assets.
Sharp RatioThe Sharpe Ratio, named after its founder, the Nobel Laureate William Sharpe, is a measure of risk-adjusted returns. It is calculated using standard deviation and excess return to determine reward per unit or risk.
Beta RatioBeta is a measure of an investment's volatility vis-à-vis the market. Beta of less than 1 means that the security will be less volatile than the market. A beta of greater than 1 implies that the security's price will be more volatile than the market.
Portfolio Turnover RatioIt is a measure of how often assets within a fund are churned.
Modified DurationModified duration is the price sensitivity and the percentage change in price for a unit changes in yield.
Average MaturityIt is the weighted average of residual maturity of debt securities in a fund portfolio
Portfolio YieldWeighted Average valuation yield of the assets
Standard DeviationStandard Deviation is a statistical measure of the range of an investment's performance. When a mutual fund has a high standard deviation, its means its range of performance is wide, implying greater volatility.
Risk Free ReturnIt represents the rate of return an investor could have earned by investing in a security which is believed to have zero investment risk over the specified period of time.
Tracking ErrorTracking error is a measure of how closely is a scheme able to imitate the index to which it is benchmarked. It is the standard deviation of the difference between the scheme and index returns.
R-Squared:It is a statistical measure of how closely the portfolio returns are correlated with its benchmark.
DEFINITIONS
38

BRANCH OFFICES Give us a missed call: +91 98104 92222 or visit: www.canararobeco.com
Disclaimer : The information used towards formulating the outlook have been obtained from sources published by third parties. While such publications
are believed to be reliable, however, neither the AMC, its officers, the trustees, the Fund nor any of their affiliates or representatives assume any
responsibility for the accuracy of such information and assume no financial liability whatsoever to the user of this document. The document is solely for
the information and understanding of intended recipients only. Internal views, estimates, opinions expressed herein may or may not materialize. These
views, estimates, opinions alone are not sufficient and should not be used for the development or implementation of an investment strategy. Forward
looking statements are based on internal views and assumptions and subject to known and unknown risks and uncertainties which could materially impact
or differ the actual results or performance from those expressed or implied under those statements.
Mutual Fund investments are subject to market risks, read all scheme related documents carefully.
DISCLAIMERS (as on May 31, 2019)
Note: The disclosures relating to portfolio Turn over Ratio (for equity segment) is based on the aggregate market value of equity as on 31.05.2019 The disclosures of average
maturity period relates to the debt component of the portfolio as on 31.05.2019.
Unclaimed Dividends : Those Investors who have not received/encashed the Dividends distributed by the Schemes, may write to respective registrar, duly furnishing the Name
of the Scheme, Folio No. and Details of the Dividends not received.
.
$Note :
Risk ratios calculated for schemes having minimum three year performance
Risk Free Rate of Return : 6.0% (MIBOR as of May 31, 2019)
For the calculation of risk ratios monthly absolute returns calculated at monthly frequency are used
AHMEDABAD BANGALORE BHUBANESWAR CHANDIGARH CHENNAI GOA GUWAHATI HYDERABAD INDORE JAIPUR KOCHI KOLKATA
LUCKNOW MANGALORE MUMBAI NEW DELHI NAGPUR PUNE PATNA SURAT
=
= = = = = = =
= = = = = = = = = = =
39
