factsheet as on april 30, 2016 - edelweissmf.com · attendees 97 4011 edelweiss mutual fund...
TRANSCRIPT

$
$(An Open Ended Equity scheme)

Mutual Fund investments are subject to market risks, read all scheme related documents carefully.
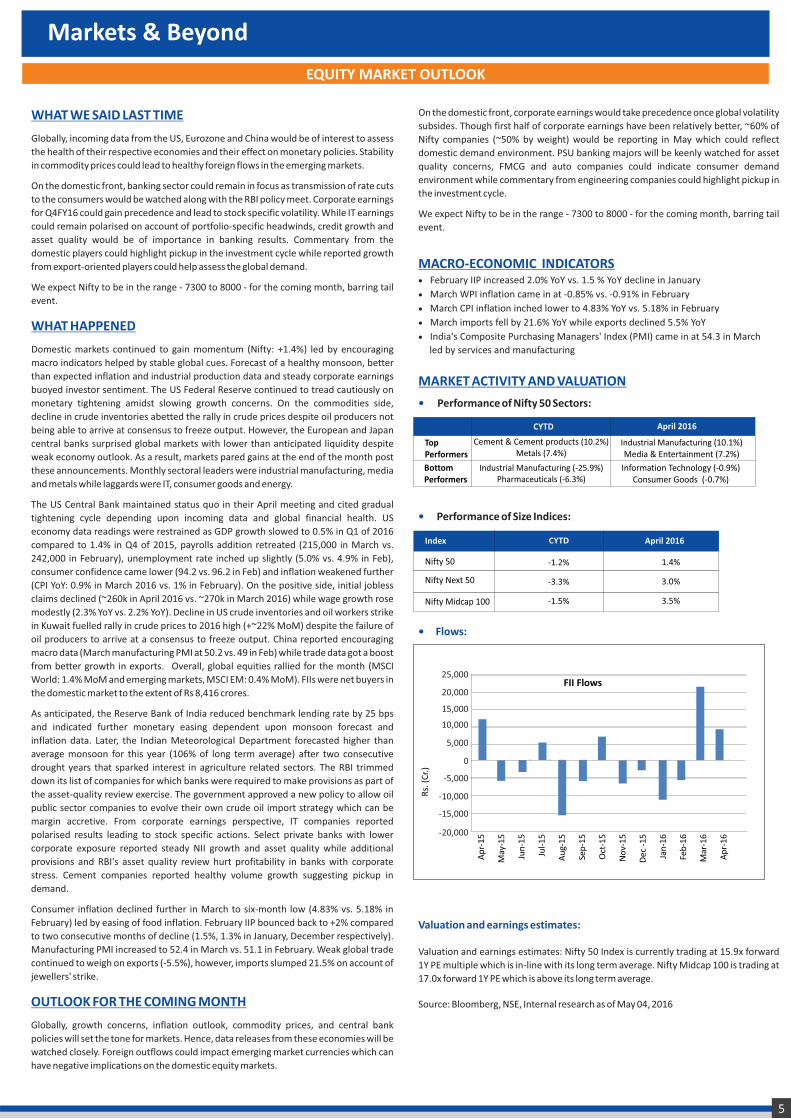
THE POWER OF HOLDING HIGH VALUE STOCKS THROUGH YOUR MUTUAL FUND INVESTMENTS
The table below shows the number of shares, forming part of the Top 10 Equity Holdings of the portfolio of the Scheme as on April 30, 2016, that will be notionally held by an investor who invests an assumed amount of in the Scheme.`10 lakhs
Edelweiss Emerging Leaders Fund (An Open Ended Equity scheme)
Top 10 stocks in the Portfolio as on April 30, 2016
*This hypothetical illustration assumes a sum of 10 Lakhs invested in the Scheme as on April 30, 2016. Number of Shares notionally held are calculated based on the percentage of Top 10 Equity Holdings to the net assets of the Scheme as on April 30, 2016.Market Price for each share as on April 30, 2016 is as follows: Yes Bank Limited @ ₹942.95 | Fiem Industries Limited @ ₹817.3 | MT Educare Limited @ ₹169.3 | APL Apollo Tubes Limited @ ₹792.75 | Aditya Birla Fashion and Retail Limited @ ₹147.55 | Strides Shasun Limited @ ₹1081 | Aegis Logistics Limited @ ₹115.15 | Mold-Tek Packaging Limited @ ₹148.15 | PTC India Financial Services Limited @ ₹38.95 | Tech Mahindra Limited @ ₹486.15Past performance may or may not be sustained in the market.This is a hypothetical exercise for improving the understanding of the investor on the deployment of his funds in the equity component of the portfolio and should not be construed to be actual holdings accruing to the Unitholder.The stocks referred to in this literature are not an endorsement by the Mutual Fund and AMC of their soundness or a recommendation to buy or sell these stocks.
2
Top 10 Equity HoldingsShares notionally
held by an investor*% to Net Assetsof the Scheme
44
48
232
49
243
32
286
215
811
64
4.14
3.95
3.93
3.85
3.58
3.50
3.29
3.19
3.16
3.13
Yes Bank Limited
Fiem Industries Limited
MT Educare Limited
APL Apollo Tubes Limited
Aditya Birla Fashion and Retail Limited
Strides Shasun Limited
Aegis Logistics Limited
Mold-Tek Packaging Limited
PTC India Financial Services Limited
Tech Mahindra Limited

An informed Investor = An informed Decision
No. of ProgramsConducted
No. of Attendees
401197
Edelweiss Mutual Fund
Investor Awareness Program
Location - Delhi NCRNo. of programs - 26No. of attendees - 1790
Location - LucknowNo. of programs - 8No. of attendees - 197
Location - KolkataNo. of programs - 5No. of attendees - 57
Location - Indore No. of programs - 31No. of attendees - 1256
Location - BangaloreNo. of programs - 12No. of attendees - 215
Location - ChennaiNo. of programs - 3No. of attendees - 39
Location - SuratNo. of programs - 2No. of attendees - 68
Location - AhmedabadNo. of programs - 9No. of attendees - 229
Location - MumbaiNo. of programs - 1No. of attendees - 160
Mutual Fund investments are subject to market risks, read all scheme related documents carefully.
An overview FY 2015 - 2016
Edelweiss Mutual Fund's Investor Awareness Program is designed with the objective of spreading awareness and making informed investors.
Our Programs have been attended by a healthy mix of individuals and institutions from the society, including students, working professionals, Police and other Govt.Officials, homemakers across age group and gender.

Index
4
Markets & Beyond
Exchange Traded Funds
• Equity Market Outlook
• Debt Market Outlook
• Edelweiss ETF - Nifty 50An Open Ended Exchange Traded Fund
• Edelweiss ETF - Nifty BankAn Open Ended Exchange Traded Fund
PAGE NO.
PAGE NO.
5
16
17
6
Schedule
Scheme Performance
• Schedule 1: How to Read Factsheet
• Direct Plan -Growth Option
PAGE NO.
PAGE NO.
23
20
• Edelweiss Absolute Return Fund*An Open Ended Equity Scheme(*The Scheme is an equity-oriented Scheme. Investors in the Scheme are not being offered any guaranteed / assured returns)
• Edelweiss Diversified Growth Equity Top 100 (E.D.G.E. Top 100) FundAn Open Ended Equity Scheme
• Edelweiss ELSS FundAn Open Ended Equity Linked Savings Scheme
• Edelweiss Emerging Leaders FundAn Open Ended Equity Scheme
• Edelweiss Prudent Advantage FundAn Open Ended Equity Scheme
• Edelweiss Arbitrage FundAn Open Ended Equity Scheme
• Edelweiss Equity Savings Advantage Fund An Open Ended Equity Scheme
PAGE NO.
7
8
10
11
13
14
15
Equity Funds
• Edelweiss Liquid FundAn Open Ended Liquid Scheme
• Edelweiss Bond FundAn Open Ended Debt Scheme
Fixed Income FundsPAGE NO.
18
19
PAGE NO.
Markets & Beyond
EQUITY MARKET OUTLOOK
WHAT WE SAID LAST TIME
Globally, incoming data from the US, Eurozone and China would be of interest to assess
the health of their respective economies and their effect on monetary policies. Stability
in commodity prices could lead to healthy foreign flows in the emerging markets.
On the domestic front, banking sector could remain in focus as transmission of rate cuts
to the consumers would be watched along with the RBI policy meet. Corporate earnings
for Q4FY16 could gain precedence and lead to stock specific volatility. While IT earnings
could remain polarised on account of portfolio-specific headwinds, credit growth and
asset quality would be of importance in banking results. Commentary from the
domestic players could highlight pickup in the investment cycle while reported growth
from export-oriented players could help assess the global demand.
We expect Nifty to be in the range - 7300 to 8000 - for the coming month, barring tail
event.
WHAT HAPPENED
Domestic markets continued to gain momentum (Nifty: +1.4%) led by encouraging
macro indicators helped by stable global cues. Forecast of a healthy monsoon, better
than expected inflation and industrial production data and steady corporate earnings
buoyed investor sentiment. The US Federal Reserve continued to tread cautiously on
monetary tightening amidst slowing growth concerns. On the commodities side,
decline in crude inventories abetted the rally in crude prices despite oil producers not
being able to arrive at consensus to freeze output. However, the European and Japan
central banks surprised global markets with lower than anticipated liquidity despite
weak economy outlook. As a result, markets pared gains at the end of the month post
these announcements. Monthly sectoral leaders were industrial manufacturing, media
and metals while laggards were IT, consumer goods and energy.
The US Central Bank maintained status quo in their April meeting and cited gradual
tightening cycle depending upon incoming data and global financial health. US
economy data readings were restrained as GDP growth slowed to 0.5% in Q1 of 2016
compared to 1.4% in Q4 of 2015, payrolls addition retreated (215,000 in March vs.
242,000 in February), unemployment rate inched up slightly (5.0% vs. 4.9% in Feb),
consumer confidence came lower (94.2 vs. 96.2 in Feb) and inflation weakened further
(CPI YoY: 0.9% in March 2016 vs. 1% in February). On the positive side, initial jobless
claims declined (~260k in April 2016 vs. ~270k in March 2016) while wage growth rose
modestly (2.3% YoY vs. 2.2% YoY). Decline in US crude inventories and oil workers strike
in Kuwait fuelled rally in crude prices to 2016 high (+~22% MoM) despite the failure of
oil producers to arrive at a consensus to freeze output. China reported encouraging
macro data (March manufacturing PMI at 50.2 vs. 49 in Feb) while trade data got a boost
from better growth in exports. Overall, global equities rallied for the month (MSCI
World: 1.4% MoM and emerging markets, MSCI EM: 0.4% MoM). FIIs were net buyers in
the domestic market to the extent of Rs 8,416 crores.
As anticipated, the Reserve Bank of India reduced benchmark lending rate by 25 bps
and indicated further monetary easing dependent upon monsoon forecast and
inflation data. Later, the Indian Meteorological Department forecasted higher than
average monsoon for this year (106% of long term average) after two consecutive
drought years that sparked interest in agriculture related sectors. The RBI trimmed
down its list of companies for which banks were required to make provisions as part of
the asset-quality review exercise. The government approved a new policy to allow oil
public sector companies to evolve their own crude oil import strategy which can be
margin accretive. From corporate earnings perspective, IT companies reported
polarised results leading to stock specific actions. Select private banks with lower
corporate exposure reported steady NII growth and asset quality while additional
provisions and RBI's asset quality review hurt profitability in banks with corporate
stress. Cement companies reported healthy volume growth suggesting pickup in
demand.
Consumer inflation declined further in March to six-month low (4.83% vs. 5.18% in
February) led by easing of food inflation. February IIP bounced back to +2% compared
to two consecutive months of decline (1.5%, 1.3% in January, December respectively).
Manufacturing PMI increased to 52.4 in March vs. 51.1 in February. Weak global trade
continued to weigh on exports (-5.5%), however, imports slumped 21.5% on account of
jewellers' strike.
OUTLOOK FOR THE COMING MONTH
Globally, growth concerns, inflation outlook, commodity prices, and central bank
policies will set the tone for markets. Hence, data releases from these economies will be
watched closely. Foreign outflows could impact emerging market currencies which can
have negative implications on the domestic equity markets.
On the domestic front, corporate earnings would take precedence once global volatility
subsides. Though first half of corporate earnings have been relatively better, ~60% of
Nifty companies (~50% by weight) would be reporting in May which could reflect
domestic demand environment. PSU banking majors will be keenly watched for asset
quality concerns, FMCG and auto companies could indicate consumer demand
environment while commentary from engineering companies could highlight pickup in
the investment cycle.
We expect Nifty to be in the range - 7300 to 8000 - for the coming month, barring tail
event.
MACRO-ECONOMIC INDICATORS February IIP increased 2.0% YoY vs. 1.5 % YoY decline in January
March WPI inflation came in at -0.85% vs. -0.91% in February
March CPI inflation inched lower to 4.83% YoY vs. 5.18% in February
March imports fell by 21.6% YoY while exports declined 5.5% YoY
India's Composite Purchasing Managers' Index (PMI) came in at 54.3 in March
led by services and manufacturing
MARKET ACTIVITY AND VALUATION
• Performance of Nifty 50 Sectors:
• Performance of Size Indices:
• Flows:
Valuation and earnings estimates:
Valuation and earnings estimates: Nifty 50 Index is currently trading at 15.9x forward
1Y PE multiple which is in-line with its long term average. Nifty Midcap 100 is trading at
17.0x forward 1Y PE which is above its long term average.
Source: Bloomberg, NSE, Internal research as of May 04, 2016
5
TopPerformers
Bottom Performers
April 2016CYTD
Cement & Cement products (10.2%) Metals (7.4%)
Industrial Manufacturing (-25.9%)Pharmaceuticals (-6.3%)
Industrial Manufacturing (10.1%)Media & Entertainment (7.2%)
Information Technology (-0.9%)Consumer Goods (-0.7%)
Nifty 50
Nifty Next 50
-1.2%
-3.3%
-1.5%Nifty Midcap 100
1.4%
3.0%
3.5%
Index CYTD April 2016
Ap
r-1
5
May
-15
Jun
-15
Jul-
15
Au
g-1
5
Sep
-15
Oct
-15
No
v-1
5
Dec
-1
5
Jan
-16
Feb
-16
Mar
-16
Ap
r-1
6
FII Flows
-20,000
-15,000
-10,000
-5,000
5,000
10,000
15,000
20,000
25,000
0
Rs.
(C
r.)
WHAT WE SAID LAST TIME
The Commitment to fiscal consolidation by the Union Government in conjunction with the three month spell of contraction of industrial output (November 2015-January 2016) and softer-than-expected headline CPI inflation for February 2016 have significantly bolstered the probability of a 25 bps rate cut in the April 2016 monetary policy review. Looming global uncertainty and weak rural demand has made it imperative to give the necessary push to domestic economic recovery. Further scope of monetary easing, however, remains constrained as evolving inflation trajectory based on implementation of Seventh Pay award and One Rank One Pension remains to be seen. For the bond market, decline in inflation brings much needed comfort. Additionally, factors such as the monsoon, extent of revision in minimum support prices and efficacy of food management would influence the inflation trajectory and the total quantum of rate cuts in 2016.
WHAT HAPPENED
US FOMC maintained status quo on its key rates and though it did not indicate an imminent June rate hike, it pointed to progress towards its inflation goal and further improvement in the labour market conditions as playing a key role in deciding the future rate trajectory.
India's annual inflation rate based on the Wholesale Price Index remained steady at -0.90% in March 2016. This was the seventeenth consecutive month where WPI Index has come in at sub-zero levels. The decline in inflation rate, is primarily on account of fall in prices of minerals, fuel & power and manufactured non-food products. Primary food inflation rose to 3.7% in March 2016 from 3.4% in February 2016, with an uptick in y-o-y inflation for cereals, milk, eggs, meat & fish and vegetables. Despite the continued correction for the fourth consecutive month, inflation for pulses remained steep at 34.4% in March 2016.The ministry also revised the WPI inflation for January 2016 by 17 bps to -1.1% from -0.9%
CPI inflation softened to a six-month low 4.8% in March 2016 from 5.7% in January 2016 and 5.3% in February 2016 in year-on-year terms, and printed below the Reserve Bank of India's target of 5.0% for March 2017. Core-CPI inflation moderated to 4.7% in March 2016 from 5.0% in February 2016, remaining lower than headline CPI inflation for the seventh consecutive month. Average CPI inflation eased to 4.9% in 2015-16 from 5.9% in 2014-15, led by food & beverages (to 5.1% from 6.5%) as well as core inflation (to 4.6% from 5.6%). Despite the second consecutive sub-par monsoon and the sharp spike in inflation for pulses (to 31.9% from 7.9%), low increases in minimum support prices and prudent food management contributed to a cooling in inflation for food and beverages. Final CPI inflation for February 2016 saw a mild upward revision to 5.3% from 5.2%, led by higher final inflation readings for tobacco, clothing and footwear.
The Index of Industrial Production (IIP) rose by 2.0% in February 2016 in year-on-year (y-o-y) terms, as compared to the 4.8% growth in February 2015, breaking the spell of contraction in industrial output for three consecutive months upto January 2016 and shrugging off concerns related to disruption in parts of Haryana. Among the broad sectors, the growth in manufacturing, which accounts for nearly three-fourths of the total weight of the Index of Industrial Production, came at 0.7% in February vis-a-vis 5.1% rise a year ago. Within the consumer goods segment, the pace of consumer durables output rose to a robust 9.7% in February from 5.8% a month ago. The contraction in output of consumer non-durables worsened to 4.2% in February 2016 from 3.1% in January 2016, reflecting the unfavourable base effect. In terms of the sectoral classification, the growth of electricity generation improved to a robust 9.6% in February 2016 from 5.9% in February 2015 and growth of mining output rose to 5.0% in February 2016 from the low 1.6% in February 2015. IIP growth stood at a meagre 2.6% in April 2015-February 2016, lower than the 2.8% rise recorded in the first 11 months of FY2015
The 10-year benchmark G-sec yield closed at 7.44%, down 3 bps from last month level of 7.47% while yield on the short-term 1-year bond went down by 13 bps to 7.06%.
In the corporate bond segment, yields were down as compared to previous month end. The 10-year AAA bond yield closed at 8.26%, 15 bps below than last month level while the short-term 1-year AAA bond yield also came down by 45 bps to close at 7.81%.
Within the short term segment, the yield on 3-month certificate of deposit (CD) were down marginally by 20 bps and ended at 7.30%, while that on the 1-year CD closed at 7.45%, down by mere 5 bps. Meanwhile, yield on 3-month commercial paper (CP) was also drastically down by 51 bps to 8.16% while yield on 1-year CP also ended lower by 46 bps from last month level to close at 8.34%.
OUTLOOK FOR THE COMING MONTH
Following two consecutive sub-par monsoons in 2014 and 2015, the initial forecast of the Indian Meteorological Department (IMD) projects an above-normal monsoon rainfall in 2016 at 106%+/-5% of the long period average (LPA). For the bond market, sustained easing of inflationary pressures is a welcome surprise. Ever since the Union Budget announcement, bond yields have rallied by almost 30–35bps, yet another lower than expected CPI print simply and WPI's continued trajectory in the negative adds to the momentum. In the near term, outlook for bonds continues to remain positive with the benchmark 10Y expected to trade in the range of 7.30% - 7.50%.
Markets & Beyond
DEBT MARKET OUTLOOK
6
India Government Actives
0.00%
0.10%
0.20%
0.30%
0.40%
0.50%
0.60%
0.70%
0.80%
0.90%
1.00%
3 Month 6 Month 1 Year 5 Year 10 Year
31-Mar-16 29-Apr-16
India Corporate Spread Curve
6.50%
6.75%
7.00%
7.25%
7.50%
7.75%
8.00%
8.25%
8.50%
3 Month 6 Month
31-Mar-16 29-Apr-16
1 Year 5 Year 10 Year

(*The Scheme is an equity - oriented Scheme. Investors in the Scheme are not being offered any guaranteed / assured returns.)#Mr. Absolute seeks to personify the characteristics of Edelweiss Absolute Return Fund: generate absolute returns with low volatility over a longer tenure of time.
Edelweiss ABSOLUTE RETURN Fund*
April
2016
Equity Fund
FACTSHEET
The primary objective of the Scheme will be to generate absolute returns with low volatility over a longer tenure of time. The Scheme will accordingly invest in arbitrage opportunities and debt and money market instruments on the one hand and in pure equity investments and equity derivative strategies on the other. However, there is no assurance that the investment objective of the Scheme will be realized and the Scheme does not assure or guarantee any returns.
INVESTMENT OBJECTIVE
FUND PERFORMANCE AS ON March 31, 2016
EDELWEISS ABSOLUTE RETURN FUND ( Edelweiss ARF)
Period
Edelweiss ARF Scheme Benchmark(Crisil MIP Blended)
$Alternate Benchmark(Nifty 50)
Risk Measurement -Standard Deviation
Returns # Value (INR) Returns # Value (INR) Returns #Value (INR) Edelweiss ARFCRISIL MIP
Blended Index Nifty 50
March 31, 2015 - March 31, 2016 ^ -3.14% 9,686 5.67% 10,567 -8.86% 9,114 7.99% 3.42% 17.17%
March 31, 2014 - March 31, 2015 ^ 35.52% 13,552 16.45% 11,645 26.65% 12,665 8.98% 3.01% 13.74%
March 28, 2013 - March 31, 2014 ^ 9.92% 10,992 6.52% 10,652 17.98% 11,798 9.35% 6.93% 18.15%
Since Inception (CAGR) - Edelweiss ARF 9.45% 18,180 8.21% 16,850 8.71% 17,376 6.95% 3.81% 17.04%
#Based on standard investment of 10,000 made at the beginning of the relevant period. ^Absolute ReturnsPast performance may or may not be sustained in future and should not be used as a basis for comparison with other investments.Since Inception returns are calculated on 10/- invested at inception of the schemeReturns shown above are for Growth Option only.Performance of the Dividend Option for the investor would be net of the dividend distribution tax, as applicable.
$Standard Benchmark prescribed by SEBI vide circular dated August 22, 2011.In case start /end date of the relevant period is a non-Business Day, the NAV of the previous Business Day is considered for computation of returns.Note: For the performance of other Schemes managed by the Fund Managers, please refer to the relevant scheme.
For Performance of Direct Plan, please refer page no. 23
Name of Instrument Industry % to Net Assets
Notes: • Fixed Deposit placed under margin : 1,900.00 Lakhs. • Total Exposure to derivative instruments (excluding reversed positions)
as on 30/04/2016 : 1,927.31 Lakhs.
INDUSTRY ALLOCATION- % of Equity Holdings
Dividend is declared on the face value of `10/- per unit. Dividend is paid subject to availability of distributable surplus. After payment of dividend the NAV of the Dividend Option of the Scheme falls to the extent of the dividend pay out and statutory levy if any. Past Performance may or may not be sustained in the future.
DIVIDEND HISTORY
Record Date Option NameNAV on Record
Date (`)Amount of
Dividend (`)26/04/2016 Dividend Option 12.70 0.2225/01/2016 Dividend Option 12.54 0.3027/10/2015 Dividend Option 13.37 0.2227/07/2015 Dividend Option 13.93 0.2222/04/2015 Dividend Option 13.81 0.2227/01/2015 Dividend Option 14.08 0.3031/10/2014 Dividend Option 13.24 0.2225/07/2014 Dividend Option 12.64 0.2225/04/2014 Dividend Option 11.16 0.2231/01/2014 Dividend Option 10.87 0.2225/10/2013 Dividend Option 11.20 0.2226/07/2013 Dividend Option 11.06 0.2226/04/2013 Dividend Option 10.98 0.1824/01/2013 Dividend Option 11.08 0.1829/10/2012 Dividend Option 11.06 0.1827/07/2012 Dividend Option 10.88 0.1827/04/2012 Dividend Option 10.84 0.1827/01/2012 Dividend Option 10.92 0.1828/10/2011 Dividend Option 10.88 0.1829/07/2011 Dividend Option 11.05 0.1829/04/2011 Dividend Option 11.10 0.1828/01/2011 Dividend Option 11.20 0.165
TOP TWENTY EQUITY HOLDINGS
ASSET ALLOCATION as on April 30, 2016
68.10 31.90Equities
Others include (Derivatives, Fixed Deposit, CBLO / Reverse Repo Investments and Cash & Cash Equivalents)
Date of Allotment : August 20, 2009
Date of Inception (Direct Plan) :January 21, 2013
Minimum Investment Amount : `1000/- per application & in multiples of 1/- thereafter
Entry Load: NIL
Exit Load• If the Units are redeemed / switched out on or
before 365 days from the date of allotment – 1.00%• If the Units are redeemed / switched out after 365
days from the date of allotment – NilThe entire exit load will be credited to the Scheme net of service tax, if any
Fund ManagerFund Manager: Mr. Kartik SoralExperience: 9 years Managing the Scheme since: April 01, 2015Assistant Fund Manager: Mr. Bhavesh JainExperience: 8 years Managing the Scheme since: - August 07, 2013
Ratios as on April 30, 2016Standard deviation 9.24%Sharpe ratio** 0.52Portfolio beta 0.53R squared 0.77Portfolio Turnover Ratio^ 7.7031 times** Risk Free Rate considered for the above = 8.110% p.a. Financial Benchmarks India Interbank 3 Month RatePlease note: Standard deviation and Sharpe ratio are annualized. ^ Lower of sales or purchase divided by average AUM for last rolling 12 months. Ratio as on March 31, 2016
Plan: The Scheme also offers Direct Plan
Options: Growth, Dividend
Benchmark: CRISIL MIP Blended Index##Total Expense Ratios :
Existing Plan: 2.44%Direct Plan: 1.69%##Current Financial year to date ratio to average AUM.
NAV as on April 29, 2016Growth Option 18.28Dividend Option 12.38
This product is suitable for investors who are seeking*:
• to create wealth over long term and prevent capital erosion in medium term
• investment predominantly in equity and equity related securities including through arbitrage opportunities with balance exposure to debt and money market securities
*Investors should consult their financial advisers if in doubt about whether the product is suitable for them.
LOW HIGH
Investors understand
that their principal will be at
moderately high risk
Riskometer
Fund SizeIn Crores
AUM Average AUM
511.28 513.08
If you had invested 10,000 every month
For SIP returns, monthly investment of equal amounts invested on the 1st working day of every month. Past performance may or may not be sustained in future
SIP PERFORMANCE as on March 31, 2016
1 Year 3 Year 5 YearTotal Amount Invested 120,000.00 360,000.00 600,000.00 Total Value as on 117723.45 416604.65 786581.11 31st March 2016 Returns -3.50% 9.73% 10.78%Total Value of Crisil MIP Index 124237.94 414726.71 757572.15Total Value of Nifty 50 115374.11 389546.49 734998.24Crisil MIP Returns 6.62% 9.42% 9.27%Nifty 50 Returns -7.07% 5.19% 8.05%
7
(An Open Ended Equity Scheme)
Infosys Limited Software 5.69Tata Consultancy Services Limited Software 4.68HDFC Bank Limited Banks 3.22Reliance Industries Limited Petroleum Products 2.90Pidilite Industries Limited Chemicals 2.58Hindustan Unilever Limited Consumer Non Durables 2.53Kotak Mahindra Bank Limited Banks 2.14Power Grid Corporation of India Limited Power 2.13Housing Development Finance Corporation Limited Finance 2.04Bajaj Finance Limited Finance 1.94Tata Motors Limited Auto 1.87State Bank of India Banks 1.86GlaxoSmithKline Consumer Healthcare Limited Consumer Non Durables 1.74Marico Limited Consumer Non Durables 1.46GlaxoSmithKline Pharmaceuticals Limited Pharmaceuticals 1.32Maruti Suzuki India Limited Auto 1.28IndusInd Bank Limited Banks 1.24Wipro Limited Software 1.22Bajaj Finserv Limited Finance 1.21Yes Bank Limited Banks 1.21
0.02%
0.02%
0.20%
0.57%
0.63%
0.76%
1.02%
1.20%
1.20%
1.32%
2.58%
2.90%
3.29%
3.69%
4.30%
7.66%
10.22%
11.57%
14.94%
Telecom - Services
Industrial Products
Healthcare Services
Consumer Durables
Construction Project
Cement
Minerals/Mining
Gas
Telecom - Equipment & Accessories
Construction
Chemicals
Petroleum Products
Pharmaceuticals
Power
Auto
Finance
Consumer Non Durables
Banks
Software

*Kindly refer addendum dated September 29, 2012 for discontinued Plan viz Plan B & Plan C & addendum dated Oct 19, 2012 for standardizing the nomenclature for existing Plan / Options
Equity Fund
FACTSHEET
EDGEMaster seeks to personify the attributes of E.D.G.E Top 100 Fund: A large cap Fund focusing on 100 largest corporates in India by market capitalization | Invests in large caps which are resilient to downtrends | Uses Quant style of investing that helps in sensing the change in the trend quickly and ensures that the portfolio has the potential to deliver returns higher than the benchmark index.
The primary objective of the Scheme is to generate capital appreciation, from a portfolio that is substantially constituted of equity securities and equity related securities of the 100 largest corporates by market capitalization, listed in India. However, there is no assurance that the investment objective of the Scheme will be realized and the Scheme does not assure or guarantee any returns.
INVESTMENT OBJECTIVE
FUND PERFORMANCE AS ON March 31, 2016
EDELWEISS DIVERSIFIED GROWTH EQUITY TOP 100 (E.D.G.E TOP 100) FUND
#Based on standard investment of `10,000 made at the beginning of the relevant period. ^Absolute ReturnsPast performance may or may not be sustained in future and should not be used as a basis for comparison with other investments.Since Inception returns are calculated on 10/- invested at inception of the Scheme. Returns shown above are for Growth Option only.Performance of the Dividend Option for the investor would be net of the dividend distribution tax, as
$applicable. Standard Benchmark prescribed by SEBI vide circular dated August 22, 2011.In case start /end date of the relevant period is a non-Business Day, the NAV of the previous Business Day is considered for computation of return. ^Standard Deviation for E.D.G.E. Top 100 Fund - Existing Plan onlyNote: For the performance of other Schemes managed by the Fund Managers, please refer to the relevant scheme.For Performance of Direct Plan, please refer page no. 22
Period
E.D.G.E Top 100 Fund (Existing Plan)
E.D.G.E Top 100 Fund Plan B*
E.D.G.E Top 100 Fund Plan C*
Scheme Benchmark(Nifty 50)
$Alternate Benchmark(S&P BSE SENSEX)
Risk Measurement -Standard Deviation^^
Returns Value
#(INR)Returns
Value #(INR)
Returns Value
#(INR)Returns
Value #(INR)
Returns #Value (INR) E.D.G.E Top 100 Nifty 50
S&P BSE SENSEX
March 31, 2015 - March 31, 2016 ^ -7.84% 9,216 -7.80% 9,220 -7.83% 9,217 -8.86% 9,114 -9.36% 9,064 16.34% 17.17% 17.01%
March 31, 2014 - March 31, 2015 ^ 44.24% 14,424 44.24% 14,424 44.19% 14,419 26.65% 12,665 24.89% 12,489 12.99% 13.74% 13.78%
March 28, 2013 - March 31, 2014 ^ 16.99% 11,699 16.97% 11,697 17.07% 11,707 17.98% 11,798 18.85% 11,885 15.90% 18.15% 17.45%
Since Inception (CAGR) - E.D.G.E. Top 100 Fund
13.58% 23,980 13.67% 24,110 13.45% 23,790 9.04% 18,121 8.96% 18,023 16.30% 17.87% 17.55%
Notes: • Fixed Deposit placed under margin : 185.00 Lakhs. • Total Exposure to derivative instruments (excluding reversed positions)
as on 30/04/2016 : 554.28 Lakhs.
INDUSTRY ALLOCATION- % of Equity Holdings
Date of Allotment: May 20, 2009
Date of Inception (Direct Plan): January 7, 2013
Minimum Investment Amount : `1000/- per application & in multiples of 1/- thereafter
Entry Load: NIL
Exit Load• If the Units are redeemed / switched out on or before
365 days from the date of allotment – 1.00%• If the Units are redeemed / switched out after 365
days from the date of allotment – NilThe entire exit load will be credited to the Scheme net of service tax, if any
Fund ManagerFund Manager: Mr. Kartik SoralExperience: 9 years Managing the Scheme since: April 01, 2015Assistant Fund Manager: Mr. Bhavesh JainExperience: 8 years Managing the Scheme since: - August 07, 2013
Ratios as on April 30, 2016Standard deviation 15.20%Sharpe ratio** 0.51Portfolio beta 0.94R squared 0.89Portfolio Turnover Ratio^ 4.1184 times** Risk Free Rate considered for the above = 8.110% p.a. Financial Benchmarks India Interbank 3 Month RatePlease note: Standard deviation and Sharpe ratio are annualized. ^ Lower of sales or purchase divided by average AUM for last rolling 12 months. Ratio as on March 31, 2016
Plan: The Scheme also offers Direct Plan
Options: Growth, Dividend
Benchmark: Nifty 50##Total Expense Ratios :
Existing Plan: 2.68% Plan B*: 2.68% Plan C*: 2.68% Direct Plan: 1.93%##Current Financial year to date ratio to average AUM.
NAV as on April 29, 2016Growth Option 24.46Dividend Option 16.49Plan B* - Growth Option 24.59Plan B* - Dividend Option 24.88Plan C* - Growth Option 24.26Plan C* - Dividend Option 19.83
April
2016
Name of Instrument Industry % to Net Assets
TOP TWENTY EQUITY HOLDINGS
Dividend is declared on the face value of `10/- per unit. Dividend is paid subject to availability of distributable surplus. After payment of dividend the NAV of the Dividend Option of the Scheme falls to the extent of the dividend pay out and statutory levy if any. Past Performance may or may not be sustained in the future.
DIVIDEND HISTORY
Record Date Plan/ Option NAV on Record Amount of Name Date (`) Dividend (`)09/03/2015 Dividend option 18.80 1.00 per unit08/08/2014 Dividend option 15.71 0.50 per unit06/12/2013 Dividend option 13.27 0.50 per unit
LOW HIGH
Investors understand
that their principal will be at
moderately high risk
Riskometer
This product is suitable for investors who are seeking*:
• to create wealth in the long term• investment predominantly in equity and equity-
related securities including equity derivatives of the 100 largest companies by market capitalization, listed in India.
*Investors should consult their financial advisers if in doubt about whether the product is suitable for them.
Fund SizeIn Crores
AUM Average AUM
103.80 102.80For SIP returns, monthly investment of equal amounts invested on the 1st working day of every month. Past performance may or may not be sustained in future
SIP PERFORMANCE as on March 31, 2016If you had invested 10,000 every month
1 Year 3 Year 5 YearTotal Amount Invested 120,000.00 360,000.00 600,000.00 Total Value as on 114790.23 417452.66 823608.3331st March 2016 Returns -7.96% 9.86% 12.63% Total Value of Nifty 50 115374.11 389546.49 734998.24 Total Value of S&P BSE Sensex Returns 114624.46 383195.79 724800.11Nifty 50 Returns -7.07% 5.19% 8.05%S&P BSE Sensex Returns -8.21% 4.10% 7.49%
8
(An Open Ended Equity Scheme)
Infosys Limited Software 5.27HDFC Bank Limited Banks 4.75Tata Consultancy Services Limited Software 4.01Reliance Industries Limited Petroleum Products 3.28State Bank of India Banks 3.08IndusInd Bank Limited Banks 3.06Axis Bank Limited Banks 2.87Pidilite Industries Limited Chemicals 2.74Power Grid Corporation of India Limited Power 2.50Bajaj Finance Limited Finance 2.39GlaxoSmithKline Consumer Healthcare Limited Consumer Non Durables 2.25Cadila Healthcare Limited Pharmaceuticals 2.23Maruti Suzuki India Limited Auto 1.90HCL Technologies Limited Software 1.79Tata Motors Limited Auto 1.76Oracle Financial Services Software Limited Software 1.71Hindustan Unilever Limited Consumer Non Durables 1.70Kotak Mahindra Bank Limited Banks 1.65Yes Bank Limited Banks 1.62Cholamandalam Investment and Finance Company Limited Finance 1.59
0.72%
0.73%
0.73%
0.79%
1.08%
1.32%
1.32%
1.39%
1.40%
1.55%
2.74%
4.11%
4.11%
5.18%
8.27%
9.21%
14.01%
14.95%
18.26%
Consumer Durables
Telecom - Services
Construction Project
Cement
Textile Products
Construction
Telecom - Equipment & Accessories
Transportation
Gas
Auto Ancillaries
Chemicals
Petroleum Products
Auto
Power
Pharmaceuticals
Finance
Consumer Non Durables
Software
Banks
Mutual Fund investments are subject to market risks, read all scheme related documents carefully.
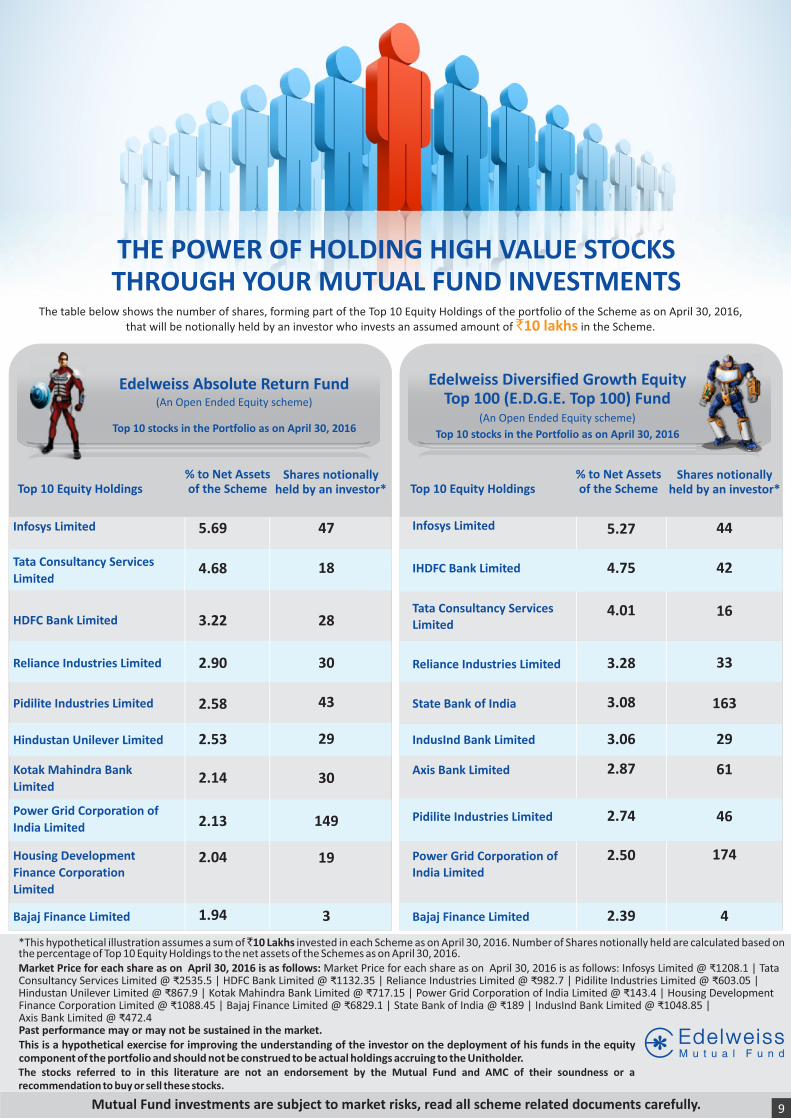
THE POWER OF HOLDING HIGH VALUE STOCKS THROUGH YOUR MUTUAL FUND INVESTMENTS
The table below shows the number of shares, forming part of the Top 10 Equity Holdings of the portfolio of the Scheme as on April 30, 2016, that will be notionally held by an investor who invests an assumed amount of in the Scheme.`10 lakhs
9
Top 10 Equity Holdings Top 10 Equity Holdings% to Net Assetsof the Scheme
Shares notionallyheld by an investor*
Shares notionallyheld by an investor*
Edelweiss Absolute Return Fund
Top 10 stocks in the Portfolio as on April 30, 2016
(An Open Ended Equity scheme)
% to Net Assetsof the Scheme
47
18
28
30
43
29
30
149
19
3
Edelweiss Diversified Growth Equity Top 100 (E.D.G.E. Top 100) Fund
(An Open Ended Equity scheme)
Top 10 stocks in the Portfolio as on April 30, 2016
44
42
16
33
163
29
61
46
174
4
5.27
4.75
4.01
3.28
3.08
3.06
2.87
2.74
2.50
2.39
Infosys Limited
Tata Consultancy Services
Limited
HDFC Bank Limited
Reliance Industries Limited
Pidilite Industries Limited
Hindustan Unilever Limited
Kotak Mahindra Bank
Limited
Power Grid Corporation of
India Limited
Housing Development
Finance Corporation
Limited
Bajaj Finance Limited
5.69
4.68
3.22
2.90
2.58
2.53
2.14
2.13
2.04
1.94
Infosys Limited
IHDFC Bank Limited
Tata Consultancy Services Limited
Reliance Industries Limited
State Bank of India
IndusInd Bank Limited
Axis Bank Limited
Pidilite Industries Limited
Power Grid Corporation of India Limited
Bajaj Finance Limited
*This hypothetical illustration assumes a sum of 10 Lakhs invested in each Scheme as on April 30, 2016. Number of Shares notionally held are calculated based on the percentage of Top 10 Equity Holdings to the net assets of the Schemes as on April 30, 2016.Market Price for each share as on April 30, 2016 is as follows: Market Price for each share as on April 30, 2016 is as follows: Infosys Limited @ ₹1208.1 | Tata Consultancy Services Limited @ ₹2535.5 | HDFC Bank Limited @ ₹1132.35 | Reliance Industries Limited @ ₹982.7 | Pidilite Industries Limited @ ₹603.05 | Hindustan Unilever Limited @ ₹867.9 | Kotak Mahindra Bank Limited @ ₹717.15 | Power Grid Corporation of India Limited @ ₹143.4 | Housing Development Finance Corporation Limited @ ₹1088.45 | Bajaj Finance Limited @ ₹6829.1 | State Bank of India @ ₹189 | IndusInd Bank Limited @ ₹1048.85 | Axis Bank Limited @ ₹472.4Past performance may or may not be sustained in the market.This is a hypothetical exercise for improving the understanding of the investor on the deployment of his funds in the equity component of the portfolio and should not be construed to be actual holdings accruing to the Unitholder.The stocks referred to in this literature are not an endorsement by the Mutual Fund and AMC of their soundness or a recommendation to buy or sell these stocks.
Limited

EDELWEISS ELSS FUND
ELSS FundEquity Fund
FACTSHEET
(An Open Ended Equity Linked Savings Scheme)
FUND PERFORMANCE AS ON March 31, 2016
#Based on standard investment of 10,000 made at the beginning of the relevant period. ^Absolute ReturnsPast performance may or may not be sustained in future and should not be used as a basis for comparison with other investments.Since Inception returns are calculated on 10/- invested at inception of the schemeReturns shown above are for Growth Option only.
Performance of the Dividend Option for the investor would be net of the dividend distribution tax, as applicable.
$Standard Benchmark prescribed by SEBI vide circular dated August 22, 2011.In case start /end date of the relevant period is a non-Business Day, the NAV of the previous Business Day is considered for computation of returns.Note: For the performance of other Schemes managed by the Fund Managers, please refer to the relevant scheme.
For Performance of Direct Plan, please refer page no. 23
Period
Edelweiss ELSS FundScheme Benchmark
(Nifty 500)
$Alternate Benchmark(Nifty 50)
Risk Measurement -Standard Deviation
Returns# Value (INR) Returns # Value (INR) Returns # Value (INR)
Edelweiss ELSS Fund
Nifty 500
Nifty 50
March 31, 2015 - March 31, 2016^ -6.40% 9,360 -7.54% 9,246 -8.86% 9,114 16.75% 17.38% 17.17%
March 31, 2014 - March 31, 2015^ 47.25% 14,725 33.56% 13,356 26.65% 12,665 13.35% 14.13% 13.74%
March 28, 2013 - March 31, 2014^ 20.03% 12,003 17.72% 11,772 17.98% 11,798 14.99% 16.91% 18.15%
Since Inception (CAGR) - Existing Plan 18.27% 33,780 15.25% 27,999 14.06% 25,972 16.95% 19.44% 20.26%
INDUSTRY ALLOCATION- % of Equity Holdings
Name of Instrument Industry % to Net Assets
TOP TWENTY EQUITY HOLDINGS
April
2016
Dividend is declared on the face value of `10/- per unit. Dividend is paid subject to availability of distributable surplus. After payment of dividend the NAV of the Dividend Option of the Scheme falls to the extent of the dividend pay out and statutory levy if any. Past Performance may or may not be sustained in the future.
DIVIDEND HISTORYRecord Date Plan/ Option NAV on Record Amount of Name Date (`) Dividend (`)31/03/2016 Dividend Option 14.02 0.50 per unit27/01/2016 Dividend Option 15.43 1.00 per unit28/12/2015 Dividend Option 17.01 0.50 per unit
The primary objective of the scheme is to generate long-term capital appreciation with an option of periodic payouts at the end of lock in periods from a portfolio that invests predominantly in equity and equity related instruments. However, there is no assurance that the investment objective of the Scheme will be realized and the Scheme does not assure or guarantee any returns.
INVESTMENT OBJECTIVE Date of Allotment: December 30, 2008
Date of Inception (Direct Plan) :January 21, 2013
Minimum Investment Amount : `500/- per application & in multiples of 500/- thereafter
Entry Load: NIL
Exit Load: NIL
Fund ManagerFund Manager: Mr. Kartik SoralExperience: 9 years Managing the Scheme since: August 03, 2015Assistant Fund Manager: Mr. Bhavesh Jain Experience: 8 years Managing the Scheme since: - August 07, 2013
Ratios as on April 30, 2016Standard deviation 15.13%Sharpe ratio** 0.67Portfolio beta 0.91R squared 0.86Portfolio Turnover Ratio^ 2.5221 times** Risk Free Rate considered for the above = 8.110% p.a. Financial Benchmarks India Interbank 3 Month RatePlease note: Standard deviation and Sharpe ratio are annualized. ^ Lower of sales or purchase divided by average AUM for last rolling 12 months. Ratio as on March 31, 2016
Plan: The Scheme also offers Direct Plan
Options: Growth, Dividend
Benchmark: Nifty 500##Total Expense Ratios :
Existing Plan:2.68%Direct Plan: 1.93%##Current Financial year to date ratio to average AUM.
NAV as on April 29, 2016Growth Option 35.35Dividend Option 17.06
LOW HIGH
Investors understand
that their principal will be at
moderately high risk
Riskometer
This product is suitable for investors who are seeking*:
• to create wealth in the long term• investment in equity and equity-related securities
that will be locked-in for the first three years.
*Investors should consult their financial advisers if in doubt about whether the product is suitable for them.
Fund SizeIn Crores
AUM Average AUM
61.69 61.23
For SIP returns, monthly investment of equal amounts invested on the 1st working day of every month. Past performance may or may not be sustained in future
SIP PERFORMANCE as on March 31, 2016If you had invested 10,000 every month
1 Year 3 Year 5 YearTotal Amount Invested 120,000.00 360,000.00 600,000.00 Total Value as on 114143.90 433097.99 857436.2331st March 2016 Returns -8.93% 12.39% 14.26% Total Value of Nifty 500 115322.06 406207.04 768407.05Total Value of Nifty 50 115374.11 389546.49 734998.24 Nifty 500 Returns -7.15% 8.01% 9.84%Nifty 50 Returns -7.07% 5.19% 8.05%
10
Infosys Limited Software 5.33
Tata Consultancy Services Limited Software2.98
Rural Electrification Corporation
Limited Finance 2.93
Piramal Enterprises Limited Pharmaceuticals 2.81
HCL Technologies Limited Software 2.57
Torrent Pharmaceuticals Limited Pharmaceuticals 2.48
Divi's Laboratories Limited Pharmaceuticals 2.46
Hexaware Technologies Limited Software 2.41
Maruti Suzuki India Limited Auto 2.30
Bharat Petroleum Corporation
Limited Petroleum Products 2.23
Alembic Pharmaceuticals Limited Pharmaceuticals 2.21
Petronet LNG Limited Gas 2.17
IRB Infrastructure Developers
Limited Construction 2.06
Tata Motors Limited Auto 1.98
Cholamandalam Investment and
Finance Company Limited Finance 1.97
Oracle Financial Services Software
Limited Software 1.93
HDFC Bank Limited Banks 1.92
Hindustan Unilever Limited Consumer Non Durables 1.91
Bajaj Finserv Limited Finance 1.90
Reliance Industries Limited Petroleum Products 1.90
0.72%
0.78%
0.80%
0.86%
1.01%
1.05%
1.06%
1.17%
1.64%
1.78%
1.97%
2.06%
2.16%
2.17%
3.75%
4.13%
4.28%
4.55%
6.03%
10.20%
13.17%
13.49%
19.51%
Hotels, Resorts And Other Recreational Activities
Chemicals
Retailing
Trading
Minerals/Mining
Consumer Durables
Textile Products
Auto Ancillaries
Media & Entertainment
Construction Project
Industrial Products
Construction
Cement
Gas
Transportation
Petroleum Products
Auto
Consumer Non Durables
Power
Banks
Pharmaceuticals
Finance
Software
Equity Fund
#Edelweiss Emerging Leaders Fund
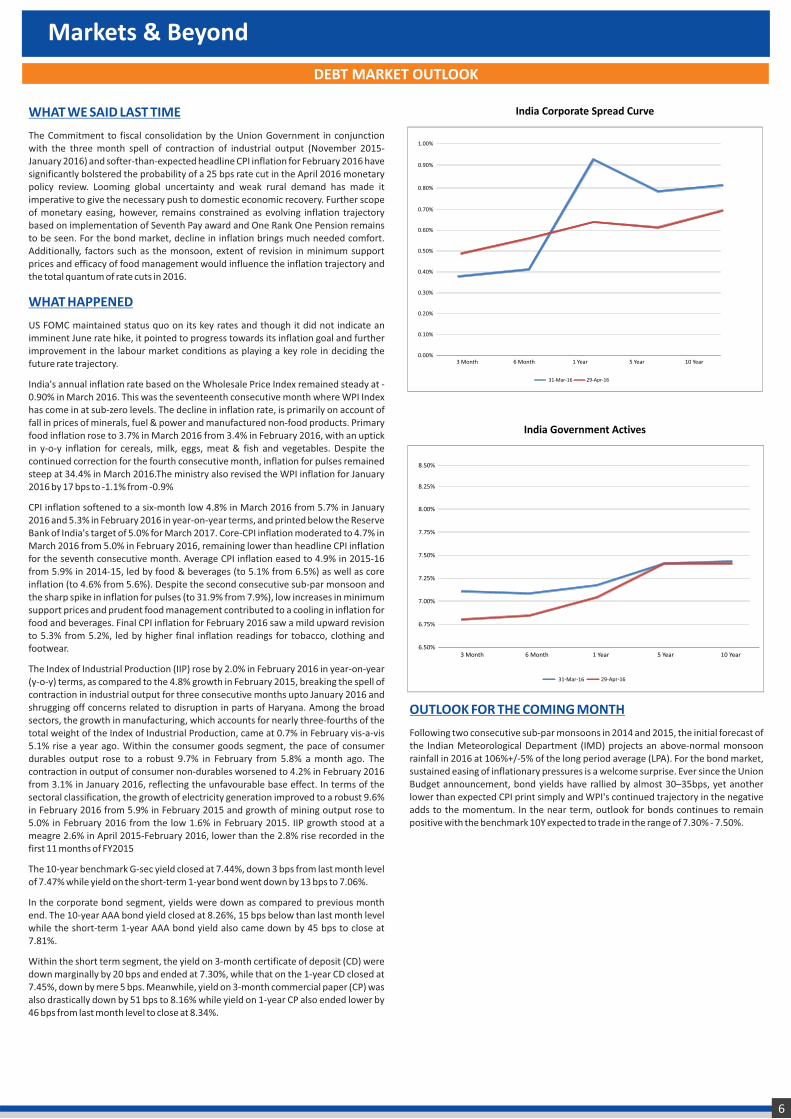
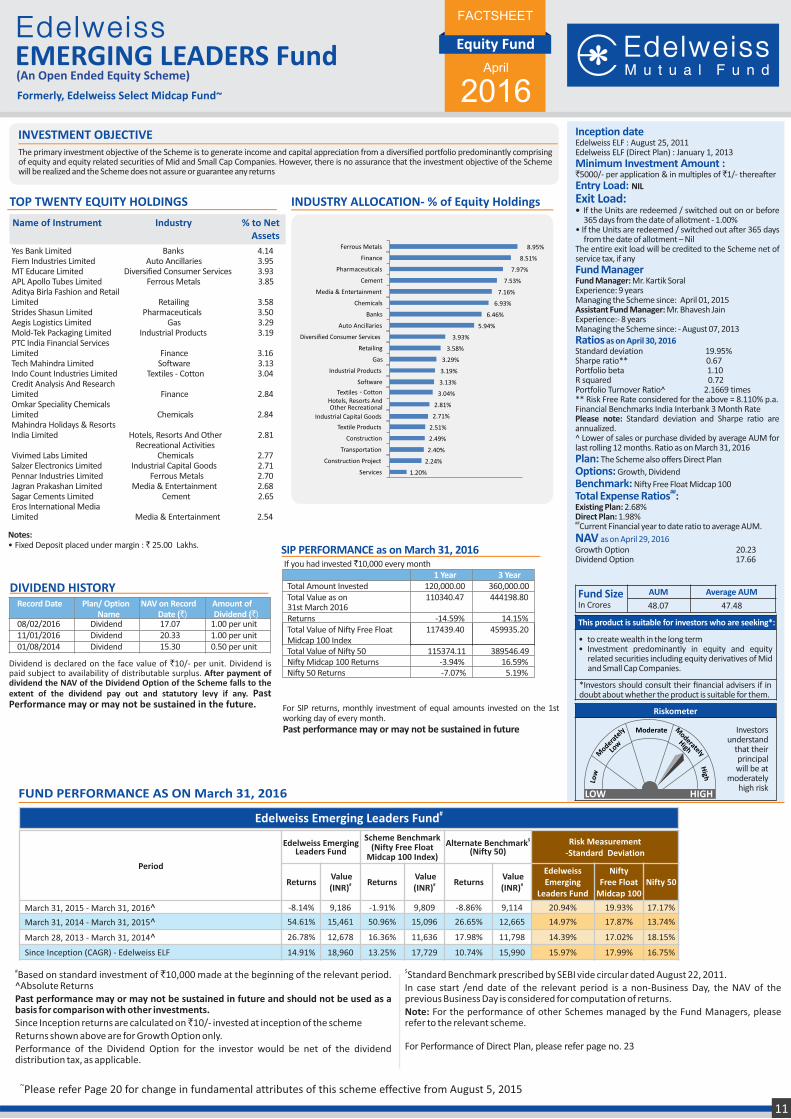
FUND PERFORMANCE AS ON March 31, 2016
#Based on standard investment of `10,000 made at the beginning of the relevant period. ^Absolute ReturnsPast performance may or may not be sustained in future and should not be used as a basis for comparison with other investments.Since Inception returns are calculated on 10/- invested at inception of the schemeReturns shown above are for Growth Option only.Performance of the Dividend Option for the investor would be net of the dividend distribution tax, as applicable.
$Standard Benchmark prescribed by SEBI vide circular dated August 22, 2011.In case start /end date of the relevant period is a non-Business Day, the NAV of the previous Business Day is considered for computation of returns.Note: For the performance of other Schemes managed by the Fund Managers, please refer to the relevant scheme.
For Performance of Direct Plan, please refer page no. 23
Period
Edelweiss Emerging Leaders Fund
Scheme Benchmark(Nifty Free Float
Midcap 100 Index)
$Alternate Benchmark(Nifty 50)
Risk Measurement-Standard Deviation
Returns Value
#(INR)Returns
Value #(INR)
Returns Value
#(INR)
Edelweiss Emerging
Leaders Fund
Nifty Free Float
Midcap 100 Nifty 50
March 31, 2015 - March 31, 2016^ -8.14% 9,186 -1.91% 9,809 -8.86% 9,114 20.94% 19.93% 17.17%
March 31, 2014 - March 31, 2015^ 54.61% 15,461 50.96% 15,096 26.65% 12,665 14.97% 17.87% 13.74%
March 28, 2013 - March 31, 2014^ 26.78% 12,678 16.36% 11,636 17.98% 11,798 14.39% 17.02% 18.15%
Since Inception (CAGR) - Edelweiss ELF 14.91% 18,960 13.25% 17,729 10.74% 15,990 15.97% 17.99% 16.75%
FACTSHEET
April
2016
Name of Instrument Industry % to Net Assets
Notes: • Fixed Deposit placed under margin : 25.00 Lakhs.
TOP TWENTY EQUITY HOLDINGS
(An Open Ended Equity Scheme)
~Please refer Page 20 for change in fundamental attributes of this scheme effective from August 5, 2015
EMERGING LEADERS FundFormerly, Edelweiss Select Midcap Fund~
Inception date Edelweiss ELF : August 25, 2011 Edelweiss ELF (Direct Plan) : January 1, 2013
Minimum Investment Amount : `5000/- per application & in multiples of 1/- thereafter
Entry Load: NIL
Exit Load: • If the Units are redeemed / switched out on or before
365 days from the date of allotment - 1.00%• If the Units are redeemed / switched out after 365 days
from the date of allotment – Nil The entire exit load will be credited to the Scheme net of service tax, if any
Fund ManagerFund Manager: Mr. Kartik SoralExperience: 9 years Managing the Scheme since: April 01, 2015Assistant Fund Manager: Mr. Bhavesh JainExperience:- 8 years Managing the Scheme since: - August 07, 2013
Ratios as on April 30, 2016Standard deviation 19.95%Sharpe ratio** 0.67Portfolio beta 1.10R squared 0.72Portfolio Turnover Ratio^ 2.1669 times** Risk Free Rate considered for the above = 8.110% p.a. Financial Benchmarks India Interbank 3 Month RatePlease note: Standard deviation and Sharpe ratio are annualized. ^ Lower of sales or purchase divided by average AUM for last rolling 12 months. Ratio as on March 31, 2016
Plan: The Scheme also offers Direct Plan
Options: Growth, Dividend
Benchmark: Nifty Free Float Midcap 100##Total Expense Ratios :
Existing Plan: 2.68%Direct Plan: 1.98%##Current Financial year to date ratio to average AUM.
NAV as on April 29, 2016Growth Option 20.23Dividend Option 17.66
LOW HIGH
Investors understand
that their principal will be at
moderately high risk
Riskometer
This product is suitable for investors who are seeking*:
• to create wealth in the long term• Investment predominantly in equity and equity
related securities including equity derivatives of Mid and Small Cap Companies.
*Investors should consult their financial advisers if in doubt about whether the product is suitable for them.
The primary investment objective of the Scheme is to generate income and capital appreciation from a diversified portfolio predominantly comprising of equity and equity related securities of Mid and Small Cap Companies. However, there is no assurance that the investment objective of the Scheme will be realized and the Scheme does not assure or guarantee any returns
INVESTMENT OBJECTIVE
INDUSTRY ALLOCATION- % of Equity Holdings
Fund SizeIn Crores
AUM Average AUM
48.07 47.48
Dividend is declared on the face value of `10/- per unit. Dividend is paid subject to availability of distributable surplus. After payment of dividend the NAV of the Dividend Option of the Scheme falls to the extent of the dividend pay out and statutory levy if any. Past Performance may or may not be sustained in the future.
DIVIDEND HISTORYRecord Date Plan/ Option NAV on Record Amount of Name Date (`) Dividend (`)08/02/2016 Dividend 17.07 1.00 per unit11/01/2016 Dividend 20.33 1.00 per unit01/08/2014 Dividend 15.30 0.50 per unit
SIP PERFORMANCE as on March 31, 2016If you had invested 10,000 every month 1 Year 3 Year Total Amount Invested 120,000.00 360,000.00 Total Value as on 110340.47 444198.80 31st March 2016 Returns -14.59% 14.15% Total Value of Nifty Free Float 117439.40 459935.20Midcap 100 IndexTotal Value of Nifty 50 115374.11 389546.49 Nifty Midcap 100 Returns -3.94% 16.59% Nifty 50 Returns -7.07% 5.19%
For SIP returns, monthly investment of equal amounts invested on the 1st working day of every month. Past performance may or may not be sustained in future
11
Yes Bank Limited Banks 4.14Fiem Industries Limited Auto Ancillaries 3.95MT Educare Limited Diversified Consumer Services 3.93APL Apollo Tubes Limited Ferrous Metals 3.85Aditya Birla Fashion and Retail Limited Retailing 3.58Strides Shasun Limited Pharmaceuticals 3.50Aegis Logistics Limited Gas 3.29Mold-Tek Packaging Limited Industrial Products 3.19PTC India Financial Services Limited Finance 3.16Tech Mahindra Limited Software 3.13Indo Count Industries Limited Textiles - Cotton 3.04Credit Analysis And Research Limited Finance 2.84Omkar Speciality Chemicals Limited Chemicals 2.84Mahindra Holidays & Resorts India Limited Hotels, Resorts And Other 2.81 Recreational Activities Vivimed Labs Limited Chemicals 2.77Salzer Electronics Limited Industrial Capital Goods 2.71Pennar Industries Limited Ferrous Metals 2.70Jagran Prakashan Limited Media & Entertainment 2.68Sagar Cements Limited Cement 2.65Eros International Media Limited Media & Entertainment 2.54
1.20%
2.24%
2.40%
2.49%
2.51%
2.71%
2.81%
3.04%
3.13%
3.19%
3.29%
3.58%
3.93%
5.94%
6.46%
6.93%
7.16%
7.53%
7.97%
8.51%
8.95%
Services
Construction Project
Transportation
Construction
Textile Products
Industrial Capital Goods
Hotels, Resorts And Other Recreational
Textiles - Cotton
Software
Industrial Products
Gas
Retailing
Diversified Consumer Services
Auto Ancillaries
Banks
Chemicals
Media & Entertainment
Cement
Pharmaceuticals
Finance
Ferrous Metals

% to Net Assetsof the Scheme
Shares notionallyheld by an investor*
Shares notionallyheld by an investor*
Edelweiss Emerging Leaders Fund
Edelweiss ELSS Fund
Top 10 stocks in the Portfolio as on April 30, 2016
(An Open Ended Equity Linked Savings Scheme) (An Open Ended Equity scheme)
Top 10 stocks in the Portfolio as on April 30, 2016
% to Net Assetsof the Scheme
The table below shows the number of shares, forming part of the Top 10 Equity Holdings of the portfolio of the Scheme as on 6, that April 30, 201
will be notionally held by an investor who invests an assumed amount of in each Scheme.`10 lakhs
THE POWER OF HOLDING HIGH VALUE STOCKS THROUGH YOUR MUTUAL FUND INVESTMENTS
Top 10 Equity Holdings Top 10 Equity Holdings
Mutual Fund investments are subject to market risks, read all scheme related documents carefully. 12
Infosys Limited
Tata Consultancy Services Limited
Rural Electrification Corporation Limited
Piramal Enterprises Limited
HCL Technologies Limited
Torrent Pharmaceuticals Limited
Divi's Laboratories Limited
Hexaware Technologies Limited
Maruti Suzuki India Limited
Bharat Petroleum Corporation Limited
Yes Bank Limited
Fiem Industries Limited
MT Educare Limited
APL Apollo Tubes Limited
Aditya Birla Fashion and Retail Limited
Strides Shasun Limited
Aegis Logistics Limited
Mold-Tek Packaging Limited
PTC India Financial Services Limited
Tech Mahindra Limited
5.33
2.98
2.93
2.81
2.57
2.48
2.46
2.41
2.30
2.23
4.14
3.95
3.93
3.85
3.58
3.50
3.29
3.19
3.16
3.13
44
12
164
24
34
17
23
100
6
23
44
48
232
49
243
32
286
215
811
64
*This hypothetical illustration assumes a sum of 10 Lakhs invested in each Scheme as on April 30, 2016. Number of Shares notionally held are calculated based on the percentage of Top 10 Equity Holdings to the net assets of the Schemes as on April 30, 2016.Market Price for each share as on April 30, 2016 is as follows: Infosys Limited @ ₹1208.1 | Tata Consultancy Services Limited @ ₹2535.5 | Rural Electrification Corporation Limited @ ₹178.4 | Piramal Enterprises Limited @ ₹1190.25 | HCL Technologies Limited @ ₹750.3 | Torrent Pharmaceuticals Limited @ ₹1430.25 | Divi's Laboratories Limited @ ₹1051.1 | Hexaware Technologies Limited @ ₹241.2 | Maruti Suzuki India Limited @ ₹3794.65 | Bharat Petroleum Corporation Limited @ ₹978 | Yes Bank Limited @ ₹942.95 | Fiem Industries Limited @ ₹817.3 | MT Educare Limited @ ₹169.3 | APL Apollo Tubes Limited @ ₹792.75 | Aditya Birla Fashion and Retail Limited @ ₹147.55 | Strides Shasun Limited @ ₹1081 | Aegis Logistics Limited @ ₹115.15 | Mold-Tek Packaging Limited @ ₹148.15 |
Past performance may or may not be sustained in the market.This is a hypothetical exercise for improving the understanding of the investor on the deployment of his funds in the equity component of the portfolio and should not be construed to be actual holdings accruing to the Unitholder.The stocks referred to in this literature are not an endorsement by the Mutual Fund and AMC of their soundness or a recommendation to buy or sell these stocks.
PTC India Financial Services Limited @ ₹38.95 | Tech Mahindra Limited @ ₹486.15

*Kindly refer addendum dated September 29, 2012 for discontinued Plan viz Plan B & addendum dated Oct 19, 2012 for standardizing the nomenclature for existing Plan / Options
PRUDENT ADVANTAGE FundEquity Fund
FACTSHEET
(An Open Ended Equity scheme)
#Based on standard investment of `10,000 made at the beginning of the relevant period. ^Absolute ReturnsPast performance may or may not be sustained in future and should not be used as a basis for comparison with other investments.Since Inception returns are calculated on `10/- invested at inception of the Scheme. Returns shown above are for Growth Option only.Performance of the Dividend Option for the investor would be net of the dividend distribution tax, as applicable.
$Standard Benchmark prescribed by SEBI vide circular dated August 22, 2011.In case start /end date of the relevant period is a non-Business Day, the NAV of the previous Business Day is considered for computation of returns. ^^Standard Deviation for Edelweiss Prudent Advantage - Existing Plan only
Note: For the performance of other Schemes managed by the Fund Managers, please refer to the relevant scheme.
TOP TWENTY EQUITY HOLDINGS
PeriodEdelweiss PAF Edelweiss PAF - Plan B* Scheme Benchmark
(Nifty 200 Index)
$Alternate Benchmark(Nifty 50)
Risk Measurement -Standard Deviation^^
Returns Value #(INR) Returns # Value (INR) Returns # Value (INR) Returns #Value (INR) PAF Nifty
200Nifty 50
March 31, 2015 - March 31, 2016^ -2.21% 9,779 -2.04% 9,796 -8.11% 9,189 -8.86% 9,114 14.66% 17.46% 17.17%March 31, 2014 - March 31, 2015^ 38.02% 13,802 37.92% 13,792 31.47% 13,147 26.65% 12,665 12.82% 14.10% 13.74%March 28, 2013 - March 31, 2014^ 16.76% 11,676 16.85% 11,685 17.57% 11,757 17.98% 11,798 15.37% 17.48% 18.15%Since Inception (CAGR) - Edelweiss PAF 10.18% 19,028 NA NA 8.65% 17,345 8.66% 17,360 15.42% 16.82% 17.17%
Since Inception (CAGR)– Edelweiss PAF – Plan B NA NA 9.68% 18,740 8.40% 17,301 8.24% 17,129 NA NA NA
~Name of “Edelweiss Value Opportunities Fund” was changed to “Edelweiss Prudent Advantage Fund” effective from October 14, 2015. Refer Notice cum Addendum dated October 9, 2015 for further details.~~Edelweiss Equity Enhancer Fund was launched on August 12, 2009. Subsequently, the fundamental attributes of the Scheme (including the Scheme name, the asset allocation and the benchmark index) were changed w.e.f. September 10, 2014. Refer Notice cum Addendum dated August 5, 2014 for further details
Formerly, Edelweiss Value Opportunities Fund~Formerly, Edelweiss Equity Enhancer Fund~~
PERFORMANCE OF EDELWEISS PRUDENT ADVANTAGE FUND (PAF)~ AS ON March 31, 2016
Name of Instrument Industry % to Net Assets
Notes: • Fixed Deposit placed under margin : 15.00 Lakhs.• Total Exposure to derivative instruments (excluding reversed positions) as
on 30/04/2016 : 67.63 Lakhs.• $$ - % of Net Holdings
Inception date Edelweiss PAF : August 12, 2009Edelweiss PAF (Plan B): June 16, 2009Edelweiss PAF (Direct Plan) : January 7, 2013
Minimum Investment Amount : `1000/- per application & in multiples of `1/- thereafter
Entry Load: NIL
Exit Load: NIL
Fund ManagerFund Manager: Mr. Bharat LahotiExperience: 9 years Managing the Scheme since: October 14, 2015Assistant Fund Manager: Mr. Kartik SoralExperience:- 9 years Managing the Scheme since: - August 3, 2015
Ratios as on April 30, 2016Standard deviation 13.68%Sharpe ratio** 0.60Portfolio beta 0.83R squared 0.87Portfolio Turnover Ratio^ 5.9587 times** Risk Free Rate considered for the above = 8.110% p.a. Financial Benchmarks India Interbank 3 Month RatePlease note: Standard deviation and Sharpe ratio are annualized. ^ Lower of sales or purchase divided by average AUM for last rolling 12 months. Ratio as on March 31, 2016
Plan: The Scheme also offers Direct Plan
Growth, DividendOptions: Benchmark: Nifty 200
##Total Expense Ratio : Existing Plan: 2.67% Plan B: 2.67% Direct Plan:2.27%##Current Financial year to date ratio to average AUM.
NAV as on April 29, 2016Growth Option 19.23Dividend Option 16.81Plan B* - Growth Option 18.98Plan B* - Dividend Option 19.35
The objective of the Scheme is to generate returns through a combination of dividend income and capital appreciation by investing primarily in a well-diversified portfolio of Value Stocks. Value Stocks are those stocks, which tend to trade at a lower price relative to their fundamentals (i.e. dividends, earnings, sales, etc.) and thus considered undervalued by investors. They have attractive valuations in relation to earnings or book value or current and/or future dividends. However, there is no assurance that the investment objective of the Scheme will be realized and the Scheme does not assure or guarantee any returns.
INVESTMENT OBJECTIVE
INDUSTRY ALLOCATION- % of Equity Holdings
Dividend is declared on the face value of `10/- per unit. Dividend is paid subject to availability of distributable surplus. After payment of dividend the NAV of the Dividend Option of the Scheme falls to the extent of the dividend pay out and statutory levy if any. Past Performance may or may not be sustained in the future.
DIVIDEND HISTORYFund SizeIn Crores
AUM Average AUM
7.73 7.42
LOW HIGH
Investors understand
that their principal will be at
moderately high risk
Riskometer
This product is suitable for investors who are seeking*:
• to create wealth in the long term• investment in equity and equity-related securities
including equity derivatives
*Investors should consult their financial advisers if in doubt about whether the product is suitable for them.
April
2016
For SIP returns, monthly investment of equal amounts invested on the 1st working day of every month. Past performance may or may not be sustained in future
SIP PERFORMANCE as on March 31, 2016If you had invested 10,000 every month
1 Year 3 Year 5 YearTotal Amount Invested 120,000.00 360,000.00 600,000.00 Total Value as on 118263.36 430570.20 801573.2131st March 2016 Returns -2.67% 11.99% 11.54% Total Value of Nifty 200 115214.25 400381.42 757196.28Total Value of Nifty 50 115374.11 389546.49 734998.24 Nifty 200 Returns -7.32% 7.03% 9.25%Nifty 50 Returns -7.07% 5.19% 8.05%
13
Record Date Plan/ Option NAV on Record Amount of Name Date (`) Dividend (`)26/04/2016 Dividend 17.20 0.20 per unit29/02/2016 Dividend 15.63 0.10 per unit18/01/2016 Dividend 16.28 0.10 per unit
$$
Tata Consultancy Services Limited Software 2.93Infosys Limited Software 2.82Reliance Industries Limited Petroleum Products 2.77Power Grid Corporation of IndiaLimited Power 2.20HDFC Bank Limited Banks 2.04Axis Bank Limited Banks 1.94Gruh Finance Limited Finance 1.89HCL Technologies Limited Software 1.62State Bank of India Banks 1.56GlaxoSmithKline Consumer Healthcare Limited Consumer Non Durables 1.46Hindustan Unilever Limited Consumer Non Durables 1.41Petronet LNG Limited Gas 1.38Yes Bank Limited Banks 1.36Reliance Power Limited Power 1.35Torrent Power Limited Power 1.35Britannia Industries Limited Consumer Non Durables 1.32Bajaj Finance Limited Finance 1.27Wipro Limited Software 1.22IRB Infrastructure Developers Limited Construction 1.22Pidilite Industries Limited Chemicals 1.20
For Performance of Direct Plan, please refer page no. 23
0.05%
0.22%
0.26%
0.29%
0.39%
0.43%
0.44%
0.53%
0.76%
0.94%
1.20%
1.28%
1.38%
1.88%
2.12%
3.51%
4.08%
4.57%
4.89%
7.85%
9.00%
10.74%
11.13%
Healthcare Services
Non - Ferrous Metals
Hotels, Resorts And Other Recreational Activities
Consumer Durables
Transportation
Telecom - Equipment & Accessories
Industrial Products
Minerals/Mining
Industrial Capital Goods
Textile Products
Chemicals
Cement
Gas
Auto Ancillaries
Construction
Auto
Petroleum Products
Pharmaceuticals
Power
Finance
Banks
Software
Consumer Non Durables

ARBITRAGE FundEquity Fund
FACTSHEET
(An Open Ended Equity scheme)
April
2016
EDELWEISS ARBITRAGE FUND ( Edelweiss ARB)
Period
Edelweiss ARB(Regular Plan)
Scheme Benchmark(Crisil Liquid Fund Index )
$Alternate Benchmark(Nifty 50)
Risk Measurement -Standard Deviation
Returns # Value (INR) Returns # Value (INR) ReturnsValue
#(INR)Edelweiss
ARBCrisil Liquid Nifty 50
March 31, 2015 - March 31, 2016 ^ 7.03% 10,703 8.06% 10,806 -8.86% 9,114 1.08% 0.34% 17.17%
March 31, 2014 - March 31, 2015 ^ NA NA NA NA NA NA NA NA NA
March 28, 2013 - March 31, 2014 ^ NA NA NA NA NA NA NA NA NA
Since Inception (CAGR) - Edelweiss ARB - Regular Plan 8.04% 11,459 8.41% 11,528 1.72% 10,306 1.09% 0.35% 15.79%
#Based on standard investment of 10,000 made at the beginning of the relevant period. ^Absolute ReturnsPast performance may or may not be sustained in future and should not be used as a basis for comparison with other investments.Since Inception returns are calculated on 10/- invested at inception of the schemeReturns shown above are for Growth Option only.Performance of the Dividend Option for the investor would be net of the dividend distribution tax, as applicable.
$Standard Benchmark prescribed by SEBI vide circular dated August 22, 2011.In case start /end date of the relevant period is a non-Business Day, the NAV of the previous Business Day is considered for computation of returns.Note: For the performance of other Schemes managed by the Fund Managers, please refer to the relevant scheme.
For Performance of Direct Plan, please refer page no. 23
FUND PERFORMANCE AS ON March 31, 2016
Name of Instrument Industry % to Net EQUITIES Assets
TOP TWENTY EQUITY HOLDINGS
Notes: • Fixed Deposit placed under margin : 17,785.00 Lakhs.
Date of Allotment: June 27, 2014
Minimum Investment Amount : `5000/- per application & in multiples of `1/- thereafter
Entry Load: Nil
Exit Load: - If the Units are redeemed/switched-out on or before 30 days from the date of allotment - 0.25%- If the Units are redeemed/switched-out after 30 days from the date of allotment - Nil
Fund ManagerFund Manager: Mr. Bhavesh JainExperience: 8 years Managing the Scheme since: June 27, 2014Co-Fund Manager: Mr. Kartik SoralExperience: 9 years Managing the Scheme since: August 3, 2015
Ratios as on April 30, 2016Portfolio Turnover Ratio^ 11.6808 times^ Lower of sales or purchase divided by average AUM for last rolling 12 months. Ratio as on March 31, 2016Please note: Since the Scheme has not completed 3 years Standard Deviation, Portfolio Beta and Sharpe Ratio is not provided
Plan: The Scheme also offers Direct Plan
Growth, DividendOptions: Benchmark: CRISIL Liquid Fund Index
##Total Expense Ratio : Regular Plan: 1.05%Direct Plan: 0.40%##Current Financial year to date ratio to average AUM.
NAV as on April 29, 2016Regular Plan - Growth Option 11.5070Regular Plan - Dividend Option 10.3127Regular Plan - Bonus Option 11.5070
This product is suitable for investors who are seeking*:
• To generate income by predominantly investing in arbitrage opportunities
• Investments predominantly in arbitrage opportunities in the cash and derivative segments of the equity markets and the arbitrage opportunities available within the derivative segment and by investing the balance in debt and money market instruments.
*Investors should consult their financial advisers if in doubt about whether the product is suitable for them.
LOW HIGH
Investors understand
that their principal will be at
moderately low risk
Riskometer
The investment objective of the Scheme is to generate income by predominantly investing in arbitrage opportunities in the cash and the derivative segments of the equity markets and the arbitrage opportunities available within the derivative segment and by investing the balance in debt and money market instruments. However, there is no assurance that the investment objective of the Scheme will be realized.
INVESTMENT OBJECTIVE
INDUSTRY ALLOCATION-% of Equity Holding
Dividend is declared on the face value of `10/- per unit. Dividend is paid subject to availability of distributable surplus. After payment of dividend the NAV of the Dividend Option of the Scheme falls to the extent of the dividend pay out and statutory levy if any. Past Performance may or may not be sustained in the future.
DIVIDEND HISTORY
Record Date Plan/ Option NAV on Record Amount of Name Date (`) Dividend (`)21/04/2016 Dividend Option 10.3711 0.06 per unit31/03/2016 Dividend Option 10.3802 0.08 per unit15/02/2016 Dividend Option 10.4218 0.10 per unit
Fund SizeIn Crores
AUM Average AUM
1315.73 1058.10
If you had invested 10,000 every month
For SIP returns, monthly investment of equal amounts invested on the 1st working day of every month. Past performance may or may not be sustained in future
SIP PERFORMANCE as on March 31, 2016
1 Year 3 Year 5 YearTotal Amount Invested 120,000.00 Total Value as on 124275.23 31st March 2016 Returns 6.68% Total Value of Crisil Liquid Index 125136.43 Total Value of Nifty 50 115374.11 Crisil Liquid Returns 8.04% Nifty 50 Returns -7.07%
14
(Quantity full hedged using Derivatives)
HDFC Bank Limited Banks 8.64Reliance Industries Limited Petroleum Products 7.98Infosys Limited Software 4.25Aurobindo Pharma Limited Pharmaceuticals 3.03Housing Development FinanceCorporation Limited Finance 3.01Adani Ports and Special Economic Zone Limited Transportation 2.56Rural Electrification Corporation Limited Finance 2.25ITC Limited Consumer Non Durables 1.80Reliance Capital Limited Finance 1.60Ashok Leyland Limited Auto 1.48Hindustan Petroleum Corporation Limited Petroleum Products 1.40Dish TV India Limited Media & Entertainment 1.35Indiabulls Housing Finance Limited Finance 1.33SKS Microfinance Limited Finance 1.28Reliance Power Limited Power 1.27The India Cements Limited Cement 1.23Coal India Limited Minerals/Mining 1.23Maruti Suzuki India Limited Auto 1.22Sun Pharmaceuticals Industries Limited Pharmaceuticals 1.21IDFC Limited Finance 1.19
0.09%
0.12%
0.12%
0.28%
0.64%
0.67%
1.05%
1.07%
1.23%
1.78%
1.79%
2.47%
2.77%3.02%
3.21%
4.44%
4.69%
5.96%
9.38%
11.32%
12.89%
Auto Ancillaries
Construction
Textile Products
Industrial Products
Ferrous Metals
Telecom - Services
Oil
Construction Project
Minerals/Mining
Non - Ferrous Metals
Media & Entertainment
Cement
Power
Transportation
Consumer Non Durables
Software
Auto
Pharmaceuticals
Petroleum Products
Banks
Finance

#Based on standard investment of `10,000 made at the beginning of the relevant period. ^Absolute ReturnsPast performance may or may not be sustained in future and should not be used as a basis for comparison with other investments.Since Inception returns are calculated on 10/- invested at inception of the schemeReturns shown above are for Growth Option only.Performance of the Dividend Option for the investor would be net of the dividend distribution tax, as applicable.
$Standard Benchmark prescribed by SEBI vide circular dated August 22, 2011.In case start /end date of the relevant period is a non-Business Day, the NAV of the previous Business Day is considered for computation of returns.Note: For the performance of other Schemes managed by the Fund Managers, please refer to the relevant scheme.
For Performance of Direct Plan, please refer page no. 24
EQUITY SAVINGS ADVANTAGE FundEquity Fund
FACTSHEET
(An Open Ended Equity Scheme)Formerly, Edelweiss Debt and Corporate Opportunities Fund~Formerly, Edelweiss Monthly Income Plan~~
Name of Instrument Industry % to Net Assets
Dividend is declared on the face value of `10/- per unit. Dividend is paid subject to availability of distributable surplus. After payment of dividend the NAV of the Dividend Option of the Scheme falls to the extent of the dividend pay out and statutory levy if any.
Past Performance may or may not be sustained in the future.
Record Date Plan/ Option NAV on Amount of Amount of Name Record Date Dividend - Retail Dividend - Corporate
(`) (`) (`)
30/04/2014 Dividend 10.2888 0.014946 per unit 0.014946 per unit
28/03/2014 Dividend 10.2645 0.069647 per unit 0.066703 per unit
28/02/2014 Dividend 10.1509 0.047130 per unit 0.045138 per unit
DIVIDEND HISTORY
~Edelweiss Debt and Corporate Opportunities Fund was launched on May 16, 2014. Subsequently, the fundamental attributes of the Scheme (including the Scheme name, the asset allocation and the benchmark index) were changed w.e.f. October 30, 2015. Refer to Notice cum Addendum dated September 24, 2015 for further details.~~Edelweiss Monthly Income Plan was launched on February 24, 2010. Subsequently, the fundamental attributes of the Scheme (including the Scheme name, the asset allocation and the benchmark index) were changed w.e.f. May 16, 2014. Refer to Notice cum Addendum dated April 11, 2014 for further details
PERFORMANCE OF EDELWEISS EQUITY SAVINGS ADVANTAGE FUND AS ON March 31, 2016
April
2016
Notes: • Fixed Deposit placed under margin : ` 32.00 Lakhs.• $$- % of Net Holdings
Inception date Edelweiss ESAF : February 24, 2010Edelweiss ESAF - Direct Plan: May 16, 2013Minimum Investment Amount : `5,000/- and in multiples of `1/- thereafter.Entry Load: NIL
Exit Load• If the Units are redeemed/switched-out on or
before 90 days from the date of allotment - 0.50%• If the Units are redeemed/switched-out after 90
days from the date of allotment - NilThe entire exit load will be credited to the scheme net of service tax, if any Fund Manager Fund Manager: Mr. Kartik Soral Experience: 9 years Managing the Scheme since: August 3, 2015Co- Fund Manager: Mr. Bhavesh JainExperience: 8 years Managing the Scheme since: December 1, 2015
Ratios as on April 30, 2016Standard deviation 3.89%Sharpe ratio** 0.33Portfolio beta 0.13R squared 0.26Portfolio Turnover Ratio^ 9.3919 times** Risk Free Rate considered for the above = 8.110% p.a. Financial Benchmarks India Interbank 3 Month RatePlease note: Standard deviation and Sharpe ratio are annualized. ^ Lower of sales or purchase divided by average AUM for last rolling 12 months. Ratio as on March 31, 2016.
Plan: The Scheme also offers Direct Plan
Options: Growth, Dividend
Benchmark: CRISIL Liquid Fund –75% + Nifty 50 – 25%##Total Expense Ratio :
Existing Plan: 1.40% Direct Plan: 1.10%##Current Financial year to date ratio to average AUM.NAV as on April 29, 2016Growth Option 16.26Dividend Option 11.80
LOW HIGH
Investors understand
that their principal will be at
moderately high risk
Riskometer
This product is suitable for investors who are seeking*:
• income and capital appreciation over long term• investment predominantly in arbitrage
opportunities in the cash and derivatives segment of the equity market and in un-hedged equity and the balance in debt and money market instruments.
*Investors should consult their financial advisers if in doubt about whether the product is suitable for them.
The investment objective of the scheme is to generate income by investing in low volatility absolute return strategies that take advantage of opportunities in the cash and the derivative segments of the equity markets including the arbitrage opportunities available within the derivative segment and by investing the balance in debt and money market instruments.
INVESTMENT OBJECTIVE
INDUSTRY ALLOCATION - % of Equity Holdings
Fund SizeIn Crores
AUM Average AUM
3.71 3.49
Please refer page 23 for change in fundamental attributes of this scheme effective from October 30, 2015
15
TOP TWENTY EQUITY HOLDINGS
For SIP returns, monthly investment of equal amounts invested on the 1st working day of every month. Past performance may or may not be sustained in future
SIP PERFORMANCE as on March 31, 2016If you had invested 10,000 every month
1 Year 3 Year 5 YearTotal Amount Invested 120,000.00 360,000.00 600,000.00 Total Value as on 123894.55 402331.05 747581.9431st March 2016 Returns 6.08% 7.36% 8.73% Total Value of 75% CRISIL LIQUID & 25% NIFTY 50 122749.26 405733.51 747642.81Total Value of Nifty 50 115374.11 389546.49 734998.24 75% CRISIL LIQUID & 25% NIFTY 50 Returns. 4.28% 7.93% 8.74%
Nifty 50 Returns -7.07% 5.19% 8.05%
Period
ESAFScheme Benchmark
(75% CRISIL LIQUID & 25% NIFTY 50)
$Alternate Benchmark(Nifty 50)
Risk Measurement-Standard Deviation
Returns # Value (INR) Returns # Value (INR) Returns # Value (INR) ESAF75% CRISIL
LIQUID & 25% NIFTY 50
Nifty 50
March 31, 2015 - March 31, 2016^ 5.71% 10,571 3.84% 10,384 -8.86% 9,114 1.89% 4.30% 17.17%
March 31, 2014 - March 31, 2015^ 9.48% 10,948 13.34% 11,334 26.65% 12,665 1.87% 3.46% 13.74%
March 28, 2013 - March 31, 2014^ 13.28% 11,328 11.93% 11,193 17.98% 11,798 6.12% 4.67% 18.15%
Since Inception (CAGR) - Edelweiss ESAF 8.22% 16,190 8.39% 16,346 7.93% 15,927 3.34% 4.25% 16.88%
$$
HDFC Bank Limited Banks 0.35Reliance Industries Limited Petroleum Products 0.59Tata Consultancy Services Limited Software 0.44IndusInd Bank Limited Banks 1.45Maruti Suzuki India Limited Auto 0.08Petronet LNG Limited Gas 0.95Axis Bank Limited Banks 0.93Power Grid Corporation of India Limited Power 0.91Pidilite Industries Limited Chemicals 0.89GlaxoSmithKline Pharmaceuticals Limited Pharmaceuticals 0.88Bajaj Finance Limited Finance 0.87Hindustan Unilever Limited Consumer Non Durables 0.69GlaxoSmithKline Consumer Healthcare Limited Consumer Non Durables 0.68Britannia Industries Limited Consumer Non Durables 0.49Marico Limited Consumer Non Durables 0.48Emami Limited Consumer Non Durables 0.48Bharat Petroleum CorporationLimited Petroleum Products 0.48Bajaj Finserv Limited Finance 0.48Kotak Mahindra Bank Limited Banks 0.46Cadila Healthcare Limited Pharmaceuticals 0.46
0.22%
0.44%
0.50%
0.89%
0.91%
0.95%
1.07%
1.33%
1.34%
2.24%
3.94%
4.09%
Consumer Durables
Telecom - Equipment & Accessories
Auto
Chemicals
Power
Gas
Petroleum Products
Software
Finance
Pharmaceuticals
Banks
Consumer Non Durables
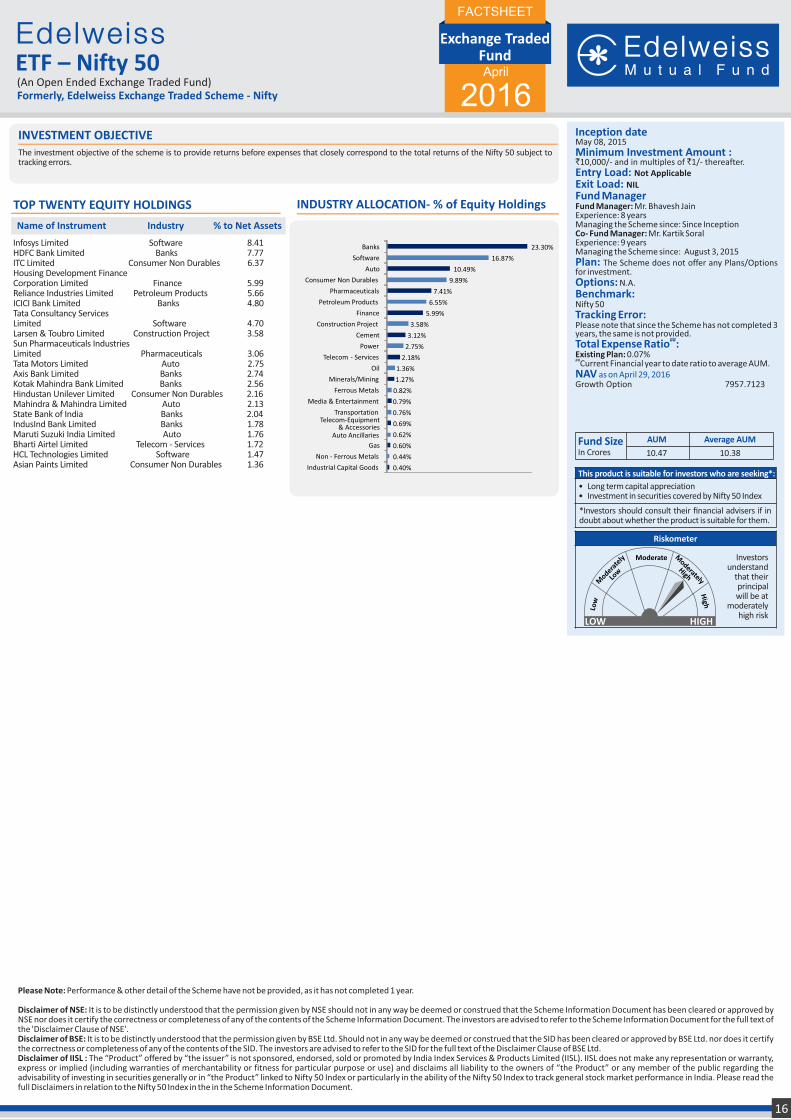
Exchange TradedFund
FACTSHEET
ETF – Nifty 50(An Open Ended Exchange Traded Fund)
April
2016Inception date May 08, 2015Minimum Investment Amount : `10,000/- and in multiples of `1/- thereafter.Entry Load: Not Applicable
Exit Load: NIL
Fund Manager Fund Manager: Mr. Bhavesh JainExperience: 8 years Managing the Scheme since: Since InceptionCo- Fund Manager: Mr. Kartik SoralExperience: 9 years Managing the Scheme since: August 3, 2015Plan: The Scheme does not offer any Plans/Options for investment.Options: N.A.
Benchmark: Nifty 50Tracking Error:Please note that since the Scheme has not completed 3 years, the same is not provided.
##Total Expense Ratio : Existing Plan: 0.07%##Current Financial year to date ratio to average AUM.NAV as on April 29, 2016Growth Option 7957.7123
LOW HIGH
Investors understand
that their principal will be at
moderately high risk
Riskometer
This product is suitable for investors who are seeking*:
• Long term capital appreciation• Investment in securities covered by Nifty 50 Index
*Investors should consult their financial advisers if in doubt about whether the product is suitable for them.
The investment objective of the scheme is to provide returns before expenses that closely correspond to the total returns of the Nifty 50 subject to tracking errors.
INVESTMENT OBJECTIVE
Fund SizeIn Crores
AUM Average AUM
10.47 10.38
Please Note: Performance & other detail of the Scheme have not be provided, as it has not completed 1 year.
Disclaimer of NSE: It is to be distinctly understood that the permission given by NSE should not in any way be deemed or construed that the Scheme Information Document has been cleared or approved by NSE nor does it certify the correctness or completeness of any of the contents of the Scheme Information Document. The investors are advised to refer to the Scheme Information Document for the full text of the 'Disclaimer Clause of NSE'. Disclaimer of BSE: It is to be distinctly understood that the permission given by BSE Ltd. Should not in any way be deemed or construed that the SID has been cleared or approved by BSE Ltd. nor does it certify the correctness or completeness of any of the contents of the SID. The investors are advised to refer to the SID for the full text of the Disclaimer Clause of BSE Ltd. Disclaimer of IISL : The “Product” offered by “the issuer” is not sponsored, endorsed, sold or promoted by India Index Services & Products Limited (IISL). IISL does not make any representation or warranty, express or implied (including warranties of merchantability or fitness for particular purpose or use) and disclaims all liability to the owners of “the Product” or any member of the public regarding the advisability of investing in securities generally or in “the Product” linked to Nifty 50 Index or particularly in the ability of the Nifty 50 Index to track general stock market performance in India. Please read the full Disclaimers in relation to the Nifty 50 Index in the in the Scheme Information Document.
16
Name of Instrument Industry % to Net Assets
INDUSTRY ALLOCATION- % of Equity HoldingsTOP TWENTY EQUITY HOLDINGS
Formerly, Edelweiss Exchange Traded Scheme - Nifty
Infosys Limited Software 8.41HDFC Bank Limited Banks 7.77ITC Limited Consumer Non Durables 6.37Housing Development FinanceCorporation Limited Finance 5.99Reliance Industries Limited Petroleum Products 5.66ICICI Bank Limited Banks 4.80Tata Consultancy Services Limited Software 4.70Larsen & Toubro Limited Construction Project 3.58Sun Pharmaceuticals IndustriesLimited Pharmaceuticals 3.06Tata Motors Limited Auto 2.75Axis Bank Limited Banks 2.74Kotak Mahindra Bank Limited Banks 2.56Hindustan Unilever Limited Consumer Non Durables 2.16Mahindra & Mahindra Limited Auto 2.13State Bank of India Banks 2.04IndusInd Bank Limited Banks 1.78Maruti Suzuki India Limited Auto 1.76Bharti Airtel Limited Telecom - Services 1.72HCL Technologies Limited Software 1.47Asian Paints Limited Consumer Non Durables 1.36 0.40%
0.44%
0.60%
0.62%
0.69%
0.76%
0.79%
0.82%
1.27%
1.36%
2.18%
2.75%
3.12%
3.58%
5.99%
6.55%
7.41%
9.89%
10.49%
16.87%
23.30%
Industrial Capital Goods
Non - Ferrous Metals
Gas
Auto Ancillaries
Telecom-Equipment & Accessories
Transportation
Media & Entertainment
Ferrous Metals
Minerals/Mining
Oil
Telecom - Services
Power
Cement
Construction Project
Finance
Petroleum Products
Pharmaceuticals
Consumer Non Durables
Auto
Software
Banks
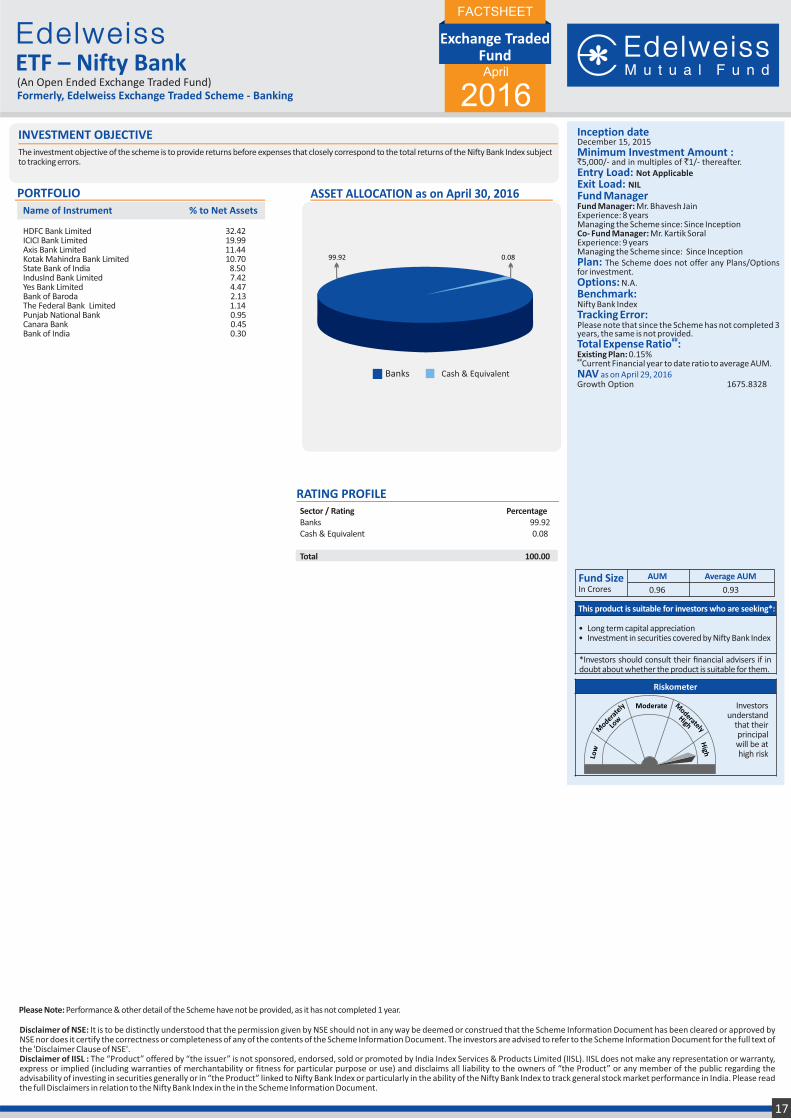
ASSET ALLOCATION as on April 30, 2016Name of Instrument % to Net Assets
PORTFOLIO
Investors understand
that their principal will be at high risk
Riskometer
This product is suitable for investors who are seeking*:
• Long term capital appreciation• Investment in securities covered by Nifty Bank Index
*Investors should consult their financial advisers if in doubt about whether the product is suitable for them.
RATING PROFILESector / Rating PercentageBanks 99.92Cash & Equivalent 0.08
Total 100.00
The investment objective of the scheme is to provide returns before expenses that closely correspond to the total returns of the Nifty Bank Index subject to tracking errors.
INVESTMENT OBJECTIVE
Fund SizeIn Crores
AUM Average AUM
0.96 0.93
17
ETF – Nifty Bank(An Open Ended Exchange Traded Fund)
Inception date December 15, 2015Minimum Investment Amount : `5,000/- and in multiples of `1/- thereafter.Entry Load: Not Applicable
Exit Load: NIL
Fund Manager Fund Manager: Mr. Bhavesh JainExperience: 8 years Managing the Scheme since: Since InceptionCo- Fund Manager: Mr. Kartik SoralExperience: 9 years Managing the Scheme since: Since InceptionPlan: The Scheme does not offer any Plans/Options for investment.Options: N.A.
Benchmark: Nifty Bank IndexTracking Error:Please note that since the Scheme has not completed 3 years, the same is not provided.
##Total Expense Ratio : Existing Plan: 0.15%##Current Financial year to date ratio to average AUM.NAV as on April 29, 2016Growth Option 1675.8328
Disclaimer of NSE: It is to be distinctly understood that the permission given by NSE should not in any way be deemed or construed that the Scheme Information Document has been cleared or approved by NSE nor does it certify the correctness or completeness of any of the contents of the Scheme Information Document. The investors are advised to refer to the Scheme Information Document for the full text of the 'Disclaimer Clause of NSE'. Disclaimer of IISL : The “Product” offered by “the issuer” is not sponsored, endorsed, sold or promoted by India Index Services & Products Limited (IISL). IISL does not make any representation or warranty, express or implied (including warranties of merchantability or fitness for particular purpose or use) and disclaims all liability to the owners of “the Product” or any member of the public regarding the advisability of investing in securities generally or in “the Product” linked to Nifty Bank Index or particularly in the ability of the Nifty Bank Index to track general stock market performance in India. Please read the full Disclaimers in relation to the Nifty Bank Index in the in the Scheme Information Document.
99.92 0.08
Banks
Please Note: Performance & other detail of the Scheme have not be provided, as it has not completed 1 year.
Cash & Equivalent
Formerly, Edelweiss Exchange Traded Scheme - Banking
HDFC Bank Limited 32.42ICICI Bank Limited 19.99Axis Bank Limited 11.44Kotak Mahindra Bank Limited 10.70State Bank of India 8.50IndusInd Bank Limited 7.42Yes Bank Limited 4.47Bank of Baroda 2.13The Federal Bank Limited 1.14Punjab National Bank 0.95Canara Bank 0.45Bank of India 0.30
Exchange TradedFund
FACTSHEET
April
2016

*Kindly refer addendum dated September 29, 2012 for discontinued Plan viz Retail and addendum dated Oct 19, 2012 for standardizing the nomenclature for existing Plan / Options
LIQUID FundLiquid Fund
FACTSHEET
(An Open Ended Liquid Scheme)
FUND PERFORMANCE AS ON March 31, 2016
*As there was no investor under these Plans during certain intervals returns for the specified Period / since inception is not provided. #Based on standard investment of 10,000 made at the beginning of the relevant period.
@^Absolute Returns. Annualized ReturnsPast performance may or may not be sustained in future and should not be used as a basis for comparison with other investments.Since Inception returns are calculated on `10/- invested at Inception/ date of the initial investment under the plans. Returns shown above are for Growth Option only.
Performance of the Dividend Option for the investor would be net of DDT, as applicable. $Standard Benchmark prescribed by SEBI vide circular dated August 22, 2011. In case start /end date of the relevant period is a non-Business Day, the NAV of the previous Business Day is considered for computation of returns.Note: For the performance of other Schemes managed by the Fund Managers, please refer to the relevant scheme.
Period
Edelweiss LF (Existing Plan)
Edelweiss LF(Retail Plan)*
Scheme Benchmark(Crisil Liquid Fund Index)
$Alternate Benchmark(Crisil 1 Year T bill)
Returns # Value (INR) Returns # Value (INR) Returns # Value (INR) Returns #Value (INR)
Last 7 days@ 7.80% 10,015 7.08% 10,014 14.45% 10,028 7.18% 10,014
Last 15 days@ 7.23% 10,030 6.51% 10,027 10.95% 10,045 6.91% 10,028
Last 30 days@ 6.96% 10,057 6.24% 10,051 9.82% 10,081 6.97% 10,057
March 31, 2015 - March 31, 2016^ 7.37% 10,737 6.53% 10,653 8.06% 10,806 7.69% 10,769
March 28, 2014 - March 31, 2015^ 8.17% 10,817 7.33% 10,733 9.06% 10,906 8.82% 10,882
March 28, 2013 - March 28, 2014^ 8.78% 10,878 7.80% 10,780 9.46% 10,946 5.77% 10,577
Since Inception (CAGR) Edelweiss LF 8.54% 14,625 NA NA 8.69% 14,718 7.58% 14,032
Since Inception (CAGR) Edelweiss LF - Retail Plan NA NA 6.81% 16,459 7.70% 17,529 6.66% 16,284
EDELWEISS LIQUID FUND (Edelweiss LF)
Name of Instrument % to Net Assets
PORTFOLIO
**Thinly traded/Non traded securities as defined in SEBI Regulations and Guidelines.
RATING PROFILE
April
2016
Money Market Instruments
Bonds & NCDs
ASSET ALLOCATION as on April 30, 2016
Cash & Cash EquivalantsMONEY MARKET INSTRUMENTS 14.09Certificate of Deposit CRISIL A1+Axis Bank Limited** 7.28State Bank of Patiala** 6.80
Commercial Paper CARE A1+ Steel Authority of India Limited 6.87
BONDS & NCDsListed / awaiting listing on the stock exchangesCRISIL AAAKotak Mahindra Prime Limited** 6.79
OTHERS CBLO / Reverse Repo Investments 71.43
Cash & Cash EquivalentsNet Receivable/Payable 0.82
GRAND TOTAL 100.00
Sector / Rating PercentageCRISIL A1+ 14.09CARE A1+ 6.87 CRISIL AAA 6.79Cash & Equivalent 72.26
Total 100.00
Date of AllotmentExisting Plan: August 12, 2011Retail Plan: September 9, 2008
Date of Inception (Direct Plan) :January 10, 2013
Minimum Investment Amount : `10,000/- & in multiples of `1/- thereafter.
Entry Load: NIL
Entry Load: NIL
Fund ManagerFund Manager: Mr. Bhavesh jainExperience: 8 years Managing the Scheme since: January 4, 2014Assistant Fund Manager: Mr. Swayam MangwaniExperience: 5 years Managing the Scheme since: December 1, 2015 Plan: The Scheme also offers Direct Plan
Growth, DividendOptions: Benchmark: CRISIL Liquid Fund Index
Modified Duration: 0.03 Years
Average Maturity: 0.03 Years
Portfolio Yield - YTM (In % age): 6.02%##Total Expense Ratio :
Existing Plan: 0.25% Retail Plan*: 0.97%Direct Plan: 0.14%##Current Financial year to date ratio to average AUM.
NAV as on April 29, 2016Growth Option 1470.7708Daily Dividend Option 1000.0000Weekly Dividend Option 1001.1337Fortnightly Dividend Option^ - Monthly Dividend Option 1005.4264Retail Plan* Growth Option 1653.8719Daily Dividend Option 1000.0000Weekly Dividend Option 1001.0161Fortnightly Dividend Option^ -Monthly Dividend Option 1004.8204
LOW HIGH
Investors understand
that their principal will be at
low risk
Riskometer
This product is suitable for investors who are seeking*:
• regular fixed income for short term• investment in Money Market Instruments and Debt
instruments
*Investors should consult their financial advisers if in doubt about whether the product is suitable for them.
The objective of the Scheme is to provide optimal returns, commensurate with low risk and high degree of liquidity, through a portfolio constituted of money market & short term debt instruments. However, there is no assurance that the investment objective of the Scheme will be realized and the Scheme does not assure or guarantee any returns.
INVESTMENT OBJECTIVE
Fund SizeIn Crores
AUM Average AUM
21.83 19.65
18
20.966.79
72.26
Dividend is declared on the Face Value of `1000/- per unit. Dividend is paid subject to availability of distributable surplus. After payment of dividend the NAV of the Dividend Option of the Scheme falls to the extent of the dividend pay out and statutory levy if any.
Past Performance may or may not be sustained in the future.
DIVIDEND HISTORY Record Date Plan/ Option Name NAV on Amount of Amount of Record Date Dividend - Retail Dividend - Corporate
29/04/2016 Dividend (Monthly) 1005.4264 3.996123 per unit 3.702333 per unit
31/03/2016 Dividend (Monthly) 1005.7666 4.187667 per unit 3.879795 per unit
29/02/2016 Dividend (Monthly) 1005.5936 4.138332 per unit 3.834086 per unit
For Performance of Direct Plan, please refer page no. 24

*Kindly refer addendum dated September 29, 2012 for discontinued Plan viz Retail Plan addendum dated Oct 19, 2012 for standardizing the nomenclature for existing Plan / Options
BOND FundDebt Fund
FACTSHEET
(An Open Ended Debt Scheme)
#Based on standard investment of `10,000 made at the beginning of the relevant period. ^Absolute ReturnsPast performance may or may not be sustained in future and should not be used as a basis for comparison with other investments.Since Inception returns are calculated on 10/- invested at inception of the schemeReturns shown above are for Growth Option only.Performance of the Dividend Option for the investor would be net of the dividend distribution tax, as applicable.
$Standard Benchmark prescribed by SEBI vide circular dated August 22, 2011.In case start /end date of the relevant period is a non-Business Day, the NAV of the previous Business Day is considered for computation of returns.
Note: For the performance of other Schemes managed by the Fund Managers, please refer to the relevant scheme.
FUND PERFORMANCE AS ON March 31, 2016
Period
Edelweiss BF(Existing Plan)
Edelweiss BF (Retail Plan*)
Scheme Benchmark(CRISIL Composite Bond
Fund Index)
Alternate Benchmark$
(Crisil 10 year Gilt Index)
Returns# Value (INR) Returns # Value (INR) Returns
# Value (INR) Returns #Value (INR)
March 31, 2015 - March 31, 2016^ 7.82% 10,782 7.82% 10,782 8.24% 10,824 7.97% 10,797
March 28, 2014 - March 31, 2015^ 9.54% 10,954 8.52% 10,852 14.67% 11,467 14.63% 11,463
March 28, 2013 - March 28, 2014^ 8.26% 10,826 7.41% 10,741 4.32% 10,432 -1.01% 9,899
Since Inception (CAGR) Edelweiss BF 8.07% 17,984 7.59% 17,384 8.21% 18,160 7.06% 16,753
EDELWEISS BOND FUND (Edelweiss BF)
Name of Instrument % to Net Assets
PORTFOLIO ASSET ALLOCATION as on April 30, 2016
Dividend is declared on the face value of `1000/- per unit. Dividend is paid subject to availability of distributable surplus. After payment of dividend the NAV of the Dividend Option of the Scheme falls to the extent of the dividend pay out and statutory levy if any. Past Performance may or may not be sustained in the future.
Bonds & NCD’sMoney Market Instruments
Central Government Securities
Cash & Equivalent
April
2016
Date of AllotmentSeptember 9, 2008Date of Inception (Direct Plan) :January 3, 2013Minimum Investment Amount : `5,000/- and in multiples of `1/- thereafter.Entry Load: NIL
Exit Load: If the Units are redeemed/switched-out on or
before 60 days from the date of allotment - 0.25% If the Units are redeemed/switched-out after
60 days from the date of allotment - NilThe entire exit load shall be credited to the scheme net of service tax, if any.Fund ManagerFund Manager: Mr. Bhavesh JainExperience: 8 years Managing the Scheme since: January 4, 2014Assistant Fund Manager: Mr. Swayam MangwaniExperience: 5 years Managing the Scheme since: December 1, 2015Plan: The Scheme also offers Direct Plan
Growth, DividendOptions: Benchmark: CRISIL Composite Bond Fund Index
Modified Duration: 1.16 Years
Average Maturity: 1.39 Years
Portfolio Yield - YTM (In % age): 7.54%##Total Expense Ratio :
Existing Plan: 0.94% Retail Plan*: 0.94%Direct Plan: 0.55%##Current Financial year to date ratio to average AUM. NAV as on April 29, 2016Growth Option 1811.2282Daily Dividend Option 1002.0124Weekly Dividend Option 1005.2058Fortnightly Dividend Option 1001.8606 Monthly Dividend Option 1010.5509Retail Plan*Growth Option 1750.8398Daily Dividend Option 1002.0124 Weekly Dividend Option 1002.7653Fortnightly Dividend Option 1002.6169Monthly Dividend Option 1010.9689
Investors understand
that their principal will be at
moderate risk
Riskometer
• Regular income over medium to long term• Investment in Debt and Money Market Instruments
*Investors should consult their financial advisers if in doubt about whether the product is suitable for them.
RATING PROFILESector / Rating PercentageCRISIL AAA 48.27CRISIL A1+ 7.93ICRA AA+ 6.42CARE AA+ 6.40CRISIL AA+ 5.39SOV 3.30CARE A1+ 3.20CARE AAA 0.99ICRA AAA 0.65Cash & Equivalent 17.45Total 100.00
The objective of the Scheme is to provide reasonable returns, commensurate with moderate level of risk and high degree of liquidity, through a portfolio constituted of money market and debt instruments. However, there is no assurance that the investment objective of the scheme will be realized and the scheme does not assure or guarantee any returns.
INVESTMENT OBJECTIVE
Fund SizeIn Crores
AUM Average AUM
31.26 25.77
19
Formerly, Edelweiss Ultra Short Bond Fund
This product is suitable for investors who are seeking*:
68.12
17.453.30
11.13
For Performance of Direct Plan, please refer page no. 25
DIVIDEND HISTORY
Record Date Plan/ Option NAV on Amount of Amount of
Name Record Date Dividend -Retail Dividend - Corporate
29/04/2016 Dividend (Monthly) 1010.5509 6.596173 per unit 6.111230 per unit
31/03/2016 Dividend (Monthly) 1009.9759 4.776112 per unit 4.424977 per unit
29/02/2016 Dividend (Monthly) 1004.5054 3.535341 per unit 3.275427 per unit
(`) (`) (`)
MONEY MARKET INSTRUMENTS** 11.13Certificate of Deposit CRISIL A1+State Bank of Patiala 4.75Axis Bank Limited 3.18 Commercial Paper**CARE A1+ Steel Authority of India Limited 3.20 CENTRAL GOVERNMENT SECURITIES 3.30SOV08.27% CGL 2020 3.30
BONDS & NCDs** 61.72Listed / awaiting listing on the stock exchanges CRISIL AAAPower Finance Corporation Limited 9.62Rural Electrification Corporation Limited 15.42LIC Housing Finance Limited 3.28Power Grid Corporation of India Limited 8.07Indian Railway Finance Corporation Limited 3.37LIC Housing Finance Limited 2.28Housing Development Finance Corporation Limited 2.01National Bank For Agriculture & Rural Development 0.64Export Import Bank of India 0.33
CARE AA+L & T Finance Limited** 6.40
CARE AAAPNB Housing Finance Limited** 0.99
ICRA AA+Aditya Birla Finance Limited** 6.42
ICRA AAAIDFC Bank Limited** 0.65
CRISIL AA+Shriram Transport Finance Company Limited** 5.39
Unlisted on Stock ExchangeCRISIL AAATATA Sons Limited** 3.24
CBLO / Reverse Repo Investments 14.48Cash & Cash Equivalents Net Receivable/Payable 2.97 Grand Total 100.00
LOW HIGH**Thinly traded/Non traded securities as defined in SEBI Regulations and Guidelines.

FUND PERFORMANCE AS ON March 31, 2016
Period
Edelweiss ARF -(Direct Plan)
Scheme Benchmark(Crisil MIP Blended)
Alternate Benchmark(Nifty 50)
Returns Value (INR) Returns Value (INR) Returns Value (INR)
March 31, 2015 - March 31, 2016 ^ -2.43% 9,757 5.67% 10,567 -8.86% 9,114
March 31, 2014 - March 31, 2015 ^ 36.16% 13,616 16.45% 11,645 26.65% 12,665
March 28, 2013 - March 31, 2014 ^ 10.31% 11,031 6.52% 10,652 17.98% 11,798
Since Inception (CAGR) - Edelweiss ARF - Direct Plan 12.28% 14,471 8.78% 13,080 7.84% 12,723
Edelweiss ABSOLUTE RETURN Fund
Edelweiss DIVERSIFIED GROWTH EQUITY TOP 100 Fund
Edelweiss ELSS Fund
NAV as on April 29, 2016
Direct Plan - Growth Option 18.59
Direct Plan - Dividend Option 13.83
NAV as on April 29, 2016
NAV as on April 29, 2016
Direct Plan - Growth Option 24.89
Direct Plan - Dividend Option 18.23
Direct Plan - Growth Option 34.40
Direct Plan - Dividend Option 14.14
FUND PERFORMANCE AS ON MAR 31, 2016
Period
E.D.G.E Top 100 Fund (Direct Plan)
Scheme Benchmark(Nifty 50)
Alternate Benchmark(S&P BSE SENSEX)
Returns Value (INR)
ReturnsValue (INR)
ReturnsValue (INR)
March 31, 2015 - March 31, 2016 ^ -7.12% 9,288 -8.86% 9,114 -9.36% 9,064
March 31, 2014 - March 31, 2015 ^ 44.92% 14,492 26.65% 12,665 24.89% 12,489
March 28, 2013 - March 31, 2014 ^ 17.43% 11,743 17.98% 11,798 18.85% 11,885
Since - Inception (CAGR) - E.D.G.E. Top 100 Fund - Direct Plan
13.22% 14,936 8.26% 12,922 8.12% 12,869
^Absolute ReturnsPast performance may or may not be sustained in future and should not be used as a basis for comparison with other investments.
^Absolute ReturnsPast performance may or may not be sustained in future and should not be used as a basis for comparison with other investments.
FUND PERFORMANCE AS ON MAR 31, 2016
Period
Edelweiss ELSS Fund(Direct Plan)
Scheme Benchmark (Nifty 500)
Alternate Benchmark(Nifty 50)
Returns Value (INR) Returns Value (INR) Returns Value (INR)
March 31, 2015 - March 31, 2016^ -5.86% 9,414 -7.54% 9,246 -8.86% 9,114
March 31, 2014 - March 31, 2015^ 47.87% 14,787 33.56% 13,356 26.65% 12,665
March 28, 2013 - March 31, 2014^ 20.50% 12,050 17.72% 11,772 17.98% 11,798
Since Inception (CAGR) - Direct Plan 15.67% 15,913 9.31% 13,287 7.84% 12,723
Scheme Performance-Direct Plan-Growth Option
April
2016
FACTSHEET
20
^Absolute ReturnsPast performance may or may not be sustained in future and should not be used as a basis for comparison with other investments.
Edelweiss EMERGING LEADERS Fund FUND PERFORMANCE AS ON MAR 31, 2016
Period
Edelweiss Emerging Leaders Fund (Direct Plan)
Scheme Benchmark(Nifty Free Float
Midcap 100 Index)
Alternate Benchmark(Nifty 50)
Returns Value (INR)
Returns Value (INR)
Returns Value (INR)
March 31, 2015 - March 31, 2016^ -7.40% 9,260 -1.91% 9,809 -8.86% 9,114
March 31, 2014 - March 31, 2015^ 55.26% 15,526 50.96% 15,096 26.65% 12,665
March 28, 2013 - March 31, 2014^ 27.23% 12,723 16.36% 11,636 17.98% 11,798
Since Inception (CAGR) - Edelweiss ELF - Direct Plan 16.54% 16,436 12.89% 14,824 8.43% 13,004
^Absolute ReturnsPast performance may or may not be sustained in future and should not be used as a basis for comparison with other investments.
NAV as on April 29, 2016
Direct Plan - Growth Option 19.89
Direct Plan - Dividend Option 16.56

Edelweiss PRUDENT ADVANTAGE Fund
Edelweiss ARBITRAGE Fund
NAV as on April 29, 2016
Direct Plan - Growth Option 19.46
Direct Plan - Dividend Option 17.06
NAV as on April 29, 2016
Direct Plan - Growth Option 11.5912
Direct Plan - Dividend Option 10.3487
Period
Edelweiss PAF (Direct Plan)
Scheme Benchmark(Nifty 200 Index)
Alternate Benchmark(Nifty 50)
Returns Value (INR) Returns Value (INR) Returns Value (INR)
March 31, 2015 - March 31, 2016^ -1.69% 9,831 -8.11% 9,189 -8.86% 9,114March 31, 2014 - March 31, 2015^ 38.51% 13,851 31.47% 13,147 26.65% 12,665March 28, 2013 - March 31, 2014^ 17.01% 11,701 17.57% 11,757 17.98% 11,798
Since Inception (CAGR)- Edelweiss PAF - Direct Plan 13.18% 14,918 8.86% 13,155 8.26% 12,922
^Absolute ReturnsPast performance may or may not be sustained in future and should not be used as a basis for comparison with other investments.
Period
Edelweiss ARB -(Direct Plan)
Scheme Benchmark(Crisil Liquid Fund Index)
Alternate Benchmark(Nifty 50)
Returns Value (INR)
Returns Value (INR)
ReturnsValue (INR)
March 31, 2015 - March 31, 2016 ^ 7.44% 10,744 8.06% 10,806 -8.86% 9,114
March 31, 2014 - March 31, 2015 ^ NA NA NA NA NA NA
March 28, 2013 - March 31, 2014 ^ NA NA NA NA NA NA
Since Inception (CAGR) - Edelweiss ARB - Direct Plan 8.45% 11,536 8.41% 11,528 1.72% 10,306
Absolute ReturnsPast performance may or may not be sustained in future and should not be used as a basis for comparison with other investments.
21
FUND PERFORMANCE AS ON March 31, 2016
FUND PERFORMANCE AS ON March 31, 2016
Edelweiss EQUITY SAVINGS ADVANTAGE Fund
Period
ESAF (Direct Plan)Scheme Benchmark
(75% CRISIL LIQUID & 25% NIFTY 50)
Alternate Benchmark(Nifty 50)
Returns Value (INR)
Returns Value (INR)
Returns Value (INR)
March 31, 2015 - March 31, 2016^ 6.10% 10,610 3.84% 10,384 -8.86% 9,114
March 31, 2014 - March 31, 2015^ 9.92% 10,992 13.34% 11,334 26.65% 12,665
March 28, 2013 - March 31, 2014^ NA NA 11.93% 11,193 17.98% 11,798
Since Inception (CAGR) - Edelweiss ESAF - Direct Plan 7.83% 12,422 8.93% 12,791 8.19% 12,542
NAV as on April 29, 2016
Direct Plan - Growth Option 16.44
Direct Plan - Dividend Option 11.82
^Absolute ReturnsPast performance may or may not be sustained in future and should not be used as a basis for comparison with other investments.
FUND PERFORMANCE AS ON March 31, 2016
Edelweiss LIQUID Fund
Period
Edelweiss LF (Direct Plan)
Scheme Benchmark(Crisil Liquid Fund Index)
Alternate Benchmark(Crisil 1 Year T bill)
Returns Value (INR) Returns Value (INR) Returns Value (INR)
Last 7 days@ 8.32% 10,016 14.45% 10,028 7.18% 10,014
Last 15 days@ 7.53% 10,031 10.95% 10,045 6.91% 10,028
Last 30 days@ 7.16% 10,059 9.82% 10,081 6.97% 10,057
March 31, 2015 - March 31, 2016^ 7.49% 10,749 8.06% 10,806 7.69% 10,769
March 28, 2014 - March 31, 2015^ 8.37% 10,837 9.06% 10,906 8.82% 10,882
March 28, 2013 - March 28, 2014^ 8.81% 10,881 9.46% 10,946 5.77% 10,577
Since Inception (CAGR) Edelweiss LF - Direct Plan 8.21% 12,895 8.79% 13,117 7.44% 12,601
NAV as on April 29, 2016
^Absolute ReturnsPast performance may or may not be sustained in future and should not be used as a basis for comparison with other investments.
Direct PlanGrowth Option 1475.8401Daily Dividend Option 1000.0000Monthly Dividend Option 1005.4274Weekly Dividend Option^ - Fortnightly Dividend Option^ - ^ There were no investors under this option
FUND PERFORMANCE AS ON March 31, 2016

22
Edelweiss BOND Fund
Period
Edelweiss BF(Direct Plan)
Scheme Benchmark(CRISIL Composite Bond
Fund Index)
Alternate Benchmark(Crisil 10 year Gilt
Index)
Returns Value (INR) Returns Value (INR) Returns Value (INR)
March 31, 2015 - March 31, 2016^ 7.91% 10,791 8.24% 10,824 7.97% 10,797
March 28, 2014 - March 31, 2015^ 9.55% 10,955 14.67% 11,467 14.63% 11,463
March 28, 2013 - March 28, 2014^ 8.31% 10,831 4.32% 10,432 -1.01% 9,899
Since Inception (CAGR) Edelweiss BF - Direct Plan 8.50% 13,025 8.82% 13,151 7.11% 12,492
^Absolute ReturnsPast performance may or may not be sustained in future and should not be used as a basis for comparison with other investments.
NAV as on April 29, 2016
Direct PlanGrowth Option 1814.4265 Daily Dividend Option 1002.0124 Weekly Dividend Option^ - Fortnightly Dividend Option^ -Monthly Dividend Option^ 1010.5957 ^ There were no investors under this option
FUND PERFORMANCE AS ON March 31, 2016

For risk factors, please refer last page
Debt Schemes
April 30, 2016
April 30, 2016
Equity Schemes
Direct Plan:Pursuant to SEBI Circular No. CIR/IMD/DF/21/2012 dated September 13, 2012, a separate plan for direct investments (i.e. investments not routed through Distributor) has been introduced under the Schemes with effect from January 1, 2013. The said ‘Direct Plan’ is only for investors who purchase /subscribe Units in a Scheme directly with the Fund and is not available for investors who route their investments through a Distributor. All Plans / Options / Facilities offered under the Schemes (other than discontinued plans/options) will also be available for subscription under the Direct Plan. For further details, Investors are requested to refer to addendum dated December 31, 2012.
Edelweiss Liquid Fund
`10,000/- & in multiples of 1/- thereafter.
`1,000/- and in multiples of 1/- thereafter.
Minimum Investment
Minimum Redemption Amount
Minimum Additional Investment Amount
Edelweiss Bond Fund
`5,000/- and in multiples of `1/- thereafter.
• Minimum of 1 unit or 1,000/- and in multiples of 1/- thereafter.
• For demat transactions, minimum redemption would be mandatorily 1 unit.
• In case of the investors / unit holders having available balance less than 1,000/- or less than 1 unit in their respective folio on the day of submission of valid redemption request, the minimum redemption amount would be the available balance.
Edelweiss Absolute Return Fund
Edelweiss Diversified Growth
Equity Top 100 (E.D.G.E. Top 100) Fund
Edelweiss ELSS Fund
Edelweiss Emerging LeadersFund*
Edelweiss Prudent
Advantage Fund
Edelweiss Arbitrage Fund
Edelweiss Equity Savings
Advantage Fund**
Minimum Investment
`1000/- per application & in multiples of `1/-
thereafter
`1000/- per application & in multiples of `1/- thereafter
`500/- per application & in
multiples of `500/- thereafter
`5000/- per application & in multiples of `1/-
thereafter
`1000/- per application & in multiples of `1/-
thereafter
`5000/- per application & in multiples of `1/-
thereafter
`5000/- per application & in multiples of `1/-
thereafter
Minimum Redemption Amount
• `1/- or any number of units. For demat transactions, minimum redemption would be mandatorily 50 units.
• For Edelweiss ELSS Fund, redemption of unit can be made only after 3 years of lock-in period from the date of allotment of the Units proposed to be redeemed.
Minimum Additional Investment Amount
`1,000/- and in multiples of `1/- thereafter.
`500/- per application & in
multiples of `500/-thereafter
`1,000/- and in multiples
of `1/- thereafter.
`1,000/- and in multiples of `1/-
thereafter.
`1,000/- and in multiples of `1/-
thereafter.
`500/- and in multiple of `1/-
thereafter
*Change in the fundamental attributes of the Scheme effective from August 5 , 2015:
Asset Class Allocation (% of Corpus) Risk Profile
Equity and equity related securities of Mid and Small Cap Companies # 80%- 100% High
Equity and equity related securities of other companies 0% - 20% Medium to High
Debt & Money Market Instruments 0% - 20% Low to Medium
For further details, investors are requested to refer to Notice cum addendum dated August 4, 2015.
Particulars Proposed features
Name of the Scheme Edelweiss Emerging Leaders Fund
Investment Objective The primary investment objective of the Scheme is to generate income and capital appreciation from a diversified portfolio predominantly comprising of equity and equity related securities of Mid and Small Cap Companies. However, there is no assurance that the investment objective of the Scheme will be realized and the Scheme does not assure or guarantee any returns.
Asset Allocation Pattern
Under normal circumstances, the anticipated asset allocation pattern of the Scheme would be as stated below:
#Mid and Small-cap Companies are companies which are not part of the top 100 companies in terms of market capitalization listed on the National Stock Exchange of India (NSE) and have market capitalization of at least Rs.100 crores at the time of investment.
The Scheme can also take derivative exposure up to 50% of the Net Assets of the Scheme.
Investment Strategy & Approach
The Scheme aims to generate income and capital appreciation from a diversified portfolio predominantly investing in equity and equity related securities of Mid and Small Cap Companies. Mid and Small Cap Companies are companies which are not part of the top 100 companies by market capitalization listed on NSE and have market capitalization of atleast Rs.100 crores at the time of investment. The Scheme will accordingly invest 80%-100% of the corpus in equity and equity related securities of Mid and Small Cap Companies and the balance in other companies and/or in debt and money market instruments.The Scheme may invest in equity derivatives instruments to the extent permitted and in accordance with the applicable Regulations.to protect the value of the portfolio and enhance Unit holders' interest.
Scheme Specific Risk Factors
Companies, which are not a part of the top 100 stocks by market capitalization, are generally illiquid in terms of trading volumes on stock exchanges. Investors should therefore assume that illiquidity risks are higher in this Scheme than in a normal diversified fund.
Risk Control Edelweiss Emerging Leaders Fund proposes to allocate assets primarily to equity and equity related instruments including derivatives of Mid and Small Cap Companies i.e. companies which are not part of the top 100 stocks by market capitalization and have market capitalization of at least Rs. 100 crores at the time of investment. The Scheme shall invest in the common stocks of companies that are selected for their growth potential and are available at a reasonable price.
Product Label This product is suitable for investors who are seeking*:
to create wealth in the long term.investment predominantly in equity and equity related securities including equity derivatives of Mid and Small Cap Companies.
LOW HIGH
retemoksiR
Investors understand that their principal will be at moderately high risk
23
*Investors should consult their financial advisers if in doubt about whether the product is suitable for them.

**Change in the fundamental attributes of the Scheme effective from October 30 , 2015:
For further details, investors are requested to refer to Notice cum addendum dated September 24, 2015.
Particulars Proposed features
Name of the Scheme Edelweiss Equity Savings Advantage Fund
Type of Scheme An Open ended Equity Scheme
Investment Objective The investment objective of the scheme is to generate income by investing in low volatility absolute return strategies that take advantage of opportunities in the cash and the derivative segments of the equity markets including the arbitrage opportunities available within the derivative segment and by investing the balance in debt and money market instruments. However, there is no assurance or guarantee that the investment objective of the Scheme will be achieved. The Scheme does not assure or guarantee any returns.
Asset Allocation Pattern
Under normal circumstances, the asset allocation pattern would be:
*Equity exposure would be completely hedged with corresponding equity derivatives. The exposure to derivatives shown in the above asset allocation tables is exposure taken against the underlying equity investments and should not be considered for calculating the total asset allocation and / or investment restrictions on the issuer. The idea is not to take additional asset allocation with the use of derivative. The margin money requirement for the purposes of derivative exposure may be held in the form of Term Deposit.**Unhedged equity exposure shall be limited to 35% of the portfolio value. Unhedged equity exposure means exposure to equity shares alone without a corresponding equity derivative exposure. Further, any exposure to Index derivatives (Index futures or Index options) shall not be considered as a hedge against the long equity exposure. The AMC reserves the right to change the above asset allocation pattern in the interest of the investors depending on the market conditions for a short term period. Such position will be closely monitored by the Fund Managers and necessary rebalancing will be done at suitable opportunity but not later than 30 days. In case the rebalancing is bnot done within the specified period, justification for the same shall be provided to the Investment Committee and the reason for the same shall be recorded in writing. The Investment Committee shall then decide on the course of action. When adequate arbitrage opportunities are not available in the equity markets or if the arbitrage returns are lower than alternative investment opportunities, the anticipated alternate asset allocation on defensive circumstances would be as stated below:
*Equity exposure would be completely hedged with corresponding equity derivatives. The exposure to derivatives shown in the above asset allocation tables is exposure taken against the underlying equity investments and should not be considered for calculating the total asset allocation and / or investment restrictions on the issuer. The idea is not to take additional asset allocation with the use of derivative. The margin money requirement for the purposes of derivative exposure may be held in the form of Term Deposit.**Unhedged equity exposure shall be limited to 35% of the portfolio value. Unhedged equity exposure means exposure to equity shares alone without a corresponding equity derivative exposure. Further, any exposure to Index derivatives (Index futures or Index options) shall not be considered as a hedge against the long equity exposure.The Scheme can take overall derivative exposure up to 90% of the net assets of the Scheme, by investing in equity and/or debt derivative instruments. The Scheme may engage in Stock Lending. Not more than 20% of the net assets of the scheme can generally be deployed in stock lending and not more than 5% of the net assets of the Scheme will be deployed in Stock Lending to any single counterparty.The Scheme will not invest in Foreign Securities and ADRs/GDRs issued by Indian or foreign companies.The allocation under defensive circumstances will be made keeping in view the interest of the Unit holders. Such position will be closely monitored by the Fund Managers and necessary rebalancing will be done at suitable opportunity but not later than 30 days. In case the rebalancing is not done within the specified period, justification for the same shall be provided to the Investment Committee and the reason for the same shall be recorded in writing. The Investment Committee shall then decide on the course of action.
Investment Strategy & Approach
The Scheme will seek to achieve its investment objective primarily by employing various strategies which seek to exploit arbitrage opportunities in cash and derivatives segments of the equity markets and at the same time attempting to enhance returns through long exposure in equity and equity related instruments. In case such opportunities are not available, depending on the market conditions, investments will be made in debt and money market instruments in accordance with the asset allocation pattern of the Scheme.
Where willthe Schemeinvest?
Investment in Equity securities: The Scheme will invest in Equity and Equity related instruments including convertible debentures, equity warrants, convertible preference shares, equity derivatives etc. in accordance with the asset allocation pattern of the Scheme.Derivatives: The sum total of derivative contracts outstanding shall not exceed 90% of the net assets of the Scheme. The Scheme may invest in Debt Derivative Instruments upto 35% of the Net Assets of the Scheme. Investment in Debt securities: The Scheme will invest in a diversified basket of debt & money market instruments.
Benchmark CRISIL Liquid Fund Index – 75%Nifty 50 Index – 25%Rationale for adoption of benchmark: CRISIL Liquid Fund Index seeks to track the performance of a debt portfolio that includes CBLO, Commercial Papers and Certificates of Deposit. The same is appropriate for benchmarking the returns generated by equity arbitrage opportunities as well, which constitute the significant portion of the portfolio of the Scheme. Also, Nifty 50 Index being a well diversified 50 stocks Index, is appropriate for benchmarking the average unhedged equity portion of the portfolio of the Scheme. Hence, a hybrid index comprising 75% weightage to CRISIL Liquid Fund Index and 25% to Nifty 50 Index has been chosen as the benchmark for the Scheme as the composition of the aforesaid hybrid index is such that it is most suited for comparing the performance of the Scheme.
Annual Scheme Recurring Expenses
The AMC has estimated that upto 3.00% of the daily net assets of the Scheme will be charged to the Scheme as expenses:
Asset Class Indicative Allocation (% of net assets) Risk Profile
Equity & Equity Related instruments including derivatives: 65 to 90 Medium to High
I. Of which cash future arbitrage (fully hedged)* 30 to 75 Low to Medium
ii. Of which unhedged long equity exposure** 15 to 35 High
Debt and Money market instruments 10 to 35 Low to medium
Asset Class Indicative Allocation (% of net assets) Risk Profile
Equity & Equity Related instruments including derivatives: 25 to 65 Medium to High
I. Of which cash future arbitrage (fully hedged)* 0 to 50 Low to Medium
ii. Of which unhedged long equity exposure** 15 to 35 High
Debt and Money market instruments 35 to 75 Low to medium
Expense Head % of Daily Net Assets
Maximum total expense ratio (TER) permissible under Regulation 52 (6) (c) (i) and (6) (a) as applicable Up to 2.50%
Additional expenses under regulation 52 (6A) (c) Upto 0.20%
Additional expenses for gross new inflows from specified cities Upto 0.30%
Additional Risk Factors Common risk factors affecting the Arbitrage Strategies are as under: The lack of arbitrage opportunities shall not provide an opportunity to the Fund Manager to exploit price differences in the capital markets. There can be no assurance or guarantee that the arbitrage opportunities may exist at all times in the capital market.In case of heavy redemptions before the Expiry Day (last Thursday of every month or any day specified by the exchange), the liquidity and/or NAV of the Scheme might be affected. In such cases, the Fund Manager may be required to unwind positions in derivative segments before the Expiry Day, which may result in a fall in NAV.The performance of the Scheme will depend on the ability of the Fund Manager to identify suitable opportunities in the cash and derivative market. No assurance can be given that Fund Manager will be able to locate investment opportunities or to correctly exploit price spread in the equity markets. There may be instances where the price spread between cash and derivative market is insufficient to meet the cost of carry. In such situations, the Fund Manager due to lack of opportunities in the derivative market, may not be able to outperform liquid/money market funds. In addition to this, there can be increase in number of transactions as the Fund Manager has to take simultaneous calls in cash and derivative market, which may lead to high portfolio turnover and consequently will lead to high transaction costs. Additional Scheme Specific Risk Factor: 1. During defensive circumstances, the equity allocation, as stated under the Asset Allocation table in this document, can fall even up to 25% in extreme situation. Further, it is also possible that, due to unfavorable market conditions the Fund Manager is unable to rebalance the position, due to which the defensive position continues for a prolonged period. Investors are thus requested to note that, during such period the nature of the Scheme may change from an equity oriented scheme to a debt oriented scheme and all the risk factors as applicable to a debt oriented mutual fund will be applicable to this Scheme. 2. Being an open-ended equity fund, the Scheme shall be subject to tax as applicable to an equity oriented mutual fund under the extant Income Tax laws. However, during defensive circumstances, the equity allocation under the Scheme may fall below the required threshold and can continue so for a prolonged period due to which the Scheme may be regarded as a debt oriented scheme as per extant Income Tax laws. In such situation, the Scheme may be subject to tax as applicable to a debt oriented fund in that particular financial year. In view of the forgoing and the individual nature of tax consequences, each Unit holder is advised to consult his / her own professional tax advisor.
Taxation Being an equity oriented scheme, the applicable tax rates as per the extant Income Tax laws for an equity oriented mutual fund shall be applicable. Potential Change in the Tax Structure of the Scheme: An equity oriented fund has been defined under the Income Tax Act as a scheme of a mutual fund where the investible funds are invested in equity shares of domestic companies to the extent of more than 65 per cent of the total assets of such fund. Given that the equity allocation under the Scheme during defensive circumstances may fall below such threshold and even upto 25% in extreme situation, it is possible that the equity allocation remains below 65% over a prolonged period. In such a case the Scheme may be regarded as a debt oriented fund as per extant Income Tax laws and may be subject to tax as a debt oriented fund in that particular financial year. In view of the forgoing and the individual nature of tax consequences, each Unit holder is advised to consult his / her own professional tax advisor. For further details on taxation please refer to the clause on taxation in the SAI.
Product Label This product is suitable for investors who are seeking*:
income and capital appreciation over long term. investment predominantly in arbitrage opportunities in the cash and derivatives segment of the equity market and in un-hedged equity and the balance in debt and money market instruments.
LOW HIGH
retemoksiR
Investors understand that their principal
will be at moderately
high risk
24
*Investors should consult their financial advisers if in doubt about whether the product is suitable for them.
HOW TO READ FACTSHEET
Fund Manager : An employee of the asset management company such as a mutual fund or life insurer, who manages investments of the
scheme. He is usually part of a larger team of fund managers and research analysts.
Application Amount for Fresh Subscription : This is the minimum investment amount for a new investor in a mutual fund scheme.
Minimum Additional Amount : This is the minimum investment amount for an existing investor in a mutual fund scheme.
Yield to Maturity : The Yield to Maturity or the YTM is the rate of return anticipated on a bond if held until maturity. YTM is expressed as an
annual rate. The YTM factors in the bond's current market price, par value, coupon interest rate and time to maturity.
SIP : SIP or systematic investment plan works on the principle of making periodic investments of a fixed sum. It works similar to a recurring
bank deposit. For instance, an investor may opt for an SIP that invests Rs 500 every 15th of the month in an equity fund for a period of three
years.
NAV : The NAV or the net asset value is the total asset value per unit of the mutual fund after deducting all related and permissible expenses.
The NAV is calculated at the end of every business day. It is the value at which the investor enters or exits the mutual fund.
Benchmark : A group of securities, usually a market index, whose performance is used as a standard or benchmark to measure investment
performance of mutual funds, among other investments. Some typical benchmarks include the Nifty, Sensex, BSE200, BSE500, 10-Year Gsec.
Entry Load : A mutual fund may have a sales charge or load at the time of entry and/or exit to compensate the distributor/agent. Entry load is
charged at the time an investor purchases the units of a mutual fund. The entry load is added to the prevailing NAV at the time of investment.
For instance, if the NAV is Rs. 100 and the entry load is 1%, the investor will enter the fund at Rs 101.
Note: SEBI, vide circular dated June 30, 2009 has abolished entry load and mandated that the upfront commission to distributors will be paid
by the investor directly to the distributor, based on his assessment of various factors including the service rendered by the distributor
Exit Load : Exit load is charged at the time an investor redeems the units of a mutual fund. The exit load is deducted from the prevailing NAV
at the time of redemption. For instance, if the NAV is Rs 100 and the exit load is 1%, the redemption price would be Rs 99 Per Unit.
Modified Duration : Modified duration is the price sensitivity and the percentage change in price for a unit change in yield
Standard Deviation : Standard deviation is a statistical measure of the range of an investment's performance. When a mutual fund has a high
standard deviation, its means its range of performance is wide, implying greater volatility.
Sharpe Ratio : The Sharpe Ratio, named after its founder, the Nobel Laureate William Sharpe, is a measure of risk-adjusted returns. It is
calculated using standard deviation and excess return to determine reward per unit of risk.
Beta : Beta is a measure of an investment's volatility vis-à-vis the market. Beta of less than 1 means that the security will be less volatile than
the market. A beta of greater than 1 implies that the security's price will be more volatile than the market.
AUM : AUM or assets under management refers to the recent / updated cumulative market value of investments managed by a mutual fund
or any investment firm.
Holdings : The holdings or the portfolio is a mutual fund's latest or updated reported statement of investments/securities. These are usually
displayed in terms of percentage to net assets or the rupee value or both. The objective is to give investors an idea of where their money is
being invested by the fund manager.
Nature of Scheme : The investment objective and underlying investments determine the nature of the mutual fund scheme. For instance, a
mutual fund that aims at generating capital appreciation by investing in stock markets is an equity fund or growth fund.Likewise, a mutual
fund that aims at capital preservation by investing in debt markets is a debt fund or income fund. Each of these categories may have sub-
categories.
Rating Profile : Mutual funds invest in securities after evaluating their creditworthiness as disclosed by the ratings. A depiction of the mutual
fund in various investments based on their ratings becomes the rating profile of the fund. Typically, this is a feature of debt funds.
25

Investor Service Centers (ISC) / Official Point of Acceptance (OPA) & Risk Factors
Edelweiss Asset Management Limited - ISC / OPA
Mutual Fund investments are subject to market risks, read all scheme related documents carefully.Disclaimer : The view of the Fund Managers should not be construed as advice. Investors must make their own investment decisions based on their specific investment objectives and financial positions and using such AMFI qualified advisors as may be necessary. Opinions expressed in various articles are not necessarily those of Edelweiss Asset Management Limited (EAML) or any of its Directors, Officers, Employees and personnel. Consequently, the Edelweiss Asset Management Limited (EAML) or any of its Directors, Officers, Employees and personnel do not accept any responsibility for the editorial content or its accuracy, completeness or reliability and hereby disclaim any liability with regard to the same.
Risk factors
Karvy Computershare Private Limited - ISC / OPA
Karvy Computershare Private Limited Karvy Computershare Pvt. Ltd, Unit: Edelweiss Mutual Fund, Karvy Selenium Tower B, Plot No 31 & 32, Gachibowli, Financial, District, Nanakramguda, Serilingampally ,Hyderabad – 500 008, Tel: 040-67161500
Edelweiss Mutual FundTower 3, Wing B, Ground Floor, Kohinoor City Mall, Kohinoor City, Kirol Road, Kurla (W), Mumbai - 400070. www.edelweissmf.com
www.karvymfs.com - Website of Karvy Computershare Pvt. Ltd. would also be considered as an Official Point of Acceptance ("OPA") for all the Schemes of the AMC. The
online transaction portal of MF Utilities India Private Limited ("MFUI") i.e www.mfuonline.com and the POS locations of MFUI will be in addition to the existing OPA of the AMC
• Agra: 1St Floor, Deepak Wasan Plaza, Behind Holiday Inn, Sanjay Place, Agra - 282002 (U.P.). Tel: 9369918603 • Ahmedabad: 201/202 Shail Complex, Opp: Madhusudan House, B/H Girish Cold Drink, Off C G Road, Navrangpura, Ahmedabad - 380006. Tel: 079-65445550/079-26402967 • Ajmer: 302, 3rd Floor, Ajmer Auto Building, Opposite City Power House, Jaipur Road, Ajmer-305001. Tel: 0145-5120725 • Aligarh: 1St Floor, Kumar Plaza, Ramghat Road, Aligarh-202001. Uttar Pradesh. Tel: 9369918604 • Allahabad: Rsa Towers, 2Nd Floor, Above Sony Tv Showroom, 57, S P Marg, Civil Lines, Allahbad - 211001. Tel: 9369918605 • Ambala: 6349, Nicholson R o a d , A d j a c e n t K o s H o s p i t a l a m b a l a C a n t , A m b a l a - 1 3 3 0 0 1 . Te l : 9 3 1 5 0 1 7 3 0 1 • A m r i t s a r : 7 2 - A , Ta y l o r ' S R o a d , O p p A g a H e r i t a g e C l u b , A m r i t s a r - 1 4 3 0 0 1 . Tel: 0183-5053802 • Anand: B-42 Vaibhav Commercial Center, Nr Tvs Down Town Showroom, Grid Char Rasta, Anand - 380001. Tel: 9662020623 • Ankleshwar: L/2 Keval Shopping Center, Old National Highway, Ankleshwar - 393002. Tel: 02646 645326 • Asansol: 114 / 71, G.T. Road Near Sony Centre, Bhanga Pachil, Asansol - 713303 Tel:0341-3266507 • Aurangabad: Ramkunj Niwas, Railway Station Road, Near Osmanpura Circle,Aurangabad-431005 Tel: 0240-2343414. • Balasore: M S Das Street, Gopalgaon, Balasore - 756001. Tel: 06782-260503 • Bangalore: 59, Skanda Puttanna Road,Basavanagudi, Bangalore- 560004. Tel: 080-26602852/9625 • Bareilly: 1st Floor, 165, Civil Lines, Opp. Hotel Bareilly Palace, Near Rly Station Road, Bareilly - 243 001. Tel: 9369918607 • Baroda: 203, Corner point, Jetalpur Road, Baroda, Gujarat – 390007 Phone : 0265-2353506/ 0265-2353507 • Begusarai: Near Hotel Diamond Surbhi Complex, Near I.O.C Township Gate, Kapasiya Chowk, Begusarai - 851117. Tel: 9308793949 • Belgaum: CTS No 3939/ A2 A1, Above Raymonds Show Room, Beside Harsha Appliances, Club Road, Belgaum - 590001. Tel: 0831 2402544 • Berhampur (OR): Opp –Divya Nandan Kalyan Mandap, 3rd Lane Dharam Nagar, Near Lohiya Motor, Berhampur - 760001, Tel:0680-2228106 • Bhagalpur: 2nd Floor, Chandralok Complex, Ghantaghar, Radha Rani Sinha Road, Bhagalpur - 812001, Tel: 9386256100 • Bharuch: 147-148, Aditya Complex, Near Kasak Circle, Bharuch - 392 001. Tel: 02642-225022 • Bhavnagar: Krushna Darshan Complex, Parimal Chowk, Office No. 306-307, 3rd Floor, Above Jed Blue Show Room, Bhavnagar - 364002. Tel: 278-3003149 • Bhilai: Shop No-1,First Floor, Plot No-1, Commercial Complex, Nehru Nagar- East, Bhilai, Pin - 490020. Tel: 0788-2295999/2295332 • Bhopal: Kay Kay Busniss Centre, 133 Zone I M P Nagar, Above City Bank, Bhopal - 462011. Tel: 0755-4092712 • Bhubaneswar: A/181 , Back Side Of Shivam Honda Show Room, Saheed Nagar, Bhubaneswar - 751007. Tel: 0674-6534585 • Bokaro: B-1, 1St Floor, Near Sona Chandi Jewellers, City Centre, Sector - 4, Bokaro Steel City - 827 004. Tel: 9204061959 • Borivali: A-1, Himanshu Building, Sodawala Lane, Near Chamunda Circle, Borivali West, Borivali, Mumbai - 400 091. Tel: 022- 28916319 • Burdwan: 63 G T Road, Birhata, Halder Complex, 1st Floor, Burdwan - 713101. Tel: 0342-2665140 • Calicut: 2nd Floor Soubhagya Shopping Complex, Areyadathupalam, Mavoor Road, Calicut - 673 004. Tel: 0495-4022480 • Chandigarh: SCO- 2423-2424, Above Mirchi Red Restaurent, First Floor, Sector 22-C, Chandigarh - 160022. Tel: 0172-5101342 • Chennai: Flat No F11,First Floor, Akshya Plaza,(Erstwhile Harris Road), Opp Chief City Metropolitan Court, #108, Adhithanar Salai,Egmore, Opp To Chief Metropolitan Court, Chennai - 600002. Tel: 044-42028512 • Cochin: Ali Arcade, 1St Floor,Kizhavana Road, Panampilly Nagar, Near Atlantis Junction, Ernakualm - 682036. Tel: 0484 3000232 • Coimbatore: 3rd Floor, 1057, Jaya Enclave, Avanashi Road,Coimbatore- 641018 Phone : 0422 - 4388011 • Cuttack: Dargha Bazar, Opp. Dargha Bazar Police Station, Buxibazar, Cuttack - 753001. Tel: 9238102118 • Dehradun: Kaulagarh Road, Near Sirmaur Marg, Above Reliance Webworld, Dehradun - 248 001. Tel: 9369918608 • Dhanbad: 208, New Market, 2nd Floor, Bank More, Dhanbad - 826001. Tel: 0326-6452027/2301045 • Dharwad: 307/9-A, 1st Floor, Elite Business Center, Nagarkar Colony, P. B Road, Dharwad-580001. Tel: 0836- 2744207 • Durgapur: MWAV-16 Bengal Ambuja, 2ndFloor, City Centre, Distt. Burdwan, Durgapur- 713216. Tel: 0343-6512111 • Erode: No. 4,KMY Salai, Veerappan Traders Complex, Opp : Erode Bus Stand , Sathy Road, Erode - 638 003. Tel: 0424-4021212 • Faridabad: A-2B, 1st Floor, Nehru Ground, Neelam Bata Road, Peer ki Mazar, Faridabad - 121 001, Tel: 9310448851 • Gandhidham: 204 2nd Floor, Bhagwati Chamber, Kutchkala Road, Gandhidham - 382007. Tel: 02836 651296 • Gaya: 1st Floor Lal Bhawan, Tower Chowk, Near Kiran Cinema, Gaya - 823001. Tel: 0631 - 2220065 • Ghaziabad: 1st Floor, C-7, Lohia Nagar, Ghaziabad - 201001. Tel: 9310448804 • Gorakhpur: Above V.I.P. House, Ajdacent A.D. Girls Inter College, Bank Road, Gorakpur - 273 001. Tel: 9369918610 • Guntur: D No 6-10-27, 10/1, Sri Nilayam, Arundelpet, Guntur -522002 - Tel: 0863-2339094 • Gurgaon: Shop No. 18, Ground Floor, Sector - 14, Opp. AKD Tower, Near Huda Office, Gurgaon - 122001. Tel: 9310448806 • Guwahati: 1st Floor, Bajrangbali Building, Near Bora Service Station, GS Road, Guwahati : 781007. Phone: 8811036746 • Gwalior: 2nd Floor, Rajeev Plaza, Jayendra Ganj, Lashkar, Gwalior - 474009. Tel: 9300004262 • Haldwani: Above Kapilaz, Sweet House, Opp LIC Building, Pilikothi, Haldwani - 263139. Uttaranchal. Tel: 9369918611 • Hissar: Sco 71, 1st Floor, Red Square Market, Hissar - 125001. Tel: (01662) 225845 • Hubli: CTC no. 483 / A1/A2, Ground Floor, Shri Ram Plaza, Behind Kotak Mahindra Bank, Club Road, Hubli – 580029. Tel:: 0836-2252444 • Hyderabad: KARVY CENTRE’ 8-2-609/K, Avenue 4, Street No. 1, Banjara Hills, Hyderabad - 500034. Tel: 040-67406120 / 040-67406121 • Hyderabad (Gachibowli): KARVY Selenium, Plot No: 31 & 32, Tower B, Survey No.115/22, 115/24, 115/25, Financial District, Gachibowli, Nanakramguda, Serilimgampally Mandal, Hyderabad - 500032. Tel: 040-3321 5121 /5122/5123 • Indore: 2nd floor, 203-205 Balaji Corporate House, Above ICICI bank, 19/1 New Palasia, Near Curewell Hospital, Janjeerwala Square, Indore - 452001. Tel: 0731-4218902 • Jaipur: S-16 A, 3rd Floor, Land Mark, Opposite Jaipur Club, Mahavir Marg, C- Scheme, Jaipur - 302 001. Tel: 0141 4167714 • Jalandhar: 1st Floor, Shanti Towers SCO No. 37, PUDA Complex, Opposite Tehsil Complex, Jalandhar -144001. Tel: 0181-5094410 • Jalgaon: 269, Jaee Vishwa, 1st Floor, Above United Bank Of India Baliram Peth, Nr Kishor Agencies, Jalgaon-425001 Tel : 0257-2226761 • Jalpaiguri: D B C Road, Opp Nirala Hotel, Jalpaiguri - 735101. Tel: 03561-222136 • Jammu: 5 A/D Extension 2, Near Panama Chowk Petrol Pump, Panama Chowk, Jammu – 180012 Tel: 0191-2458820 • Jamnagar: 136-137-138, Madhav Plaza, Opposite SBI Bank, Nr Lal Bunglow, Jamnagar, Gujarat -361001. Tel: 0288-2558887 • Jamshedpur: 2nd Floor, SB Shop Area, near Reliance Foot Print & Hotel- Bs Park Plaza, Main Road, Bistupur, Jamshedpur - 831001. Tel: 0657-6655000 • Jhansi: 371/01, Narayan Plaza, Gwalior Road, Near Jeevan Shah Chauraha, Jhansi - 284 001. Tel: 9369918614 • Jodhpur: 203, Modi Arcade, Chopasni Road, Jodhpur - 342 001. Tel: 0291-6454590 • Kanpur: 15/46, B, Ground Floor, Opp: Muir Mills, Civil Lines, Kanpur - 208001. Tel: 9369918615/6 • Karaikudi: No. 2, Gopi Arcade, 100 Feet Road, Karaikudi - 630 001. Tel: 04565-237192 • Karur: No.6, Old No.1304, Thiru-Vi-Ka Road , Near G.R.Kalyan Mahal, Karur - 639 001. Tel: 04324-241755 • Kharagpur: 180, Malancha Road, Beside Axis Bank, Kharagpur - 721304. Tel: 03222-253380 • Kolhapur: 605/1/4 E Ward, Shahupuri 2Nd Lane, Laxmi Niwas, Near Sultane Chambers, Kolhapur 416001. Tel: 0231 2653656 • Kolkata: 166A, Rash behari Avenue, Opp- Fortish Hospital, Kolkata-700029. Tel. Nos. 033-40611135/ 36, 033-24659263/9267/24635432/24669450/24196462 • Kota: H.No. 29, First Floor, Near Lala Lajpat Rai Circle, Shopping Centre, Kota - 324007. Tel: 0744-5100964 • Kottayam: 1st Floor Csiascension Square, Railway Station Road, Collectorate P O, Kottayam - 686 002. Tel: 0481-2300868 • Lucknow: 1st Floor, A. A. Complex, Thaper House, 5, Park Road,Hazratganj, Lucknow - 226001, Tel: 9369918600 • Ludhiana: SCO - 136 , First Floor, Above Airtel Show Room,Feroze Gandhi Market, Ludhiana - 141001. Tel: 0161-4648747 • Madurai: Rakesh Towers, 30-C, Bye Pass Road, Ist Floor, Opp Nagappa Motors, Madurai - 625010. Tel: 0452-2605856 • Malda: Sahistuli Under Ward, No-6, English Bazar Municipality, No-1 Govt Colony, Malda - 732101. Tel: 03512-223763 • Mangalore: Mahendra Arcade Opp Court Road, Karangal Padi, Mangalore - 575003. Tel: 0824-2496289 • Margoa: 2nd Floor, Dalal Commercial Complex, Opp: Hari Mandir, Pajifond, Margao, Goa -403601. Tel: 0832-2731823 • Mathura: AMBEY Crown, IInd Floor, In Front Of BSA College, Gaushala Road, Mathura - 281001 Tel: 9369918618 • Meerut: 1st Floor, Medi Centre Complex, Opp. Icici Bank, Hapur Road, Near Bachha Park, Meerut - 250 002. Tel: 9369918619 • Mehsana: Ul -47, Apollo Enclave, Opp Simandhar Temple, Modhera Char Rasta; Highway, Mehsana-384002. Tel: 2762 242950 • Moradabad: Om Arcade, Parker Road, Above Syndicate Bank, Tari Khana Chowk, Moradabad - 244 001. Tel: 9369918620 • Mumbai: 24/B, Raja Bahadur Compound, Ambalal Doshi Marg, Behind Bombay Stock Exchange, Fort, Mumbai – 400001 Tel: 022 - 66235353• Muzaffarpur: 1St Floor, Uma Market, Near Thana Gumti, Motijheel, Muzaffarpur, Bihar - 842001. Tel: 9386256101 • Mysore: L - 350 , Silver Tower , Clock Tower, Ashoka Road, Mysore - 570 001. Tel: 0821-2438006 • Nadiad: 104/105 City Point Nadiad, Near Paras Cinema, Nadiad - 387001. Tel: 0268-2563245 • Nagpur: Plot No.2/1, House No. 102/1, Mangaldeep Apartment, Mata Mandir Road, Opp. Khandelwal Jewellers, Dharampeth, Nagpur - 440 010. Tel: 0712-2533040 • Nasik: F-1, Suyojit Sankul, Suyojit Sankul, Sharanpur Road, Near Rajiv Gandhi Bhavan Nasik - 422 002. Tel: 0253-6611395 • Navsari: 1st Floor,/ Chinmay Arcade, Opp. Sattapir, Tower Road, Navsari - 396 445. Tel: 02637-280367 • New Delhi: 305, 3rd Floor, New Delhi House, Bara Khamba Road, New Delhi-110 001. Tel: 011-43681700 • Panipat: JAVA Complex, 1st Floor , Above Vijaya Bank, G T Road, Panipat - 132103. Tel: 9315017304 • Panjim: Flat No.1-A, H. No. 13/70, Timotio Bldg, Heliodoro Salgado Road, Next to Navhind Bhavan (Market Area), Panjim - 403001. Tel:0832-2426873 • Patiala: Sco 27 D, Chhoti Baradari, Near Car Bazaar, Patiala - 147 001. Tel: 0175-5004349 • Patna: 3A, 3rd Floor, Anand Tower, Exhibition Road, Opp Icici Bank, Patna - 800001. Tel: 0612-6453098 • Pondicherry: First Floor, No.7, Thiayagaraja Street, Pondicherry - 605 001. Tel: 0413 2220640 • Pune: Mozaic Bldg, CTS No.1216/1, Final Plot No.576/1 TP, Scheme No.1, F C Road, Bhamburda, Shivaji Nagar, Pune-411004, Ph. No: 020-66496700/01/02/03/04 • Raipur: Room No. TF 31, 3 RD Floor, Millennium Plaza, Behind Indian Coffee House, G E Road, Raipur - 492 001. Tel: 0771-4052620 • Rajahmundry: Dr.No. 6-1-4, First Floor, Rangachary Street,T. Nagar, Near Axis Bank, Rajahmundry -533101. Tel: 0883 - 2434468 / 70 • Rajkot: 104, Siddhi Vinayak Complex, Dr. Yagnik Road,Opp. Ramkrishna Ashram, Rajkot - 360 001 Gujarat Tel: 2816545888 • Ranchi: Commerce Towers, 3rd Floor, Room No. 307, Beside Mahabir Towers, Main Road, Ranchi - 834 001. Tel: 0651-2331320 • Rohtak: 1st Floor, Ashoka Plaza, Delhi Road, Rohtak - 124001. Tel:( 01262) 253597 • Rourkela: 1St Floor, Sandhu Complex, Kanchery Road, Rourkela - 769 012. Tel: 0661-2500005 • Saharanpur: 18 Mission Market, Court Road, Saharanpur - 247001. Uttar Pradesh. Tel: 9369918622 • Salem: NO 3/250 , Brindavan Road, Near Perumal Koil, Fairlands, Salem - 636016. Tel: 0427-4020300 • Sambalpur: Ground Floor Quality Massion, Infront of bazaar kolkata, Nayapara, Sambalpur-768 001. Tel: 0663-2522105 Secunderabad: Crystal Plaza 2nd Floor, Manday Lane, Near Sunshine Hospital, P G Road, Secunderabad - 500003. Tel: 8985469607• Shillong: Mani Bhawan, Thana Road, Lower Police Bazar, Near R K M Lp School , Shillong - 793 001. Tel: 0364 2506106 • Shimla: Triveni Building, By Pas Chowk, Khallini, Shimla - 171 002. Tel: 9318644501 • Shimoga: Sri Matra Naika Complex, 1St Floor, Above Shimoga Diagnostic Centre, Llr Road, Durgigudi, Shimoga - 577201. Tel: 08182-228799 • Silchar: Chowchakra Complex, N N Dutta Road, Premtala, Silchar - 788001. Tel: 03842 261714 • Siliguri: Nanak Complex, Near Church Road, Sevoke Road, Siliguri - 734001. Tel: 0353-2526393 • Surat: G-5 Empire State Building, Near Parag House,Udhna Darwaja, Ring Road, Surat-395002. Tel: 0261-2311100 • Thane: 101, Yaswant Towers, Ram Maruti Road, Opp. Pooja Hotel, Naupada, Thane West, 400 602. Tel: 022 25428475 • Tirunelveli: Jeney Building, 55/18, S N Road, Near Arvind Eye Hospital, Tirunelveli - 627 001. Tel: 0462 2335137 • T. Nagar: G1, Ground Floor, No 22, Vijayaraghava Road, Swathi Court, T Nagar, Chennai - 600 017. Tel: 044 - 28151034 • Tirupur: First Floor, 224 A, S, Selvakumar Departmental Stores, Palladam Road, Opp to Cotton market complex,Tirupur -641604 . Tel: 0421-2214221 • Trichur: 2'Nd Floor, Brother'S Complex, Near Dhana Laxmi Bank Head Office, Nikkanal Junction, Trichur - 680 001. Tel: 0487 6999987 • Trichy: 60, Sri Krishna Arcade, 1st Floor, Thennur High Road, Trichy - 620 017. Tel: 0431-4020227 • Trivandrum: 2nd Floor, Akshaya Towers, Above Jetairways, Sasthamangalam, Trivandrum - 695 010. Tel: 0471-2725728 • Udaipur: 201-202, Madhav Chambers, Opp. G.P.O, Chetak Circle, Madhuban, Udaipur-313001. Tel: 0294-2429370 • Valsad: Shop No 2, Phiroza Corner, Opp Next Showroom, Tithal Road, Valsad - 396001. Tel: 02632-258481 • Vapi: Shop No-12 , Ground floor, Sheetal Appartment , Near K P Tower, Vapi -396195 Tel : 9228012909 • Varanasi: D-6/132,KA 1st Floor, Anant Complex, Sigra, Varanasi - 221 010. Tel: 9369918626 • Vijayawada: 39-10-7 Opp. Municipal Water Tank, Labbipet, Vijayawada - 520 010. Tel:0866 - 6604040/39/32 • Vile Parle: 104, Sangam Arcade, V P Road, Opp. Railway Station ,Above Axis Bank ATM, Vile Parle (West) - 400 056. Tel: 022-26100967 • Visakhapatnam: Door No: 48-8-7,Dwaraka Diamond, Ground Floor, Srinagar, Visakhapatnam - 530 016. Tel: 0891-2714125 • Warangal: 5-6-95, 1st Floor, Opp. B.Ed Collage, Lashkar Bazar , Chandra Complex, Hanmakonda, Warangal - 506001. Tel: 0870-2501664
Ahmedabad: Madhusudan House, Basement, Near Navrangpura Telephone Exchange, Off CG Road, Navrangpura, Ahmedabad – 380 009 Tel - 079 - 6514 1246
Bengaluru: S M Tower, 3rd floor, 3/2 & 4/3/1, 11th Main Road, Jayanagar 3rd Block East, Above Nike Showroom, Bengaluru – 560011 Tel - 080 - 4059 2935Chennai: 7th Avenue, 2nd floor Ammayi Eye hospital building, Ashok Nagar, Chennai- 600083 Tel: 044- 42895741Delhi: 104,1st Floor, Mercantile House, 15 Kasturba Gandhi Marg, New Delhi – 110001 Tel - 011 - 4357 1105Indore: 312-313, D.M. Tower, Third Floor, Race Course Road, Indore, Madhya Pradesh - 452001 Tel - 0731 6701522Kolkata: Savitri Tower, 2nd Floor, 3A Upper Wood Street, Kolkata - 700017 Tel - 033 - 4421 8800Lucknow : Cabin No. 102, A Small Store Trade Point, Ground Floor, Saran Chamber-1, 5-Park Road, Hazratgunj, Lucknow - 226001 Tel - 0522-4070679Mumbai: Tower 3, Wing B, Ground Floor, Kohinoor City Mall, Kohinoor City, Kirol Road, Kurla(W), Mumbai-400070. Maharashtra