facts and trends 2009-10
DESCRIPTION
Facts and Trends of Mills College of 2009-2010, including statistics.TRANSCRIPT

MILLS COLLEGE: FACTS AND TRENDS
OFFICE OF INSTITUTIONAL RESEARCH, PLANNING, AND ACADEMIC ASSESSMENT
2009 - 2010
Mills College Facts and Trends 2009-10
Office of Institutional Research, Planning, and Academic Assessment Page 2
Contents Contents ........................................................................................................................................... 2
Executive Summary ........................................................................................................ 7
Section I Overview .................................................................................................................................... 7
Section II Undergraduate Admissions and Enrollment ............................................................................. 7
Section II Retention and Graduation ......................................................................................................... 8
Section III Graduate Admissions and Enrollment ..................................................................................... 9
Section IV Financial Aid .......................................................................................................................... 10
Section V Curriculum and Academic Support Services .......................................................................... 10
Section VI Personnel ............................................................................................................................... 11
Section VII Fund-Raising ........................................................................................................................ 12
Section VIII Financial Summary .............................................................................................................. 12
Section IX Comparative Data on Higher Education ................................................................................ 13
SECTION I: OVERVIEW ............................................................................................... 14
I.A Enrollment Trends: Undergraduate, Graduate and Total .................................................................. 15
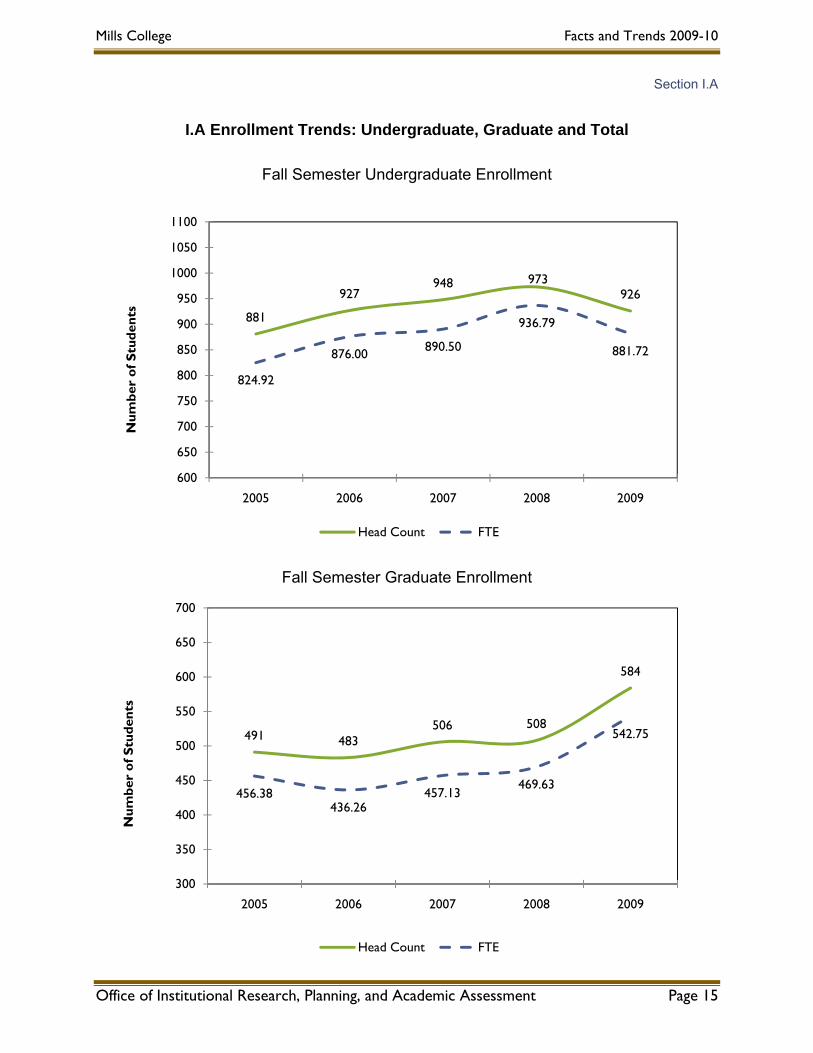
Fall Semester Undergraduate Enrollment...................................................................................... 15
Fall Semester Graduate Enrollment ............................................................................................... 15
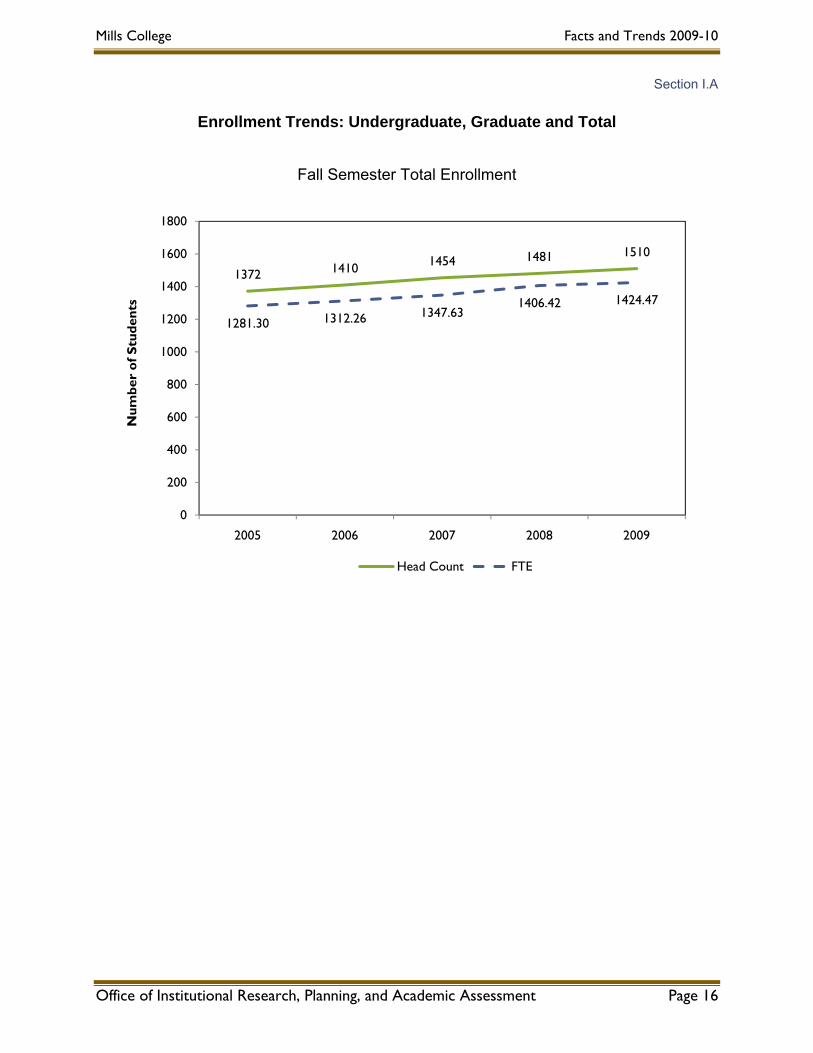
Fall Semester Total Enrollment ...................................................................................................... 16
I.B On-Campus Residence Trends ......................................................................................................... 17
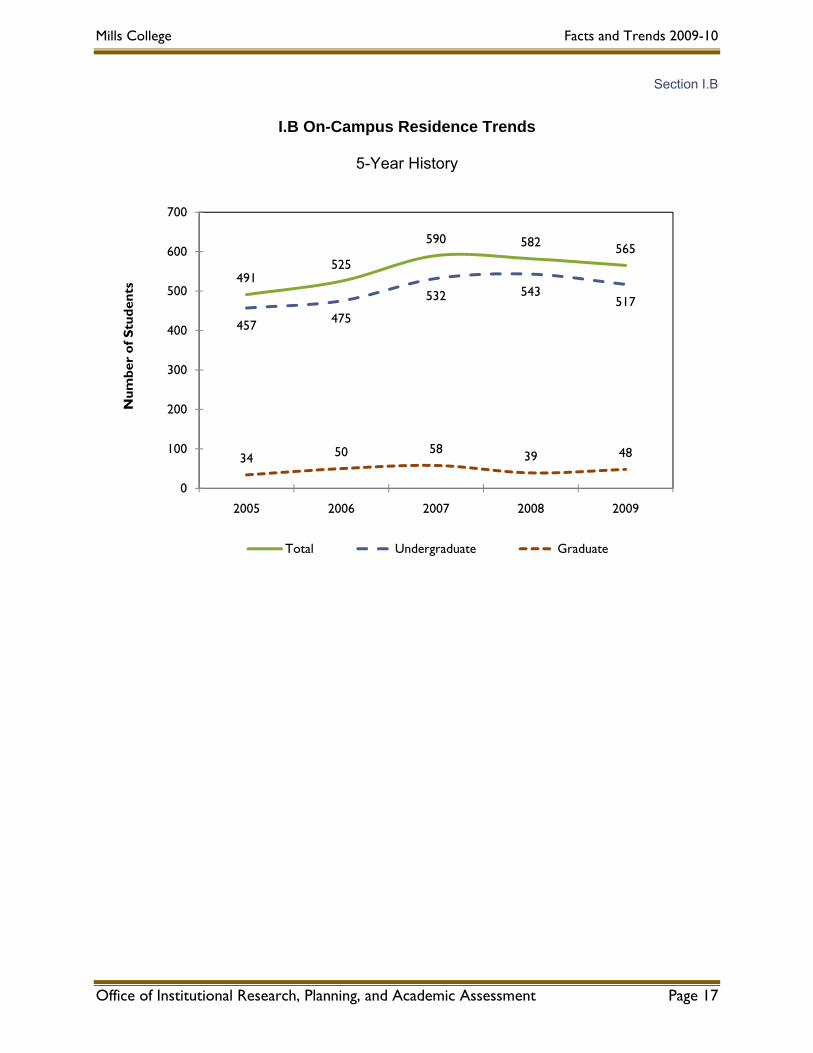
5-Year History ................................................................................................................................ 17
I.C Geographic Distribution of Students .................................................................................................. 18
SECTION II: UNDERGRADUATE ADMISSIONS AND ENROLLMENT ....................... 19
II.A Overall Undergraduate Selectivity and Yield .................................................................................... 21
II.B Admissions and Enrollment by Type ................................................................................................ 22
First-Year Selectivity and Yield ...................................................................................................... 22
II.C First-Year Student SAT Scores ........................................................................................................ 23
Average Math Scores ..................................................................................................................... 23
Average Verbal Scores .................................................................................................................. 23
Average Writing Scores ................................................................................................................. 24
Mills’ Middle 50% SAT Scores ....................................................................................................... 24
II.D High School GPA .............................................................................................................................. 25
II.E Trends in Undergraduate Enrollment and Residence ...................................................................... 26
30-Year History .............................................................................................................................. 27
II.F Undergraduate Students of Color ..................................................................................................... 28
5-Year History ................................................................................................................................ 28
II.G Undergraduate Resuming Students ................................................................................................. 30
5-Year History ................................................................................................................................ 30
II.H Undergraduate First Generation Students ....................................................................................... 31
First-Year First Generation Selectivity and Yield ........................................................................... 31

Mills College Facts and Trends 2009-10
Office of Institutional Research, Planning, and Academic Assessment Page 3
Percent of First Generation Students by Cohort ............................................................................ 32
II.I Persistence Rates .............................................................................................................................. 33
Persistence Rates of First-Time First-Year Students .................................................................... 33
First to Second Year Persistence Rates ........................................................................................ 33
Second to Third Year Persistence Rates ....................................................................................... 35
II.J Graduation Rates .............................................................................................................................. 38
Graduation Rates of First-Time First-Year Students ..................................................................... 38
Six Year Graduation Rates ............................................................................................................ 38
Graduation Rate Distribution .......................................................................................................... 39
SECTION III: GRADUATE ADMISSIONS AND ENROLLMENT ................................... 41
III.A Entering Graduates – Fall ................................................................................................................ 42
Applied, Admitted, Paid Deposit, and Registered .......................................................................... 42
By Discipline ................................................................................................................................... 43
III.B Graduate Enrollment by Residence Status and Gender ................................................................. 44
Graduate Enrollment – Fall ............................................................................................................ 44
III.C Trends in Graduate Enrollment ....................................................................................................... 45
20-Year History .............................................................................................................................. 45
Graduate Students of Color ........................................................................................................... 46
SECTION IV: FINANCIAL AID ...................................................................................... 48
IV.A Undergraduate Financial Aid ........................................................................................................... 49
Sources and Recipients ................................................................................................................. 49
IV.B Entering Undergraduate Financial Aid ............................................................................................ 50
Average Mills Scholarship Award Compared with Cost of Attendance ......................................... 50
IV.C Undergraduate Financial Aid ........................................................................................................... 51
Distribution of Need-Based Aid ...................................................................................................... 51
Grant and Scholarship Recipients ................................................................................................. 51
IV.D Graduate Financial Aid .................................................................................................................... 52
Sources and Recipients ................................................................................................................. 52
IV.E Loan Information ............................................................................................................................. 53
Average Student Loan Indebtedness ............................................................................................. 53
Default Rate ................................................................................................................................... 53
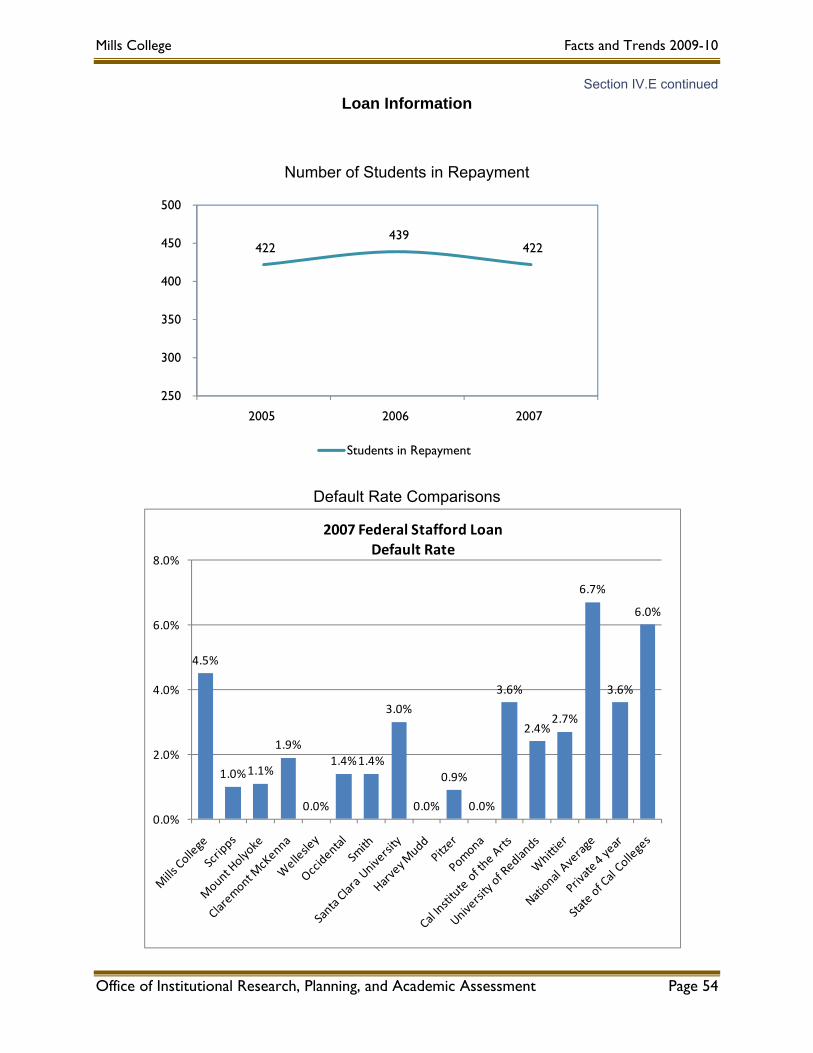
Number of Students in Repayment ................................................................................................ 54
Default Rate Comparisons ............................................................................................................. 54
SECTION V: CURRICULUM AND ACADEMIC SUPPORT SERVICES ....................... 55
V.A Curriculum Overview for Regular Courses ....................................................................................... 56
By Discipline ................................................................................................................................... 56
Explanation of Enrollments and Majors ......................................................................................... 57
(Sections V.B and V.C) .................................................................................................................. 57
V.B Enrollment, Credit Hours, Class Sizes by Discipline ........................................................................ 58

Mills College Facts and Trends 2009-10
Office of Institutional Research, Planning, and Academic Assessment Page 4
Division of Education ...................................................................................................................... 58
Division of Fine Arts ....................................................................................................................... 59
Division of Letters ........................................................................................................................... 62
Division of Natural Sciences and Mathematics .............................................................................. 66
Division of Social Sciences ............................................................................................................ 72
Non-Divisional ................................................................................................................................ 77
V.C Graduated and Declared Majors by Discipline ................................................................................. 78
Division of Education ...................................................................................................................... 78
Division of Fine Arts ....................................................................................................................... 83
Division of Letters ........................................................................................................................... 89
Division of Natural Sciences and Mathematics .............................................................................. 93
Division of Social Sciences .......................................................................................................... 102
Interdivisional ............................................................................................................................... 108
V.D Academic Support Services ........................................................................................................... 112
F.W. Olin Library .......................................................................................................................... 114
SECTION VI: PERSONNEL ........................................................................................ 117
VI.A FTE Funded Position Count by Functional Area ........................................................................... 118
2008-09 ........................................................................................................................................ 118
2008-09 ........................................................................................................................................ 119
VI.B FTE Funded Position Count by Division and Department ............................................................ 120
Fall 2009 ...................................................................................................................................... 120
VI.C Faculty Characteristics by Division and Department .................................................................... 121
Fall Semester 2009 and Fall 2005 - Fall 2008 Summary Data .................................................... 121
SECTION VII: FUND-RAISING ................................................................................... 122
VII.A Summary of Fund-raising by Source ............................................................................................ 123
FY2005 - FY2009 ......................................................................................................................... 123
Sources of Giving ......................................................................................................................... 123
VII.B Total Gifts to the College .............................................................................................................. 124
FY2005 – FY2009 ........................................................................................................................ 124
VII.C Gifts to the College by Fund Type ............................................................................................... 125
FY2005 – FY2009 ........................................................................................................................ 125
Gifts to Mills by Fund Type .......................................................................................................... 125
VII.D Gifts to the College by Designation .............................................................................................. 126
FY2005 – FY2009 ........................................................................................................................ 126
Percent of Funds That Are Unrestricted ...................................................................................... 126
VII.E Bequests and Planned Gifts to the College ................................................................................. 127
FY2005 – FY2009 ........................................................................................................................ 127
VII.F Comparison of Voluntary Support by Type of Institution .............................................................. 128
FY2005 – FY2009 ........................................................................................................................ 128
Mills College Facts and Trends 2009-10
Office of Institutional Research, Planning, and Academic Assessment Page 5
VII.G Comparison of Voluntary Support with Women’s Colleges ......................................................... 129
FY2005 – FY2009 ........................................................................................................................ 129
VII.H Gifts to the College and the Alumnae Association by Alumnae ................................................... 130
FY2005 – FY2009 ........................................................................................................................ 130
VII.I Alumnae Fund Gifts by Source ...................................................................................................... 131
FY2005 – FY2009 ........................................................................................................................ 131
2008-09 ........................................................................................................................................ 131
VII.J Class Gift Fund Accumulations ..................................................................................................... 132
SECTION VIII: FINANCIAL SUMMARY ...................................................................... 133
VIII.A Statement of Activities ................................................................................................................. 134
VIII.B Statement of Financial Position and Net Assets ......................................................................... 135
VIII.C Operating Budget ........................................................................................................................ 136
VIII.D Components of Core Operating Revenues and Coverage of Expenses .................................... 137
VIII.E Components of Core Operating Expenses ................................................................................. 138
Core Operating Expenses 2007-08 ............................................................................................. 138
Core Operating Expenses 2008-09 ............................................................................................. 138
VIII.F Student Revenues and Components of Student Aid ................................................................... 139
Components of Net Revenue from Students ............................................................................... 139
Tuition Revenue and Components of Financial Aid ..................................................................... 139
VIII.G Student Tuition and Fee Information .......................................................................................... 140
Mills College Undergraduate Tuition, Fees, Room and Board .................................................... 140
Undergraduate Tuition & Fee Comparison .................................................................................. 140
VIII.H Endowment Investment Information ........................................................................................... 141
Endowment Market Value ............................................................................................................ 141
Endowment Asset Allocation and Value ...................................................................................... 141
VIII.I Financial Ratios ............................................................................................................................ 142
SECTION IX: COMPARATIVE DATA ON HIGHER EDUCATION .............................. 143
IX.A The Nation and California .............................................................................................................. 144
IX.B Comparable Colleges .................................................................................................................... 146
Appendix ..................................................................................................................... 147
Appendix I: Mills College 2009-10 Profile Sheet ................................................................................... 148
Appendix II: Mills College Fall 2009 Census ......................................................................................... 150
Appendix III: Mills College Spring 2010 Census ................................................................................... 158

Mills College Facts and Trends 2009-10
Office of Institutional Research, Planning, and Academic Assessment
Mills College 5000 MacArthur Boulevard Oakland, California 94613
MILLS
February 1, 2010
Dear Mills College Trustees, Officers, Senior Staff, and Department Heads:
The Office of Institutional Research, Planning, and Academic Assessment is pleased to present Facts & Trends 2009-10. This annual publication is a resource of information about various aspects of Mills College. Where possible, data is presented longitudinally in order to assist the Mills community in assessing the College’s challenges, strengths, and achievements.
This publication is being made available to the campus in electronic form only. The document can be accessed by faculty and staff as a PDF on the Institutional Research section of the College’s Intranet. Institutional Research Department - <https://intranet.mills.edu/institutional_research/>
You are encouraged to refer interested members of your department to the Web for Facts & Trends. We do ask, however, that distribution of this document be limited to members of the Mills community.
Students may access Facts & Trends in the Elinor Raas Heller Rare Book Room in the F.W. Olin Library or by requesting an electronic copy of the document from the Office of Institutional Research, Planning, and Academic Assessment.
The Office of Institutional Research, Planning, and Academic Assessment is grateful for the efforts of many individuals and departments who have supplied information contained in this volume.
Suggestions, as well as general comments and questions regarding Facts & Trends, are always welcome.
Sincerely,
Alice Knudsen
Director of Institutional Research, Planning, and Academic Assessment
E: [email protected] T: 510.430.2350 F: 510.430.3119
Office of Institutional Research, Planning, and Academic Assessment Page 6
Mills College Facts and Trends 2009-10
Office of Institutional Research, Planning, and Academic Assessment Page 7
Mills College Facts and Trends 2009-10
Executive Summary
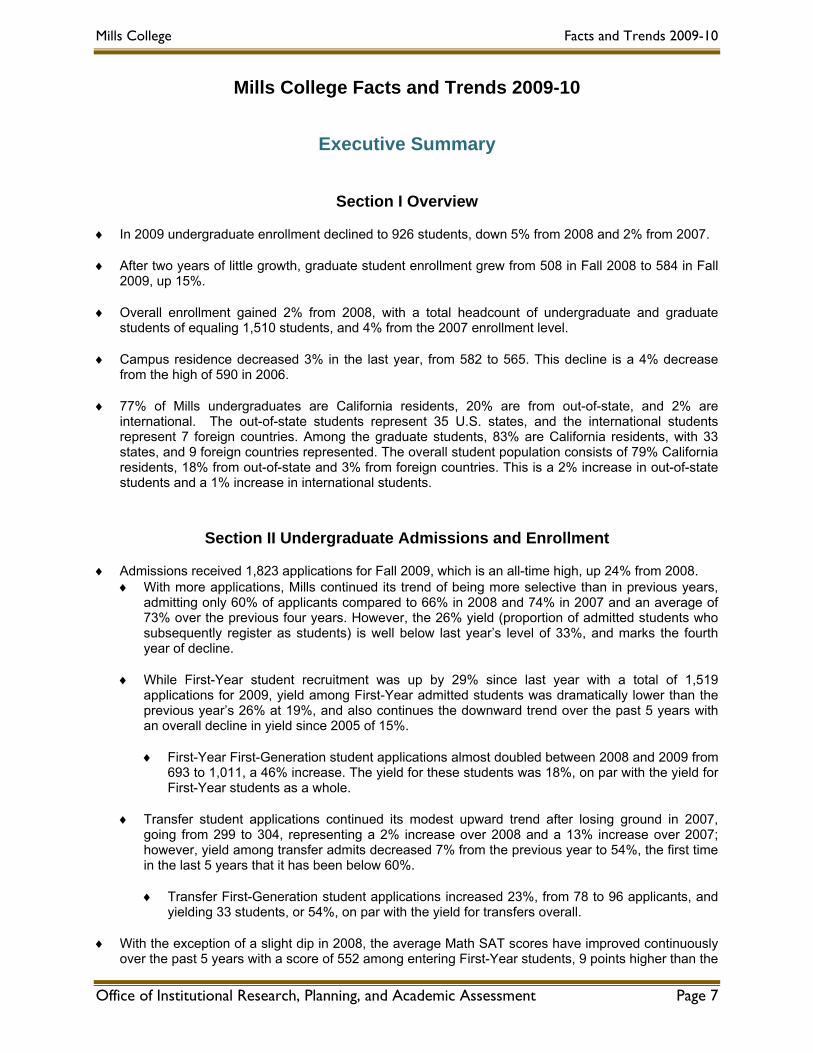
Section I Overview ♦ In 2009 undergraduate enrollment declined to 926 students, down 5% from 2008 and 2% from 2007. ♦ After two years of little growth, graduate student enrollment grew from 508 in Fall 2008 to 584 in Fall
2009, up 15%. ♦ Overall enrollment gained 2% from 2008, with a total headcount of undergraduate and graduate
students of equaling 1,510 students, and 4% from the 2007 enrollment level.
♦ Campus residence decreased 3% in the last year, from 582 to 565. This decline is a 4% decrease from the high of 590 in 2006.
♦ 77% of Mills undergraduates are California residents, 20% are from out-of-state, and 2% are international. The out-of-state students represent 35 U.S. states, and the international students represent 7 foreign countries. Among the graduate students, 83% are California residents, with 33 states, and 9 foreign countries represented. The overall student population consists of 79% California residents, 18% from out-of-state and 3% from foreign countries. This is a 2% increase in out-of-state students and a 1% increase in international students.
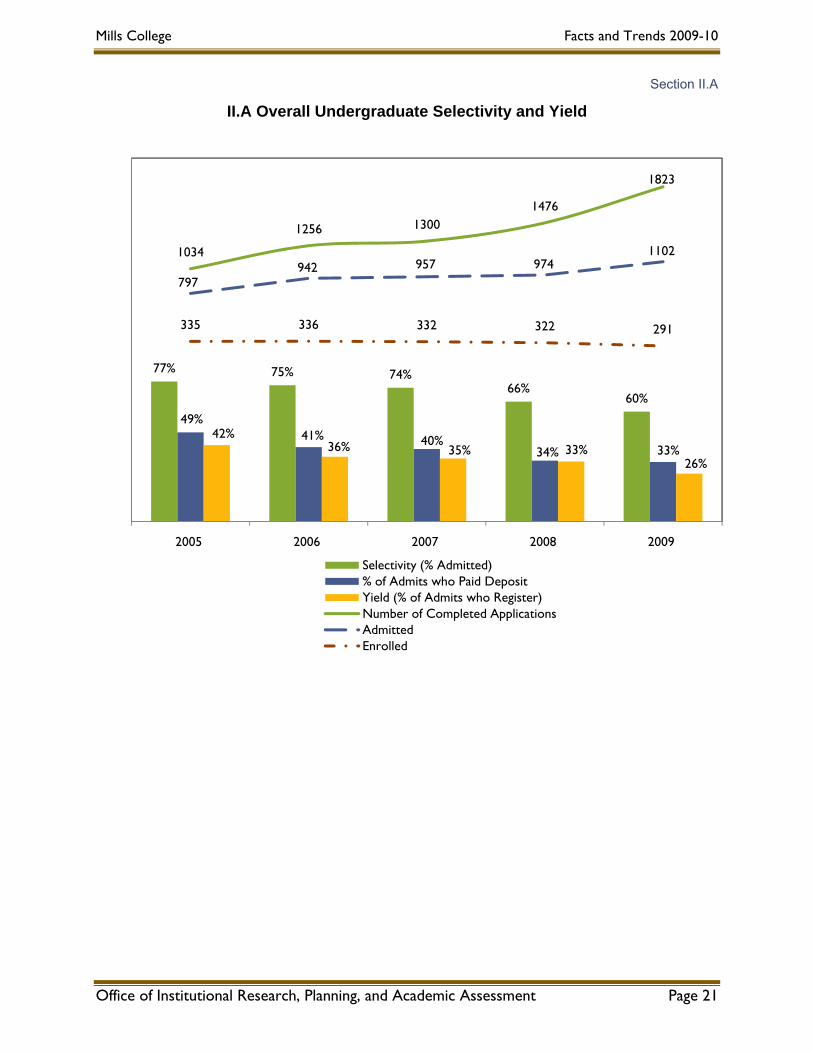
Section II Undergraduate Admissions and Enrollment ♦ Admissions received 1,823 applications for Fall 2009, which is an all-time high, up 24% from 2008.
♦ With more applications, Mills continued its trend of being more selective than in previous years, admitting only 60% of applicants compared to 66% in 2008 and 74% in 2007 and an average of 73% over the previous four years. However, the 26% yield (proportion of admitted students who subsequently register as students) is well below last year’s level of 33%, and marks the fourth year of decline.
♦ While First-Year student recruitment was up by 29% since last year with a total of 1,519 applications for 2009, yield among First-Year admitted students was dramatically lower than the previous year’s 26% at 19%, and also continues the downward trend over the past 5 years with an overall decline in yield since 2005 of 15%.
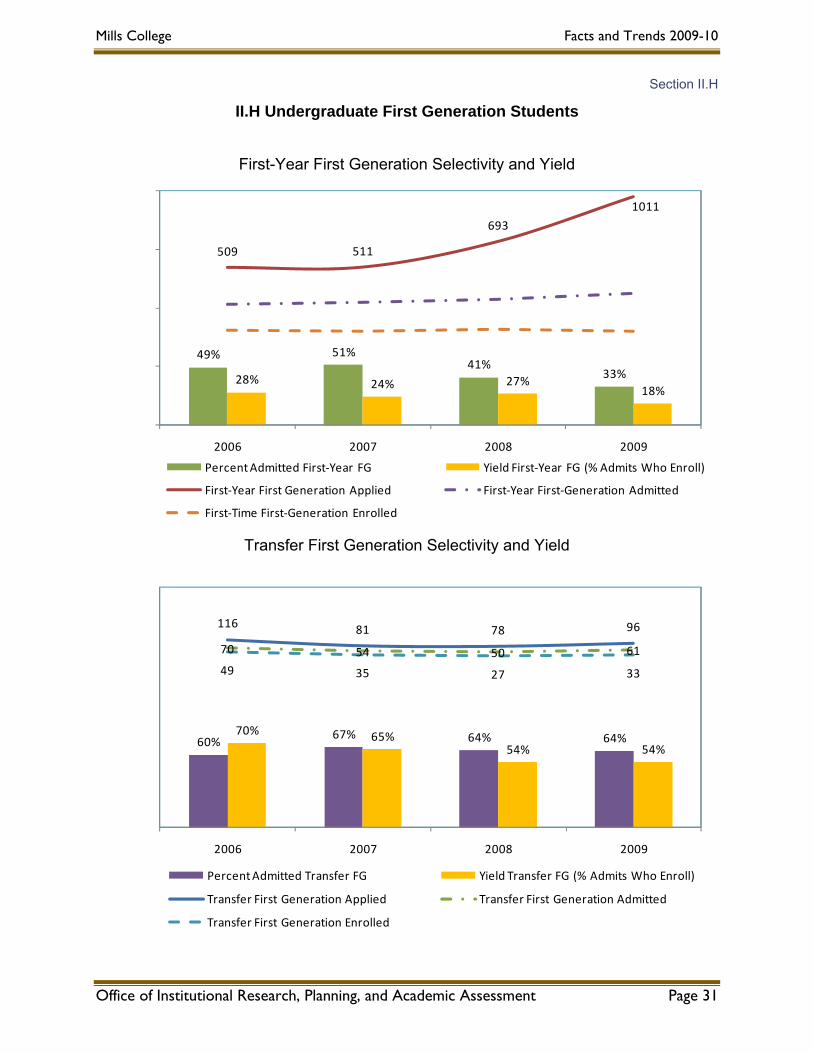
♦ First-Year First-Generation student applications almost doubled between 2008 and 2009 from
693 to 1,011, a 46% increase. The yield for these students was 18%, on par with the yield for First-Year students as a whole.
♦ Transfer student applications continued its modest upward trend after losing ground in 2007, going from 299 to 304, representing a 2% increase over 2008 and a 13% increase over 2007; however, yield among transfer admits decreased 7% from the previous year to 54%, the first time in the last 5 years that it has been below 60%. ♦ Transfer First-Generation student applications increased 23%, from 78 to 96 applicants, and
yielding 33 students, or 54%, on par with the yield for transfers overall. ♦ With the exception of a slight dip in 2008, the average Math SAT scores have improved continuously
over the past 5 years with a score of 552 among entering First-Year students, 9 points higher than the

Mills College Facts and Trends 2009-10
Office of Institutional Research, Planning, and Academic Assessment Page 8
2008 cohort, 37 points higher than the national average, and 52 points higher than the national average score for women in 2008.
♦ SAT Verbal scores continue to improve. The Fall 2009 cohort of First-Year students’ had an average
score of 598, 10 points higher than the previous year, and 86 points or 17% higher than the national average score for women in 2008.
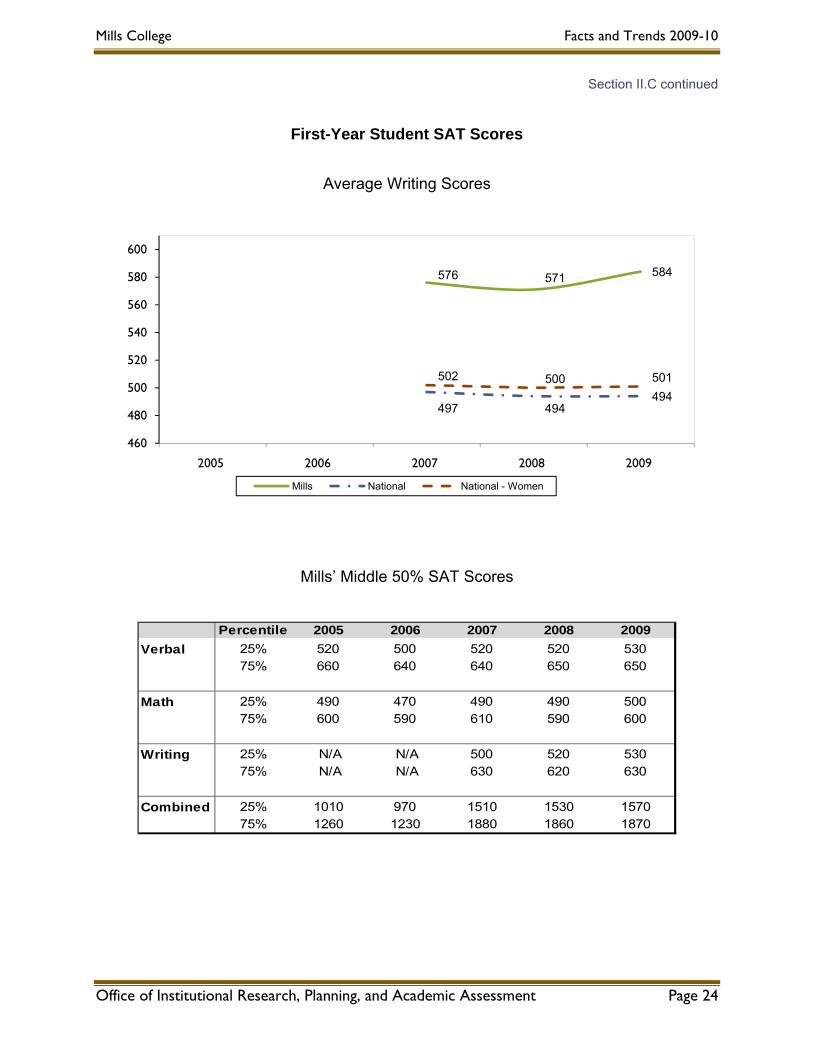
♦ The average SAT Writing score of 584 for First-Year students at Mills increased 13 points from 2008, and is 17% above the national average for women of 501 points.
♦ After a slight decline between 2005 and 2006, the average high school GPA of 3.70 among First-Year
students exceeded by .05 points the 2008 level of 3.65. This is the first time the entering GPA has reached the 3.70 level.
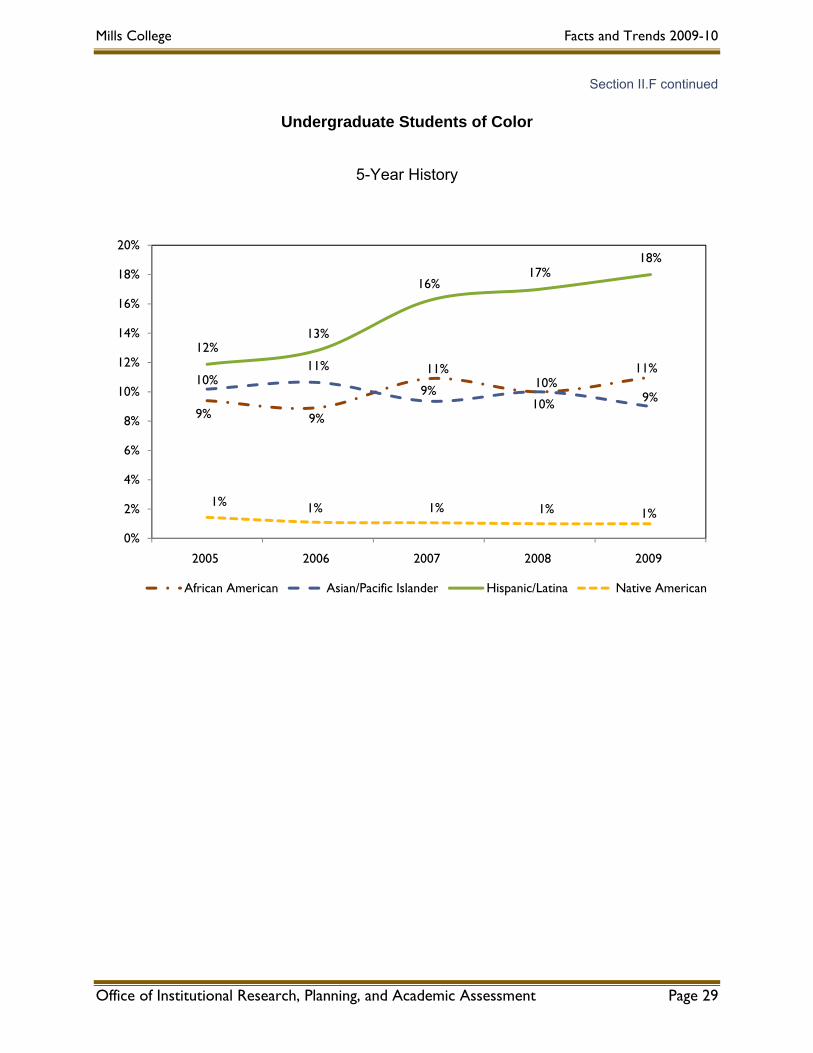
♦ Of those students of known ethnicity, well over one-third (39%) of the undergraduate student
population are students of color, a 1% increase over last year. This net increase is caused by a 1% gain in Hispanic and African-American students and a 1% decline in Asian students. An additional 16% of undergraduates indicated that they are bi/multi-racial, a 2% increase over 2008.
♦ First-Generation students made up 37% of the entering First-Year students and 26% of the entering
Transfer students. This represents a relatively steady-state for First-Year First-Generation students and an overall decline from 2006 of 11% for Transfer First-Generation students, even with the 3% increase between last year and this year.
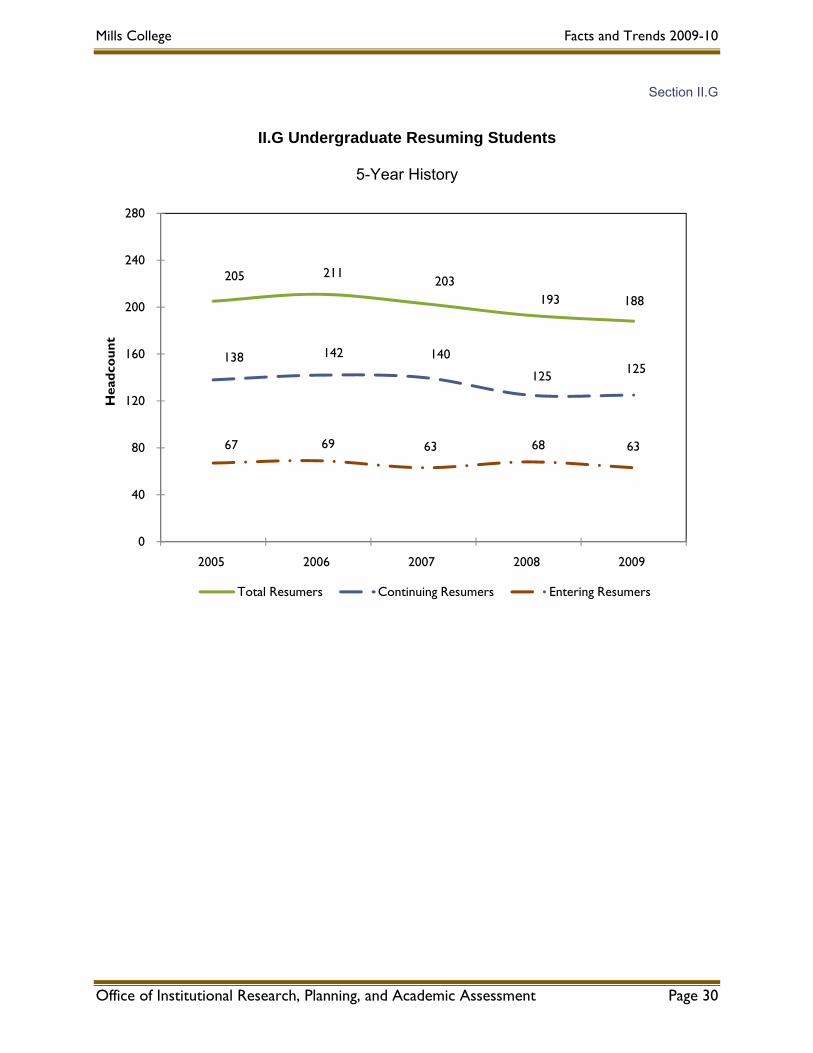
♦ The decline in resuming transfer students continued in 2009, with a total of 188 compared to 193 in 2008 and a high of 211 in 2006.
♦ On-campus residence was 69% for entering undergraduates, a decrease of 3% from 2008, 50% for
continuing undergraduates, an increase of 2% from 2008, and 56% overall.
Section II Retention and Graduation ♦ The first-to-second year persistence rate for First-Time First-Year students who began their studies at
Mills in the fall of 2008 and returned for Fall 2009 was 77%. This represents a 3% increase from the 2007 cohort, and a 6% increase from the 2005 cohort, and is .5% higher than the average over the last 10 years.
♦ The first-to-second year persistence rate for the 2008 cohort of transfer students is 80%, a 6% gain
from the 2007 cohort but only equal to the average over the last 5 years. ♦ The first-to-second year persistence rate for the First-Time First-Generation students who entered in
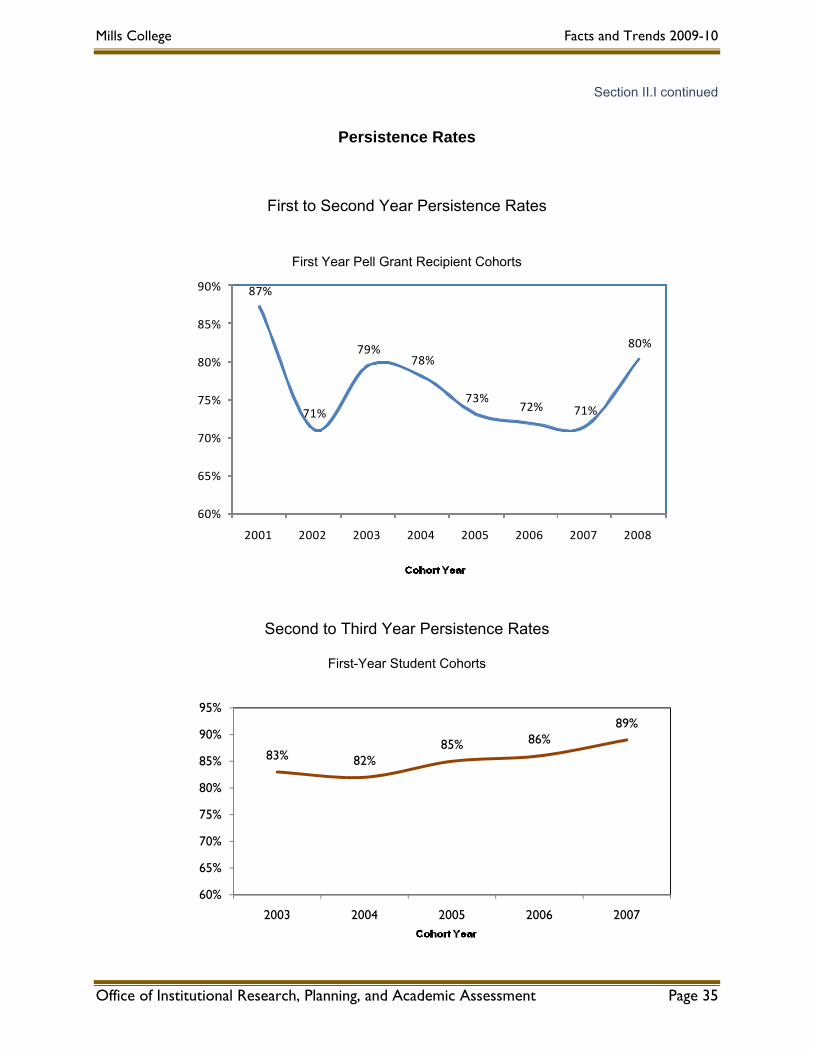
2008 was 76%, slightly lower than for all entering First-Year students. ♦ First-to-second year persistence for First-Year students who were awarded a Pell Grant was 80%,
higher than that of the overall population. ♦ The second-to-third year persistence rates for First-Year students entering in Fall 2007 is 89%, a 3%
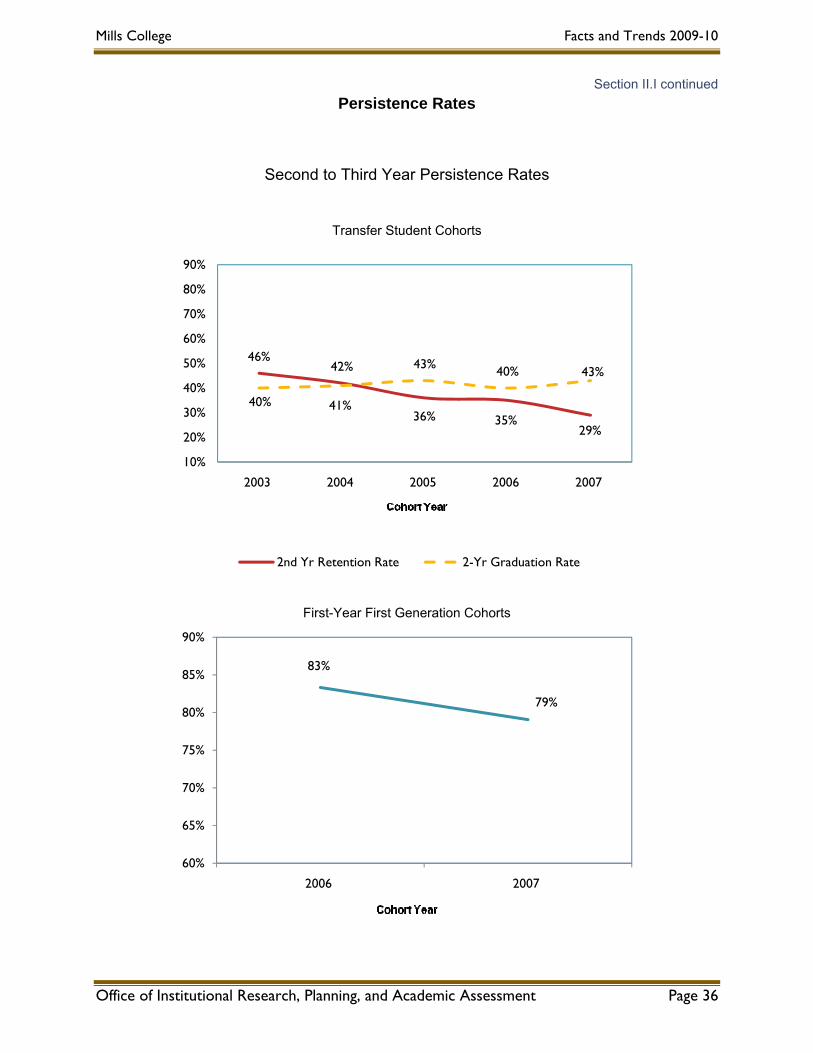
increase from the 2006 cohort, and 4% above the average for the last 5 years. ♦ Second-to-third year persistence rates for the 2007 cohort of Transfer students declined 6%, from
35% to 29%; however, the two-year graduation rate for this cohort increased 3%, which means that the actual decline is a net 3%.
♦ Second-to-third year persistence for First-Year First-Generation students declined from 83% to 79%
from the 2006 cohort to the 2007 cohort. This is also quite a bit lower than the rate for all First-Year students.
Mills College Facts and Trends 2009-10
Office of Institutional Research, Planning, and Academic Assessment Page 9
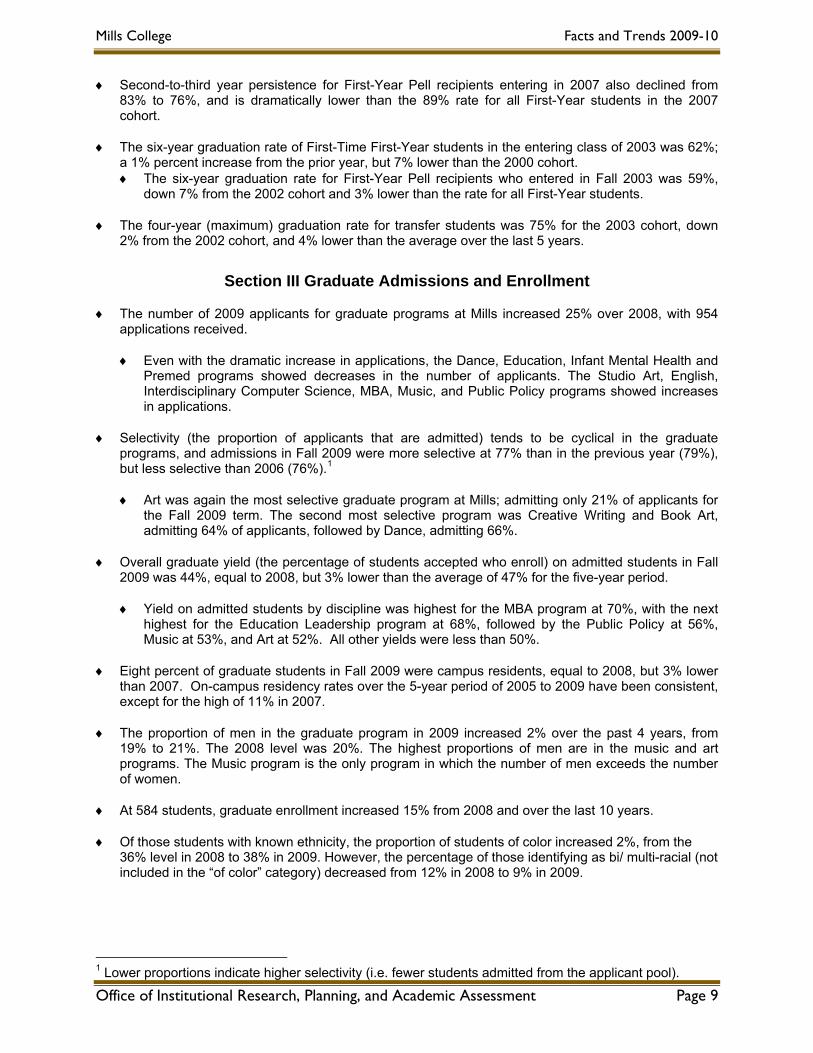
♦ Second-to-third year persistence for First-Year Pell recipients entering in 2007 also declined from 83% to 76%, and is dramatically lower than the 89% rate for all First-Year students in the 2007 cohort.
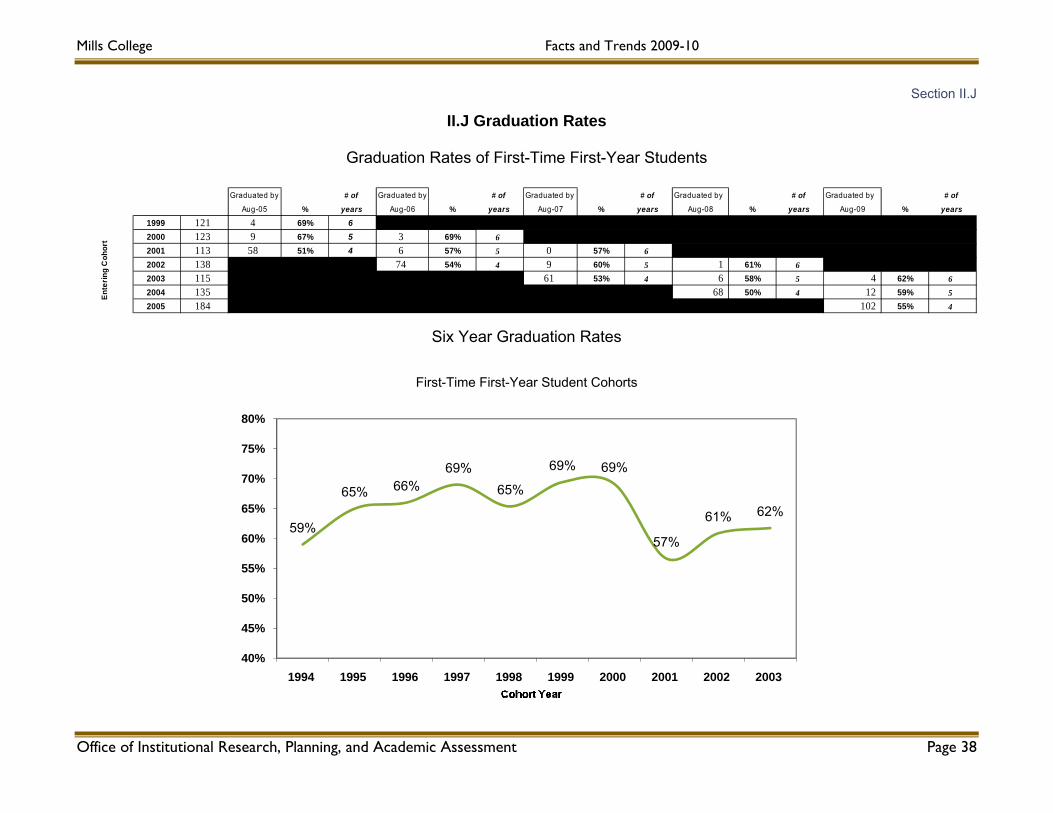
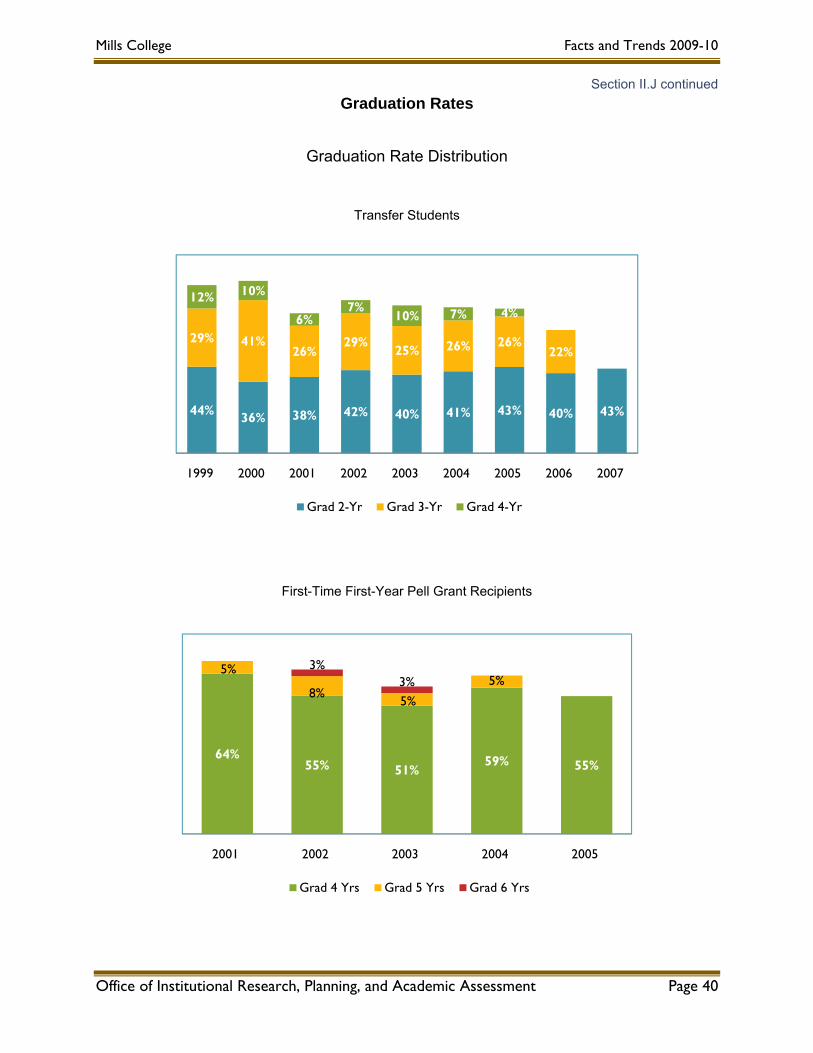
♦ The six-year graduation rate of First-Time First-Year students in the entering class of 2003 was 62%; a 1% percent increase from the prior year, but 7% lower than the 2000 cohort. ♦ The six-year graduation rate for First-Year Pell recipients who entered in Fall 2003 was 59%,
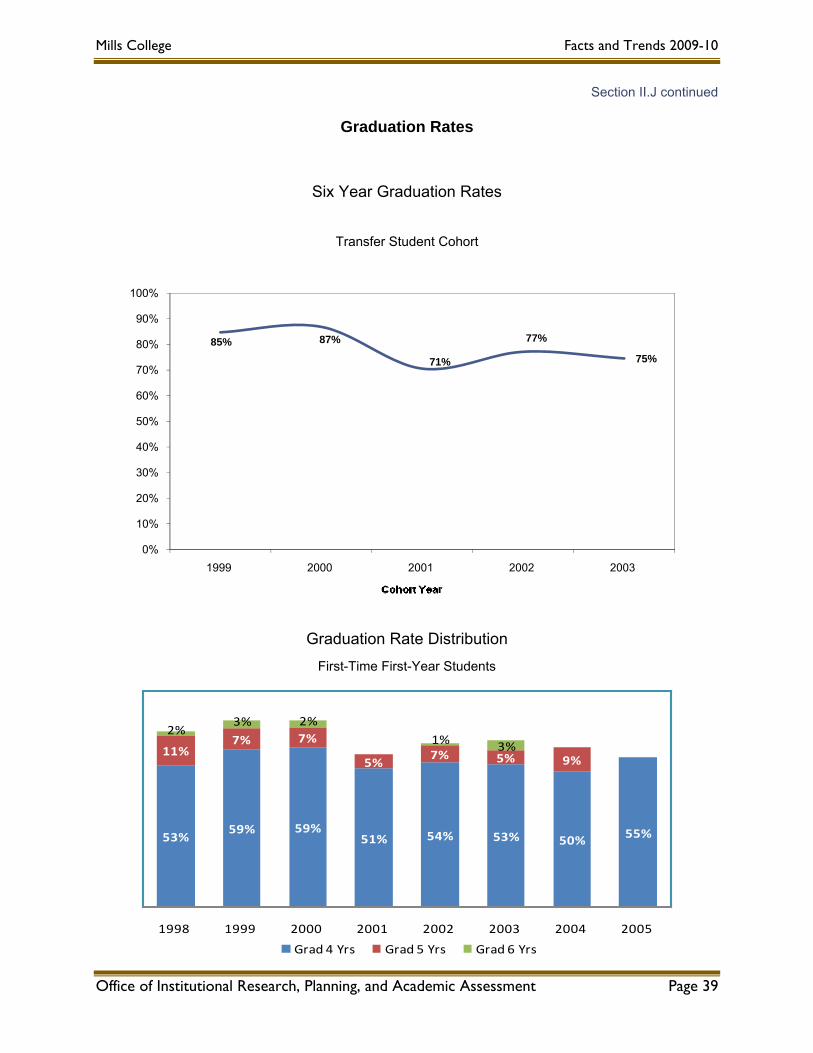
down 7% from the 2002 cohort and 3% lower than the rate for all First-Year students. ♦ The four-year (maximum) graduation rate for transfer students was 75% for the 2003 cohort, down
2% from the 2002 cohort, and 4% lower than the average over the last 5 years.
Section III Graduate Admissions and Enrollment ♦ The number of 2009 applicants for graduate programs at Mills increased 25% over 2008, with 954
applications received.
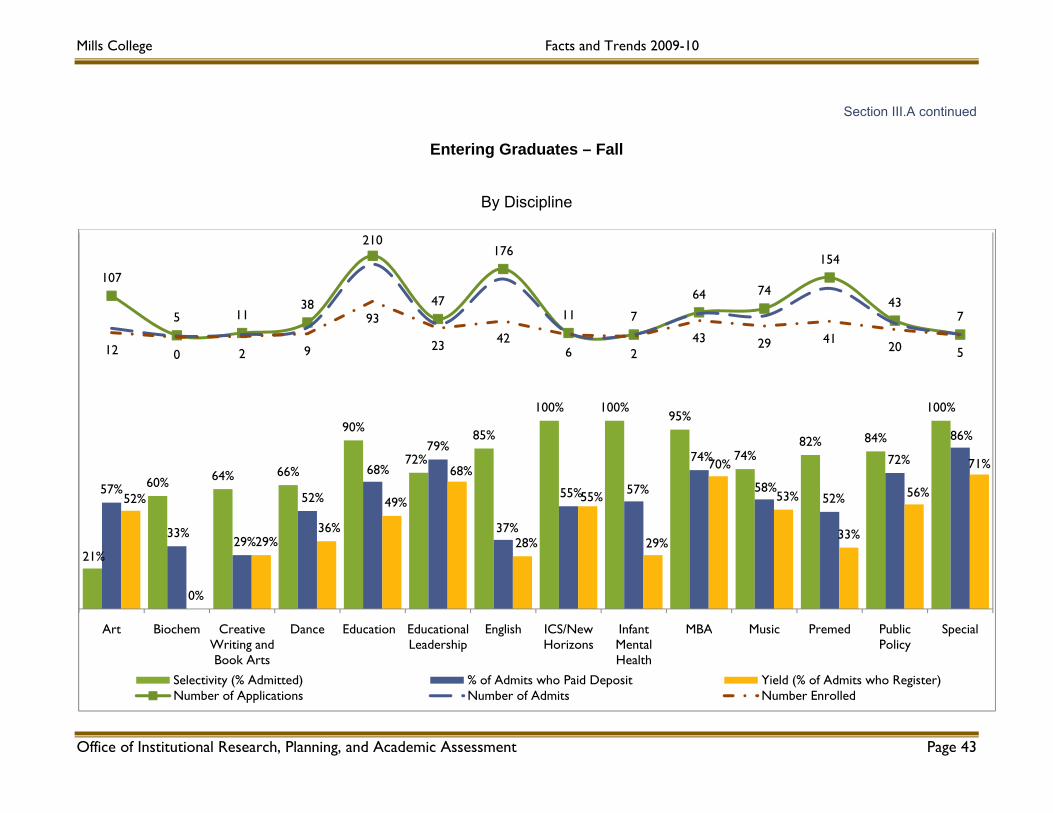
♦ Even with the dramatic increase in applications, the Dance, Education, Infant Mental Health and Premed programs showed decreases in the number of applicants. The Studio Art, English, Interdisciplinary Computer Science, MBA, Music, and Public Policy programs showed increases in applications.
♦ Selectivity (the proportion of applicants that are admitted) tends to be cyclical in the graduate
programs, and admissions in Fall 2009 were more selective at 77% than in the previous year (79%), but less selective than 2006 (76%).1
♦ Art was again the most selective graduate program at Mills; admitting only 21% of applicants for
the Fall 2009 term. The second most selective program was Creative Writing and Book Art, admitting 64% of applicants, followed by Dance, admitting 66%.
♦ Overall graduate yield (the percentage of students accepted who enroll) on admitted students in Fall
2009 was 44%, equal to 2008, but 3% lower than the average of 47% for the five-year period. ♦ Yield on admitted students by discipline was highest for the MBA program at 70%, with the next
highest for the Education Leadership program at 68%, followed by the Public Policy at 56%, Music at 53%, and Art at 52%. All other yields were less than 50%.
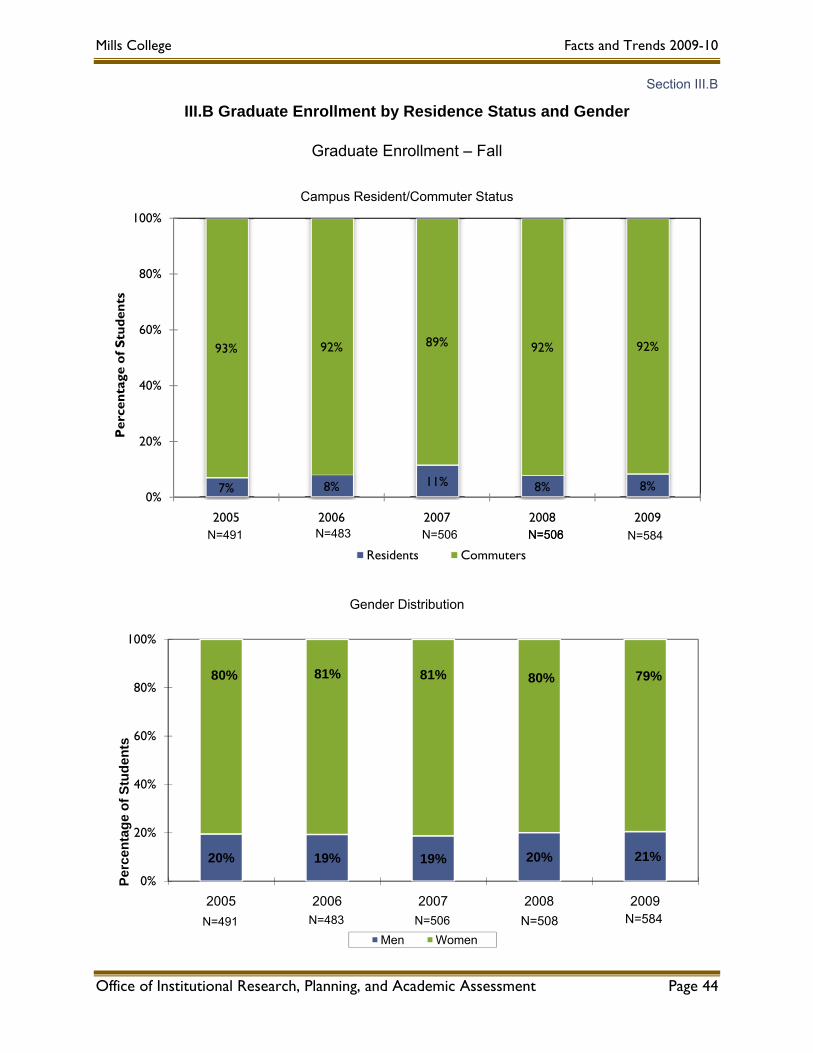
♦ Eight percent of graduate students in Fall 2009 were campus residents, equal to 2008, but 3% lower
than 2007. On-campus residency rates over the 5-year period of 2005 to 2009 have been consistent, except for the high of 11% in 2007.
♦ The proportion of men in the graduate program in 2009 increased 2% over the past 4 years, from
19% to 21%. The 2008 level was 20%. The highest proportions of men are in the music and art programs. The Music program is the only program in which the number of men exceeds the number of women.
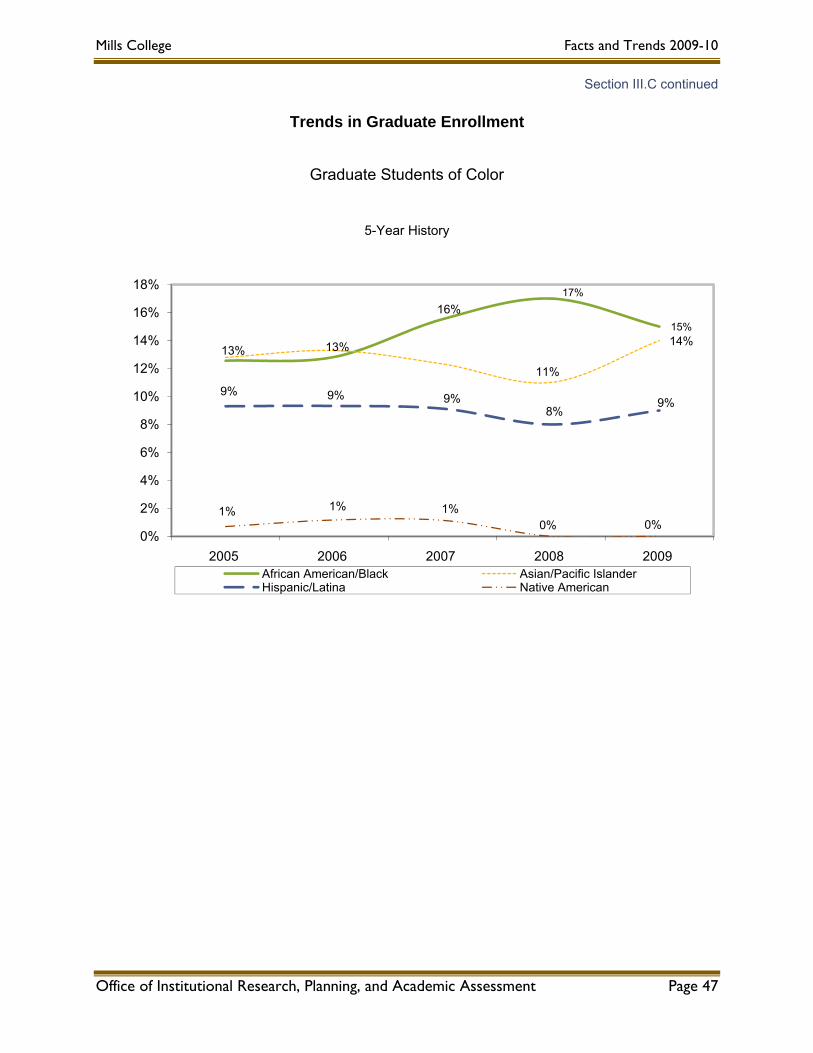
♦ At 584 students, graduate enrollment increased 15% from 2008 and over the last 10 years. ♦ Of those students with known ethnicity, the proportion of students of color increased 2%, from the
36% level in 2008 to 38% in 2009. However, the percentage of those identifying as bi/ multi-racial (not included in the “of color” category) decreased from 12% in 2008 to 9% in 2009.
1 Lower proportions indicate higher selectivity (i.e. fewer students admitted from the applicant pool).
Mills College Facts and Trends 2009-10
Office of Institutional Research, Planning, and Academic Assessment Page 10
Section IV Financial Aid
♦ During the fiscal year 2008-09 undergraduates received a record high of over $28.5 million in financial aid, with more than $15.6 million in aid provided by the college.
♦ The average Mills scholarship awards for First-Year students and transfers in Fall 2009 were $20,436
and $16,788 respectively. These amounts represent a continuing upward trend in scholarship award dollars given to both First-Year and transfer students.
♦ The average Mills scholarship for First-Year students in 2009 was $3,648 more than the average
scholarship for transfer students. ♦ The distribution of income among need-based financial aid recipients shows a decrease of 7% (from
44% to 37%) for families with incomes less than $40,000 and an increase of 4% (from 26% to 30%) for families with incomes over $70,000. The percent of families with incomes between $40,000 and $70,000 increased 1% (from 30% to 31%).
♦ The majority (53%) of self-supporting need-based aid recipients report yearly incomes of $10,000 or
less, the same as 2008. The distribution of aid among the remaining 47% of students with incomes over 10,000 has 12% of the funds going to students with a reported income between $10,000 and $15,000, and 34% to those reporting an income over $15,000. This is compared to 31% going to those in the highest income bracket the year before.
♦ During the year 2008-09 school year, graduate students received $11.9 million in financial aid; over
$3.6 million was in Mills aid alone. Mills scholarships increased for graduate students from $2.1 million to $2.4 million, while assistantships decreased from $1.3 million to $1.2 million.
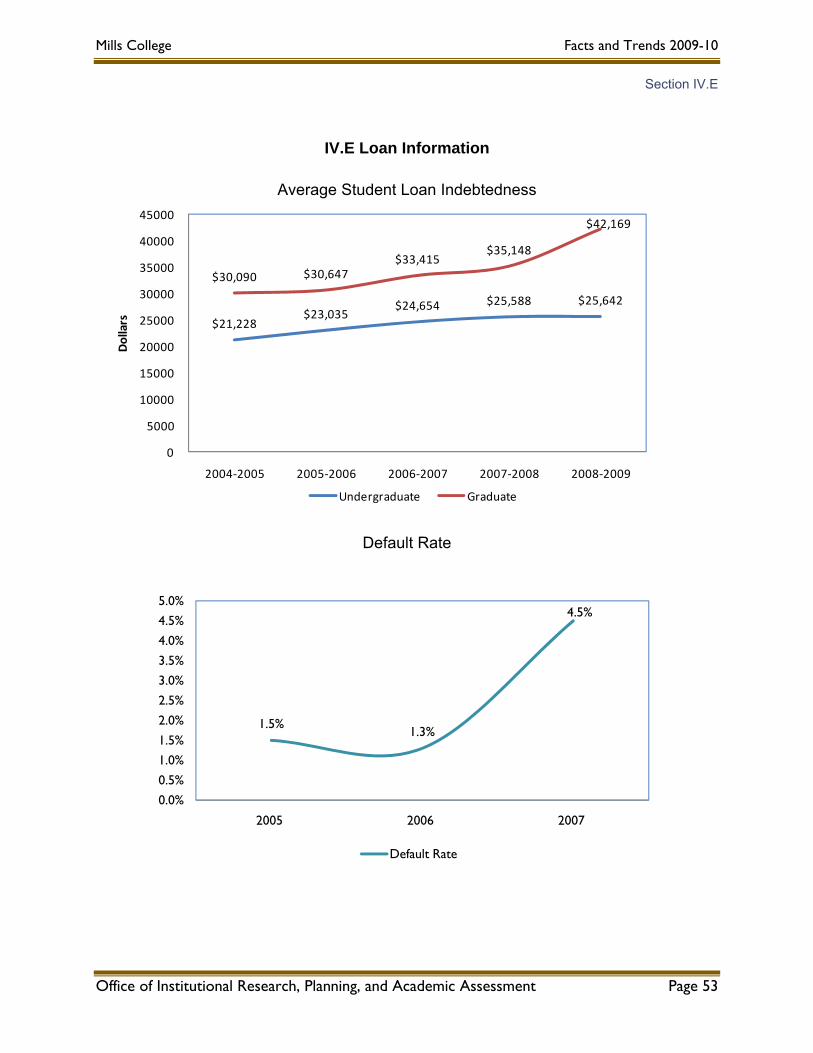
♦ The current average debt level for undergraduates is $25,642, and for graduates $42,169. This
represents an increase of $4,414 for undergraduate students and $12,079 for graduate students over the last five years.
♦ The number of students in repayment decreased from 439 to 422 between 2006 and 2007.
♦ Mills default rate has increased 246% from 1.3% to 4.5% between 2006 and 2007. The 4.5% rate is
.9% higher than the average for four-year private institutions but 2.2% lower than the national average and 2% lower than State of California colleges.
Section V Curriculum and Academic Support Services ♦ 693 course titles were offered in the 2008-09 academic year with a total of 822 class sections. This is
an increase of 91 course titles and a decrease of 15 sections over the 2007-08 academic year . ♦ The average class size was 15 students, compared to 14 in the 2007-08 academic year. 30% of
courses had more than 12 students, which is equal to the 2007-08 academic year. 16% of courses had an enrollment of greater than 20 students, also the same as the 2007-08 year.
♦ The FTE student to faculty ratio (including both undergraduate and graduate students) for Fall 2009 increased from 11:1 to 12:1, based on a student FTE of 1,417 and faculty FTE of 122.
♦ The largest undergraduate programs at Mills as measured by the number of declared majors in Fall
2009 were: Undergraduate
English (62 majors) Psychology (49 majors) Political Legal and Economic Analysis (30 majors) Child Development (26 majors)
Mills College Facts and Trends 2009-10
Office of Institutional Research, Planning, and Academic Assessment Page 11
Ethnic Studies (22 majors)
♦ The largest increases in undergraduate majors were in ethnic studies (13), economics (8), music (7), literary and cultural studies (4), and child development (4), while the largest decreases were in art history (11), anthropology/sociology (7), computer science (3), and history (3).
♦ The largest graduate programs at Mills as measured by the number of declared majors in Fall 2009
were: Graduate Masters in Business Administration- MBA (85 majors) Teaching-Credential Preparation and MA (78 majors)
English Writing MFA (69 majors) Post-Baccalaureate Pre-Medical Certificate Program (53 participants)
Doctor of Education in Leadership- Ed.D. (47 majors)
♦ The largest increases in graduate programs were in Masters in Public Policy (18), Masters in Business Administration (17) and Teaching Credential (17) and Music Performance and Literature (9), and English literature (6). The only notable decrease in graduate programs is in English, Writing (10).
♦ Academic support services at Mills include: Academic Technical Services, the Art Museum, the Center for Contemporary Music, the F.W. Olin Library, Computing Services, and the Center for Academic Excellence (Writing Center and Peer Tutoring).
♦ At the F.W. Olin Library, total volumes in the collection, volumes added, and circulation were
stable, while bound and electronic full-text subscriptions continue to increase. While database searches have increased, reference questions decreased to their lowest level in the last five years.
Section VI Personnel ♦ In 2009-10, Mills had a total of 421.51 FTE staff and faculty positions, an increase of .17 FTE from
2008-09.
♦ The largest increase in FTE (+4.08) occurred among the Professional staff. The largest decrease (-2.12) occurred in the area of clerical staff. Faculty decreased 1.97 FTE and administration increased by 1.70 FTE.
♦ The two largest groups of employees were faculty (128.22 FTE) and professional employees
(103.58 FTE).
♦ Non-core FTE decreased 3.23 FTE from the Institute for Civic Leadership (-1.00), NSF-biology (-1.84) and Other Educational Research (-.55).
♦ The division with the greatest number of faculty was Letters with 31.74 FTE positions, followed by
Social Sciences with 29.31 FTE, Natural Sciences and Mathematics with 28.42, Fine Arts with 23.72 FTE and Education with 15.03 FTE.
♦ Seventy-one percent of the full-time faculty was tenured, up 2% from Fall 2008, and another 11%
were in tenure track positions, consistent with Fall 2008. ♦ Women made up 62% of full-time and 70% of part-time faculty, continuing the growth in this area over
the past few years. ♦ Twenty-five percent of full-time and part-time were faculty of color, consistent with Fall 2008.
Mills College Facts and Trends 2009-10
Office of Institutional Research, Planning, and Academic Assessment Page 12
Section VII Fund-Raising ♦ The fundraising peak was in the 2004-05 school year with $31.5 million received by the college, in
part due to an ongoing capital campaign. The total raised in 2008-09 was $3.3 million less than 2007-08, but higher than the $17.2 raised in 2006-07.
♦ Estates represent 49% of the total raised at $8.9 million in 2008-09, compared to the 39% they
represented last year at $8.3 million. It appears that, with estates stable but still representing half the funds raised, that other funds are decreasing, most notably foundations (-3.6 million) alumnae funds (-$.8 million) trustees (-.34 million) and parents (-.08 million). Areas of increase are friends (+1.9 million) and corporations (+.34 million).
♦ Other than gifts to the “current” fund (54%), most gifts were given to the Plant Fund (27%) and the
Endowment Fund (19%). However, these represented a significantly lower percentage of the total than last year at -12% and -9% respectively.
♦ A total of 78% of funds were designated as unrestricted; a 12% increase over the previous year.
♦ $8.9 million was received in bequests and planned gifts, a modest $0.1 million increase from the
previous year. ♦ Even with a lower average, Mills continued to outperform other women’s colleges in fundraising
during the 2008-09 year with and average of $18.2 million compared to the $13.4 million average among private women’s liberal arts colleges. We are also well above the average for Masters Private institutions (+$10.3 million) and Liberal Arts Private institutions (+$8.7 million). Averages for all groups decreased from 2007-08 to 2008-09.
♦ Total alumnae giving decreased from $3 million to $1.9 million between 2007-08 and 2008-09 .
♦ While 26% of Mills Bachelors degree alumnae donate to the college, only 9% of the graduate alumnae do so.
Section VIII Financial Summary ♦ Mills ended the 2008-09 year with $72.7 million in revenues and $62.3 million in expenses, resulting
in a $10.4 million excess in revenues, compared to a $5.8 deficiency of revenues last year. ♦ Forty-eight percent of the College’s net assets were unrestricted, which is 1% higher last year .
♦ The proportion of temporarily restricted assets increased from 13% in FY 2008 to 22% in FY 2009.
♦ Mills endowment market value decreased from $211 million in 2008 to $157 million in 2009.
♦ The College continued to allocate endowment assets primarily in equity funds (28% in U.S. equity and 21% in non-U.S. equity funds).
♦ The largest source of operating funds was tuition and fees (48%), although this was a decrease from
53% the previous year. ♦ Exactly half (50%) of all operating funds were applied to salaries and benefits, and an additional 26%
was used for student financial aid, a 2% increase from last year.

Mills College Facts and Trends 2009-10
Office of Institutional Research, Planning, and Academic Assessment Page 13
Section IX Comparative Data on Higher Education ♦ California lagged behind the nation in percentages of students enrolled in 4-year post-secondary
institutions (public or private). ♦ Post-secondary enrollment of minority students is larger in California than in the nation as a whole;
41.2% of the students enrolled at private 4-year institutions in California were minorities, an increase of .3% over the previous year.
♦ SAT scores among California high school students and high school students nationwide are
comparable. ♦ The average tuition and fees for a California private 4-year institution continues to be higher than the
national average by approximately $3,000. The average annual salary of full-time professors at California private 4-year universities is $16,728 higher than the national average.
♦ The graduation rate for women in California is 6% higher at 65.2% than the national average of
59.2%. ♦ Mills ranks eleventh out of the 14 institutions used for tuition price comparison.
Mills College Facts and Trends 2009-10
Office of Institutional Research, Planning, and Academic Assessment Page 14
SECTION I: OVERVIEW
Section I.A Enrollment Trends: Undergraduate, Graduate and Total
Section I.B On-Campus Residence Trends
Section I.C Geographic Distribution of Students
Mills College Facts and Trends 2009-10
Section I.A
I.A Enrollment Trends: Undergraduate, Graduate and Total
Fall Semester Undergraduate Enrollment
881
927948 973
926
824.92
876.00 890.50
936.79
881.72
600
650
700
750
800
850
900
950
1000
1050
1100
2005 2006 2007 2008 2009
Num
ber
of S
tude
nts
Head Count FTE
Fall Semester Graduate Enrollment
491 483506 508
584
456.38436.26
457.13469.63
542.75
300
350
400
450
500
550
600
650
700
2005 2006 2007 2008 2009
Num
ber
of S
tude
nts
Head Count FTE
Office of Institutional Research, Planning, and Academic Assessment Page 15
Mills College Facts and Trends 2009-10
Section I.A
Enrollment Trends: Undergraduate, Graduate and Total
Fall Semester Total Enrollment
1372 1410 1454 1481 1510
1281.30 1312.26 1347.631406.42 1424.47
0
200
400
600
800
1000
1200
1400
1600
1800
2005 2006 2007 2008 2009
Num
ber
of S
tude
nts
Head Count FTE
Office of Institutional Research, Planning, and Academic Assessment Page 16
Mills College Facts and Trends 2009-10
Section I.B
I.B On-Campus Residence Trends
5-Year History
491525
590 582 565
457 475
532 543517
34 50 58 39 48
0
100
200
300
400
500
600
700
2005 2006 2007 2008 2009
Num
ber
of S
tude
nts
Total Undergraduate Graduate
Office of Institutional Research, Planning, and Academic Assessment Page 17

Mills College Facts and Trends 2009-10
Section I.C
I.C Geographic Distribution of Students
Fall 2009
United States Undergraduate Graduate Foreign Countries Undergraduate Graduate
American Samoa Canada 1Alabama 1 China 5Alaska 1 1 FranceArizona 5 2 Guatemala 1Arkansas 1 Hong Kong 2California 711 489 IcelandColorado 7 2 India 1Connecticut 4 4 Italy 1Delaware Japan 2District of Columbia 1 Korea (South) 1 2Florida 2 5 Lebanon 1Georgia 1 1 Malaysia 1Guam Pakistan 1Hawaii 15 3 SenegalIdaho 3 1 SingaporeIllinois 11 3 SlovakiaIndiana 2 South AfricaIowa 1 1 Sri LankaKansas 1 Sweden 1 1Kentucky 2 3 Taiwan 1 2Louisiana ThailandMaine 3 TurkeyMaryland 2 UgandaMassachusetts 11 6 United KingdomMichigan 4Minnesota 7 2Mississippi 2Missouri 1 2Montana 2Nebraska 1Nevada 4 1New HampshireNew Jersey 2New Mexico 5 2New York 12 8North Carolina 1North Dakota 1Ohio 2 2OklahomaOregon 27 4Pennsylvania 3 4Rhode Island 1South Carolina 1South Dakota 1TennesseeTexas 10 1Utah 1Vermont 2Virginia 1 3Virgin IslandsWashington 28 2West Virginia 1Wisconsin 2 1WyomingTotal 895 565 12 12
Percentage of students with known geographic information: 98% Total number of states, zones, territories, and districts represented: 45Total number of foreign countries represented: 13
Office of Institutional Research, Planning, and Academic Assessment Page 18
Mills College Facts and Trends 2009-10
Office of Institutional Research, Planning, and Academic Assessment Page 19
SECTION II: UNDERGRADUATE ADMISSIONS AND ENROLLMENT
Section II.A Overall Selectivity and Yield
Section II.B Admissions and Enrollment by Type
First-Year Students
Transfer Students
Section II.C First-Year Student SAT Scores
Enrolled First-Year Students Compared to National Averages
Mills’ Middle 50% SAT Scores
Section II.D High School GPA
Enrolled First-Year Students
Section II.E Trends in Undergraduate Enrollment
Section II.F Undergraduate Students of Color
Headcount
Enrollment Trend
Section II.G Undergraduate Resuming Students
Section II.H Undergraduate First Generation Students
First-Year First Generation Selectivity and Yield
Transfer First Generation Selectivity and Yield
Percent of First Generation Undergraduates by Cohort
Section II.I Persistence Rates
First-Year Students
Transfer Students
First-Year First Generation Students

Mills College Facts and Trends 2009-10
Office of Institutional Research, Planning, and Academic Assessment Page 20
Section II.J Graduation Rates
First-Year Students
6-Year Graduation Rates
First-Year Students
Transfer Students
Graduation Rate Distribution
First-Year Students
Transfer Students
First-Year Pell Grant Recipients
Mills College Facts and Trends 2009-10
Section II.A
II.A Overall Undergraduate Selectivity and Yield
77% 75% 74%66%
60%
49%41% 40%
34% 33%42%
36% 35% 33%26%
1034
1256 1300 1476
1823
797 942 957 974
1102
335 336 332 322 291
2005 2006 2007 2008 2009
Selectivity (% Admitted)% of Admits who Paid DepositYield (% of Admits who Register)Number of Completed ApplicationsAdmittedEnrolled
Office of Institutional Research, Planning, and Academic Assessment Page 21

Mills College Facts and Trends 2009-10
Section II.B
II.B Admissions and Enrollment by Type
First-Year Selectivity and Yield
Transfer Selectivity and Yield
77% 74% 73% 66% 57%34% 28% 27% 26% 19%
783 976 1030
1177
1519
604 727 750 776 862
207 200 199 202 162
2005 2006 2007 2008 2009
Selectivity (% Admitted) Yield (% of Admits who Register)
Number of Completed Applications Admitted
Enrolled
77% 77% 77%66%
79%66% 63% 64% 61%
54%
251 280 270 299 304
193 193 207 198 240
128 136 133 120 129
2005 2006 2007 2008 2009
Selectivity (% Admitted) Yield (% of Admits who Register)
Number of Completed Applications Admitted
Enrolled
Office of Institutional Research, Planning, and Academic Assessment Page 22

Mills College Facts and Trends 2009-10
Section II.C
II.C First-Year Student SAT Scores
Average Math Scores
546 551
544 549
542
514
516
519 518 520
498 500 503 501 504
460
480
500
520
540
560
580
600
2001 2002 2003 2004 2005
Mills National National - Women
Average Verbal Scores
589
571
582 588
598
508 508 503 502 502 505 505 502 502 500
460
480
500
520
540
560
580
600
2005 2006 2007 2008 2009
Mills National National - Women
Office of Institutional Research, Planning, and Academic Assessment Page 23
Mills College Facts and Trends 2009-10
Section II.C continued
First-Year Student SAT Scores
Average Writing Scores
576 571 584
497 494 494
502 500 501
460
480
500
520
540
560
580
600
2005 2006 2007 2008 2009
Mills National National - Women
Mills’ Middle 50% SAT Scores
Percentile 2005 2006 2007 2008 2009Verbal 25% 520 500 520 520 530
75% 660 640 640 650 650
Math 25% 490 470 490 490 50075% 600 590 610 590 600
Writing 25% N/A N/A 500 520 53075% N/A N/A 630 620 630
Combined 25% 1010 970 1510 1530 157075% 1260 1230 1880 1860 1870
Office of Institutional Research, Planning, and Academic Assessment Page 24

Mills College Facts and Trends 2009-10
Section II.D
II.D High School GPA
Entering First-Year Students
7% 5% 7% 6% 4%
34% 37% 28% 29%22%
58% 57%60% 65%
74%
3.64 3.58 3.61 3.65 3.7
2005 2006 2007 2008 2009
2.00 - 2.49 2.50 - 2.99 3.00 - 3.49 3.50 - 4.00 Average G.P.A.
Office of Institutional Research, Planning, and Academic Assessment Page 25

Mills College Facts and Trends 2009-10
Section II.E
II.E Trends in Undergraduate Enrollment and Residence
YEAR TOTAL Entering Continuing Total Entering Continuing Total UNDERGRADUATE
1965 7 25 32 227 450 677 7091966 24 23 47 226 457 683 7301967 11 31 42 206 466 672 7141968 15 32 47 322 373 695 7421969 38 39 77 279 407 686 763
1970 71 67 138 309 405 714 8521971 71 203 274 265 368 633 9071972 65 157 222 227 421 648 8701973 75 171 246 261 372 633 8791974 84 167 251 232 368 600 851
1975 88 166 254 232 382 614 8681976 68 180 248 245 347 592 8401977 76 150 226 213 403 616 8421978 72 186 258 208 385 593 8511979 58 169 227 221 371 592 819
1980 49 172 221 188 367 555 7761981 51 150 201 205 381 586 7871982 30 138 168 204 369 573 7411983 48 120 168 210 337 547 7151984 43 122 165 212 362 574 739
1985 56 139 195 193 379 572 7671986 39 161 200 209 365 574 7741987 42 158 200 245 365 610 8101988 40 122 162 221 366 587 7491989 50 165 215 184 378 562 777
1990 42 162 204 214 356 570 7741991 66 151 217 191 362 555 7721992 78 182 260 182 328 510 7741993 112 227 339 204 278 482 8241994 100 269 369 203 291 494 863
1995 * * 386 * * 485 8711996 83 327 410 194 262 456 8661997 76 306 382 153 237 390 7721998 79 268 347 171 226 397 7441999 66 277 343 154 236 397 733
2000 65 247 312 173 206 379 6912001 90 232 322 152 248 400 7222002 76 251 327 186 250 436 7632003 86 268 354 165 216 381 7352004 94 259 353 181 228 409 762
2005 121 303 424 245 212 457 8812006 94 312 406 237 269 506 9122007 91 314 405 238 288 526 9312008 95 331 426 227 320 547 9732009 91 318 409 198 319 517 926
* Unavailable
COMMUTING RESIDENT
Note: Data prior to 2002 reflect "tuition-paying" students. In order to provide a more comprehensive count, data as of 2002 have been updated to reflect the total headcount. Students away on exchange are counted as commuting.
Office of Institutional Research, Planning, and Academic Assessment Page 26
Mills College Facts and Trends 2009-10
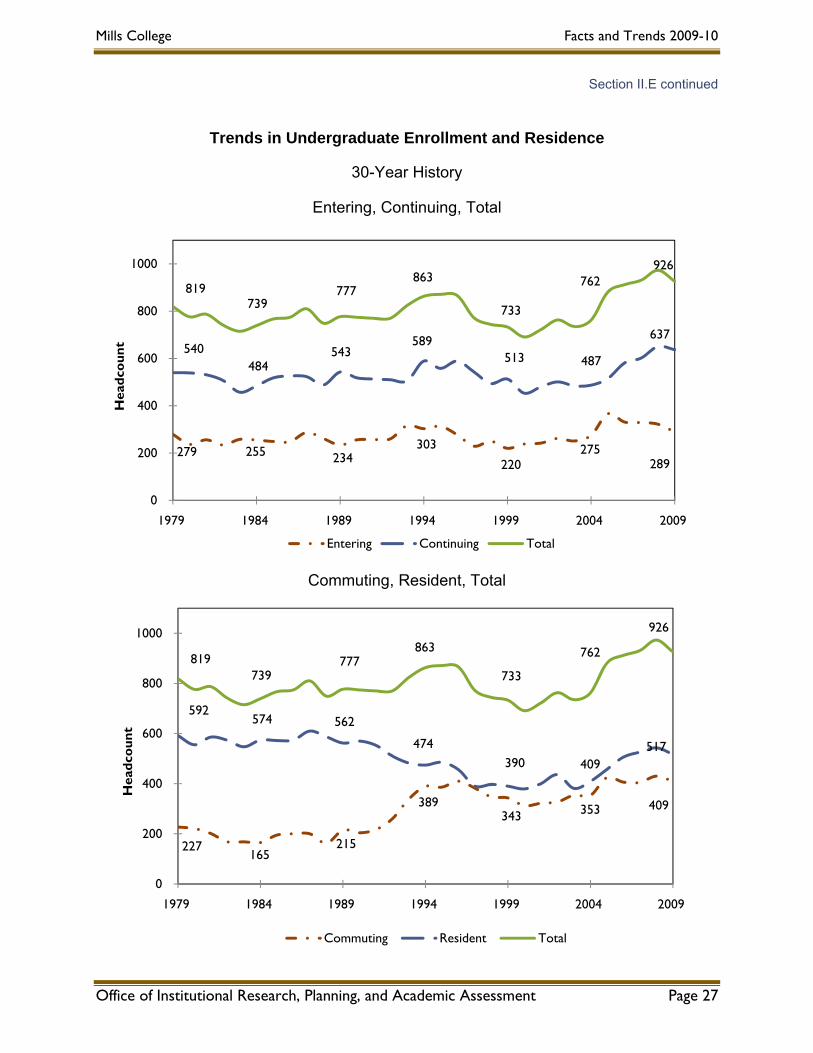
Section II.E continued
Trends in Undergraduate Enrollment and Residence
30-Year History
Entering, Continuing, Total
Commuting, Resident, Total
279 255 234 303
220 275
289
540 484
543 589
513 487
637
819 739
777 863
733
762 926
0
200
400
600
800
1000
1979 1984 1989 1994 1999 2004 2009
Hea
dcou
nt
Entering Continuing Total
227 165
215
389 343 353 409
592 574 562
474 390 409
517
819 739
777 863
733
762
926
0
200
400
600
800
1000
1979 1984 1989 1994 1999 2004 2009
Hea
dcou
nt
Commuting Resident Total
Office of Institutional Research, Planning, and Academic Assessment Page 27

Mills College Facts and Trends 2009-10
Section II.F
II.F Undergraduate Students of Color
5-Year History
2005 2006 2007 2008 2009White Students
U.S. Number 399 416 402 421 356
International Number 5 3 4 1 0
Total 404 419 406 422 356
Percent 53% 51% 48% 48% 45%
Multi-EthnicU.S. Number 106 123 121 123 123
International Number 4 2 0 0 0
Total 110 125 121 123 123
Percent 14% 15% 14% 14% 16%
Total Students of ColorU.S. Number 230 247 299 298 293
International Number 22 27 18 33 30
Total 252 274 317 331 313
Percent 33% 33% 38% 38% 40%
African American/BlackU.S. Number 71 72 91 89 87
International Number 1 1 1 0 0
Total 72 73 92 89 87
Percent 9% 9% 11% 10% 11%
Asian/Pacific IslanderU.S. Number 70 73 73 71 64
International Number 8 14 6 15
Total 78 87 79 86 71
Percent 10% 11% 9% 10% 9%
Hispanic/LatinaU.S. Number 78 93 126 131 132
International Number 13 12 11 18 11
Total 91 105 137 149 143
Percent 12% 13% 16% 17% 18%
Native AmericanTotal 11 9 9 7
Percent 1% 1% 1% 1% 1%
Total Known Ethnicity 766 818 844 876 792
7
10
Office of Institutional Research, Planning, and Academic Assessment Page 28
Mills College Facts and Trends 2009-10
Section II.F continued
Undergraduate Students of Color
5-Year History
9% 9%
11%10%
11%10%
11%
9%10% 9%
12%13%
16%17%
18%
1% 1% 1% 1% 1%
0%
2%
4%
6%
8%
10%
12%
14%
16%
18%
20%
2005 2006 2007 2008 2009
African American Asian/Pacific Islander Hispanic/Latina Native American
Office of Institutional Research, Planning, and Academic Assessment Page 29
Mills College Facts and Trends 2009-10
Section II.G
II.G Undergraduate Resuming Students
5-Year History
205 211 203
193 188
138 142 140
125 125
67 69 63 68 63
0
40
80
120
160
200
240
280
2005 2006 2007 2008 2009
Hea
dcou
nt
Total Resumers Continuing Resumers Entering Resumers
Office of Institutional Research, Planning, and Academic Assessment Page 30
Mills College Facts and Trends 2009-10
Section II.H
II.H Undergraduate First Generation Students
First-Year First Generation Selectivity and Yield
49% 51%41%
33%28% 24% 27%18%
509 511
693
1011
2006 2007 2008 2009
Percent Admitted First‐Year FG Yield First‐Year FG (% Admits Who Enroll)
First‐Year First Generation Applied First‐Year First‐Generation Admitted
First‐Time First‐Generation Enrolled
Transfer First Generation Selectivity and Yield
60%67% 64% 64%
70% 65%54% 54%
116 81 78 96
70 54 50 61
49 35 27 33
2006 2007 2008 2009
Percent Admitted Transfer FG Yield Transfer FG (% Admits Who Enroll)
Transfer First Generation Applied Transfer First Generation Admitted
Transfer First Generation Enrolled
Office of Institutional Research, Planning, and Academic Assessment Page 31

Mills College Facts and Trends 2009-10
Section II.H continued
Undergraduate First Generation Students
Percent of First Generation Students by Cohort
35%32%
37% 37%37%
26%23%
26%
0%
10%
20%
30%
40%
50%
2006 2007 2008 2009
Percent First‐Years who are First Generation
Percent of Transfers who are First Generation
Office of Institutional Research, Planning, and Academic Assessment Page 32

Mills College Facts and Trends 2009-10
Section II.I
II.I Persistence Rates
Persistence Rates of First-Time First-Year Students
Fall 2005 Fall 2006 Fall 2007 Fall 2008 Fall 2009
2001 113 7 6%2002 137 86 63% 2 1%2003 115 79 69% 63 55% 6 5%2004 135 101 75% 89 66% 85 63% 8 6%2005 184 131 71% 110 60% 105 57% 93 51%2006 185 136 74% 117 63% 105 57%2007 185 137 74% 122 66%2008 188 144 77%
First to Second Year Persistence Rates
First-Year Student Cohorts
78%
80% 81%
72%
83%
75%
71%74% 74%
77%
60%
65%
70%
75%
80%
85%
90%
1999 2000 2001 2002 2003 2004 2005 2006 2007 2008
Cohort Year
Office of Institutional Research, Planning, and Academic Assessment Page 33

Mills College Facts and Trends 2009-10
Section II.I continued
Persistence Rates
First to Second Year Persistence Rates
Transfer Student Cohorts
First Year First Generation Student Cohorts
75%
68%
76%
60%
65%
70%
75%
80%
85%
90%
2006 2007 2008
83%
79%
84%
76%
80%
72%
74%
76%
78%
80%
82%
84%
86%
2004 2005 2006 2007 2008
Office of Institutional Research, Planning, and Academic Assessment Page 34
Mills College Facts and Trends 2009-10
Section II.I continued
Persistence Rates
First to Second Year Persistence Rates
First Year Pell Grant Recipient Cohorts
87%
71%
79%78%
73%72% 71%
80%
60%
65%
70%
75%
80%
85%
90%
2001 2002 2003 2004 2005 2006 2007 2008
Second to Third Year Persistence Rates
First-Year Student Cohorts
83% 82%85% 86%
89%
60%
65%
70%
75%
80%
85%
90%
95%
2003 2004 2005 2006 2007
Office of Institutional Research, Planning, and Academic Assessment Page 35
Mills College Facts and Trends 2009-10
Section II.I continued Persistence Rates
Second to Third Year Persistence Rates
Transfer Student Cohorts
46%42%
36% 35%29%
40% 41%
43% 40% 43%
10%
20%
30%
40%
50%
60%
70%
80%
90%
2003 2004 2005 2006 2007
2nd Yr Retention Rate 2-Yr Graduation Rate
First-Year First Generation Cohorts
83%
79%
60%
65%
70%
75%
80%
85%
90%
2006 2007
Office of Institutional Research, Planning, and Academic Assessment Page 36

Mills College Facts and Trends 2009-10
Section II.I continued
Persistence Rates
Second to Third Year Persistence Rates
First-Time First-Year Pell Grant Recipient Cohorts
85%
93%90% 91%
79%83%
76%
60%
65%
70%
75%
80%
85%
90%
95%
100%
2001 2002 2003 2004 2005 2006 2007
Office of Institutional Research, Planning, and Academic Assessment Page 37
Mills College Facts and Trends 2009-10
Section II.J
II.J Graduation Rates
Graduation Rates of First-Time First-Year Students
Graduated by # of Graduated by # of Graduated by # of Graduated by # of Graduated by # of
Aug-05 % years Aug-06 % years Aug-07 % years Aug-08 % years Aug-09 % years
1999 121 4 69% 62000 123 9 67% 5 3 69% 62001 113 58 51% 4 6 57% 5 0 57% 62002 138 74 54% 4 9 60% 5 1 61% 62003 115 61 53% 4 6 58% 5 4 62% 62004 135 68 50% 4 12 59% 52005 184 102 55% 4
Ent
erin
g C
ohor
t
Six Year Graduation Rates
First-Time First-Year Student Cohorts
59%
65% 66%69%
65%
69% 69%
57%
61% 62%
40%
45%
50%
55%
60%
65%
70%
75%
80%
1994 1995 1996 1997 1998 1999 2000 2001 2002 2003
Office of Institutional Research, Planning, and Academic Assessment Page 38
Mills College Facts and Trends 2009-10
Section II.J continued
Graduation Rates
Six Year Graduation Rates
Transfer Student Cohort
85% 87%
71%
77%
75%
0%
10%
20%
30%
40%
50%
60%
70%
80%
90%
100%
1999 2000 2001 2002 2003
Graduation Rate Distribution
First-Time First-Year Students
Office of Institutional Research, Planning, and Academic Assessment Page 39
53%59% 59%
51% 54% 53% 50% 55%
11%7% 7%
5%7% 5% 9%
2%3% 2%
1% 3%
1998 1999 2000 2001 2002 2003 2004 2005
Grad 4 Yrs Grad 5 Yrs Grad 6 Yrs
Mills College Facts and Trends 2009-10
Section II.J continued Graduation Rates
Graduation Rate Distribution
Transfer Students
44% 36% 38% 42% 40% 41% 43% 40% 43%
29% 41%26%
29%25% 26% 26%
22%
12% 10%
6%7%
10% 7% 4%
1999 2000 2001 2002 2003 2004 2005 2006 2007
Grad 2-Yr Grad 3-Yr Grad 4-Yr
First-Time First-Year Pell Grant Recipients
64%55% 51%
59% 55%
5%
8%5%
5%3%
3%
2001 2002 2003 2004 2005
Grad 4 Yrs Grad 5 Yrs Grad 6 Yrs
Office of Institutional Research, Planning, and Academic Assessment Page 40
Mills College Facts and Trends 2009-10
Office of Institutional Research, Planning, and Academic Assessment Page 41
SECTION III: GRADUATE ADMISSIONS AND ENROLLMENT
Section III.A Entering Graduates – Fall
Applied, Admitted, Paid Deposit, and Registered by Discipline
Section III.B Graduate Enrollment by Residence Status and Gender
Section III.C Trends in Graduate Enrollment
Graduate Enrollment 20-year History
Graduate Students of Color 5-year History

Mills College Facts and Trends 2009-10
Section III.A
III.A Entering Graduates – Fall
Applied, Admitted, Paid Deposit, and Registered
65%76% 81% 79% 77%
55%48% 47% 46% 45%
52% 47% 46% 44% 44%
716 645 640762
954
465 487 518605
733
243 227 237269 322
2005 2006 2007 2008 2009
Selectivity (% Admitted) % of Admits who Paid DepositYield (% of Admits who Register) Number of ApplicationsAdmitted Enrolled
Office of Institutional Research, Planning, and Academic Assessment Page 42
Mills College Facts and Trends 2009-10
Section III.A continued
Entering Graduates – Fall
By Discipline
21%
60% 64% 66%
90%
72%
85%
100% 100%95%
74%82% 84%
100%
57%
33%29%
52%
68%
79%
37%
55% 57%
74%
58%52%
72%
86%
52%
0%
29%36%
49%
68%
28%
55%
29%
70%
53%
33%
56%
71%
107
5 1138
210
47
176
11 7
64 74
154
43 7
12 0 2 9
93
23 42 6 2
43 29 41 20 5
Art Biochem Creative Writing and Book Arts
Dance Education Educational Leadership
English ICS/New Horizons
Infant Mental Health
MBA Music Premed Public Policy
Special
Selectivity (% Admitted) % of Admits who Paid Deposit Yield (% of Admits who Register)Number of Applications Number of Admits Number Enrolled
Office of Institutional Research, Planning, and Academic Assessment Page 43
Mills College Facts and Trends 2009-10
Section III.B
III.B Graduate Enrollment by Residence Status and Gender
Graduate Enrollment – Fall
Campus Resident/Commuter Status
7% 8% 11% 8% 8%
93% 92% 89% 92% 92%
0%
20%
40%
60%
80%
100%
2005 2006 2007 2008 2009
Per
cent
age
of S
tude
nts
Residents Commuters
N=491 N=506N=483 N=506 N=584N=508
Gender Distribution
20% 19% 19% 20% 21%
80% 81% 81% 80% 79%
0%
20%
40%
60%
80%
100%
2005 2006 2007 2008 2009
Perc
enta
ge o
f Stu
dent
s
Men WomenN=491 N=483 N=506 N=508 N=584
Office of Institutional Research, Planning, and Academic Assessment Page 44

Mills College Facts and Trends 2009-10
Section III.C
III.C Trends in Graduate Enrollment
20-Year History
137152
202
255
322
127 152197
239262
264304
399
494584
0
100
200
300
400
500
600
1989 1994 1999 2004 2009
Entering Continuing Total
Office of Institutional Research, Planning, and Academic Assessment Page 45

Mills College Facts and Trends 2009-10
Section III.C continued Trends in Graduate Enrollment
Graduate Students of Color
5-Year History
2005-06 2006-07 2007-08 2008-09 2009-10White Students
U.S. Number 248 243 241 230 266International Number 1 0 0 3 5Total 249 243 241 233 271Percent 58% 57% 55% 53% 55%
Multi-EthnicU.S. Number 29 29 30 52 44International Number 0 0 0 0 0Total 29 29 30 52Percent 7% 7% 7% 12% 9%
Total Students of ColorU.S. Number 147 144 160 154 180International Number 5 13 7 3 5Total 152 157 167 157 185Percent 35% 37% 38% 36% 38%
African American/BlackU.S. Number 54 54 68 72 73International Number 0 1 0 1 1Total 54 55 68 73Percent 13% 13% 16% 17% 15%
Asian/Pacific IslanderU.S. Number 50 46 47 45 63International Number 5 11 7 2 4Total 55 57 54 47Percent 13% 13% 12% 11% 14%
Hispanic/LatinaU.S. Number 40 39 40 36 44International Number 0 1 0 0 0Total 40 40 40 36Percent 9% 9% 9% 8% 9%
Native AmericanTotal 3 5 5 1Percent 1% 1% 1% 0% 0% Total Known Ethnicity 430 429 438 442 492
44
74
67
44
0
Office of Institutional Research, Planning, and Academic Assessment Page 46
Mills College Facts and Trends 2009-10
Section III.C continued
Trends in Graduate Enrollment
Graduate Students of Color
5-Year History
13%
16%17%
15%
13%
11%
14%
9% 9% 9%8%
9%
1% 1% 1%0% 0%
0%
2%
4%
6%
8%
10%
12%
14%
16%
18%
2005 2006 2007 2008 2009 African American/Black Asian/Pacific IslanderHispanic/Latina Native American
Office of Institutional Research, Planning, and Academic Assessment Page 47

Mills College Facts and Trends 2009-10
Office of Institutional Research, Planning, and Academic Assessment Page 48
SECTION IV: FINANCIAL AID
Section IV.A Undergraduate Financial Aid
Sources and Recipients
Section IV.B Entering Undergraduate Financial Aid
Average Mills Scholarship Award Compared with Cost of Attendance
Section IV.C Distribution of Need-Based Grant and Scholarship Recipients
Section IV.D Graduate Financial Aid
Sources and Recipients
Section IV.E Loan Information
Average Debt Level
Default Rate
Number of Students in Repayment

Mills College Facts and Trends 2009-10
Section IV.A
IV.A Undergraduate Financial Aid
Sources and Recipients
FY 2004 – FY 2009
SOURCE 2003-04 # 2004-05 # 2005-06 # 2006-07 # 2007-08 # 2008-09 #
MILLS Schlrships/Grants $3,153,392 365 $3,808,310 421 $5,209,542 493 $5,122,139 571 $5,921,146 590 $5,465,352 622 Acad/Merit Awards 3,052,613 453 3,754,696 523 $5,325,672 602 $6,897,847 724 $8,916,024 735 $9,306,995 754 Loans 80,300 49 100,550 57 $135,400 75 $179,080 93 $147,350 91 $305,012 100 NDSL/Perkins 17,312 178 17,312 163 0 0 0 0 0 0 0 0 Employment 356,125 189 264,639 214 $275,138 229 $284,169 237 $276,195 230 $569,075 285 CWS TOTAL $6,659,742 $7,945,507 $10,945,752 $12,483,235 $15,260,715 $15,646,434
FEDERAL Pell $761,926 286 $887,360 312 $1,041,386 364 $1,034,734 382 $1,194,152 392 $1,302,576 375 SEOG 252,350 225 208,550 220 $221,650 234 $236,922 255 $265,500 270 $291,884 281 NDSL/Perkins 337,082 178 273,973 163 $334,950 190 $414,123 236 $284,954 224 $169,768 134 CWS 224,030 156 284,439 167 $286,415 198 $259,808 175 $212,071 218 $212,689 141 Robert C. Byrd 4,500 3 3,000 2 $5,250 4 $1,500 1 $0 0 $0 0 Veterans Educ. Ben. 18,465 4 16,422 3 $3,854 2 $21,017 4 $45,010 7 $43,293 National Service 16,519 4 12,341 4 $6,806 3 $10,967 4 $0 0TOTAL $1,614,872 $1,686,085 $1,900,311 $1,979,071 $2,001,687 $2,020,210
STATE Cal Grant A 1,138,087 125 983,062 113 $1,279,480 160 $1,531,337 179 $1,687,347 193 $1,924,130 215 Cal Grant B 465,243 50 593,443 63 $638,799 76 $678,848 84 $797,415 91 $766,934 91 Other 83,649 33 45,098 43 $91,999 35 $119,980 39 $43,521 8 $30,214 12TOTAL $1,686,979 $1,621,603 $2,010,278 $2,330,165 $2,528,283 $2,721,278
OTHER Schlrships/Grants $220,060 58 $232,746 67 $240,336 79 $282,052 88 $376,474 87 $526,373 104 Stafford Loan 2,069,907 474 2,311,373 523 $2,539,719 722 $2,739,237 686 $2,637,162 588 $2,712,255 609 Unsubsidized Staffrd 1,020,565 247 1,471,005 310 $4,192,224 448 $3,624,079 417 $2,058,000 337 $2,431,064 576 PLUS/Parent Loan 752,474 64 1,011,723 70 $1,160,929 81 $1,508,624 92 $1,387,191 91 $1,236,030 81 Other Loans 460,770 42 645,866 65 $887,320 78 $993,930 80 $1,126,165 84 $1,263,794 116 TOTAL $4,523,776 $5,672,713 $9,020,528 9,147,922 7,584,992 8,169,516
GRAND TOTAL $14,485,369 $16,925,908 $23,876,869 $25,940,392 $27,375,677 $28,557,438
Office of Institutional Research, Planning, and Academic Assessment Page 49

Mills College Facts and Trends 2009-10
Section IV.B
IV.B Entering Undergraduate Financial Aid
Average Mills Scholarship Award Compared with Cost of Attendance
Fall 2005 – Fall 2009
41418 44580
47530 49852 51186
27750 30300
32542 34170 35196
16561 15763 19522
20100 20436
13114 15177 16569
15638 16788
0
10000
20000
30000
40000
50000
60000
2005 2006 2007 2008 2009
Cost of Attendance
Tuition
First-year Student Average Scholarship Award
Transfer Average Scholarship Award
Cost of attendance includes tuition, fees, room and board, books, supplies, and personal expenses for resident students from California.
Office of Institutional Research, Planning, and Academic Assessment Page 50

Mills College Facts and Trends 2009-10
Office of Institutional Research, Planning, and Academic Assessment Page 51
Section IV.C
IV.C Undergraduate Financial Aid
Distribution of Need-Based Aid Grant and Scholarship Recipients
2007-08 and 2008-09 Final
Dependent Student Percent Average Average AverageFamily Income Recipients Mills Outside Total
2008-09
$0-10,000 14% $7,731 $14,042 $21,773$10,001-20,000 3% $9,082 $11,177 $20,259$20,001-30,000 8% $10,529 $10,997 $21,526$30,001-40,000 12% $8,572 $10,568 $19,140$40,001-50,000 8% $7,520 $9,814 $17,334$50,001-60,000 14% $7,255 $6,381 $13,636$60,001-70,000 9% $10,015 $7,149 $17,164
Over $70,000 30% $5,565 $3,077 $8,642
2007-08
$0-10,000 15% $10,830 $12,544 $23,374$10,001-20,000 7% $9,312 $8,075 $17,387$20,001-30,000 9% $10,077 $10,983 $21,060$30,001-40,000 13% $8,540 $8,069 $16,609$40,001-50,000 10% $7,671 $7,545 $15,216$50,001-60,000 11% $7,318 $7,625 $14,943$60,001-70,000 9% $8,844 $5,270 $14,114
Over $70,000 26% $6,114 $1,614 $7,728
Self-Supp. Student Percent Average Average AverageFamily Income Recipients Mills Outside Total
2008-09
$0-5,000 35% $6,661 $10,248 $16,909$5,001-10,000 18% $7,950 $7,937 $15,887
$10,001-15,000 12% $8,422 $4,702 $13,124Over $15,000 34% $8,193 $2,792 $10,985
2007-08
$0-5,000 36% $7,658 $9,962 $17,620$5,001-10,000 22% $9,015 $5,911 $14,926
$10,001-15,000 11% $9,576 $5,293 $14,869Over $15,000 31% $9,088 $3,121 $12,209

Mills College Facts and Trends 2009-10
Office of Institutional Research, Planning, and Academic Assessment Page 52
Section IV.D
IV.D Graduate Financial Aid
Sources and Recipients FY 2005 - FY 2009
SOURCE 2004-05 # 2005-06 # 2006-07 # 2007-08 # 2008-09 #MILLS Schlrships/Grants $1,241,717 274 $1,155,724 298 $1,311,450 284 $2,102,400 260 $2,421,854 360 Assistantships 1,297,525 154 1,501,061 139 1,687,125 149 1,325,150 99 1,172,070 99 Residence Awards 0 0 0 0 0 0 0 0 0 0 Employment 79,157 41 86,163 37 38,443 14 27,054 17 49,224 38 CWS 0 0 9191 5 0 0 0 0 0 0 TOTAL $2,618,399 $2,752,139 $3,037,018 $3,454,604 $3,643,148FEDERAL CWS 1,997 1 2,200 2 990 2 7,865 5 9,226 6PATHWAYS 78,800 26 82,205 15 58,100 24 0 0 0 0TOTAL $80,797 $84,405 $59,090 $7,865 $9,226STATE & FEDERALFELLOWSHIPS Cal Grant A (Tch.Crd.) 0 0 0 0 0 0 0 0 0 0 Cal Grant T 0 0 0 0 0 0 0 0 0 0 California Gov Tch. Flwshp 0 0 0 0 0 0 0 0 0 0 National Service 35,378 9 1000 1 10,715 4 8,933 2 40,070 6 TOTAL $35,378 $1,000 $10,715 $8,933 $40,070OTHER Schlrships/Grants $18,133 8 $41,498 7 $14,000 2 $49,158 6 $60,878 11 Subsidized Stafford 2,295,489 300 2,230,454 283 3,325,175 110 3,912,124 171 2,738,625 364 Unsubsidized Stafford 2,617,492 298 2,592,342 86 3,312,512 143 3,922,250 165 3,735,905 333 PLUS 10,000 1 14,500 1 510,124 45 844,125 45 1,131,283 92 Other Loans 298,258 29 514,617 40 259,240 219,817 12 508,585 31 TOTAL $5,239,372 $5,393,411 $7,421,051 $8,947,474 $8,175,276
GRAND TOTAL $7,973,946 $8,230,955 $10,527,874 $12,418,876 $11,867,720
Mills College Facts and Trends 2009-10
Section IV.E
IV.E Loan Information
Average Student Loan Indebtedness
$21,228$23,035
$24,654 $25,588 $25,642
$30,090 $30,647$33,415
$35,148
$42,169
0
5000
10000
15000
20000
25000
30000
35000
40000
45000
2004‐2005 2005‐2006 2006‐2007 2007‐2008 2008‐2009
Dollars
Undergraduate Graduate
Default Rate
1.5% 1.3%
4.5%
0.0%0.5%1.0%1.5%2.0%2.5%3.0%3.5%4.0%4.5%5.0%
2005 2006 2007
Default Rate
Office of Institutional Research, Planning, and Academic Assessment Page 53
Mills College Facts and Trends 2009-10
Section IV.E continued Loan Information
Number of Students in Repayment
422 439
422
250
300
350
400
450
500
2005 2006 2007
Students in Repayment
Default Rate Comparisons
4.5%
1.0%1.1%
1.9%
0.0%
1.4%1.4%
3.0%
0.0%
0.9%
0.0%
3.6%
2.4%2.7%
6.7%
3.6%
6.0%
0.0%
2.0%
4.0%
6.0%
8.0%
2007 Federal Stafford Loan Default Rate
Office of Institutional Research, Planning, and Academic Assessment Page 54
Mills College Facts and Trends 2009-10
Office of Institutional Research, Planning, and Academic Assessment Page 55
SECTION V: CURRICULUM AND ACADEMIC SUPPORT SERVICES
Section V.A Curriculum Overview for Regular Courses by Discipline
Section V.B Semester Enrollments and Credit Hours by Discipline
Section V.C Graduated and Declared Majors by Discipline
Section V.D Academic Support Services and F.W. Olin Library

Mills College Facts and Trends 2009-10
Section V.A
V.A Curriculum Overview for Regular Courses
By Discipline
Fall 2008 and Spring 2009 Course Course Credit Total Avg % Course % Course % CourseTitles Sections Hours Class Class Sections Sections Sections
Subject Offered Taught Generated Enrol Size <=12 > 12 > 20------------------------------ ------- -------- --------- ----- ----- -------- -------- --------Education 81 95 1181.50 1327 14 36% 49% 15%
EDUCATION 81 95 1181.50 1327 14 36% 49% 15%
Art History 13 13 247.50 247 19 15% 54% 31%Dance 43 44 247.00 505 11 52% 48% 0%Intermedia Arts 8 8 74.25 75 9 75% 25% 0%Media Studies (see Letters)Music 52 67 1288.00 644 10 75% 19% 6%Studio Art 37 45 327.25 376 8 71% 29% 0%College Seminars 2 2 33.00 33 17 0% 100% 0%
FINE ARTS 155 179 2217.00 1880 12 48% 46% 6%
Arabic 0 0 0.00 0 0 0% 0% 0%Book Arts 7 7 76.00 76 11 86% 14% 0%Chinese 0 0 0.00 0 0 0% 0% 0%English 83 122 1440.25 1535 13 51% 40% 9%Ethnic Studies 19 19 370.25 367 19 32% 37% 31%French Lang & Lit 9 9 100.00 101 11 67% 33% 0%Letters 10 10 132.00 138 14 40% 50% 10%Modern Lang & Lit (See French, Spanish, Chinese and Arabic)Spanish Lang & Lit 12 16 156.00 161 10 56% 44% 0%Women's Studies 8 9 160.75 160 18 33% 22% 45%College Seminar* 6 7 86.00 468 67 14% 43% 43%*includes COLL 005 online course
LETTERS 154 199 2521.25 3006 16 38% 28% 14%
Biology 20 23 454.75 414 18 35% 22% 43%Biochemistry 3 3 19.00 19 6 100% 0% 0%Chemistry 13 22 433.00 372 17 41% 27% 32%Physics 3 5 125.00 107 21 40% 40% 20%Environmental Science 3 3 46.50 44 15 67% 0% 33%Computer Science 10 11 104.00 115 10 82% 9% 9%Mathematics 18 27 249.25 356 13 59% 15% 26%Psychology 28 31 643.25 636 21 36% 19% 45%College Seminar 3 3 44.00 44 15 33% 67% 0%
NATURAL SCIENCES 101 128 2118.75 2107 15 55% 22% 23%
Anthropology 12 12 372.25 377 31 17% 8% 75%Business Administration 24 31 408.00 409 13 39% 45% 16%Economics 30 34 690.75 698 21 32% 30% 38%Government 14 14 286.25 287 21 29% 14% 57%History 18 18 285.00 287 16 33% 39% 28%ICL 1 1 8.00 8 8 100% 0% 0%Philosophy 11 11 162.50 164 15 46% 18% 36%Public Policy 14 14 187.00 242 17 50% 7% 43%Social Science 4 4 57.50 55 14 50% 50% 0%Sociology 13 13 248.75 243 19 31% 31% 38%College Seminar 4 4 64.50 65 16 50% 25% 25%
SOCIAL SCIENCES 145 156 2770.50 2835 17 43% 24% 32%
Physical Education 57 65 188.50 869 13 51% 35% 14%NON-DIVISIONAL 57 65 188.50 869 13 51% 35% 14%
GRAND TOTALS 693 822 10997.50 12024 15 55% 30% 16% Faculty/Student Ratio For Fall 2009, the number of full-time equivalent students was 1,417. The core salary FTE for faculty was 122. The student/faculty ratio, including both undergraduate and graduate students, was 12:1 (i.e., 12 student FTEs for each 1 faculty member FTE).
Office of Institutional Research, Planning, and Academic Assessment Page 56

Mills College Facts and Trends 2009-10
Office of Institutional Research, Planning, and Academic Assessment Page 57
Explanation of Enrollments and Majors
(Sections V.B and V.C) Overview of Majors Total undergraduate majors 41 Total disciplines in the Master of Arts program 7 Total disciplines in the Master of Business Administration program 1 Total disciplines in the Master of Fine Arts program 6 Total disciplines in the Master of Public Policy program 1 Total disciplines in the Doctor of Education program 2 Total Teaching Credentials 8 Total non-degree Certificate/Diploma graduate programs 3
Total Semester Enrollments Class totals included in the following charts are calculated after the final grades for each semester have been recorded. Totals include all students who completed courses for credit cumulative to every course taught in each discipline—auditors are not included. These totals include students enrolled in teaching practica, independent studies, internships, and individual music instruction for credit. Totals represent enrollment characteristics for undergraduate and graduate courses combined. Credit Hours Generated The number of credit hours included in the following charts represents the total number of credit hours generated by students who completed courses for credit in each discipline. The courses upon which credit hours are based are the same as those used to calculate class totals. Average Class Size Average class size is calculated by dividing the total enrollment in a core set of courses with the number of sections taught among that core set. Unlike class totals and credit hours, the core set of courses used in this calculation do not include teaching practica, independent studies, internships, and individual music instruction for credit. Declared Majors Declared majors are counted after the second week of each Fall semester and are based on all students registered. Double majors are counted separately under each major. Graduated Majors Graduated majors are counted after May commencement of each year and include those who graduated in absentia in January.
2009 Graduates
PNC BA BS Cert Cred MA MBA MFA MPP EDD TOTAL January 8 52 3 0 0 7 10 8 0 2 90
May 14 195 4 26 44 38 22 57 4 5 409
Total 22 247 7 26 44 45 32 65 4 7 499

Mills College Facts and Trends 2009-10
Section V.B
V.B Enrollment, Credit Hours, Class Sizes by Discipline
Division of Education
Education
845
745749
642697
631662
539698
629
638.0 642.0
587.8 533.5 544.5 552.8
551.5 492.3
592.3 589.3
18 17 16 16 14 13 12 11 1314
0
100
200
300
400
500
600
700
800
900
1000
2004f 2005s 2005f 2006s 2006f 2007s 2007f 2008s 2008f 2009s
Class Totals Credit Hours Ave Class Size
Office of Institutional Research, Planning, and Academic Assessment Page 58

Mills College Facts and Trends 2009-10
Section V.B continued
Enrollment, Credit Hours, Class Sizes by Discipline
Division of Fine Arts
Art History
134
107119
128 127139
125 127
99
148
133.0
107.5 118.8 127.3 126.5
138.8125.3 126.8
100.3
147.3
19 17 14 16 21 3018 18 20 19
0
50
100
150
200
250
2004f 2005s 2005f 2006s 2006f 2007s 2007f 2008s 2008f 2009s
Num
ber o
f Stu
dent
s
Class Totals Credit Hours Average Class Size
Studio Arts
207 207
183 181 178187 192 193 197 194
190.8 178.8 167.5 158.0 163.0 162.8 177.0 172.3 183.8
169.8
7 7 8 8 8 8 10 9 9 8
0
50
100
150
200
250
2004f 2005s 2005f 2006s 2006f 2007s 2007f 2008s 2008f 2009s
Num
ber o
f Stu
dent
s
Class Totals Credit Hours Average Class Size
Office of Institutional Research, Planning, and Academic Assessment Page 59
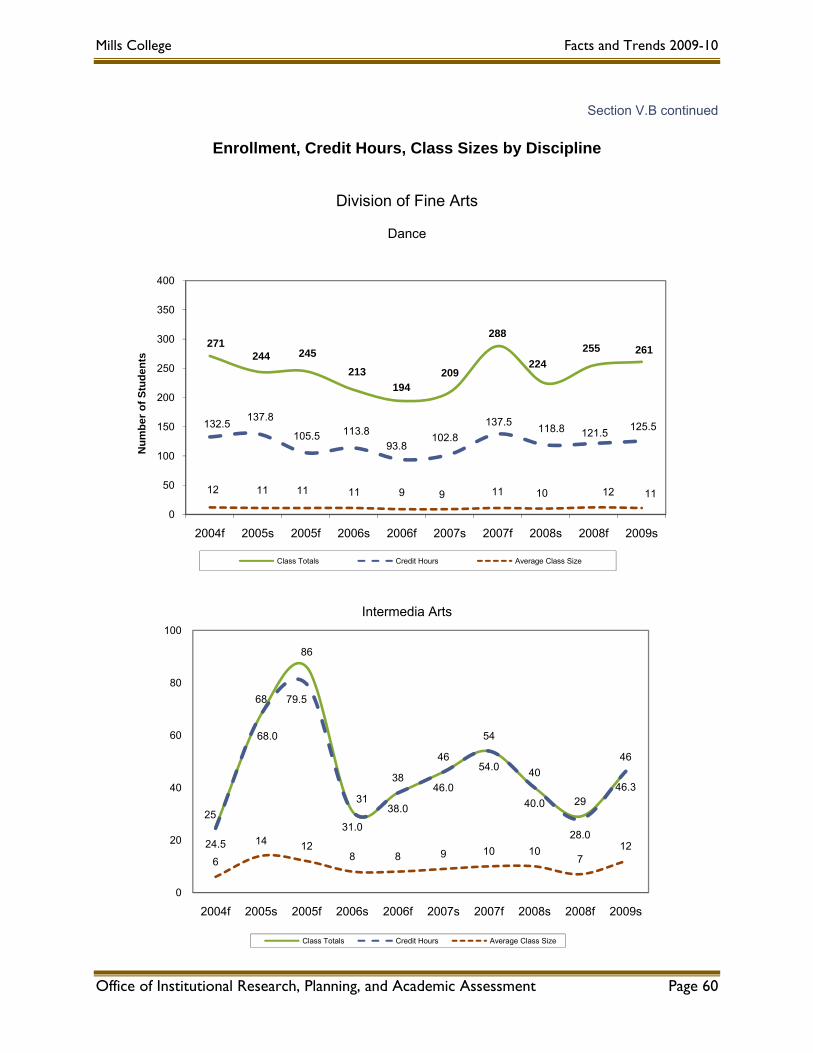
Mills College Facts and Trends 2009-10
Section V.B continued
Enrollment, Credit Hours, Class Sizes by Discipline
Division of Fine Arts
Dance
271244 245
213194
209
288
224255 261
132.5 137.8
105.5 113.893.8
102.8137.5 118.8 121.5 125.5
12 11 11 11 9 9 11 10 12 11
0
50
100
150
200
250
300
350
400
2004f 2005s 2005f 2006s 2006f 2007s 2007f 2008s 2008f 2009s
Num
ber o
f Stu
dent
s
Class Totals Credit Hours Average Class Size
Intermedia Arts
Office of Institutional Research, Planning, and Academic Assessment Page 60
25
68
86
31
38
46
54
40
29
46
24.5
68.0
79.5
31.0
38.0
46.0
54.0
40.0
28.0
46.3
6
14 128 8 9 10 10
712
0
20
40
60
80
100
2004f 2005s 2005f 2006s 2006f 2007s 2007f 2008s 2008f 2009s
Class Totals Credit Hours Average Class Size

Mills College Facts and Trends 2009-10
Section V.B continued
Enrollment, Credit Hours, Class Sizes by Discipline
Division of Fine Arts
Media Studies and Dramatic Arts
0.0
29.0 0.0
20
0.0 0.0 0.0 0.0 0.0
247 175
186 194 0
50
100
150
200
250
300
350
400
2004f 2005s 2005f 2006s 2006f 2007s 2007f 2008s 2008f 2009s
Num
ber o
f Stu
dent
s
Class Totals Credit Hours Average Class Size
Music
290319 333 349
395
377372
361 345308
220.3 249.9
198.3
255.0 261.8251.8
259.8240.5
262.5
210.8
10 14 11 1111 9 11 10 10 9
0
50
100
150
200
250
300
350
400
450
500
2004f 2005s 2005f 2006s 2006f 2007s 2007f 2008s 2008f 2009s
Num
ber o
f Stu
dent
s
Class Totals Credit Hours Average Class Size
Office of Institutional Research, Planning, and Academic Assessment Page 61

Mills College Facts and Trends 2009-10
Section V.B continued
Enrollment, Credit Hours, Class Sizes by Discipline
Division of Letters
Arabic
139
15
411
5
0 0
-20
-10
0
10
20
30
40
50
2005f 2006s 2006f 2007s 2007f 2008s 2008f 2009s
Num
ber o
f Stu
dent
s
Class Totals Credit Hours Ave. Class Size
Book Arts
32 27
36
44 45 45
33
5147
29
32.3 35.5
44.0 45.0 44.0
33.0
49.846.8
29.311 13 12 14 11 11 11 12 12 10
0
10
20
30
40
50
60
70
80
90
100
2004f 2005s 2005f 2006s 2006f 2007s 2007f 2008s 2008f 2009s
Num
ber o
f Stu
dent
s
Class Totals Credit Hours Ave. Class Size
Office of Institutional Research, Planning, and Academic Assessment Page 62

Mills College Facts and Trends 2009-10
Section V.B continued
Enrollment, Credit Hours, Class Sizes by Discipline
Division of Letters
College Seminars*
275
187 227 191
477
148
377
91
0.0 60.047.0
11.032.0
40.046.0
47 48
239
50
136
23
0
100
200
300
400
500
600
2004f 2005s 2005f 2006s 2006f 2007s 2007f 2008s 2008f 2009s
Num
ber o
f Stu
dent
s
Class Totals Credit Hours Ave Class Size
*Includes COLL 005 which has high enrollments and generates 0 credits.
English
Office of Institutional Research, Planning, and Academic Assessment Page 63
656 596
869
655
838
636
775697
856
691
623.8573.8
808.5
629.0
776.3
616.3714.0 667.8
777.0
663.3
12 12 13 13 13 11 12 11 13 12
0
100
200
300
400
500
600
700
800
900
1000
2004f 2005s 2005f 2006s 2006f 2007s 2007f 2008s 2008f 2009s
Num
ber o
f Stu
dent
s
Class Totals Credit Hours Ave Class Size

Mills College Facts and Trends 2009-10
Section V.B continued
Enrollment, Credit Hours, Class Sizes by Discipline
Division of Letters
Ethnic Studies
194
128
214
180
209
165
198
165
209
158186.3
127.8
214.3
172.0
208.3
171.0
198.0
168.3
208.3
162.0
20 21 21 21 23 21 20 20 21 18
0
50
100
150
200
250
300
2004f 2005s 2005f 2006s 2006f 2007s 2007f 2008s 2008f 2009s
Num
ber o
f Stu
dent
s
Class Totals Credit Hours Ave. Class Size
French and Francophone Studies*
*Prior to Fall 2004, courses were listed under Modern Languages
46
33
4942
5549
60
46
63
4045.0
39.5
48.5
41.3
54.349.0
60.0
46.0
62.0
32.014
812 14
18
10 12 11 138
0
10
20
30
40
50
60
70
80
90
100
2004f 2005s 2005f 2006s 2006f 2007s 2007f 2008s 2008f 2009s
Num
ber o
f Stu
dent
s
Class Totals Credit Hours Ave Class Size
Office of Institutional Research, Planning, and Academic Assessment Page 64

Mills College Facts and Trends 2009-10
Section V.B continued
Enrollment, Credit Hours, Class Sizes by Discipline
Division of Letters
Letters
92
10999
147
95
74
101
77 71 6792.0105.0
98.0
139.5
95.0
71.8
101.3
68.3 71.560.5
15 1019 15 19
10 14 10 14 13
0
20
40
60
80
100
120
140
160
180
200
2004f 2005s 2005f 2006s 2006f 2007s 2007f 2008s 2008f 2009s
Num
ber o
f Stu
dent
s
Class Totals Credit Hours Ave Class Size
Spanish and Spanish American Studies*
*Prior to Fall 2004, courses were listed under Modern Languages
72
50
70
57
70
5359
77 75
86
72.0
49.3
69.5
57.0
70.3
53.059.0
76.573.0
83.0
118 10 9 10 9 10 11 9 11
0
10
20
30
40
50
60
70
80
90
100
2004f 2005s 2005f 2006s 2006f 2007s 2007f 2008s 2008f 2009s
Num
ber o
f Stu
dent
s
Class Totals Credit Hours Ave Class Size
Office of Institutional Research, Planning, and Academic Assessment Page 65

Mills College Facts and Trends 2009-10
Section V.B continued
Enrollment, Credit Hours, Class Sizes by Discipline
Division of Natural Sciences and Mathematics
Biology
152115
192
161
204196
233251
231
183164.0
125.8
208.8
176.5
225.8
208.5
251.5267.0 256.5
198.3
16 18 2117 22 18 16 22
18 18
0
50
100
150
200
250
300
2004f 2005s 2005f 2006s 2006f 2007s 2007f 2008s 2008f 2009s
Num
ber o
f Stu
dent
s
Class Totals Credit Hours Ave Class Size
Biochemistry
18
11 10 9
18.0
11.0 10.0 9.0
18
6
10
5
0
10
20
30
40
50
2004f 2005s 2005f 2006s 2006f 2007s 2007f 2008s 2008f 2009s
Num
ber o
f Stu
dent
s
Class Totals Credit Hours Ave Class Size
Office of Institutional Research, Planning, and Academic Assessment Page 66

Mills College Facts and Trends 2009-10
Section V.B continued
Enrollment, Credit Hours, Class Sizes by Discipline
Division of Natural Sciences and Mathematics
Chemistry
161 154
213
158
207
163
193
151
207
165
189.0 170.3
245.8
185.5
233.5
184.8
222.5
177.8
235.8
197.3
20 19 23 17 20 18 16 16 15 21
0
50
100
150
200
250
300
2004f 2005s 2005f 2006s 2006f 2007s 2007f 2008s 2008f 2009s
Num
ber o
f Stu
dent
s
Class Totals Credit Hours Ave Class Size
Chemistry and Physics
207 203
262
199
249
208232
200
251228
246.5 231.3
306.1
236.8
284.0
240.1
271.3
235.8
287.0 271.0
22 22 24 19 20 20 18 16 19 21
0
50
100
150
200
250
300
350
400
2004f 2005s 2005f 2006s 2006f 2007s 2007f 2008s 2008f 2009s
Num
ber o
f Stu
dent
s
Class Totals Credit Hours Ave Class Size
Office of Institutional Research, Planning, and Academic Assessment Page 67
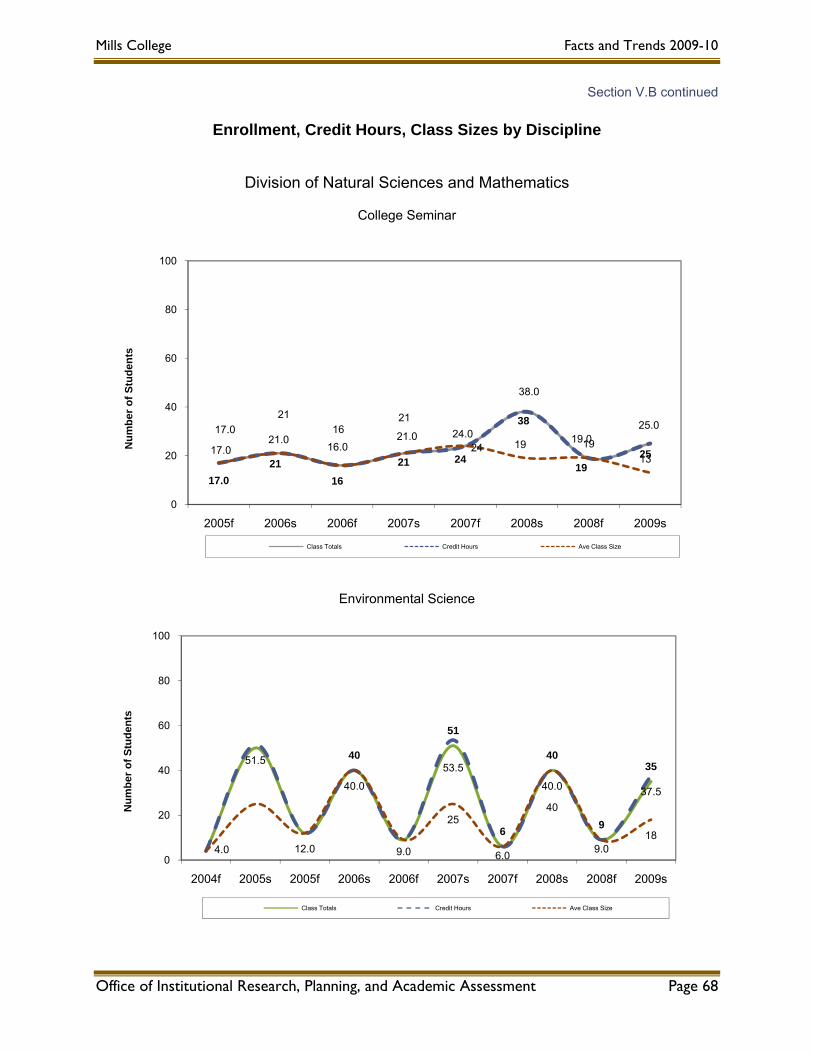
Mills College Facts and Trends 2009-10
Section V.B continued
Enrollment, Credit Hours, Class Sizes by Discipline
Division of Natural Sciences and Mathematics
College Seminar
17.0 21
16
21 24
38
192517.0
21.016.0
21.0 24.0
38.0
19.025.017.0
2116
21
24 19 1913
0
20
40
60
80
100
2005f 2006s 2006f 2007s 2007f 2008s 2008f 2009s
Num
ber o
f Stu
dent
s
Class Totals Credit Hours Ave Class Size
Environmental Science
40
51
6
40
9
35
4.0
51.5
12.0
40.0
9.0
53.5
6.0
40.0
9.0
37.5
2540
18
0
20
40
60
80
100
2004f 2005s 2005f 2006s 2006f 2007s 2007f 2008s 2008f 2009s
Num
ber o
f Stu
dent
s
Class Totals Credit Hours Ave Class Size
Office of Institutional Research, Planning, and Academic Assessment Page 68
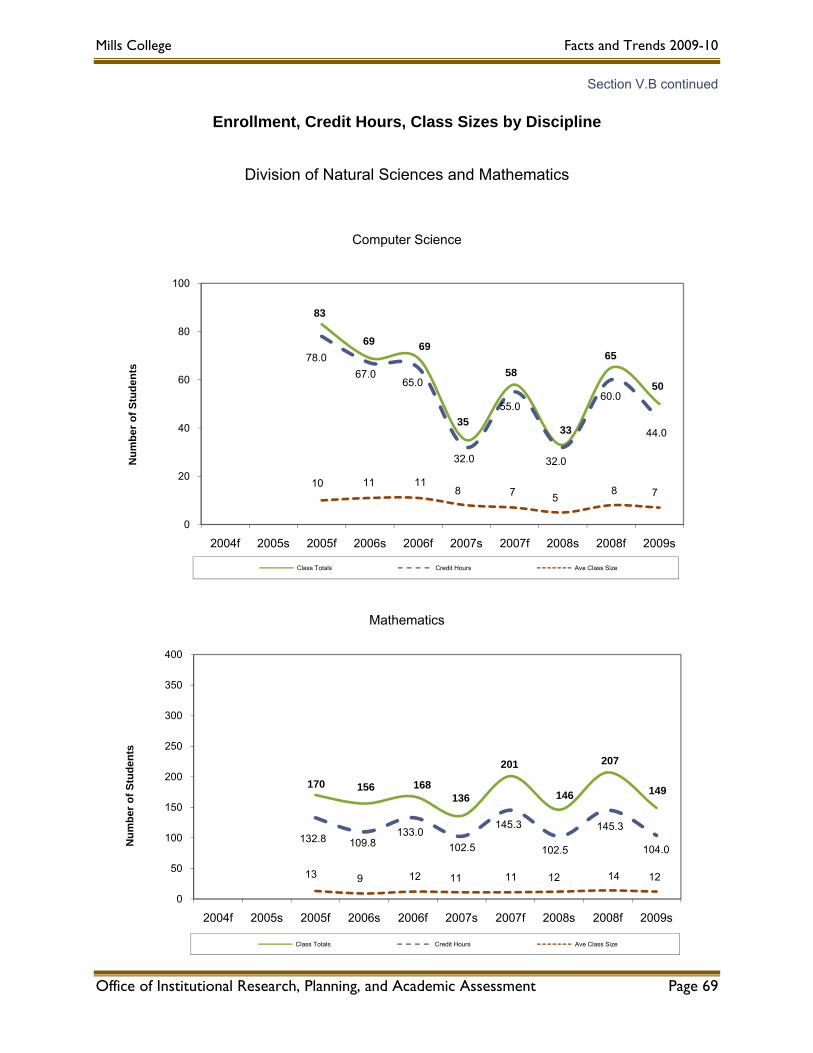
Mills College Facts and Trends 2009-10
Section V.B continued
Enrollment, Credit Hours, Class Sizes by Discipline
Division of Natural Sciences and Mathematics
Computer Science
83
69 69
35
58
33
65
50
78.067.0
65.0
32.0
55.0
32.0
60.0
44.0
10 11 118 7 5
8 7
0
20
40
60
80
100
2004f 2005s 2005f 2006s 2006f 2007s 2007f 2008s 2008f 2009s
Num
ber o
f Stu
dent
s
Class Totals Credit Hours Ave Class Size
Mathematics
170 156 168136
201
146
207
149
132.8 109.8133.0
102.5
145.3
102.5
145.3
104.0
13 9 12 11 11 12 14 12
0
50
100
150
200
250
300
350
400
2004f 2005s 2005f 2006s 2006f 2007s 2007f 2008s 2008f 2009s
Num
ber o
f Stu
dent
s
Class Totals Credit Hours Ave Class Size
Office of Institutional Research, Planning, and Academic Assessment Page 69

Mills College Facts and Trends 2009-10
Section V.B continued
Enrollment, Credit Hours, Class Sizes by Discipline
Division of Natural Sciences and Mathematics
Mathematics and Computer Science
255
180
253225 237
171
259
179
272
199
209.0
135.8
210.8176.8
198.0
134.5
200.3
134.5
205.3
148.0
10 9 12 10 12 10 9 9 11 10
0
50
100
150
200
250
300
350
400
2004f 2005s 2005f 2006s 2006f 2007s 2007f 2008s 2008f 2009s
Num
ber o
f Stu
dent
s
Class Totals Credit Hours Ave Class Size
Physics
4649 49
41 4245
39
4944
6357.5 61.0 60.3
51.3 50.5
55.348.8
58.0
51.3
73.8
23 24 2421 20 22 20
1622 21
0
20
40
60
80
100
2004f 2005s 2005f 2006s 2006f 2007s 2007f 2008s 2008f 2009s
Num
ber o
f Stu
dent
s
Class Totals Credit Hours Ave Class Size
Office of Institutional Research, Planning, and Academic Assessment Page 70

Mills College Facts and Trends 2009-10
Section V.B continued
Enrollment, Credit Hours, Class Sizes by Discipline
Division of Natural Sciences and Mathematics
Psychology
176200
253
327 270
300 296 296
332304
177.0
207.0
254.0
330.8
271.0
304.0 296.0300.3
333.8309.3
2919 27 25 22 21 25 19 21 20
0
50
100
150
200
250
300
350
400
2004f 2005s 2005f 2006s 2006f 2007s 2007f 2008s 2008f 2009s
Num
ber o
f Stu
dent
s
Class Totals Credit Hours Ave Class Size
Office of Institutional Research, Planning, and Academic Assessment Page 71

Mills College Facts and Trends 2009-10
Section V.B continued
Enrollment, Credit Hours, Class Sizes by Discipline
Division of Social Sciences
Anthropology
154 157
204
123
169
205 169195
189 188159.0
159.0
209.8
118.3
170.8
205.8
167.3191.8
186.5185.8
2537
22 2227 33
24 31 3231
0
50
100
150
200
250
300
2004f 2005s 2005f 2006s 2006f 2007s 2007f 2008s 2008f 2009s
Num
ber o
f Stu
dent
s
Class Totals Credit Hours Ave Class Size
Economics
Office of Institutional Research, Planning, and Academic Assessment Page 72
213230
284
346
295308 319
372
341
357
213.3 229.8
280.8
343.8
294.5 307.5318.5
372.3336.3
354.5
23 21 25 26 24 21 21 21 23 19
0
50
100
150
200
250
300
350
400
2004f 2005s 2005f 2006s 2006f 2007s 2007f 2008s 2008f 2009s
Num
ber o
f Stu
dent
s
Class Totals Credit Hours Ave Class Size

Mills College Facts and Trends 2009-10
Section V.B continued
Enrollment, Credit Hours, Class Sizes by Discipline
Division of Social Sciences
Government
142 143134
139
185 174
132140
136
151
142.3 143.0 132.8
139.0
185.3
169.0
132.0 140.3
136.0150.3
20 16 19 1726
16 1914
2319
0
50
100
150
200
2004f 2005s 2005f 2006s 2006f 2007s 2007f 2008s 2008f 2009s
Num
ber o
f Stu
dent
s
Class Totals Credit Hours Ave Class Size
History
90
134138
147 137
121
137 148 167135
90.3
133.5 137.5148.0
136.3121.0
137.0148.3
151.8
133.3
12 15 17 17 17 15 14 18 15 17
0
50
100
150
200
2004f 2005s 2005f 2006s 2006f 2007s 2007f 2008s 2008f 2009s
Num
ber o
f Stu
dent
s
Class Totals Credit Hours Ave Class Size
Office of Institutional Research, Planning, and Academic Assessment Page 73

Mills College Facts and Trends 2009-10
Section V.B continued
Enrollment, Credit Hours, Class Sizes by Discipline
Division of Social Sciences
MBA
160165
221230 238
182
208196
160.0165.0
221.0 228.5237.0
182.0207.0 196.0
1613 16 14 14 14 12
15
0
50
100
150
200
250
300
2004f 2005s 2005f 2006s 2006f 2007s 2007f 2008s 2008f 2009s
Num
ber o
f Stu
dent
s
Class Totals Credit Hours Ave Class Size
Philosophy
70 69 7966 70
10499
5976
88
70.0 69.0 79.0
66.0 70.0
104.099.0
59.075.5
87.0
13 15 13 16 14 21 1911 13 18
0
50
100
150
200
2004f 2005s 2005f 2006s 2006f 2007s 2007f 2008s 2008f 2009s
Num
ber o
f Stu
dent
s
Class Totals Credit Hours Ave Class Size
Office of Institutional Research, Planning, and Academic Assessment Page 74

Mills College Facts and Trends 2009-10
Section V.B continued
Enrollment, Credit Hours, Class Sizes by Discipline
Division of Social Sciences
Public Policy
55
46
60
129 128
112
130
40.0
25.8 36.0
107.5
93.0
84.5
102.5
14 15 12 18 14 19 160
50
100
150
200
2004f 2005s 2005f 2006s 2006f 2007s 2007f 2008s 2008f 2009s
Num
ber o
f Stu
dent
s
Class Totals Credit Hours Ave Class Size
Social Sciences
53
14
30
21
55
2823
29 28 27
53.0
14.0
29.520.8
54.8
28.023.0
29.8 28.0 29.526
14
18
13 11 14 14
0
20
40
60
80
100
2004f 2005s 2005f 2006s 2006f 2007s 2007f 2008s 2008f 2009s
Num
ber o
f Stu
dent
s
Class Totals Credit Hours Ave Class Size
Office of Institutional Research, Planning, and Academic Assessment Page 75

Mills College Facts and Trends 2009-10
Section V.B continued
Enrollment, Credit Hours, Class Sizes by Discipline
Division of Social Sciences
Sociology
101
71
141 115
12473
184
120 157
86102.8
69.8
147.0
114.8
128.3
72.8
185.3
119.5
162.8
86.0
13 1423 19
2512
20 17 2214
0
50
100
150
200
250
300
2004f 2005s 2005f 2006s 2006f 2007s 2007f 2008s 2008f 2009s
Num
ber o
f Stu
dent
s
Class Totals Credit Hours Ave Class Size
Women’s Studies
80
65 63
9399
93
68
55
71
89
76.3
64.5 62.0
93.898.5
93.0
68.3
55.0
71.0
89.8
18 20 19 16 19 1813
18 18 18
0
20
40
60
80
100
120
140
2004f 2005s 2005f 2006s 2006f 2007s 2007f 2008s 2008f 2009s
Num
ber o
f Stu
dent
s
Class Totals Credit Hours Ave Class Size
Office of Institutional Research, Planning, and Academic Assessment Page 76

Mills College Facts and Trends 2009-10
Section V.B continued
Enrollment, Credit Hours, Class Sizes by Discipline
Non-Divisional Physical Education*
297307
337
306322
336 341
308
435 434
74.8
93.8 85.8 91.5
81.0100.3
86.0 89.5 91.0 97.5
11 9 13 12 1411 10 9 14 13
0
50
100
150
200
250
300
350
400
450
500
2004f 2005s 2005f 2006s 2006f 2007s 2007f 2008s 2008f 2009s
Num
ber o
f Stu
dent
s
Class Totals Credit Hours Ave Class Size
*Average class size includes auditors in the case of P.E. since auditing is common in these courses, and required for graduate students. Including the auditors gives a more realistic picture of the actual average class size.
Office of Institutional Research, Planning, and Academic Assessment Page 77
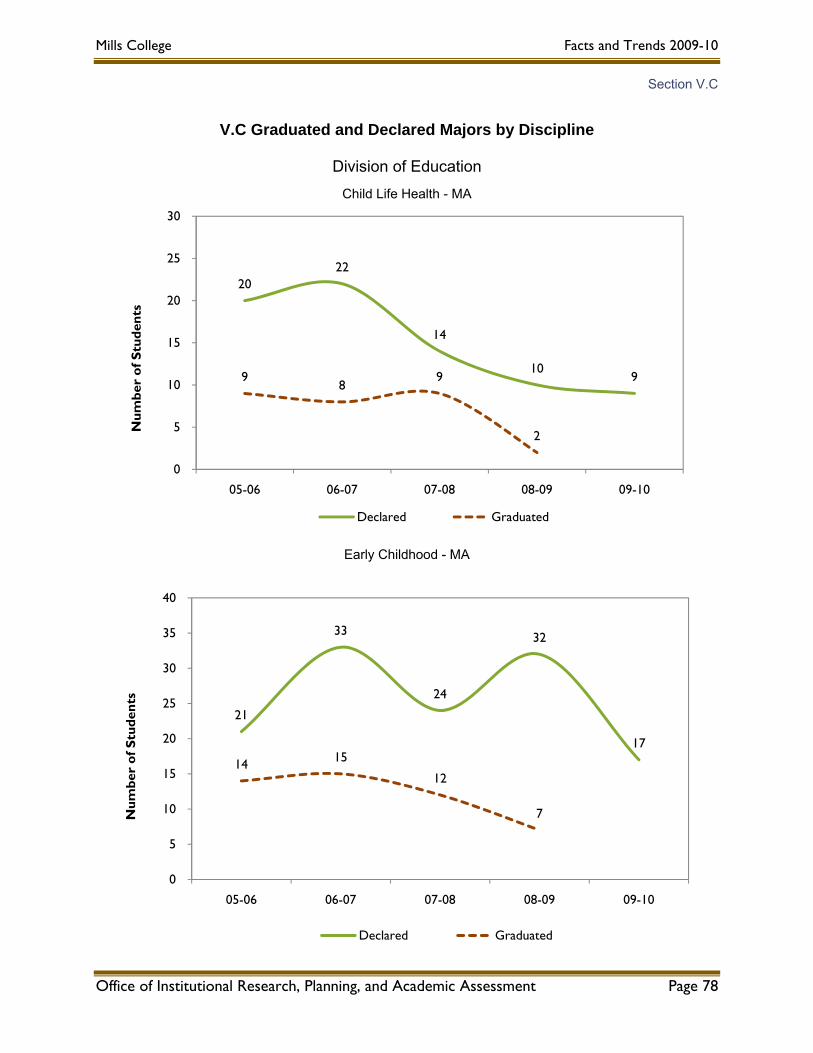
Mills College Facts and Trends 2009-10
Section V.C
V.C Graduated and Declared Majors by Discipline
Division of Education
Child Life Health - MA
20 22
14
10 9 9
8 9
2
0
5
10
15
20
25
30
05-06 06-07 07-08 08-09 09-10
Num
ber
of S
tude
nts
Declared Graduated
Early Childhood - MA
21
33
24
32
17
14 15
12
7
0
5
10
15
20
25
30
35
40
05-06 06-07 07-08 08-09 09-10
Num
ber
of S
tude
nts
Declared Graduated
Office of Institutional Research, Planning, and Academic Assessment Page 78
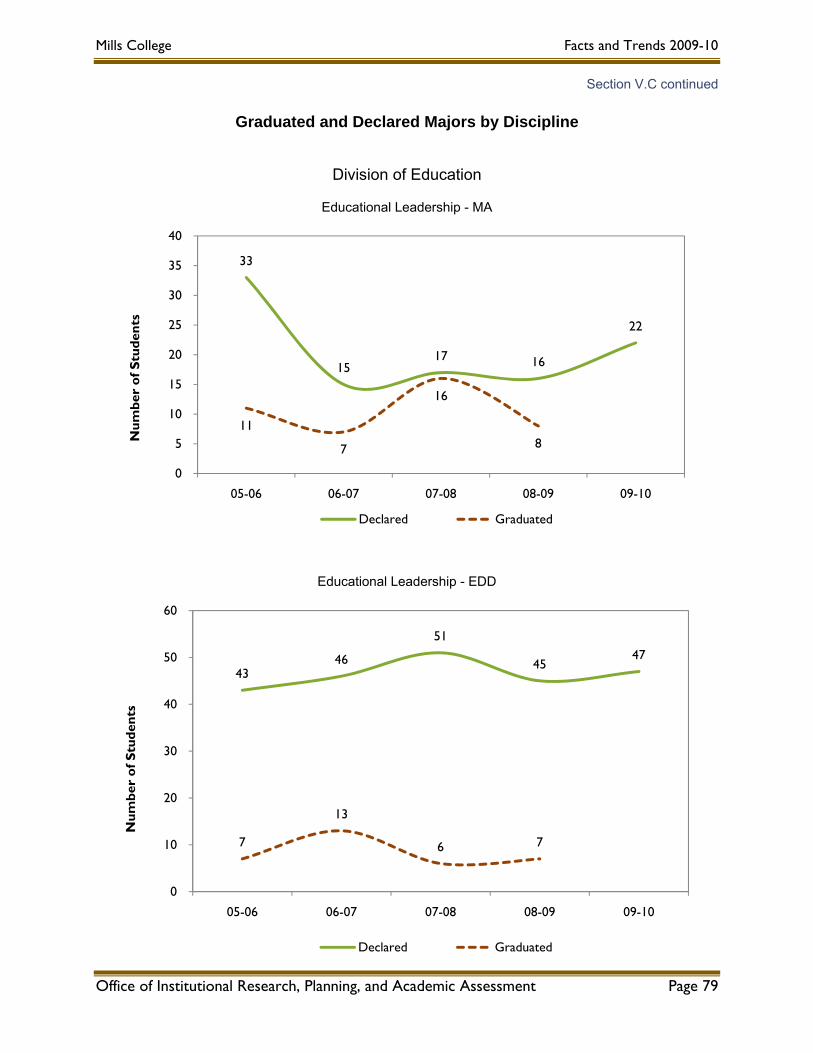
Mills College Facts and Trends 2009-10
Section V.C continued
Graduated and Declared Majors by Discipline
Division of Education
Educational Leadership - MA
33
15 17 16
22
11
7
16
8
0
5
10
15
20
25
30
35
40
05-06 06-07 07-08 08-09 09-10
Num
ber
of S
tude
nts
Declared Graduated
Educational Leadership - EDD
Office of Institutional Research, Planning, and Academic Assessment Page 79
43 46
51
45 47
7
13
6 7
0
10
20
30
40
50
60
05-06 06-07 07-08 08-09 09-10
Num
ber
of S
tude
nts
Declared Graduated
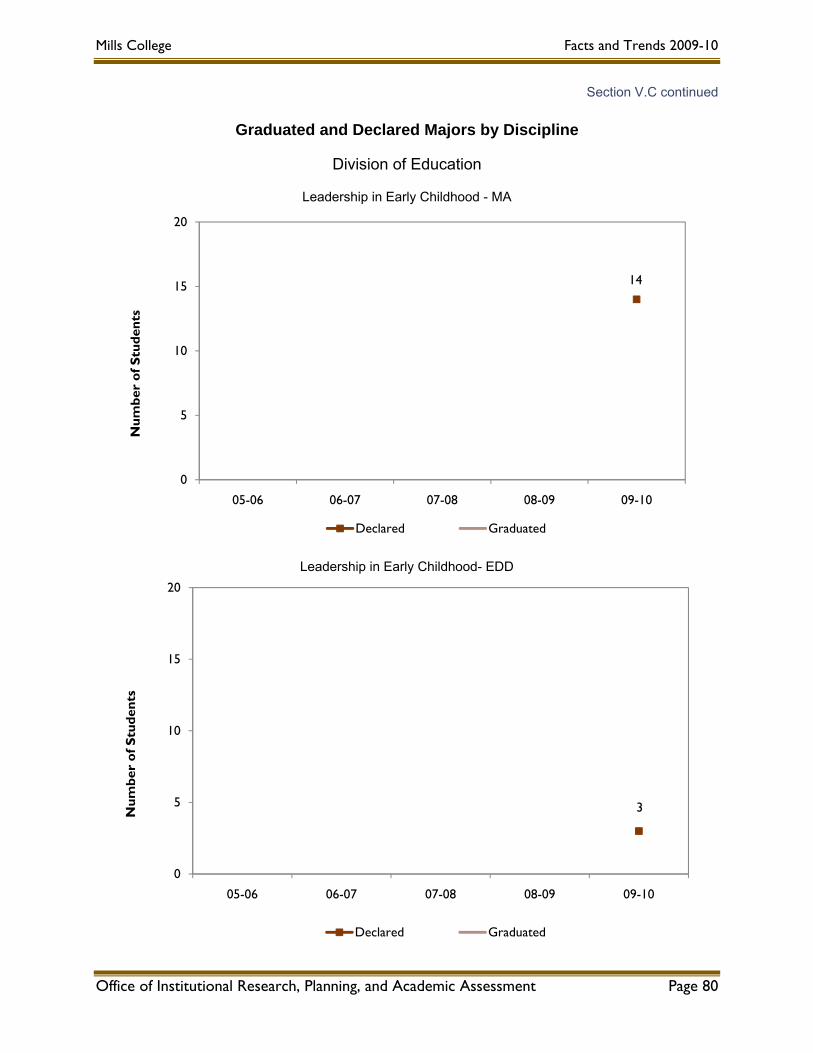
Mills College Facts and Trends 2009-10
Section V.C continued
Graduated and Declared Majors by Discipline
Division of Education
Leadership in Early Childhood - MA
14
0
5
10
15
20
05-06 06-07 07-08 08-09 09-10
Num
ber
of S
tude
nts
Declared Graduated
Leadership in Early Childhood- EDD
3
0
5
10
15
20
05-06 06-07 07-08 08-09 09-10
Num
ber
of S
tude
nts
Declared Graduated
Office of Institutional Research, Planning, and Academic Assessment Page 80
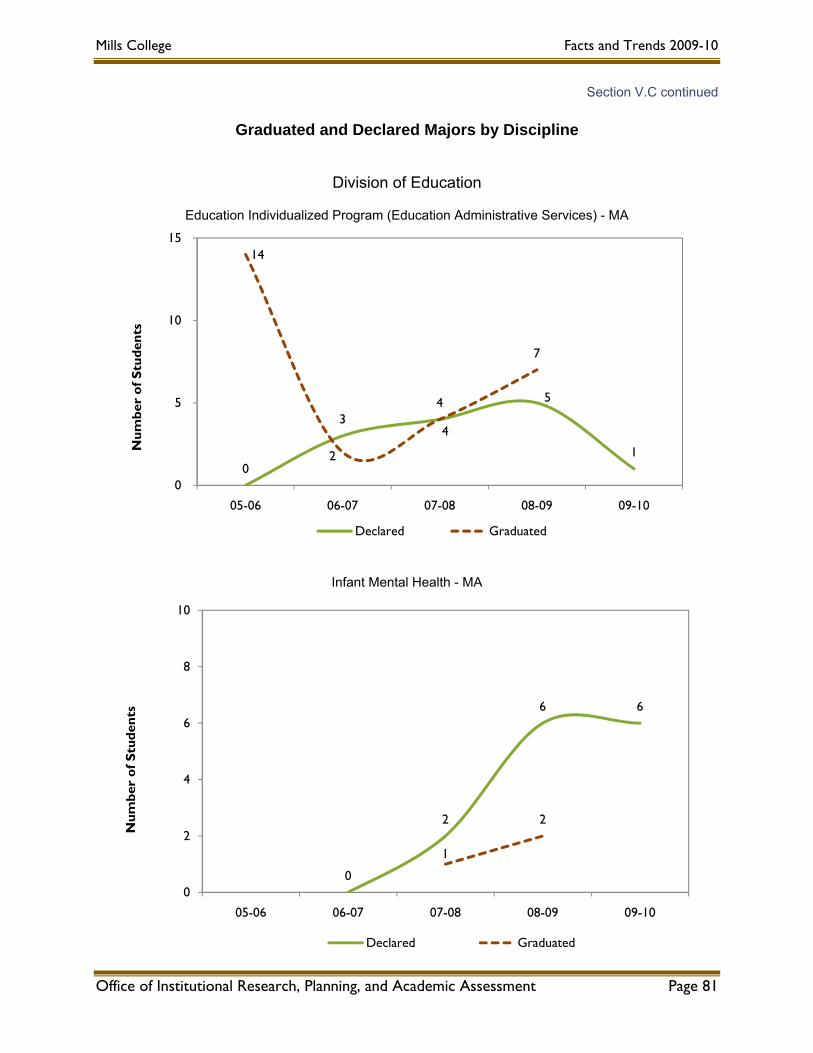
Mills College Facts and Trends 2009-10
Section V.C continued
Graduated and Declared Majors by Discipline
Division of Education
Education Individualized Program (Education Administrative Services) - MA
0
3 4 5
1
14
2
4
7
0
5
10
15
05-06 06-07 07-08 08-09 09-10
Num
ber
of S
tude
nts
Declared Graduated
Infant Mental Health - MA
Office of Institutional Research, Planning, and Academic Assessment Page 81
0
2
6 6
1
2
0
2
4
6
8
10
05-06 06-07 07-08 08-09 09-10
Num
ber
of S
tude
nts
Declared Graduated

Mills College Facts and Trends 2009-10
Section V.C continued
Graduated and Declared Majors by Discipline
Division of Education
Teaching Credential Preparation and MA
44
62 61
78
9 10
17 14
44 28 27
36
0
10
20
30
40
50
60
70
80
90
05-06 06-07 07-08 08-09 09-10
Num
ber
of S
tude
nts
Declared Graduated-MA Graduated-Credential
Office of Institutional Research, Planning, and Academic Assessment Page 82

Mills College Facts and Trends 2009-10
Section V.C continued
Graduated and Declared Majors by Discipline
Division of Fine Arts
Art History - BA
13
9
14
19
8
5 5
7
12
0
5
10
15
20
25
05-06 06-07 07-08 08-09 09-10
Num
ber
of S
tude
nts
Declared Graduated
Studio Arts - BA
18
13
16
2119
9
6 7
10
0
5
10
15
20
25
30
35
05-06 06-07 07-08 08-09 09-10
Num
ber
of S
tude
nts
Declared Graduated
Office of Institutional Research, Planning, and Academic Assessment Page 83
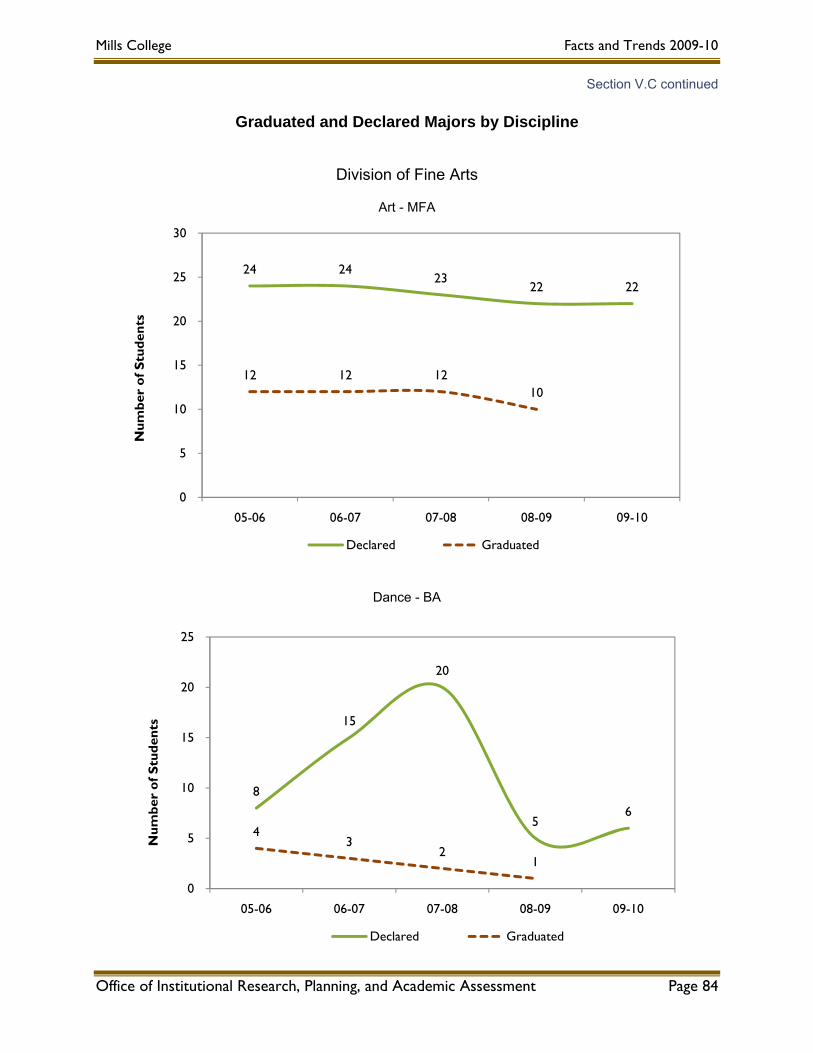
Mills College Facts and Trends 2009-10
Section V.C continued
Graduated and Declared Majors by Discipline
Division of Fine Arts
Art - MFA
24 24 23
22 22
12 12 12 10
0
5
10
15
20
25
30
05-06 06-07 07-08 08-09 09-10
Num
ber
of S
tude
nts
Declared Graduated
Dance - BA
8
15
20
56
4 3
2 1
0
5
10
15
20
25
05-06 06-07 07-08 08-09 09-10
Num
ber
of S
tude
nts
Declared Graduated
Office of Institutional Research, Planning, and Academic Assessment Page 84
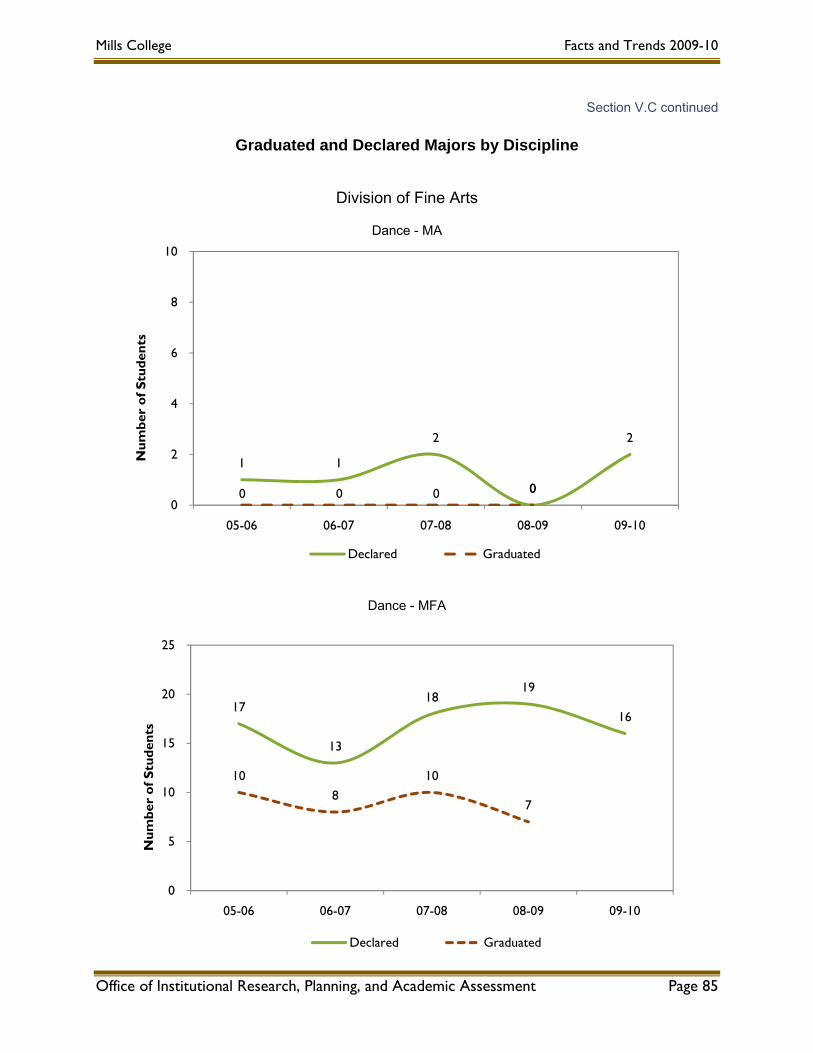
Mills College Facts and Trends 2009-10
Section V.C continued
Graduated and Declared Majors by Discipline
Division of Fine Arts
Dance - MA
1 1
2
0
2
0 0 0 00
2
4
6
8
10
05-06 06-07 07-08 08-09 09-10
Num
ber
of S
tude
nts
Declared Graduated
Dance - MFA
17
13
18 19
16
10 8
10
7
0
5
10
15
20
25
05-06 06-07 07-08 08-09 09-10
Num
ber
of S
tude
nts
Declared Graduated
Office of Institutional Research, Planning, and Academic Assessment Page 85
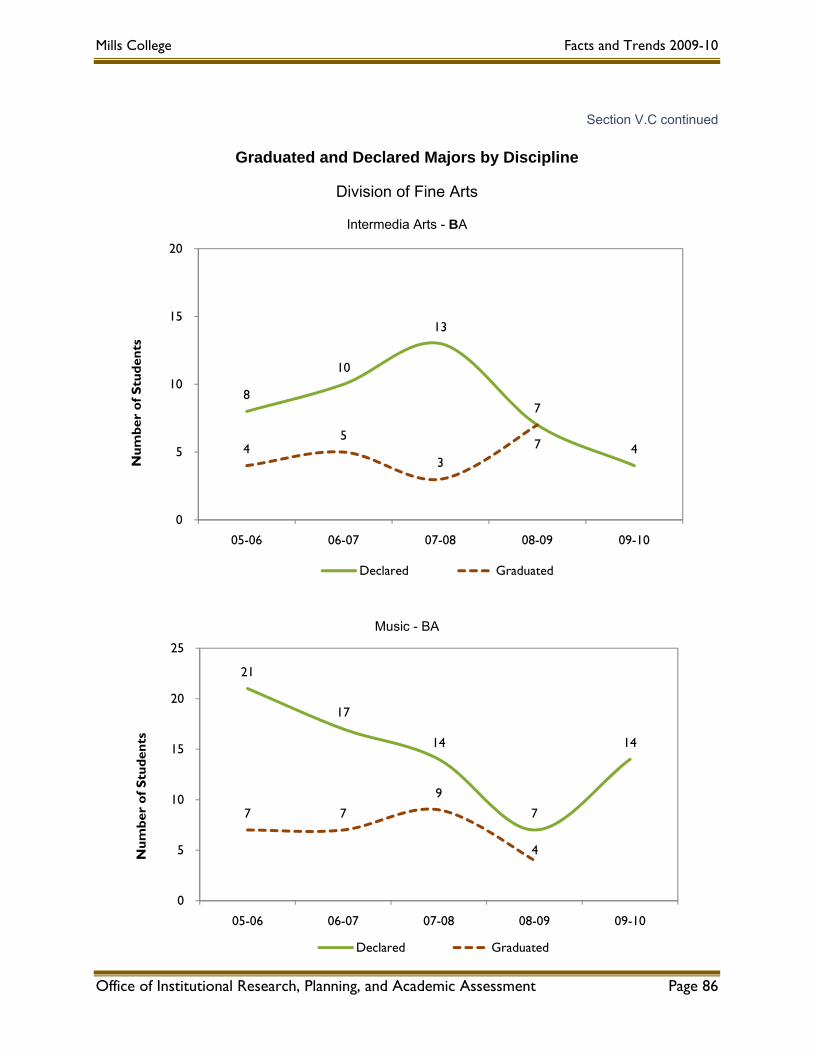
Mills College Facts and Trends 2009-10
Section V.C continued
Graduated and Declared Majors by Discipline
Division of Fine Arts
Intermedia Arts - BA
8
10
13
7
44 5
3 7
0
5
10
15
20
05-06 06-07 07-08 08-09 09-10
Num
ber
of S
tude
nts
Declared Graduated
Music - BA
Office of Institutional Research, Planning, and Academic Assessment Page 86
21
17
14
7
14
7 7
9
4
0
5
10
15
20
25
05-06 06-07 07-08 08-09 09-10
Num
ber
of S
tude
nts
Declared Graduated
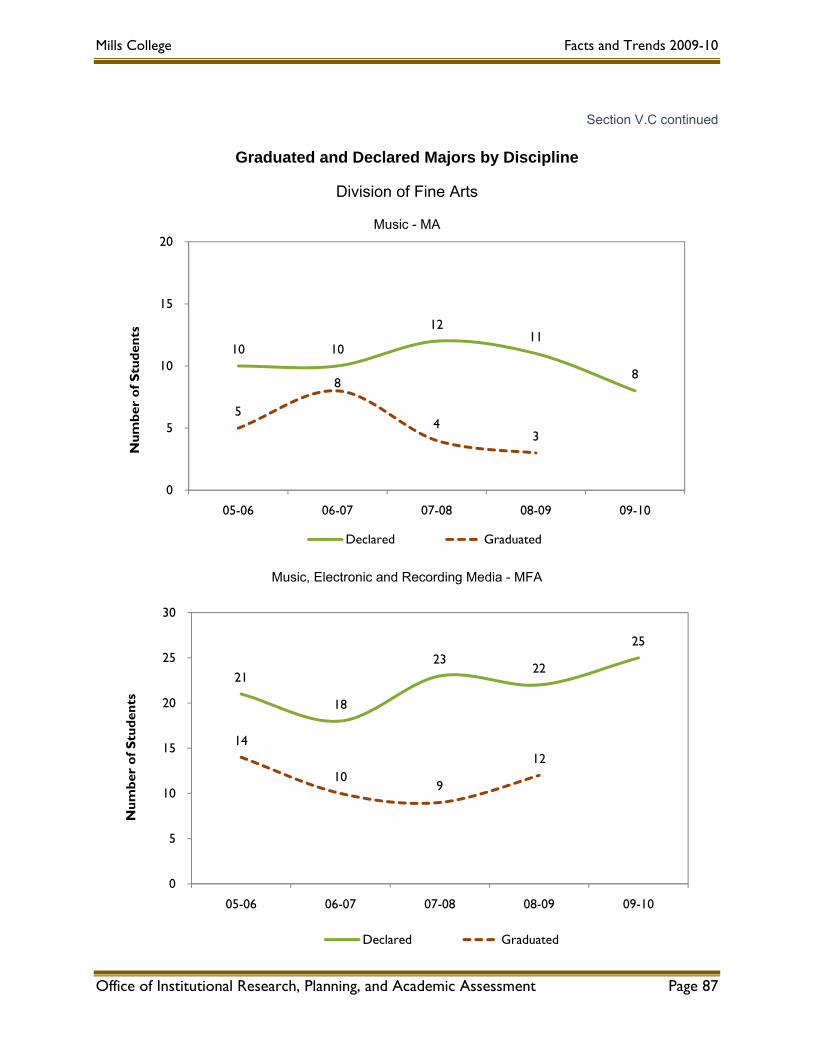
Mills College Facts and Trends 2009-10
Section V.C continued
Graduated and Declared Majors by Discipline
Division of Fine Arts
Music - MA
10 10
12 11
8
5
8
4 3
0
5
10
15
20
05-06 06-07 07-08 08-09 09-10
Num
ber
of S
tude
nts
Declared Graduated
Music, Electronic and Recording Media - MFA
21
18
23 22
25
14
10 9
12
0
5
10
15
20
25
30
05-06 06-07 07-08 08-09 09-10
Num
ber
of S
tude
nts
Declared Graduated
Office of Institutional Research, Planning, and Academic Assessment Page 87
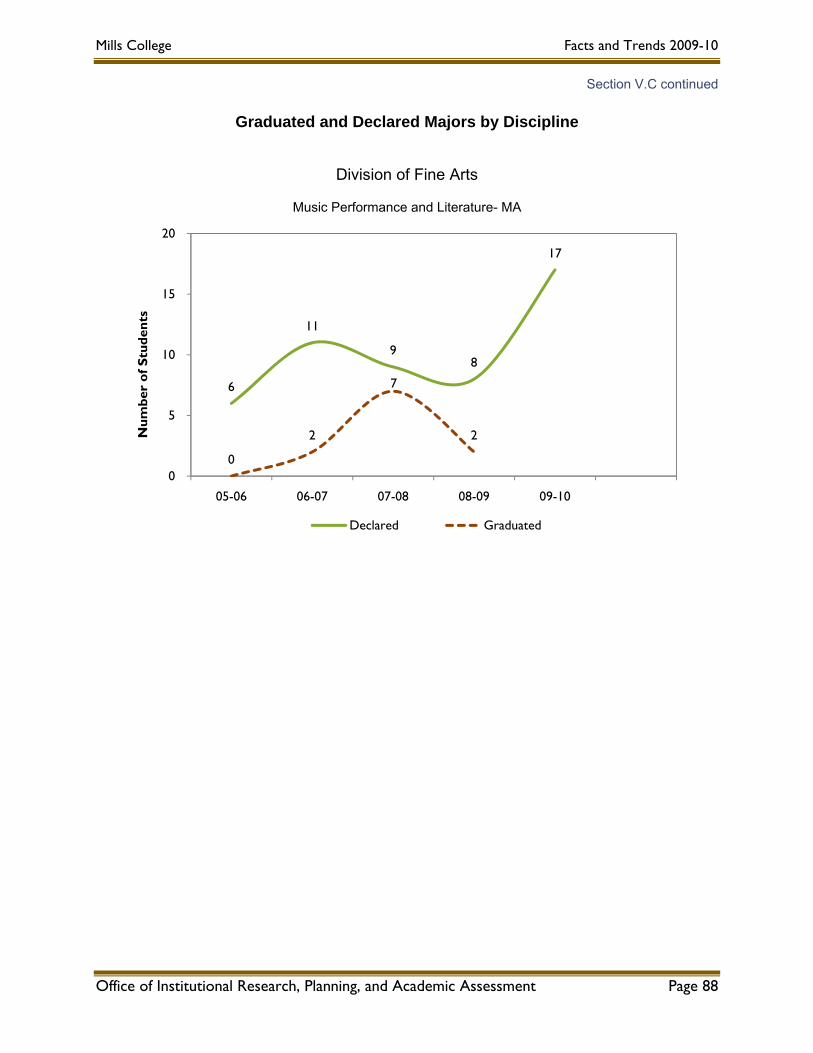
Mills College Facts and Trends 2009-10
Section V.C continued
Graduated and Declared Majors by Discipline
Division of Fine Arts
Music Performance and Literature- MA
6
11
9 8
17
0
2
7
2
0
5
10
15
20
05-06 06-07 07-08 08-09 09-10
Num
ber
of S
tude
nts
Declared Graduated
Office of Institutional Research, Planning, and Academic Assessment Page 88
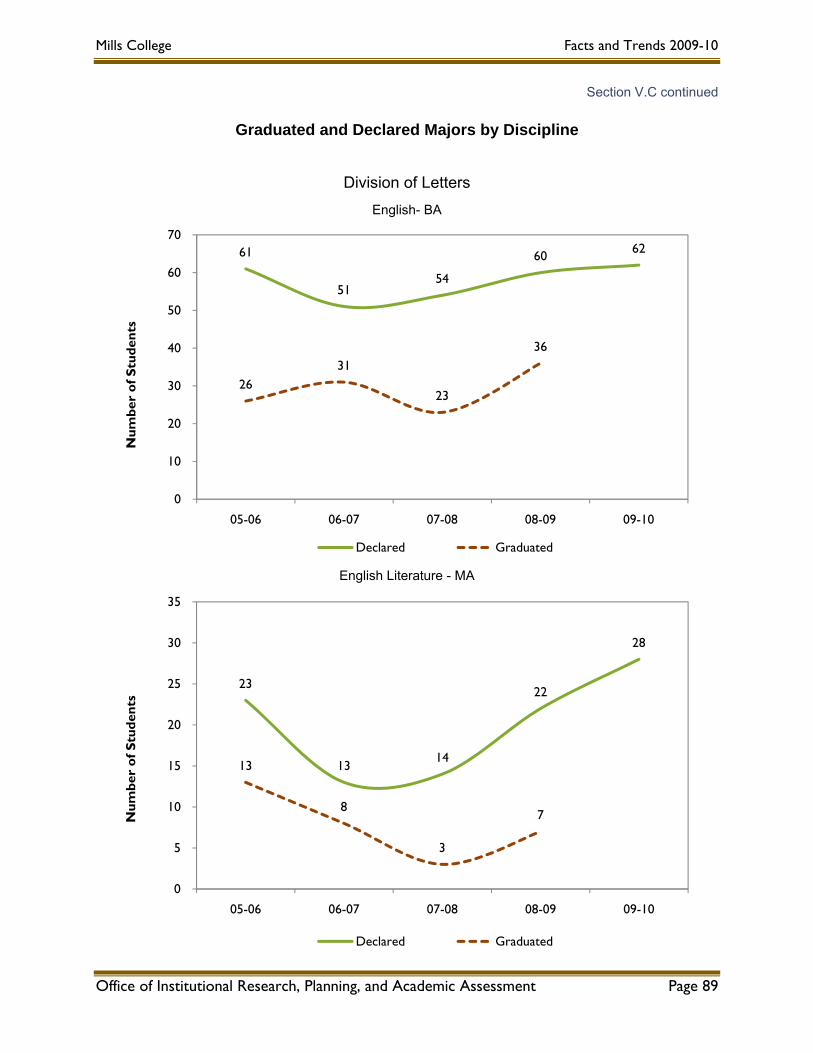
Mills College Facts and Trends 2009-10
Section V.C continued
Graduated and Declared Majors by Discipline
Division of Letters
English- BA
English Literature - MA
61
51 54
60 62
26 31
23
36
0
10
20
30
40
50
60
70
05-06 06-07 07-08 08-09 09-10
Num
ber
of S
tude
nts
Declared Graduated
23
13 14
22
28
13
8
3
7
0
5
10
15
20
25
30
35
05-06 06-07 07-08 08-09 09-10
Num
ber
of S
tude
nts
Declared Graduated
Office of Institutional Research, Planning, and Academic Assessment Page 89

Mills College Facts and Trends 2009-10
Section V.C continued
Graduated and Declared Majors by Discipline
Division of Letters
English Writing- MFA
86
77 74
79
69
34
41
31 34
0
10
20
30
40
50
60
70
80
90
100
05-06 06-07 07-08 08-09 09-10
Num
ber
of S
tude
nts
Declared Graduated
Creative Writing and Book Arts MFA
2
0
5
10
15
05-06 06-07 07-08 08-09 09-10
Num
ber
of S
tude
nts
Declared Graduated
Office of Institutional Research, Planning, and Academic Assessment Page 90

Mills College Facts and Trends 2009-10
Section V.C continued
Graduated and Declared Majors by Discipline
Division of Letters
Ethnic Studies- BA
23
11 13
9
22
12
6 4
5
0
5
10
15
20
25
30
05-06 06-07 07-08 08-09 09-10
Num
ber
of S
tude
nts
Declared Graduated
French & Francophone Studies - BA
1
9
14
5
6
0
2 3
6
0
5
10
15
20
05-06 06-07 07-08 08-09 09-10
Num
ber
of S
tude
nts
Declared Graduated
Office of Institutional Research, Planning, and Academic Assessment Page 91
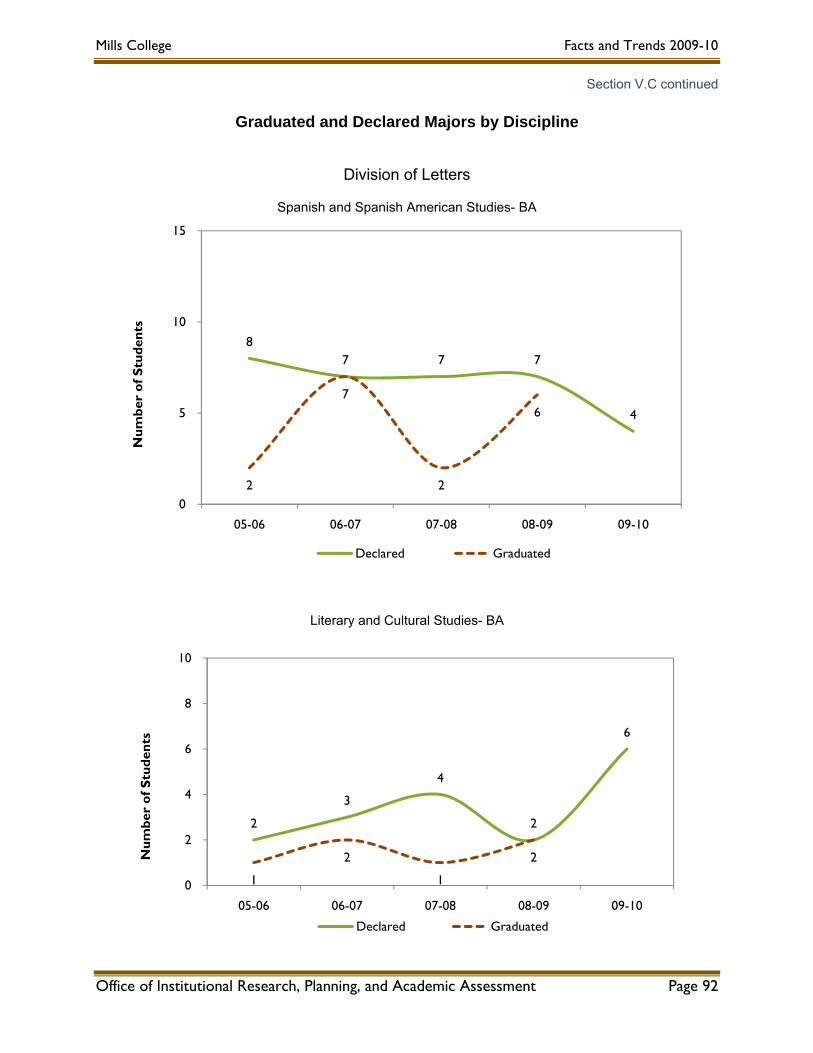
Mills College Facts and Trends 2009-10
Section V.C continued
Graduated and Declared Majors by Discipline
Division of Letters
Spanish and Spanish American Studies- BA
8 7 7 7
4
2
7
2
6
0
5
10
15
05-06 06-07 07-08 08-09 09-10
Num
ber
of S
tude
nts
Declared Graduated
Literary and Cultural Studies- BA
2
3
4
2
6
1
2
1
2
0
2
4
6
8
10
05-06 06-07 07-08 08-09 09-10
Num
ber
of S
tude
nts
Declared Graduated
Office of Institutional Research, Planning, and Academic Assessment Page 92

Mills College Facts and Trends 2009-10
Section V.C continued
Graduated and Declared Majors by Discipline
Division of Natural Sciences and Mathematics
Biology- BA
14
16
13
18
10
4
7 8
10
0
5
10
15
20
25
05-06 06-07 07-08 08-09 09-10
Num
ber
of S
tude
nts
Declared Graduated
Biology - BS
1
4
9
4
12
0 0
4
3
0
5
10
15
05-06 06-07 07-08 08-09 09-10
Num
ber
of S
tude
nts
Declared Graduated
Office of Institutional Research, Planning, and Academic Assessment Page 93
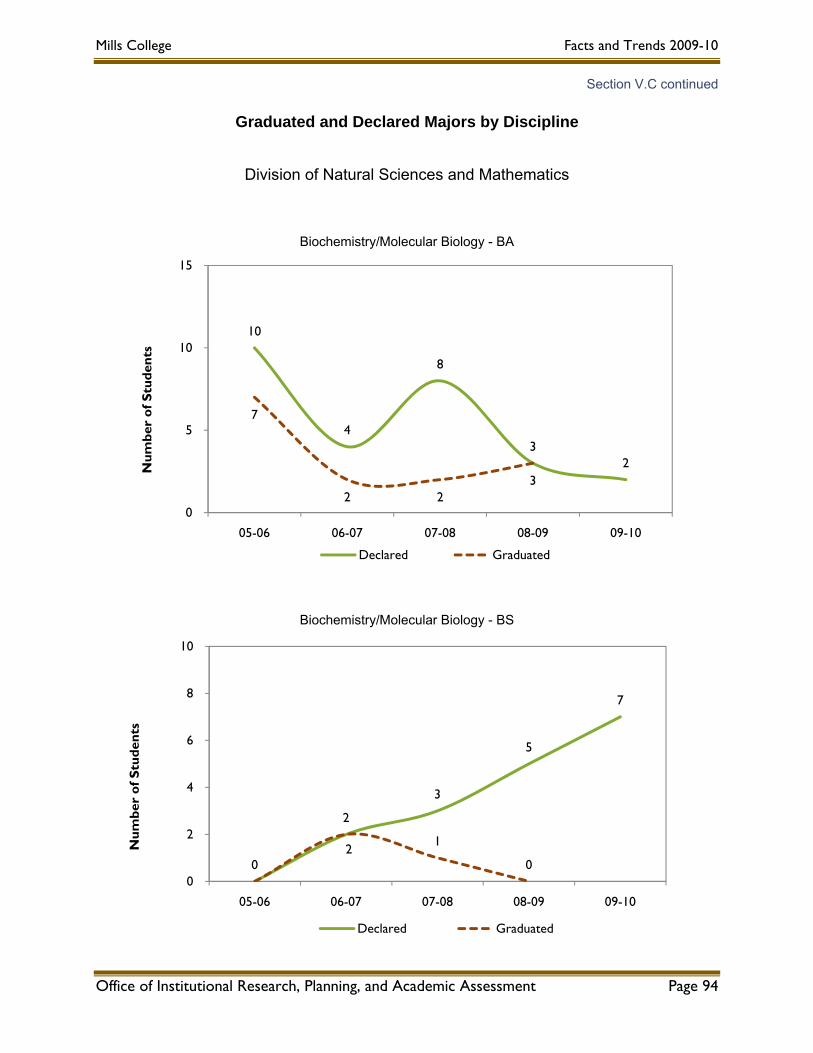
Mills College Facts and Trends 2009-10
Section V.C continued
Graduated and Declared Majors by Discipline
Division of Natural Sciences and Mathematics
Biochemistry/Molecular Biology - BA
10
4
8
3 2
7
2 2 3
0
5
10
15
05-06 06-07 07-08 08-09 09-10
Num
ber
of S
tude
nts
Declared Graduated
Biochemistry/Molecular Biology - BS
0
2
3
5
7
2 1
0 0
2
4
6
8
10
05-06 06-07 07-08 08-09 09-10
Num
ber
of S
tude
nts
Declared Graduated
Office of Institutional Research, Planning, and Academic Assessment Page 94
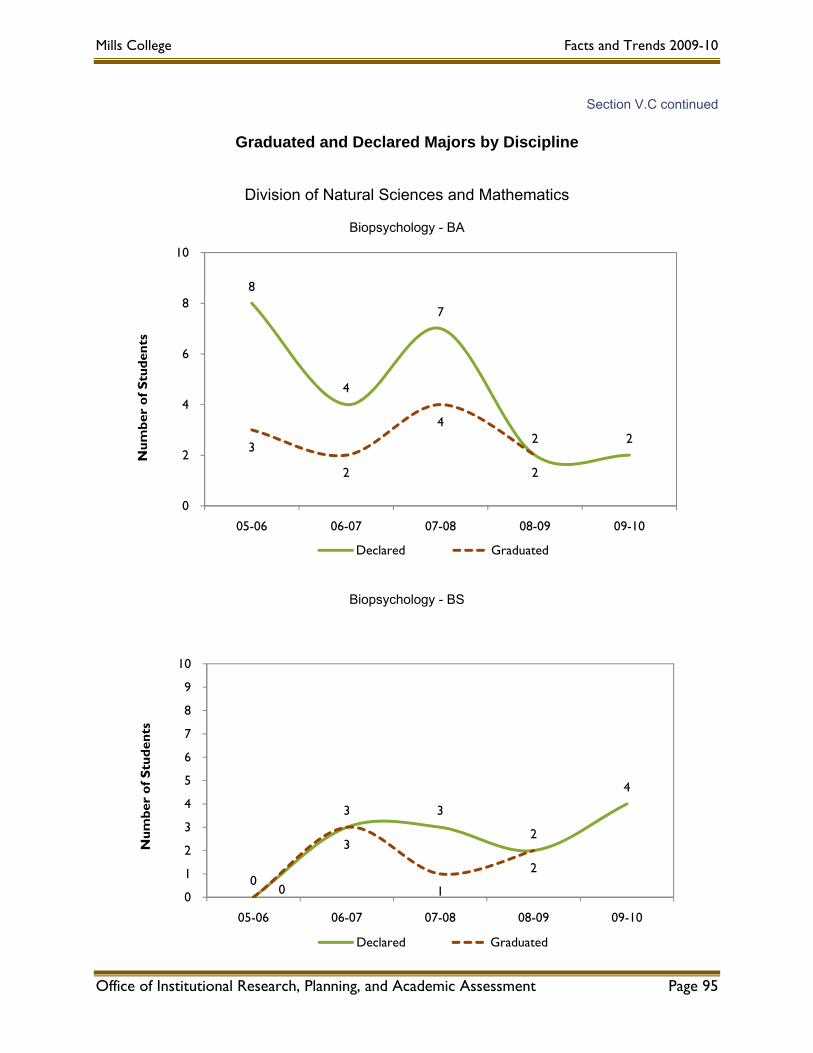
Mills College Facts and Trends 2009-10
Section V.C continued
Graduated and Declared Majors by Discipline
Division of Natural Sciences and Mathematics
Biopsychology - BA
8
4
7
2 2 3
2
4
2
0
2
4
6
8
10
05-06 06-07 07-08 08-09 09-10
Num
ber
of S
tude
nts
Declared Graduated
Biopsychology - BS
0
3 3
2
4
0
3
1
2
0
1
2
3
4
5
6
7
8
9
10
05-06 06-07 07-08 08-09 09-10
Num
ber
of S
tude
nts
Declared Graduated
Office of Institutional Research, Planning, and Academic Assessment Page 95
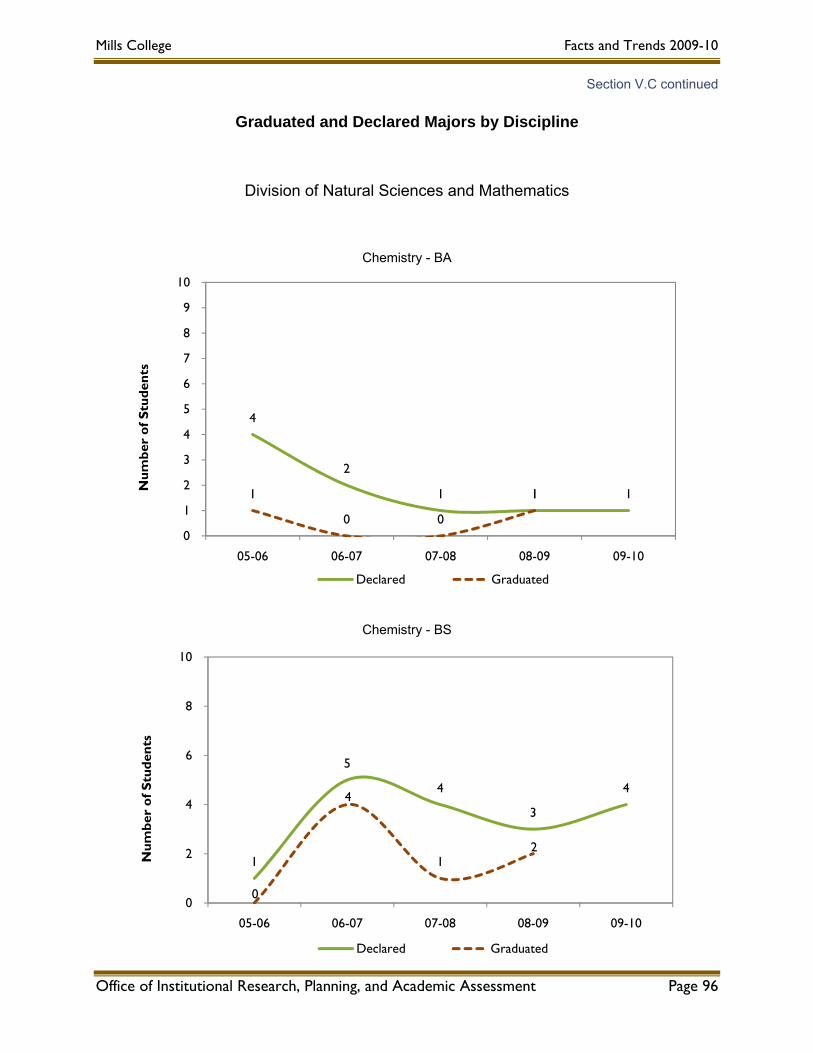
Mills College Facts and Trends 2009-10
Section V.C continued
Graduated and Declared Majors by Discipline
Division of Natural Sciences and Mathematics
Chemistry - BA
4
2
1 1 1 1
0 0
1
0
1
2
3
4
5
6
7
8
9
10
05-06 06-07 07-08 08-09 09-10
Num
ber
of S
tude
nts
Declared Graduated
Chemistry - BS
Office of Institutional Research, Planning, and Academic Assessment Page 96
1
5
4
3
4
0
4
1 2
0
2
4
6
8
10
05-06 06-07 07-08 08-09 09-10
Num
ber
of S
tude
nts
Declared Graduated
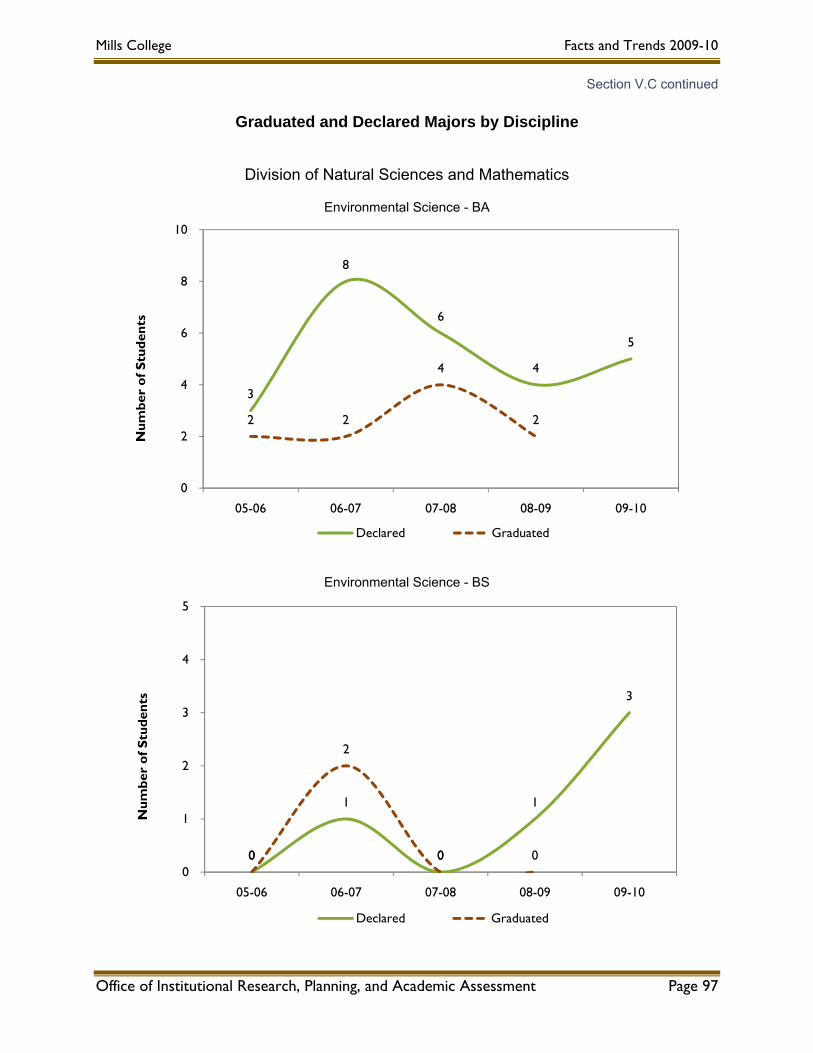
Mills College Facts and Trends 2009-10
Section V.C continued
Graduated and Declared Majors by Discipline
Division of Natural Sciences and Mathematics
Environmental Science - BA
3
8
6
4
5
2 2
4
2
0
2
4
6
8
10
05-06 06-07 07-08 08-09 09-10
Num
ber
of S
tude
nts
Declared Graduated
Environmental Science - BS
0
1
0
1
3
0
2
0 0 0
1
2
3
4
5
05-06 06-07 07-08 08-09 09-10
Num
ber
of S
tude
nts
Declared Graduated
Office of Institutional Research, Planning, and Academic Assessment Page 97

Mills College Facts and Trends 2009-10
Section V.C continued
Graduated and Declared Majors by Discipline
Division of Natural Sciences and Mathematics
Computer Science - BA
8
3
4 4
1
3
3
0
2
0
2
4
6
8
10
05-06 06-07 07-08 08-09 09-10
Num
ber
of S
tude
nts
Declared Graduated
Computer Science - Certificate
Office of Institutional Research, Planning, and Academic Assessment Page 98
0
1
2
1 1
0 0
1
0 0
1
2
3
4
5
05-06 06-07 07-08 08-09 09-10
Num
ber
of S
tude
nts
Declared Graduated
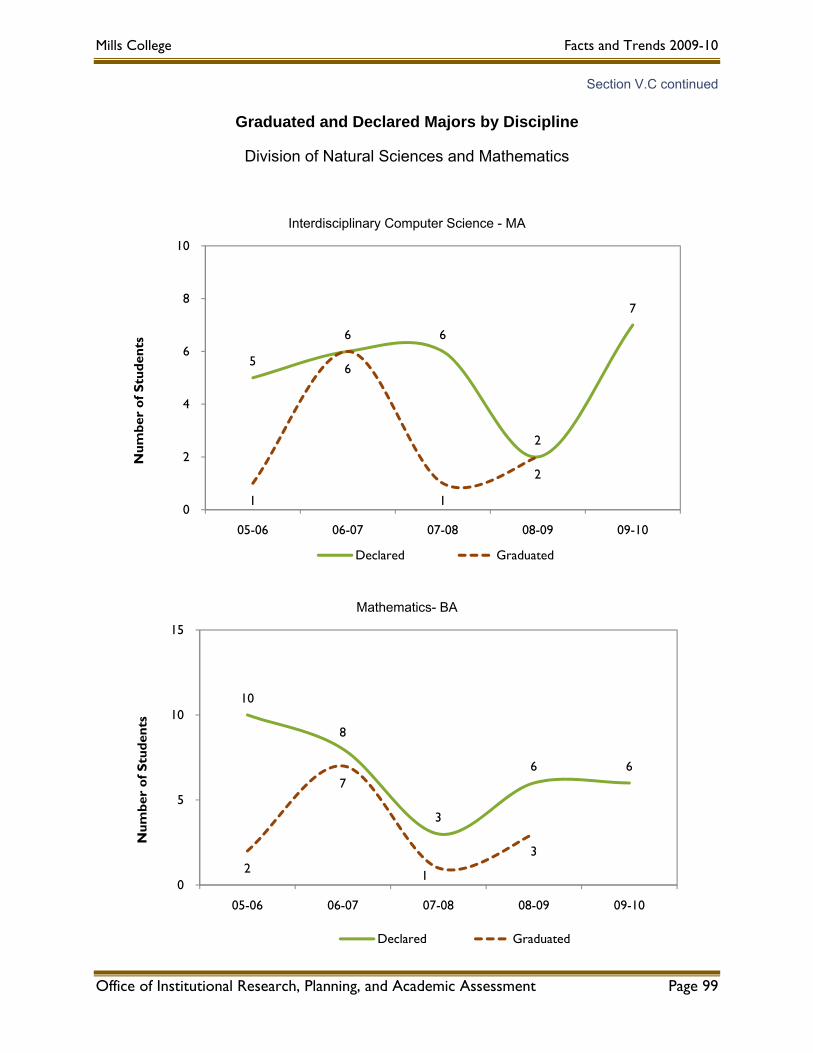
Mills College Facts and Trends 2009-10
Section V.C continued
Graduated and Declared Majors by Discipline
Division of Natural Sciences and Mathematics
Interdisciplinary Computer Science - MA
5
6 6
2
7
1
6
1
2
0
2
4
6
8
10
05-06 06-07 07-08 08-09 09-10
Num
ber
of S
tude
nts
Declared Graduated
Mathematics- BA
10
8
3
6 6
2
7
1
3
0
5
10
15
05-06 06-07 07-08 08-09 09-10
Num
ber
of S
tude
nts
Declared Graduated
Office of Institutional Research, Planning, and Academic Assessment Page 99

Mills College Facts and Trends 2009-10
Section V.C continued
Graduated and Declared Majors by Discipline
Division of Natural Sciences and Mathematics
Mathematics - BS
2
0
1
2
3
4
5
05-06 06-07 07-08 08-09 09-10
Num
ber
of S
tude
nts
Declared Graduated
Pre-Medical Studies - Certificate
66
51 57
53
63
32
25 24 26
0
10
20
30
40
50
60
70
05-06 06-07 07-08 08-09 09-10
Num
ber
of S
tude
nts
Declared Graduated
Office of Institutional Research, Planning, and Academic Assessment Page 100
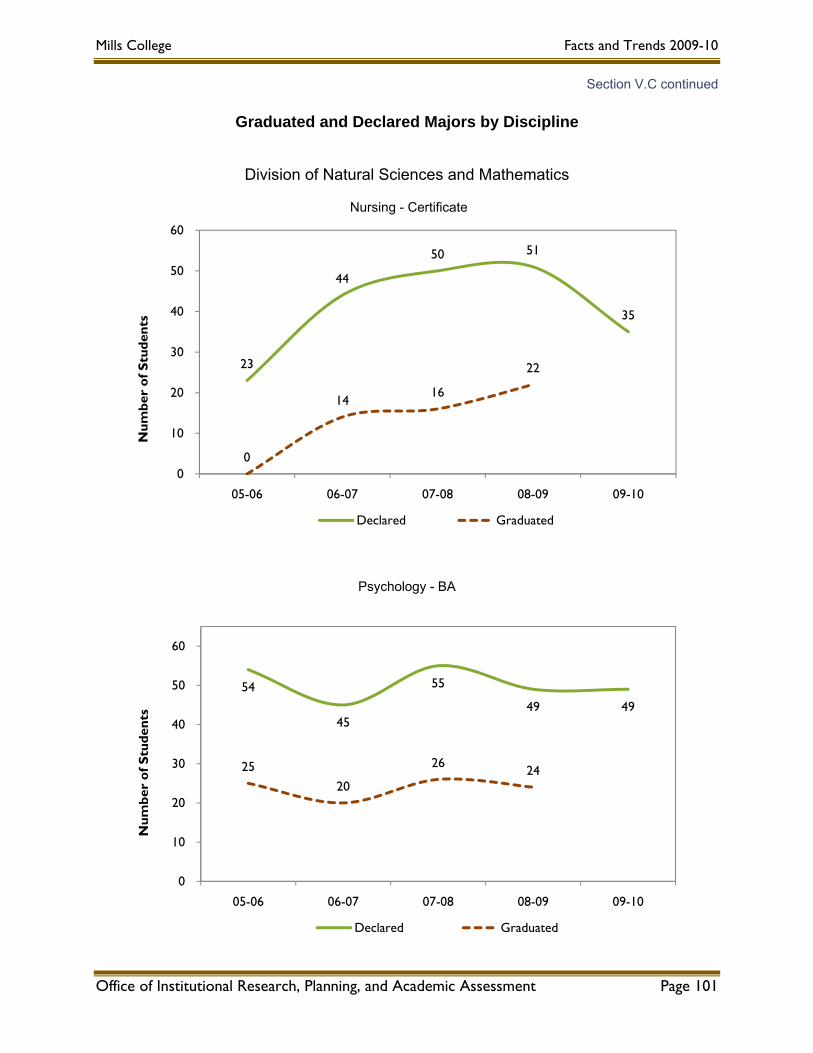
Mills College Facts and Trends 2009-10
Section V.C continued
Graduated and Declared Majors by Discipline
Division of Natural Sciences and Mathematics
Nursing - Certificate
23
44
50 51
35
0
14 16
22
0
10
20
30
40
50
60
05-06 06-07 07-08 08-09 09-10
Num
ber
of S
tude
nts
Declared Graduated
Psychology - BA
54
45
55
49 49
25 20
26 24
0
10
20
30
40
50
60
05-06 06-07 07-08 08-09 09-10
Num
ber
of S
tude
nts
Declared Graduated
Office of Institutional Research, Planning, and Academic Assessment Page 101

Mills College Facts and Trends 2009-10
Section V.C continued
Graduated and Declared Majors by Discipline
Division of Social Sciences
Anthropology and Sociology - BA
26
14
21 23
16
12
8 10
17
0
5
10
15
20
25
30
35
05-06 06-07 07-08 08-09 09-10
Num
ber
of S
tude
nts
Declared Graduated
Business Economics - BA
9
12
14 15
16
3
5
7 6
0
5
10
15
20
05-06 06-07 07-08 08-09 09-10
Num
ber
of S
tude
nts
Declared Graduated
Office of Institutional Research, Planning, and Academic Assessment Page 102
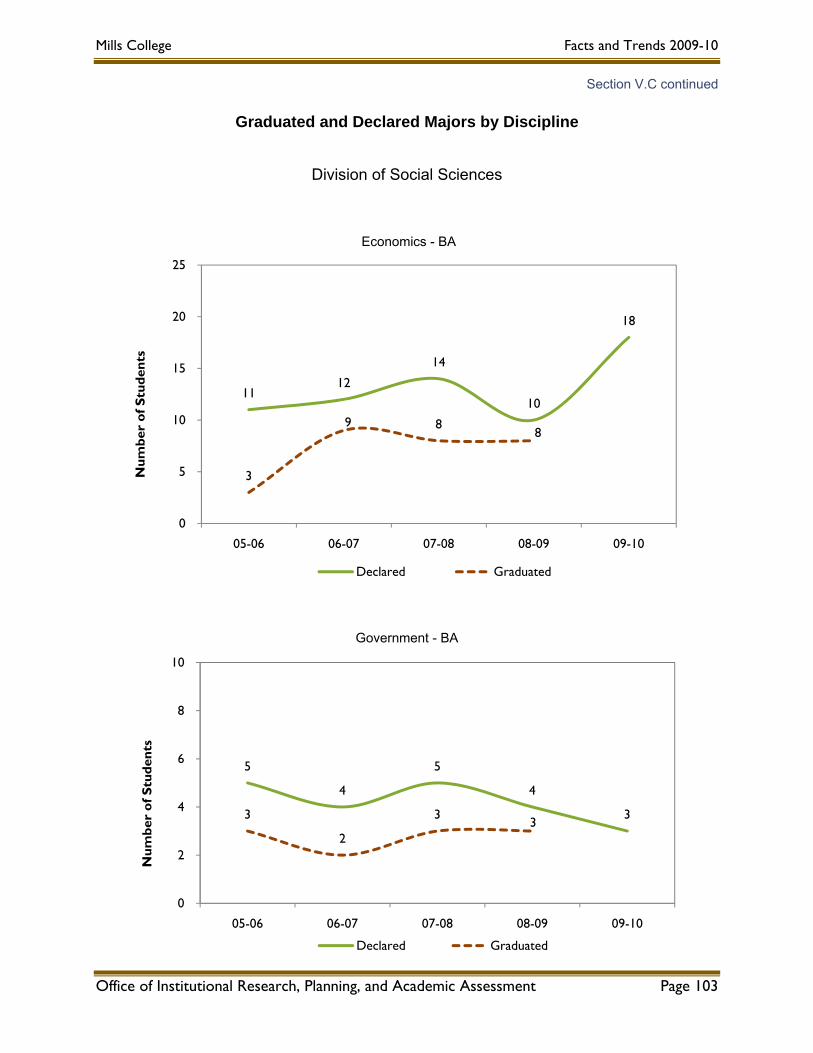
Mills College Facts and Trends 2009-10
Section V.C continued
Graduated and Declared Majors by Discipline
Division of Social Sciences
Economics - BA
11 12
14
10
18
3
9 8 8
0
5
10
15
20
25
05-06 06-07 07-08 08-09 09-10
Num
ber
of S
tude
nts
Declared Graduated
Government - BA
5
4
5
4
3 3
2
3 3
0
2
4
6
8
10
05-06 06-07 07-08 08-09 09-10
Num
ber
of S
tude
nts
Declared Graduated
Office of Institutional Research, Planning, and Academic Assessment Page 103

Mills College Facts and Trends 2009-10
Section V.C continued
Graduated and Declared Majors by Discipline
Division of Social Sciences
History - BA
17
13
11 11
8
8
11
3
9
0
5
10
15
20
05-06 06-07 07-08 08-09 09-10
Num
ber
of S
tude
nts
Declared Graduated
International Relations - BA
Office of Institutional Research, Planning, and Academic Assessment Page 104
12 13
14
11
14
7 8
3
5
0
5
10
15
20
05-06 06-07 07-08 08-09 09-10
Num
ber
of S
tude
nts
Declared Graduated
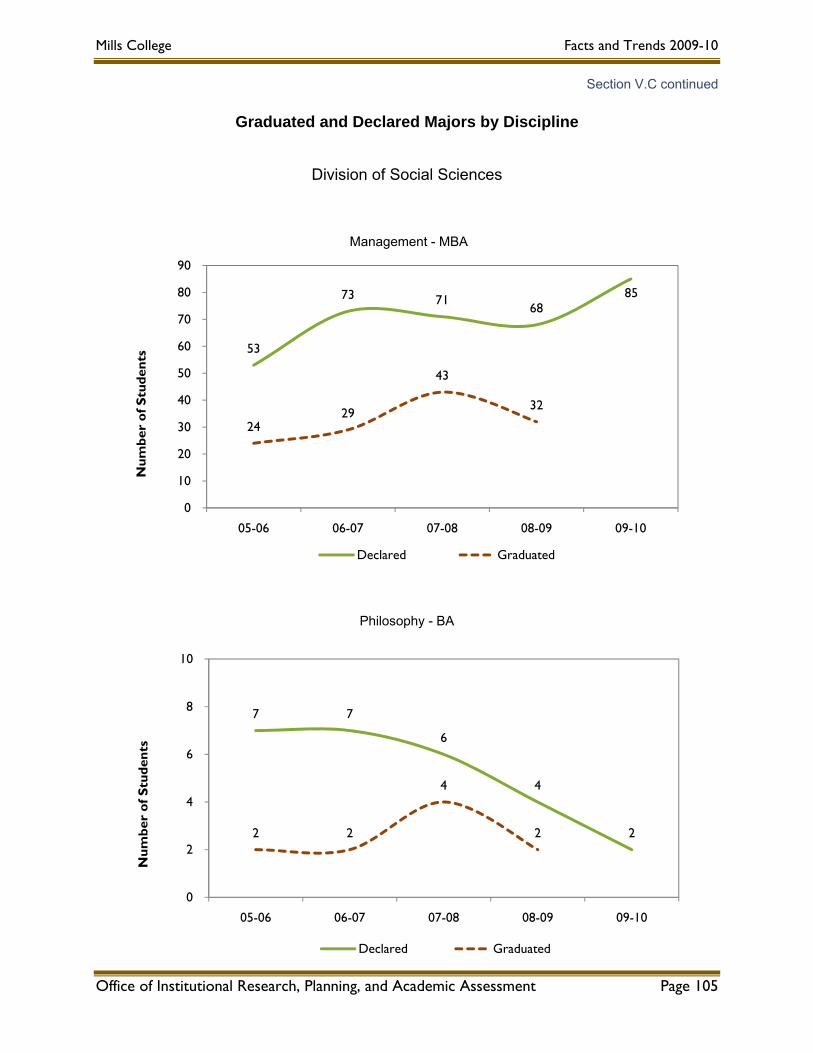
Mills College Facts and Trends 2009-10
Section V.C continued
Graduated and Declared Majors by Discipline
Division of Social Sciences
Management - MBA
53
73 71 68
85
24 29
43
32
0
10
20
30
40
50
60
70
80
90
05-06 06-07 07-08 08-09 09-10
Num
ber
of S
tude
nts
Declared Graduated
Philosophy - BA
Office of Institutional Research, Planning, and Academic Assessment Page 105
7 7
6
4
2 2 2
4
2
0
2
4
6
8
10
05-06 06-07 07-08 08-09 09-10
Num
ber
of S
tude
nts
Declared Graduated

Mills College Facts and Trends 2009-10
Section V.C continued
Graduated and Declared Majors by Discipline
Division of Social Sciences
Public Policy - BA
14
10
15
11 12
9
4 5
8
0
5
10
15
20
05-06 06-07 07-08 08-09 09-10
Num
ber
of S
tude
nts
Declared Graduated
Public Policy - MPP
1
7
11
29
0 6
4 0
5
10
15
20
25
30
35
40
05-06 06-07 07-08 08-09 09-10
Num
ber
of S
tude
nts
Declared Graduated
Office of Institutional Research, Planning, and Academic Assessment Page 106

Mills College Facts and Trends 2009-10
Section V.C continued
Graduated and Declared Majors by Discipline
Division of Social Sciences
Sociology - BA
13
8
3
12
10
5 6
3
5
0
5
10
15
20
05-06 06-07 07-08 08-09 09-10
Num
ber
of S
tude
nts
Declared Graduated
Women's Studies - BA
15
9
6
10 10
8
4 4
7
0
5
10
15
20
05-06 06-07 07-08 08-09 09-10
Num
ber
of S
tude
nts
Declared Graduated
Office of Institutional Research, Planning, and Academic Assessment Page 107
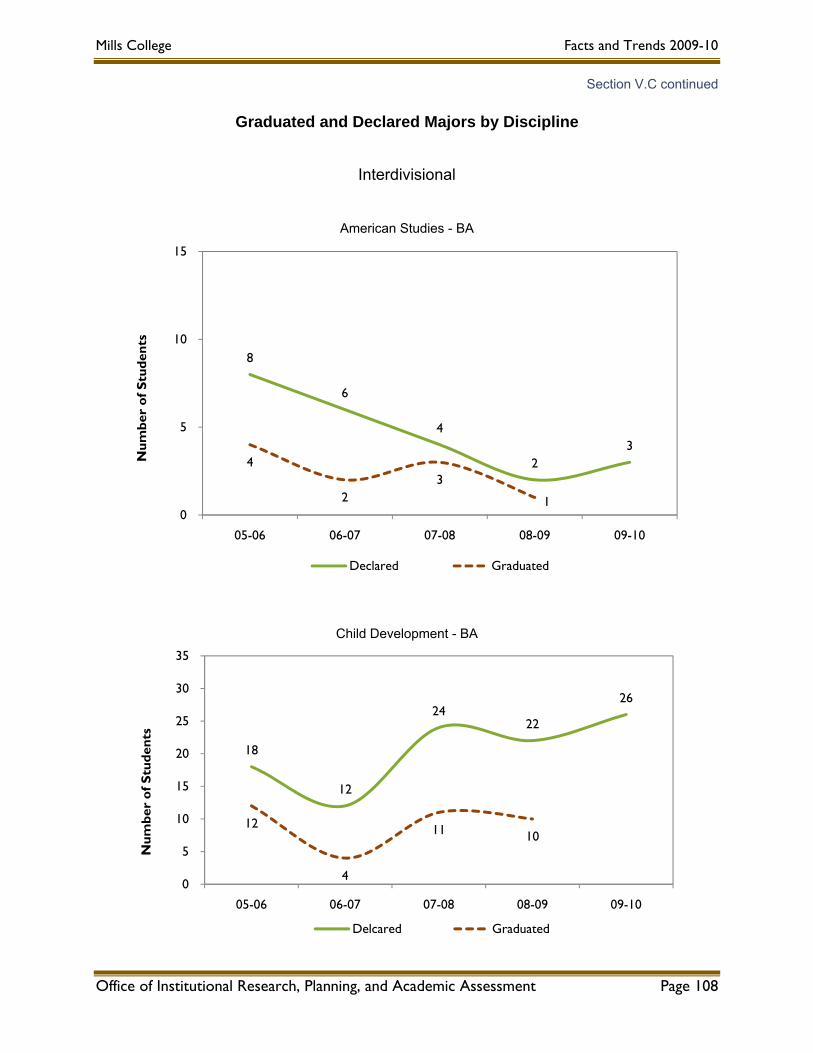
Mills College Facts and Trends 2009-10
Section V.C continued
Graduated and Declared Majors by Discipline
Interdivisional
American Studies - BA
8
6
4
2 3
4
2 3
1 0
5
10
15
05-06 06-07 07-08 08-09 09-10
Num
ber
of S
tude
nts
Declared Graduated
Child Development - BA
18
12
24 22
26
12
4
11 10
0
5
10
15
20
25
30
35
05-06 06-07 07-08 08-09 09-10
Num
ber
of S
tude
nts
Delcared Graduated
Office of Institutional Research, Planning, and Academic Assessment Page 108

Mills College Facts and Trends 2009-10
Section V.C continued
Graduated and Declared Majors by Discipline
Interdivisional
College Major - BA
9
7
3
6 6
6
4 3
5
0
5
10
15
05-06 06-07 07-08 08-09 09-10
Num
ber
of S
tude
nts
Declared Graduated
Comparative Literature - BA
0 0 0
1
0 0
1
0 0
1
2
3
4
5
05-06 06-07 07-08 08-09 09-10
Num
ber
of S
tude
nts
Declared Graduated
Office of Institutional Research, Planning, and Academic Assessment Page 109
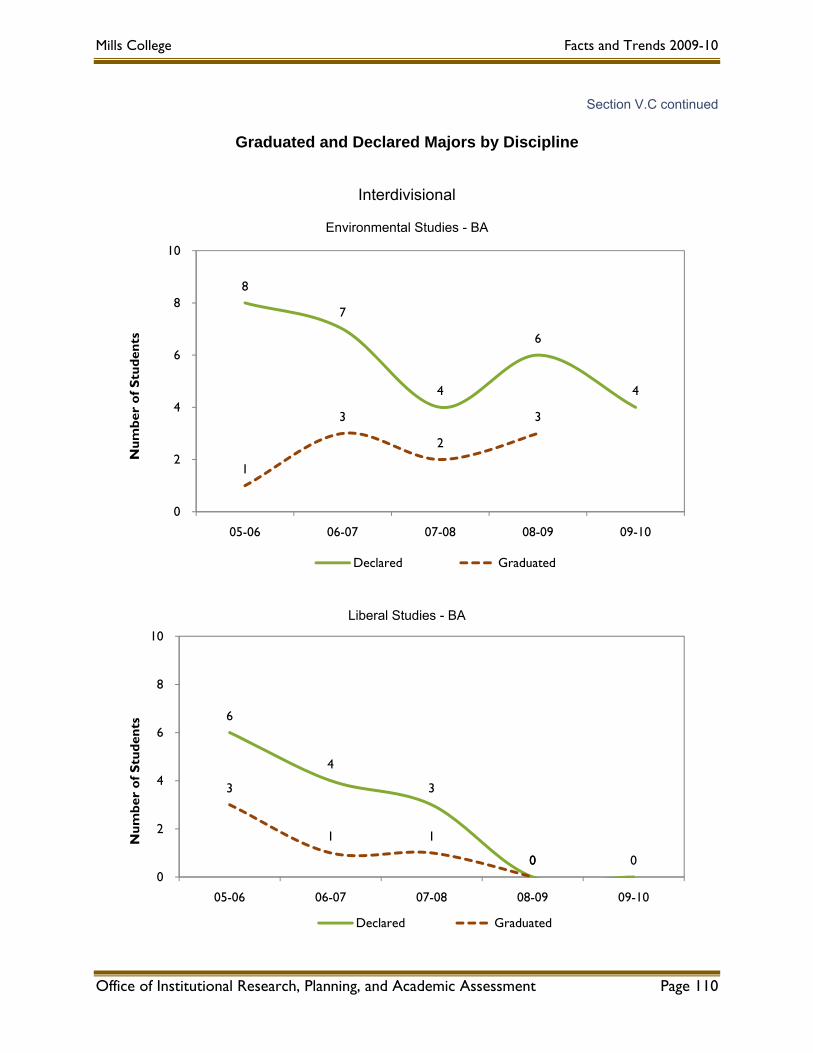
Mills College Facts and Trends 2009-10
Section V.C continued
Graduated and Declared Majors by Discipline
Interdivisional
Environmental Studies - BA
8
7
4
6
4
1
3
2
3
0
2
4
6
8
10
05-06 06-07 07-08 08-09 09-10
Num
ber
of S
tude
nts
Declared Graduated
Liberal Studies - BA
6
4
3
0 0
3
1 1
0 0
2
4
6
8
10
05-06 06-07 07-08 08-09 09-10
Num
ber
of S
tude
nts
Declared Graduated
Office of Institutional Research, Planning, and Academic Assessment Page 110

Mills College Facts and Trends 2009-10
Section V.C continued
Graduated and Declared Majors by Discipline
Interdivisional
Political, Legal, and Economic Analysis - BA
30 30
26
30 30
19 19 16
20
0
5
10
15
20
25
30
35
40
05-06 06-07 07-08 08-09 09-10
Num
ber
of S
tude
nts
Declared Graduated
Office of Institutional Research, Planning, and Academic Assessment Page 111
Mills College Facts and Trends 2009-10
Office of Institutional Research, Planning, and Academic Assessment Page 112
Section V.D
V.D Academic Support Services
The Academic Support Services at Mills College include:
Academic Technical Services provides qualified students, faculty, and staff with audio-visual equipment and support relating to presentation, video and theatre needs. Among the equipment available are data, overhead, and slide projectors; cameras and editing systems; and stage lights and control boards.
The Art Museum serves as a museum for the College, as a laboratory for the Department of Art, and as an educational center for the community. The Museum’s collection includes over 6,000 objects including California regionalist paintings; works on paper such as prints, photographs, drawings and watercolors dating from the 16th century to the present; textiles; and ceramics. Objects from the museum are borrowed regularly for exhibition in other museums and galleries throughout the world.
The Center for Contemporary Music (CCM) provides qualified students, faculty, and staff with instruments, computer music laboratories, recording equipment, and recording and editing studios. In addition to providing instruction and technical assistance in the use of its equipment to the Mills community, the CCM is open to the public on a non-profit basis, it offers artists in residencies, and it is the co-sponsors of various concerts and lectures on the Mills campus.
Computing Services oversees all college computing labs and their associated services. The department supports the design and maintenance of the College’s Web site, Intranet, and general computing and telecommunication services for the campus.
The F.W. Olin Library provides the Mills College community with a full spectrum of library services from traditional resources to on campus and remote access to more than fifty databases. Specialized research materials can be found in the library’s Special Collections Department, Rare Books Room and College Archive. Individual and group study spaces are available throughout the library.
The Center for Academic Success (CAE) provides services to students to enhance their success while studying at Mills. It has three components: The Peer Tutoring Center, the Writing Center and the Services for Students with Disabilities (SSD) Test Administrative Center. It is located directly opposite Founders dining hall. www.mills.edu/cae<http://www.mills.edu/cae>. The Peer Tutoring Center seeks to promote student success through active learning and motivation. Free tutoring is provided in many subjects, which are chosen semester-by-semester, focusing on the mastery of material while encouraging creativity and independent thinking. Students are eligible for up to three hours of one-on-one tutoring per subject per week. Students with the appropriate academic background and proven ability may be eligible to apply for positions as Peer Tutors. Peer tutors are selected by faculty, approved by the Center for

Mills College Facts and Trends 2009-10
Office of Institutional Research, Planning, and Academic Assessment Page 113
Section V.D continued Academic Support Services
Academic Success Coordinator, and paid on a sliding scale based on experience. www.mills.edu/peertutoring<http://www.mills.edu/peertutoring>. The Writing Center is free for all Mills students seeking assistance with writing projects. English Department graduate student staff assist with one-on-one tutorials and writing workshops throughout the academic year. www.mills.edu/student_services/writing_center/index.php<http://www.mills.edu/student_services/writing_center/index.php>.
SSD (Services for Students with Disabilities) Test Administration Center, part of the CAE, administers tests for students with disabilities registered with SSD who receive testing accommodations. Students registered with SSD whose disability impacts their mobility and access to Reinhardt Hall will continue to have their tests administered in the Cowell Building. www.mills.edu/disability<http://www.mills.edu/disability>.
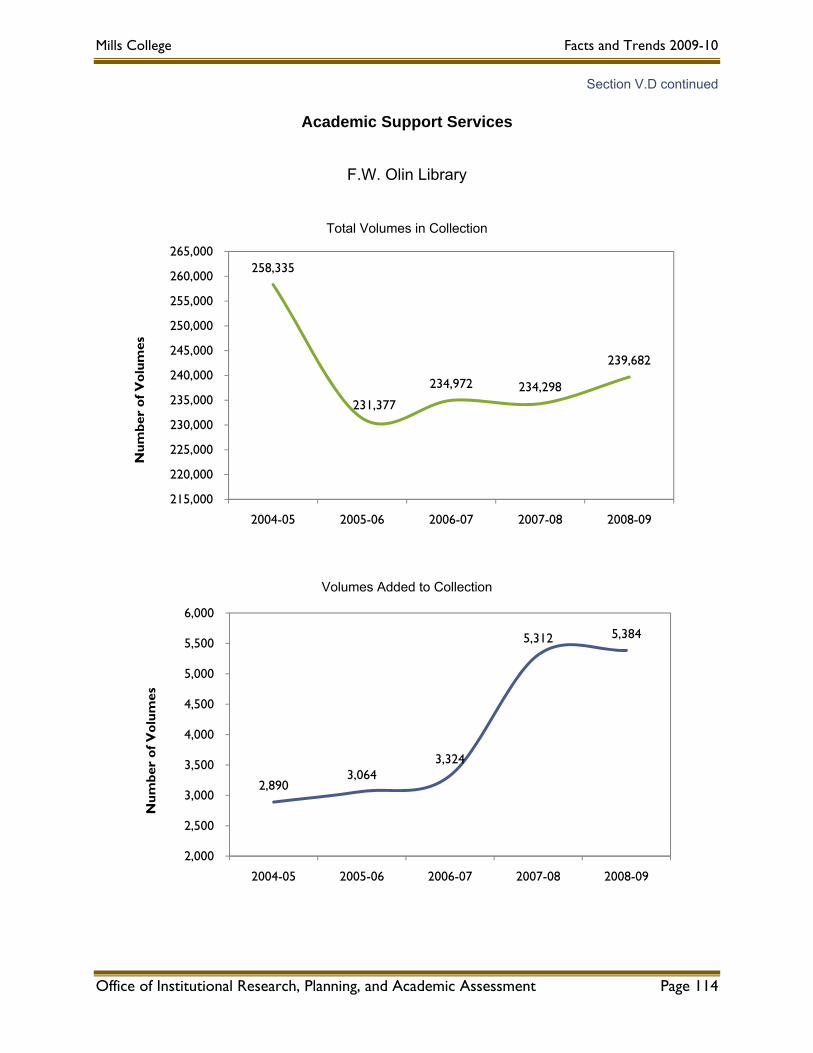
Mills College Facts and Trends 2009-10
Section V.D continued
Academic Support Services
F.W. Olin Library
Total Volumes in Collection
258,335
231,377
234,972 234,298
239,682
215,000
220,000
225,000
230,000
235,000
240,000
245,000
250,000
255,000
260,000
265,000
2004-05 2005-06 2006-07 2007-08 2008-09
Num
ber
of V
olum
es
Volumes Added to Collection
2,890 3,064
3,324
5,312 5,384
2,000
2,500
3,000
3,500
4,000
4,500
5,000
5,500
6,000
2004-05 2005-06 2006-07 2007-08 2008-09
Num
ber
of V
olum
es
Office of Institutional Research, Planning, and Academic Assessment Page 114
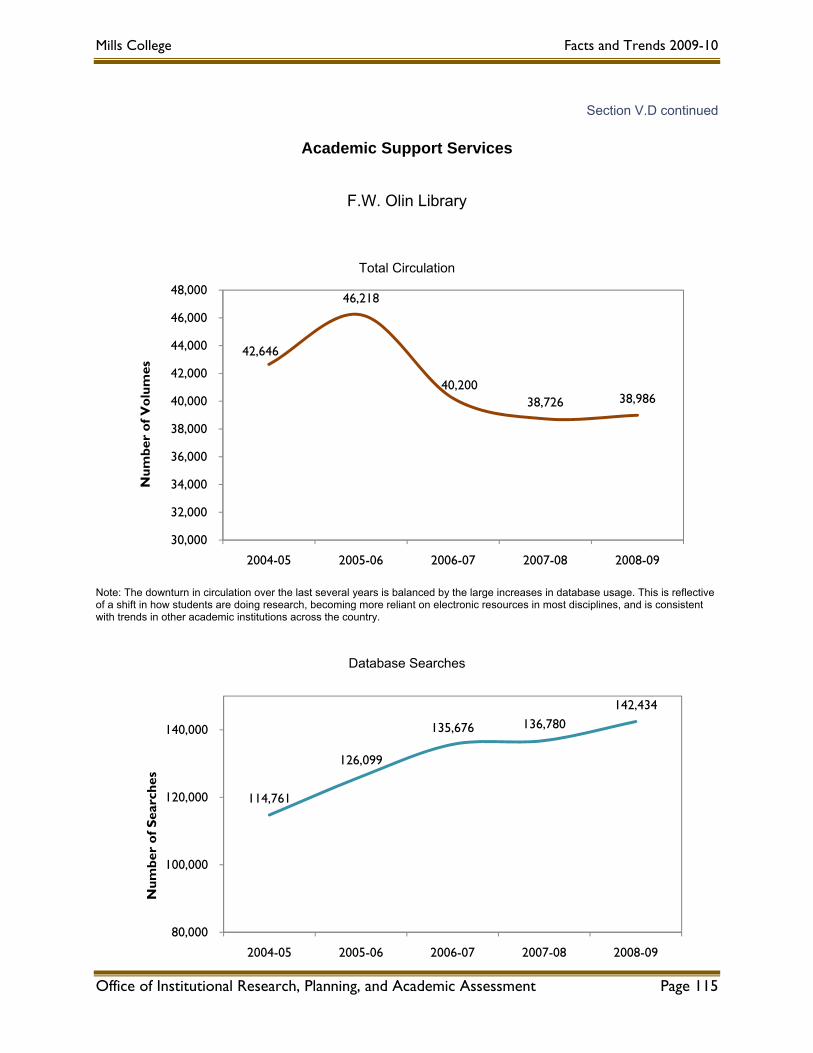
Mills College Facts and Trends 2009-10
Section V.D continued
Academic Support Services
F.W. Olin Library
Total Circulation
42,646
46,218
40,200 38,726 38,986
30,000
32,000
34,000
36,000
38,000
40,000
42,000
44,000
46,000
48,000
2004-05 2005-06 2006-07 2007-08 2008-09
Num
ber
of V
olum
es
Note: The downturn in circulation over the last several years is balanced by the large increases in database usage. This is reflective of a shift in how students are doing research, becoming more reliant on electronic resources in most disciplines, and is consistent with trends in other academic institutions across the country.
Database Searches
114,761
126,099
135,676 136,780142,434
80,000
100,000
120,000
140,000
2004-05 2005-06 2006-07 2007-08 2008-09
Num
ber
of S
earc
hes
Office of Institutional Research, Planning, and Academic Assessment Page 115

Mills College Facts and Trends 2009-10
Section V.D continued
Academic Support Services
F.W. Olin Library
Reference Questions
3,388
2,899 2,707
3,156
2,614
1,000
1,500
2,000
2,500
3,000
3,500
4,000
4,500
5,000
2004-05 2005-06 2006-07 2007-08 2008-09
NU
mbe
r of
Que
stio
ns
Bound and Electronic Full-text Subscriptions
15,919 16,567
17,529
24,192
26,625
10,000
12,000
14,000
16,000
18,000
20,000
22,000
24,000
26,000
28,000
2004-05 2005-06 2006-07 2007-08 2008-09
Num
ber
of P
erio
dica
ls
Note: As of 2002-03 Bound and Electronic Full-text Subscriptions includes full-text periodical titles that are available and archived in databases.
Office of Institutional Research, Planning, and Academic Assessment Page 116

Mills College Facts and Trends 2009-10
Office of Institutional Research, Planning, and Academic Assessment Page 117
SECTION VI: PERSONNEL
Section VI.A FTE Funded Position Count by Functional Area
Core Activities
Auxiliary Enterprises and Non-Core Activities
Section VI.B Faculty FTE Summaries by Division and Department
Section VI.C Faculty Characteristics by Division and Department

Mills College Facts and Trends 2009-10
Section VI.A
VI.A FTE Funded Position Count by Functional Area
2008-09 Core Activities
(A) (A)-(B) (B)Core Activities Subtotal 2009-10 Net 2008-09
Department Faculty Teach Admin Prof Cler Serv Tech Staff Total Change TotalInstruction and Research110 Art/Art History 8.55 0.83 1.00 1.06 2.89 11.44 -0.13 11.57114 Dance 6.16 0.85 0.85 7.01 -0.46 7.47117 Intermedia 2.00 0.00 2.00 0.00 2.00118 Music 7.01 0.80 1.00 1.00 2.80 9.81 -0.49 10.30120 Letters 1.00 1.00 1.00 2.00 -0.20 2.20121 English 19.46 1.00 0.65 1.65 21.11 0.37 20.74124 Book Art 1.45 0.65 0.65 2.10 0.12 1.98125 French/Francophone Studies 2.17 0.13 0.13 2.30 -0.16 2.46126 Spanish/Spanish Am Studies 3.00 0.13 0.13 3.13 0.00 3.13131 Biology 6.34 0.75 1.17 1.92 8.26 -0.25 8.51133 Math/Computer Science 7.25 0.27 0.27 7.52 0.25 7.27135 Chemistry/Physics 7.66 0.50 0.60 1.10 8.76 -0.26 9.02136 Nursing 2.17 0.25 0.25 0.50 2.67 -0.17 2.84137 Psychology 5.00 0.75 0.75 5.75 -1.17 6.92141 Social Science 1.00 0.85 0.85 1.85 0.00 1.85142 Government 2.83 0.00 2.83 -0.17 3.00143 History 2.84 0.00 2.84 -0.33 3.17144 Philosophy 2.17 0.00 2.17 0.00 2.17145 Soc/Anthropology 5.83 0.00 5.83 0.08 5.75146 Economics/MBA 6.34 0.00 6.34 -0.33 6.67147 Public Policy 2.25 1.00 1.00 3.25 0.17 3.08148 MBA Program 3.71 3.00 1.15 4.15 7.86 1.58 6.28151 Education 15.03 2.83 1.70 4.53 19.56 1.62 17.94161 Institute of Civic Leadership 0.17 1.00 1.00 1.17 1.00 0.17191 Ethnic Studies 4.66 0.63 0.63 5.29 -0.84 6.13192 Women's Studies 2.17 0.35 0.35 2.52 -0.01 2.53Total Instruction and Research 128.22 0.00 0.00 11.96 10.46 0.00 4.73 27.15 155.37 0.22 155.15Academic Support315 Women's Leadership 0.00 0.00 -0.80 0.80410 Library 2.00 6.07 3.60 1.00 12.67 12.67 0.00 12.67412 Computing Services 1.00 3.50 4.50 4.50 -0.50 5.00416 Web Support 1.00 2.26 3.26 3.26 0.00 3.26420 Art Museum 1.00 2.00 3.00 3.00 0.00 3.00431 Audio Visual Services 0.92 3.00 3.92 3.92 0.00 3.92455 Children's School 1.00 9.24 1.00 0.83 12.07 12.07 -1.17 13.24461 Provost and Deans 4.95 3.53 8.48 8.48 -0.22 8.70467 Graduate Studies 1.00 1.53 1.00 3.53 3.53 0.00 3.53468 Institutional Research 1.00 1.00 2.00 2.00 0.00 2.00Total Academic Support 0.00 0.00 13.87 22.37 5.60 0.83 10.76 53.43 53.43 -1.89 56.12Student Services510 Dean of Students 9.00 5.84 3.72 18.56 18.56 1.64 16.92511 College Events 1.00 2.00 3.00 6.00 6.00 0.00 6.00520 Chapel 0.88 0.88 0.88 0.05 0.83530 Career Services 1.00 1.52 2.52 2.52 -0.48 3.00534 Counseling/Psych Services 1.00 0.85 1.85 1.85 0.21 1.64550 Admission 4.80 6.80 4.00 15.60 15.60 -0.20 15.80570 M Center 4.00 7.00 5.00 16.00 16.00 -0.06 16.06590 Athletics 6.95 2.00 3.03 11.98 11.98 0.07 11.91Total Student Services 0.00 6.95 22.80 27.92 12.72 3.00 0.00 73.39 73.39 1.23 72.16Institutional Support610 Office of President 2.72 0.50 2.00 1.00 6.22 6.22 -0.28 6.50617 Office of Legal Counsel 1.00 0.53 1.53 1.53 0.00 1.53621 VP & Treasurer 1.00 2.00 2.00 5.00 5.00 1.20 3.80622 Finance 3.00 1.00 2.49 6.49 6.49 0.00 6.49630 Empl Svcs/Payroll 2.00 2.00 2.00 6.00 6.00 0.20 5.80631 Mail and Copy Center 1.00 1.00 2.00 2.00 0.17 1.83640 Central Systems & Admin. Computing 3.00 7.50 10.50 10.50 0.50 10.00660 Instit Advancement 7.00 18.15 6.47 1.00 32.62 32.62 1.85 30.77670 Marketing 1.00 4.00 0.53 5.53 5.53 1.00 4.53Total Institutional Support 0.00 0.00 21.72 27.65 15.02 1.00 10.50 75.89 75.89 4.64 71.25Plant Operations and Maintenance710 Plant Supervision 2.00 1.00 3.00 3.00 1.00 2.00712 Building Maintenance 10.00 10.00 10.00 0.00 10.00714 Grounds 8.00 8.00 8.00 0.00 8.00720 Public Safety 2.00 1.00 1.00 12.40 16.40 16.40 0.00 16.40721 Hauling 1.00 1.00 1.00 0.00 1.00Total Plant Operations and Maint. 0.00 0.00 4.00 1.00 2.00 31.40 0.00 38.40 38.40 1.00 37.40
Office of Institutional Research, Planning, and Academic Assessment Page 118
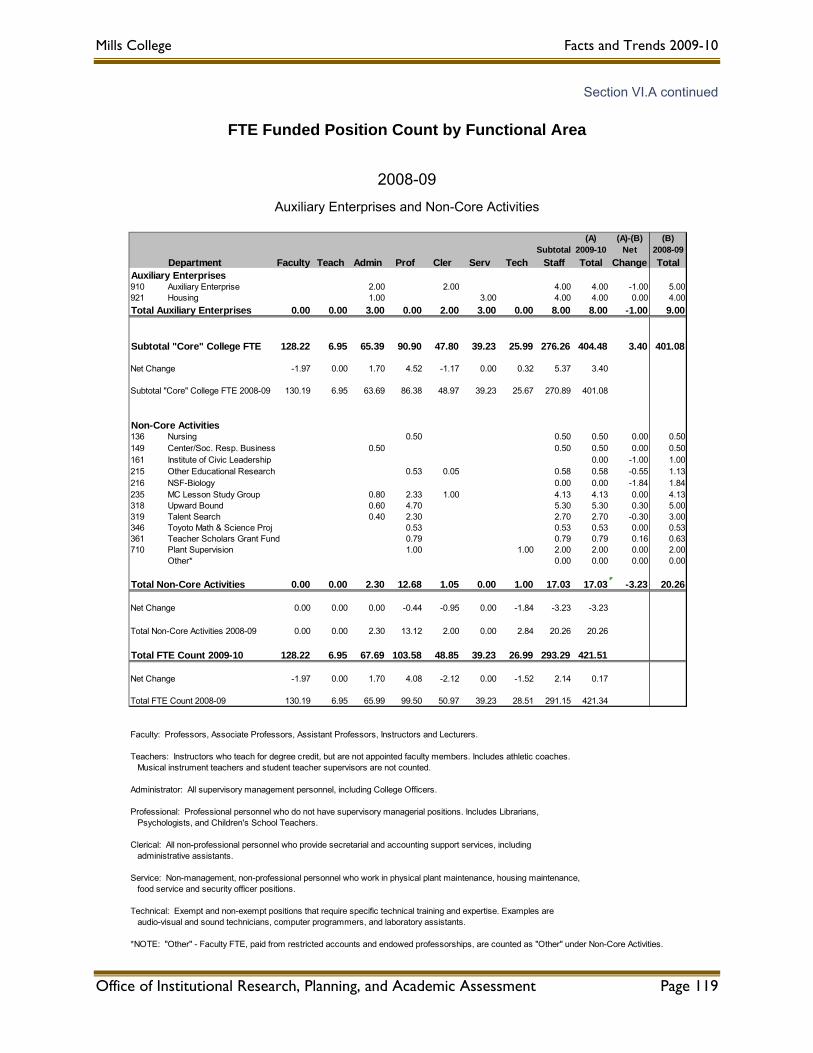
Mills College Facts and Trends 2009-10
Section VI.A continued
FTE Funded Position Count by Functional Area
2008-09
Auxiliary Enterprises and Non-Core Activities
(A) (A)-(B) (B)Subtotal 2009-10 Net 2008-09
Department Faculty Teach Admin Prof Cler Serv Tech Staff Total Change TotalAuxiliary Enterprises910 Auxiliary Enterprise 2.00 2.00 4.00 4.00 -1.00 5.00921 Housing 1.00 3.00 4.00 4.00 0.00 4.00Total Auxiliary Enterprises 0.00 0.00 3.00 0.00 2.00 3.00 0.00 8.00 8.00 -1.00 9.00
Subtotal "Core" College FTE 128.22 6.95 65.39 90.90 47.80 39.23 25.99 276.26 404.48 3.40 401.08
Net Change -1.97 0.00 1.70 4.52 -1.17 0.00 0.32 5.37 3.40
Subtotal "Core" College FTE 2008-09 130.19 6.95 63.69 86.38 48.97 39.23 25.67 270.89 401.08
Non-Core Activities136 Nursing 0.50 0.50 0.50 0.00 0.50149 Center/Soc. Resp. Business 0.50 0.50 0.50 0.00 0.50161 Institute of Civic Leadership 0.00 -1.00 1.00215 Other Educational Research 0.53 0.05 0.58 0.58 -0.55 1.13216 NSF-Biology 0.00 0.00 -1.84 1.84235 MC Lesson Study Group 0.80 2.33 1.00 4.13 4.13 0.00 4.13318 Upward Bound 0.60 4.70 5.30 5.30 0.30 5.00319 Talent Search 0.40 2.30 2.70 2.70 -0.30 3.00346 Toyoto Math & Science Proj 0.53 0.53 0.53 0.00 0.53361 Teacher Scholars Grant Fund 0.79 0.79 0.79 0.16 0.63710 Plant Supervision 1.00 1.00 2.00 2.00 0.00 2.00
Other* 0.00 0.00 0.00 0.00
Total Non-Core Activities 0.00 0.00 2.30 12.68 1.05 0.00 1.00 17.03 17.03 -3.23 20.26
Net Change 0.00 0.00 0.00 -0.44 -0.95 0.00 -1.84 -3.23 -3.23
Total Non-Core Activities 2008-09 0.00 0.00 2.30 13.12 2.00 0.00 2.84 20.26 20.26
Total FTE Count 2009-10 128.22 6.95 67.69 103.58 48.85 39.23 26.99 293.29 421.51
Net Change -1.97 0.00 1.70 4.08 -2.12 0.00 -1.52 2.14 0.17
Total FTE Count 2008-09 130.19 6.95 65.99 99.50 50.97 39.23 28.51 291.15 421.34
Faculty: Professors, Associate Professors, Assistant Professors, Instructors and Lecturers.
Teachers: Instructors who teach for degree credit, but are not appointed faculty members. Includes athletic coaches. Musical instrument teachers and student teacher supervisors are not counted.
Administrator: All supervisory management personnel, including College Officers.
Professional: Professional personnel who do not have supervisory managerial positions. Includes Librarians, Psychologists, and Children's School Teachers.
Clerical: All non-professional personnel who provide secretarial and accounting support services, including administrative assistants.
Service: Non-management, non-professional personnel who work in physical plant maintenance, housing maintenance, food service and security officer positions.
Technical: Exempt and non-exempt positions that require specific technical training and expertise. Examples are audio-visual and sound technicians, computer programmers, and laboratory assistants.
*NOTE: "Other" - Faculty FTE, paid from restricted accounts and endowed professorships, are counted as "Other" under Non-Core Activities.
Office of Institutional Research, Planning, and Academic Assessment Page 119

Mills College Facts and Trends 2009-10
Section VI.B
VI.B FTE Funded Position Count by Division and Department
Fall 2009
Department / Division Total FTE Core FTE Other FTE
EDUCATION* 15.03 14.32 0.7115.03 14.32 0.71
Art 8.55 8.55Dance 6.16 6.16Intermedia Arts/Video & Electr Art 2 2Music** 7.01 7.01
FINE ARTS 23.72 23.72 0.00
Book Arts 1.45 1.45English 19.46 19.46Ethnic Studies 4.66 4.66Letters 1 1French and Francophone Studies 2.17 5 0.17Spanish and Spanish Am Studies 3 3
LETTERS 31.74 33.74 0.17
Biology 6.34 6.34Chemistry & Physics 7.66 7.66Nursing 2.17 2.17Math & Computer Science 7.25 7.25Psychology 5 5
NATURAL SCIENCES 28.42 28.42 0.00
Economics & MBA 10.05 10.05Government 2.83 2.83History 2.84 2.84ICL 0.17 0.17Philosophy 2.17 2.17Public Policy 2.25 2.25Social Science 1 1Sociology & Anthropology 5.83 5.83Women's Studies 2.17 2.17
SOCIAL SCIENCES 29.31 29.31 0.00
GRAND TOTAL - 2009 128.22 127.34 0.88
* Supervisors of Student Teachers are not included.** Individual lesson instructors are not included
are not included.
"Core FTE" = Salary FTE paid from the regular faculty salary budget."Other FTE" = Salary FTE paid from restricted accounts. Endowed professorships
All figures as of Fall 2009.
"Total FTE" = Salary FTE for all salaried members of the faculty from any source.
Office of Institutional Research, Planning, and Academic Assessment Page 120

Mills College Facts and Trends 2009-10
Section VI.C
VI.C Faculty Characteristics by Division and Department
Fall Semester 2009 and Fall 2005 - Fall 2008 Summary Data
Department Head Count Tenured Tenure-Track Women Of Color Terml. Deg. Head Count Women Of Color Terml. Deg.Education* 11 9 1 9 3 10 16 14 6 9
EDUCATION 11 9 1 9 3 10 16 14 6 9Art 5 5 4 2 8 5 2 7Dance 4 1 3 1 5 4 2 1Fine ArtsIntermedia Arts/Video & Electr Art 2 1 1 1 1 0Music** 6 3 1 2 2 4 5 3 4
FINE ARTS 17 8 3 10 3 8 18 12 4 12Book Arts 1 1 1 1English 10 9 1 8 3 10 17 14 3 14Ethnic Studies 4 4 4 4 4 2 2 2 2Letters 1 1 1Modern LanguagesFrench & Francophone Studies 2 2 1 1 2 0Spanish & Spanish-American Studies 3 2 2 2 3 0
LETTERS 21 18 1 16 10 20 20 17 6 16Biology 6 3 1 3 1 6 2 2 1 2Chemistry & Physics 5 4 1 3 5 6 4 1 4Math & Computer Science 7 5 6 1 7 2 1 1 1Nursing 1 1 1 2Psychology 5 4 1 3 1 5 0
NATURAL SCIENCES & MATH 24 16 3 16 3 24 12 7 3 8Economics & MBA 5 3 2 2 5 12 7 2 7Government 2 2 2 1 1 1History 2 2 1 2 1 1ICL 0 1Philosophy 2 1 1 2 1 1Public Policy 2 1 1 2 2 0 0 1Social Science 0 2Sociology & Anthropology 5 5 0 2 2 5 2 1 0 2Women's Studies 2 1 2 2
SOCIAL SCIENCES 20 15 2 7 4 20 22 12 3 15
GRAND TOTAL 93 66 10 58 23 82 88 62 22 60PERCENT OF TOTAL 100% 71% 11% 62% 25% 88% 100% 70% 25% 68%
Fall 2008 96 66 11 59 25 85 103 73 24 61Fall 2007 94 67 10 57 24 82 97 71 22 54Fall 2006 90 65 13 56 24 80 129 87 31 76Fall 2005 89 58 14 53 19 81 94 70 24
Fall 2009 notes:* Education Dept. Supervisor of Student Teachers are not included** Individual Lesson instructors not includedScheinberg, Kahne, Thornborrow, Sheldon, Workman not counted as faculty; ** per David Gin, list Bi/Multiracial faculty as faculty of colorGreer not counted as facultyWOMEN'S STUDIES PROGRAM IS NOW PART OF SOC SCI DIVISION, AS OF FALL 2009FACULTY TEACHING IN MULTIPLE DEPARTMENTS ARE ONLY COUNTED ONCE (Edwards, McEntyre, Cone, Walter)
FULL-TIME PART-TIME
1
1
1 1 1
2 0 1
Office of Institutional Research, Planning, and Academic Assessment Page 121

Mills College Facts and Trends 2009-10
Office of Institutional Research, Planning, and Academic Assessment Page 122
SECTION VII: FUND-RAISING
Section VII.A Summary of Fund-raising by Source
Section VII.B Total Gifts to the College
Section VII.C Gifts to the College by Fund Type
Section VII.D Gifts to the College by Designation
Section VII.E Bequests and Planned Gifts to the College
Section VII.F Comparison of Voluntary Support by Type of Institution
Section VII.G Comparison of Voluntary Support with Women’s Colleges
Section VII.H Gifts to the College and the Alumnae Association by Alumnae
Section VII.I Alumnae Fund Gifts by Source
Section VII.J Class Gift Fund Accumulations

Mills College Facts and Trends 2009-10
Section VII.A
VII.A Summary of Fund-raising by Source
FY2005 - FY2009
2004-05 2005-06 2006-07 2007-08 2008-09 % of Total
Trustees $6,972,803 $1,424,885 $326,678 $911,026 $563,847 3%Alumnae $6,715,845 $2,536,043 $4,668,519 $2,493,330 $1,689,707 9%Parents $206,118 $150,547 $1,123,048 $1,142,584 $61,927 0%Friends $246,043 $218,144 $207,017 $196,084 $2,178,534 12%Corporations $378,375 $196,650 $382,695 $179,901 $525,554 3%Foundations $3,342,084 $17,137,324 $9,289,852 $7,901,902 $4,268,613 23%Estates $12,581,568 $4,808,624 $1,100,247 $8,373,125 $8,912,354 49%Other $1,073,650 $52,152 $99,623 $339,807 $6,057 0%
Total $31,516,486 $26,524,368 $17,197,679 $21,537,759 $18,206,592 100%
Sources of Giving FY 2008-09
Trustees, 3%Alumnae, 0%
Parents, 0%
Friends, 12%
Corporations, 3%
Foundations, 23%
Estates, 49%
Other, 0%
Office of Institutional Research, Planning, and Academic Assessment Page 123
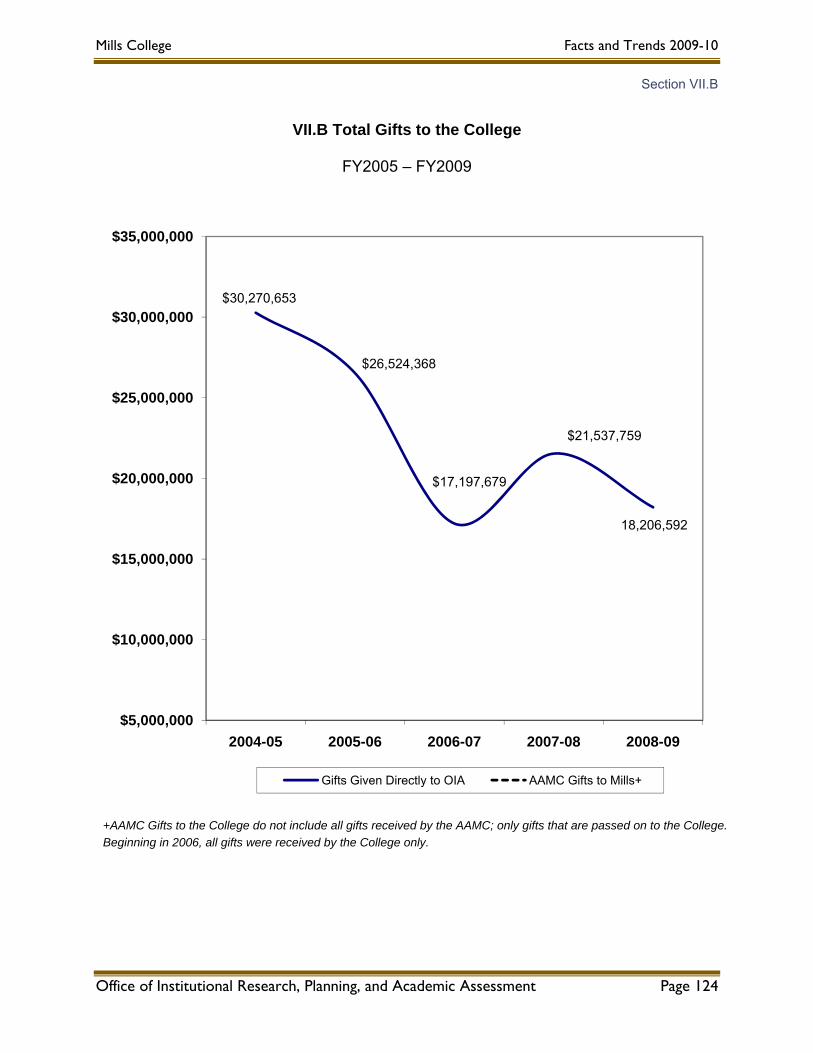
Mills College Facts and Trends 2009-10
Section VII.B
VII.B Total Gifts to the College
FY2005 – FY2009
$30,270,653
$26,524,368
$17,197,679
$21,537,759
18,206,592
$5,000,000
$10,000,000
$15,000,000
$20,000,000
$25,000,000
$30,000,000
$35,000,000
2004-05 2005-06 2006-07 2007-08 2008-09
Gifts Given Directly to OIA AAMC Gifts to Mills+
+AAMC Gifts to the College do not include all gifts received by the AAMC; only gifts that are passed on to the College. Beginning in 2006, all gifts were received by the College only.
Office of Institutional Research, Planning, and Academic Assessment Page 124
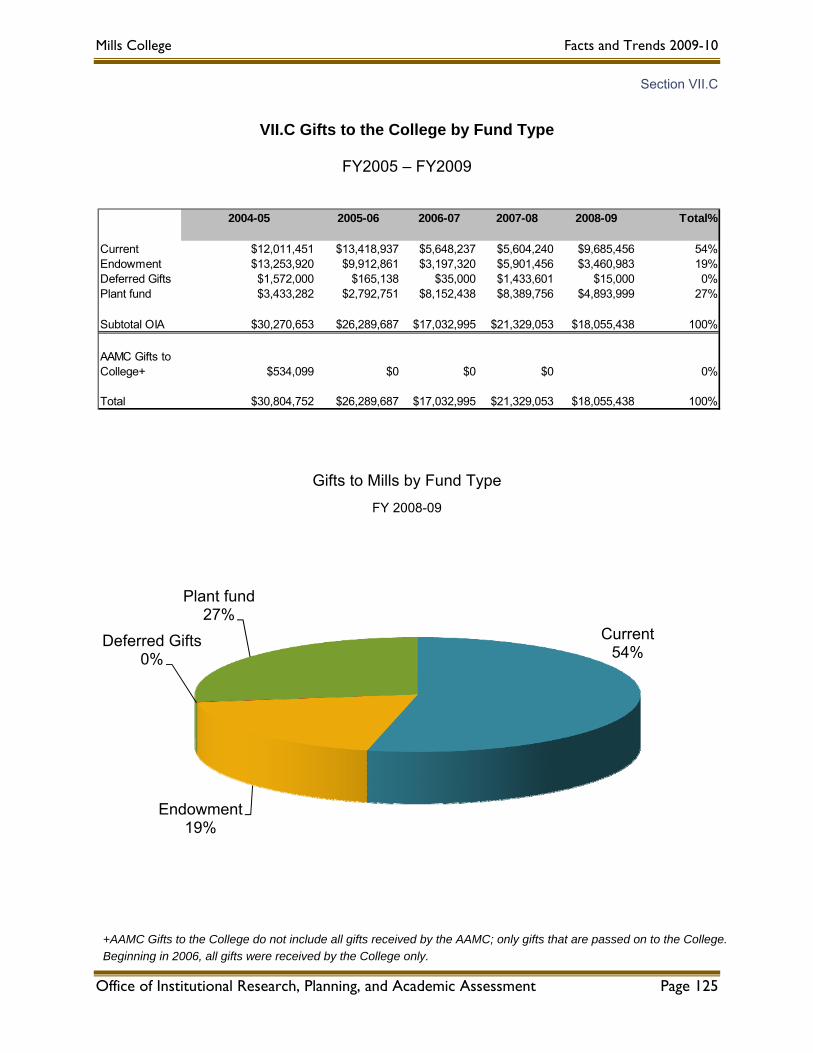
Mills College Facts and Trends 2009-10
Section VII.C
VII.C Gifts to the College by Fund Type
FY2005 – FY2009
2004-05 2005-06 2006-07 2007-08 2008-09 Total%
Current $12,011,451 $13,418,937 $5,648,237 $5,604,240 $9,685,456 54%Endowment $13,253,920 $9,912,861 $3,197,320 $5,901,456 $3,460,983 19%Deferred Gifts $1,572,000 $165,138 $35,000 $1,433,601 $15,000 0%Plant fund $3,433,282 $2,792,751 $8,152,438 $8,389,756 $4,893,999 27%
Subtotal OIA $30,270,653 $26,289,687 $17,032,995 $21,329,053 $18,055,438 100%
AAMC Gifts to College+ $534,099 $0 $0 $0 0%
Total $30,804,752 $26,289,687 $17,032,995 $21,329,053 $18,055,438 100%
Gifts to Mills by Fund Type FY 2008-09
Current54%
Endowment19%
Deferred Gifts0%
Plant fund27%
+AAMC Gifts to the College do not include all gifts received by the AAMC; only gifts that are passed on to the College. Beginning in 2006, all gifts were received by the College only.
Office of Institutional Research, Planning, and Academic Assessment Page 125
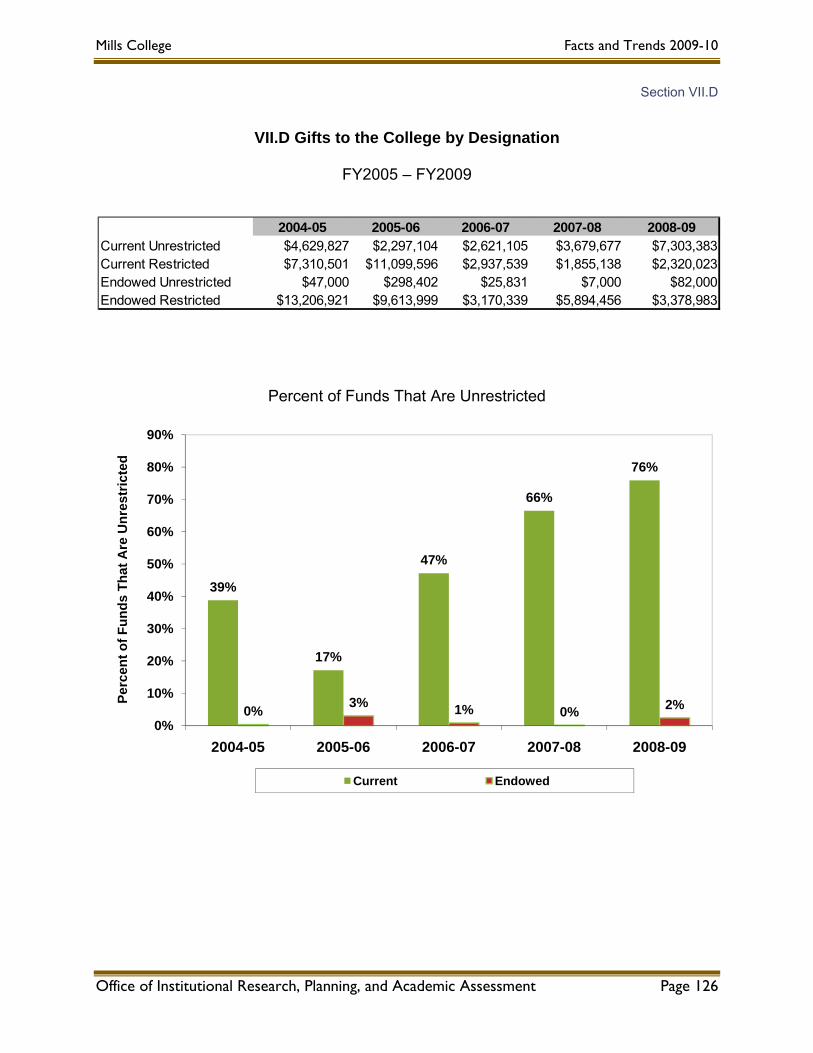
Mills College Facts and Trends 2009-10
Section VII.D
VII.D Gifts to the College by Designation
FY2005 – FY2009
2004-05 2005-06 2006-07 2007-08 2008-09Current Unrestricted $4,629,827 $2,297,104 $2,621,105 $3,679,677 $7,303,383Current Restricted $7,310,501 $11,099,596 $2,937,539 $1,855,138 $2,320,023Endowed Unrestricted $47,000 $298,402 $25,831 $7,000 $82,000Endowed Restricted $13,206,921 $9,613,999 $3,170,339 $5,894,456 $3,378,983
Percent of Funds That Are Unrestricted
39%
17%
47%
66%
76%
0% 3% 1% 0% 2%0%
10%
20%
30%
40%
50%
60%
70%
80%
90%
2004-05 2005-06 2006-07 2007-08 2008-09
Perc
ent o
f Fun
ds T
hat A
re U
nres
tric
ted
Current Endowed
Office of Institutional Research, Planning, and Academic Assessment Page 126

Mills College Facts and Trends 2009-10
Section VII.E
VII.E Bequests and Planned Gifts to the College
FY2005 – FY2009
2004-05 2005-06 2006-07 2007-08 2008-09
Estates $12,568,168 $4,808,624 $1,100,247 $8,373,125 $8,912,354Deferred Gifts $1,572,000 $165,138 $35,000 $433,601 $15,000
Total $14,140,168 $4,973,761 $1,135,247 $8,806,726 $8,927,354
$12,568,168
$4,808,624
$1,100,247
$8,373,125 $8,912,354
$1,572,000
$165,138 $35,000$433,601
$15,000$0
$5,000,000
$10,000,000
$15,000,000
2004-05 2005-06 2006-07 2007-08 2008-09
Estates Deferred Gifts
Office of Institutional Research, Planning, and Academic Assessment Page 127

Mills College Facts and Trends 2009-10
Section VII.F
VII.F Comparison of Voluntary Support by Type of Institution
FY2005 – FY2009
YearType of Institution
In Thousands In Thousands
2004-05Masters Private 136 $1,126,080 $8,280Liberal Arts Private 287 $2,472,505 $8,615Women’s Liberal Arts Pvt. 18 $325,890 $18,105MILLS -- -- $31,516
2005-06Masters Private 146 $1,331,484 $9,120Liberal Arts Private 277 $2,709,009 $9,780Women’s Liberal Arts Pvt. 17 $268,492 $15,794MILLS -- -- $26,524
2006-07Masters Private 183 $1,568,891 $8,573Liberal Arts Private 235 $2,701,191 $11,494Women’s Liberal Arts Pvt. 23 $258,499 $14,361MILLS -- -- $17,197
2007-08Masters Private 159 $1,320,597 $8,305Liberal Arts Private 231 $2,717,678 $11,765Women’s Liberal Arts Pvt. 13 $182,782 $14,060MILLS $21,5372008-09Masters Private 170 $1,337,646 $7,868Liberal Arts Private 228 $2,183,448 $9,534Women’s Liberal Arts Pvt. 22 $200,589 $13,372MILLS $18,206
# Institutions Reporting
Total Raised per Category
Avg. per Institution
Source: Voluntary Support of Education report produced by the council for Financial Aid to Education.
Office of Institutional Research, Planning, and Academic Assessment Page 128

Mills College Facts and Trends 2009-10
Section VII.G
VII.G Comparison of Voluntary Support with Women’s Colleges
FY2005 – FY2009
$18,104,503
$16,716,987 $14,361,060 $14,060,177 $13,372,625
$17,197,679
$21,537,759
$17,197,661
$21,537,759
$18,206,592
$0
$5,000,000
$10,000,000
$15,000,000
$20,000,000
$25,000,000
$30,000,000
$35,000,000
2004-05 2005-06 2006-07 2007-08 2008-09
Women's College Average Mills and AAMC Totals+
Source: Voluntary Support of Education report produced by the Council for Financial Aid to Education. +AAMC Gifts to the College do not include all gifts received by the AAMC; only gifts that are passed on to the College. Beginning in 2006, all gifts were received by the College only.
Office of Institutional Research, Planning, and Academic Assessment Page 129

Mills College Facts and Trends 2009-10
Section VII.H
VII.H Gifts to the College and the Alumnae Association by Alumnae
FY2005 – FY2009
Gifts by Degree Type
2004-05 2005-06 2006-07 2007-08 2008-09
Total Alumnae Giving * $9,063,011 $2,728,701 $5,951,888 $2,964,722 $1,883,800
Mills BA's of record $10,120 $10,199 $10,323 $10,497 $11,263Mills BA's solicited $9,026 $10,199 $9,519 $9,766 $9,566Mills BA donors $2,823 $2,545 $2,466 $2,530 $2,505% of BA's giving 31% 25% 26% 26% 26%Amount given $7,528,401 $2,266,020 $4,568,658 $2,433,376 $1,594,094
All undergraduates solicited $11,635 $19,603 $17,275 $15,755 $13,694All undergraduate donors $3,130 $3,301 $3,136 $3,285 $3,028% of all undergrad giving 27% 17% 18% 21% 22%
Mills graduate degrees of record $3,216 $2,623 $2,783 $2,917 $3,079Mills graduate degrees solicited $3,201 $2,623 $2,561 $2,713 $2,739Mills grad degree donors $206 $118 $218 $251 $248% grad degrees giving 6% 4% 9% 9% 9%Amount given $1,097,916 $35,642 $45,641 $325,411 $93,572
Non-degree/diploma of record $8,537 $9,404 $6,952 $7,003 $7,497Non-degree/diploma solicited $3,091 $9,404 $5,862 $5,989 $5,639Non-degree/diploma donors $674 $638 $670 $755 $619% non-degree/diploma giving 22% 7% 11% 13% 11%Amount given $436,694 $427,039 $1,337,589 $205,685 $195,979
Office of Institutional Research, Planning, and Academic Assessment Page 130

Mills College Facts and Trends 2009-10
Section VII.I
VII.I Alumnae Fund Gifts by Source
FY2005 – FY2009
2004-05 2005-06 2006-07 2007-08 2008-09 % of TotalTotal Giving $1,244,831 $2,616,502 $2,621,007 $1,902,384 $1,460,620 100%Trustees+++ N/A $104,717 $144,290 $129,375 $111,382 8%Alumnae $1,062,781 $1,385,577 $1,147,395 $1,370,322 $1,069,485 73%Foundations $82,237 $168,465 $221,582 $202,389 $125,473 9%Corp. Matching $70,932 $67,500 $61,206 $66,728 $57,711 4%Friends/parents $15,481 $105,044 $65,764 $108,570 $94,069 6%Bequests $13,400 $785,199 $980,770 $25,000 $2,500 0%
2008-09
Trustees+++8%
Alumnae73%
Foundations9%
Corp. Matching4%
Friends/parents6%
Bequests0%
+++Prior to 2005-06, trustees were not reported as a separate source of giving.
Office of Institutional Research, Planning, and Academic Assessment Page 131

Mills College Facts and Trends 2009-10
Section VII.J
VII.J Class Gift Fund Accumulations
$40,885
$21,085
$51,567
$17,616
$49,105
$26,704 $26,201
$61,182
$6,162
$24,391
$30,028
$85,709
$29,188
$8,180
$21,496
$33,618
$16,680
$41,504
$18,349
Class of 1956 Class of 1957 Class of 1958 Class of 1959 Class of 1960 Class of 1961
2004-05 2005-06 2006-07 2007-08 2008-09
Note: Three years prior to its 50th Reunion, each class establishes a 50-Year Class Gift Fund for individual donations to be held in trust by the College. The gift is presented to the College at the Class 5-Year Reunion (i.e. the Class of 1957 gift is presented in the fall of 2007).
Office of Institutional Research, Planning, and Academic Assessment Page 132
Mills College Facts and Trends 2009-10
Office of Institutional Research, Planning, and Academic Assessment Page 133
SECTION VIII: FINANCIAL SUMMARY
Section VIII.A Statement of Activities
Section VIII.B Statement of Financial Position and Net Assets
Section VIII.C Operating Budget
Section VIII.D Components of Core Operating Revenues and Coverage of Expenses
Section VIII.E Components of Core Operating Expenses
Section VIII.F Student Revenues and Components of Student Aid
Section VIII.G Student Tuition and Fee Information
Section VIII.H Endowment Investment Information
Section VIII.I Financial Ratios

Mills College Facts and Trends 2009-10
Section VIII.A
VIII.A Statement of Activities (from Audited Financial Statements)
2005 2006 2007 2008 2009Revenue and gains:
Tuition and fees $ 25,900,155 31,516,111 35,559,336 39,772,178 43,508,570 Less financial aid (9,282,016) (12,291,805) (13,930,515) (16,687,873) (17,934,504)
Net tuition and fees 16,618,139 19,224,306 21,628,821 23,084,305 25,574,066
7,107,737 8,057,449 8,349,538 8,351,214 8,523,132
5,877,082 4,330,606 6,668,916 5,953,423 21,330,366
2,871,202 2,741,048 2,691,085 2,473,939 2,495,425
8,356,534 8,639,013 9,190,720 11,494,007 12,123,750 Other, net 2,257,608 2,759,716 3,218,772 3,396,123 2,658,504
43,088,302 45,752,138 51,747,852 54,753,011 72,705,243
Expenses:Instruction 15,897,367 17,953,005 20,328,091 20,564,003 21,334,648 Research 1,385,117 1,180,542 1,323,390 1,575,930 1,224,182 Academic support 6,268,651 6,919,155 6,289,382 6,869,858 6,841,362 Student services 6,660,226 7,289,089 8,622,627 9,416,015 9,768,113 Institutional support 6,794,017 8,345,208 10,972,453 11,683,234 11,840,083 Public service 1,398,814 1,153,691 1,119,380 869,843 1,343,696 Auxiliary enterprises 7,000,320 7,722,848 8,242,276 9,563,149 9,913,456
Total expenses 45,404,512 50,563,537 56,897,599 60,542,032 62,265,540
Excess (deficiency) of revenues over(under) expenses before other changes in net assets (2,316,210) (4,811,399) (5,149,747) (5,789,021) 10,439,703
Other changes in net assets:Nonoperating contributions 26,250,624 8,121,949 12,816,279 20,114,245 3,844,950 Pledges written off (228,151) (85,437) (33,733) 76,407 (85,964) Investment (loss) return, net of
allocation to operations 8,878,803 10,928,013 27,246,958 (22,709,591) (58,480,012) Actuarial adjustment 215,624 (136,161) 532,806 (569,536) (1,320,498) Other nonoperating revenue 24,925 458,925 36,807 41,031 18,356 Loss on bond refunding (244,834) Cumulative effect of accounting change (140,946)
Change in total net assets 32,825,615 14,090,110 35,449,370 (8,836,465) (45,583,465)
Net assets at beginning of period 229,378,033 262,203,648 276,293,758 311,743,128 302,906,663
Net assets at end of period $ 262,203,648 276,293,758 311,743,128 302,906,663 257,323,198
Investment returns allocated to operations
Total revenues, gains and other support
Sales and services of auxiliary enterprisesContributions available for operations Contracts and other exchange transactions
Office of Institutional Research, Planning, and Academic Assessment Page 134
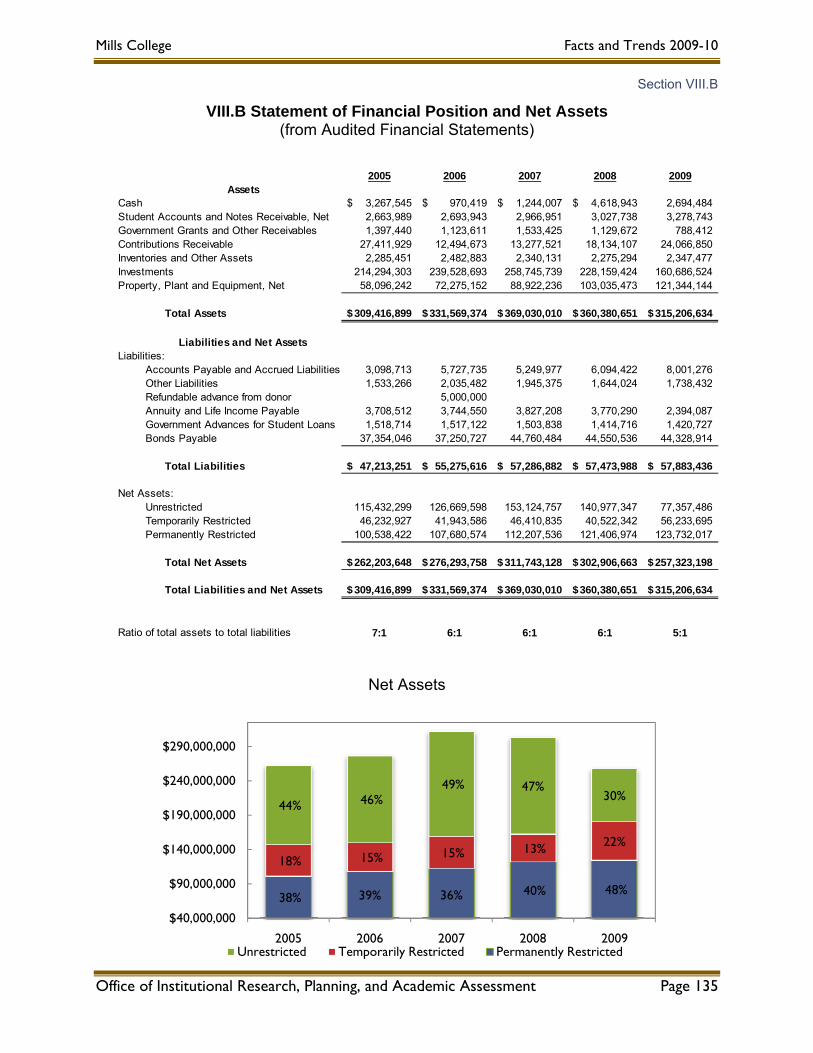
Mills College Facts and Trends 2009-10
Section VIII.B
VIII.B Statement of Financial Position and Net Assets (from Audited Financial Statements)
2005 2006 2007 2008 2009Assets
Cash 3,267,545$ 970,419$ 1,244,007$ 4,618,943$ 2,694,484 Student Accounts and Notes Receivable, Net 2,663,989 2,693,943 2,966,951 3,027,738 3,278,743 Government Grants and Other Receivables 1,397,440 1,123,611 1,533,425 1,129,672 788,412 Contributions Receivable 27,411,929 12,494,673 13,277,521 18,134,107 24,066,850 Inventories and Other Assets 2,285,451 2,482,883 2,340,131 2,275,294 2,347,477 Investments 214,294,303 239,528,693 258,745,739 228,159,424 160,686,524 Property, Plant and Equipment, Net 58,096,242 72,275,152 88,922,236 103,035,473 121,344,144
Total Assets 309,416,899$ 331,569,374$ 369,030,010$ 360,380,651$ 315,206,634$
Liabilities and Net AssetsLiabilities:
Accounts Payable and Accrued Liabilities 3,098,713 5,727,735 5,249,977 6,094,422 8,001,276 Other Liabilities 1,533,266 2,035,482 1,945,375 1,644,024 1,738,432 Refundable advance from donor 5,000,000 Annuity and Life Income Payable 3,708,512 3,744,550 3,827,208 3,770,290 2,394,087 Government Advances for Student Loans 1,518,714 1,517,122 1,503,838 1,414,716 1,420,727 Bonds Payable 37,354,046 37,250,727 44,760,484 44,550,536 44,328,914
Total Liabilities 47,213,251$ 55,275,616$ 57,286,882$ 57,473,988$ 57,883,436$
Net Assets:Unrestricted 115,432,299 126,669,598 153,124,757 140,977,347 77,357,486 Temporarily Restricted 46,232,927 41,943,586 46,410,835 40,522,342 56,233,695 Permanently Restricted 100,538,422 107,680,574 112,207,536 121,406,974 123,732,017
Total Net Assets 262,203,648$ 276,293,758$ 311,743,128$ 302,906,663$ 257,323,198$
Total Liabilities and Net Assets 309,416,899$ 331,569,374$ 369,030,010$ 360,380,651$ 315,206,634$
Ratio of total assets to total liabilities 7:1 6:1 6:1 6:1 5:1
Net Assets
38% 39% 36% 40% 48%
18% 15% 15% 13% 22%
44% 46%49% 47%
30%
$40,000,000
$90,000,000
$140,000,000
$190,000,000
$240,000,000
$290,000,000
2005 2006 2007 2008 2009Unrestricted Temporarily Restricted Permanently Restricted
Office of Institutional Research, Planning, and Academic Assessment Page 135
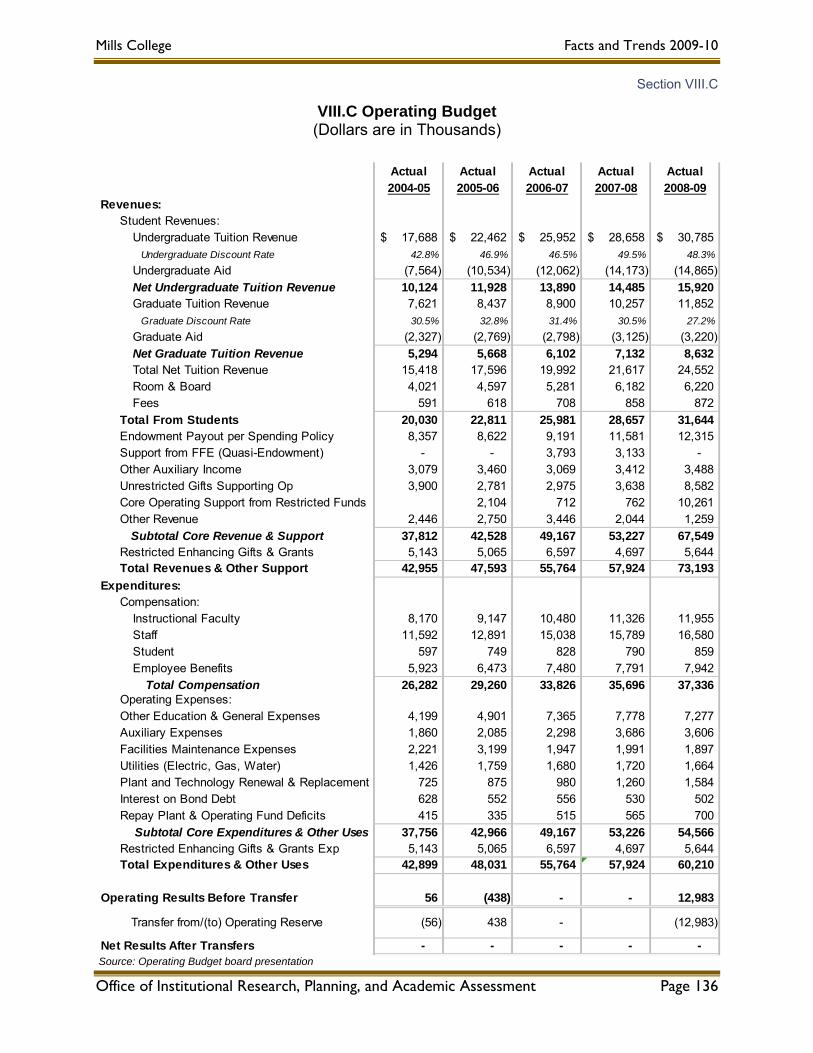
Mills College Facts and Trends 2009-10
Section VIII.C
VIII.C Operating Budget (Dollars are in Thousands)
Source: Operating Budget board presentation
Actual Actual Actual Actual Actual2004-05 2005-06 2006-07 2007-08 2008-09
Revenues:Student Revenues:
Undergraduate Tuition Revenue 17,688$ 22,462$ 25,952$ 28,658$ 30,785$ Undergraduate Discount Rate 42.8% 46.9% 46.5% 49.5% 48.3%Undergraduate Aid (7,564) (10,534) (12,062) (14,173) (14,865) Net Undergraduate Tuition Revenue 10,124 11,928 13,890 14,485 15,920 Graduate Tuition Revenue 7,621 8,437 8,900 10,257 11,852 Graduate Discount Rate 30.5% 32.8% 31.4% 30.5% 27.2%Graduate Aid (2,327) (2,769) (2,798) (3,125) (3,220) Net Graduate Tuition Revenue 5,294 5,668 6,102 7,132 8,632 Total Net Tuition Revenue 15,418 17,596 19,992 21,617 24,552 Room & Board 4,021 4,597 5,281 6,182 6,220 Fees 591 618 708 858 872
Total From Students 20,030 22,811 25,981 28,657 31,644 Endowment Payout per Spending Policy 8,357 8,622 9,191 11,581 12,315 Support from FFE (Quasi-Endowment) - - 3,793 3,133 - Other Auxiliary Income 3,079 3,460 3,069 3,412 3,488 Unrestricted Gifts Supporting Op 3,900 2,781 2,975 3,638 8,582 Core Operating Support from Restricted Funds 2,104 712 762 10,261 Other Revenue 2,446 2,750 3,446 2,044 1,259 Subtotal Core Revenue & Support 37,812 42,528 49,167 53,227 67,549 Restricted Enhancing Gifts & Grants 5,143 5,065 6,597 4,697 5,644 Total Revenues & Other Support 42,955 47,593 55,764 57,924 73,193
Expenditures:Compensation:
Instructional Faculty 8,170 9,147 10,480 11,326 11,955 Staff 11,592 12,891 15,038 15,789 16,580 Student 597 749 828 790 859 Employee Benefits 5,923 6,473 7,480 7,791 7,942
Total Compensation 26,282 29,260 33,826 35,696 37,336 Operating Expenses:Other Education & General Expenses 4,199 4,901 7,365 7,778 7,277 Auxiliary Expenses 1,860 2,085 2,298 3,686 3,606 Facilities Maintenance Expenses 2,221 3,199 1,947 1,991 1,897 Utilities (Electric, Gas, Water) 1,426 1,759 1,680 1,720 1,664 Plant and Technology Renewal & Replacement 725 875 980 1,260 1,584 Interest on Bond Debt 628 552 556 530 502 Repay Plant & Operating Fund Deficits 415 335 515 565 700 Subtotal Core Expenditures & Other Uses 37,756 42,966 49,167 53,226 54,566 Restricted Enhancing Gifts & Grants Exp 5,143 5,065 6,597 4,697 5,644 Total Expenditures & Other Uses 42,899 48,031 55,764 57,924 60,210
Operating Results Before Transfer 56 (438) - - 12,983
Transfer from/(to) Operating Reserve (56) 438 - (12,983)
Net Results After Transfers - - - - -
Office of Institutional Research, Planning, and Academic Assessment Page 136

Mills College Facts and Trends 2009-10
Section VIII.D
VIII.D Components of Core Operating Revenues and Coverage of Expenses
Office of Institutional Research, Planning, and Academic Assessment Page 137
Section VIII.E
14% 15% 13%
11%12% 7%
22%20% 19%
12%12% 12%
41%
41% 41%
$-
$5,000
$10,000
$15,000
$20,000
$25,000
$30,000
$35,000
$40,000
$45,000
$50,000
$55,000
$60,000
$65,000
$70,000
FY05 FY06 FY07
Core Operating Net Revenues and with Revenues as %
(in thousands)
10% 8%
8%
35%22%
23%
13%
13%41%
45%
FY08 FY09
Core Operating Expenses, of Expense
Net Tuition Revenue
Room & Board & Other Student Fee Revenue
Endowment Payout
Gift Support
Other Auxiliary, Indirect Cost Recovery & Misc Revenue
Core Operating Expenses
Total Core Net Revenues
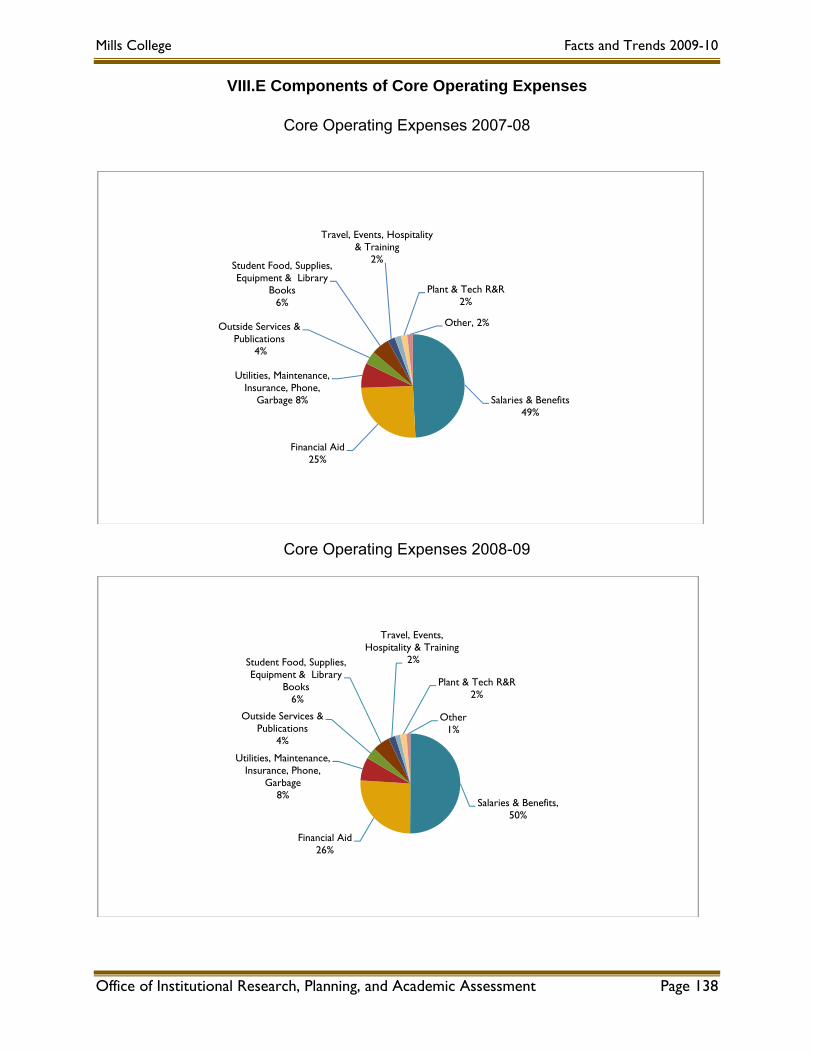
Mills College Facts and Trends 2009-10
VIII.E Components of Core Operating Expenses
Core Operating Expenses 2007-08
Office of Institutional Research, Planning, and Academic Assessment Page 138
Salaries & Benefits49%
Financial Aid25%
Utilities, Maintenance, Insurance, Phone,
Garbage 8%
Outside Services & Publications
4%
Student Food, Supplies, Equipment & Library
Books6%
Travel, Events, Hospitality & Training
2%
Plant & Tech R&R 2%
Other, 2%
Core Operating Expenses 2008-09
Salaries & Benefits,50%
Financial Aid26%
Utilities, Maintenance, Insurance, Phone,
Garbage8%
Outside Services & Publications
4%
Student Food, Supplies, Equipment & Library
Books6%
Travel, Events, Hospitality & Training
2%
Plant & Tech R&R 2%
Other1%

Mills College Facts and Trends 2009-10
Section VIII.F
VIII.F Student Revenues and Components of Student Aid
Components of Net Revenue from Students (in thousands)
$20,030
$22,811
$25,981
$28,657
$31,644
$10,124$11,928
$13,890 $14,485$15,920
$5,294 $5,668 $6,102$7,132
$8,632
$4,612 $5,215 $5,989$7,040 $7,092
$-
$5,000
$10,000
$15,000
$20,000
$25,000
$30,000
$35,000
FY05 FY06 FY07 FY08 FY09
Total Net Student Revenue
Net Undergraduate Tuition Revenue
Net Graduate Tuition Revenue
Room & Board & Other Student Fee Revenue
Tuition Revenue and Components of Financial Aid
(in thousands)
$0
$5,000
$10,000
$15,000
$20,000
$25,000
$30,000
$35,000
$40,000
$45,000
FY05 FY06 FY07 FY08 FY09
Gift Funded Aid
Endowment Funded Aid
Mills Funded Aid
Total Financial Aid from Core Operating FundsTuition Revenue
Office of Institutional Research, Planning, and Academic Assessment Page 139

Mills College Facts and Trends 2009-10
Section VIII.G
VIII.G Student Tuition and Fee Information
Mills College Undergraduate Tuition, Fees, Room and Board
Academic
Year
Undergraduate Tuition and
Fees %
Increase
Room and
Board %
Increase
Undergraduate
Total %
Increase 2004-05 $26,050 6% $9,400 5% $35,450 6% 2005-06 $28,600 10% $9,880 5% $38,480 9% 2006-07 $31,191 9% $10,290 4% $41,481 8% 2007-08 $33,510 7% $10,820 5% $44,330 7% 2008-09 $35,190 5% $11,270 4% $46,460 5% 2009-10 $36,328 3% $11,480 2% $47,808 3%
Undergraduate Tuition & Fee Comparison
Source: Cambridge Associates, "Student Charges, Academic Year 2009-10"
2009-10 Tuition &
Mandatory Fees
2009-10 Room & Board
2009-10 Total Student Charges
% Increase
from 2008-09
Harvey Mudd College AICCU 3 38,467$ 12,570$ 51,037$ 5%Claremont McKenna College AICCU 3 38,510$ 12,525$ 51,035$ 4%Scripps College AICCU 3 38,700$ 11,850$ 50,550$ 2%Mills College AICCU 3 36,328$ 11,480$ 47,808$ 3%Pomona College AICCU 3 37,017$ 12,651$ 49,668$ 4%Occidental College AICCU 3 38,471$ 10,780$ 49,251$ 5%UC Berkeley (Non-resident) 31,022$ 14,721$ 45,743$ 7%University of Redlands AICCU 3 33,894$ 10,472$ 44,366$ 5%UC Berkeley (Resident) 8,353$ 14,721$ 23,074$ 4%
Institution (sorted by total fees)
Office of Institutional Research, Planning, and Academic Assessment Page 140

Mills College Facts and Trends 2009-10
Section VIII.H
VIII.H Endowment Investment Information Endowment Market Value
(In millions)
$73 $79$92
$102$110$128
$141
$171$178$176$158
$145$139$155
$178$199
$234
$211
$157
$50$70$90
$110$130$150$170$190$210$230$250
1991 1992 1993 1994 1995 1996 1997 1998 1999 2000 2001 2002 2003 2004 2005 2006 2007 2008 2009
Endowment Asset Allocation and Value (in millions)
35% 36% 30% 27% 28%
21%24% 25%
27%
21%
24%
24%25%
30%
26%
18%
14%
13%15%
15%
4%
3%
6%1%
11%
$25
$50
$75
$100
$125
$150
$175
$200
$225
$250
2005 2006 2007 2008 2009
Cash and Equivalents
U.S. Fixed Income
Alternative Equities
Non-U.S. Equity
U.S. Equity
FY05 FY06 FY07 FY08 FY09Endowment investment return (in thousands) $17,235 $19,567 $36,438 ($11,216) ($46,356)Return as a percent of beginning market value 11.30% 10.80% 18.50% (5.10%) (22.10%)
Endowment payout to operating budget (in thousands) $8,357 $8,622 $9,191 $11,581 $12,315
Payout as a percent of beginning market value 5.38% 4.85% 4.62% 4.95% 5.85%Payout as a percent of 12-quarter average market value 5.97% 5.78% 5.52% 6.12% 5.96%
Endowment Returns and Payout
Office of Institutional Research, Planning, and Academic Assessment Page 141

Mills College Facts and Trends 2009-10
Section VIII.I
VIII.I Financial Ratios
2005 2006 2007 2008 2009
Primary Reserve Ratio 296% 228% 224% 154% 70%
Expendable net assets 134,400,690 115,455,673 127,434,892 93,515,459 43,632,255
Total expenses 45,404,512 50,563,537 56,897,599 60,542,032 62,265,540 (Measures existing resources available to cover annual expenses)
Net Income Ratio 14% 18% 32% (25%) 20%
Change in unrestricted net assets 7,584,345 11,237,299 26,455,159 (12,147,410) 15,299,700
Total unrestricted revenue 52,988,857 62,186,616 83,352,758 48,394,622 77,565,240 (Measures annual unrestricted operating results)
Return on Net Assets Ratio 14% 5% 13% (3%) (15%)
Change in net assets 32,825,615 14,090,112 35,449,370 (8,836,465) (45,583,465)
Total beginning net assets) 229,378,033 262,203,648 276,293,758 311,743,128 302,906,663 (Measures annual increase in total net assets)
Viability Ratio 360% 310% 347% 259% 123%
Expendable net assets 134,400,690 115,455,673 127,434,892 93,515,459 43,632,255 Long-term debt 37,354,046 37,250,727 36,706,611 36,112,494 35,488,377
(Measures existing resources available to cover debt)
Composite Financial Index (CFI) 10.0 10.0 10.0 4.0 2.9
(Measures the overall financial health of an institution by combining the four core financial ratios above into one with 10 being the highest achievable score overall
Office of Institutional Research, Planning, and Academic Assessment Page 142

Mills College Facts and Trends 2009-10
Office of Institutional Research, Planning, and Academic Assessment Page 143
SECTION IX: COMPARATIVE DATA ON HIGHER EDUCATION
Section IX.A The Nation and California
Section IX.B Comparison Colleges

Mills College Facts and Trends 2009-10
Office of Institutional Research, Planning, and Academic Assessment Page 144
Section IX.A
IX.A The Nation and California
DEMOGRAPHICS U.S. California Population (2008) 304,059,724 36,756,666
Racial and Ethnic Distribution (2008) U.S. California Native American 1.0% 1.2% Asian American 4.5% 12.5% Pacific Islander 0.2% .4% African American 12.8% 6.7% White (non Hispanic) 79.8% 76.6% More than one race 1.7% 2.6% Hispanic (may be any race) 15.4% 36.6%
Income (2008) U.S. California Per capita personal income $39,751 $42,696 Percent living in poverty* 12.4% 12.5% *Average of 2007 and 2008
EDUCATIONAL STATISTICS U.S. California High School Drop Out Rate 7% 7%
Postsecondary Enrollment (2008)
U.S. California Enrollment at Public 4-Yr Inst. 39.3% 25.6% Enrollment at Private 4-Yr Inst. 24.5% 14.1% Full-time 75.5% 67.6% Women 57.2% 55.6% Minority (Overall) 31.8% 55.2% Minority at Private 4-Yr Inst. 28.6% 41.2% Foreign 3.4% 3.2%
Test Scores U.S. California SAT (2008) 1511 1512 ACT (2008) 21.1 NA
In all cases, the most recent data available has been used. Unless otherwise noted, the source for data is The Chronicle of Higher Education Almanac Issue 2009-10.
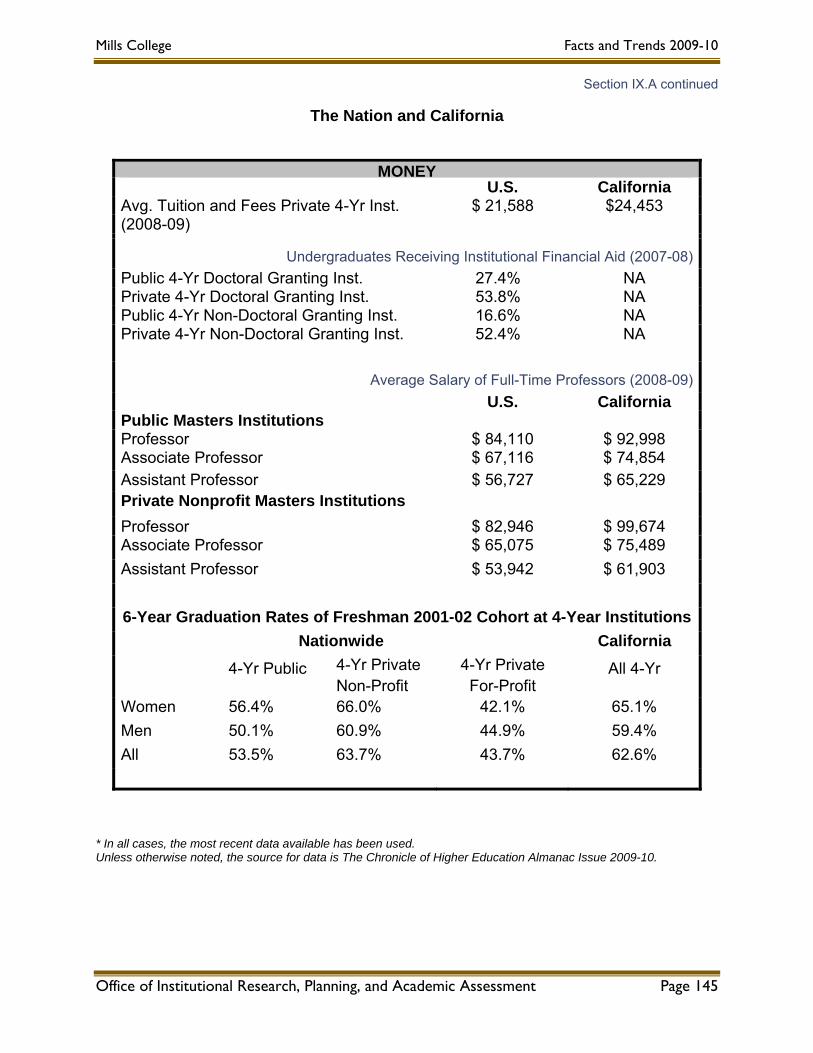
Mills College Facts and Trends 2009-10
Office of Institutional Research, Planning, and Academic Assessment Page 145
Section IX.A continued
The Nation and California
MONEY
U.S. California Avg. Tuition and Fees Private 4-Yr Inst. $ 21,588 $24,453 (2008-09)
Undergraduates Receiving Institutional Financial Aid (2007-08)Public 4-Yr Doctoral Granting Inst. 27.4% NA Private 4-Yr Doctoral Granting Inst. 53.8% NA Public 4-Yr Non-Doctoral Granting Inst. 16.6% NA Private 4-Yr Non-Doctoral Granting Inst. 52.4% NA
Average Salary of Full-Time Professors (2008-09) U.S. California Public Masters Institutions Professor $ 84,110 $ 92,998 Associate Professor $ 67,116 $ 74,854 Assistant Professor $ 56,727 $ 65,229 Private Nonprofit Masters Institutions Professor $ 82,946 $ 99,674 Associate Professor $ 65,075 $ 75,489 Assistant Professor $ 53,942 $ 61,903 6-Year Graduation Rates of Freshman 2001-02 Cohort at 4-Year Institutions
Nationwide California 4-Yr Public 4-Yr Private
Non-Profit 4-Yr Private For-Profit
All 4-Yr
Women 56.4% 66.0% 42.1% 65.1% Men 50.1% 60.9% 44.9% 59.4% All 53.5% 63.7% 43.7% 62.6%
* In all cases, the most recent data available has been used. Unless otherwise noted, the source for data is The Chronicle of Higher Education Almanac Issue 2009-10.
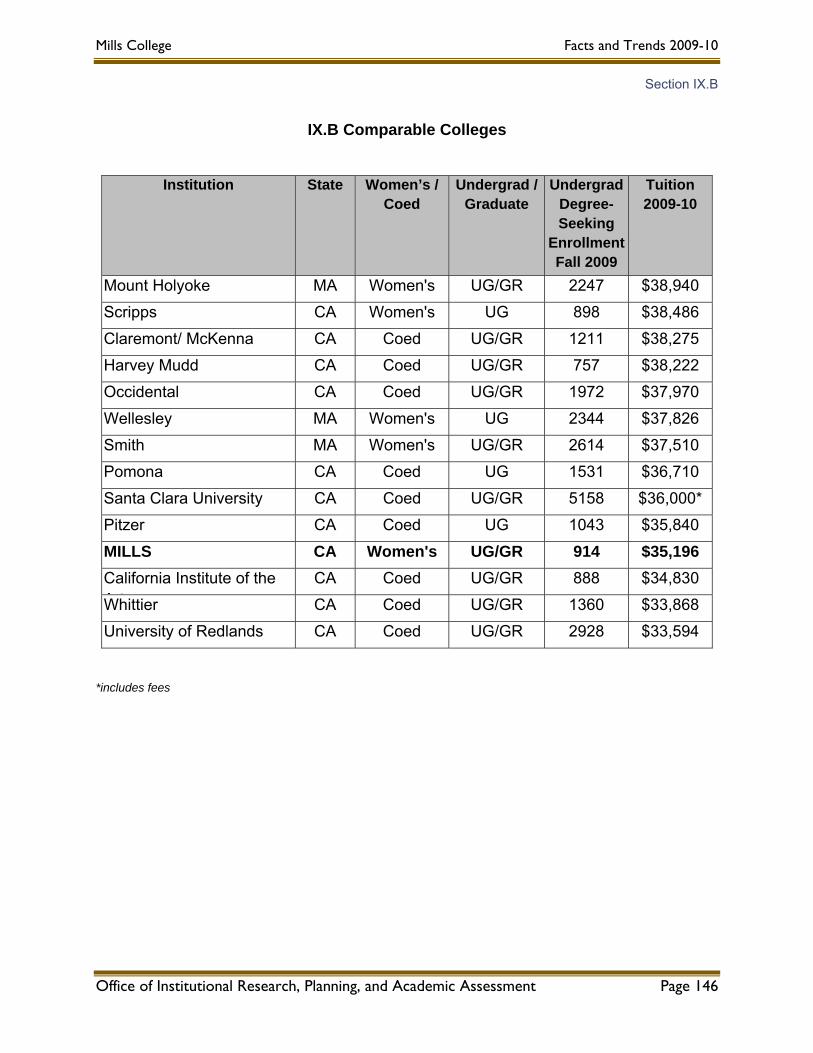
Mills College Facts and Trends 2009-10
Office of Institutional Research, Planning, and Academic Assessment Page 146
Section IX.B
IX.B Comparable Colleges
Institution State Women’s / Coed
Undergrad / Graduate
Undergrad Degree-Seeking
Enrollment Fall 2009
Tuition2009-10
Mount Holyoke MA Women's UG/GR 2247 $38,940
Scripps CA Women's UG 898 $38,486
Claremont/ McKenna CA Coed UG/GR 1211 $38,275
Harvey Mudd CA Coed UG/GR 757 $38,222
Occidental CA Coed UG/GR 1972 $37,970
Wellesley MA Women's UG 2344 $37,826
Smith MA Women's UG/GR 2614 $37,510
Pomona CA Coed UG 1531 $36,710
Santa Clara University CA Coed UG/GR 5158 $36,000*
Pitzer CA Coed UG 1043 $35,840
MILLS CA Women's UG/GR 914 $35,196 California Institute of the A t
CA Coed UG/GR 888 $34,830
Whittier CA Coed UG/GR 1360 $33,868
University of Redlands CA Coed UG/GR 2928 $33,594
*includes fees

Mills College Facts and Trends 2009-10
Office of Institutional Research, Planning, and Academic Assessment Page 147
Appendix
Appendix I: Mills College 2009-10 Profile Sheet
Appendix II: Mills College Fall 2009 Census
Appendix III: Mills College Spring 2010 Census
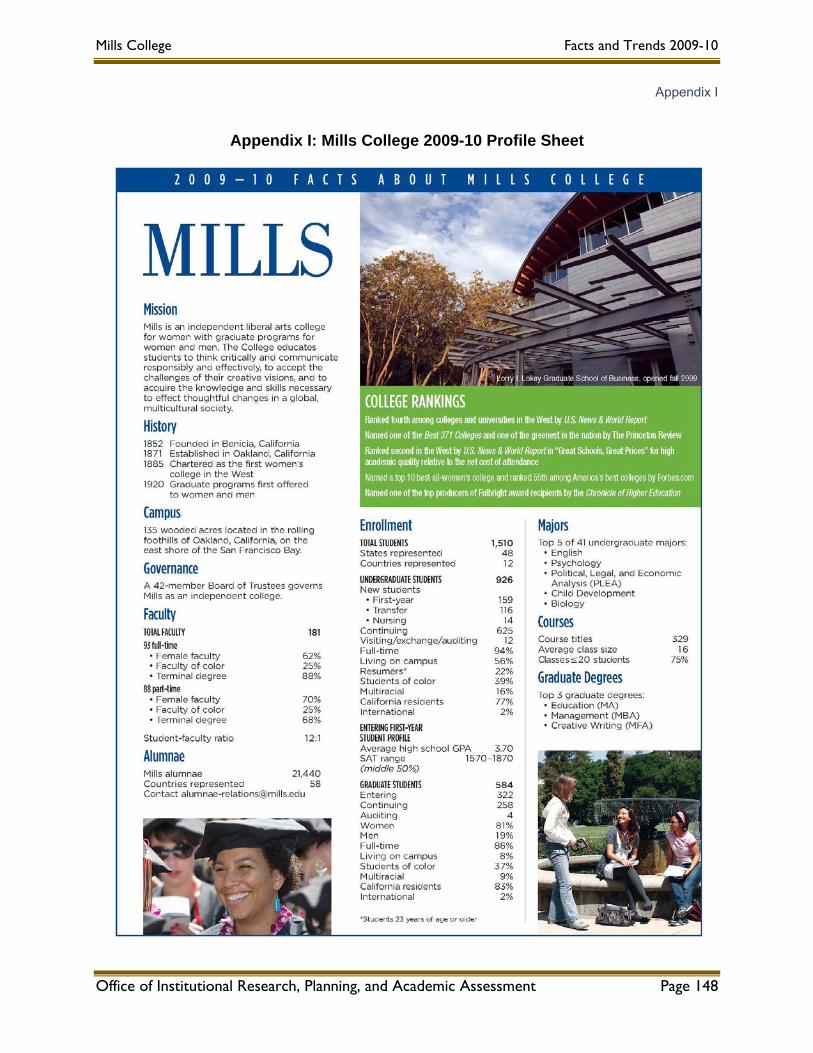
Mills College Facts and Trends 2009-10
Appendix I
Appendix I: Mills College 2009-10 Profile Sheet
Office of Institutional Research, Planning, and Academic Assessment Page 148
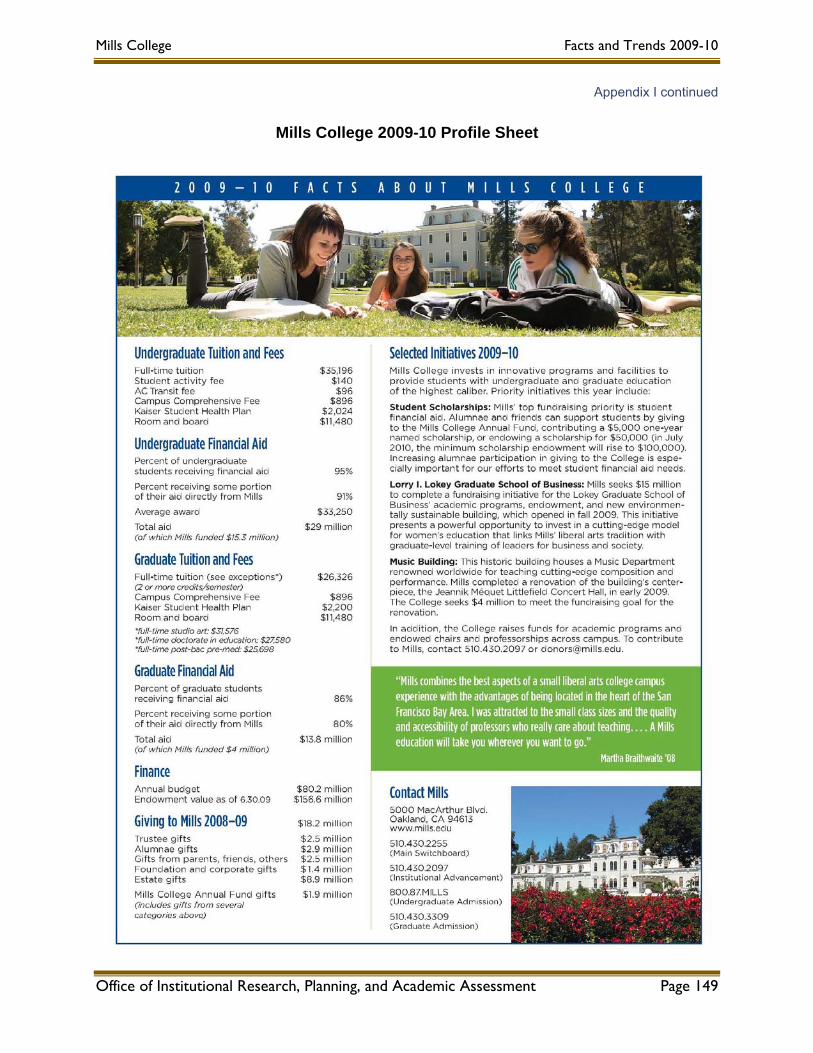
Mills College Facts and Trends 2009-10
Appendix I continued
Mills College 2009-10 Profile Sheet
Office of Institutional Research, Planning, and Academic Assessment Page 149

Mills College Facts and Trends 2009-10
Appendix II
Appendix II: Mills College Fall 2009 Census Fall 2009 Enrollment Report
The following pages contain the Fall 2009 Enrollment Report. These statistics reflect the enrollment as of September 16th. These data should be used for all enrollment reporting requests that you may receive in your individual areas. If you require enrollment information that is not included in this report you can contact the Office of Institutional Research, Planning, and Academic Assessment for assistance.
Summary of Fall 2009 Enrollment
Overall headcount enrollment at Mills College is 1,510 students. The headcount enrollment is comprised of 926 undergraduate and 584 graduate students. These figures represent a 2% increase in overall enrollment from last fall with a 5% decrease in undergraduate enrollment and a 15% increase in graduate enrollment.
The undergraduate headcount of 926 includes 289 new tuition-paying students: 159 new First-Year students, 116 new transfer students, and 14 new nursing students. One "Network" student is enrolled and 5 "AA to BA" students are enrolled. Twenty-two Mills students are away on study abroad, and one student is at Mills on international exchange. There are 4 students attending courses at Mills under cross-registration, 2 undergraduates who are here on short-term visit programs, and 3 students who are attending Mills under tuition exchange this fall. There are 5 undergraduate auditors.
The graduate headcount of 584 includes 312 new students, 268 continuing students, and 4 graduate auditors. New graduate enrollment increased 16% over last year. Women make up 81% of the graduate enrollment.
Overall , the tuition-paying FTE (full-time equivalent) enrollment of 1424.47 is comprised of 881.72 undergraduate FTE and 542.75 graduate FTE. For the entire population, FTE is up by 1% compared to last year; undergraduate FTE is down 6% while graduate FTE is up 16%.
Over half (56%) of all undergraduate students and 8% of graduate students are campus residents, with 37% of the overall population living in the residence halls. Of the undergraduates, 96% of the entering First-Time First-Year Bachelor's degree students , 35% of the new transfer students, and 36% of the nursing students (which includes 100% of the new nursing First-Year and 18% of the new transfer nursing students) live in the residents halls. A larger percentage of male graduate students (12%) than women graduate students (8%) live in the residence halls.
Seventy-eight percent of undergraduates and 83% of graduate students are California residents. Of the incoming undergraduates, 70% of the First-Year Bachelors' degree students are California residents, 27% are from out-of-state, and 3% are non-resident aliens.
Students of color (African-American; American Indian; Asian or Pacific Islander; and Latina/Latino) make up 39% of the overall Mills student population. An additional 13% of the current student population classify themselves Bi/Multi Ethnic. 39% percent of undergraduates and 37% of graduate students classify themselves as students of color. An additional 16% of undergraduates and 9% of graduates consider themselves Bi/Multi Ethnic. Thirty-seven percent of the incoming First-Year students are first-generation students.
Retention of First-Time First-Year undergraduate students who began study at Mills in Fall 2008 is 77%. This represents 144 of the entering Fall 2008 cohort of 188 First-Time full-time students currently enrolled in Fall 2009. This is a 3% increase over last year, and a 6% increase over the past three years. First-Year retention of transfer students who entered Mills in Fall 2008 is 80%, up 4% from last year. Retention of nursing First-Year students entering in Fall 2008 is 71%, down 29% from last year.
Office of Institutional Research, Planning, and Academic Assessment Page 150

Mills College Facts and Trends 2009-10
Appendix II continued Mills College Fall 2009 Census
Fall Mills Tuition Tuition Tuition Cont New New New New UG-EV Away Here Here Here Here Away Away Audit*** Res ComTerm UG Paying Paying Paying UG Fresh Trans PNC PNC and Exch Visit Tuition Exch Cross Dom Study
HC UG HC UG FTE UG-New FF TR AA-BA* Exch Reg Visit Abroad2005 881 845 824.92 335 480 184 128 17 6 16 1 6 7 10 12 2 12 0 457 4242006 927 892 876.00 333 538 185 123 15 10 7 2 6 6 8 7 1 13 6 510 4182007 948 910 899.50 330 570 185 123 12 10 5 0 0 5 5 4 1 21 7 532 4162008 973 948 936.79 322 608 188 107 14 13 8 3 0 7 6 7 0 8 4 543 4302009 926 894 881.72 289 594 159 116 3 11 6 0 2 3 1 4 0 22 5 517 409
Fall Mills Tuition Tuition Tuition Cont Grad Here Here Here Audit*** Res ComTerm GR Paying Paying Paying GR Pre-Req** Tuition Exch Cross
HC GR HC GR FTE GR-New Exch Reg2005 491 491 456.38 243 248 0 0 0 0 0 34 4572006 483 483 436.26 227 256 0 0 0 0 0 38 4452007 506 506 457.13 237 269 0 0 0 0 0 58 4482008 508 507 469.63 269 235 3 0 0 0 1 39 4692009 584 580 542.75 312 268 0 0 0 0 4 48 536
Fall Total Total Total Total Grand New New New UG-EV Away Here Here Here Here Away Away Total Res ComTerm Mills Tuition Tuition Tuition Total Fresh Trans Gr AA-BA Exch Visit Tuition Exch Cross- Dom Study Audit
HC Pay HC Pay FTE Pay New Cont GR Pre-Req Exch Reg. Visit Abroad2005 1372 1336 1281.30 578 728 184 128 243 16 1 6 7 10 12 2 12 0 491 8812006 1410 1375 1312.26 560 794 185 123 227 7 2 6 6 8 7 1 13 6 548 8632007 1454 1416 1356.63 567 839 185 123 237 5 0 0 5 5 4 1 21 7 590 8642008 1481 1455 1406.42 591 843 202 120 269 11 3 0 7 6 7 0 8 5 582 8992009 1510 1474 1424.47 601 862 162 127 312 6 0 2 3 1 4 0 22 9 565 945
*UG-EV and AA-BA students are charged a discounted tuition rate.**Graduate Pre-Req students are those enrolled to take pre-requisite courses at a discounted tuition rate.***Auditors pay an auditing fee equal to one/half the tuition rate.
Summary Data Housing StatusNon-Tuition Paying
Included in Head CountTuition-Paying
Five-Year Fall 2009 Final Census - Summary
Summary Data Housing StatusUNDERGRADUATES
Included in Head CountNon-Tuition-Paying
Housing StatusNon-Tuition Paying
GRADUATES
Tuition-PayingIncluded in Head Count
Tuition-Paying
Summary Data
Office of Institutional Research, Planning, and Academic Assessment Page 151
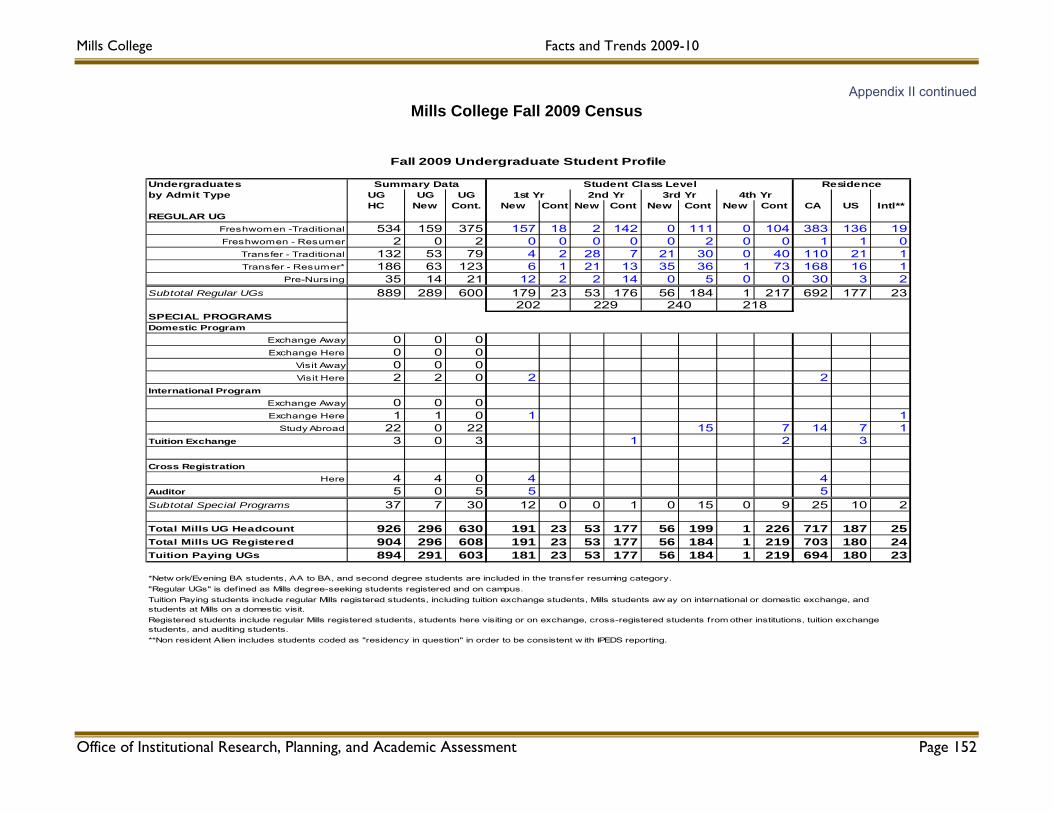
Mills College Facts and Trends 2009-10
Office of Institutional Research, Planning, and Academic Assessment Page 152
Undergraduatesby Admit Type UG UG UG
HC New Cont. New Cont New Cont New Cont New Cont CA US Intl**REGULAR UG
Freshwomen -Traditional 534 159 375 157 18 2 142 0 111 0 104 383 136 19Freshwomen - Resumer 2 0 2 0 0 0 0 0 2 0 0 1 1 0
Transfer - Traditional 132 53 79 4 2 28 7 21 30 0 40 110 21 1Transfer - Resumer* 186 63 123 6 1 21 13 35 36 1 73 168 16 1
Pre-Nursing 35 14 21 12 2 2 14 0 5 0 0 30 3 2Subtotal Regular UGs 889 289 600 179 23 53 176 56 184 1 217 692 177 23
SPECIAL PROGRAMSDomestic Program
Exchange Away 0 0 0 Exchange Here 0 0 0
Visit Away 0 0 0 Visit Here 2 2 0 2 2
International ProgramExchange Away 0 0 0Exchange Here 1 1 0 1 1
Study Abroad 22 0 22 15 7 14 7 1Tuition Exchange 3 0 3 1 2 3
Cross Registration Here 4 4 0 4 4
Auditor 5 0 5 5 5Subtotal Special Programs 37 7 30 12 0 0 1 0 15 0 9 25 10 2
Total Mills UG Headcount 926 296 630 191 23 53 177 56 199 1 226 717 187 25Total Mills UG Registered 904 296 608 191 23 53 177 56 184 1 219 703 180 24Tuition Paying UGs 894 291 603 181 23 53 177 56 184 1 219 694 180 23
*Netw ork/Evening BA students, AA to BA, and second degree students are included in the transfer resuming category. "Regular UGs" is defined as Mills degree-seeking students registered and on campus.
**Non resident Alien includes students coded as "residency in question" in order to be consistent w ith IPEDS reporting.
202 229 240 218
Tuition Paying students include regular Mills registered students, including tuition exchange students, Mills students aw ay on international or domestic exchange, and students at Mills on a domestic visit.Registered students include regular Mills registered students, students here visiting or on exchange, cross-registered students from other institutions, tuition exchange students, and auditing students.
Fall 2009 Undergraduate Student Profile
Summary Data Student Class Level Residence1st Yr 2nd Yr 3rd Yr 4th Yr
Appendix II continued Mills College Fall 2009 Census
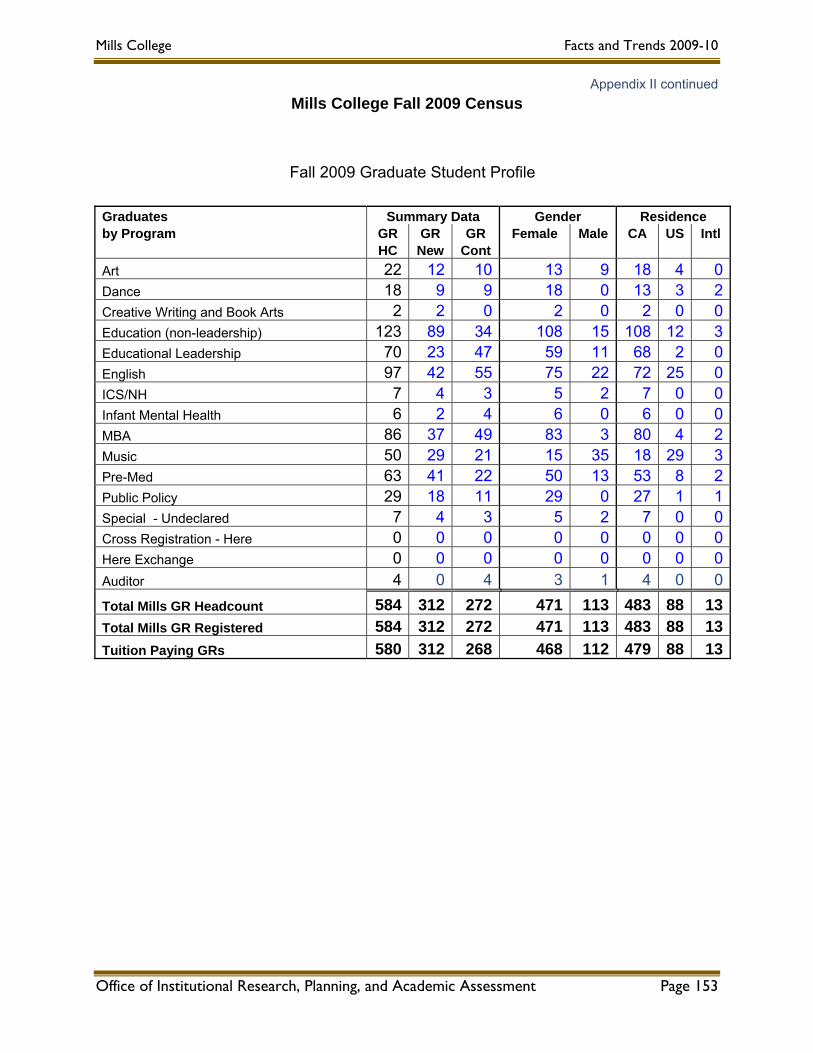
Mills College Facts and Trends 2009-10
Office of Institutional Research, Planning, and Academic Assessment Page 153
Appendix II continued Mills College Fall 2009 Census
Fall 2009 Graduate Student Profile
Graduates Summary Data Gender Residence by Program GR GR GR Female Male CA US Intl HC New Cont Art 22 12 10 13 9 18 4 0Dance 18 9 9 18 0 13 3 2Creative Writing and Book Arts 2 2 0 2 0 2 0 0Education (non-leadership) 123 89 34 108 15 108 12 3Educational Leadership 70 23 47 59 11 68 2 0English 97 42 55 75 22 72 25 0ICS/NH 7 4 3 5 2 7 0 0Infant Mental Health 6 2 4 6 0 6 0 0MBA 86 37 49 83 3 80 4 2Music 50 29 21 15 35 18 29 3Pre-Med 63 41 22 50 13 53 8 2Public Policy 29 18 11 29 0 27 1 1Special - Undeclared 7 4 3 5 2 7 0 0Cross Registration - Here 0 0 0 0 0 0 0 0Here Exchange 0 0 0 0 0 0 0 0Auditor 4 0 4 3 1 4 0 0Total Mills GR Headcount 584 312 272 471 113 483 88 13Total Mills GR Registered 584 312 272 471 113 483 88 13Tuition Paying GRs 580 312 268 468 112 479 88 13
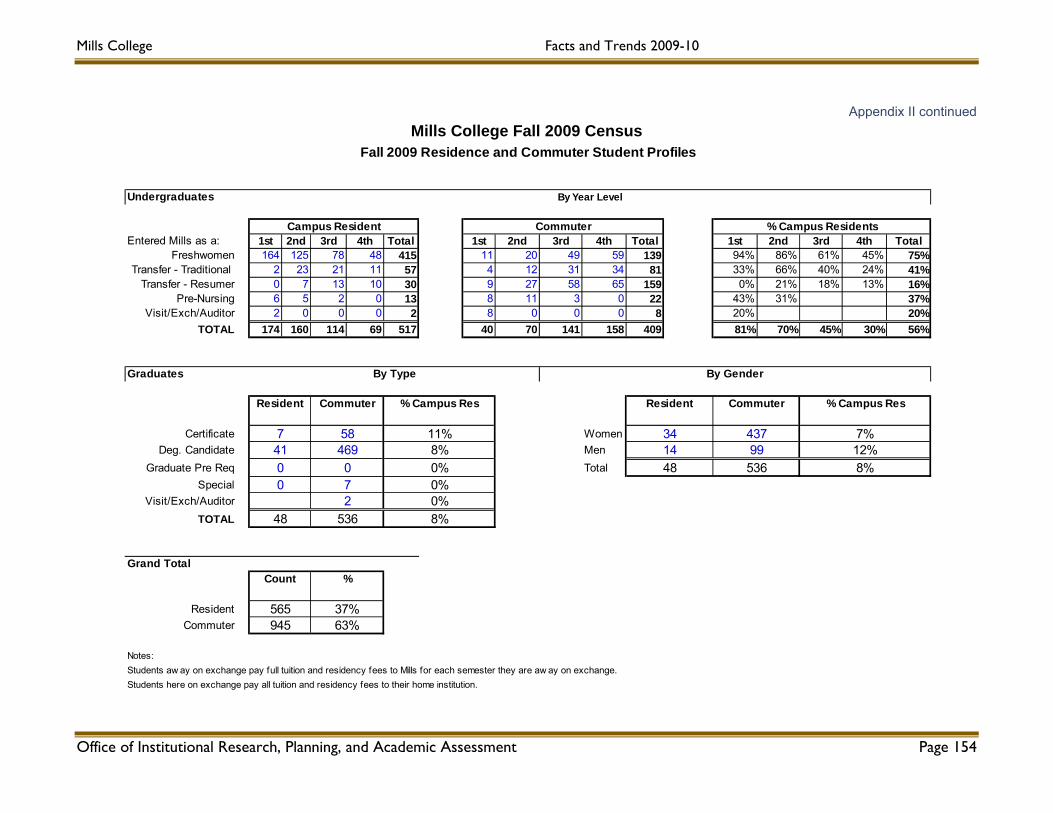
Mills College Facts and Trends 2009-10
Appendix II continued Mills College Fall 2009 Census
Undergraduates
Entered Mills as a: 1st 2nd 3rd 4th Total 1st 2nd 3rd 4th Total 1st 2nd 3rd 4th TotalFreshwomen 164 125 78 48 415 11 20 49 59 139 94% 86% 61% 45% 75%
Transfer - Traditional 2 23 21 11 57 4 12 31 34 81 33% 66% 40% 24% 41%Transfer - Resumer 0 7 13 10 30 9 27 58 65 159 0% 21% 18% 13% 16%
Pre-Nursing 6 5 2 0 13 8 11 3 0 22 43% 31% 37%Visit/Exch/Auditor 2 0 0 0 2 8 0 0 0 8 20% 20%
TOTAL 174 160 114 69 517 40 70 141 158 409 81% 70% 45% 30% 56%
Graduates
Certificate WomenDeg. Candidate Men
Graduate Pre Req TotalSpecial
Visit/Exch/AuditorTOTAL
Grand Total
ResidentCommuter
Notes:Students aw ay on exchange pay full tuition and residency fees to Mills for each semester they are aw ay on exchange.Students here on exchange pay all tuition and residency fees to their home institution.
48
3414
945
8%
0%
63%
0 0 8%0
4827
536
37%565
Count %
0%
536
7%12%
7
By Type
5846941
43799
Fall 2009 Residence and Commuter Student Profiles
% Campus Residents
Resident Commuter
Campus Resident Commuter
Resident
0%
By Year Level
% Campus Res
11%8%
Commuter % Campus Res
By Gender
Office of Institutional Research, Planning, and Academic Assessment Page 154

Mills College Facts and Trends 2009-10
Appendix II continued Mills College Fall 2009 Census
Over Total FTE of FTE Total Full-time Part-time Load UG-EV & AA-BA HC Part-time UG-EV & AA-BA FTE
Tuition-Paying:826 41 16 6 889 31.43 4.00 877.43
Tuition Exchange 3 0 0 3 3.00Here Visiting 1 1 0 2 0.29 1.29
0 0 0 0 0.00 0.00Subtotal Tuition-Paying 830 42 16 6 894 31.72 4.00 881.72
Non-Tuition-PayingAway Intl or Dom Visit 22 0 0 22 22.00
Here Intl or Dom Exchange 1 0 0 1 1.00Here Cross-Registered 4 4 1.14 1.14
Auditor 5 5 0.00853 51 16 6 926 32.86 4.00 905.86
Over Total FTE of FTE TotalFull-time Part-time Load Grad Pre Req HC Part-time Grad Pre Req FTE
Tuition-Paying:281 65 122 0 468 33.00 0.00 436.00
88 10 14 0 112 4.75 0.00 106.75Subtotal Tuition-Paying 369 75 136 0 580 37.75 0 542.75
Non-Tuition-PayingHere Cross-Registered
Auditor 4 0.00369 75 136 0 584 37.75 0.00 542.75
Total Tuition-Paying 1199 117 152 6 1474 69.47 4.00 1424.47Total Non-Tuition-Paying 23 9 0 0 36 1.14 0.00 24.14
1222 126 152 6 1510 70.61 4.00 1448.61
Definition of Full-Tim e: Undergraduates taking 3.5 to 5 creditsGraduates taking 2 to 4 credits
Definition of Overload: Undergraduates taking greater than 5.0 credits .Graduates taking greater than 4.0 credits .(Mills policy allows Graduates in Education to take up to 6 Credits ; however this s tudyincludes education s tudents taking an excess of 4 credits in the overload count.)
Definition of FTE: Full-tim e equivalents (FTE) includes the total of full-tim e and overload s tudents plus the total credits taken by part-tim e s tudents divided by the num ber of credits constituting full-tim e enrollm ent.
Assumptions: Students Away on Exchange are assum ed to be taking a full course load.
WomenMen
TOTAL GRADUATES
GRAND TOTAL
Fall 2009 Course Load and FTE
UNDERGRADUATES
UG registered
Away Intl or Dom Exchange
TOTAL UNDERGRADUATES
GRADUATES
Office of Institutional Research, Planning, and Academic Assessment Page 155

Office of Institutional Research, Planning, and Academic Assessment Page 156
Appendix II continued
Mills College Facts and Trends 2009-10
African American Asian or Latina/ Bi/Multi White Not specified TotalFIRST-TIME FIRST YEAR* American Indian Pacific Is Latino Non-Hispanic Other
Non-resident Alien** 3 1 1 5United States Citizen / Resident 16 0 18 28 19 61 14 156
SUBTOTAL FIRST-TIME FIRST YEAR 16 0 21 29 19 61 15 161
African American Asian or Latina/ Bi/Multi White Not specified TotalALL FULL TIME American Indian Pacific Is Latino Non-Hispanic Other
Non-resident Alien** 9 10 3 22United States Citizen / Resident 78 10 63 127 115 333 122 848
TOTAL FULL-TIME UNDERGRADUATES 78 10 72 137 115 333 125 870
African American Asian or Latina/ Bi/Multi White Not specified TotalFIRST-TIME FIRST YEAR American Indian Pacific Is Latino Non-Hispanic Other
Non-resident Alien 0United States Citizen / Resident 0 0 0 0 0 1 0 1
SUBTOTAL FIRST-TIME FIRST YEAR 0 0 0 0 0 1 0 1
African American Asian or Latina/ Bi/Multi White Not specified TotalALL PART TIME American Indian Pacific Is Latino Non-Hispanic Other
Non-resident Alien 1 1United States Citizen / Resident 9 1 5 8 23 9 55
TOTAL PART-TIME UNDERGRADUATES 9 0 1 6 8 23 9 56
TOTAL UG STUDENTS 87 10 73 143 123 356 134 926% of KNOWN ETHNICITY 11% 1% 9% 18% 16% 45%
African American Asian or Latina/ Bi/Multi White Not specified TotalFULL TIME American Indian Pacific Is Latino Non-Hispanic Other
4 2 6 1257 2 50 39 38 226 81 49357 2 54 39 38 228 87 505
African American Asian or Latina/ Bi/Multi White Not specified TotalAmerican Indian Pacific Is Latino Non-Hispanic Other
016 9 5 6 38 5 7916 0 9 5 6 38 5 79
73 2 63 44 44 266 92 584% of KNOWN ETHNICITY 15% 0% 13% 9% 9% 54%
African American Asian or Latina/ Bi/Multi White Not specified TotalAmerican Indian Pacific Is Latino Non-Hispanic Other
COUNT 160 12 136 187 167 622 226 1510% of KNOWN ETHNICITY 12% 1% 11% 15% 13% 48%
*First-Time First Year includes Nursing**Non resident Alien includes students coded as "residency in question" in order to be consistent with IPEDS reporting.
Fall 2009 Ethnicity Profile
UNDERGRADUATES
Non-resident Alien*United States Citizen / Resident
GRADUATES
MILLS UG and GR TOTAL
FULL
TIM
EPA
RT
TIM
E
TOTAL GR STUDENTS
TOTAL FULL TIME
Non-resident AlienUnited States Citizen / Resident
TOTAL PART TIME
PART TIME
Mills College Fall 2009 Census
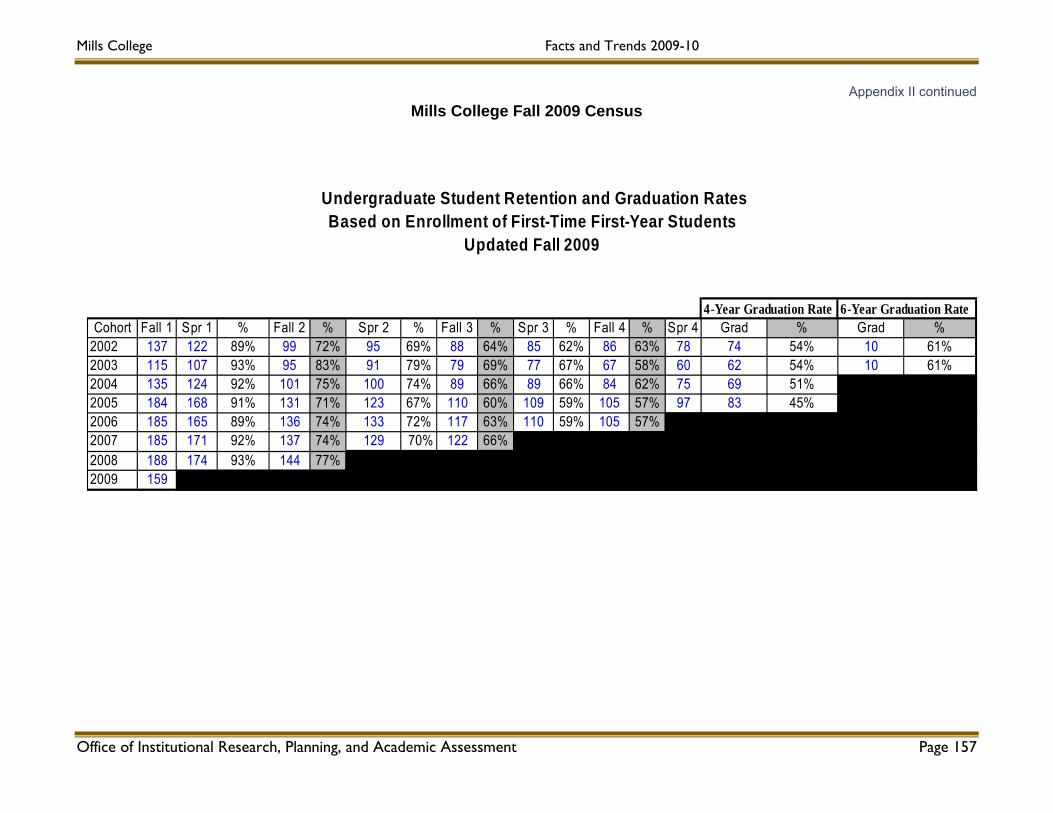
Mills College Facts and Trends 2009-10
Appendix II continued Mills College Fall 2009 Census
Cohort Fall 1 Spr 1 % Fall 2 % Spr 2 % Fall 3 % Spr 3 % Fall 4 % Spr 4 Grad % Grad %2002 137 122 89% 99 72% 95 69% 88 64% 85 62% 86 63% 78 74 54% 10 61%2003 115 107 93% 95 83% 91 79% 79 69% 77 67% 67 58% 60 62 54% 10 61%2004 135 124 92% 101 75% 100 74% 89 66% 89 66% 84 62% 75 69 51% 54%2005 184 168 91% 131 71% 123 67% 110 60% 109 59% 105 57% 97 83 45% 51%2006 185 165 89% 136 74% 133 72% 117 63% 110 59% 105 57% 0% 45%2007 185 171 92% 137 74% 129 70% 122 66% 02008 188 174 93% 144 77%2009 159
Undergraduate Student Retention and Graduation RatesBased on Enrollment of First-Time First-Year Students
Updated Fall 2009
4-Year Graduation Rate 6-Year Graduation Rate
Office of Institutional Research, Planning, and Academic Assessment Page 157

Mills College Facts and Trends 2009-10
Appendix III
Appendix III: Mills College Spring 2010 Census
Spring 2010 Enrollment Report
The following pages contain the Spring 2010 Enrollment Report. These statistics reflect the enrollment as of February 10, 2010.
Summary of Spring 2010 Enrollment
Overall headcount enrollment at Mills College for Spring 2010 is 1,454 students. The headcount enrollment is comprised of 900 undergraduate and 554 graduate students. These figures represent a 5% increase in overall enrollment from last spring―a .5% increase in undergraduate enrollment and a 12% increase in graduate enrollment.
The undergraduate headcount of 900 includes 55 new tuition-paying students―1 new First-Year student, 50 new transfer students, and 4 new nursing transfer students. New undergraduate enrollment increased 49% from last spring. There are 804 continuing students, a decline of 1% from last spring. Nineteen Mills students are away on study abroad, and one is away on a domestic visit. There are 8 students attending courses at Mills under cross-registration, 1 undergraduate who is here on a short-term international exchange program, and 7students who are attending Mills under tuition exchange. There are 3 auditors.
The graduate headcount of 554 includes 24 new regular students and 529 continuing students, and one auditing student. New graduate enrollment increased 26% from last spring.
The overall FTE (full-time equivalent) enrollment of 1370.31, which is comprised of 857.93 undergraduate FTE and 512.38 graduate FTE, is up by 5% compared to last year. Total undergraduate FTE is up 1% while graduate FTE is up 12%.
Fall to spring retention of First-Time First-Year undergraduate students who began study at Mills in fall 2009 is 96%, a 3% increase from last year. This represents 153 of the entering cohort of 159 students in the fall 2009 cohort of First-Time full-time students currently enrolled in spring 2010. First-Year fall to spring retention has improved 4% from two years ago. Fall to spring retention of traditional transfer students who entered Mills in fall 2009 is 93%, a 3% increase from last year, and fall to spring retention for transfer resumers is 95%, a 2% increase from last year. Fall to spring retention of nursing First-Year students entering in fall 2008 is 100%, up 7% from last year; however, transfer nursing student retention is 82%, down 10% from last year.
Over half (57%) of all undergraduate students and 8% of graduate students are campus residents. This is an increase from last spring of 1% for both groups. Thirty-three percent of the entering undergraduates and 13% of the new graduates are housed on campus.
Seventy-nine percent of our undergraduates and 83% of our graduate students are California residents. We have 14 international students enrolled in undergraduate study and 11 enrolled in graduate study. Twenty percent of our undergraduates and 15% of our graduates are from out of state.
Our "pilot" use the federally mandated new method of collecting and reporting race/ethnicity yielded a dramatic shift in the proportion of students of color within our population with known ethnicity. Students of color (African-American; American Indian; Asian, Pacific Islander; and Latina/Latino) now make up 43% of the overall Mills student population with known ethnicity, with only an additional 3% of the population classifying themselves as Bi-multiracial. Forty-six percent of the undergraduates and 39% of the graduates are students of color, with an additional 4% of undergraduates and 2% of the graduates classifying themselves as bi-multiracial. The increases in the percentages of students of color from last spring―7% overall, 8% undergraduate, and 2% graduate―and the dramatic decrease in the percent of bi-multiracial students―-11% overall, -11% undergraduate, and -10% graduate―are, for the most part, due to a large proportion of students previously identified as bi-multiracial not self-identifying as such in the new system, shifting instead to "unknown." The larger proportion of "unknown" and the resulting decrease in the number of "known" used in the calculation have resulted in the new higher percentages.
Office of Institutional Research, Planning, and Academic Assessment Page 158
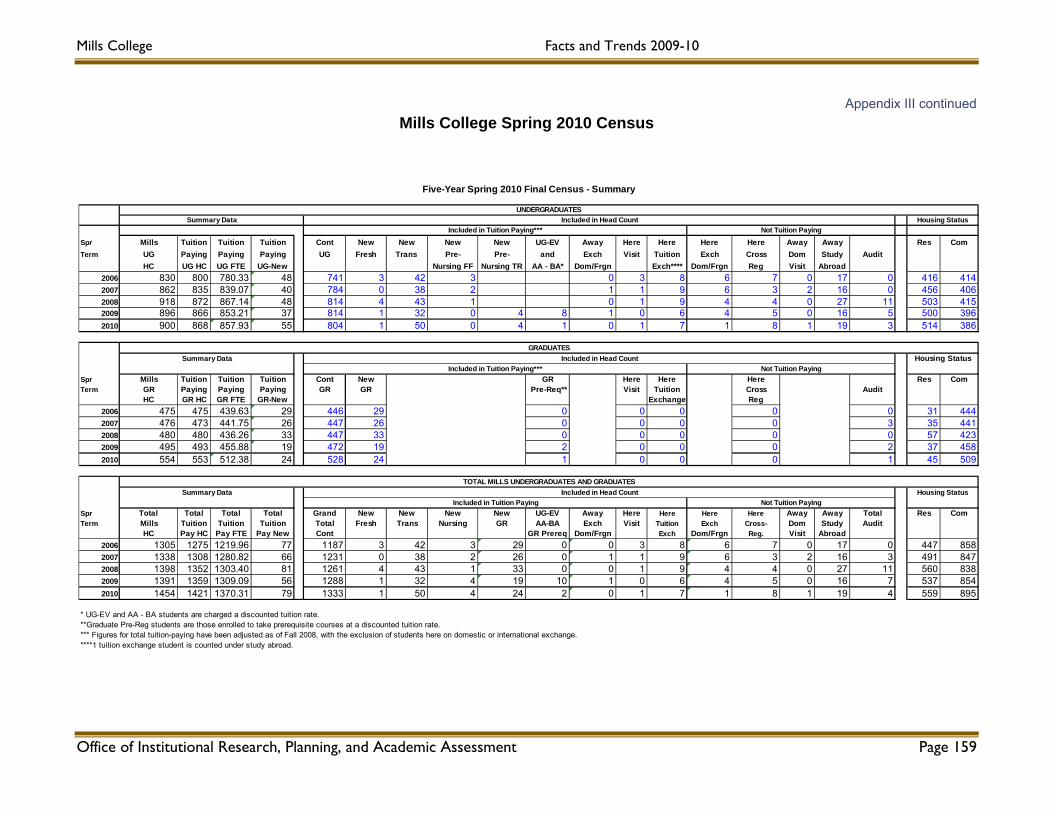
Mills College Facts and Trends 2009-10
Appendix III continued Mills College Spring 2010 Census
Spr Mills Tuition Tuition Tuition Cont New New New New UG-EV Away Here Here Here Here Away Away Res ComTerm UG Paying Paying Paying UG Fresh Trans Pre- Pre- and Exch Visit Tuition Exch Cross Dom Study Audit
HC UG HC UG FTE UG-New Nursing FF Nursing TR AA - BA* Dom/Frgn Exch**** Dom/Frgn Reg Visit Abroad2006 830 800 780.33 48 741 3 42 3 0 3 8 6 7 0 17 0 416 4142007 862 835 839.07 40 784 0 38 2 1 1 9 6 3 2 16 0 456 4062008 918 872 867.14 48 814 4 43 1 0 1 9 4 4 0 27 11 503 4152009 896 866 853.21 37 814 1 32 0 4 8 1 0 6 4 5 0 16 5 500 3962010 900 868 857.93 55 804 1 50 0 4 1 0 1 7 1 8 1 19 3 514 386
Spr Mills Tuition Tuition Tuition Cont New GR Here Here Here Res ComTerm GR Paying Paying Paying GR GR Pre-Req** Visit Tuition Cross Audit
HC GR HC GR FTE GR-New Exchange Reg2006 475 475 439.63 29 446 29 0 0 0 0 0 31 4442007 476 473 441.75 26 447 26 0 0 0 0 3 35 4412008 480 480 436.26 33 447 33 0 0 0 0 0 57 4232009 495 493 455.88 19 472 19 2 0 0 0 2 37 4582010 554 553 512.38 24 528 24 1 0 0 0 1 45 509
Spr Total Total Total Total Grand New New New New UG-EV Away Here Here Here Here Away Away Total Res ComTerm Mills Tuition Tuition Tuition Total Fresh Trans Nursing GR AA-BA Exch Visit Tuition Exch Cross- Dom Study Audit
HC Pay HC Pay FTE Pay New Cont GR Prereq Dom/Frgn Exch Dom/Frgn Reg. Visit Abroad2006 1305 1275 1219.96 77 1187 3 42 3 29 0 0 3 8 6 7 0 17 0 447 8582007 1338 1308 1280.82 66 1231 0 38 2 26 0 1 1 9 6 3 2 16 3 491 8472008 1398 1352 1303.40 81 1261 4 43 1 33 0 0 1 9 4 4 0 27 11 560 8382009 1391 1359 1309.09 56 1288 1 32 4 19 10 1 0 6 4 5 0 16 7 537 8542010 1454 1421 1370.31 79 1333 1 50 4 24 2 0 1 7 1 8 1 19 4 559 895
* UG-EV and AA - BA students are charged a discounted tuition rate.**Graduate Pre-Reg students are those enrolled to take prerequisite courses at a discounted tuition rate.*** Figures for total tuition-paying have been adjusted as of Fall 2008, with the exclusion of students here on domestic or international exchange.****1 tuition exchange student is counted under study abroad.
Housing Status
Housing StatusSummary Data
TOTAL MILLS UNDERGRADUATES AND GRADUATES
Included in Head CountIncluded in Tuition Paying*** Not Tuition Paying
Included in Head CountSummary Data
GRADUATES
Not Tuition PayingIncluded in Tuition Paying
Summary Data Included in Head Count
Five-Year Spring 2010 Final Census - Summary
UNDERGRADUATESHousing Status
Included in Tuition Paying*** Not Tuition Paying
Office of Institutional Research, Planning, and Academic Assessment Page 159
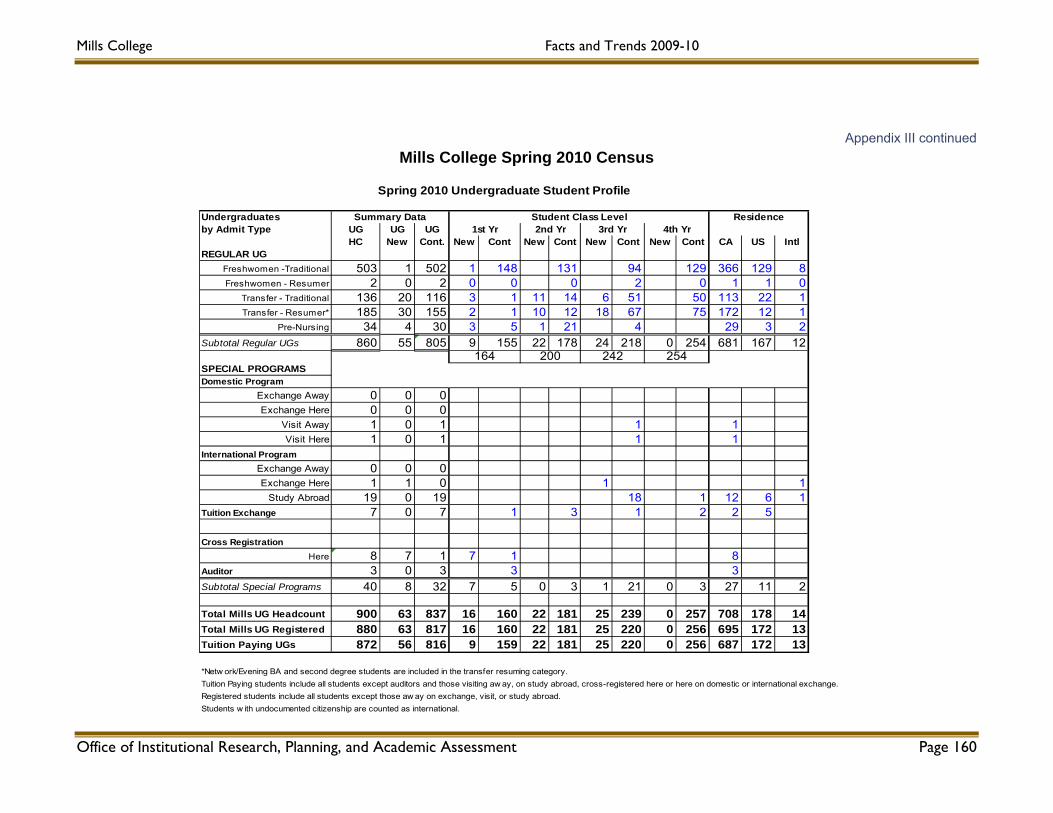
Mills College Facts and Trends 2009-10
Appendix III continued Mills College Spring 2010 Census
Undergraduatesby Admit Type UG UG UG
HC New Cont. New Cont New Cont New Cont New Cont CA US IntlREGULAR UG
Freshwomen -Traditional 503 1 502 1 148 131 94 129 366 129 8Freshwomen - Resumer 2 0 2 0 0 0 2 0 1 1 0
Transfer - Traditional 136 20 116 3 1 11 14 6 51 50 113 22 1Transfer - Resumer* 185 30 155 2 1 10 12 18 67 75 172 12 1
Pre-Nursing 34 4 30 3 5 1 21 4 29 3 2Subtotal Regular UGs 860 55 805 9 155 22 178 24 218 0 254 681 167 12
SPECIAL PROGRAMSDomestic Program
Exchange Away 0 0 0 Exchange Here 0 0 0
Visit Away 1 0 1 1 1 Visit Here 1 0 1 1 1
International ProgramExchange Away 0 0 0Exchange Here 1 1 0 1 1
Study Abroad 19 0 19 18 1 12 6 1Tuition Exchange 7 0 7 1 3 1 2 2 5
Cross Registration Here 8 7 1 7 1 8
Auditor 3 0 3 3 3Subtotal Special Programs 40 8 32 7 5 0 3 1 21 0 3 27 11 2
Total Mills UG Headcount 900 63 837 16 160 22 181 25 239 0 257 708 178 14Total Mills UG Registered 880 63 817 16 160 22 181 25 220 0 256 695 172 13Tuition Paying UGs 872 56 816 9 159 22 181 25 220 0 256 687 172 13
*Netw ork/Evening BA and second degree students are included in the transfer resuming category. Tuition Paying students include all students except auditors and those visiting aw ay, on study abroad, cross-registered here or here on domestic or international exchange.Registered students include all students except those aw ay on exchange, visit, or study abroad.Students w ith undocumented citizenship are counted as international.
Spring 2010 Undergraduate Student Profile
4th Yr
200 242 254
1st Yr 2nd Yr 3rd YrStudent Class Level ResidenceSummary Data
164
Office of Institutional Research, Planning, and Academic Assessment Page 160

Graduates by Program GR GR GR Female Male CA US Intl
HC New ContArt 22 0 22 13 9 18 4 0Creative Writing and Book Arts 2 0 2 2 0 2 0 0Dance 18 0 18 18 0 13 3 2Education (non-leadership) 96 1 95 86 10 82 11 3Educational Leadership 80 0 80 68 12 78 2 0English 90 0 90 69 21 67 23 0ICS/NH 5 0 5 3 2 5 0 0Infant Mental Health 5 0 5 5 0 5 0 0MBA 90 17 73 86 4 85 4 1Music 44 1 43 12 32 16 26 2Pre-Med 62 0 62 50 12 52 8 2Public Policy 29 1 28 29 0 26 2 1Special - Undeclared 10 4 6 7 3 10 0 0Cross Registration - Here 0 0 0 0 0 0 0 0Here Exchange 0 0 0 0 0 0 0 0Auditor 1 0 1 1 0 1 0 0Total Mills GR Headcount 554 24 530 449 105 460 83 11Total Mills GR Registered 553 24 529 448 105 459 83 11Tuition Paying GRs 553 24 529 448 105 459 83 c
Spring 2010 Graduate Student Profile
Gender ResidenceSummary Data
Office of Institutional Research, Planning, and Academic Assessment Page 161
Appendix III continued
Mills College Facts and Trends 2009-10
Mills College Spring 2010 Census
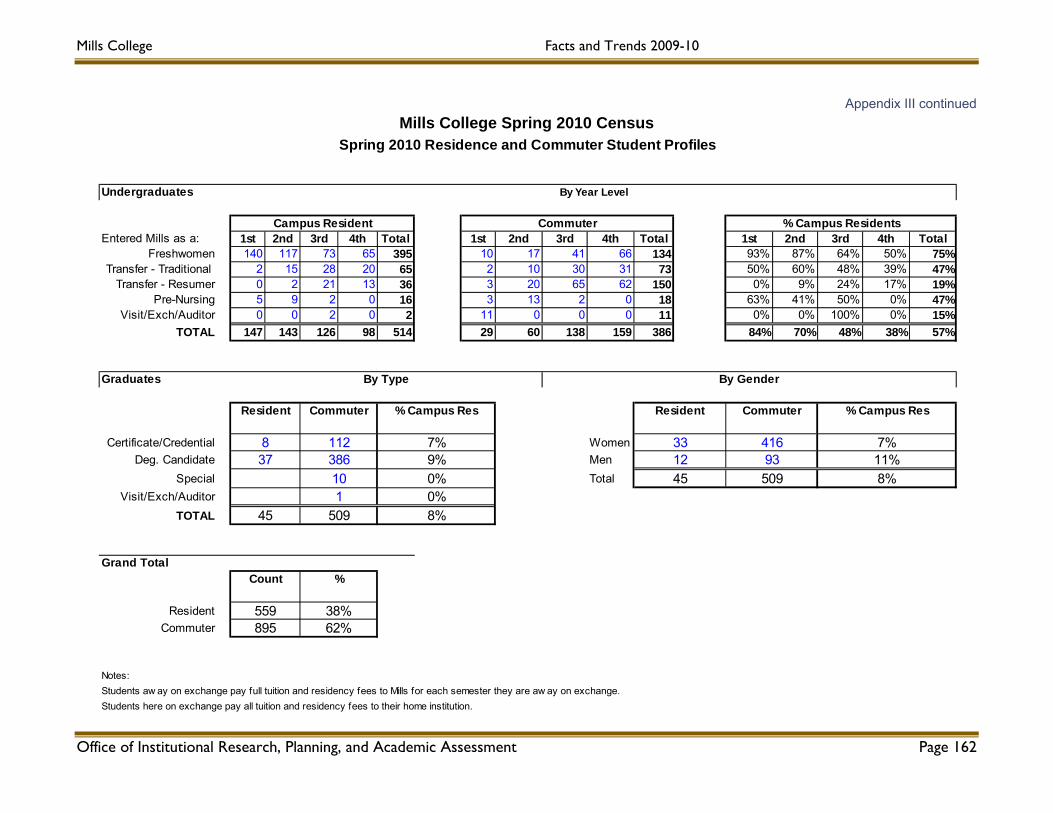
Mills College Facts and Trends 2009-10
Appendix III continued Mills College Spring 2010 Census
Undergraduates
Entered Mills as a: 1st 2nd 3rd 4th Total 1st 2nd 3rd 4th Total 1st 2nd 3rd 4th TotalFreshwomen 140 117 73 65 395 10 17 41 66 134 93% 87% 64% 50% 75%
Transfer - Traditional 2 15 28 20 65 2 10 30 31 73 50% 60% 48% 39% 47%Transfer - Resumer 0 2 21 13 36 3 20 65 62 150 0% 9% 24% 17% 19%
Pre-Nursing 5 9 2 0 16 3 13 2 0 18 63% 41% 50% 0% 47%Visit/Exch/Auditor 0 0 2 0 2 11 0 0 0 11 0% 0% 100% 0% 15%
TOTAL 147 143 126 98 514 29 60 138 159 386 84% 70% 48% 38% 57%
Graduates
Certificate/Credential WomenDeg. Candidate Men
Special TotalVisit/Exch/Auditor
TOTAL
Grand Total
ResidentCommuter
Notes:Students aw ay on exchange pay full tuition and residency fees to Mills for each semester they are aw ay on exchange.Students here on exchange pay all tuition and residency fees to their home institution.
450%8%
1
38%
%
3750993
45
33
8%1012
0%
By Type
509
% Campus Res
7%9%
559895 62%
Count
7%11%386
Commuter
416
Resident
112
By Year Level
8
Spring 2010 Residence and Commuter Student Profiles
% Campus Residents
Resident Commuter
Campus Resident Commuter
% Campus Res
By Gender
Office of Institutional Research, Planning, and Academic Assessment Page 162
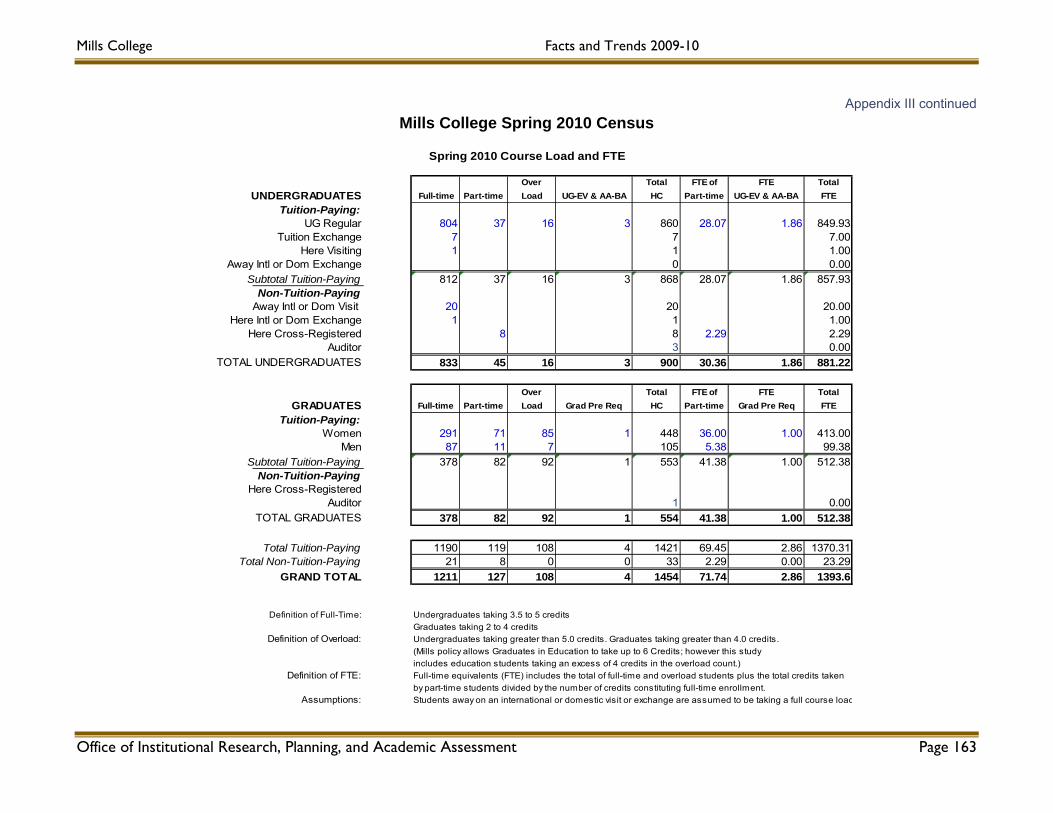
Over Total FTE of FTE Total Full-time Part-time Load UG-EV & AA-BA HC Part-time UG-EV & AA-BA FTE
Tuition-Paying:804 37 16 3 860 28.07 1.86 849.93
Tuition Exchange 7 7 7.00Here Visiting 1 1 1.00
0 0.00Subtotal Tuition-Paying 812 37 16 3 868 28.07 1.86 857.93
Non-Tuition-PayingAway Intl or Dom Visit 20 20 20.00
Here Intl or Dom Exchange 1 1 1.00Here Cross-Registered 8 8 2.29 2.29
Auditor 3 0.00833 45 16 3 900 30.36 1.86 881.22
Over Total FTE of FTE TotalFull-time Part-time Load Grad Pre Req HC Part-time Grad Pre Req FTE
Tuition-Paying:291 71 85 1 448 36.00 1.00 413.0087 11 7 105 5.38 99.38
Subtotal Tuition-Paying 378 82 92 1 553 41.38 1.00 512.38Non-Tuition-Paying
Here Cross-RegisteredAuditor 1 0.00
378 82 92 1 554 41.38 1.00 512.38
Total Tuition-Paying 1190 119 108 4 1421 69.45 2.86 1370.31Total Non-Tuition-Paying 21 8 0 0 33 2.29 0.00 23.29
1211 127 108 4 1454 71.74 2.86 1393.6
Definition of Full-Time: Undergraduates taking 3.5 to 5 creditsGraduates taking 2 to 4 credits
Definition of Overload: Undergraduates taking greater than 5.0 credits. Graduates taking greater than 4.0 credits.(Mills policy allows Graduates in Education to take up to 6 Credits; however this studyincludes education students taking an excess of 4 credits in the overload count.)
Definition of FTE: Full-time equivalents (FTE) includes the total of full-time and overload students plus the total credits taken by part-time students divided by the number of credits constituting full-time enrollment.
Assumptions: Students away on an international or domestic visit or exchange are assumed to be taking a full course load
WomenMen
TOTAL GRADUATES
GRAND TOTAL
Spring 2010 Course Load and FTE
UNDERGRADUATES
UG Regular
Away Intl or Dom Exchange
TOTAL UNDERGRADUATES
GRADUATES
Office of Institutional Research, Planning, and Academic Assessment Page 163
Appendix III continued
Mills College Facts and Trends 2009-10
Mills College Spring 2010 Census

Mills College Facts and Trends 2009-10
Appendix III continued Mills College Spring 2010 Census
African American Asian Pacific Latina/ Bi/Multi White Unknown TotalFIRST-TIME FIRST YEAR American Indian Islander Latino Non-Hispanic
Non-resident Alien 0United States Citizen / Resident 1 1
SUBTOTAL FIRST-TIME FIRST YEAR 0 0 0 0 0 0 0 1 1
African American Asian Pacific Latina/ Bi/Multi White Unknown TotalALL FULL TIME American Indian Islander Latino Non-Hispanic
Non-resident Alien 8 9 5 22United States Citizen / Resident 64 7 55 2 146 25 310 218 827
TOTAL FULL-TIME UNDERGRADUATES 64 7 63 2 155 25 310 223 849
African American Asian Pacific Latina/ Bi/Multi White Unknown TotalFIRST-TIME FIRST YEAR American Indian Islander Latino Non-Hispanic
Non-resident Alien 0United States Citizen / Resident 0
SUBTOTAL FIRST-TIME FIRST YEAR 0 0 0 0 0 0 0 0 0
African American Asian Pacific Latina/ Bi/Multi White Unknown TotalALL PART TIME American Indian Islander Latino Non-Hispanic
Non-resident Alien 1 7 8United States Citizen / Resident 8 3 2 20 10 43
TOTAL PART-TIME UNDERGRADUATES 8 0 3 0 2 0 21 17 51
TOTAL UG STUDENTS 72 7 66 2 157 25 331 241 900% of KNOWN ETHNICITY 11% 1% 10% 0.30% 24% 4% 50%
African American Asian Pacific Latina/ Bi/Multi White Unknown TotalFULL TIME American Indian Islander Latino Non-Hispanic
7 1 2 1049 2 45 0 39 9 223 94 46149 2 52 0 39 9 224 96 471
African American Asian Pacific Latina/ Bi/Multi White Unknown TotalAmerican Indian Islander Latino Non-Hispanic
021 7 5 1 35 14 8321 0 7 0 5 1 35 14 83
70 2 59 0 44 10 259 110 554% of KNOWN ETHNICITY 16% 0% 13% 0% 10% 2% 58%
African American Asian or Pacific Latina/ Bi/Multi White Unknown TotalAmerican Indian Pacific Is Islander Latino Non-Hispanic
COUNT 142 9 125 2 201 35 590 351 1454% of KNOWN ETHNICITY 13% 1% 11% 0.18% 18% 3% 53%
TOTAL FULL TIME
Non-resident AlienUnited States Citizen / Resident
TOTAL PART TIME
PART TIME
Spring 2010 Ethnicity Profile
UNDERGRADUATES
Non-resident AlienUnited States Citizen / Resident
GRADUATES
MILLS UG and GR TOTAL
FULL
TIM
EPA
RT T
IME
TOTAL GR STUDENTS
Office of Institutional Research, Planning, and Academic Assessment Page 164

Office of Institutional Research, Planning, and Academic Assessment Page 165
Appendix III continued
Mills College Facts and Trends 2009-10
Cohort Fall 1 Spr 1 % Fall 2 % Spr 2 % Fall 3 % Spr 3 % Fall 4 % Spr 4 Grad % Grad %2001 113 100 88% 91 81% 81 72% 69 61% 52 46% 62 55% 54 58 51% 6 57%2002 137 122 89% 99 72% 95 69% 88 64% 85 62% 86 63% 78 74 54% 10 61%2003 115 107 93% 95 83% 91 79% 79 69% 77 67% 67 58% 60 62 54% 10 61%2004 135 124 92% 101 75% 100 74% 89 66% 89 66% 84 62% 75 69 51% 54%2005 184 168 91% 131 71% 123 67% 110 60% 109 59% 105 57% 97 83 45% 51%2006 185 165 89% 136 74% 133 72% 117 63% 110 59% 105 57% 103 0% 45%2007 185 171 92% 137 74% 129 70% 122 66% 113 61% 0%2008 188 174 93% 144 77% 140 74% 0%2009 159 153 96% 0%
Other Fall to Spring Retention Rates (Fall 1 to Spring 1)
Transfers: S 08 S 09 S 10Traditional 90% 90% 93%Resumer 88% 93% 95%Nursing:First-Year 100% 93% 100%Transfer 90% 92% 82%
Undergraduate Student Retention and Graduation RatesBased on Enrollment of First-Time First-Year Students
Updated Spring 2010
4-Year Graduation Rate 6-Year Graduation Rate
Mills College Spring 2010 Census