facts and figures on skills in manufacturing
TRANSCRIPT

Facts and Figures on Skills in Manufacturing │ 1
towards full-scale industrialisation and inclusive growththe dti Customer Contact Centre: 0861 843 384
the dti Website: www.thedti.gov.za
FACTS AND FIGURES ON SKILLS IN
MANUFACTURING2019

© The Department of Trade and Industry (the dti), March 2019.
Compiled by: Raidani P
Photos are courtesy of the dti Photo Library
the dti Campus
77 Meintjies Street
Sunnyside
Pretoria
0002
the dti
Private Bag X84
Pretoria
0001
the dti Customer Contact Centre: 0861 843 384
the dti Website: www.thedti.gov.za

Contents
Introduction ..........................................................................................................................5
Highlights .............................................................................................................................6
Manufacturing employment, value-added and gross domestic product ..............................7
Competitive rankings: Education and related indicators....................................................10
Skills levels and employment by manufacturing subsectors and qualifications.................13
Demographic profile of artisan, technician and engineer employment in manufacturing ..19
Registration of professional engineering technicians with ECSA ......................................23
Industrial Policy Action Plan (IPAP) sectoral focus areas ..................................................26
Supply of artisans, technicians and engineers ..................................................................28
Enrolment and graduation of engineers, technologists and technicians ...........................30
References ........................................................................................................................33
Annexures .........................................................................................................................35

4

Facts and Figures on Skills in Manufacturing │ 5
Introduction
Government has acknowledged that the manufacturing sector is indispensable if South
Africa is to achieve its economic growth targets (the dti, Newsflash, 20 June 2018). After
growing by 3,1% in the fourth quarter of 2017, the South African economy wobbled in
the first quarter of 2018, shrinking by 2,2% quarter-on-quarter (seasonally adjusted and
annualised) (Statistics SA, GDP 2018). Agriculture, mining and manufacturing were the main
contributors to the slowdown.
Global challenges such as trade wars and increased protectionism necessitate that South
Africa and its neighbours trade among themselves (the dti, Newsflash, 20 June 2018).
According to Statistics SA, the unemployment rate among young South African people aged
15 to 34 was 38,2%, implying that more than one in every three young people in the labour
force did not have a job in the first quarter of 2018. Youth unemployment, however, is not
unique to South Africa; it is a global phenomenon. According to the International Labour
Organisation (ILO), there were about 71-million unemployed youth aged 15 to 24 years
globally in 2017, with many of them facing long-term unemployment.
Artisan training and development has been identified as a critical area to address the
challenges of economic growth and redress, and provide an avenue to tackle the growing
challenge of youth unemployment in South Africa (NSDS III).
This information brief provides an overview of employment trends for artisans, technicians
and engineers in the manufacturing sector in South Africa from 2002 to 2017. It examines

6
the employment and value-added trends and provides detailed technical occupational
trends as well as an overview of the skills levels and technical occupations by qualifications
and sub-sectors. Finally, it analyses the relationship between enrolments and graduations of
engineering students at universities of technology, and enrolments and competent artisans
from the Department of Higher Education and Training.
There is much data and information available on manufacturing value-added and employment
growth. This document does not try to replicate the good work carried out by researchers,
instead it attempts to pool together a few pieces of data and statistics with the intention to
inform the private sector and assist policymakers in their attempts to plan for future skills
and economic growth.
Highlights
• South Africa was 61 out of 137 countries in the World Economic Forum’s (WEF) 2017/18 ranking of the best place to do business.
• Corruption is the most problematic factor of doing business in South Africa (WEF).
• Manufacturing’s share of total employment in the country is 11%.
• Domestic demand remains weak, with sales volumes stuck in negative terrain since 2015.
• The share of South Africa’s manufacturing is about 13% of gross domestic product (GDP).
• The majority of artisans do not have the required qualifications.

Facts and Figures on Skills in Manufacturing │ 7
• The basic metals sector is the largest employer of artisans in the manufacturing sector.
• The majority of the technical workforce in the manufacturing sector is artisans.
• Only 24,4% of South African women are in craft and trade positions in the manufacturing sector.
• Women remain a minority in the science, technology, engineering, and mathematics (STEM) fields.
• Women are less likely to enter and more likely to leave STEM careers.
• Only 11% of all engineers globally are female.
• Only 8% of all students in engineering, manufacturing and construction globally are women.
• South Africa has one engineer per 3 166 people, compared to 1:227 in Brazil and 1:543 in Malaysia (ECSA).
• The key challenge to industrial policy is to incentivise investment in plant, technologies and skills.
Manufacturing employment, value-added and gross domestic product
This section considers growth trends in the manufacturing sector, its share of GDP and
impact on the trends in employment between 2002 and 2017. The manufacturing sector
provides a locus for stimulating the growth of other activities, such as services, and achieving
specific outcomes, such as employment creation and economic empowerment (Brand South
Africa, June 2017).

8
Figure 1: Manufacturing share of total employment, 2008-2017
Source: Statistics South Africa, QLFS and own calculations, 2017
Manufacturing accounts for about 11% of the total South African workforce, down from
14% in 2008, as shown in Figure 1. Manufacturing employment share has been stable at
about 11% for the past eight years, though the total employment in the economy has been
increasing since 2011.
The rise of digital and changes in manufacturing technologies has led to the decline of
employment in the sector. There was, however, improvement and strong linkages to the
service sectors that sustain jobs in the economy (the dti, 2017). Employment prospects
in manufacturing remain weak, with only the two subsectors of wood and textiles reporting
positive employment growth (BER Survey, 2017Q4).

Facts and Figures on Skills in Manufacturing │ 9
Consistent improvement in manufacturing capacity and quality requires a “constant watch”
of supply side issues such as labour, skills and material costs (Dylan Slater, March 2018).
This is due to innovation and technology, which is always improving. Job creation and
economic motivation remains government’s first target in attracting domestic and foreign
investment to the economy. Government needs to make an effort if it is to achieve the
economic projections outlined in the National Development Plan (NDP).
Figure 2: Manufacturing value-added and GDP growth rates at constant 2010 prices, 2002−2017
Source: Statistics South Africa, GDP, 2017

10
South Africa’s manufacturing sector is stuck in a rut, with negative growth in 2017, as indicated
in Figure 2. According to the BER 2017Q4 survey, domestic demand remains weak, with
sales volumes stuck in negative terrain since 2015. Weak consumer demand, persistently
falling business investment, policy uncertainty and the prolonged drought weighed heavily
on activity (OECD, 2017). This is a worry for South Africans since stagnating local production
and sales volumes will have a negative impact on employment and economic growth.
The decrease in production volumes might have been caused by an increase in total cost
of production per unit. The acceleration was likely driven by higher purchasing prices of raw
materials, which rose to their highest levels since 2016Q2 (BER Survey, 2017Q4).
According to the South African Reserve Bank (SARB), South Africa continues to record
steady declines in manufacturing value added, from about 24% of GDP in the 1980s to
13% in 2017. The declining share of manufacturing is not unusual and is a feature of other
developing and developed economies, excluding the Asia and Pacific regions. The share of
manufacturing in the United States (US), for example, has been declining for more than two
decades (Martin NB and Barry PB, 2014).
Competitive rankings: Education and related indicators
The WEF,s Global Competitiveness Report provides an overview of the competitiveness of
138 economies in 2016/17 and 137 in 2017/18, and is considered the most comprehensive
assessment of its kind globally. It contains a detailed profile for each of the economies

Facts and Figures on Skills in Manufacturing │ 11
included in the study, as well as an extensive section of data tables with global rankings
covering more than 100 indicators.
Table 1: Global Competitiveness Index (score and ranking for South Africa), 2011−2018
Edition 2011 − 12 2012 − 13 2013 − 14 2014 − 15 2015 − 16 2016 − 17 2017 − 18Rank 50/142 52/144 53/148 56/144 49/140 47/138 61/137Score (1 - 7) 4,3 4,4 4,4 4,4 4,4 4,5 4,3
Source: World Economic Forum, Global Competitiveness Report 2017/18
South Africa was ranked 61 out of 137 countries in the WEF 2017/18 Global Competitiveness
report, down from 47 out of 138 countries in 2016/17, as shown in Table 1. According to the
Global Competitiveness data, South Africa is ranked 100 (less than 50% on average) out
of 137 countries when looking at the availability of scientists and engineers in the country,
an improvement on its ranking of 112 in 2016. This means that South Africa does not have
enough scientists and engineers, which could impact negatively on the country’s levels of
innovation and competitiveness.
South Africa’s education system is poor; at least 60% of youth drop out of school before
the matriculation stage (Thomas Neymar, September 2017). Competitiveness remains an
important contributor to the broader goal of human-centric economic progress by creating
the resources needed for increased well-being, including better education, health, security
and higher per capita income.

12
Figure 3: Most problematic factors for doing business in South Africa
Source: World Economic Forum, Executive Opinion Survey 2017
Business confidence remained low despite an improvement in underlying business
conditions, falling from 27 points in 2017Q3 to 24 points in 2017Q4 (BER Survey, 2017Q4).
Political climate, insufficient demand and skilled labour rated as the biggest constraints.
According to the WEF, the most problematic factor of doing business in South Africa is
corruption, followed by crime and theft, and government instability, as listed in Figure 3.
The high levels of crime in South Africa are deterring potential investors and contributing
to poor economic growth (Thomas Neymar, September 2017). Corruption is the enemy of

Facts and Figures on Skills in Manufacturing │ 13
good governance and destroys public trust in institutions (the dti, Newsflash, 28 September
2018); it discourages people from setting up businesses and applying for certain tenders
or jobs, particularly in government, as those who have connections get business in corrupt
ways. Monitoring, understanding and adapting to the political situation is critical for every
business since it can affect decision-making processes and strategic financial decisions,
supply chain, sales, distribution and reputation in the global market.
Skills levels and employment by manufacturing subsectors and qualifications
This section provides an analysis of skills levels in manufacturing, employment by sub-
sectors and the percentage shares of employed artisans, technicians and engineers by
education. As indicated in Figure 3, South Africa has an inadequately educated workforce
and this was identified as one of the most problematic factors of doing business in the
country. This section provides the overview of the qualifications of the technical workforce
in manufacturing.

14
Figure 4: Share of employed persons by occupation in manufacturing, 2002-2017
Source: Statistics South Africa, QLFS and own calculations, 2017
The share of low skilled employment was stable over the period, while that of semi-skilled
employment declined by 2,5 percentage points to 61,9% in 2017, and skilled employment
increased by 3,1% in 2017, as shown in Figure 4. The manufacturing sector faces a low-
growth environment, characterised by a poor skills profile and weak competition for goods
and services (StatsSA, 2015). The majority of manufacturing employment is semi-skilled
(61,9%), followed by skilled (21,8%) and low-skilled occupations (16,4%).
The change in the skills level employment might be due to new technology in the industry,
including robots and automation. Manufacturers rely on skilled people to operate advanced
technology, which is a basic requirement of the sector. With increasing reliance on
Facts and Figures on Skills in Manufacturing │ 15
technology, businesses collect, store and analyse massive amounts of data on a daily basis.
These advances in computing and automation have resulted in high demand for analytics
professionals (Staff Writer, 20 June 2018). Automation provides the opportunity for humans
to focus on higher-skilled, higher-quality and higher-paid tasks.
A key constraint to economic growth is the mismatch between the demand and supply of
skills. The extent to which workers are qualified in line with the requirements of the job is
a key indicator of the skills mismatch. Historically, most artisans had less than Grade 12
(at least Grade 9) and a post-school qualification, NTC 1-3, attained at a TVET college.
However, the oversupply of Grade 12s means that recently trained artisans have a minimum
of Grade 12 plus a TVET engineering qualification.
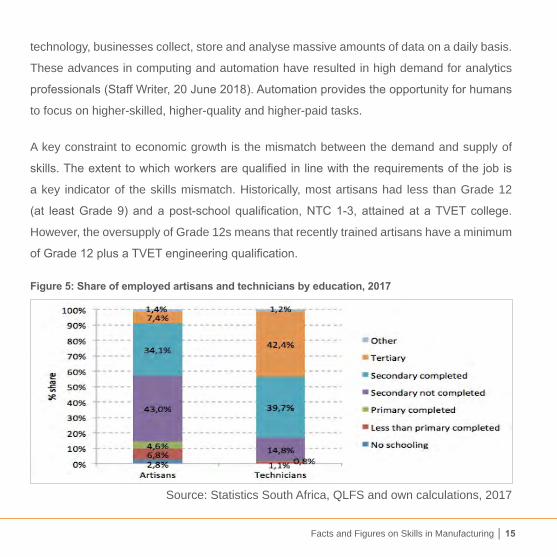
Figure 5: Share of employed artisans and technicians by education, 2017
Source: Statistics South Africa, QLFS and own calculations, 2017

16
Note to Fugure 5: StatsSA does not include the trade test qualification in its survey, which
is the only way to determine if an artisan is qualified or not. ‘Tertiary’ includes post-matric
certificate and diploma, post-higher diploma, bachelor’s degree, post-graduate diploma,
honours degree and higher degree.
The majority of artisans are unqualified, with 43,0% having less than Grade 12 (with no
additional qualification) and 34,1% Grade 12. It is painfully evident from these figures that
South Africa has a severe shortage of artisans with tertiary qualifications (7,4%), as shown
in Figure 5. While those who are unqualified probably have significant experience, it is clear
that not enough effort is being made to provide a form of certification through Recognition of
Prior Learning (RPL).
The share of employed persons with tertiary qualifications (graduates and other tertiary)
was higher among technicians than artisans. In terms of employed technicians, there is a
dissonance between the baseline qualification required (National Diploma from a University
of Technology) and the actual qualifications attained. This is worrying. Only 42,4% of
technicians in the manufacturing sector had tertiary qualifications, implying that the majority
did not have the right qualifications. The findings suggest that 57,6% of employed technicians
have either a Grade 12 (39,7%) or less (16,7%).
South Africa has set itself the goals of eradicating poverty, reducing inequality, growing
the economy by an average of 5,4% and cutting the unemployment rate to 6% by 2030.
Education, training and innovation are critical to the attainment of these goals (NDP: 296-7).

Facts and Figures on Skills in Manufacturing │ 17
Currently about 38% of South Africa’s youth are unemployed and this is further increasing
societal issues of poverty, inequality and crime.
South Africa’s large, well-developed metals industry, with vast natural resources and a supportive
infrastructure, represents roughly a third of all South Africa’s manufacturing. In 2001, South Africa
was ranked the world’s 19th-largest steel-producing country, and is the largest steel producer in
Africa (almost 60% of Africa’s total production) (Brand South Africa, June 2017).
Manufacturing covers a broad range of sub-sectors, each with its own set of unique
challenges and opportunities.
Figure 6: Percentage share of technician employment by manufacturing sub-sector, 2017
Source: Statistics South Africa, QLFS and own calculations, 2017

18
The food, beverages and tobacco sector remains the largest employer of technicians in the
manufacturing industry, followed by petroleum and basic metals, as indicated in Figure 6.
Figure 7: Percentage share of artisan employment by manufacturing sub-sector, 2017
Source: Statistics South Africa, QLFS and own calculations, 2017
The basic metals sector is the largest employer of artisans in the manufacturing industry,
followed by textile and clothing, and the food, beverages and tobacco sector, as shown in
Figure 7.

Facts and Figures on Skills in Manufacturing │ 19
Demographic profile of artisan, technician and engineer employment in manufacturing
The overwhelming majority of the technical workforce in the manufacturing sector is
represented by artisans (74%) and technicians (23%), while engineers and technologists
constitute only 3,0%, as shown in Figure 8. The percentage share of highly skilled individuals
is the smallest of the technical workforce in the sector. According to the Manufacturing,
Engineering and Related Services Sector Education and Training Authority (MerSETA), the
shortage of highly skilled individuals has contributed to the slow adoption of technology,
lower productivity and low competitiveness in South Africa.
Figure 8: Percentage share of technical workforce in manufacturing, 2017
Source: Statistics South Africa, QLFS and own calculations, 2017

20
Over the period 2002 to 2017, total manufacturing employment grew by about 0,4%,
as compared to the annual growth of employment in the economy, which was 2,4%.
The compounded annual growth rate (CAGR) varied widely in technical occupations in
manufacturing, ranging from -7,1% for engineers and technologists to -0,8% for technicians
and -0,8% for artisans (2002 to 2017) (Annexure 1). Employment of technical workforce in
manufacturing is therefore shrinking
Figure 9: Employment share of artisans and technicians by gender (%), 2002 and 2017
Source: Statistics South Africa, QLFS and own calculations, 2017
In South Africa, women represent about 52% of the population, but only 24,4% are in craft
and trade positions in the manufacturing sector, a decrease of 11% from 35,4% in 2002.

Facts and Figures on Skills in Manufacturing │ 21
The proportion of women employed as technicians increased from 34,0% in 2002 to 37,4%
in 2017, a significant step towards closing the gender gap. TVET colleges are reporting an
increase in female students in fitting and turning as well as electrical and motor trades. More
women are graduating (20% in 2017) in engineering than men (18% in 2017) in universities
of technology (DHET, 2017). In 2017, women were far less likely than men to be working
as artisans and technicians. A higher proportion of women (37,4%) are more likely to be
technicians than artisans (24,4%), as shown in Figure 9.
As many girls as boys are completing high-school-level education, and more women
graduate from university worldwide than men, but women remain a minority in the science,
technology, engineering and mathematics (STEM) fields (Ana Maria Munoz-Boudet, March
2017). These include engineers, scientists, technicians and artisans.
Surveys in 2017 indicate that only 11% of engineers globally are female (Moosajee N,
October 2017). Worryingly, things are not getting better: The proportion of South African
women employed as engineers actually fell between 2002 and 2017 (StatsSA, 2017).
Women are less likely to enter and more likely to leave STEM careers (Catalyst, Quick Take,
3 January 2018).

22
Figure 10: Percentage share (%) of artisans and technicians by population group, 2002 and 2017
Source: Statistics South Africa, QLFS and own calculations, 2017
Figure 10 shows employment of artisans and technicians by population group. Black artisans
outnumbered those from other racial categories, with about 69% working as artisans in 2002
and 77% in 2017. In 2002, about 47% of employed technicians were white, dropping to 18%
in 2017. The number of black technicians increased the most, growing from 31% in 2002 to
59% in 2017. The percentage share of white artisans declined from 15% in 2002 to 10% in
2017.

Facts and Figures on Skills in Manufacturing │ 23
The share of black artisans (albeit male) is reflective of the economically active population,
contradicting the public perception that the average artisan is white and male (usually
more than 50 years of age). The data shows that there has been a substantive turnaround
in the demographic profile of the employed artisan population, which closely mirrors the
economically active population. The proportion of black workers in the labour force has also
increased since 2002 (StatsSA, 2017).
Registration of professional engineering technicians with ECSA
According to the Engineering Council of South Africa (ECSA), persons applying for
registration as professionals must have demonstrated their competence, as measured
against standards determined by the ECSA for the relevant category of registration, and
have passed any additional examinations determined by the council.

24
Figure 11: Registrations (% growth) of professional engineering technicians with
ECSA, 2010−2017
Source: ECSA and own calculations, 2018
In the 2016/17 financial year, there were 49 304 registered persons. At the end of the 2017/18
financial year, the numbers were at 52 557, which shows an upward trajectory of 6,6% in
the database of registered engineering practitioners. The percentage share of professional
engineering technicians was 19,6%, as compared to the share of professional engineers, which
was 59,2% for 2017/18. According to ECSA, the positive trajectory is a result of the increased
database of trained and appointed volunteers assisting ECSA with the peer-review exercise,
which in turn contributes to reduced turnaround times in the processing of registrations.

Facts and Figures on Skills in Manufacturing │ 25
Figure 11 provides an analysis of the annual growth trends of registered technician
professionals. Black Africans represent the overwhelming share registered in 2017/18,
with a growth of 7,8% from 2016/17. In 2010, whites represented the overwhelming share
of professional engineering technicians, but constituted 39,1% (more than two population
groups) of registrations in 2017/18. White registrations showed the slowest growth in
2017/18.
Figure 12: Registrations (% growth) of professional engineers with ECSA, 2009-2017
Source: ECSA and own calculations, 2018
Figure 12 shows the trend in the growth rates of registered engineers by population group in
South Africa. Whites have the lowest growth rates as compared to other population groups.

26
Black Africans grew at higher rates than other groups, followed by Indians. Data provided by
ECSA shows that South Africa lags behind other developing countries on the international
benchmark of average population per engineer. One engineer in South Africa services an
estimated 3 166 people, compared to Brazil’s 227 and Malaysia’s 543 people per engineer
(ECSA, 2018). It is evident from these figures that South Africa has a severe shortage
of engineering practitioners. Research shows that shortage of skills is a key obstacle to
economic growth, job creation and business expansion.
Industrial Policy Action Plan (IPAP) sectoral focus areas
Industrial policy has traditionally placed a strong emphasis on the manufacturing sector,
precisely because industrial investment in targeted technologies and sectors spills over
to the rest of the economy, and in terms of production disciplines, the mastery of new
technologies and ultimately design capabilities (IPAP, 2018). The IPAP, which has been
developed and published by the dti every year since 2007, analyses the South African
economy and identifies key constraints on industrial policy as well as sectoral focus areas in
order to increase the economy’s ability to produce more value using less resources.
In addition, core to South Africa’s industrial policy is the objective of transforming the racially
skewed ownership, management and employment profile of the economy (IPAP, 2018).
Over the 10-year IPAP period, imports have doubled, while manufactured exports have
grown four-fold, mainly dominated by metals, metal products, machinery and equipment,

Facts and Figures on Skills in Manufacturing │ 27
including capital equipment and mining machinery (the dti, Newsflash, 20 June 2018).
Figure 13 shows the IPAP sectoral focus areas for the period 2018/19 to 2020/21.
Figure 13: IPAP sectors
Source: the dti, IPAP 2018/19 – 2020/21
The IPAP Sectoral focus areas 2 include green industries, mineral beneficiation, business
process services, aerospace and defence, electro-technical and white goods industries, and
marine manufacturing and associated services.

28
The key challenge to industrial policy is to incentivise investment in plant, technologies
and skills that would have medium- to long-term benefits for the economy (IPAP, 2018).
Investment in the sectoral focus areas will increase production, employment and infrastructure
development in the economy. New technologies and skills will also have a positive impact on
South Africa’s competitiveness improvement as compared to other economies. Government
must work closely with the private sector to secure and support investments in a modernised
and competitive manufacturing sector, if it is to grow the economy (the dti, Newsflash, 20
June 2018).
Competitiveness remains an important contributor to the broader goal of economic progress
by creating the resources needed for increased well-being, including better health and
higher per capita income.
Supply of artisans, technicians and engineers
The supply of artisans and technicians in this paper will be analysed using the following data
sources:
• Artisan trade test results – number of people enrolled and those who passed the artisan trade test as released by Indlela, based on SETA data; and
• Higher Education Management Information System (HEMIS) data – this dataset has the number of engineering (including technician) enrolments and graduations from universities of technology.

Facts and Figures on Skills in Manufacturing │ 29
SETAs have been established to manage the skills development needs in South Africa. Each
SETA coordinates skills development in its particular sector. For the purposes of planning
and managing the delivery of training, the economy has been divided into 23 sectors, each
of which has its own SETA.
Table 2: Artisan enrolments and completion by manufacturing SETAs, 2017-2018
Manufacturing SETAs
Actual enrolled learners Actual certificated learners
2016/17 2017/18Y/Y
growth rate
2016/17 2017/18Y/Y
growth rate
CHIETA 4 263 3 172 -26% 936 957 2%
FOODBEV 178 167 -6% 13 63 385%
FP&M 419 290 -31% 124 114 -8%
MERSETA 8 038 6 755 -16% 9 661 7 938 -18%
Total Manufacturing
12 898 10 384 -19% 10734 9072 -15%
Source: DHET, 2018
The NDP aims to ensure that all South Africans attain a decent standard of living by 2030,
and states that the country should produce more than 30 000 qualified artisans a year
in order to meet labour demand. Table 2 shows that 9 072 manufacturing artisans were
certificated in 2017/18, a decrease from 10 734 in 2016/17. Job creation begins with a

30
skilled workforce, and South Africa needs to increase its effort to achieve the increase in
industrialisation projects and employment projections outlined in the NDP.
Enrolment and graduation of engineers, technologists and technicians
The ratio of enrolment to graduation of engineering students provides insight into the
profession’s skills pipeline. There are three types of universities in South Africa: traditional,
comprehensive and technological. The country’s 26 public higher education institutions offer
a range of study and research options for local and international students.
The data from the Department of Higher Education and Training (DHET) shows that the
overwhelming majority of students are at universities of technology (43,1%), followed by
traditional (30,3%) and comprehensive universities (26,6%), as shown in Figure 14.

Facts and Figures on Skills in Manufacturing │ 31
Figure 14: Engineering students (enrolments) by types of universities in South
Africa, 2017
Source: DHET, 2018
Figure 15 shows the trends in the enrolments and graduations of engineers who studied at
the universities of technology. Engineering technicians generally hold a National Diploma
(NDip) from a university of technology. The number of enrolments improved incrementally
over the period, after a dip from 2005 to 2007. The same trend was observed in the number
of graduates. There is a big gap between the numbers of enrolments and graduates, a
situation that has persisted over the past 16 years. South Africa produces and retains too
few engineers, with many graduates choosing to work abroad (Staff Writer, 20 June 2018).

32
The development of trades and engineers (skills required by the economy) should be a
priority.
Figure 15: Trends in universities of technology engineering enrolments and
graduates (2002-2017)
Source: DHET, 2018
Data from the DHET shows that engineering is one of the areas with the greatest gender
imbalance in universities, with only 27% of students being women in 2017. According to
the United Nations Educational, Scientific and Cultural Organisation (Unesco) Institute of
Statistics, only 8% of all students in engineering, manufacturing and construction globally
are women.

Facts and Figures on Skills in Manufacturing │ 33
Table 3: Gender distribution of engineering enrolments and graduates at all universities (2017)
Gender Enrolments Graduates % share of graduatesMale 63 585 (73%) 10 561 (70%) 17%
Female 23 721 (27%) 4 482 (30%) 19%
Total 87 305 (100%) 15 043 (100%) 17%
Source: DHET, 2018
The proportion of women receiving engineering degrees in South Africa actually fell between
2002 and 2017 and, according to the World Bank research (Ana Maria Munoz-Boudet,
March 2017), the picture is similar around the world. The data, however, shows that in 2017
the percentage of women engineering students who graduated from universities (19%) was
higher than that of men (17%), as shown in Table 3.
According to Unesco, limited female role models, misconceptions about engineering studies
and careers, and gender bias are some of the factors that are keeping girls and women out
of engineering studies and careers (Moosajee N, October 2017).

34
ReferencesMoosajee Naadiya (UNESCO), October 2017. WomEng in South Africa is cracking the code to get girls into engineering studies. https://en.unesco.org/
Ana Maria Munoz-Boudet, March 2017. STEM fields still have a gender imbalance, here’s what we can do about it. World Bank.
Catalyst, Quick Take: Women in Science, Technology, Engineering, and Mathematics (STEM) (January 3, 2018).
Thomas Neymar, September 2017. Can you analyse the constraints of economic growth in South Africa? Retrieved from https://www.quora.com/
the dti, 2018. Industrial Policy Action Plan 2018/19 – 2020/21.
Brand South Africa, June 2017. Manufacturing in South Africa. Retrieved from https://www.brandsouthafrica.com/investments-immigration/business/economy
Dylan Slater, March 2018. Long-suffering South African manufacturing sector hoping to reap Ramaphosa dividend, Engineering News. Retrieved from http://www.engineeringnews.co.za/article
BER, 2017Q4. Bureau for Economic Research Manufacturing Survey.
the dti, Newsflash, 20 June 2018. Manufacturing sector is an indespensable sector in South Africa.
Statistics SA, 2018. Gross Domestic Product publication, first quarter 2018.
Statistics SA, 2017. Quarterly Labour Forth Survey, third quarter publication.
International Labour Organisation, 2018.
OECD (2017, July). Economic Survey South Africa. Retrieved from OECD: www.oecd.org/eco/surveys/economic-survey-south-africa.htm
the dti, (2017). Manufacturing is a critical component for job creation.
Schwab K. World Economic Forum. (2016 – 2017). Global Competitiveness Report. Retrieved from www.weforum.org/gcr
DHET, 2017. HEMIS database.
ECSA. (2018). Annual Report. Retrieved from www.ecsa.co.za
Staff Writer. (20 June 2018). Top 5 jobs that young South Africans should be considering right now. Retrieved from https://businesstech.co.za/news/business
Kaizer Nyatsumba, October 2017. South Africa’s escalating engineering crisis. Business Report.

Facts and Figures on Skills in Manufacturing │ 35
Annexures
Annexure 1: Comparison of employment trends in artisans, technicians and manufacturing in South Africa (2002-2017)
YearArtisans and technicians employment in manufacturing Total
manufacturing employment '000
Technicians '000
Y/Y % change
Artisans '000
Y/Y % change
2002 153 481 1647
2003 141 -7.90% 453 -5.80% 1560
2004 120 -14.60% 464 2.40% 1724
2005 110 -8.10% 545 17.50% 1742
2006 120 8.40% 547 0.40% 1757
2007 109 -9.10% 525 -4.00% 1776
2008 158 45.10% 546 4.00% 19172009 168 6.50% 458 -16.10% 17712010 163 -2.90% 445 -2.80% 1713
2011 135 -17.60% 471 5.80% 1737
2012 143 5.90% 430 -8.70% 1727
2013 166 16.30% 404 -6.10% 1667
2014 145 -12.50% 441 9.20% 1741
2015 137 -5.40% 475 7.70% 1774
2016 110 -19.70% 455 -4.20% 1683
2017 136 23.64% 427 -6.15% 1749
CAGR -0.8% -0.8% 0.4%

towards full-scale industrialisation and inclusive growththe dti Customer Contact Centre: 0861 843 384
the dti Website: www.thedti.gov.za
the dti Campus
77 Meintjies Street
Sunnyside
Pretoria
0002
the dti Private Bag X84
Pretoria
0001
the dti Customer Contact Centre: 0861 843 384
Website: www.thedti.gov.za