factors underlying human errors in air traffic...
TRANSCRIPT

Factors Underlying Human Errors in Air
Traffic Control
Samantha de Reuck 312568
Supervisor: Fiona Donald 3/10/2014
A research project submitted in partial fulfilment of the requirements for the degree of MA
by coursework and research report in the field of Industrial/Organisational Psychology in the
Faculty of Humanities, University of the Witwatersrand, Johannesburg, 14th February 2014.

i
Table of Contents CHAPTER 1: INTRODUCTION ........................................................................................................... 1
1.1. Rationale ................................................................................................................................. 2
1.2. Aims ........................................................................................................................................ 3
1.3. Research Questions ................................................................................................................. 3
1.4. Structure .................................................................................................................................. 4
1.5. Acronyms used ........................................................................................................................ 4
CHAPTER 2: CONCEPTUAL BACKGROUND .................................................................................. 6
2.1. Air Traffic Control ....................................................................................................................... 6
2.2. Safety Events ............................................................................................................................... 9
2.3. Human Error .............................................................................................................................. 12
2.4. Factors Underlying Air Traffic Control ..................................................................................... 14
2.4.1. Shift variables (Covariate 1). .............................................................................................. 14
2.4.2. Demographic Factors (Covariate 2). ................................................................................... 15
2.4.3. Human Factors (Covariate 3). ............................................................................................. 15
2.4.4. External Factors (Covariate 4). ........................................................................................... 30
2.4.5. Risk Factors (Covariate 5). ................................................................................................. 33
2.4.6. Stated causal errors (covariate 6). ....................................................................................... 35
2.5. Research Questions .................................................................................................................... 36
2.6. Jargon used................................................................................................................................. 37
CHAPTER 3: METHODOLOGY ....................................................................................................... 38
3.1. Sample........................................................................................................................................ 38
3.2. Instruments and procedure ......................................................................................................... 38
3.3. Ethical Considerations ............................................................................................................... 39
3.4. Data Analysis ............................................................................................................................. 40
CHAPTER 4: RESULTS ...................................................................................................................... 44
4.1. Introduction ........................................................................................................................... 44
4.2. Shift Variables, event variables and demographic variables ................................................ 44
4.3. Safety Events ........................................................................................................................ 48
4.4. Summary of results ............................................................................................................... 70
CHAPTER 5: DISCUSSION ................................................................................................................ 72
5.1. Shift, event and demographic variables. .................................................................................... 72
5.2. Safety events .............................................................................................................................. 76
5.3. Human error ............................................................................................................................... 86

ii
5.4. Summary of findings. ................................................................................................................. 92
CHAPTER 6: CONCLUSIONS ........................................................................................................... 94
6.1. Limitation and suggestions for future research .......................................................................... 95
Reference List ....................................................................................................................................... 97

iii
List of tables
Table
Number
Title Page
Number
1 List of acronyms 5
2 List of jargon used 37
3 Descriptive statistics of shift variables 45
4 Frequencies for grouped time since start of shift 45
5 Variables and component variables pre cluster analysis 49
6 Summary of the human factors clusters 50
7 Agglomeration Schedule for human factors with LoS 51
8 Logistic regression between LoS and mental models 52
9 Agglomeration schedule for human factors with RI 53
10 Logistic regression with Mental Models and RI 54
11 Summary of logistic regression on information processing (covariate) and
events (dependent).
54
12 Logistic regression with information processing components (covariates)
and safety events (dependent variable)
55
13 Agglomeration schedule for external factors with LoS 56
14 Logistic regression external factors (covariates) and LoS (dependent) 57
15 Agglomeration schedule for external factors with RI 58
16 Logistic regression external factors (covariates) and RI (dependent) 59
17 Logistic regression with workplace design components (covariates) and
safety events (dependent variable)
60
18 Logistic regression risk factors (covariates) and event type (dependent) 61
19 Logistic regression on causal errors and LoS 63
20 Logistic regression on causal errors and RI 63
21 Summary of findings from ‘step one’ 64
22 Agglomeration schedule for human factors with human errors. 65
23 A summary of the logistic regression on information processing factors
and error types
66
24 A summary of the logistic regression on event type (dependent variable)
and error types (covariates)
68
25 Logistic regression with lapses (covariates) and safety events (dependent
variable)
69
26 A summary of the logistic regression on causal errors and human errors 70
27 Summary of the findings 71

iv
List of figures
Figure
Number
Title Page
Number
1 The different areas of control 7
2 Safety event scoring system 11
3 Information Processing Context for representing human error 13
4 Execution and planning failures 13
5 Generic model of human information processing with three memory
systems
19
6 A representation of memory functions 21
7 Decision making and situation awareness 24
8 The inverted U-curve 27
9 Photograph of a work station 32
10 Dendrogram using Ward linkage to cluster human factors with LoS. 52
11 Dendrogram using Ward linkage to cluster human factors with RI 53
12 Dendrogram using Ward linkage to cluster external factors with LoS 56
13 Dendrogram using Ward linkage to cluster external factors with RI
58
14 Dendrogram using Ward linkage to cluster human factors with human
errors
65
15 Dendrogram using Ward linkage to cluster human errors with LoS and RI. 68
16 A graphic representation of the relationship between shift variables and
safety events
75
17 A graphic representation of the findings thus far 80
18 A graphic representation of the relationship between shift variables, human
factors and external factors with safety events.
82
19 A graphic representation of the results. 84
20 A graphic representation of the relationship between the covariates and
safety events thus far.
86
21 A graphic representation incorporating the relationships found thus far. 88
22 A graphic representation of the relationships found 89
23 A graphic representation of the significant relationships found thus far in
this study
91
24 A graphic representation of all the significant relationships found in this
study
92

1
CHAPTER 1: INTRODUCTION
Navigable airspaces are becoming increasingly crowded with an escalation in the number of
accidents caused by human errors (Moon, Yoo & Choi, 2011). Air traffic control (ATC) is a
highly complex job that requires controllers to utilise specific skill sets in response to a
number of varying stimuli in order to ensure the safe passage of aircraft. Safety events or
occurrences are defined by the International Civil Aviation Authority as “any event which is
or could be significant in the context of aviation safety” (Skybrary, 2013). The term
‘occurrence’ refers to “operational interruption, defect, fault or other irregular circumstances
that has or may have influenced flight safety and that has not resulted in an accident or
serious incident” (Skybrary, 2013). Africa shows the highest regional accident rate despite
accounting for the lowest percentage of global traffic volume; only 3% of scheduled
commercial traffic (International Civil Aviation Organisation, 2013). Africa also shows
steadily increasing traffic volumes, with an average annual increase of 6.2% within the region
(International Civil Aviation Organisation, 2013). With the rise of traffic volumes and high
accident rates in Africa, it is imperative to address the issues underlying the incidents in order
to avert future incidents.
Safety occurrences or events emerge through a number of errors originating in two primary
sources; technical and human. The International Civil Aviation Organisation (ICAO)
categorise incidents into three primary categories; controlled flight into terrain, loss of control
in-flight and runway safety related (Skybrary, 2013). Two of these three categories fall
within ATC’s domain. Events can be initiated by both technical and human errors. In terms
of human errors, there are two primary sources from which the error can originate; pilot and/
or air traffic controller (controller) actions. This research set out to explore and identify the
underlying constructs at the base of one of the two primary originators of human error;
controllers. The research thus focused exclusively on safety events that occurred through the
fault of ATC. The research narrowed its exploration down to focus on six primary impacting
variables; shift work, demographic factors, human processes, physiological variables,
external factors and risk factors. Identifying the factors underlying human error in ATC will
aid navigation by informing and focusing the development of prevention techniques.

1.1. Rationale
With the number of aeroplanes entering and exiting airport space, it is essential that
operations and communication run smoothly. As seen from the description of the controller’s
job, this can be an extremely arduous task. There are a number of regulations (set forth by
the International Civil Aviation Organization- ICAO) that must be adhered to so as to
maintain safety standards. Incidents can range from a loss of separation to runway clearance.
The International Civil Aviation Organisation (2009) has set forth a Safety Management
System (SMS) in which they stipulate that organisations must have a formal process that
identifies hazards in operations.
In accordance with these prescriptions, the Air Navigation Service Provider (ANSP) is
alerted to any incidents that occur in the South African airspace. The ANSP then investigate
the details regarding the incident, the actions taken leading up to the incident and its primary
causes. Although these reports cover the incident and the primary source of that incident,
they do not look in depth at the underlying factors that caused the human error as they serve
more of a deposition function than an exploratory one.
The literature also shows paucity in the deep rooted factors underlying human errors. The
majority of literature that addresses human errors in ATC either identify the primary cause
for the incident (for example, communication breakdown) but not the root underlying that
reason. This means that the impact that human factors, external factors, shift factors and
demographic factors have on ATC capabilities has not been covered in great detail in
previous research (Endsley & Rodgers (1998), Moon, Yoo, & Choi (2011), Arvidsson,
Johansson, Ek, & Akselsson (2007), Isaac, Duchenne, & Amalberti (2002), Eurocontrol
(1996).
Little research into this particular field has been done, with a primary focus on the
development of human error identification systems and tools. Identifying the underlying
causes of commonly occurring incidents will help future studies in designing interventions
that may help eliminate these errors. Lastly, little if any research has been done in this field in
South Africa. ANSP ensures that the details of the incident are properly investigated but
there has been no research that looks at all the incidents together and identifies the underlying
causes and trends. Identifying causes at the root of incidents in the South African region will
guide future studies in tailoring solutions specific for the South African context.

1.2. Aims
The primary aim of this study was to explore and identify the underlying factors of human
errors in ATC. A number of factors were explored, with the aims of the research to establish
links between the six core variables (human factors, demographic factors, external factors,
shift variables, risk factors and stated causal factors) and the safety events as well as to
establish links between the core variables and the types of errors that occurred. In
establishing links between the variables, the events and the types of errors, this research was
able to identify the core factors underlying human error in safety events in air traffic control.
1.3. Research Questions
The research questions are posited as a means of identifying the underlying factors of human
error in ATC. The questions are divided in relation to two primary facets of the research;
safety events and human error. The research questions are consolidated into four primary
questions:
1. Are there particular times in shifts when safety events are likely to occur?
2. What event variables and demographic variables are common between events?
3. Which human factors, external factors, risk factors and stated causal errors are related
to safety events in air traffic control?
Which human factors are predictors of safety events?
What external factors are predictors of safety events?
What risk factors are predictors of safety events?
What stated causal factors are predictors of safety events?
The first three questions relate to the safety events and aim at establishing which shift
variables, demographics and event variables are common between events as well as which
human factors, risk factors, external factors and stated causal factors are related to safety
events in ATC. The establishment of which variables are predictors of safety events will
inform question four.
4. Are human factors, external factors, causal factors and safety events related to
different types of human errors?
What errors are human factors related to?

What errors are external factors related to?
Are safety events related to certain types of human errors?
Are stated causal errors related to certain types of human errors?
Question four aims at establishing links between the human and external factors that were
found to predict safety events and human error types as well as establish a link between
human error and the events themselves. The first sub-question aims at establishing what types
of errors safety events are related to. This will inform the research as to which human errors
are predictors of safety events. Next, the research investigates which of the predicting human
and external factors are related to human errors that predict safety events.
1.4. Structure
This research utilized ANSP safety event reports in an attempt to identify key conceptual
factors at the root of ATC. The report sets out a conceptual background in which the study is
contextualized and the various concepts explored are explicated. The conceptual background
is concluded with a reminder of the research questions and the technical terms used. The
methodology section proceeds and covers the sample, instruments and procedure, ethical
considerations and data analysis. The research results are then presented followed by a
discussion of the results and a conclusion.
1.5. Acronyms used
For convenience, Table 1 lists the acronyms used.
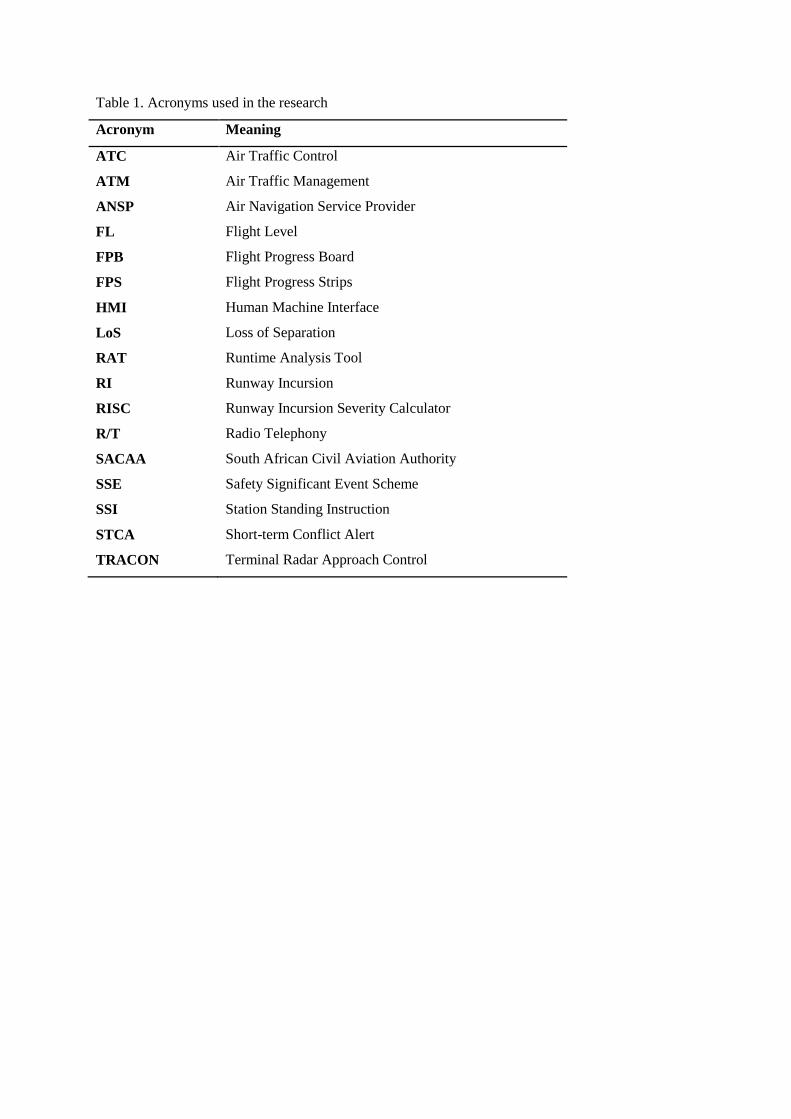
Table 1. Acronyms used in the research
Acronym Meaning
ATC Air Traffic Control
ATM Air Traffic Management
ANSP Air Navigation Service Provider
FL Flight Level
FPB Flight Progress Board
FPS Flight Progress Strips
HMI Human Machine Interface
LoS Loss of Separation
RAT Runtime Analysis Tool
RI Runway Incursion
RISC Runway Incursion Severity Calculator
R/T Radio Telephony
SACAA South African Civil Aviation Authority
SSE Safety Significant Event Scheme
SSI Station Standing Instruction
STCA Short-term Conflict Alert
TRACON Terminal Radar Approach Control

CHAPTER 2: CONCEPTUAL BACKGROUND
This section provides a brief theoretical background relevant to the study. The literature
review starts by providing a brief description of the responsibilities and roles of ATC as well
as the general rules and guidelines under which they operate. It then moves on to cover the
approach to human error this research adopted and the underlying core factors that will be
addressed, namely; demographic variables, shift variables, external factors and human
factors. The theory presented in the review aims to locate the study within the literature and
aid in contextualising it. A systems approach was adopted as ATC was regarded as a system
and factors within that system were evaluated and their impacts on one another explored.
These factors may potentially not always reside within a controller’s tasks, for example, but
may lie within the processes in place and system designs.
2.1. Air Traffic Control
The primary objective of ATC is ensuring the safe and orderly movement of aircraft through
a nation's airspace (U.S. Office of Personnel Management, 1978). To accomplish this, ATC
work is divided into three major functional groups, namely; “pre-flight briefing and
assistance, and advisory services to pilots during flight, providing control and separation of
en route air traffic; and control and separation of air traffic at airports” (U.S. Office of
Personnel Management, 1978, p. 4).
These three primary functional services are divided among the three different air traffic
facilities - flight service stations, air route traffic control centres and air traffic control
terminals (U.S Office of Personnel Management, 1978). These three ATC facilities control
different areas and heights and are in constant communication with each other as they hand
aircraft over from one area to the next. This involves efficient coordination and
communication between the control areas. The areas and corresponding facilities responsible
for them can be seen in figure 1. ATC manages a number of primary phases, ground
operations (which oversee from the gate to the taxiway to the runway), take-off and climb,
cross country flights and approach and landing (Wickens, Mavor, & McGee, 1997).
Air route traffic control centres use radar surveillance to issue speed, altitude and directional
instructions to pilots in order to keep aircraft properly separated. These are referred to as
clearance issues throughout the research. A complete clearance issue includes complete

speed, altitude and directional information. An incomplete clearance lacks one of these
dimensions. In addition to their responsibilities for en route aircraft, they also provide
approach control services to aircraft operating within their assigned area (U.S. Office of
Personnel Management, 1978). ATC terminal staff depend on radar was well as a visual
view of the runways (referred to in the research as radar and visual monitoring) in order to
issue control instructions that provide separations. This assures the orderly movement of
aircraft that are departing, landing and approaching for landing. This is done through the
conveyance of essential traffic information to pilots regarding clearances and other crucial
procedural instructions (U.S. Office of Personnel Management, 1978).
Figure 1. The different areas of control. Air Traffic Navigation Systems, 2011.
In order to maintain certain separations between aircraft, controllers have to be apt at
interacting with pilots, controllers and a wide range of stimuli as well as making decisions
based on this range of input. Following this, it is apparent that the controller must be able to
execute multiple cognitive functions simultaneously (Moon et al., 2011). Depending on the
station controllers assume during their shift, they will deal with a wide variation of stimuli
and objectives.
Station standing instructions (SSIs) convey a multitude of regulations and procedures that
must be adhered to at all times. Included in the SSI’s are the duty priorities of an ATCO and

the correct phraseology to be used, among other aspects. The Duty Priority states that the
ATCO is to “give first priority to separating aircraft and issuing safety warnings... good
judgment shall be used in prioritizing all other provisions of service, based on the
requirements of the situation at hand, within prescribed regulations and documentation”
(SSI’s ,Part 4 A General Operating procedure, section 4.7.1). This provides the scope and
primary purpose of ATC.
There are a number of different control areas that controllers may assume during a shift.
Controllers in different control facilities rely on different types of stimuli to perform their
tasks. For example, controllers in the tower depend on a direct visual of the airport whilst
controllers in TRACON (Terminal Radar approach control) and en-route environments
depend on computer-based, partially automated radar displays (Wickens et al., 1997). This
demonstrates the range of cognitive tasks required by controllers in order to complete
different tasks successfully. The variety of visual stimuli presented by differing
technological displays is coupled with the dynamic nature of the constantly changing images
which change according to priorities. During standard operations, controllers must take
various contextual complexities into account in order to manage traffic successfully
(International Civil Aviation Organization, 2005). Complexities may include dealing with
adverse meteorological conditions, congested airspace and malfunctions, all of which are
considered in this research. This calls for a number of different types of cognitive functions
such as attention and information processing in order to successfully perform the task. This
also calls for a high level of situational awareness in order to maintain an awareness of the
aircraft in the control area as well as project and predict the aircrafts’ paths in reality based on
a two-dimensional monitor. Air traffic control is a highly complex task that requires high
levels of information processing by controllers in order to cope with the mental work load as
well as the tasks’ complexity.
Complexity may be increased when the common practice of combining sectors is
implemented. It is stated that the combining of positions shall only be done under low traffic
volumes (CAA Standards & Procedures Manual, 2013). The decision to combine sectors lies
with ATC Planners on position and relies solely on good judgement as no accurate prediction
tool exists with the capacity to predict traffic demands beyond 30 minutes (CAA Standards
& Procedures Manual, 2013). The SSIs do not specify exact levels to guide ATCO’s
decisions regarding sector combinations. Controllers are cautioned against combining
positions prematurely as this may result in overload of sectors.
Previous research has found that controllers report and prioritise key goals in the following
order; avoiding violation of minimum separation standards, avoiding deviations from
standard operating procedures, avoiding any disorder that may result in overload and lastly,
making unnecessary requests to the pilot (Seamster, Redding, Cannon, Ryder, & Purcell,
1993). These goals are focused on preventing safety events and are discussed in more detail
in the next section.
2.2. Safety Events
It can often be difficult to identify the scope or extent of a safety occurrence as it can be
difficult to establish when an occurrence really began (Eurocontrol, 2003). There are two
principal safety events that can occur through erroneous Air Traffic Controlling, namely; loss
of separation (LoS) and runway incursions (RI). This section explicates these primary safety
events, providing a brief description of the safety standards and what is considered an
infringement of those standards.
Runway incursions. A runway incursion is defined as “any occurrence at an
aerodrome involving the incorrect presences of an aircraft, vehicle or person on the protected
area of a surface designated for the landing and takeoff of aircraft” (International Civil
Aviation Organization, 2007). The South African Civil Aviation Authority (SACAA)
Standards and Procedure Manual states that aerodrome control is responsible for issuing
information and instructions in order to prevent collisions between aircraft flying in, taking
off, landing and aircraft in the vicinity of the aerodrome traffic zone. The aerodrome is also
responsible for aircraft and vehicles, obstructions and other aircraft on the manoeuvring area
(CAA Standards & Procedures Manual, 2013). Aerodrome controllers are required to
maintain a constant visual watch over the area the aerodrome is responsible for in order to
ensure that it remains free of obstructions, vehicles and other obstructions when needed for
aircraft movements (CAA Standards & Procedures Manual, 2013).
If any vehicles are operating on a runway (including runway inspections or maintenance), the
runway is to be kept sterile. This means that while these operations are in progress, no aircraft
are to be allowed to line-up on the runway. This procedure does not apply to normal
vehicular crossings but only to vehicles that will be on the runway for an extended time. For
example, there are 3 daily runway inspections at O.R Tambo at dawn, dusk, and late night.

For the main inspections (dawn and dusk) the Inspection Team consists of a vehicle from Fire
and Rescue Services, Aviation Safety and Airside Operations (CAA Standards & Procedures
Manual, 2013). The runway must be kept sterile from any aircraft for the duration of these
three daily inspections.
When permission has been given to cross or enter a runway, the controller must make use of
a strip on the Flight Progress board (FPB) so as to serve as a memory cue. Flight Progress
Strips (FPS) are displayed on the flight progress board so as to provide the maximum visual
presentation of the traffic situation and possible traffic conflicts (CAA Standards &
Procedures Manual, 2013). FPS are only to be removed from the progress board after
transfer of the aircraft to another Air Traffic Service Unit or controlling sector. In addition to
this, the Advanced Surface Movement Guidance and control system (A-SMGCS) displays
information and is used to assist ATC in ensuring that runways are sterile before issuing
landing or takeoff clearance.
Loss of Separation. A Loss of separations (LoS) involves an infringement of both
horizontal and vertical separation minima in controlled airspace (International Civil Aviation
Organization, 2013). The SACAA Standards and Procedure Manual contains the regulations
regarding minima for horizontal separation and sets the minimum separation at 5 Nautical
Miles (Nm).Vertical separation is infringed upon when the vertical distance between aircraft
falls less than the prescribed minima. The SACAA Standards & Procedure Manual specifies
the standards and regulations regarding vertical separation (CAA Standards & Procedures
Manual, 2013). The vertical separation minima are 1,000 ft up to Flight Level (FL) 290
between all aircraft and 2,000 ft between all aircraft above FL410. A LoS is an event in
which either horizontal or vertical separation minima are infringed upon.
Safety Standards and Ratings. There are a number of procedures that are considered
compulsory for controllers. These procedures include the practice of read-back, issuing
traffic information and using radio telephony (R/T) phraseology. Read-back is defined as a
procedure whereby the receiving station repeats a received message or an appropriate part
thereof back to the transmitting station so as to obtain confirmation of correct reception
(ICAO Annex). Traffic information is issued in a strict format that must be followed and
forwarded to aircraft in the airspace and R/T phraseology sets out the phrasing of
communications to be used when controlling.

Safety events are scored according to severity and frequency. There are a number of different
systems used to calculate the severity. In South Africa, the primary rating systems are the
Runtime Analysis Tool (RAT), the Safety Significant Event scheme (SSE) and the Runway
Incursion Severity Calculator (RISC).
Figure 2. Safety event scoring system. Received from ANSP, 2013.
A safety event classified as an ‘A’ is considered a serious incident in which a collision is
narrowly avoided, a ‘B’ class event an incident in which separation decreases and there is
significant potential for collision, a ‘C’ classification as an incident characterized by ample
time and/or distance to avoid a collision, a ‘D’ class event as an incident that meets the
definition of runway incursion such as the incorrect presence of a vehicle, person or aircraft
on the area of a surface designated for the landing and take-off of aircraft but with no
immediate safety consequences and lastly an ‘E’ classification as an event with insufficient
information, inconclusive or conflicting evidence (figure 2). The events are then rated 1 to 5,
depending on the frequency with which the events occur (from extremely rare to very
frequent). Following this, the most severe safety event is rated A1 and the least severe as E5.

2.3. Human Error
It has been estimated that between 60 and 90 percent of major incidents in complex systems
such as aviation are caused by human error (Rouse & Rouse, 1983, as cited in Wickens &
Hollands, 2000). Human errors are generically defined as “all those occasions in which a
planned sequence of mental or physical activities fail to achieve its intended outcome, and
when these failures cannot be attributed to the intervention of some chance agency” (Salmon,
et al., 2011, p. 9).
This research adopted an information processing approach to categorizing human error. In
particular, it was guided by the scheme developed by Norman (1981, 1988) and Reason
(1984, 1990 & 1997) (figure 3). The scheme follows the general format that a human
operator is met by stimuli from the environment and has the potential to interpret the
information correctly or incorrectly. Given that interpretation, the human operator may or
may not have the intention to carry out the right action in response to the stimuli and finally
may or may not execute the intended action correctly (Wickens & Hollands, 2000).
There are three distinct types of errors; slips, lapses and mistakes. Slips and lapses are “errors
which result from some failure in the execution and or storage of an action sequence,
regardless of whether or not the plan which guided them was adequate to achieve its
objective” (Salmon et al., 2011, p. 9). Mistakes are “failures in judgemental and/or
inferential processes involved in the selection of an objective or in the specification of the
means to achieve it, irrespective of whether or not the actions directed by this decision
scheme run according to plan” (Salmon et al., 2011, p. 9). As seen from figure 3, mistakes
are errors in interpretation or in choice of intentions. Slips occur when the right interpretation
occurs in conjunction with the correct intention formulation but the wrong action is generated
(Wickens & Hollands, 2000).

Figure 3. Information Processing Context for representing human error. Taken from Wickens
& Hollands, 2000, p.494.
Following the working definitions, human operating errors can occur in two ways; through an
action that goes according to plan when the plan was inadequate or when the action is
deficient despite a satisfactory plan (Reason, 1990). In summary, Reason (1990) argues for
three primary classification types of errors; skill-based slips, rule-based mistakes and
knowledge-based mistakes. Execution failures correspond to skill based levels of
performance and planning failures with rule and knowledge-based levels (Reason, 1990).
Planning failures are classified as mistakes and execution failures as slips or lapses
(Rasmussen, 1986). Figure 2 shows a summary of these errors adapted from Rasmussen.
Figure 4. Execution and planning failures. Adapted from “Rasmussen (1986)” by Skybrary,
2013.
Planning failures
Rule-based
mistakes
Knowledge-
based mistakes
Execution failures
Slips Lapses
Stimulus
Evidence
Slips
Memory
Lapses & Mode errors
Mistake
s Knowledge Rule
Interpretation
Situation
Assessment
Plan
Intention of Action
Action Execution

Errors are defined in ATC as “actions or inactions by the air traffic controller that lead to
deviations from organizational or air traffic controller intentions or expectations”
(International Civil Aviation Organization, 2005, p. 5). Examples of errors include not
detecting a read-back error by a pilot and clearing an aircraft to use a runway that is occupied.
This research took these errors and classified them into a type of error. For example, a
controller that failed to detect an error in read-back has displayed an error in situation
assessment which is indicative of a knowledge based error.
2.4. Factors Underlying Air Traffic Control
A large number of cognitive skills are required by controllers including; perception, attention,
memory, information processing, decision making and attention (Eurocontrol, 1996). These
cognitive skills need to be readily available to controllers and are often used concurrently. In
addition, they are likely to interact with other factors relating to shifts and demographic
variables in influencing the occurrence of safety events. Cognitive task analyses analysed
knowledge structures, mental models, skills and strategies of en route Controllers and found
that primary tasks reported by Controllers were primarily behavioural but included
maintaining situation awareness (Seamster, Redding, Cannon, Ryder, & Purcell, 1993).
This section reviews the factors and theoretical constructs that contribute to controller
performance. The theoretical constructs were identified mainly through a literature review.
However, when analysing the safety report data, several additional factors (namely, shift
variables, external factors and risk factors) were identified that and these were then included
in the review below. Thus an iterative process was used to identify the relevant factors.
Working definitions are given for each concept, links are made to ATC and a brief motivation
is given for their inclusion in the study.
2.4.1. Shift variables (Covariate 1). Shift variables include time since start of shift
(in minutes), time since position takeover (in minutes), time since last break (in minutes),
hours since last sign off and days since last day off. As previously stated, there are a number
of different control areas that controllers may assume during a shift. Time since start of shift
indicates the time since the controller commenced that particular shift, whilst time since
position takeover indicates the time since the controller has assumed a position. For example,
a controller may work an hour on the aerodrome position, have an hour break and takeover a

position on ground controls on which a safety event occurs thirty minutes later. In this case,
the time since start would be noted as two and a half hours whereas time since position
takeover would be noted as thirty minutes.
ANSP have stated that most events occur within the first 30 minutes of a shift, or the first 30
minutes after returning from a break or assuming a new position. Roster designs are not
standardised at the moment and are dependent on the airport. ANSP is in the process of
standardising rosters. Regardless of the unstandardised times, all rosters follow the guideline
that controllers cannot work more than eight consecutive days without a day off, with shifts
of 7 hours long. The duration of breaks differs from 30 minutes to 2 hours depending on the
situation.
2.4.2. Demographic Factors (Covariate 2). Demographic factors refer to factors
relating the structure of populations and often include age, gender and language knowledge
(Stangor, 2011). Demographic variables differ with each individual and could potentially
impact a controller’s performance. The demographic factors taken into account in this study
were limited by the information provided in the reports and included age, gender and
language proficiency. The International Civil Aviation Organisation (ICAO) grades English
language proficiency on a scale from to 1 (lowest) to 6 (highest). In order to conform to
ICAO Language Proficiency requirements, pilots, controllers and all others who use English
in Radio Telephony (R/T) communication must be at ICAO English Language Level 4
(Operational) or above. Level five designates ‘extended’ and six, ‘expert’.
2.4.3. Human Factors (Covariate 3). The study of human factors is defined as “the
scientific discipline concerned with the understanding of the interactions among humans and
other elements of a system” (International Ergonomics Association, 2014). Effective human
performance is fundamental to ensuring operational safety in aviation. The human factors that
are brought to ATC can lead to unintended errors of task management and professional
judgement (Skybrary, 2013). The human factors considered in this research were workload,
memory, mental models, attention, task engagement, situation awareness, information
processing, decision-making and human-machine interface.

Workload. Rapid advancements in technology have resulted in complex work systems
in which operators must adapt their performance to suit dynamic environments, concurrent
task demands, time pressure and tactical constraints (Sheridan, 2002). Consideration must be
taken for the workload placed on the operation of these complex systems (Loft, Sanderson,
Neal, & Mooij, 2007). Workload refers to the capacity to process information in a task
situation, with processing capacity dependent on the availability of processing modules,
attentional resources and the state of the organism (Gaillard, 1993). Workload is a function of
the task demands placed on an operator and the capacity of the operator to meet those
demands (Hopkin, 1995 as cited in Loft, Sanderson, Neal, & Mooij, 2007). Workload covers
a broad spectrum of human activity but this research limited its scope to include only ‘mental
workload’ which limits the research to mental capacities (the capacity of the operator to meet
task demands) and physical co-ordination (task demands) (Hancock & Meshkati, 1988).
Increases in air traffic density and complexity have substantially increased the demands on
controller’s mental workload (Wickens et al., 1997). It has been posited that high workloads
can lower performance (Wickens et al., 1997) and that workload is influenced by traffic
volume and complexity (Moon et al., 2011). This would suggest that increases in workload
increase the probability of errors. Increase in traffic volume is a form of job stressor in the
work environment. Endsley and Rodgers (1998) found that controllers were significantly less
likely to make mistakes with lower levels of subjective workload than high levels.
Environmental stressors impact on a controller’s workload as traffic volume and complexity
(external stressors) increase controller workload. Research shows that an individual’s
performance decreases when workload increases (Wickens, Gordon, & Liu, 1998). This study
considered both the environmental stressors and the subjective view of the mental workload
at the time of the event. The subjective view of mental workload was provided by controllers
in the safety event reports immediately after the event, on a scale of 1 to 5. One denoted low,
two; medium-low, three; medium, four; medium high and five; high mental workload. The
subjective rating was taken for both traffic load and complexity separately, both impacting on
controller workload. The environmental stressors considered in the research were the traffic
load in the form of number of aircraft on frequency at the time of the event and aircraft
movement in the hour leading up to the event. Environmental stressors also included
investigator analysis of the traffic as being complex or not.

A number of airports in South Africa were included in the investigation reports, each with
varying traffic volumes and staff necessary to deal with the different traffic volumes. For
example, for the financial year 2011/2012, one of the international airports clocked 62000
international movements and 110 000 domestic movements. For the same period another
international airport registered 1400 international flights and 55 000 domestic flights
(Airports Company South Africa, 2013). The traffic volumes for the two airports differ
significantly and these traffic volumes will ultimately affect the workload. It has been
suggested by investigating officers that the qualities of ATC services deteriorate when traffic
loading increases above quiet. Due to the nature of the medium with which controllers
interact (i.e. via radio), it is difficult to predict exact traffic loading before hand and must be
established through snapshot values of the amount of aircraft on radio frequency at a point in
time. It is thus difficult to predict exactly when traffic volumes will increase above quiet.
Mental Models. Mental models are the “mechanisms whereby humans are able to
generate descriptions of system purpose and form, explanations of system functioning and
observed system states and predictions about future system states” (Rouse & Morris, 1986, as
cited by Zang, Kaber & Hsiang, 2009, p.2). This is a crucial aspect of ATC as it represents a
controller’s knowledge of flight locations, conditions and intentions of aircraft in his or her
designated area. Following from this, mental models adjusted to be more situation-specific
are known as mental/traffic pictures (Eurocontrol, 1996). Mental or traffic pictures are the
“actual mental picture of a situation represent[ing] a moment to moment snapshot of the
actual situation based on the mental model and the actually perceived external cues. A series
of mental pictures represents the actual mental model including the actual parameterization”
(Eurocontrol, 1996, p. 10). The mental picture represents the mental picture of the traffic
situation and the necessary actions a controller has taken and should take. Mental imagery
plays a significant role in air traffic control and has been equated to concepts of situational
awareness and mental models (Shorrock & Isaac, 2010).
Shared mental models occur when the members of a team organise their knowledge of team
tasks, equipment, roles and goals in a similar fashion (Lim & Klein, 2006). Team mental
models allow team members to coordinate their behaviours, especially when both time and
circumstance prevent lengthy communication and strategising among team members (Lim &
Klein, 2006). Under these restricted circumstances, team members must rely on pre-existing
knowledge to predict the actions of teammates in order to respond in a coordinated manner to

urgent, high staked task demands (Lim & Klein, 2006). ATC work primarily on their own but
they must be able to co-ordinate with other controllers as well as pilots. A certain degree of
shared mental models is required between controllers and pilots in order to be able to co-
ordinate and anticipate actions.
Information Processing. A number of vulnerabilities inherent in human information
processing have been found in ATC (Wickens, Mavor, & McGee, 1997). Information
processing assumes that human beings receive information from the environment, act
cognitively on that information in a number of ways and emit some response back to the
environment (Wickens, Gordon, & Liu, 1998). This complements the model used to classify
human error as there is a stimulus (the environment), some assessment of that stimulus and a
reaction.
Information is received through various cell receptors for the senses, namely; sight, hearing,
smell, taste and feeling. This implies that information can have any form; visual, sensual or
auditory (Sinanovic & Johnson, 2007). The most crucial forms of information to ATC are
visual and auditory information. Information processing (figure 5) is dependent on a number
of faculties including perception, working memory, sensory memory and attentional
resources (Wickens, Gordon, & Liu, 1998). Sensory memory holds detailed memory for a
short period of time (for example visual sensory memory is held for approximately two to
three seconds). Perception adds meaning to the information by comparing it with other
information stored in long term memory (Wickens, Gordon, & Liu, 1998). Once the meaning
has been assigned to the information, it is either reacted to or transferred to working memory.
Working memory refers to both the short term memory for what is currently being processed
and a form of conscious in which human beings compare and evaluate cognitive
representations (Wickens, Gordon, & Liu, 1998). The greater task uncertainty, the greater the
amount of information that must be processed during task execution in order to achieve a
certain level of performance (Galbraith, 1984)
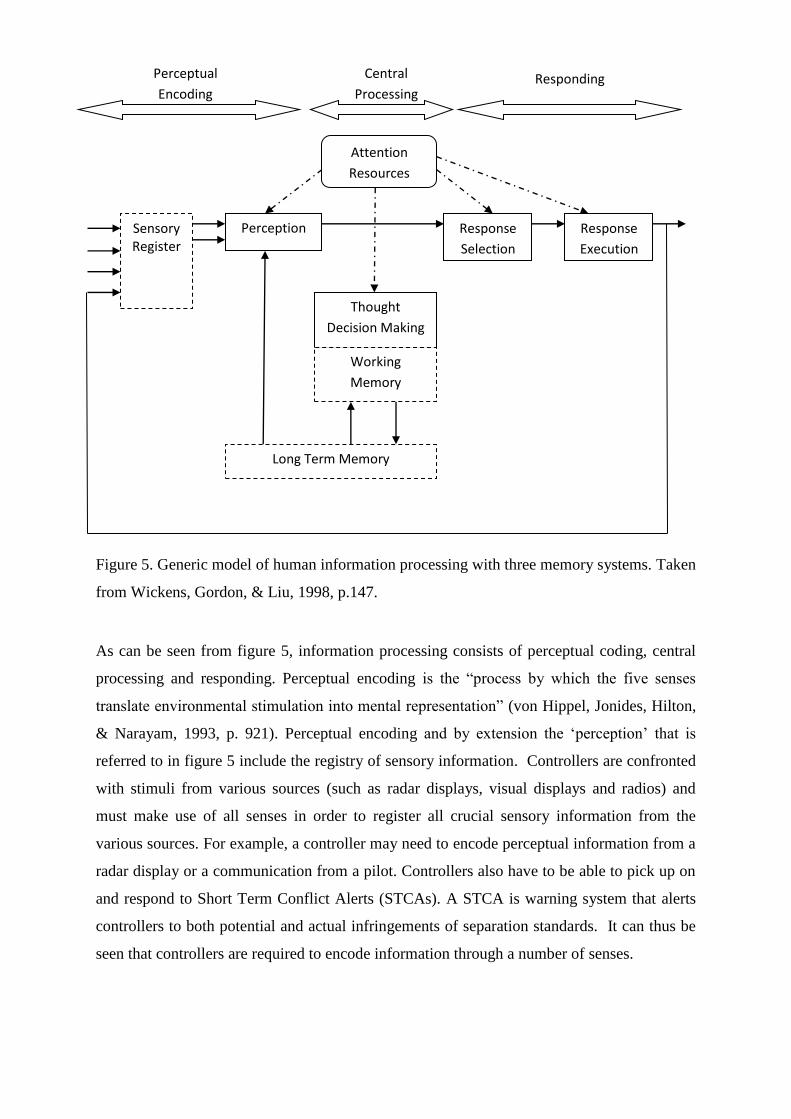
Figure 5. Generic model of human information processing with three memory systems. Taken
from Wickens, Gordon, & Liu, 1998, p.147.
As can be seen from figure 5, information processing consists of perceptual coding, central
processing and responding. Perceptual encoding is the “process by which the five senses
translate environmental stimulation into mental representation” (von Hippel, Jonides, Hilton,
& Narayam, 1993, p. 921). Perceptual encoding and by extension the ‘perception’ that is
referred to in figure 5 include the registry of sensory information. Controllers are confronted
with stimuli from various sources (such as radar displays, visual displays and radios) and
must make use of all senses in order to register all crucial sensory information from the
various sources. For example, a controller may need to encode perceptual information from a
radar display or a communication from a pilot. Controllers also have to be able to pick up on
and respond to Short Term Conflict Alerts (STCAs). A STCA is warning system that alerts
controllers to both potential and actual infringements of separation standards. It can thus be
seen that controllers are required to encode information through a number of senses.
Perceptual
Encoding
Central
Processing Responding
Attention
Resources
Thought
Decision Making
Working
Memory
Long Term Memory
Sensory Register
Perception Response
Selection
Response
Execution

Central processing incorporates actions that draw on attentional resources such as decision
making and working memory. Responding requires both response selection and response
execution. These constitute the information processing procedure of human beings. Research
has found weaknesses in controller information processing with relation to detecting subtle or
infrequent events, predicting events in three-dimensional space and in temporarily storing and
communicating information (Wickens, Mavor, & McGee, 1997). Detecting infrequent events
would show errors in sensory registration, problems of prediction would show errors in
central processing whilst problems with storing information shows problems with working
memory (central processing) and problems with communicating information shows errors in
response execution. The errors in information processing that emerge through this research
will be equated to errors in the relevant stages of information processing; perceptual
encoding, central processing and responding. In this way, the research will be able to state in
which stages errors in information processing occur.
It has been posited that schemata play a vital role in information processing in that they shape
what we see and hear as well as how we store information and access that information at a
later stage (von Hippel, Jonides, Hilton, & Narayam, 1993). A schema is a “plan,diagram or
outline , especially a mental representation of some aspect of experience , based on prior
experience and memory, structures in such a way as to facilitate (and sometimes distort)
perception, cognition, the drawing of inferences, or the interpretation of new information in
terms of existing knowledge” (Colman, 2006, p. 672). Schematic processing could possibly
inhibit perceptual encoding in that schema guide interpretation and selective attention. This is
supported by the model used in this study as attention resources guide perception (figure 5)
which is in turn guided by schema. Schemata facilitate the interpretation of incoming
information by allowing the perceiver to rely on prior conceptualizations in order to
understand specific instances and current circumstances (von Hippel, Jonides, Hilton, &
Narayam, 1993). In this way, perceivers with adequate schema do not need to pay much
attention to either relevant or irrelevant information as they can rely on previously stored
information and expectancies. An individual that lacks adequate schema must rely on an
effortful integration of information (von Hippel, Jonides, Hilton, & Narayam, 1993).
By facilitating selective attention, schemata essentially enable perceivers to devote attentional
resources to relevant information whilst ignoring irrelevant information (von Hippel, Jonides,
Hilton, & Narayam, 1993). Following figure 5, the attention resources facilitate perception

which leads into response selection. A breakdown in percetion would lead to erroneous
responses.
Memory. Memory is a critical factor in establishing effective mental pictures and
situation awareness in controllers (Shorrock, 2005). Memory is a cognitive function that is
fundamental to most of a controller’s tasks and is a common thread in most variables.
Shorrock (2005) found that 38% of memory errors in ATC involved a failure to complete an
intended action and states that controllers rely primarily on working memory and long-term
memory. Working memory is a “temporary store for recently activated items of information
that are currently occupying consciousness and can be manipulated and moved in and out of
short-term memory” (Colman A. M., 2006). Working memory is used to encode, store and
retrieve information regarding aircraft and the environment (Shorrock, 2005) but its capacity
constrains cognitive abilities in numerous domains (Bradley & Tenenbaum, 2013).
Information is constantly displayed for the controller to visually scan for changes, but the
controller is required to keep information such as aircraft frequency, callsigns, route, flight
level, aircraft type and location in his/her working memory (Shorrock, 2005).
Figure 6. A representation of memory functions. Taken from Wickens & Hollands, 2000,
p.242.
Retrieval
Storage
Working Memory
Verbal
Spatial
Encoding
Learning and
Training Long-term Memory
Procedural,
declarative
organisation, mental
models

Long term memory is defined as, “a type of memory containing information that is stored for
periods ranging from 30 seconds to many decades, often differentiated into episodic memory
for events and experiences and semantic memory for information about the world” (Colman,
2006, p. 429). Long term memory has no known capacity, is fairly permanent, and supports
information retrieval with little conscious effort whilst working memory retrieval requires conscious
effort.
The model of memory functions (figure6) shows encoding in the first stage which involves
the acquisition of information into the memory system and can take place by encoding
information into working memory or transferring information from working memory to long-
term memory. Learning or training requires the latter encoding (Wickens & Hollands, 2000).
The second stage (referred to as storage) is the way in which information is held (or
represented) in the two memory systems (Wickens & Hollands, 2000). Retrieval, the third
stage, refers to one’s ability to access the information in the memory systems. If material
cannot be retrieved, it is known as forgetting.
When accessing declarative memory, an individual is conscious of doing so (Goldstein,
2008). Declarative memory regards the accumulation of fact and data derived from learning
experiences (Cohen & Poldrack, 1997). In other terms, it represents the outcomes of a
number of processes which identify, appreciate and accrue the appropriate response to objects
and persons encountered. Any complex event will entail information about visual objects,
sounds, odours and so forth (Cohen & Poldrack, 1997). For example, controlling entails
information from radar displays (visual) and information from radio telephony
communications (auditory). Declarative memory is the system which chunks the information
from the various information sources and binds them together to present the individual with a
coherent representation of the event (Cohen & Poldrack, 1997). Declarative memory is a
form of explicit memory for facts and events and is used to consciously remember facts,
knowledge and events (Osipova et al., 2006). Procedural memory is a type of implicit
memory which occurs when previous experience improves performance on a task even
though one may not consciously remember the event (Goldstein, 2008). Procedural memory
thus enables an individual to retain learned connections between stimuli and response
(Tulving, 1987).
Decision-making. Aviation is a complex, safety-critical enterprise where decisions
can affect the lives of hundreds of people as well as have vast economic consequences

(Eurocontrol, 2009). From an information processing perspective, decision making
represents a mapping of copious information received to one or few responses (Wickens &
Hollands, 2000). Decision making can be defined as a task in which (a) an individual must
select one choice from a number of choices, (b) there is information available with respect to
the decisions, (c) the time frame is longer than a second and (d) the choice is associated with
uncertainty (Wickens, Gordon, & Liu, 1998). There are thus a number of factors that
influence decision making, including the degree of uncertainty regarding the consequences of
decisions, familiarity and expertise regarding the circumstances in which decisions need to be
made as well as the time required for the decision process (Wickens & Hollands, 2000).
According to an information processing approach to decision making, there are critical
components of decision making; selective attention, working memory and long term memory.
Decision making involves cue reception and integration, hypothesis generation, hypothesis
evaluation and selection, and the selection and generation of actions (Wickens & Hollands,
2000). This follows the general layout of both the human error and information processing
approaches adopted by this research which involve to some degree the stimulus, an
assessment of the stimulus and action formation. There are a number of cognitive limitations
to factor into decision making. These include the amount or quality of the information cue,
the amount of time allocated for each decision making activity, the attentional resources
allocated to the activity, the amount or quality of the individual’s knowledge of the situation,
an individual’s ability to retrieve relevant information or hypotheses and lastly an
individual’s working memory capacities (Reason, 1990).
Aeronautical decision making is carried out in dynamic and complex environments
characterized by ill-structured problems, copious amounts of information, uncertainty,
competing goals, time constraints, high levels of risk and collaboration or task sharing among
multiple individuals (Zsambok & Klein, 1997). Eurocontrol (2009) suggest a model of
decision making that incorporates situation awareness and goals. In the model, the goal
informs the planned action. The planned action incorporates the perception, understanding
and forethought. This in turn informs the anticipated result which leads into an action
(decision) and subsequent result. This result feeds back into the goal and forms the decision-
making loop (Eurocontrol, 2009).

Figure 7. Decision making and situation awareness. Taken from Eurocontrol, 2009.
Attention. Attention is broadly defined as “sustained concentration on a specific
stimulus, sensation, idea, thought or activity enabling one to use information processing
systems with limited capacity to handle vast amounts of information available from the sense
organs and memory stores” (Colman A. M., 2006). Attention can be subdivided into four
primary groups; selective, focused, sustained and divided. Sustained attention refers to the
ability to sustain attention over long periods of time (Demeter, Hernandez-Garcia, Sarter, &
Lustig, 2011). At any given time there is a large amount of information sent to our brains
through our senses. In order to be effective our actions must be directed to one object or
location at a time (Chica, Bartolomeo, & Luianez, 2012). A selective mechanism is thus
neccessary in order to select relevant information so that only these bits of information are
processed deeply. It is posited that attended objects are processed to high levels leading to
conscious awareness and voluntary reactions to them (Chica, Bartolomeo, & Luianez, 2012).
Focused attention is the ability to attend only to relevant stimuli and ignore distracting ones
(Nebel, et al., 2005). Divided attention occurs when we distribute our attention to two or
more tasks. The ability to divide attention depends on a number of factors including practice
and difficulty of the task (Goldstein, 2008). Although divided attention distributes mental
resources, they are limited (Nebel, et al., 2005). Both focused and divided attention are
Think ahead
Understand
Perceive
Feedback
Goal Action Result
Planned
Action
Anticipated
result
Situation
Awareness

aspects of selectivity. Controllers must be able to divide their attention without limiting their
cognitive resources so that they are able to respond to all stimuli regarding ATC. It is crucial
for controllers to be able to use aspects of selectivity in complex situations when there are
conflicts and numerous sources of informaton. Sustained attention is also important as a
controller needs to stay constantly vigilant during their shift so as not to miss any cues.
Sustained attention is similar to vigilance, and some researchers use the terms
interchangeably. Vigilance has been defined as occuring when “attention must be focused on
a source in order to detect a critical but infrequent event” (Gale & Christie, 1987, as cited by
Donald, 2011) and refers to the “ability of organisms to maintain their focus of attention and
to remain alert to stimuli over prolonged periods of time” (Warm, Parasuraman, & Matthews,
2008, p. 433). This form of attention that detects infrequent events is known as vigilance.
Donald (2008) posits that definitions of vigilance overlook the complexities related to the
significant events and defines vigilance as, “a capacity for sustained effective attention when
monitoring a situation or display for critical signals, conditions or events to which the
observer must respond” (Donald, 2008, p. 36). This definition is more apt for ATC as
controllers encounter frequent significant events as opposed to infrequent. Their sustained
attention is required to monitor all events both frequent and infrequent.
Coupled with these frequent events, controllers must also anticipate paths or events that may
occur (i.e. are not currently occuring) and patterns that may materialise into a critical event.
This shows how complex the nature of a controller’s job is and the level of vigilance required
is above and beyond merely detecting critical infrequent events. The definition posited by
Donald (2008) incorporates cognitive processes such as the ability to identify, recognise and
interpret the information presented. This definition incorporates the complex cogntive tasks
required by controllers in order to remain fully vigilant. The vigilance decrement is a
decrease in performance over time resulting in decreases in efficiencies through slower
detection times (Lanzetta, Dember, Warm, & Berch, 1987). Sawin and Scerbo (1995) posit
that a decrease in performance most commonly occurs after the first 20 to 35 minutes. ANSP
have posited that most safety events occur within the first 20 to 35 minutes of a shift, if this is
found to be true then this may be attributed to a decrease in detection performance or a
vigilance decrement.
Studies have more recently come to focus less on influencing factors on vigilance decrements
but on the role of attention resources in the vigilance decrement (Warm et al., 2008).

Traditionally, vigilience decrements were found to be caused by declines in arousal, more
recently, evidence has shown that vigilance tasks impose substantial demands on the
information processing resources of the observer (Warm et al., 2008). This approach to
vigilance decrement postulate that the workload placed on operators performaing vigilance
intensive tasks drain information processing resources, leading to lowered vigilance states. If
safety events occur mostly within the first thirty minutes of the shift, this is likely not due to a
vigilance decrement as the decrement decreases performance over time and by extension,
safety events would occur further in to shifts than only within the first thirty minutes. These
notions of performance and vigilance consider constructs such as task engagement and
mental alertness.
Task engagement and mental alertness. Task disengagement has been studied under
a number of varying rubrics including absent-mindedness, mind wandering, stimulus-
independent thought and task unrelated thought (Cheyne, Solman, Carriere, & Smilek, 2009).
Regardless of its label, general consensus is that task disengagement “consists of a state of
reduced allocation of attention resources to environmental task-related stimuli” (Cheyne et
al., 2009, p.93). Mind wandering occurs frequently and individuals are often caught thinking
spontaneously about personal priorities, memories and other thoughts that are unrelated to the
task at hand (Levinson, Smallwood, & Davidson, 2012). It has been found that when
deprived of a task or involved in a task with insignificant demands on working memory,
individuals devote their spare resources to personal musings (and task unrelated thought).
There are two primary differences in attention lapses. The first difference concerns task
unrelated thoughts which translate to absent mindedness and disengagement. The second
involves and pre-occupation with performance on a task that deploys attention in response to
an environmental demand that exceeds one’s capabilities (Smallwood, et al., 2004). This is
relevant to controllers, whose attention is drawn to another stimulus or problem, disengaging
them from their primary task. If a controller is inadequately trained or is new to the job,
his/her attention resources are likely to be depleted more quickly. Alternatively, beliefs that
the expectations of the task exceed his/her capabilities could result in thoughts about the risks
of making incorrect decisions and concerns about performance, resulting in task
disengagement.

Studies have found that a variety of external factors influence disengagement. Disengagement
has been found to be high when the rate of stimulus presentation is slow, frequency of targets
is low or task duration is long (Smallwood, et al., 2004). With regard to the safety event
reports used in the current research, certain information was available which indicated
conditions that could have been related to task disengagement. The reports did not directly
measure disengagement but rather provided detail regarding the conditions surrounding the
safety event which research has demonstrated to be related to disengagement. The presence
of these conditions does not necessarily mean that disengagement occurred but rather taken to
be indicative of possible disengagement. Indications of disengagement that were included in
the analysis were decline in traffic load (slow rate of stimuli), inadequate break allocation
(long task duration) and distraction (reduced allocation of attentional resources). The reports
explicitly stated distractions such as subject-unrelated conversation. The decline in traffic
load and break allocations are not direct indicators of disengagement but were taken to be
indicative of possible disengagement. Task disengagement is also promoted through
protracted, unvarying, familiar and repetitive tasks (Cheyne et al., 2009). It is possible that
disengagement may be more applicable to certain airports that experience low traffic loads or
alternatively at times in which there is little traffic loading.
Figure 8. The inverted U-curve. Taken from Gilliard, 1993, p.994.

Cognitive processes transform sensory information into behaviour using logical operations.
Energetical processes regulate the state of the organism and indirectly influence the
processing of information (Gaillard, 1993). Every activity has an optimum activation level at
which a task is best performed. The inverted U-curve (figure 8) shows the relationship
between energetical levels (activation) and the efficiency with which tasks are performed.
Performance efficiency on a task is low when the activation (energetical) level is either too
high or too low (Gaillard, 1993). It can thus be seen that if activation levels are low (through
slow frequency of targets, long task duration and boredom), optimal performance on tasks is
not achieved.
Situation Awareness (SA). Situation awareness is an understanding of the state of the
environment (including relevant parameters of the system). SA constitutes the primary basis
for subsequent decision making and by extension, performance in the operation of complex,
dynamic systems (Wickens & Hollands, 2000). SA is formally defined as a “person’s
perception of the elements of the environment within a volume of time and space” (Endsley,
1995, p. 65). Durso et al. (1999) apply SA to aviation and posit that it is the “continuous
extraction of environmental information, integration of this information with previous
knowledge to form a coherent mental picture, and the use of that picture in directing further
perception and anticipating future events” (p.284). Expanding SA to an operator’s
understanding of a complex system extends SA research into dynamically changing
environments where operators are responsible for achieving certain states (Durso, et al.,
1999). Controllers must continuously be aware of the location of each aircraft in his/her
sector, the aircraft parameters (such as speed and heading) and their projected future locations
(Endsley & Rodgers, 1998). In highly complex situations, there is an increase in the cognitive
nature of the task, highlighting the pertinent role of SA in order to understand the state of the
environment (Durso, et al., 1999).
There are different levels of SA that must be applied to the situation that allows one to
ascertain the degree to which an individual is situationally aware. At the lowest level (level
1) the operator needs to perceive relevant information (in the environment, system, self, et
cetera.). Level 2 comprises that initial perception plus the integration of that data in
conjunction with task goals. Lastly, the highest level (level 3) requires the prediction of
future events and system states based on the understanding gained at level 2 and subsequently
allows for effective decision making (Endsley, 1995). For example, a controller perceives

two aircraft whose future paths display a loss of horizontal separation (level 1), realises that
task goals are to maintain a safe separation distance (level 2) and predicting that maintaining
original flight paths would deviate from this distance, changes flight paths so as to maintain
separation. It is clear from this example that errors may occur at varying levels of SA. It is
thus important to identify at which levels of SA the errors are predominantly occurring.
Endsley identifies certain internal and external factors that will affect SA. External factors
include the workload, stress, interface design, task complexity and automation (Endsley,
1995). Internal factors include experience, communication, pre-attentive processing (the
unconscious collection of information from the environment), attention, working memory,
perception and mental models (Endsley, 1995). Applying this concept of SA to the context
of ATC, SA would entail a mental picture of the location, flight, conditions and intentions of
aircraft within an area in relation to each other (GATCSA, 2013). Situation awareness was
stated as the primary cognitive task reported by controllers and included maintaining
understanding current and projected positions of aircraft in the controller’s sector in order to
determine events that require or may require controller activity (Seamster, Redding, Cannon,
Ryder, & Purcell, 1993). Controller understanding of aircraft projections (the future
positioning of aircraft) is essential to ATC.
Some theorists have warned against considering SA as a causal agent in that when SA is
considered as part of cognition, there is the danger of circular reasoning in which SA is
presented as the cause of itself (Flach, 1995). Flach (1995) posits that SA is but another box
in the information processing model. The differentiation and reduction of these concepts
effectively confuse and complicate rather than clarify these concepts. This research will
consider the circular nature of SA as a causal agent and its effects on the validity of
conclusions if SA is found to be a significant predictor of safety events.
Human-machine interface. The construction of complex socio-technical systems has led
to a greater demand for ‘knowledge workers’. Knowledge workers are people whose primary
function is to engage in rational work that requires discretionary decision- making. The
primary reason these people are present in complex sociotechnical systems is to engage in
adaptive problem solving (Vicente, 2002). There are various control areas that controllers
may assume during a shift which rely on different types of stimuli to perform the various
tasks. The variety of visual stimuli presented by the various technological displays is coupled

with the dynamic nature of the constantly changing images displayed according to priority.
This study adopted an ecological approach to human factors in that it was characterised by
four principles; the reciprocity of person and environment, the representative design of
experiments and evaluation, the primacy of perception and initiating while analysing the
environment.
The ecological approach to human factors and human-machine interface (HMI) compliments
the models used in this research. The various models (such as the decision making and SA
models) stress the importance of perception and analysis of the environment. The ecological
approach builds on this by recognising the crucial role that environment scanning and
perception have on the reciprocal nature of the HMI. Furthermore, the ecological approach
looks at specific problems of designing human-computer interfaces for complex
sociotechnical systems (Vicente, 2002). Air Traffic Management (ATM) is a complex system
that requires computer systems designed purely for the tasks of aircraft management. This
study investigated the sociotechnical systems specific to ATM, noting any delays or errors in
systems as well as errors in the use of the system, capturing the reciprocal nature of HMI.
2.4.4. External Factors (Covariate 4). This study considered a wide range of external
factors, namely; recreational flights in the airspace, airspace design, complex traffic
scenarios, workplace design, distracting phone calls, weather phenomena and combined
sectors. These factors were extracted from report analyses as the primary external factors that
were investigated in the ANSP reports.
Recreational flights in the airspace. Numerous reports involved recreational flights such
as skydiving charters and paragliding in the airspace. When there are recreational flights in
the airspace, a window is initiated in which the recreational flights operate. Controllers are
responsible for instructing departing and arriving aircraft on which fly track to follow. A
flight track is the path followed by the aircraft and there are a number of tracks that run next
to each other on which aircraft can be placed. The window created by recreational flights
changes flight tracks and the controllers need to be aware of these changes and apply them to
aircraft entering and exiting the airspace. Changing the flight track may place aircraft on a
track that ensures a buffer of the required 5nM from the boundary of the window in which the
recreational flights operate.

Airspace design. Airspace organisation provides strategies, rules and procedures by
which airspace is structured to accommodate different types of air activity and volumes of
traffic (Department of Transport, 2010). Following this, some airspace are more complex
than others, with varying sizes, flight paths and traffic volumes and these must be known by
the controllers. The airspace design may include vast areas to be controlled by one controller
or small airspaces that can be complex with many aircraft movements, leaving little room for
error. Complex airspace designs were considered in this research to be an external factor that
may have an impact on controller performance.
Complex traffic scenarios. Some reports included situations in which an unusual
complex traffic scenario manifested. This could be due to variable flight information, aircraft
low on fuel or other situations in which a common scenario manifests into a complex
scenario in which the controller has to adapt plans to accommodate the complex scenario.
Workplace design. Organisational design traditionally refers to the division and co-
ordination of tasks (Robbins, Judge, Odendaal, & Roodt, 2009). Workplace design was taken
here not as a fixed structure but rather considered two facets of workplace design that
emerged through the report analysis; workplace staffing as well as physical setting. The
‘workplace design’ variable in this study incorporated the physical design of the workplace.
The physical workplace design included for example, the layout of the tower consoles in
relation to the tower windows. In this example, the layout makes it difficult for controllers to
execute a proper visual scan of both the runway and taxiway (figure 9). When the controller
sits in the normal control position the consoles are too high to the left of the controller to
comfortably scan the runway/taxiway to the left. This is considered poor workplace design.
Any physical hindrance in the design of the workspace was considered to be a poor
workplace design and was included in this variable.

Figure 9. Photograph of a work station. Taken from an incident report.
Ergonomics refers to the science of work; the individuals involved, the way work is done, the
tools and equipment used, the place worked in and the psychosocial aspects of work
(Pheasant & Haslegrave, 2006). Anthropometrics is concerned with the matching of the
physical demands of the working task (including monitoring runways and performing visual
scans) to the workplace (among others) (Pheasant & Haslegrave, 2006).
The other aspect of workplace design encompassed notions regarding the staffing design of
the workplace. The staffing design was largely concerned with whether there was adequate
staffing at the time of the events as well as the supervision present at the time of the event.
The reports included details regarding individuals having to work extended hours due to
people being booked off sick or absent from work. Cases like this were considered to be
indicative of poor staffing designs as there was not an adequate amount of staff available at
the control centres. With respect to supervision, there are times when traffic loading is low in
which case there may be a lack of management supervision. The lack of supervision may
stem from beliefs that the situation will be able to be monitored without supervision
(Eurocontrol, 2010). Regardless of the reasoning, this research considered a lack in
supervision as a form of poor staffing designs.
Weather phenomena. Weather phenomena were included in the analysis as any weather
phenomenon that incurred a change in operations. This may have included weather patterns
that are cause pilots to fly under instrument meteorological conditions (meaning that pilots
fly primarily by reference to instruments as opposed to visual references), change in runway
use or weather avoidance.

Combined sectors. The combination of sectors follows strict rules regarding capacity
levels as well as which sectors may be combined. For example, approach control may be
combined with aerodrome Control, and flight information services may be combined with
area control (South African Civil Aviation Authority, 2009). Snapshot values can be
determined to provide the controllers with the means to determine demand prior to collapsing
sectors. The Air Traffic Management (ATM) capacity document sets maximum capacity at
30 movements per hour. A movement is considered to be any one aircraft that either lands at
or departs from an airport. Pace levels are used to describe the level of activity within the
declared capacity of each sector. Pace levels form the basis for a comparison between
different sectors and airports, and are expressed as a percentage of the declared capacity. The
pace levels are described as follows;
Pace level 1: 20% (Light)
Pace level 2: 40% (Light – Moderate)
Pace level 3: 60% (Moderate)
Pace level 4: 80% (Moderate – Heavy)
Pace level 5: 100% (Heavy)
Combining sectors should be done when expected traffic remains below 90% of merged
sector capacity. Risks of combining sectors include underestimation of traffic and controller
overload (Skybrary, 2013).
2.4.5. Risk Factors (Covariate 5). These factors were extracted from report analyses,
taken from stated risk factors investigated in the ANSP reports. The most relevant and
frequently stated risk factors that were included in the analysis were failure to respond to
alerts, unclear position takeover, poor co-ordination standards, failure to pass on essential
traffic information, poor radio telephony (R/T) phraseology and lack of memory cues in the
environment.
Position handover/takeover. This is the process by which a controller on position is
relieved of her duties and hands over to another controller. There are a number of procedures
that need to occur before, during and post handover. Pre-briefing assimilates the new
controller with the situation, what movements the current controller is dealing with and what
needs to be done (Skybrary, 2011). The operational handover checklist for each section
should be followed during the handover process and the outgoing controller must ensure that
all relevant information has been passed on (Skybrary, 2011). The checklist include for
example; weather, equipment, situation and traffic. Post hand-over, the handing over
controller remains at the control position until such a time that it is clear that the taking over
controller has full command of the situation (Skybrary, 2011). If any of these procedures are
not carried out correctly or not all relevant information is passes, it may result in an unclear
position takeover in which the taking over controller does not have all the information
required to establish full command of the situation.
Co-ordination standards. Coordination standards and procedures aim at establishing safe
and efficient mechanisms for the notification, exchange and transfer of flights between ATC
units (Eurocontrol, 2012). Co-ordination lies largely on the communication of information
regarding flight progress, flight plans and control information to necessary ATC units
(Eurocontrol, 2012). Co-ordination is defined as the “organisation of the different elements of
a complex body or activity so as to enable them to work together effectively” (Pearsall, 2005,
p. 210). Co-ordination standards apply to controller-controller communications as well as
controller-pilot communications. All parties must be aware of flight progress, flight plans
and control information in order to work effectively. Adherence to these standards includes
the use of correct R/T phraseology as well as passing essential traffic information. These
concepts were discussed in the safety standards and rating section. Recall that traffic
information must be passed to aircraft in a strict format using R/T phraseology.
Memory Cues. There is a large amount of information that reaches controllers whilst on
position. Information must be managed so as to ensure that important information is not
missed or forgotten (Eurocontrol, 2013). A lack of memory cues in the environment refers to
controller error with respect to flight progress strips (FPS). If a controller forgets to or fails to
move a FPS to indicate the movement of an aircraft, there is a lack of memory cue to serve as
a reminder of the movements. For example, a controller may fail to move a FPS to indicate a
runway occupancy, which would serve as a memory cue that the runway is occupied when a
vehicle requests permission to enter the runway. The lack of memory cue may lead to the
controller clearing the vehicle to enter the runway, causing a RI.

2.4.6. Stated causal errors (covariate 6). These factors were taken straight from the
reports as the stated primary cause of the events. There were eight posited primary causal
factors; memory lapse, mishear of read-back/hear-back, incomplete clearances issued, error
in timing of clearances, misjudging aircraft, radar and visual monitoring failures, incorrect
assumptions regarding separation and instructions issued to the incorrect aircraft.
Read-back/hear-back. Read-back is defined as the “procedure whereby the receiving
station repeats a received message or an appropriate part thereof back to the transmitting
station so as to obtain confirmation of correct reception” (Eurocontrol, 2013, p. 1). Following
this definition, read-back is the practice by which the receiving station repeats the message
and hear-back is the practice in which the transmitting station listens to the read-back to
ensure that the message has been correctly received. An uncorrected erroneous read-back
(known as a hear-back error) may lead to the aircraft’s deviation from the intended clearance.
This deviation may not be detected until the controller observes the divergence on his/her
radar display (Eurocontrol, 2013).
Clearance Issues. Recall that ATC centres use radar surveillance to issue speed,
altitude and directional instructions to pilots in order to keep aircraft properly separated.
These are known as clearance issues. Occasionally, controllers issue clearances that are
incomplete in that they may lack an aspect of the clearance such as altitude clearances.
Controllers may also issue a clearance too soon or too late, effectively clearing an aircraft to
an altitude too early or late resulting in inadequate separation between aircraft. Clearances
may also be issued to the incorrect aircraft. When this occurs, the intended aircraft does not
receive the clearances needed, whilst another aircraft receives the incorrect clearances.
Radar and visual monitoring failures. Controllers depend on radar was well as a
visual view of the runways in order to issue control instructions that provide separations. This
entails both radar and visual monitoring in order to ensure the orderly movement of aircraft
that are departing, landing and approaching for landing.
Misjudging aircraft projections. Controllers need to assess both the current positions
of aircraft as well as the projected position of aircraft. Aircraft projection is the future
positioning of aircraft based on current positioning, direction and speed. It is essential for

controllers to be able to assess aircraft speed and direction in order to assess whether future
projections allow for the maintenance of separation standards. When aircraft projections are
misjudged, the future projections as not correctly perceived, occasionally resulting in a
reduction in separation standards between aircraft.
As can be seen, these primary factors can be linked theoretically to the constructs introduced
under human factors. Memory lapses can be connected with memory constructs or to the
memory components in the central processing stage of information processing. Mishear of
read-back, misjudging aircraft, radar and visual monitoring failures can be related to errors in
the various in the perceptual encoding stage of information processing. Issues with
incomplete clearances, timing of clearances and instructions issued to the wrong aircraft can
be rooted back to errors in the central processing stages of information processing. Before
any analysis is done, it can be seen that all of the stated primary errors are related to issues in
the stages of information processing.
The stated primary causes are considered here as it is important to capture the opinions of the
investigating officers. The stated primary causes that are found significant in predicting
safety events can then be evaluated in terms of the theoretical constructs that underpin them.
This will assist in the overall evaluation of what human factors are at the root of the errors
that lead to safety events in ATC.
2.5. Research Questions
1. Are there particular times in shifts when safety events are likely to occur?
2. What event variables and demographic variables are common between events?
3. Which human factors, external factors, risk factors and stated causal errors are related
to safety events in air traffic control?
Which human factors are predictors of safety events?
What external factors are predictors of safety events?
What risk factors are predictors of safety events?
What stated causal factors are predictors of safety events?
4. Are human factors, external factors, causal factors and safety events related to
different types of human errors?
What errors are human factors related to?
What errors are external factors related to?

Are safety events related to certain types of human errors?
Are stated causal errors related to certain types of human errors?
2.6. Jargon used
For convenience, Table 2 lists the jargon used in the conceptual background.
Table 2. List of jargon used
Jargon Explanation
Aircraft projection The future positioning of aircraft based on current positioning, direction and
speed.
Clearance issues The issue of speed, altitude and directional instructions to pilots in order to
keep aircraft properly separated
Essential traffic
information
Information regarding clearances as well as other crucial procedural
instructions
Instrument
meteorological
conditions
Weather conditions under which pilots fly primarily by reference to
instruments as opposed to visual references
Loss of separation An infringement of both horizontal and vertical separation minima in
controlled airspace
Mistakes Failures in judgmental and/or inferential processes involved in the selection of
an objective or in the specification of the means to achieve it, irrespective of
whether or not the actions directed by this decision scheme run according to
plan
Radar and visual
monitoring
The constant scanning of runways and radar in order to maintain separation
between aircraft and ensure the orderly movement of aircraft.
Runway incursion Any occurrence at an aerodrome involving the incorrect presences of an
aircraft, vehicle or person on the protected area of a surface designated for the
landing and takeoff of aircraft
Safety event Safety events or occurrences are defined as any event which is or could be
significant in the context of aviation safety.
Slips and lapses Slips and lapses are errors which result from some failure in the execution and
or storage of an action sequence, regardless of whether or not the plan which
guided them was adequate to achieve its objective.

CHAPTER 3: METHODOLOGY
This research took the design of quantifying trends in qualitative data. The research design
was cross-sectional, exploratory and non-experimental as there is no manipulation of the
situation or variables, no control group and no random assignment of participants (Rosnow &
Rosenthal, 1999).
3.1. Sample
A sample refers to a set of observations which form a part of an entire population (Howell,
2008). The research study was based on archival data in the form of incident reports that
provided descriptions of safety events that occurred in civil aviation in the South African
airspace. The sample includes all reports from the years 2010 through to 2012 with 32 reports
from 2010, 27 from 2011 and 25 from 2012 making a total of 84 incident reports. The reports
cover all airports in the South African airspace covered by the ANSP.
Factors underlying human errors will be analysed using these safety event reports provided
by ANSP. These incident reports are drafted and collated by ANSP incident investigators.
The sample for this study was thus South African controllers who have infringed certain
airspace regulations resulting in a safety event. As the entire population of incident reports
from the years 2010 to 2012 in South Africa was used, this constitutes a random, independent
sample. In terms of the demographic variables, the mean age of the controllers involved in
the events is 32.40 with (32.40, 5.44²) and a minimum age of 21 and maximum of 52.
The most common occurring gender was male (Mo=1), with 72 males (77.4%) and 21
females (22.6%) making a sum total of 93 controllers. The most common occurring sector is
reported as tower/approach (Mo=11).
3.2. Instruments and procedure
Permission to gain access to the reports was granted by ANSP. Full non-disclosure
agreements were signed, allowing the researchers access to the reports. The reports were
assessed by two researchers. One researcher covered years 2008 to 2010 as part of a separate
study, and the years 2010 to 2012 were covered by this study.

The incident reports are based on the Human Error in Air Traffic Management (HERA)
model (appendix 1). This system is the preferred technique among air traffic investigators and
shows high inter-rater reliability (Lyons, Boive, & Van Damme, 2003). Incident investigators
from ANSP have been trained in the HERA system. Incident investigations follow the
detection and notification of a safety occurrence. Investigators perform factual information
gathering in which they assemble evidence and information regarding the event. A
preliminary report is compiled through various methods. For example, if a safety event
occurred in a radar environment the radar recordings are impounded and reviewed. If it was a
non-radar environment only the audio or frequency recording is impounded and investigated.
In this step, causal factors are consolidated with the views of the individuals involved in the
event and may prompt controller memory of details that were omitted straight after the event
(Eurocontrol, 2003). An analysis phase follows in which arguments are put forward regarding
why the safety event occurred and what technical, operational and underlying factors were
involved.
In order to classify errors for incident analysis, the HERA technique aims to describe two
types of factors, namely; the error and the context. In describing the error, the event is
described in terms of what occurred (the error type), how it occurred (the error mechanisms)
and why the mechanism failed (the information processing levels). In evaluating the context,
the investigator notes when the event occurred, the individuals involved, the tasks being
performed, the time sequence of the event and which information was involved (Eurocontrol,
2004). This analysis is then consolidated into a final report accompanied with
recommendations for the issues that should be addressed, proposed remedial action as well as
the controllers to receive remedial action (Eurocontrol, 2003).
3.3. Ethical Considerations
Since the study made use of archival data, no ethical approval regarding access to participants
or samples was required. ANSP gave permission for the reports to be used for research
purposes. The archival data (in the form of ANSP safety event reports) contains information
that is both privileged and confidential and was required to remain so. The company
concerned is responsible for protecting the rights of their employees as well as the individuals
involved in the incidents. A non-disclosure agreement was signed by the parties involved
(the University of the Witwatersrand and ANSP) stipulating the terms and conditions of the

mental alertness project (appendix 2). Some of the safety event reports name the controller
involved in the event, thus in order to ensure confidentiality and anonymity, no identifying
information was reported in this research and the names were omitted from all analyses. As
per the non-disclosure agreement, should this report be published, ANSP will be provided
with a copy of the proposed thesis and given a period of thirty days to review the thesis.
Safety events reports have been kept in a confidential on-line file to which only the
researchers and supervisors had access. As per the non-disclosure agreement, the copies of
the safety event reports will be returned to ANSP once the research report is finalised and
associated proceedings have concluded. A copy of the report and results will be made
available to ANSP on conclusion of the research as well as for the WITS library. In the case
that results are reported at conference(s) and in journal(s), the researchers will comply with
the agreement stipulated in the non-disclosure agreement. The agreement specifies that
ANSP requires 30 days to review the research report and to stipulate changes to be made
should they find any part of the report to be commercially prejudicial. In addition, the non-
disclosure agreement stipulates that ANSP might request that the research report and other
publications be withheld from publication for a year after completion (Appendix 2).
3.4. Data Analysis
There were two primary parts to the analysis. Firstly, content analysis was performed on the
safety event reports provided by ANSP. Although the reports were coded to some extent
within the HERA framework, the reports were highly textual and require further analysis.
The researchers developed a model that allowed for the coding of the information in the
reports into various components. The framework was developed to capture both factors that
emerged from literature as well as others that emerged from the reports themselves. This
analysis allowed for a more in-depth approach to the reports in which the researcher was able
to extract constructs pertinent to the study. A number of the reports involved more than one
controller at fault. These reports were divided into the number of controllers involved in
order to effectively capture the errors for each controller. When analysing event variables
these reports were counted as one. This meant that these reports were viewed to represent one
safety event but also captured the aspects of all the controllers involved. Once the reports
were summarised into the model, they were then coded into quantifiable units of analysis.

The second part of the analysis involved statistical procedures, all performed in SPSS.
Descriptive statistics were used in describing the sample and gaining insight into the shift and
event variables. The second component of the statistical analysis was aimed at establishing
relationships between human and external factors, and safety events and human errors
respectively. This was performed in a number of steps. Initially a hierarchical cluster analysis
was performed on the individual human factors umbrella variables as there were too many
components for a cluster analysis. Hierarchical clustering is a method used to investigate
grouping in data, over a variety of scales of distance, by creating a cluster tree called a
dendrogram (MathWorks, 2013). The technique used agglomerative clustering which means
that the procedure starts with each object representing an individual cluster; these clusters are
subsequently merged according to their similarity (Mooi & Sarstedt, 2011).
The analysis clustered variables using Wards Method and by extension used a squared
Euclidean distance, which is an agglomerative, complete linkage procedure (Mooi &
Sarstedt, 2011). This method essentially draws a straight line between two variables to assess
their proximity and ultimately their similarity, which is then compared with other variables
and grouped according to similarity (Mooi & Sarstedt, 2011). The Agglomeration schedule,
dendrograms and distance matrices were reported.
The dendrogram represents a multi-level hierarchy, where clusters at one level are joined as
clusters at the next higher level and thus allows for the discerning of what level of clustering
is most appropriate in the specific application (MathWorks, 2013). The dendrogram was used
to determine the number of clusters for each umbrella variable. This was determined by
looking at the point at which breaks occur at greatly increased distance levels (Mooi &
Sarstedt, 2011). The squared Euclidean distance is reported in the ‘coefficients’ column of
the Agglomeration Schedule and the difference (d) between distances establishes the number
of clusters. Small coefficients indicate that relatively homogenous clusters have been merged
whilst large coefficients show that groups containing dissimilar members have been merged.
A coefficient cut off in SPSS lies around 9.0 (Gebotys, 2000).
The Agglomeration schedule reports the variables that are clustered as well as the stages at
which they were clustered. The dendrogram (tree) provides a visual representation of this
schedule. Using the schedule, the dendrogram and agglomerative schedule, the researcher
discerned the number of clusters under each umbrella variable. Umbrella variables
containing less than 3 sub variables did not have the minimum number of variables required

for a hierarchical cluster analysis. The sub variables were thus chosen as the clusters under
those umbrella variables. This was the case for decision making, mental models and mental
alertness. Once the number of clusters per umbrella variable was established, variables were
recoded into those clusters. This approach was adopted as there were too many variables
under each umbrella variable to enter into a cluster analysis. The second part of the analysis
involved the clustering of the clustered human processes variables, unclustered physical
variables and unclustered external factors variables around the events as well as errors. These
clustered were then evaluated and it was noted which variables clustered around the events
and errors respectively.
The variables that were clustered around events as well as errors were then put through a
logistic regression in order to establish the overall association between them and establish
how well these clusters predict events and variables. Logistic regression provides knowledge
of the relationships and strengths among variables (Sage, 2013). Logistic regression was
chosen instead of a discriminant function analysis as the data included dichotomous response
variables and categorical explanatory variables. Logistic regression is a method for testing
relationships between one or more quantitative and/or categorical explanatory variable and
one categorical outcome (Seltman, 2013). Logistic regression ultimately models the success
probability as a function of the explanatory variables.
Logistic regression faces a number of assumptions that are less stringent than the assumptions
of normality in discriminant function analysis. Logistic regression assumes random
independent sampling, linearity between the Independent variables and logit of probability
and model satisfaction. This means that there are no assumptions of normality, linearity or
homogeneity of variance for the independent variables. The minimum number of cases per
independent variable is 10, using a guideline provided by Hosmer and Lemeshow (Hosmer,
Lemeshow, & Sturdivant, 2013). This requirement is met with the number of cases for each
variable sitting at 94 (n=94). To test linearity, random IVs were chosen and entered into
binning methods. Binning is a process in which individual data values are grouped into one
instance of a graphic element (IBM, 2011). No differences were found between results
including bins and those including original clusters. This may be because clustering is to
some extent a similar process to binning, in which individual data values are grouped with
others. Each regression looked at model fit, ensuring that the last assumption is met for every
regression.

A limitation that this study faces is the consequences of a small to moderate sample size on
logistic regressions. The phenomenon of small studies reporting large effects is due to
systematically induced bias away from the null (Nemes, Jonasson, Genell, & Steineck, 2009).
This study employed logistic regression on a small to moderate sample size, meaning that
some cases may overestimate the effect measure. It is noted in such case that discretion must
be used when interpreting results.

CHAPTER 4: RESULTS
4.1. Introduction
The results section presents the outcomes of the study through the reporting of the statistical
analyses performed. This section starts with reports of the results in relation to safety events,
effectively answering research questions 1 to 3 followed by results in relation to human error,
answering research question 4. As this research is extremely technical in nature, the reader is
reminded of the summary table (Table 2) of all jargon used on page 38. The results are
reported in a constant format for each section, evaluating the cluster analysis in which the
agglomeration schedule and dendrogram are provided followed by the results of the logistic
regressions. It is noted that when factors are referred to as a ‘significant predictor’, this
denoted that it showed to be statistically significant in the chi-square facet of the logistic
regression at the 5% level of significance (p< .05). Factors are only considered to be
significant predictors if statistically significant and not merely because they occurred most
frequently.
Where large odds ratios occur, these are noted as a limitation of logistic regressions and may
reflect an overestimation of the chances of the event occurring. Large odds ratios reflecting
overestimations are possible outcomes in logistic regressions used in studies with small to
moderate sample sizes. It is posited that these overestimations occurred when there were few
observations for one of the explanatory variables (Nemes, Jonasson, Genell & Steineck,
2009).
4.2. Shift Variables, event variables and demographic variables
The first research question asked whether there are particular times in shifts when
safety events are likely to occur. The most common occurring time of a safety event since
the start of shift was 30 min (Mo=30). The most frequent occurring reported minutes since
last break is 20 (Mo=20) and the most common occurring time since position takeover is 32
(Mo=32). The most common occurring duration of breaks was 60 min, with 12 being the
most frequent number of hours reported since last sign off (Table 3). Because of the high
range of times reported for time since start and minutes since last break (R=441 & R=225)
and the extreme high values, means cannot be looked at for these variables as the extreme

numbers pull the mean in one direction, ultimately positively skewing them. The modal
values and means do not allow for any decisive conclusions to be drawn. In order to get a
better understanding of times in a shift in which events occur, the data must be grouped into
time periods.
Table 3. Descriptive statistics of shift variables.
Table 4. Frequencies for grouped time since start of shift.
Time since
start (min)
Time since
position
takeover
Minutes
since last
break
Duration
of last
break
(min)
Hours
since last
sign off
Days
since last
off day
Mean 153.26 44.89 50.80 59.49 38.12 5.34
Median 123.50 32.00 41.50 60.00 24.00 2.00
Mode 30 32 20 60 13 2.00
Std.
Deviation
116.92 41.49 42.75 40.28 39.94 11.97
Range 440 186 225 240 215 60
Minimum 1 1 0 0 1 0
Maximum 441 187 225 240 216 60
Minutes Frequency Percent Valid Percent
0 -30 17 18.1 18.5
31 – 60 9 9.6 9.8
61 – 90 4 4.3 4.3
91 - 120 11 11.7 12.0
121 – 150 11 11.7 12.0
151 – 180 6 6.4 6.5
181 – 210 7 7.4 7.6
211 – 240 5 5.3 5.4
241 – 270 5 5.3 5.4
271 - 300 4 4.3 4.3
301 - 330 3 3.2 3.3
331 - 360 4 4.3 4.3
361 - 390 4 4.3 4.3
> 391 2 2.1 2.2
Total 92 97.9 100.00
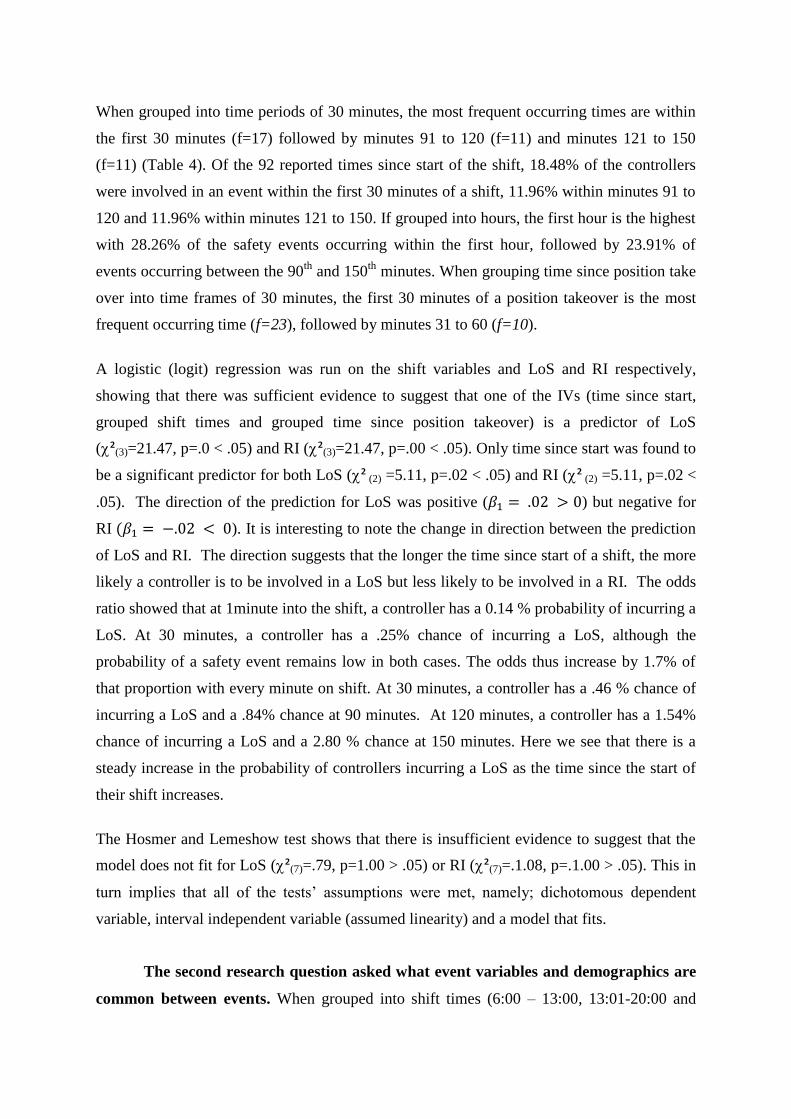
When grouped into time periods of 30 minutes, the most frequent occurring times are within
the first 30 minutes (f=17) followed by minutes 91 to 120 (f=11) and minutes 121 to 150
(f=11) (Table 4). Of the 92 reported times since start of the shift, 18.48% of the controllers
were involved in an event within the first 30 minutes of a shift, 11.96% within minutes 91 to
120 and 11.96% within minutes 121 to 150. If grouped into hours, the first hour is the highest
with 28.26% of the safety events occurring within the first hour, followed by 23.91% of
events occurring between the 90th
and 150th
minutes. When grouping time since position take
over into time frames of 30 minutes, the first 30 minutes of a position takeover is the most
frequent occurring time (f=23), followed by minutes 31 to 60 (f=10).
A logistic (logit) regression was run on the shift variables and LoS and RI respectively,
showing that there was sufficient evidence to suggest that one of the IVs (time since start,
grouped shift times and grouped time since position takeover) is a predictor of LoS
(²(3)=21.47, p=.0 < .05) and RI (²(3)=21.47, p=.00 < .05). Only time since start was found to
be a significant predictor for both LoS (² (2) =5.11, p=.02 < .05) and RI (² (2) =5.11, p=.02 <
.05). The direction of the prediction for LoS was positive ( ) but negative for
RI ). It is interesting to note the change in direction between the prediction
of LoS and RI. The direction suggests that the longer the time since start of a shift, the more
likely a controller is to be involved in a LoS but less likely to be involved in a RI. The odds
ratio showed that at 1minute into the shift, a controller has a 0.14 % probability of incurring a
LoS. At 30 minutes, a controller has a .25% chance of incurring a LoS, although the
probability of a safety event remains low in both cases. The odds thus increase by 1.7% of
that proportion with every minute on shift. At 30 minutes, a controller has a .46 % chance of
incurring a LoS and a .84% chance at 90 minutes. At 120 minutes, a controller has a 1.54%
chance of incurring a LoS and a 2.80 % chance at 150 minutes. Here we see that there is a
steady increase in the probability of controllers incurring a LoS as the time since the start of
their shift increases.
The Hosmer and Lemeshow test shows that there is insufficient evidence to suggest that the
model does not fit for LoS (²(7)=.79, p=1.00 > .05) or RI (²(7)=.1.08, p=.1.00 > .05). This in
turn implies that all of the tests’ assumptions were met, namely; dichotomous dependent
variable, interval independent variable (assumed linearity) and a model that fits.
The second research question asked what event variables and demographics are
common between events. When grouped into shift times (6:00 – 13:00, 13:01-20:00 and

20:01-05:59 South African times and 8:00 – 15:00, 15:01 – 22:00 & 22:01 – 07:59 UTC),
frequencies show that events most frequently occur in the first shift (8:00 – 15:00 UTC) with
a frequency of 46 of the 78 reports (59%), followed by the third shift (22:01 – 07:59 UTC)
reported in 20 of the events (26%) and lastly the second shift time reported in 12of the reports
(15%). This result shows that the first shift (6:00 – 13:00 Central African time) is the most at
risk shift of incurring a safety event. When the data is grouped into time periods of an hour,
the most frequent occurring time is 12:01 – 13:00 UTC (f=12), followed by 05:01 – 06:00
UTC (f=8) and 10:01 – 11:00 UTC (f=8). This shows that the most at risk time is 12:01 and
13:00 UTC which fall in the last hour of the first shift. The next most at risk times fall
between 05:01 UTC and 06:00 UTC as well as 10:01 UTC and 11:00 UTC.
The most frequent occurring type of weather is reported as undefined in the reports (f=40),
with ‘clear’ as the next most frequent occurring (f=19) followed by Instrumental
Meteorological Conditions (f=11). The most common occurring sector was reported as
aerodrome and approach combined (f=20, 21.3%), followed by approach (f=15, 16.00 %).
The most frequent occurring severity level of the incident scored by the rating scale (figure 2)
was minimal (f=21, 27%) followed closely by marginal (f=20, 26%) and significant (f=19,
24%). Of the 78, only seven were rated as severe (f=7, 9%). Descriptive statistics show that
the average number of aircraft on radio frequency at the time of safety events is 8 (
, with the most common occurring number of aircraft on frequency set at 2
(Mo = 2). The average movement per hour was 29.45 ( with the
most frequency set at 42 (Mo = 42). Analysing the statistical frequencies, it can be seen that
22 of the 44 reported movements per hour (50%) were above 30 movements per hour. Recall
that the ATM capacity document sets maximum capacity at 30 movements per hour. This
shows that 50% of the reported movements per hour were above maximum capacity levels.
When evaluating the combination of sectors, cross tabulation showed that aerodrome and
approach sectors were combined in two instances, with more than 30 movements per hour,
tower west and east combined once and radar west and east sectors combined four times with
traffic volumes of more than 30 movements per hour. This implies that 7 of the 22 (31.82 %)
occurrences of more than 30 movements per hour occurred on combined sectors.
Of the 93 controllers investigated, 72 were male (77.40%) and 21 were female (22.60%). In
order to see the relevance of these findings, they must be placed in context of the employee
demographics of controllers in South Africa. Of the 355 ANSP employees in 2013, 254

(71.5%) were male and 101 (28.5%) were females. Within the ANSP staff, 28.35% of the
males were involved in an event whilst 20.79% of the females were involved in safety events.
As only access to the demographics from 2013 was given, the percentages cannot be taken as
absolutes but rather as indications of the ratio of men and women involved in events. The
percentages show that a greater percentage of men are involved in safety events.
The most common occurring English proficiency was level 6 with 1 controller reported at
level 4, 29 at level 5, and 64 at level 6. The mean age of the controllers involved in the events
is 32.40 with (32.40, 5.44²) and a minimum age of 21 and maximum of 52. In 2013,
ANSP staff ages ranged from 22 to 63, with a mean age of 33.66, (33.66, 8.27²). These
mean ages mirror the mean ages of controllers involved in the safety events. Logistic
regression showed that none of the demographic variables (age, gender and language
proficiency) are significant predictors of either RI (²(4)= 8.30, p=.08 > .05) or LoS (²(4)=
8.30, p=.08 > .05).
4.3. Safety Events
The analysis was performed with respect to the two types of safety events; a LoS and a RI in
order to establish whether different human factors were associated to different event types. If
it was established that the variable in question was a predictor of both RI and LoS, then
subsequent analyses were performed on the variable labelled ‘event type’ which included
both RI and LoS.
The next question asked which human factors are associated with safety events.
Cluster analyses were performed on the human factors variables that had more than three
component variables. This method was adopted in order to focus the research by
amalgamating similar component variables into fewer representative variables. Recall that a
hierarchical cluster analysis is a means of investigating grouping in data (MathWorks, 2013)
which starts with each object representing an individual cluster which are subsequently
merged according to their similarity (Mooi & Sarstedt, 2011). In this way, the component
variables under the human factors variables with more than 3 component variables were
clustered into groupings so as to minimise the number of component variables. Once the
clusters were established, the variables were recoded. This meant that, for example,
information processing was coded from 1 to 4 (1 representing detection of information errors,

2 representing interpretation, 3 representing visual errors and four auditory). This ultimately
allowed for the amalgamation of similar variables so as to compress many variables to fit
under one. This allowed each variable to be entered into a cluster analysis with other human
factors and the Los and RI variables.
Table 5. Variables and component variables pre cluster analysis.
Information Processing Situation Awareness Memory
Component
variables
Monitoring failure
Failure to scan runway
Similar call signs
Information Overload
Misjudged Aircraft
projection
Error in Auditory
detection
Ambiguous
instructions issued
Incorrect detection of
visual information
Erroneous
Perception
Erroneous hear-back
Misjudged aircraft
projection
Instruction issued to
wrong aircraft
Failure to recognize
risk
Forgot planned action
Inaccurate recall of
temporary memory
Rarely used
information
Working memory
failure
Attention Human Machine
Interface
Workload
Component
variables
Divided
Selective
Focused
Sustained
Vigilant
Poor label
management
System delay
Insufficient use of
tools
Poor radar images
High complexity
Low Complexity
High volume
Low volume
Underload
Overload
Subjective traffic
complexity rating
Subjective workload
rating

The variables with more than three component variables (Table 5) included information
processing (8 component variables), situation awareness (5 component variables), memory (4
component variables), attention (5 component variables), human-machine interface (4
component variables) and workload (8 component variables). The clusters of these human
factors variables were decidedly interpretable in that majority of the cluster breaks and
clusterings were clear and easily translated. The summary of clusters chosen under each
variable is presented in Table 6. The table shows the number of clusters that the
agglomeration schedule alluded to, the number of clusters chosen and what those clusters
were. The symbol ‘≈’ denotes approximation. The remaining human processing variables that
had 2 or less sub-components were recoded into one variable.
Table 6. Summary of the human factors clusters.
Information Processing Situation Awareness
No of Clusters suggested 4 ≈ 3
No of cluster chosen
Clusters
4
Quality of information received
Interpretation
Visual detection errors
Auditory detection errors
4
Communication
Situation Assessment
Perception
Distraction
Attention Memory
No of Clusters suggested ≈ 2 3
No of cluster chosen
Clusters
2
Vigilance
Divided
3
Forgot Action
Working memory
Rarely used info
Human Machine Interface Workload
No of Clusters suggested ≈ 1 4
No of cluster chosen
Clusters 2
System
System Use
4
Overload
Underload
Subjective rating of workload
Complexity
Nine sub-variables under the human factors heading were entered into the cluster analysis
with the LoS variable. These sub-variables included; information processing cluster,
situation awareness cluster, attention cluster, workload cluster, memory cluster, human

machine interface cluster, mental alertness, mental models and the decision making cluster.
According to the agglomeration schedule (Table 7), breaks occur at greatly increased distance
levels around 4 clusters (d=3.25). The 5th
cluster’s coefficient (10.25) lies higher than the
recommended Euclidean distance of 9.00, suggesting that between 3 and 4 clusters should be
chosen. As the first increased break lies at the 4th cluster, 3 clusters most adequately explain
the data.
Table 7. Agglomeration Schedule for human factors with LoS.
Stage Cluster Combined Coefficients Stage Cluster First Appears Next Stage
Cluster 1 Cluster 2 Cluster 1 Cluster 2
1 1 10 .00 0 0 6
2 2 5 .50 0 0 3
3 2 8 2.00 2 0 4
4 2 7 5.25 3 0 6
5 4 6 10.25 0 0 7
6 1 2 15.50 1 4 9
7 3 4 21.17 0 5 8
8 3 9 27.75 7 0 9
9 1 3 60.80 6 8 0
The dendrogram’s ‘clusters combined’ column (figure 10) and Agglomeration Schedule
(Table 6) show that mental models and LoS were clustered together in the first stage,
followed by attention with decision-making, human machine interface and memory variables.
Workload was clustered with situation awareness, information processing and mental
alertness variables in the final stages. Three clusters were chosen as the best descriptors of the
data. These three clusters chosen were; (a) mental models and Los, (b) decision making,
attention, human-machine interface and memory and (c) situation awareness, workload,
information processing and mental alertness. A logistic regression analysis (Table 8) run
with mental models (covariates) and LoS (dependent variable) showed that there was
insufficient evidence to suggest that mental models are a significant predictor of LoS
(²(1)=1603, p= .21 > .05).

Figure 10. Dendrogram using Ward linkage to cluster human factors with LoS. Table 8. Logistic regression between LoS and mental models
Variable Significant Beta Direction Odds Ratio Confidence Interval
Mental Models X
(p=.22) -.79 -ve .46 .13 → 1.60
The same nine variables were then entered into a cluster analysis with the RI variable. The
agglomeration schedule (Table 9) shows that breaks occur at greatly increased distance levels
at stage 4 (d= .75) suggesting that 3 clusters best describe the data. Again mental models are
clustered with Runway Incursions in the first level, whilst attention, human machine
interface, decision making and mental alertness are clustered together in subsequent stages.
Situation awareness, workload and information processing are then clustered together and
only in the final stages are mental models clustered with decision making (figure 11). The
clusters are thus similar to the previous analysis for LoS in that they were; (a) mental models
and RI, (b) decision making, attention, human-machine interface and mental alertness and (c)
situation awareness, workload and information processing. A logistic regression (Table 9)
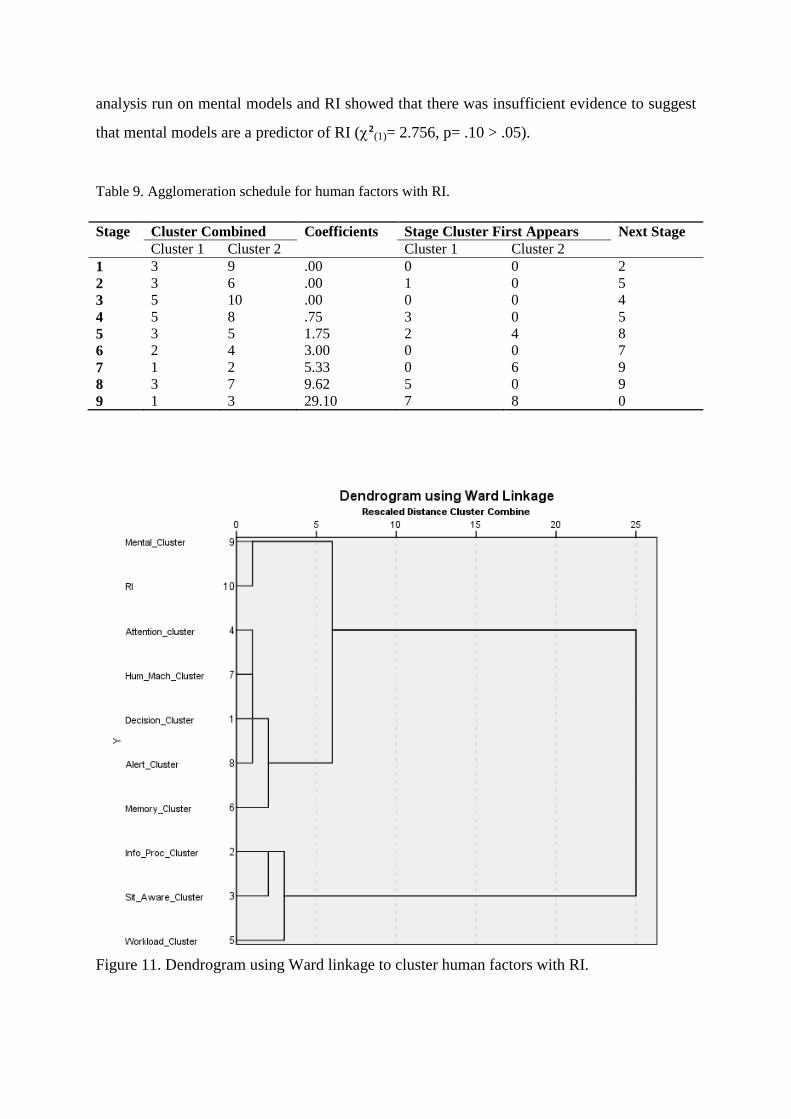
analysis run on mental models and RI showed that there was insufficient evidence to suggest
that mental models are a predictor of RI (²(1)= 2.756, p= .10 > .05).
Table 9. Agglomeration schedule for human factors with RI.
Stage Cluster Combined Coefficients Stage Cluster First Appears Next Stage
Cluster 1 Cluster 2 Cluster 1 Cluster 2
1 3 9 .00 0 0 2
2 3 6 .00 1 0 5
3 5 10 .00 0 0 4
4 5 8 .75 3 0 5
5 3 5 1.75 2 4 8
6 2 4 3.00 0 0 7
7 1 2 5.33 0 6 9
8 3 7 9.62 5 0 9
9 1 3 29.10 7 8 0
Figure 11. Dendrogram using Ward linkage to cluster human factors with RI.

Table 10. Logistic regression with Mental Models and RI.
Variable Significant Beta Direction Odds Ratio Confidence
Interval
Mental Models X
(p= 3.00)
1.01 +ve 3.00 .76 → 11.88
Logistic regression analyses were then run on the human factors variables individually
(covariates) with both LoS and RI (dependent variables). These had to be entered separately
as entering all nine variables at once required more cases than were present in the data. When
entered in together, the model could not be fitted because the number of observations is less
than or equal to the number of model parameters. The analysis (Table 11) showed that
information processing is the only predictor of both LoS and RI (²(3)=27.44, p=.00 &
²(3)=28.62, p=.00). When a logistic regression was run on the individual human factors
variables and event type variable (both RI and LoS coded into one variable), information
processing was again the only significant predictor (²(1)=24.55, p=.00).
Table 11. Summary of logistic regression on information processing (covariate) and events
(dependent).
Variable Significant Beta Direction Odds Ratio Confidence Interval
Information Processing
Errors
(p=.001)
2.27 +ve 9.67 2.594 → 36.070
The more information processing errors an individual displays, the more likely a safety event
will occur ( . Controllers with poor information processing skills are 9.67 times more
likely to cause a safety event . However, the large confidence interval (2.59 to 36.07) reflects
a possible overestimation that might be related to the small number of observations for
information processing as an explanatory variable (Nemes, Jonasson, Genell & Steineck,
2009).
In terms of the assumptions of the test, the Hosmer and Lemeshow test indicates that there is
insufficient evidence to suggest that the model does not fit (²(2)=1.98, p=.371).
The individual factors of information processing (detection errors, interpretation errors and
errors in perceptual and auditory detection) were entered into a logistic regression with both

LoS and RI respectively and there was sufficient evidence to suggest that at least one of these
factors predicted both LoS (²(3)=24.55, p=.00 < .05) and RI (²(3)=27.44, p=.00 < .05).
Interpretation errors and auditory detection errors were significant predictors of both LoS and
RI (Table 12). Controllers exhibiting interpretation errors are 46 times more likely to incur a
RI and 6.53 times more likely to incur a LoS. However, these results regarding interpretation
errors should be treated with caution due to the large confidence intervals associated with
them. Controllers displaying difficulties in auditory detection are 33.5 times more likely to
incur a LoS and 68 times more likely to incur a RI. Once again, however, the confidence
intervals are very large indicating that other factor might have been responsible for the
predictions. Following these predictions, it can be seen that interpretation errors auditory
detection errors predict both LoS and RI.
Table 12. Logistic regression with information processing components (covariates) and safety events
(dependent variable).
Variable Predicted
variable
Significant Beta Direction Odds
Ratio
Confidence
Interval
Quality of
Information received
Los X
(p=1.00)
-21.20
RI X
(p=1.00)
21.21
Interpretation
errors
Los
(p=.00)
1.88 +ve 6.53 1.32 → 32.32
RI
(p=.00)
3.83 +ve 46.00 5.17 → 409.38
Visual detection
errors
Los X
(p=1.00)
-21.20
RI X
(p=1.00)
21.203
Auditory detection
errors
Los
(p= .00)
3.51 +ve 33.50 2.63 → 180.25
RI
(p=.00)
4.22 +ve 68.00 7.6 → 601.44

The next question asked which external factors are associated with safety events.
Seven external variables were entered into the cluster analysis with LoS and RI respectively
to establish which external variables clustered around safety events. These variables included
recreational flights in the airspace, airspace design, complex traffic scenarios, workplace
design, distracting phone calls, weather phenomena and combined sectors. The
agglomeration schedule (Table 13) showed that one cluster best explains the data (d=9.5).
The first stage of the analysis saw recreational flights in the airspace clustered with airspace
design. The LoS variable was only clustered in the last stage and is thus not significant.
Table 13. Agglomeration schedule for external factors with LoS.
Stage Cluster Combined Coefficients Stage Cluster First Appears Next Stage
Cluster 1 Cluster 2 Cluster 1 Cluster 2
1 4 7 9.00 0 0 3
2 2 5 18.50 0 0 4
3 4 6 32.17 1 0 6
4 1 2 49.33 0 2 5
5 1 3 68.42 4 0 6
6 1 4 89.71 5 3 7
7 1 8 129.50 6 0 0
Figure 12. Dendrogram using Ward linkage to cluster external factors with LoS.

Logistic regression analyses showed that there was sufficient evidence to suggest that at least
one of the external factors (Independent variables) is a predictor of LoS at the 5% level of
significance (²(7)=17.56, p=.01 < .05). Analysis of the variables in the equation (Table 14)
showed that poor workplace design (²(1)=6.00, p=.01< .05) is a significant predictor of LoS,
with airports with poor workplace design 7.8 times more likely to cause an LoS. However,
the confidence intervals is fairly large. The Hosmer and Lemeshow test shows that there is
insufficient evidence to suggest that the model doesn’t fit (²(8)= 3.74, p=.88 > .05).
Table 14. Logistic regression external factors (covariates) and LoS (dependent).
Variable Significant Beta Direction Odds
Ratio
Confidence
Interval
Poor workplace design
(p=.01)
2.06 +ve 7.81 1.51 → 40.44
Combined sectors X
(p= .58)
.47
Recreational flights in
airspace
X
(p=1.00)
-19.42
Distracting phone calls X
(p=1.00)
-.001
Unusual complex traffic
scenario
X
(p=.64)
-.37
Airspace restriction X
(p=.51)
-.65
Weather Phenomenon X
(p=.28)
1.01
The same variables (covariates) were then entered into a cluster analysis with RI (dependent
variable). The agglomeration schedule (Table 15) showed that the largest distance break
occurs at the 4th
stage (d=1.67) suggesting that three clusters best explained the data. Again,
the first stage clustered recreational flights with airspace design in the Dendrogram (figure
13). The next stage clustered weather phenomena with complex traffic scenarios. The
following two stages cluster workplace design with combined sectors and Runway
Incursions. The three clusters were thus; (a) recreational flights and airspace design, (b)

weather phenomena and complex traffic scenarios and (c) workplace design, combined
sectors and Runway Incursions.
Table 15. Agglomeration schedule for external factors with RI.
Stage Cluster Combined Coefficients Stage Cluster First Appears Next Stage
Cluster 1 Cluster 2 Cluster 1 Cluster 2
1 4 7 1.00 0 0 5
2 1 6 2.00 0 0 6
3 2 3 3.00 0 0 4
4 2 8 4.67 3 0 7
5 4 5 7.00 1 0 6
6 1 4 10.27 2 5 7
7 1 2 21.88 6 4 0
Figure 13. Dendrogram using Ward linkage to cluster external factors with RI.

The same seven external factors were entered into a logistic regression using RI as the
dependent variable. There was sufficient evidence to suggest that at least one of the external
factors is a predictor of RI at the 5% level of significance (²(7)=19.11, p=.01 < .05). Analysis
of the variables in the equation (Table 16) showed that workplace design is a predictor of RI
(²(1)=10.29, p=.0 < .05). The odds ratio shows that poor workplace designs are 9.95 times
more likely to incur RI, but the confidence interval is once again fairly large.. The Hosmer
and Lemeshow test shows that there is insufficient evidence to suggest that the model doesn’t
fit (²(8)=6.25, p=.62 > .05).
Table 16. Logistic regression external factors (covariates) and RI (dependent).
The components of workplace design; physical set up and staffing procedures were entered as
covariates into a logistic regression with Los and RI (dependent variable). The omnibus test
of model coefficients showed that at least one of the covariates (staffing and physical design)
predicted LoS (²(3)=9.66, p=.02 < .05) as well as RI (²(3)=11.30, p=.01 < .05).
Variable Significant Beta Direction Odds
Ratio
Confidence
Interval
Poor workplace design
(p=.01)
2.29 +ve 9.95 2.44 → 40.49
Combined sectors X
(p= .35)
-.83
Recreational flights in
airspace
X
(p=1.00)
19.53
Distracting phone calls X
(p=.84)
-.19
Unusual complex traffic
scenario
X
(p=.74)
.27
Airspace restriction X
(p=.63)
.50
Weather Phenomenon X
(p=.42)
-.77

Table 17. Logistic regression with workplace design components (covariates) and safety events
(dependent variable).
Variable Predicted
variable
Significant Beta Direction Odds
Ratio
Confidence
Interval
Poor physical
workplace design
LoS
(p=.00)
1.98 +ve 7.27 1.89 → 27.96
Poor workplace
Staffing design
X
(p=.30)
19.89
Poor physical
workplace design
RI
(p=.00)
1.97 +ve 7.20 1.94 → 26.70
Poor workplace
staffing design
X
(p=.22)
-19.87
Physical workplace design (Table 17) showed to be a significant predictor of both RI and
LoS, with airports with poor physical workstation setting 7.27 times more likely to incur a
LoS and 7.20 times more likely to incur a RI. Both show significant confidence intervals,
suggesting that physical workplace design may not be predicting of safety events as strongly
as suggested by the odds ratios.
The next question concerned which risk factors are related to the events. Logistic
regression was performed on risk factors with event type as the dependent variable. Risk
factors include failure to respond to alerts, unclear position takeover, poor co-ordination
standards, pilot controller communication, failure to pass essential traffic information, poor
R/T phraseology use and lack of memory cues in the environment. It was shown that at least
one risk factor predicted LoS (²(7)=25.21, p=.00 < .05) and RI (²(7)=28.17, p=.00 < .05).
Analysis of the variables in the equation (Table 18) shows that poor adherence to co-
ordination standards (²(1)=3.81, p=.05 < .05) as well as lack of memory cues in the
environment (²(1)=8.00, p=.01 < .05) are significant predictors of safety events. The
direction of the betas and odds ratios suggested that controllers displaying poor adherence to
co-ordination standards are 16.26 times more likely to incur a LoS and stations that lack a

memory cue are 15.05 times more likely to incur a RI. It is noted again that there is a
possibility of overestimation as reflected in the large confidence intervals. Poor adherence to
communication standards was shown to be an insignificant predictor of RI with an odds ratio
of .05 and confidence interval of 1.01. A lack of memory cue in the environment showed to
be a poor predictor of LoS with an odds ratio of .08 and confidence interval of only .46.
Hosmer and Lemeshow tests show that there was not sufficient evidence to suggest that this
model does not fit (²(7)=3.58, p=.83 > .05). These results show that poor coordination
standards are a strong predictor of a LoS, whilst a lack of memory cues are a strong predictor
for RI.
Table 18. Logistic regression risk factors (covariates) and event type (dependent).
Variable Predicted
variable
Significant Beta Direction Odds
Ratio
Confidence
Interval
Failure to
respond to alerts
LoS X
(p=.55)
.71
RI X
(p=.79)
-.34
Unclear position
takeover
LoS X
(p=.63)
-.66
RI X
(p=.50)
1.01
Poor co-
ordination
standards
LoS
(p=.05)
2.79 +ve 16.26 1.01 →
259.88
RI
(p=.05)
-
3.00
-ve .05 .00 →1.01
Pilot controller
communication
LoS X
(p=.61)
-.46
RI X
(p=.44)
.78
Failure to pass
essential traffic
information
LoS X
(p=.30)
.84
RI X
(p=.27)
-
1.32

Poor R/T
phraseology
LoS X
(p=.10)
-
1.30
RI X
(p=.08)
1.47
Lack of memory
cues in the
environment
LoS
(.01)
-
2.48
-ve .08 .02→ .48
RI
(.01)
2.71 +ve 15.05 2.30 → 98.62
The next question asked which stated primary causal errors related to events. A
logit regression was run on stated causal errors (covariates) and event type (dependent
variable). The stated causal errors included memory lapse, mishear of read-back, incomplete
clearances issued, incorrect timing in issuing of clearances, misjudging aircraft, radar and
visual monitoring failure, incorrect assumptions regarding separation, and instructions issued
to the wrong aircraft. Logistic regression showed that at least one stated causal error is a
significant predictor of LoS, (²(8)=30.91, p=.00 < .05), analysis of the variables in the
equation showed that four factors are significant predictors of LoS; incomplete clearances
issued, misjudging aircraft, radar and visual monitoring failures and incorrect assumptions
regarding separation (Table 19). Misjudged aircraft projections shows to be a weak predictor
of LoS with an odds ratio of 8.25 and a large confidence interval. The same can be said for
incorrect assumption regarding separation which shows a small odds ratio of .07 and a small
confidence interval of .76. Following this, it can be said that there are two stated causal errors
that are strong significant predictors of LoS, namely; incomplete clearance issues and radar
and visual monitoring failures. Controllers issuing incomplete clearances are 13.86 times
more likely to incur a LoS and controllers that make incorrect assumptions regarding
separation are 10.59 times more likely to incur a LoS. However, the confidence intervals are
extremely high, indicating that caution is needed in interpreting these odds ratios.
Three out of these four errors are rooted in the interpretation or situation assessments, which,
according to Reason’s representation of human error (figure 3) correlate to knowledge-based
mistakes. It would thus be expected to find that knowledge based mistakes predict these
errors.

Table 19. Logistic regression on causal errors and LoS.
Predictor Significant Beta Direction Odds
Ratio
Confidence
Interval
Incomplete clearances issued
(p=.03)
2.63 +ve 13.86 1.32 → 145.51
Misjudged aircraft projections
(p=.05)
2.11 +ve 8.25 1.02 → 66.54
Radar and visual monitoring
failure
(p=.03)
2.36 +ve 10.59 1.28 → 89.91
Incorrect assumption regarding
separation
(p=.03)
-
2.66
-ve .07 .01 → .77
Logistic regression showed that at least one stated causal error is a significant predictor of RI,
(²(8)=44.70, p=.00 < .05), and analysis of the variables in the equation showed that only two
causal factors; incomplete clearance issues and radar and visual monitoring failures are
significant predictors of RI (Table20). The odds ratios and confidence intervals show that
neither incomplete clearance issues nor radar and visual monitoring failures are strong
predictors of RI. The confidence intervals of only .42 and .70 respectively indicate that one
can be fairly confident about the accuracy of the odds ratios. This leads to the conclusion that
there are no causal errors that boast strong prediction of RI.
Table 20. Logistic regression on causal errors and RI.
Predictor Significant Beta Direction Odds Ratio Confidence Interval
Incomplete clearance
issues
(p=.02)
-5.23 -ve .01 .00 →.42
Radar and visual
monitoring failures
(p=.02)
-3.80 -ve .02 .00 → .70

The results for the analysis with respect to safety events are summarised in Table 21. This
constitutes the ‘first step’ in the analysis, whereby the factors are investigated in terms of
their relation to safety events.
Table 21. Summary of findings from ‘step one’.
4.4. Human Error
The next question asked which human errors are related to human factors. The
same 9 human factors that were used in the first stage (information processing cluster,
situation awareness cluster, attention cluster, workload cluster, memory cluster, human
machine interface cluster, mental alertness, mental models and the decision making cluster)
were entered into a cluster analysis with the human error types (knowledge based mistakes,
rule based mistakes, lapses and slips). The agglomeration scale (Table 22) showed the first
largest break around stage 4 or 5, suggesting that 3 or 4 clusters best explained the data. The
Dendrogram showed knowledge based mistakes clustered with attention and decision
making, rule based mistakes clustered with lapses and human-machine interface, and slips
clustered with mental models and memory. The three chosen clusters were thus (a)
knowledge based mistakes, attention and decision making, (b) rule based mistakes, lapses and
human-machine interface, (c) mental models, memory and mental alertness and (d) situation
awareness, workload and information processing.
Safety event type Predictor Predictor type
RI Time since start of shift
Interpretation errors
Shift event
Human Factor
Lack of memory cues Risk Factor
LoS Time since start of shift
Auditory detection errors
Shift event
Human Factor
Poor workplace design External Factor
Poor coordination standards Risk Factor
Incomplete clearance issues
Radar and visual monitoring
Causal error
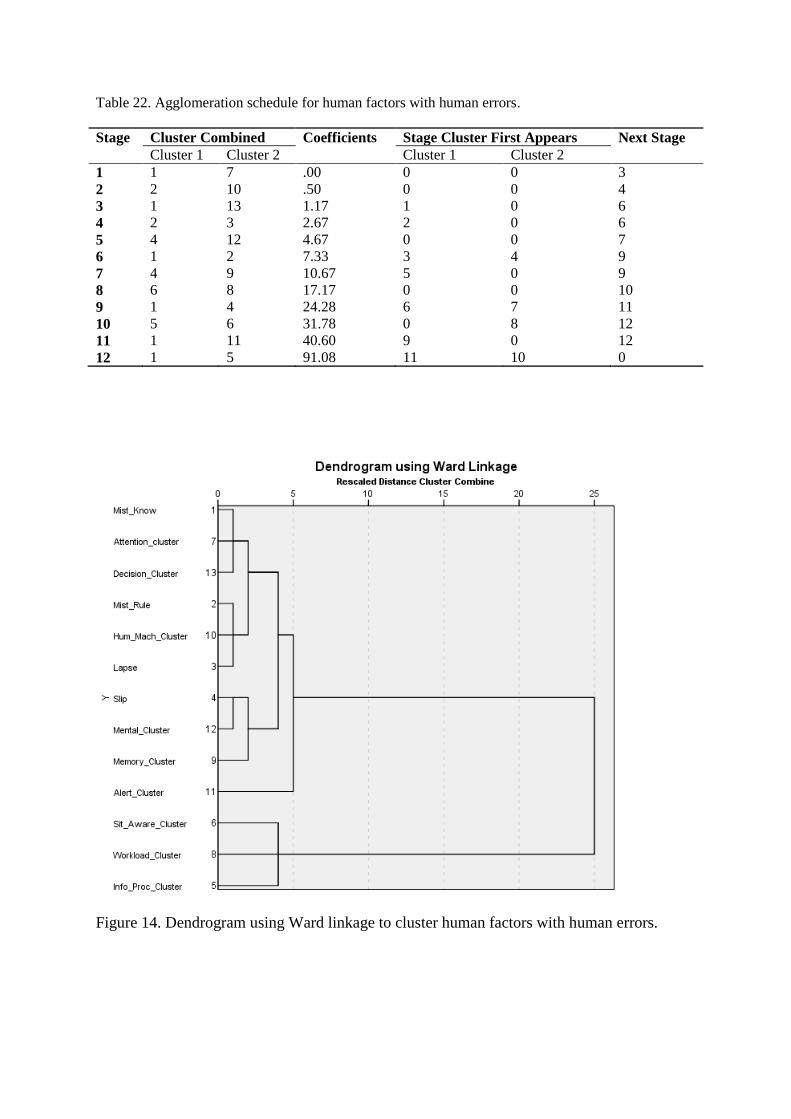
Table 22. Agglomeration schedule for human factors with human errors.
Figure 14. Dendrogram using Ward linkage to cluster human factors with human errors.
Stage Cluster Combined Coefficients Stage Cluster First Appears Next Stage
Cluster 1 Cluster 2 Cluster 1 Cluster 2
1 1 7 .00 0 0 3
2 2 10 .50 0 0 4
3 1 13 1.17 1 0 6
4 2 3 2.67 2 0 6
5 4 12 4.67 0 0 7
6 1 2 7.33 3 4 9
7 4 9 10.67 5 0 9
8 6 8 17.17 0 0 10
9 1 4 24.28 6 7 11
10 5 6 31.78 0 8 12
11 1 11 40.60 9 0 12
12 1 5 91.08 11 10 0

Logistic regression showed that there was insufficient evidence to suggest that knowledge
based mistakes predicted errors in attention (²(1)=.00 , p=.99 > .05) or decision-making
(²(1)=.101, p=.75 > .05). Further logistic regression analyses showed that there was
insufficient evidence to suggest that rule based mistakes predict human machine interface
errors at the 5% level of significance (²(1)=1.03, p=.31 > .05) nor do lapses (²(1)=.14, p=.71
> .05). Lastly, logit regression showed that there was insufficient evidence to suggest that
slips predict errors in mental models (²(1)=.35, p=.55 > .05) or memory (²(1)=.01, p=.94 >
.05) at the 5% level of significance.
When the components of information processing (detection of information, interpretation,
visual and auditory errors) were entered into logistic regressions with the four primary error
types (knowledge and rule based mistakes, slips and lapses) it was shown that lapses are
predictors of both interpretation errors (²(1)=6.193, p=.013) and auditory detection errors
(²(1)=9.79, p=.00 > .05). The odds ratios and Beta values (Table 23) showed controllers who
experience lapses are 8.15 times more likely to experience auditory detection errors and 7.5
times more likely to incur interpretation errors whilst controlling. Again, however, the
confidence intervals are high indicating that caution should be exercised in interpreting these
results.
Table 23. A summary of the logistic regression on information processing factors and error types.
Variable Predictor Significant Beta Direction Odds
Ratio
Confidence
Interval
Quality of information
received
None X
Interpretation errors Lapse P= .013 2.02 +ve 7.5 1.534 → 36.66
Visual detection errors None X
Auditory detection
errors
Lapse P=.002 2.10 +ve 8.15 2.19 → 30.31
The next question asked which human errors are related to external factors. The four
human error variables were entered separately into a logit regression with the same seven
external factor variables used in the previous analyses (recreational flights in the airspace,
airspace design, complex traffic scenarios, workplace design, distracting phone calls, weather

phenomena and combined sectors). At least one external factor was shown to be a significant
predictor of lapses (²(7)=16.180, p=.024) but no other human errors. When evaluating the
variables in the equation, workplace design was the only significant predictor (²(1)=8.82,
p=.00 < .05). The Beta ( and odds ratio (.09) indicated that organisations
with poor workplace (both physical and staffing) design are only .09 times more likely to
incur lapses in controllers than organisations with adequate workplace design. The odds ratio
and confidence interval of .42 show that workplace design is not a strong predictor of lapses.
The Hosmer and Lemeshow test showed that there was insufficient evidence to suggest that
the model does not fit (²(8)=3.78, p=.88 > .05). When the components of workplace design
(physical setting and staffing procedures) were entered into a regression it was found again
that physical workplace design was the only significant predictor of lapses (²(1)=18.11,
p=.00 < .05). The Beta ( and odds ratio of 18.53 showed that poor workplace
designs are strong predictor of lapses. The confidence interval (4.54 → 75.64) is large,
indicating that caution should be exercised in interpreting the results.
Cross tabulation showed that 34.5 % of recorded poor workplace designs occurred within
combined aerodrome and approach sectors, followed by 17.2% in Radar West and East
combined. They also showed that 46.4% of reported poor workplace designs occurred in
International Airport X, followed by 14.3% at International Airport Y.
The following question asked which human errors predict safety events. When
clustering event type (LoS and RI) with error types (knowledge and rule based mistakes, slips
and lapses), the squared Euclidean distance showed that only one cluster should be used but
it is interesting to note that lapses, rule based mistakes and knowledge based mistakes
clustered with RI, whilst LoS clustered with slips. The Euclidean distance past the second
stage (d= 20.67) was above the recommended level of 9.00.
When a logit regression was run on event type and the four error types there was sufficient
evidence to suggest that one of the error types is a predictor safety events (²(4)=19.48, p=.00
< .05) (Table 24). Lapses were reported as a significant predictor of safety events
(²(1)=16.97, p=.00 < .05). Controllers who have lapses are 21.56 times more likely to cause a
safety event. However, the confidence interval is high and therefore caution needs to be
exercised in interpreting this result.

Figure 15. Dendrogram using Ward linkage to cluster human errors with LoS and RI.
Table 24. A summary of the logistic regression on event type (dependent variable) and error types
(covariates).
Predictor Significant Beta Direction Odds Ratio Confidence Interval
Lapse
(p=.00)
3.07 +ve 21.56 5.00 → 92.95
Rule based
mistakes
X
(p=.12
1.69 +ve 5.40 .66 → 44.02
Knowledge
based mistakes
X
(p=.97)
.03 +ve 1.03 .20 → 5.22
Slip X
(p=.13)
1.21 +ve 3.37 .69 → 16.37

Logistic regression run on the human error types (covariates) and LoS (dependent variable)
and RI (dependent variable) respectively, there is sufficient evidence to suggest that at least
one of the covariates is a predictor of both LoS (²(4)=18.09, p=.00 < .05) and RI (²(4)=19.48,
p=.00 < .05). Analyses of the variables in the equation show that lapses predict both LoS and
RI. Controllers experiencing lapses are 17.73 times more likely to incur a LoS. The odds ratio
(.05) shows that lapses are not strong predictors of RI.
Table 25. Logistic regression with lapses (covariates) and safety events (dependent variable).
The next question concerned which human errors are related to the stated causal
errors. A logit regression was run on human errors (covariates) and stated causal errors
(dependent variable). Stated causal errors included memory lapse, mishear of read-back,
incomplete clearances issued, incorrect timing in issuing of clearances, misjudging aircraft,
radar and visual monitoring failure, incorrect assumptions regarding separation, and
instructions issued to the wrong aircraft. Logistic regression revealed that rule based mistakes
are predictors of assumption, with individuals displaying rule based mistakes 2.5 times more
likely to make assumptions regarding separation. Slips are shown to predict radar and visual
monitoring failures, misjudging aircraft projection, incorrect timing of clearances and
memory lapses. A slip is 2.77 times more likely to lead to incorrect assumptions regarding
separation, 2.85 times more likely to lead to misjudging aircraft positions, 7.58 times more
likely to lead to incorrect timing in issuing clearances and 2.61 times more likely to incur a
memory lapse. Knowledge based mistakes were reported as a predictor of visual and
monitoring failures, although the odds ratio of .15 shows that this is a weak prediction.
Knowledge based mistakes were shown to predict incomplete clearance issues and mishear of
read-back. The analyses show that knowledge based mistakes are 5.96 times more likely to
Predictor Significant Beta Direction Odds
Ratio
Confidence
Interval
Lapse LoS
(p=.00)
2.88 +ve 17.73 4.23 → 73.14
RI
(p=.00)
-3.07 -ve .05 .01 → .20

be associated with incomplete clearances and 4.74 times more likely to be associated with
mishearing read-back.
Table 26. A summary of the logistic regression on causal errors and human errors.
Covariates Predictor Significant B
(direction)
Odds
Ratio
Confidence
Interval
Assumption Rule-based
mistakes
(p= .05) .91 2.49 1.01 → 6.15
Radar and visual
monitoring failure
Slips
Knowledge-based
mistakes
(p= .02)
(p= .01)
1.01
-1.88
2.77
.15
1.15 → 6.67
.04 → .58
Incomplete
clearances issued
Knowledge-based
mistakes
(p= .00) 1.78 5.96 1.78 → 19.95
Misjudging aircraft Slip
(p=.02) 1.05 2.85 1.18 → 6.84
Incorrect timing in
clearance issue Slip
(p=.00) 2.02 7.57 2.79 → 20.56
Mishear Read-back Knowledge based
mistake
(p=.01) 1.56 4.74 1.46 → 15.35
Memory lapse Slip
(p=.04) .96 2.61 1.03 → 6.60
4.4. Summary of results
The findings can be consolidated by summarizing significant findings under each broad
research question. It was found that time since start of shift is a significant predictor of safety
events. Furthermore, time frames 0-30 minutes and 91 – 151 minutes were the most
frequently occurring time of the safety events. In terms of safety events, it was found that
information processing (human factors), workplace design (external factors), poor adherence
to communication standards and lack of memory cues (risk factors) are significant predictors
of safety events. With respect to human error, lapses were found to predict two components
of information processing; detection and auditory errors. Poor workplace design was found to
be a significant predictor of lapses. The causal errors found to be significant predictors of
safety events. These findings are summarized in Table 27, with the text in blue demonstrating
the findings from step two; the core factors in relation to human error.
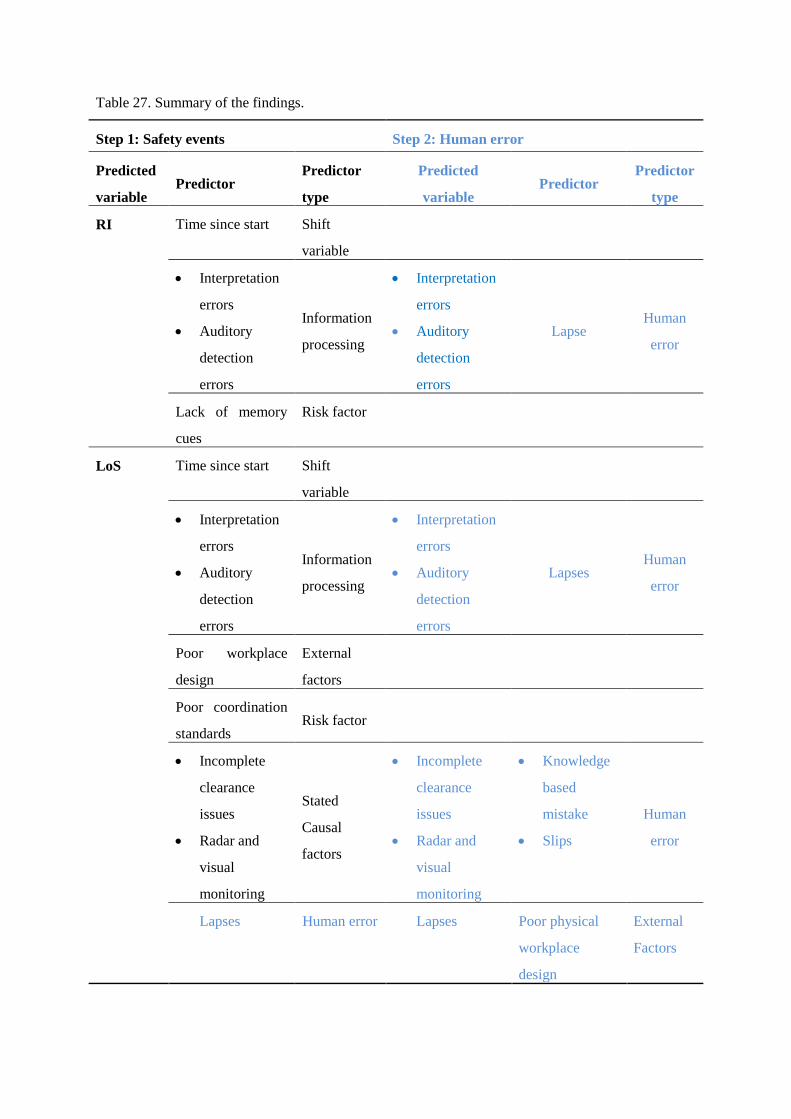
Table 27. Summary of the findings.
Step 1: Safety events Step 2: Human error
Predicted
variable Predictor
Predictor
type
Predicted
variable Predictor
Predictor
type
RI Time since start Shift
variable
Interpretation
errors
Auditory
detection
errors
Information
processing
Interpretation
errors
Auditory
detection
errors
Lapse Human
error
Lack of memory
cues
Risk factor
LoS Time since start Shift
variable
Interpretation
errors
Auditory
detection
errors
Information
processing
Interpretation
errors
Auditory
detection
errors
Lapses Human
error
Poor workplace
design
External
factors
Poor coordination
standards Risk factor
Incomplete
clearance
issues
Radar and
visual
monitoring
Stated
Causal
factors
Incomplete
clearance
issues
Radar and
visual
monitoring
Knowledge
based
mistake
Slips
Human
error
Lapses Human error Lapses Poor physical
workplace
design
External
Factors

CHAPTER 5: DISCUSSION
The majority of the research in this field has been conducted in simulators (Eurocontrol,
2002, Zhang, Kaber, & Hsiang, 2009), focused on individual aspects of ATC and human
error (Moon, Yoo, & Choi, 2011; Shorrock, 2005, Shorrock & Isaac, 2010) and aimed at
developing a tool that identifies human error (Shorrock & Kirwan, 2002; Eurocontrol, 2004).
As discussed in the theoretical background, there are a number of cognitive tasks and human
factors that controllers bring to ATC, which are influenced by external factors, processing
factors and a number of differrent elements. This research set out to identify the key aspects
at the root of safety events and errors in ATC. It considered a number of variables that were
deemed pertinent to processes in ATC. These included demographics, shift and event
variables, human factors, external factors and risk factors.
This discussion will evaluate the results under each research question in order to gain insight
into the various factors underlying errors in ATC. Firstly, the shift, event and demographic
variables are evaluated. This is followed by a discussion of the findings with respect to safety
events followed by an evaluation of the findings with respect to human error. Finally, all of
the conclusions and findings are consolidated and brought together to demonstrate their
applicability to the bigger picture.
5.1. Shift, event and demographic variables.
The first research question asked whether there are particular times in shifts
when safety events are likely to occur. The most common occurring reported time since
start of a shift was 30 minutes, 123 minutes and 319 minutes into the shift. The most frequent
time since the last break was 20 minutes and the most frequent occurring time since position
takeover was 32 minutes. These frequencies do not allow for viable conclusions regarding
times in controller shifts when events are most likely to occur.
When grouped into shift times, results showed that 59% of the safety events occurred in the
first shift (8:00 – 15:00 UTC). This shows that the first shift which occurs from 6:00 – 13:00
in South African time is the shift in which most safety events occur. When the data is
grouped into time periods of an hour, the most frequent occurring time is 12:01 – 13:00 UTC,
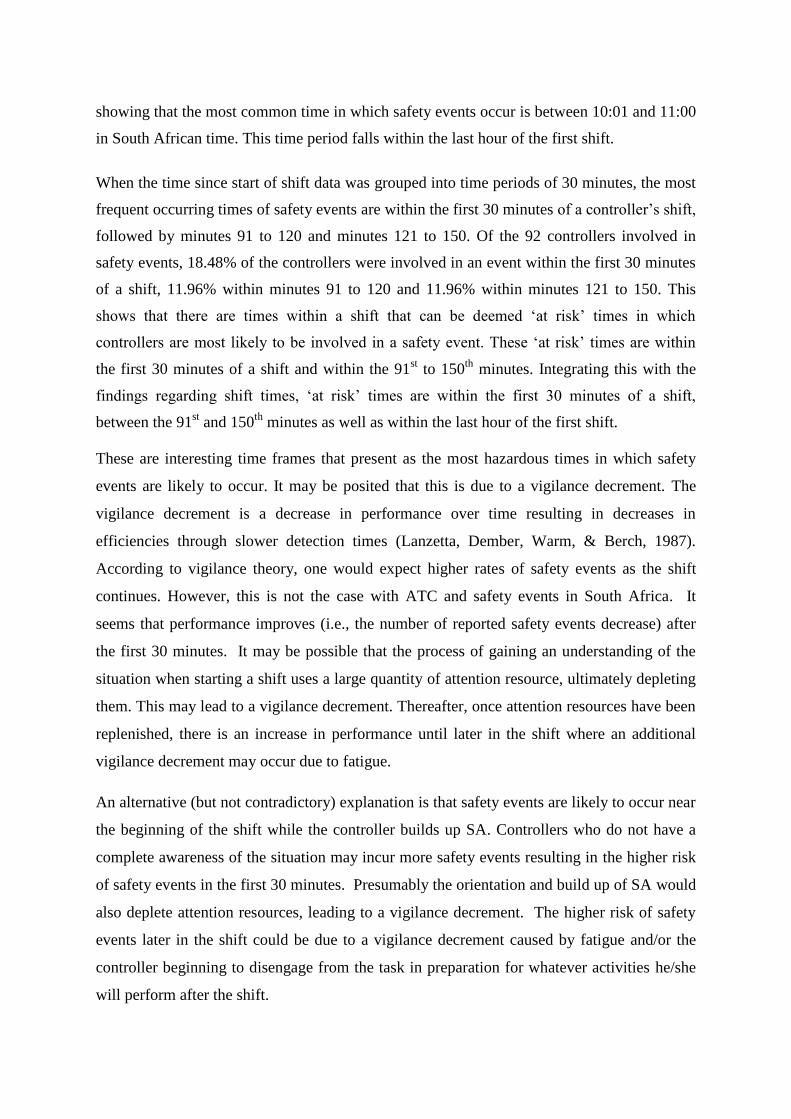
showing that the most common time in which safety events occur is between 10:01 and 11:00
in South African time. This time period falls within the last hour of the first shift.
When the time since start of shift data was grouped into time periods of 30 minutes, the most
frequent occurring times of safety events are within the first 30 minutes of a controller’s shift,
followed by minutes 91 to 120 and minutes 121 to 150. Of the 92 controllers involved in
safety events, 18.48% of the controllers were involved in an event within the first 30 minutes
of a shift, 11.96% within minutes 91 to 120 and 11.96% within minutes 121 to 150. This
shows that there are times within a shift that can be deemed ‘at risk’ times in which
controllers are most likely to be involved in a safety event. These ‘at risk’ times are within
the first 30 minutes of a shift and within the 91st to 150
th minutes. Integrating this with the
findings regarding shift times, ‘at risk’ times are within the first 30 minutes of a shift,
between the 91st and 150
th minutes as well as within the last hour of the first shift.
These are interesting time frames that present as the most hazardous times in which safety
events are likely to occur. It may be posited that this is due to a vigilance decrement. The
vigilance decrement is a decrease in performance over time resulting in decreases in
efficiencies through slower detection times (Lanzetta, Dember, Warm, & Berch, 1987).
According to vigilance theory, one would expect higher rates of safety events as the shift
continues. However, this is not the case with ATC and safety events in South Africa. It
seems that performance improves (i.e., the number of reported safety events decrease) after
the first 30 minutes. It may be possible that the process of gaining an understanding of the
situation when starting a shift uses a large quantity of attention resource, ultimately depleting
them. This may lead to a vigilance decrement. Thereafter, once attention resources have been
replenished, there is an increase in performance until later in the shift where an additional
vigilance decrement may occur due to fatigue.
An alternative (but not contradictory) explanation is that safety events are likely to occur near
the beginning of the shift while the controller builds up SA. Controllers who do not have a
complete awareness of the situation may incur more safety events resulting in the higher risk
of safety events in the first 30 minutes. Presumably the orientation and build up of SA would
also deplete attention resources, leading to a vigilance decrement. The higher risk of safety
events later in the shift could be due to a vigilance decrement caused by fatigue and/or the
controller beginning to disengage from the task in preparation for whatever activities he/she
will perform after the shift.

The regression analysis showed that time since start was a significant predictor of both LoS
and RI. These findings suggest that there are particular times in a shift in which controllers
are most likely at risk of being involved in a safety event; namely, within the first 30 minutes
of a controller’s shift and between the 91st and 150
th minutes of a controllers shift. These
frequencies support the claim made by ANSP that safety events occur within the first 30
minutes of a shift, but show that this is not the only at risk time of a controller’s shift. Sawin
and Scerbo (1995) posit that a decrease in performance most commonly occurs after the first
20 to 35 minutes. ANSP posited that most safety events occur within the first 20 to 35
minutes of a shift. This claim is supported by the evaluation of the data frequencies. The
events may be occuring within the first 30 minutes of a shift due to vigilance decrement. The
analysis of frequencies alone cannot establish vigilince decrement but rather posit it as a
possible reason for this occurence. Again, one would expect higher rates of safety events
occuring throughout the shift. This is not the case. Instead, the performance improves after
the forst thirty minutes and decreases again over the 91st to 150
th minutes.
When grouping time since position take over into time frames of 30 minutes, the first 30
minutes of a position takeover is the most frequent occurring time (f=23), followed by
minutes 31 to 60 minutes (f=10). Again, this supports ANSP’s claim that events occur within
the first 30 minutes of a position takeover. Although this supports ANSP’s claims, time since
position takeover was not found to be a significant predictor of safety events. This was the
case for all shift variables apart from time since start of shift. Following this, time since
position takeover, time since last break, duration of last break, last 30 minutes of a shift, time
since last sign off and days since last off day are not significant predictors of safety events.
This implies that time since start of a shift is the only significant variable when considering
the time frame of a controller’s shift in which safety events are most likely to occur. Joining
this finding with the time of day broken into shifts, the most at risk times are in the first shift
(8:00 – 15:00 UTC), within the first thirty minutes of any shift and within minutes 91 – 150
of any shift.
Time since the start of a shift was the only significant predictor of events and is represented
graphically in figure 16. It is noted that the arrow shows the direction of prediction and not
causality.

Figure 16. A graphic representation of the relationship between shift variables and safety
events.
The second research question asked which event variables and demographic
variables are common between events. Of the 93 controllers investigated, 77.4% were male
and 22.6% were female. The most common occurring English proficiency was level 6 with
only one controller reported at level 4. The most common occurring airport in South Africa at
which the events occurred was International Airport X with the next highest at International
Airport Y. International Airport X clocked 200 000 aircraft movements in the 2012/2013
financial year whilst all other regional airports together clocked around 190 000 (Airports
Company South Africa, 2014). International Airport X is the busiest airport in South Africa
and so it is expected that more events would occur there as there are more aircraft moving
through the airspace. Statistically, an airport dealing with more aircraft volumes would incur
more safety events than an airport with smaller aircraft volumes.
The range of movements through the different airports highlights the differing workloads
undertaken by controllers at different airports. Workload is a function of the task demands
placed on an operator as well as the capacity of the operator to meet those demands (Hopkin,
1995 as cited in Loft, Sanderson, Neal, & Mooij, 2007). The higher the demands, the more
capacity is needed by controllers to meet those demands. Airports with more aircraft
movements place higher demands on controllers and ultimately place more demands on
controllers. Recall that increases in air traffic density and complexity substantially increase
the demands on controller’s mental workload (Wickens et al., 1997). Furthermore, workload
is influenced by traffic volume and complexity (Moon et al., 2011) and high workloads can
lower performance (Wickens et al., 1997). Increases in workload caused by higher traffic
Shift variable: Time
since start of shift
within the first 30
minutes & between
91st and 150
th
minutes
EventsSafety
Events

volumes and traffic complexity decrease performance and ultimately increase the probability
of the occurrence of errors. The traffic volumes for airports considered in this research differ
significantly and these traffic volumes ultimately affect the workload experienced by
controllers.
The most commonly occurring sector for safety events occurred when aerodrome and
approach sectors were combined, followed by approach, and finally radar west and east
combined. It is important to note here that two of the three sectors reported with the highest
levels of safety events are combined sectors. Recall that SACAA sets a maximum capacity at
30 movements per hour, but 22 of the 44 reported movements per hour (50%) that involved
safety events were above 30 movements per hour. Cross tabulation showed that 36% of the
occurrences of more than 30 movements per hour occurred in combined sectors. As stated
before, sector combinations are based on expected traffic volumes. Occasionally the volumes
are underestimated and sectors are combined when traffic loading exceeds maximum
capacities. It has been suggested by investigating officers that the quality of ATC services
deteriorate when traffic loading increases above quiet. This is not to say that the quality of the
service is below adequate, but rather that the quality of the service is diminished somewhat
when the quantity of traffic loading increases. This would suggest that an increase in traffic
load results in a lower quality of ATC service. This could be linked to an increase in
workload which can lead to a decrease in performance. In this case, the performance concerns
the quality of ATC services. The evidence from the analyses would lend support to this
claim as half of the reported movements per hour when safety events were above the
maximum capacity and two of the three sectors reported with the highest levels of safety
events were combined sectors.
5.2. Safety events
The first part of the next research question (research question 3) asked which
human factors are associated with safety events. The results of the cluster analysis showed
that mental models were associated with safety events but the logistic regression revealed that
erroneous mental models are not significant predictors of safety events. Logistic regression
showed that information processing was the only significant human factor that predicted
safety events. Mental models are the mechanisms whereby humans are able to generate
descriptions of the purpose of systems, explanations of system functioning as well as both
observed system states and predictions about future system states (Rouse & Morris, 1986, as
cited by Zang, Kaber & Hsiang, 2009, p.2).The result that mental models are not significant
predictors of safety events is an interesting one as literature alludes to mental models as
existing at the core of ATC. Here we see some overlap between concepts as parts of mental
models can be seen as coinciding with information processing. Mental models require the
observation of system states as well as predictions about future system states. The
observation of system states show commonalities with the perceptual encoding of
information processing. Mental models may have been found non-significant as errors in
ATC in South Africa occur in the information processing stages which filter in and inform
the mental model.
The information processing cluster included the quality of information received by the
controller, controller interpretation of the information as well as errors in the detection of
visual and auditory cues. Linking these factors back to the information processing model
(figure 5), it can be seen that the information received by the controller is categorised under
sensory register which lies in the encoding stage of information processing. Errors in the
detection of auditory and visual cues refer to the actual perceptual encoding and ‘perception’
stage of information processing. Controller interpretation of information falls under the
central processing stage. Logistic regression showed that interpretation errors and auditory
detection errors are strong predictors of both RI and LoS. Following the model of information
processing established in the literature review and the results it can be seen that errors in the
perceptual encoding stages (errors in auditory detection) and central processing stages (errors
in interpretation) are of the most significance to controllers in South Africa.
Errors in the detection of auditory cues show that safety events are predicted by errors in the
perceptual encoding of information. Perceptual encoding is the “process by which the five
senses translate environmental stimulation into mental representation” (von Hippel, Jonides,
Hilton, & Narayam, 1993, p. 921). Recall that controllers rely on both radar displays, visual
views of runways and radio telephony, showing that the environmental stimuli that
controllers have to encode are both visual and auditory. From the results, it can be seen that
safety events are predicted by a breakdown in the process by which controllers translate
auditory environment stimuli into mental representation. Auditory environment stimuli
include verbal radio interactions between controllers, controllers and pilots as well as
warning signals from the STCA. Controllers may be displaying a breakdown in encoding
communications with other controllers or pilots or in their response to STCA alerts. There
have been a number of complaints regarding false STCA alarms going off. If the STCA

system has given a number of false alerts, controllers may not treat alerts from the STCA
with as much attention as they should as they may be primed to think it is another false alert.
A definitive conclusion cannot be drawn regarding the phase of perceptual encoding in which
the errors are occurring. However, since controllers are medically cleared, it can be assumed
that controllers are medically fit and their hearing is of a standard deemed fit for operation.
This would imply that the auditory detection errors are occurring at the ‘perception’ stage
during which meaning is added to information received. This is done by comparing it to
permanent information brought forward by long term memory (Wickens, Gordon, & Liu,
1998).
Recall that schemata play a vital role in information processing in that they shape what we
see and hear as well as how we store information and access that information at a later stage
(von Hippel, Jonides, Hilton, & Narayam, 1993). Schematic processing could possibly inhibit
perceptual encoding in that schema guide interpretation and selective attention. Individuals
lacking adequate schema must rely on an effortful integration of information (von Hippel,
Jonides, Hilton, & Narayam, 1993). Attentional resources direct perception (figure 5), which
directs and informs response execution plans. If controllers are displaying errors in the
perceptual stage of information processing, this may be due to a number of issues related to
perceptual encoding. If attentional resources direct perception and the controllers are showing
errors in perception, then the error may be traced back to the allocation of attention resources.
Controller schemata may inhibit the allocation of attention resources, resulting in the
controller missing crucial information.
The regression analysis showed that controllers displaying errors in auditory detection are
33.5 times more likely to be involved in a LoS than a controller displaying adequate auditory
detection and 46 times more likely to incur a RI. The confidence interval showed that these
controllers are at least 2.63 times more likely and at most 409 times more likely to cause a
LoS and at least 5.17 times more likely to incur a RI. These substantially large confidence
intervals indicate a highly possible overestimation related to the small number of
observations for auditory detection as an explanatory variable (Nemes, Jonasson, Genell &
Steineck, 2009). This indicates that caution should be exercised when interpreting the odds
ratios and although a predictor, it cannot be confidently concluded thaterrors in auditory
detection in controllers are a significant predictorof safety events. Although caution must be

exercised, future studies and interventions may focus on the impact of errors in auditory
detection on ATCO performance.
Error in the interpretation of information occurs in the central processing stage and shows
that safety events are also predicted by a breakdown in the central processing of controllers.
The central processing stage involves decision making processes (figure 5). From an
information processing perspective, decision making represents a mapping of copious
information received to one or few responses (Wickens & Hollands, 2000). It can be posited
that an error in perceptual encoding may lead to an error in decision making. When there is
an error or inadequacy in the information received this may lead to the mapping of
inadequate information. According to the information processing approach to decision
making, selective attention, working memory and long term memory are critical components
of decision making. It has already been shown that errors in selective attention may lead to
the incorrect allocation of resources, and by extension to inadequate perceptual encoding.
Decision making involves cue reception and integration, hypothesis generation, hypothesis
evaluation and selection, and the selection and generation of actions (Wickens & Hollands,
2000). An error in the cue reception and integration impacts hypothesis generation,
evaluation and selection. The errors in central processing stage may stem from errors in the
perceptual encoding stage. This conjecture is supported by the evaluation of the cognitive
limitations that limit decision making. These include the amount or quality of the information
cue, the attentional resources allocated to the activity, the amount or quality of the
individual’s knowledge of the situation, an individual’s ability to retrieve relevant
information or hypotheses and lastly an individual’s working memory capacities (Reason,
1990).
Recall that schemata play a vital role in information processing in that they shape what we
see and hear as well as how we store and acces information (von Hippel et al., 1993). A
perceiver relies on prior conceptualizations in order to understand specific instances and
current circumstances. This facilitates the interpretation of incoming information. If, as
previously mentioned, certain stimuli such as the STCA alerts have falsely gone off, a
controller may be inclined not intepret incoming information based in prior
conceptualisations of false alerts. The false alerts may facilitate inadequate schema. If the
schema is inadequate, the controller may devote attentional resources to relevant information
while ignoring information the controller deems irrelevant (such as STCA alerts) which in
actual fact may be relevant.

The supposition that erroneous central processing is initiated at the perceptual encoding stage
is supported by the decision making and SA model (figure 7). The model shows that from
goal to action, a controller must perceive, understand and think ahead. Errors in perceiving
and understanding will impact the way in which controllers think ahead, distorting the path
from goal to action. The regression showed that auditory and visual interpretation errors in
controllers are 46 times more likely to incur a RI than correct interpretation processes and
6.53 times more likely to incur a LoS. The confidence intervals and odds ratios show that
controller interpretation errors are a stronger predictor of RI than LoS but may indicate
overestimation in the logistic regression. . Although it’s impact may potentially be
overestimated, future studies mayexamine the role of interpretation errors and decision
making in the human errors in ATC in South Africa.
It can be said that although most of the human factors variables were regarded as
insignificant predictors of safety events in the logistic regressions, some of them essentially
filter into the information processing model. Information processing encapsulates memory,
attention resources, perception and sensory registration. In terms of information processing,
it can be concluded that errors occur at the perceptual encoding and central processing stages.
These stages utilize cognitive processes such as memory, attention and decision making. It
can thus be said that these human factors are, by extension, related to safety events caused by
controllers. This finding can be added to the findings for shift variables and represented
graphically in figure 17, with the arrows denoting the direction of prediction.
Figure 17. A graphic representation of the findings thus far.
Shift variable: Time
since start of shift
within the first 30
minutes & between
91st and 150
th minutes
Safety
Human factors:
Information Processing
Interpretation errors
Auditory detection errors
The next part investigated which external factors are related to safety events. Cluster
analysis clustered poor workplace design with combined sectors and RI, but not with LoS.
Logistic regression showed that poor workplace design was a significant predictor of both
LoS and RI whilst the direction of the regressions suggested that airports with poor
organisational design are 7.8 times more likely to incur a LoS. The odds ratio shows that poor
workplace designs are 9.95 times more likely to incur RI than adequate workplace designs.
Poor workplace design incorporated the physical design of the workplace as well as the
staffing design. Logistic regression showed that poor physical workplace design is a predictor
of both LoS and RI whilst the staffing design was not a significant predictor of either. The
analysis showed that poor physical workplace designs are 7.27 times more likely to incur a
LoS than adequate physical setups, and 7.2 times more likely to incur a RI. Both predictions
(for LoS and RI) showed significant confidence intervals, suggesting that poor physical
workplace design is a strong predictor of safety events.
The physical setup and design of the workplace and controlling area is a predictor of RI and
LoS events. This is intuitively sound as many of the poor designs hinder procedures such as
runway visual scans, which are essential in preventing runway incursions. Controllers who
are hindered to some degree by the workplace design may execute improper scanning and
visual procedures, resulting in runway incursions. ATC terminal staff depend on radar was
well as a visual view of the runways in order to issue control instructions that provide
adequate separations. Workplace designs that hinder visual monitoring of the runways may
result in inaccurate control instructions that provide less than adequate separations.
The ergonomics of the control facilities and workplace set up can be noted as a significant
predictor of safety events and can direct future research. Anthropometrics is a factor of
ergonomics and is concerned with the matching of the physical demands of the working task
to the workplace (among others) (Pheasant & Haslegrave, 2006). The anthropometrics of the
workstations at which the controllers are expected to perform physical tasks such as runway
scans and visual monitoring should be explored in order to maximise the ease with which
controllers can perform the physical tasks required of them.

Figure 18. A graphic representation of the relationship between shift variables, human factors
and external factors with safety events.
The next part asked which risk factors are related to safety events. Recall that risk
factors included failure to respond to alerts, unclear position takeover, poor co-ordination
standards, pilot-controller communication, failure to pass essential traffic information to
aircraft, poor R/T phraseology use and lack of memory cues in the environment. Logistic
regression showed that poor adherence to co-ordination standards is a significant predictor of
LoS while a lack of memory cues in the environment is a significant predictor of RI. Poor
adherence to co-ordination standards between controllers is 16.26 times more likely to incur a
LoS than adherence to co-ordination standards. It is noted that caution should be exercised
when interpreting this result due to possible overestimation. Poor adherence to co-ordination
standards between controllers only renders controllers .05 times more likely to incur a RI
than adherence to coordination standards (showing weak prediction for LoS). This is
logically sound as RIs occur on runways that are governed by one unit of controllers. RIs
usually involve one controller allowing an aircraft or vehicle access to a runway that is
already occupied. This does not entail coordination between controllers as only one controller
is responsible for the runway at a time.
Shift variable: Time
since start of shift
within the first 30
minutes & between
91st and 150
th
minutes
Safety Events
Human factors: Information
Processing
Interpretation errors
Auditory detection errors
External factors: Poor
Workplace Design
Poor physical work
station designs

A LoS involves an infringement of both horizontal and vertical separation minima in
controlled airspace (International Civil Aviation Organization, 2013) and by extension, can
only occur when an aircraft is in the air. Recall that the three ATC facilities control different
areas and heights, essentially splitting airspace between different ATC facilities. As aircraft
pass through airspace they are handed over to the controllers responsible for that airspace.
These facilities are in constant communication with each other as they hand aircraft over
from one area to the next. This involves efficient coordination and communication between
the control areas. It is logical that poor adherence to co-ordination standards effects LoS
more significantly than RIs as LoSs occur in airspaces that are controlled by different ATC
facilities.
Co-ordination is defined as the “organisation of the different elements of a complex body or
activity so as to enable them to work together effectively” (Pearsall, 2005, p. 210).
Following this, the controllers can be seen as the different elements of the complex system of
ATC and without their organisation, they are unable to work effectively, resulting in safety
events. Adherence to coordination standards must be investigated when looking to reduce
incidences of LoS.
A lack of memory cues at the workstation refers to controller failure to update or move FPS
to represent aircraft movements. The lack of memory cues at a station is 15.05 times more
likely to incur a RI than at a station with memory cues. Memory cues serve to remind
controllers of the various aircraft movements in their sector. Without the FPS to serve as a
reminder, a controller is at least 2.3 times more likely to incur a RI and at most 98.62 times
more likely. This is a significant confidence interval, once again demonstrating the possibility
of overestimation due to the small number of observations of explanatory variables (Nemes,
Jonasson, Genell & Steineck, 2009). Discretion must be used when interpreting the strengths
of predition with respect to lack of memory cues. Controller work with FPS and FPB should
be of a standard by which strips are moved to correspond to all movements in the controller’s
sector. These findings can be viewed in conjunction with the previous findings to see the
progress thus far (figure 19).
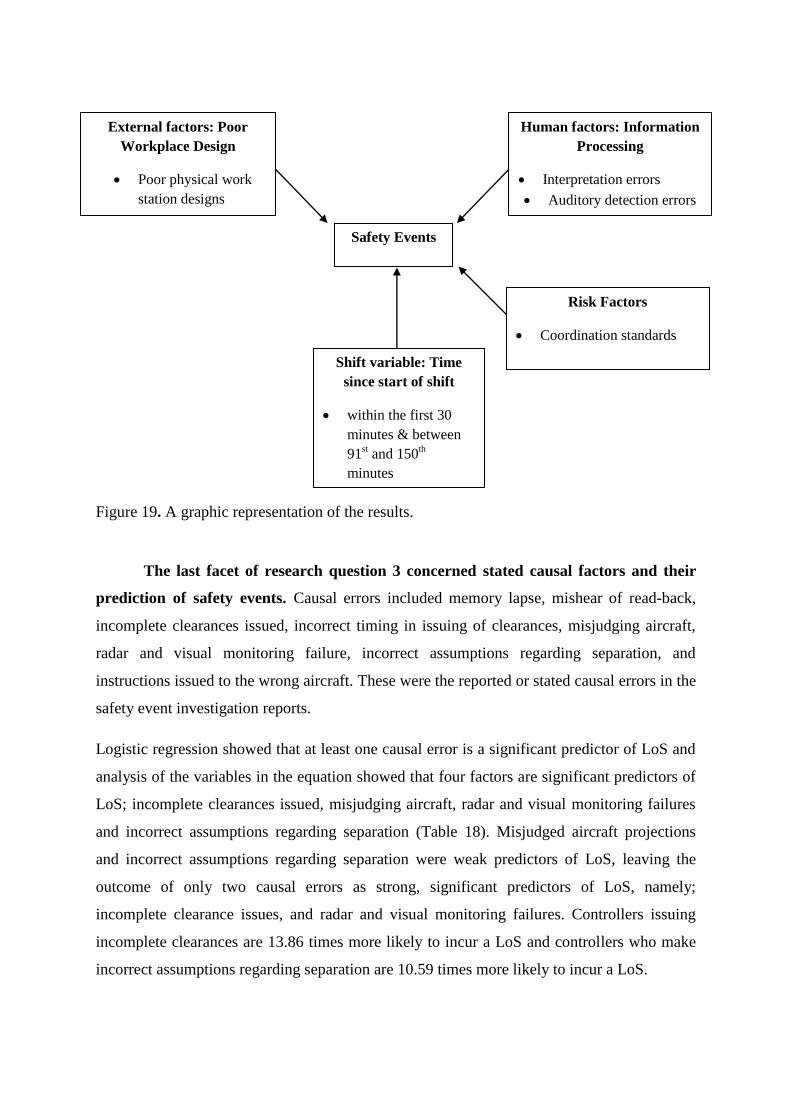
Figure 19. A graphic representation of the results.
The last facet of research question 3 concerned stated causal factors and their
prediction of safety events. Causal errors included memory lapse, mishear of read-back,
incomplete clearances issued, incorrect timing in issuing of clearances, misjudging aircraft,
radar and visual monitoring failure, incorrect assumptions regarding separation, and
instructions issued to the wrong aircraft. These were the reported or stated causal errors in the
safety event investigation reports.
Logistic regression showed that at least one causal error is a significant predictor of LoS and
analysis of the variables in the equation showed that four factors are significant predictors of
LoS; incomplete clearances issued, misjudging aircraft, radar and visual monitoring failures
and incorrect assumptions regarding separation (Table 18). Misjudged aircraft projections
and incorrect assumptions regarding separation were weak predictors of LoS, leaving the
outcome of only two causal errors as strong, significant predictors of LoS, namely;
incomplete clearance issues, and radar and visual monitoring failures. Controllers issuing
incomplete clearances are 13.86 times more likely to incur a LoS and controllers who make
incorrect assumptions regarding separation are 10.59 times more likely to incur a LoS.
Shift variable: Time
since start of shift
within the first 30
minutes & between
91st and 150
th
minutes
Safety Events
Human factors: Information
Processing
Interpretation errors
Auditory detection errors
External factors: Poor
Workplace Design
Poor physical work
station designs
Risk Factors
Coordination standards
Logistic regression showed that only two causal factors predicted RI; incomplete clearance
issues, and radar and visual monitoring failures. The odds ratios and confidence intervals
showed that neither incomplete clearance issues nor radar and visual monitoring failures are
strong predictors of RI. It is interesting to note that the two events have differing causal error
predictors.
When linking causal errors back to the human errors model (figure 3), it can be seen that a
LoS is predicted by errors in issuing incomplete clearances (in controller plan and action
intention) and radar and visual monitoring failures (situation assessment). Monitoring
situations can be linked back to the interpretation or assessment of situations, which,
according to Reason’s representation of human error (figure 3 on page 17) correlate with
knowledge-based mistakes. This shows that causal errors that predict LoS for controllers in
South Africa lie within their assessment and interpretation of the situation, which in turn is
indicative of knowledge-based mistakes. Incomplete clearance issues are based in erroneous
and inadequate plans which link back to lapses. This is explored further when the links
between causal errors and human errors are established.
Incomplete clearance issues and radar and visual monitoring failures can also be discussed in
terms of which stage of information processing they occur. Radar and visual monitoring
failures are rooted in the perceptual encoding stages of information processing and
incomplete clearance issues are rooted in the response stage of information processing. Recall
that the perceptual encoding stage entails the translation of environmental stimuli into mental
representation through the use of the five senses. The sense that is incurring the error in radar
and visual monitoring failures is sight. Controllers may be displaying problems in the
encoding of visual information. As per the model of human information processing,
perception informs response selection. It is thus logical that an error in perception would feed
into response selection, resulting in erroneous response selections based on erroneous
perception. If this is the case, addressing issues at the perception stage may filter through and
address issues in the response stage.
An alternative explanation can be found in theories of attention. The errors in radar and
visual monitoring could possibly be caused by failures in concentration and the deployment
of attention. Recall that vigilance tasks impose substantial demands on the information
processing resources of the observer (Warm et al., 2008). As previously discussed, it can be
seen that the significant causal factors can be rooted in the stages of information processing.

In particular, these stated causal errors correlate with errors in the perceptual encoding and
response stages. Controlling is a vigilance task and following the research, the workload
placed on operators performaing vigilance intensive tasks drain information processing
resources, leading to lowered vigilance states (Warm et al., 2008). The errors in visual and
radar monitoring and clearance issues may be due to a lowered state of vigilance. The
vigilance intensive task and the resulting workload may be draining information processing
resources, resulting in errors in the perceptual encoding and response stages.
Figure 20. A graphic representation of the relationship between the covariates and safety
events thus far.
5.3. Human error
The scheme adopted by this research (figure 3) is led by the supposition that a human
operator is met by stimuli from the environment, and has the potential to interpret the
information correctly or incorrectly. Given that interpretation, the controller may or may not
have the intention to carry out the right action in response to the stimuli and finally may or
Shift variable: Time
since start of shift
within the first 30
minutes & between
91st and 150
th
minutes
Safety Events
Human factors: Information
Processing
Interpretation errors
Auditory detection errors
External factors: Poor
Workplace Design
Poor physical work
station designs
Risk Factors
Coordination standards
Stated causal errors
Incomplete clearance
issues
Radar and visual
monitoring

may not execute the intended action correctly (Wickens & Hollands, 2000). Following this,
there are three primary phases in which error may occur. Human errors are categorised into
three distinct kind of errors that occur at the different phases; slips, lapses and mistakes (both
knowledge and rule based).
The first part of research question four asked which errors human factors are
related to. No evidence was found to support the cluster analysis results which suggested
that knowledge based mistakes, attention and decision making were related, or that rule
based mistakes, lapses and human-machine interface were related (refer to Figure 13, p.70).
When the components of information processing were entered into a logistic regression with
the four human errors (knowledge and rule based mistakes, slips and lapses) it was found that
lapses were significant predictors for both interpretation errors and auditory detection errors,
with controllers who experience lapses 7.52 times more likely to incur an incorrect
interpretation and 8.14 times more likely to miss auditory cues than not. It is interesting to
note that the only information processing factors that yielded significant predictors were the
two factors that were themselves significant predictors of safety events. Alternatively stated;
the analysis showed that lapses are a significant predictor of interpretation errors and auditory
detection errors and that interpretation errors and auditory detection errors are significant
predictors of safety events.
Lapses are defined as “errors which result from some failure in the execution and or storage
of an action sequence, regardless of whether or not the plan which guided them was adequate
to achieve its objective” (Salmon, et al., 2011, p. 9). Since lapses occur in the execution and
or storage of an action (i.e. within the action stage) it is evident that human factor errors
(information processing errors) in ATC in South Africa are rooted in intention formation and
planning (figure 3).
As posited earlier, errors in auditory detection and interpretation may be linked to errors in
perceptual encoding (figure 5). Auditory detection errors link to perceptual encoding errors
which lead to central processing errors. The central processing stage involves the formulation
of responses and decision making. This can be equated to intention formation and planning.
Here we see that the errors in information processing correspond with the human errors at the
root of those errors. Lapses can be brought in to the graphic representation to show how it
fits in to the bigger picture (figure 21)

Figure 21. A graphic representation incorporating the relationships found thus far.
The next question regarded which errors are related to external factors. Analyses
showed that workplace design was a significant predictor of lapses in controllers involved in
safety events. No other external factors predicted any human errors. The results showed that
controllers in poor workplace design are 12.34 times more likely to experience a lapse than
controllers in adequate workplace design. This a substantial increase in lapses. Although the
direction of prediction has changed, lapses are once again the primary human error that
showed any significant results. Lapses are errors which result from some failure in the
execution and or storage of an action sequence (Salmon, et al., 2011). Lapses may possibly
be related to the inability of controllers to perform adequate visual scans of runways due to
poor physical workplace designs.
The components of workplace design were entered into logistic regression and it was found,
once again, that physical workplace design was the only significant predictor of lapses in
controllers. Lapses are errors which result from failure in the execution and or storage of an
action sequence (Salmon, et al., 2011, p. 9). The physical workplace design considered the
anthropometric dimension of ergonomics, namely; the physical setting of the workplace and
workstation and how this hindered or aided controller tasks. The analysis showed that the
Shift variable: Time
since start of shift
within the first 30
minutes & between
91st and 150
th
minutes
Safety Events
Human factors: Information
Processing
Interpretation errors
Auditory detection errors
External factors: Poor
Workplace Design
Poor physical work
station designs
Risk Factors
Coordination standards
Lapses
Stated causal errors
Incomplete clearance
issues
Radar and visual
monitoring

physical set up of a work station is a predictor of lapses in controllers in South Africa. This
infers that poor physical designs of work stations predict errors due to a failure in the
execution and or storage of an action sequence. This is a coherent finding in that poor
workspace designs hinder the execution of action sequences such as visual scans of runways.
It is both plausible and reasonable that poor workplace design predict lapses in controllers.
It could alternatively be posited that poor workplace designs require more attentional
resources to be deployed and as a result, controllers may experience greater resource
depletion. Vigilance was defined as, “a capacity for sustained effective attention when
monitoring a situation or display for critical signals, conditions or events to which the
observer must respond” (Donald, 2008, p. 36). If the ability of a controller to monitor a
situation or display for critical signals or conditions is hindered by poor workplace design,
the controller cannot achieve sustained effective attention. It it is logical then that poor
workplace designs (and the resulting hinderance to monitoring abilities) predict lapses which
are errors which result from some failure in the execution of an action.
Figure 22. A graphic representation of the relationships found.
The next part of the research question asked if stated causal errors related to certain
human errors. Logistic regression showed that incomplete clearances, radar and visual
Shift variable: Time
since start of shift
within the first 30
minutes & between
91st and 150
th
minutes
Safety Events
Human factors: Information
Processing
Interpretation errors
Auditory detection errors
External factors: Poor
Workplace Design
Poor physical work
station designs
Risk Factors
Coordination standards
Lapses
Stated causal errors
Incomplete clearance
issues
Radar and visual
monitoring

monitoring failures, incorrect assumptions regarding separation and misjudging aircraft
projections were predictors of LoS, whilst incomplete clearances and radar and visual
monitoring failures are predictors of RI. As these are the predictors of safety events, the other
causal factors and their human error predictors will not be discussed as their relationship to
safety events are not significant.
Logistic regression revealed that rule based mistakes are predictors of incorrect assumptions,
slips are shown to predict radar and visual monitoring failures, misjudging aircraft projection,
incorrect timing of clearances and memory lapses and knowledge based mistakes were shown
to predict incomplete clearance issues and mishearing of read-back. As only incomplete
clearance issues and radar and visual monitoring errors were significant predictors, only these
two causal errors will be discussed.
Incomplete clearance issues are predicted by knowledge based mistakes while radar and
visual monitoring failures are predicted by slips. Knowledge-based mistakes predicting errors
in visual monitoring failures was expected as monitoring failures are indicative of errors in
situation assessment. Recall that mistakes are “failures in judgmental and/or inferential
processes involved in the selection of an objective or in the specification of the means to
achieve it, irrespective of whether or not the actions directed by this decision scheme run
according to plan” (Salmon, et al., 2011, p. 9). Errors in radar and visual monitoring failures
are logically rooted in knowledge based mistakes as knowledge based mistakes are linked to
errors in interpretation of stimuli.
A slip predicting incomplete clearance issues is logically sound as slips correspond to errors
in action execution. Slips are “errors which result from some failure in the execution and or
storage of an action sequence, regardless of whether or not the plan which guided them was
adequate to achieve its objective” (Salmon, et al., 2011, p. 9). Here we see that the error lies
in the execution of the action sequence. This contradicts the claim made earlier in the
discussion in which it was posited that incorrect clearance issues are rooted in the formation
of a plan, rather, it is rooted in the execution of the action. This may be because of the nature
of information processing and the manner in which one stage feeds into the next. Errors in
perception obscure response selection which results in erroneous response execution. It can
be posited that the errors are all linked and influence each other, making errors in all three
stages in information processing a likely find.

Figure 23. A graphic representation of the significant relationships found thus far in this
study.
The next question regarded if safety events are related to certain types of human
error. Lapses were established as a significant predictor of safety events. Recall that lapses
occur in the planning stage, in which the intention to act is erroneous. This implies that safety
events in South Africa can primarily be predicted by errors in planning phases. The planning
phase in ATC involves the revision of current plans for controlling sectors to match
contingencies, implementing ways of avoiding conflicts and changing aircraft routes in
response to the situation (Seamster, Redding, Cannon, Ryder, & Purcell, 1993). All of this
planning occurs in real time and thus present controllers with a challenging task with a
restricted amount of time in which to formulate and consolidate sufficient plans. Errors that
occur in the planning phase involve erroneous intention formulations, for example the
formulation of inadequate conflict avoidance plans.
Shift variable: Time
since start of shift
within the first 30
minutes & between
91st and 150
th
minutes
Safety Events
Human factors: Information
Processing
Interpretation errors
Auditory detection errors
External factors: Poor
Workplace Design
Poor physical work
station designs
Risk Factors
Coordination standards
Lapses
Stated causal errors
Incomplete clearance
issues
Radar and visual
monitoring
Knowledge-based
mistakes and slips

Figure 24. A graphic representation of all the significant relationships found in this study.
5.4. Summary of findings.
The results showed that errors in information processing factors, workplace design, poor co-
ordination standards and lack of memory cues are predictors of safety events. It was then
established that lapses are predictors of poor information processing in controllers whilst poor
workplace design is a predictor of lapses. Finally, lapses are a predictor of safety events. A
final graphic representation of the results was shown in figure 24. It was noted that the arrows
show prediction and in no way suggest causality. The results presented an interesting
possible relationship between poor workplace design, lapses and information processing
errors. Not only did all three factors (poor workplace designs, lapses and information
processing errors) individually predict safety events, there were two paths of note that
developed. Firstly, poor workplace designs predicted lapses which in turn predicted safety
events. Secondly, poor workplace designs predicted lapses which predicted errors in
information processing which in turn predicted safety events. These paths show that there
Shift variable: Time
since start of shift
within the first 30
minutes & between
91st and 150
th
minutes
Safety Events
Human factors: Information
Processing
Interpretation errors
Auditory detection errors
External factors: Poor
Workplace Design
Poor physical work
station designs
Risk Factors
Coordination standards
Lapses
Stated causal errors
Incomplete clearance
issues
Radar and visual
monitoring
Knowledge-based
mistakes and slips

could possibly be some mediation at play. It is possible that lapses mediate the relationship
between poor workplace designs and information processing errors.
A mediating variable is one caused by the predictor variable and in turn causes the outcome
variable (Stangor, 2011). Mediating variables are important because they explain why the
relationship between two variables occur (Stangor, 2011). It would be logically and
theoretically sound to view lapses as the reason why (mediating variable) the relationship
between poor workplace designs and errors in information processing occurs in controllers.
Alternatively phrased, it is theoretically sound to posit that there is a relationship between
poor workplace designs and errors in information processing because poor workplace designs
encumber the execution of an action sequence. The obstruction of the execution of certain
actions causes errors in information processing. This shows that the possibility of lapses as a
mediating variable is both logically and theoretically sound.

CHAPTER 6: CONCLUSIONS
This study investigated the factors underlying human error in ATC by assessing safety event
reports from years 2010 to 2012. This was achieved through content analysis, cluster analysis
and a number of logistic regressions. The study found a number of significant predictors of
both RI and LoS from the various covariates. Firstly, the research established that there are
times in a shift which can be labelled as risk times. Time since the start of a shift is a
predictor of safety events and the most at risk times are within the first thirty minutes of a
shift and between the 90th
and 150th
minutes. The research found that errors in information
processing are significant predictors of LoS and RI, in particular, errors in auditory detection
and interpretation. The research can thus conclude that the human factor at the root of errors
in ATC in South Africa is information processing. These errors in information processing are
predicted by lapses. It can thus also conclude that the human error at the foundation of errors
in information processing is lapses.
The research found that poor physical workplace designs are predictors of both RI and LoS.
Poor physical workplace designs are also predictors of lapses in controllers. Of all the
variables included in the study, this was the only external factor that predicted any human
error. It can thus be concluded that poor workplace designs are the core problem when
considering the impacts external factors have on controllers in South Africa. The possibility
of other external factors that were not included in the reports that may not have considered
under other variable headings such as distraction. This variable was coded into task
engagement but could have been factored into an external variable when considering the
amount of distraction from within the workplace. In this way, the study incorporated it into a
human factor and thus ensured that it was still considered in the study. In terms of the
variables included in the study, physical workplace design was the only significant external
factor that predicted any human error. The research also notes that poor physical workplace
designs predict both lapses and safety events. Lapses in turn predict errors in information
processing as well as safety events and errors in information processing predict safety events.
The research concludes that poor adherence to coordination standards predict LoS events
while a lack of memory cues predicts RI events. Incomplete clearance issues and radar and
visual monitoring failures predict LoS events and in turn are predicted by knowledge based
mistakes and slips. The final conclusions of this research can be stated as follows. There are a

number of factors that interact and influence controller performance in ATC. When
considering human factors, lapses are the primary human error at play. When considering the
causal errors, slips and knowledge based mistakes are at the base of human errors in ATC.
6.1. Limitation and suggestions for future research
There were a number of limitations to this research, most originating from time constraints.
Firstly, the sample size was relatively small and analysing years 2008 to 2012 would have
allowed for a more in depth and conclusive evaluation of errors in ATC. If the sample size
was bigger, the researcher may have found it useful to separate reports into major airports and
run analyses on the airports. If the research had been conducted according to airports, future
preventative measures may have been tailored to the airport and its specific needs. The
amalgamation of airports may have resulted in the issues of smaller airports being lost due to
the number of events occurring at larger airports. A larger sample size would also have
allowed for more inclusive regressions as the number of observations would outweigh the
number of model parameters. Secondly, the researcher was unable to incorporate inter-rater
reliability due to time constraints. Inter-rater reliability would essentially have tested the data
more than once, and ensured that the initial content analysis of the safety event reports was
consistent.
As ATC is so complex, there are a number of extraneous variables that may not have been
considered by the researcher. Future research may consider variables that were not
considered in this research such as psycho-physiological aspects, for example; stress. Future
research may use this research as a guide in developing interventions aimed at combating
errors in ATC. It is recommended that the significant predictors be addressed in future studies
and used as a basis from which to improve the training of controllers. Lastly, future research
could explore the dynamic relationship between the physical design of controller
workstations, lapses and information processing. With more data, future research may be able
to establish some mediation roles in human errors, for example lapses mediating the
relationship between physical workplace design and information processing errors.
Future research should look to take ATC research away from the diagnostics of errors and
move towards a proactive approach that may lessen human error in ATC. Professor Sidney
Dekker, from the Griffith University in Brisbane, Australia, delivered his paper, "I wish I
could get rid of the people who make mistakes" at the human factors symposium in

Johannesburg. Professor Dekker suggests that systems are essentially safe if not for the few
unreliable people within it (Air Traffic and Navigation Services, 2014) . He also posited that
the focus on human error has the danger of becoming a focus on humans as the cause of
safety events and on humans as the targets for intervention (Air Traffic and Navigation
Services, 2014). This may serve to be a mislead safety endeavour, as getting rid of one person
does not remove the conditions that gave rise to the safety event (Air Traffic and Navigation
Services, 2014). This research has considered not only the human factors but the external and
risk factors in order to establish a more comprehensive account of the factors that underpin
errors in air traffic control. This may assist future research in directing focus away from
human factors but allow them to consider other factors such as workplace designs and risk
factors. In this way, the conditions that facilitated the errors can be addressed and bettered.
Although the results have indicated predictors of safety events in ATC, this research was
limited in its estimations of the strength of the prediction. The small to moderate sample size
caused possible biases in results. Despite the overestimation, predictors were identified and
future studies may use these findings to direct the focus of future studies and interventions.

Reference List
CAA Standards & Procedures Manual (ATCIs) . (2013, August 10). Retrieved from CAA:
http://www.caa.co.za/resource%20center/AirTrafficServices/ATS%20Standards%20and%20
Procedures%20manual.htm
Air Traffic and Navigation Services. (2014, 02 04). The first ever human factor symposium in aviation
stirs positive debate. 2. Johannesburg, Gauteng, Johannesburg: ATNS.
Airports Company South Africa. (2013, 05 02). Aircraft statistics. Retrieved from Airports Company
South Africa: http://www.acsa.co.za/home.asp?pid=135
Airports Company South Africa. (2014, 08 01). Aircraft statistics. Retrieved from Airports Company
South Africa: http://www.acsa.co.za/home.asp?pid=100
Arvidsson, M., Johansson, C. R., Ek, A., & Akselsson, R. (2007). SItuational Leadership in Air TRaffic
Control. Journal of Air Transportation (12) no 1, 67-85.
Bellorini, A., Larsen, M. N., Pistre, M., Considine, B., Woldring, M., & Van Damme, D. (1999).
Computer based training on human factors for ab-initio air traffic controllers. Tenth
international symposium on aviation psychology (pp. 1072-1077). Ohio: Ohio State
University.
Bradley, T. F., & Tenenbaum, J. B. (2013). A probabilistic model of visual working memory:
Incorporating higher order regularities into working memory capacity estimates.
Psychological Review vol 120 no 1, 85-109.
Carriere, J. S., Cheyne, J. A., & Smilek, D. (2008). Everyday attention lapses and memory failures: The
affective consequences of mindlessness. Consciousness and Cognition (17), 835-847.
Cheyne, J. A., Solman, G. J., Carriere, J. S., & Smilek, D. (2009). Anatomy of error: A bidirectional state
model of task engagement/disengagement and attention-related errors. Cognition (111), 98-
113.
Chica, A. B., Bartolomeo, P., & Luianez, J. (2012). Two cognitive and neural systems for endogenous
and exogenous spatial attention. Behvioural Brain research 237, 107- 123.
Cohen, N. J., & Poldrack, R. A. (1997). Memory for items and memory for relations in the
procedural/declarative memory framework. Memory, 5, 131-178.
Colman, A. M. (2006). Oxford dictionary of Psychology. New York: Oxford University Press.
Colman, A. M. (2006). Oxford Dictionary of Psychology. New York: Oxford University Press.
Demeter, E., Hernandez-Garcia, L., Sarter, M., & Lustig, C. (2011). Challenges to attention: A
continuous arterial spin labelling (ASL) study of the effects of distraction on sustained
attention. NeuroImage 54, 1518-1529.

Department of Transport. (2010, 11 11). South African national airspace master plan 2011 - 2025.
Retrieved from http://www.caa.co.za/resource%20center/AirTrafficServices/NAMP_2011-
2025.pdf
Donald, F. (2008). The classification of vigilance tasks in the real world. Ergonomics, 51 (11), 1643-
1655.
Donald, F. (2011). Optimal characteristics of inserted graphic objects in stimulating CCTV operator
vigilance and performance. unpublished thesis.
Durso, T. F., Nickerson, R. S., Schvaneveldt, R. W., Dumais, S. T., Lindsay, D. S., & Chi, M. T. (1999).
Handbook of applied cognition. Oklahoma: John Wiley & Sons Ltd.
Endsley, M. &. (1997). Distribution of attention, situational awareness and workload in a passive air
traffic control task. Washington: Office of aviation medicine.
Endsley, M. R. (1995). Measurement of Situational Awareness in Dynamic Systems. Human Factors
(37), 65-84.
Endsley, M. R., & Rodgers, M. D. (1998). Distribution of Ateention, Situation awareness & Workload
in a Passive Air TRaffic COntrol Task: Implications for Operational Errors and Automation. Air
TRaffic Control Quarterly (6), 21-44.
Eoropean Organisation for the safety of air navigation. (2013, 02 05). The investigation of human
error in ATm simulation: the toolkit. Retrieved from Eurocontrol:
http://www.eurocontrol.com
Eurocontrol. (1996). Proceedings of the First Eurocontrol Human Factors Workshop Cognitive
Aspects in ATC. European Air Traffic Control Harmonisation and Integration Programme, (pp.
1-63).
Eurocontrol. (2002, 07 02). The investigation of human error in ATM simulation. Retrieved from
Skybrary:
https://www.eurocontrol.int/sites/default/files/content/documents/nm/safety/the-
investigation-of-human-error-in-atm-simulation-the-toolkit.pdf
Eurocontrol. (2003, 03 03). Guidelines for investigation of safety occurences in ATM. Retrieved from
Eurocontrol: D:\tblajev\Biblioteka\my folder\Occurrence
Investigation\Giudelines\Released_Issue
Eurocontrol. (2004, 03 05). A method for predicting human error in ATM (HERA_PREDICT). Retrieved
from Skybrary: http://www.skybrary.aero/bookshelf/books/327.pdf
Eurocontrol. (2009, 07 17). Decision-Making. Retrieved from Skybrary:
http://www.skybrary.aero/index.php/Decision-Making_(OGHFA_BN)
Eurocontrol. (2010, 09 30). Non-compliance with ATC procedures in low traffic periods. Retrieved
from Skybrary: http://www.skybrary.aero/index.php/Non-
compliance_with_ATC_Procedures_in_low_traffic_periods
Eurocontrol. (2012). Guidelineds for the application od European coordination and transfer
procedures. Brussels: Eurocontrol Headquaters.
Eurocontrol. (2012, 08 08). Regulation 1032/2006 - Exchange of flight data between ATC units.
Retrieved from Skybrary: http://www.skybrary.aero/index.php/Regulation_1032/2006_-
_Exchange_of_Flight_Data_Between_ATC_Units
Eurocontrol. (2013, 05 03). Memory in ATC. Retrieved from Skybrary:
http://www.skybrary.aero/index.php/Memory_in_ATC
Eurocontrol. (2013, 09 29). Read-back or hear-back. Retrieved from Skybrary:
http://www.skybrary.aero/index.php/Read-back_or_Hear-back
European AGency for Safety and Health at Work. (?). The human machine interface as an emerging
rish.
European Organisation for the safety of air navigation. (2013, 04 15). A method for predicting human
error in ATM (HERA_PREDICT). Retrieved from Eurocontrol: http://www.eorocontrol.com
Flach, J. M. (1995). Situation awarenedd: proceed with caution. Human Factors, 37, 149-157.
Frishammar, J. (2002). Characteristics in information processing approaches. International Journal of
Information Management, 22, 143-156.
Gaillard, A. (1993). Comparing the concepts of mental workload and stress. Ergonomics, 36, 991-
1004.
Galbraith, J. R. (1984). Organizational Design: An Information Processing View. Army Organizational
effectiveness Journal, 8, 21-26.
Gale, A., & Christie, B. (1987). Psychophysiological and the electronic workplace. Chichester: John
Wiley & Sons Ltd.
GATCSA. (2013, April 14). Situational Awareness. Retrieved from Guild of Air Traffic Controllers of
South Africa:
http://www.gatcsa.org/index.php?option=com_content&task=view&id=50&Itemid=28
Gebotys, R. (2000, 01). Week 6- cluster analysis. Waterloo, Canada.
Goldstein, E. B. (2008). Cognitive Psychology: Connecting mind, research and everyday experience
(2nd ed.). CA: Thomson Wadsworth.
Hancock, P. A., & Meshkati, N. (1988). Advances in Psychology: Human Mental Workload. New York:
Elsevier Science Publishers.
Hosmer, D. W., Lemeshow, S., & Sturdivant, R. X. (2013). Applied logistic regression. New Jersey:
Wiley.
IBM. (2011). Binning (Grouping) Data Values. Retrieved from IBM:
http://pic.dhe.ibm.com/infocenter/spssstat/v20r0m0/index.jsp?topic=%2Fcom.ibm.spss.sta
tistics.help%2Fidh_webhelp_scatter_options_palette.htm
International Civil Aviation Organisation. (2013, April 15). Safety Report 2012. Retrieved from
International Civial Aviation Organisation: A United Nations Specialised Agency:
http://www.icao.int/safety/Documents/ICAO_SGAS_2012_final.pdf
International Civil Aviation Organization. (2005, 10 06). Threat and error management (TEM) in air
traffic control. Retrieved from ICAO: http://flightsafety.org/files/tem_icao_10-05.pdf
International Civil Aviation Organization. (2007). Manual on the Prevention of Runway Incursions,
Doc 9870. Montreal: International Civil Aviation Organization.
International Civil Aviation Organization. (2013, August 15). Loss of Separation. Retrieved from
SKYbrary: http://www.skybrary.aero/index.php/Loss_of_Separation
International Ergonomics Association. (2014, 01 02). Ergonomics and human centred design.
Retrieved from IEA: http://www.iea.cc/whats/index.html
Isaac, A., Duchenne, C., & Amalberti, R. (2002, July 02). The Investigation of Human Error in ATM
Simulation. European Air TRaffic Management Programme, pp. 1-72.
Jonge, J., Bosma, H., Peter, R., & Siegrist, J. (2000). Jon strain, effort-reward imbalance and employee
well-being: a large scale cross-sectional study. Social Science & Medicine (50), 1317-1327.
Lanzetta, T. M., Dember, W. M., Warm, J. S., & Berch, D. B. (1987). Effects of task type and stimulus
heterogeneity on the event rate function in sustained attention. Human Factors, 39 (2), 625-
633.
Levinson, D. B., Smallwood, J., & Davidson, R. J. (2012). The persistance of thought: evidence for the
role of working memory in the maintenance of task-unrelated thinking. Psychological
Science, 23, 375-380.
Lim, B., & Klein, K. J. (2006). Team mental models and team performance: A field study of the effects
of team mental model similarity and accuracy. Journal of Organisational Behaviour, 27, 403-
418.
Loft, S., Finnerty, D., & Remington, R. W. (2011). Using Spacial COntext to Support Prospective
Memory in Simulated Air Traffic Control. Human Factors, 53 (6), 662-671.
Loft, S., Sanderson, P., Neal, A., & Mooij, M. (2007). Modelling and predicting mental workload in en
route air traffic control: Critical review and broader implications. Human Factors, 49, 376-
399.
Lyons, A. I., Boive, T., & Van Damme, D. (2003, May 12). Validation of the Human Error in ATM
(HERA-JANUS) Technique. Retrieved from Eurocontrol: G:\Deliverables\HUM Deliverable pdf
Library\

MathWorks. (2013, 12 01). Cluster Analysis. Retrieved from MathWorks:
http://www.mathworks.com/help/stats/examples/cluster-analysis.html
Mooi, E., & Sarstedt, A. (2011). A concise guide to market research. Berlin: Springer. Retrieved from
Springer.
Moon, W., Yoo, K., & Choi, Y. (2011). Air Traffic Volume and Air Traffic Control Human Errors. Journal
of Transportation Technologies (1), 47-53.
Nebel, K., Wiese, H., Stude, P., de Greiff, A., Diener, H.-C., & Keidel, M. (2005). On the neural basis of
focused and divided attention . Cognitive Brain research 25, 760-776.
Nemes, S., Jonasson, J. M., Genell, A., & Steineck, G. (2009). Bias in odds ratios by logistic regression
modelling and sample size. BMC Medical Research Methodology, 56. doi:10.1186/1471-
2288-9-56
Norman, D. (1981). Categorization of action slips. Psychological Review, 88, 1-15.
Norman, D. (1988). The Psychology of everyday things. New York: Harper & Row.
Osipova, D., Takashima, A., Oostenveld, R., Fernandez, G., Maris, E., & Jensen, O. (2006). Theta and
gamma oscillations predict encoding and retrieval of declarative memory. The journal of
neuroscience, 26, 7523-7531.
Pearsall, J. (2005). Oxford Dictionary of English. Oxford: Oxford University Press.
Pheasant, S., & Haslegrave, C. (2006). Bodyspace: anthropometry, ergonomics and the design of work
(3 ed.). NW: Taylor & Francis Group.
Rasmussen, J. (1986). Information processing and human-machine interaction: an approach to
cognitive engineering. New York: Wiley.
Reason, J. (1990). Human Error. New York: Cambridge University Press.
Reason, J. (1990). Human Error. New York: Cambridge University Press.
Reason, J. (1997). Managing the risks of organizaional accidents. Brookfield: VT:Ashgate.
Reason, J. (2000). Human error: models and management. BMJ, 320, 768-770.
Reason, J. T. (1984). Lapses of Attention. In R. Parasuraman, & R. Davies, Varieties of Attention. New
York: Academic Press.
Robbins, S. P., Judge, T. A., Odendaal, A., & Roodt, G. (2009). Organisational Behaviour: Global and
Southern African perspectives. Cape Town: Pearson Education.
Sage. (2013, 12 11). Chapter 24: Logistic Regression. Retrieved from edoqs:
http://edoqs.com/pdf/bchapterb-24-blogisticb-bregressionb-bsageb-the-natural-home-for-
_fbb04a796ac0b7ed723c82d36ae21b9c
Salmon, P. M., Stanton, N. E., Lenne, M., Jenkins, D. P., Rafferty, L., & Walker, G. H. (2011). Human
Factors Methods and Accident ANalysis: Practical Guidance and Case Study Applications.
Surrey: Ashgate Publishing Limited.
Sawin, D. A., & Scerbo, M. W. (1995). Effects of instruction type and boredom proneness in vigilance:
implications for boredom and workload. Human Factors 37(4), 752-765.
Seamster, T. L., Redding, R. E., Cannon, J. R., Ryder, J. M., & Purcell, J. A. (1993). Cognitive task
analysis of expertise in air traffic control. The international journal of aviation psychology, 3,
257 - 283.
Seltman, H. J. (2013, 12 3). Chapter 16 (Categorical Outcomes). Retrieved from Experimental design
and analysis: http://www.stat.cmu.edu/~hseltman/309/Book/Book.pdf
Sheridan, T. B. (2002). Humans and automation: System design and research issues. CA:
Wiley/Human Factors and Ergonomics Society.
Shorrock, S. T. (2005). Errors in memory in air traffic control. Safety Science, 43, 571-588.
Shorrock, S. T. (2005). Errors in memory in air traffic control. Safety Science, 43, 571-588.
Shorrock, S. T., & Isaac, A. (2010). Mental Imagery in Air Traffic Control. The International Journal od
Aviation Psychology, 20 (4), 309-324.
Shorrock, S. T., & Kirwan, B. (2002). Development and applications of human error identification tool
for air traffic control. Applied ergonomics 33, 319-336.
Sinanovic, S., & Johnson, D. H. (2007). Toward a theory of information processing. Signal Processing,
87, 1326-1344.
Skybrary. (2011, 11 09). Handover/takeover of operational ATC working positions/responses.
Retrieved from Skybrary:
http://www.skybrary.aero/index.php/Handover/Takeover_of_Operational_ATC_Working_P
ositions/Responses
Skybrary. (2013, 11 7). ATM Sector Management. Retrieved from Skybrary:
http://www.skybrary.aero/index.php/ATM_Sector_Management
Skybrary. (2013, April 14). Skybrary. Retrieved from Human Behaviour: Human Error Types:
http://www.skybrary.aero/index.php/Human_Error_Types
Skybrary. (2013, 11 20). Skybrary. Retrieved from Human factors:
http://www.skybrary.aero/index.php/Portal:Human_Factors
Smallwood, J., Davies, J. B., Heim, D., Finnigan, F. S., Sudberry, M., O'Connor, R., & Obonsawin, M.
(2004). Subjective Experience and the attentional lapse: Task engagement and
disengagement during sustained attention. Consciousness and Cognition (13), 657-690.
South African Civil Aviation Authority. (2009). Section 2. In S. A. Authority, CAA Standards &
Procedures (ATCIs) Maual (pp. 1 - 49).
Stangor, C. (2011). Research methods for the behavioural sciences. Belmont: Wadsworth.
Statsoft. (2013, 04 28). Statsoft: Electronic Statistics Textbook. Retrieved from How to group objects
into similar categories, cluster analysis: http://www.statsoft.com/textbook/about-
textbook/?button=3
techniques, E. C. (n.d.). Sage Publications.
Tulving, E. (1987). Multiple memory systems and consciousness. Human Neurobiology, 6, 67-80.
U.S. Office of Personnel Management. (1978, June). Position Classification Standard for Air TRaffic
Control Series. Air TRaffic COntrol Series. Retrieved from OPM.GOV:
https://www.opm.gov/policy-data-oversight/classification-qualifications/classifying-general-
schedule-positions/standards/2100/gs2152.pdf
Vicente, K. (2002). Ecological interface design:progress and challenges. Human Factors, 44, 62-78.
von Hippel, W., Jonides, J., Hilton, J. L., & Narayam, S. (1993). Inhibitory effect of schematic
processing on perceptual encoding. Journal of personality and social psychology, 6, 921-935.
Warm, J. S., Parasuraman, R., & Matthews, G. (2008). Vigilance requires hard mental work and is
stressful. Human Factors, 50, 433-441.
Wickens, C. D., & Hollands, J. G. (2000). Engineering Psychology and Human Performance (3rd Ed.).
New Jersey: Prentice Hall.
Wickens, C. D., Gordon, S. E., & Liu, Y. (1998). Human Factors Engineering. New York: Longman.
Wickens, C. D., Mavor, A. S., & McGee, J. P. (1997). Flight to the future: Human Factors in Air Traffic
Control. Wahington: National Academy Press.
Wickens, C. D., Mavor, A. S., & McGee, J. P. (1997). Flight to the Future: Human Factors in Air Traffic
Control. Washington: National Academy Press.
Zhang, T., Kaber, D., & Hsiang, S. (2009). Characterisation of mental models in virtual reality-based
multitasking scenario using measures of situation awareness. Theoretical issues in
ergonomics science , 1-20.
Zsambok, C. E., & Klein, G. (1997). Naturalistic Decision Making. New Jersey: Erlbaum.

Appendix 1: HERA Model
HERA ANALYSIS
DESCRIPTION OF ERROR
1.
How detected:
How recovered:
Causal Contributory Compounding Non-
contributory
HERA CLASSIFICATIONS
Error Type:
Error Detail:
Error Mechanism:
Information
Processing:
Task
Taxonomy:
Information/
Equipment
Contextual
Condition:
Reporter’s

Assumptions:
Analyst’s
assumptions:
NOTES
Source: EUROCONTROL, HERA-JANUS. 2003. HRS/HSP-002-REP-03

Appendix 2: Non-disclosure agreement.
An Air Navigation Service Provider


An Air Navigation Service Provider
