factors that affect relative product quality of the …
TRANSCRIPT

FACTORS THAT AFFECT RELATIVE PRODUCT
QUALITY OF THE SMES IN THE KENYAN APPAREL
INDUSTRY
BY
CAROL WANJIRU KOMU
UNITED STATES INTERNATIONAL UNIVERSITY -
AFRICA
SUMMER 2017

FACTORS THAT AFFECT RELATIVE PRODUCT
QUALITY OF THE SMES IN THE KENYAN APPAREL
INDUSTRY
BY
CAROL WANJIRU KOMU
A Research Project Report Submitted to the Chandaria School
of Business in Partial Fulfillment of the Requirement for the
Degree of Masters in Business Administration (MBA)
UNITED STATES INTERNATIONAL UNIVERSITY-
AFRICA
SUMMER 2017

ii
STUDENT’S DECLARATION
I, the undersigned, declare that this is my original work and has not been submitted to any
other college, institution, or university other than the United States International
University in Nairobi for academic credit.
Signed: ________________________ Date: _______________________
Carol Wanjiru Komu (ID: 637843)
This project has been presented for examination with my approval as the appointed
supervisor.
Signed: ________________________ Date: _______________________
Professor Scott Bellows
Sign: _____________________________ Date________________________________
Dean, Chandaria School of Business

iii
COPYRIGHT
All the rights reserved. No part of this report may be photocopied, recorded or otherwise
reproduced, stored in a retrieval system or transmitted in any electronic or mechanical
means without prior permission of the copyright owner.
Carol Wanjiru Komu. Copyright © 2017

iv
ABSTRACT
The purpose of the study was to establish the factors that affect product quality of the
SMEs in the Kenyan Apparel Industry. The study was guided by the following research
questions: How does a quality department affect apparel relative product quality? How
does employee training affect the apparel relative product quality? And how does a set
operating procedure affect the apparel relative product quality?
The study took up the approach of a descriptive survey. This aided in recognition of the
factors that affect the relative product quality in the SME sector of the KAI. The target
population of the study was on KAI SMEs in Nairobi. It will focus particularly on the
owners or those in management of these SMEs. From the KAM and AFDAK directories,
there are 800 in number. A stratified random sampling technique was used. From the
population of 800 and by use of the rule of thumb a 20% sample size was considered, so
our sample was made of 160 companies and the target was the owners or those in
management of the company.
A total of 160 questionnaires were distributed to small and medium enterprises and only
119 questionnaires were filled and returned giving a response rate of 74.7%, which was
considered sufficient for the study. Once the descriptive statistics was applied on the
collected data, the results were summarized on different tools such as charts, graphs and
tables this allowed the researcher to investigate and draw conclusions on the relationships
that existed between the independent and dependent variables in question.
The first objective sought to establish the effects of quality department on the clothing
quality. The findings revealed that there was a high extent of autonomy of the quality
department (freedom to run the department as they find fit), and high extent was also
experienced when quality department coordinates with other departments. Most
respondents also noted to a high extent that there was visible quality department and
quality department has access to the top management. The findings established that there
was a positive relationship between quality of clothing and quality department (r=0.127,
p>0.05).
The second objective sought to establish the impact of the employee training on the
clothing quality. The finding revealed that to a medium extent there are available
resources for employee training and top management is committed to employee training.

v
However, to a low extent it was revealed that quality achievement training is given to
management and specific technical skill training is given to every employee. The findings
established that there was a positive relationship between quality of clothing and
employee training (r=0.254, p<0.05).
The third objective sought to establish the impact of a standard operating procedure on
the clothing quality. The findings revealed that to a high extent there was a thorough final
inspection of the clothes and incoming raw material, as well as clarity of work and
process instructions given to employees. There was also a high extent of continuous self-
inspection. The findings established that there was a positive relationship between quality
of clothing and a standard operating procedure (r=-0.073, p>0.05).
The study concluded that there exists a high extent of autonomy of the quality department
and coordination with other departments. There is also a high coordination between the
quality department and the top management to ensure operational efficiency. It was also
concluded that the firms have ample resources for employee training, and this is fostered
by the top management commitment to ensure employees are well trained. It was also
inferred that due to high cost associated with correcting errors there is a vast clarity of
work and process instructions given to employees as a standard operation procedure
accompanied by continuous self- inspection to minimizes the chance of employee error.
It was recommended that there should be a continuous autonomy of the quality
department (freedom to run the department as they find fit) as well as coordination with
other departments to ensure quality is maintained. It was also recommended that the
sector needs to ensure that available resources for employee training are effectively used
this should be supported by top management to ensure its effectiveness. It was also
recommended that the firms should maintain a continuous thorough inspection of the
clothes and incoming raw material to ensure the quality of the outputs is not
compromised.
Further studies need to be undertaken in other sectors so as to be able to generalize the
findings. There is a need to undertake a research in the same industry in order to establish
what causes the 94% variation in quality of clothing.

vi
ACKNOWLEDGEMENT
I would like to give thanks to God for the guidance he has accorded me up to this level of
my master’s program. I also give special thanks to my family for the support and to my
supervisor Prof. Scott Bellows, for the guidance throughout this research project.

vii
DEDICATION
I would like to dedicate this research project to my father, mother and sister for all the
motivation and support they offered me throughout the course.

viii
TABLE OF CONTENT
STUDENT’S DECLARATION ........................................................................................ ii
COPYRIGHT ................................................................................................................... iii
ABSTRACT ....................................................................................................................... iv
ACKNOWLEDGEMENT ................................................................................................ vi
DEDICATION.................................................................................................................. vii
LIST OF TABLES ............................................................................................................. x
LIST OF FIGURES .......................................................................................................... xi
ABBREVIATONS AND ACRONYMS ......................................................................... xii
CHAPTER ONE ................................................................................................................ 1
1.0 INTRODUCTION........................................................................................................ 1
1.1 Background of the Problem ........................................................................................... 1
1.2. Statement of the problem .............................................................................................. 7
1.3 Purpose of the study ....................................................................................................... 8
1.5 Importance of the Study ................................................................................................. 9
1.6 Scope of the Study ......................................................................................................... 9
1.7 Definition of Terms...................................................................................................... 10
1.8 Chapter summary ......................................................................................................... 11
CHAPTER TWO ............................................................................................................. 12
2.0 LITERATURE REVIEW ......................................................................................... 12
2.1 Introduction .................................................................................................................. 12
2.2 Effect of Quality Department on Relative Product Quality ......................................... 12
2.3 Effects of Employee Training on Relative Product Quality ........................................ 20
2.4 Effect of a Set Standard Operating Procedure on Relative Product Quality ............... 27
2.5 Chapter Summary ........................................................................................................ 34
CHAPTER THREE ......................................................................................................... 35
3.0 RESEARCH METHODOLOGY ............................................................................. 35
3.1 Introduction .................................................................................................................. 35
3.2 Research Design........................................................................................................... 35

ix
3.3 Population and Sampling Design ................................................................................. 36
3.4 Data CollectionMethods .............................................................................................. 37
3.5 Research Procedure ...................................................................................................... 38
3.6 Data Analysis ............................................................................................................... 39
3.7 Chapter Summary ........................................................................................................ 39
CHAPTER FOUR ............................................................................................................ 40
4.0 RESULTS AND FINDINGS ..................................................................................... 40
4.1 Introduction .................................................................................................................. 40
4.2 Demography ................................................................................................................. 40
4.3 Effects of Quality Department on The Clothing Quality ............................................. 44
4.4 Impact of The Employee Training on The Quality Of Clothing ................................. 45
4.5 Impact ofthe Operating Procedure On the Quality Of Clothing .................................. 46
4.6 Relative Clothing Quality ............................................................................................ 47
4.7 Inferential Statistics ..................................................................................................... 48
4.8 Chapter Summary ........................................................................................................ 51
CHAPTER FIVE ............................................................................................................. 52
5.0 DISCUSSIONS, CONCLUSIONS AND RECOMMENDATIONS ...................... 52
5.1 Introduction ................................................................................................................ 52
5.2 Summary ...................................................................................................................... 52
5.3 Discussion .................................................................................................................... 54
5.4 Conclusion ................................................................................................................... 59
5.5 Recommendation ......................................................................................................... 60
REFERENCES ................................................................................................................. 62
APPENDIX I: QUESTIONNAIRE ................................................................................ 68

x
LIST OF TABLES
Table 3.1 :Target Population .............................................................................................33
Table 3.2: Sample Size................................................................................................... ...34
Table 4.1: Response Rate ................................................................................................... 40
Table 4.2: Descriptive on Effects of Quality Department on Clothing Quality ................ 45
Table4.3: Descriptive on the Impact of Employee Training on The Quality of Clothing . 45
Table 4.4: Descriptive on Impact of the Operating Procedure on the Quality .................. 47
Table 4.5: Descriptive on Relative Clothing Quality ......................................................... 48
Table 4.6: Correlation Analysis ......................................................................................... 48
Table 4.7: Model Summary ............................................................................................... 49
Table 4.8: Anova Analysis ................................................................................................. 49
Table 4.9: Coefficient of Quality of clothing and cofactors .............................................. 50

xi
LIST OF FIGURES
Figure 4.1: Gender ............................................................................................................. 41
Figure 4.2: Duration of Employment ................................................................................. 41
Figure 4.3: Position Held ................................................................................................... 42
Figure 4.4: Duration of Operation ..................................................................................... 42
Figure 4.5: Number of Employees ..................................................................................... 43
Figure 4.6: Clothing Produced ........................................................................................... 43
Figure 4.7: Market for The Clothing Produced ................................................................. 44

xii
ABBREVIATONS AND ACRONYMS
AGOA - The African Growth and Opportunity Act
ANOVA - Analysis of Variances
EPZ - Export Processing Zones
GDI -Gross Domestic Income
KAI - Kenya Apparel Industry
KTI -Kenya Textile Industry
MSMEs - Micro, Small & Medium Enterprises
SD - Standard Deviation
SMEs -Small and Medium Enterprises
SOP - Standard Operating Procedure
SPSS - Statistical Package for Social Sciences

1
CHAPTER ONE
1.0 INTRODUCTION
1.1 Background of the Problem
Quality of a product is a major influence on how successfully the product will do once
placed in the market and in the long term, its profitability. The term quality is frequently
used by both consumers and producers. The consumers are usually looking for a quality
that fits their expectation while the producers want their product to be their product.
According to Deming (1986), quality is defined as a predictable degree of uniformity. He
further states that there should be a consistency of conformance and performance and
keeping the customer in mind. For something to be categorized as good or bad, it needs
dimensions that can be measured. Sethi (2000), states that the dimensions that are used to
measure quality include; aesthetics, performance, durability, workmanship and safety.
Sethi (2000), defines quality as the superiority of the mentioned dimensions as compared
to the competing firms. This comparison of product quality between competitors is
known as relative product quality. Every firm should aim at having a high relative
product quality within the industry. Juran (1998) defines quality as having a product that
meets the needs of the customer. He says that this is achieved through three processes that
are quality planning, quality control and quality improvement. To achieve good quality
there is need to understand the needs of the customer and set goals that are in accordance
to the same.
Crosby (1979), defines quality as the full and perfect conformance to the customers’
requirements. Both Juran (1998) and Crosby (1979) agree that quality is based on the
needs of the customer and that the needs are met. Once one has done the needed research
to find the specific needs of the customer, there is then a plan needed to be put in place to
achieve that that is needed to achieve that satisfaction. Quality planning is a key
component to achieving of quality. Goals need to be set in line with the needs according
to Juran (1998). There is a need for those in charge to understand the psychology of the
customers to achieve the conformance (Deming, 1986).
The planning should be followed by measures put in place for the control of the activities.
Crosby (1979) states that quality should be free, he focuses on a zero defect production

2
process that leads to a product that has no problems or variations. He believes, and in
accordance to Deming (1986), that the product should be perfectly done and that there
should be constant uniformity all through. For zero defects to be achieved there is need
for close monitoring of the process from start to end. A firm has to be highly quality
oriented (Sethi, 2000). This means that a firm has to have goals of achieving the best
quality and have in line, the resources, procedures, planning and control to achieve this.
These goals should be communicated to everyone in the firm (Crosby, 1979). This allows
for a firm to achieve the best quality and in turn have high relative product quality and
success.
It has been observed how product orientation and in turn good quality products have
greatly grown industries in some countries and in turn their economies massively
improved. It has been argued that product quality gives an organization competitive
advantage (Dunk, 2007). This has been observed particularly in the Apparel industries of
the world. Many countries have had an apparel industry that has grown in leaps and
bounds and become a top earner of the country’s economy. Bangladesh is a good example
of this. Bangladesh for a long time depended on agriculture as the economy’s backbone.
With time and growth of population, the land to person ratio was very high and it decided
to diversify into manufacturing (Yunus & Yamagata, 2012). In the year 2014, Bangladesh
garment industry earned USD 19 million which was 80% of the export earnings. It
created employment for 4.2 million workers in 4,200 factories.
India is another case study on the success of an apparel industry. India is the second
largest producer of clothing in the world after china. The apparel industry contributes in a
substantial way towards the country’s export earnings as a result of its high product
quality. Just the apparel brings in 30% of the earning from exports. The industry creates
employment to over 15 million people and contributes to 20% of the national production
industry (Varukolu, 2007).
Sri Lanka is a similar success case after a choice of diversification of the country’s
economy by opening up industrialization as an investment option and welcoming foreign
investment. The manufacturing industry grew at a great rate and in 2014, apparel industry
as a sub sector contributed to the export earnings at 19.7%. It is a leading exporting earner
and contributes greatly to the country economy. The apparel industry of Sri Lanka is

3
highly reputable and carries praises of reliability and high quality of product
(Embuldeniya, 2015).
The similar characteristic of these three cases is the level of product quality they offer the
world and this is why the world responds to them by buying and that explains the export
earnings. It is similar with the AGOA, the quality of products created in the EPZ in
Kenya increased drastically as a result of foreign investment and the earnings moved
from USD 8.6 Million in 2000 to USD 332 Million in 2014 (Bean, 2010).
According to (Deming, 1986), quality of a product is solely keeping the customers need
in mind. This means that the products designed have to fulfill these needs and
expectation. This is the definition of quality. The country industries above are highly
quality oriented and this has led to their production of high quality clothing that led to
high demand of their product (Varukolu, 2007; Embuldeniya, 2005).
To unlock the potential of the apparel industry would mean to focus on the SMEs and
strengthen and support them into growth. Creating a growth strategy that enhances high
value addition on the product offering by encouraging original design manufacturing
(ODM) (Amolo, 2015). This would mean different stakeholders putting in effort to
improve the national value chain to develop a product offering that suites the highly
westernized needs in apparel off the domestic market and one of high quality.
The Kenyan domestic apparel industry has been in existence for a very long time. It
ranges from large to micro sized companies and this has been the case in Kenya since the
start. It includes large manufacturing firms that produce an offering meant for export to
small tailoring units that create clothing for people in their neighborhood. The apparel
industry was able to grow at a good rate after Kenya independence in 1963 (Charmy,
2013). Import substitution industrialization policies that were introduced in the period
soon after independence years were an advantage to cotton farmers and to the textile and
garment industries, as a result of the 100% duty on imported goods (Mangieri, 2006).
In the 1984, the Kenyan textile industry was able to manage the best performance in
history when the cotton farmers were able to supply 70,000 bales of cotton that were able
to very comfortably manage the demand of the local textile industry and apparel industry
(Charmy, 2013).

4
At the time the textile industry consisted of 52 textile mills (Dawn, 2015). The mills were
able to make available jobs for about 42,000 Kenyans. At that particular time the KTI,
was able to create jobs to the people and was ranked as the second largest job creator
(Charmy, 2013).
Early in the 90’s, the KTI and KAI fell apart as a result of a number of reasons. The main
one being, The Global Economic Reforms that came under the Structural Adjacent
Program’s. Also there was a Trade Liberalization that took place in Kenya in the 80s and
early 90s (Rael, 2012). There were also the issues of corruption and mismanagement in
the Cotton Board of Kenya which led to the drop of these industries (Charmy, 2013).
Having the economy of Kenya Liberalized in 1993 allows for the influx of imported good
both new and used. This gave the garment industry a kick and it collapsed (Charmy,
2013).
Liberalization of the Kenyan Economy in 1993 meant great competition from imported
clothing (Rael, 2012). In the year 2016, many years later after the liberalization, the
imported clothing still is a major problem. In the year 2014, Kenya spent U$ 96.7 Million
on second hand goods only. This translated to about 100,763 tons of used clothing
(Amolo, 2015). This shows that the demand on the garment industry is present; it is
unfortunately being satisfied by imported clothing. This is one of the reasons as to which
the locally producing and especially non-EPZ sector is failing as it is. All this money is
going to foreign countries while it should be maintained here which would help the
industry grow further. This would greatly increase Kenya’s GDI which among many
other positive results such as job creation, poverty reduction and the resurrection of the
KTI.
The apparel industry and textile industry are joined at the hip. The KTI supplied fabric
from the cotton produced by the farmers. The fabric is then used to produce clothing. The
KTI currently only supplies 45% of the textile demand. The rest of the demand is
supplied by the imported clothing both new and used and the imported fabric (Omolo,
2006). The apparel industry especially the non- EPZ sector has mostly survived by
importing fabric as is currently the case (Dawn, 2015). Ensuring that these two industries
grow together would be key to reduce the cost of production of clothing. The cost of
production of clothing in Kenya makes it very difficult to compete with second hand

5
clothing and imported clothes. The high cost of production is as a result of cost factors
such as electricity, the high cost of labor in the country, outdated equipment, extremely
difficult logistical systems and the imported fabric cost (Dawn, 2015)
The Kenya apparel industry also known as Kenya garment industry consists of thousands
of companies. It is made up of two sectors. This is the Export Processing zones (EPZ)and
the non-EPZ. The EPZ is made up of companies that came up after The African Growth
and Opportunity Act (AGOA). This was a trade program which makes the United States
market accessible to 41 sub-Saharan countries in Africa. It was originally an 8 year
agreement from October 2000 to the year September 2008, however, amendments further
moved it into 2015. It allows access to the U.S. market duty free (Bean, 2010) The EPZ is
made up of 21 companies that are able to employ about 1,800 individuals each (Dawn,
2015). Apparel from these companies is exported to the US market and none of it is used
locally.
The EPZ as a result of the AGOA act produces clothing that is intended for the
international market. As a result of the partnership, they are highly quality oriented. The
EPZ is able to access good resources, be highly mechanized and automated, access
financing and train their people well and have operating procedures that work which
greatly improves on the quality (Deming, 1986). As a result of the large numbers they do,
(Dawn, 2015), they are able to bring their costs down and with the ready demand. So both
in terms of quality and financially, they are able to perform quite well (Dawn, 2015).
The non-EPZ which is the main focus of this research is made up of very many
companies. These range in size from large to micro. The non-EPZ sector consists of about
170 companies that are ranked as large and medium and a whooping 7,400 companies
that are ranked as small (Dawn, 2015). A few of these companies do produce garment
that goes into export outside of the AGOA but most of them produce for local use from
companies in production of uniforms to the supply to hospitals and industries to small
tailoring units in the residential areas. Some produce made to measure clothing and some
ready to wear to those who are tailors in the estates (Amolo, 2015).
The non-EPZ KAI is made up of a number of different types of companies such as
specialty clothing store such as the Deacons Stores with multi-products which carry new

6
imported clothes, stand alone designer shops these are made locally such as Kiko Romeo,
local designer boutiques which carry local designer collections such as Fiona Kay, local
supermarkets which all carry new imported clothes, local tailoring units that make made
to measure clothes locally and second hand clothing vendors (Amolo, 2015). Another part
of the apparel industry that makes a decent portion of it is the uniform producing
companies. Many of these came up as a result the competition that came from imported
clothing (Fukunishi, 2012).
A big problem that is faced by the industry is the low product quality of the locally
produced apparel. This makes many of the people opt for the clothing that is imported
both new and used (Rael, 2012). Product quality in the garment industry is dependent on
the quality of fabric, the workmanship and equipment and techniques used. In Kenya,
especially in the non-EPZ sector, our biggest problem is the low product quality and that
is why the domestic market is not interested in our local product and exporting is even a
greater problem (Mangieri, 2006). The domestic market is already made aware of the
high quality apparel can have as a result of use of all the imported clothing and in turn
have also acquired a very westernized taste. Product quality is dependent on factors such
as training of workers and the skills that they acquire (Deming, 1986), the set operating
procedure that a company has put in place for production and how well it is known and
understood by the workers (Juran, 1998) and (Yunus & Yamagata, 2012).
In Kenya, many companies are not able to achieve high quality. This is as a result of
many factors such as training on how to achieve the quality from top management
downward to the employees (Dawn, 2015). For this reason, many companies do not set
up operating procedures to constantly work on achieving zero defects in the product
(Juran, 1998).The technical workers carry skills that are outdated. Many acquire their
skills from informal training which is pretty much learning on the job as they go. The
companies do not set aside resources to offer training to the workers. Many companies
are not committed to training of staff. The institutes that offer formal training also have
outdated syllabus which do not offer a competitive edge. As we know the apparel
industry is highly dynamic (Fukunishi, 2012). As a result of the lack of commitment to
achieving good quality, many companies are not quality oriented.

7
Sethi (2000), states that a company has to be highly or positively quality oriented to set
up the needed requirements to achieve good quality. One of the requirements is having a
well trained quality department that ensures that quality is the best from the raw material,
to the in-process and the final product. The quality department has to be aware of the
need and advantages of having the best quality and know what elements need to be
checked to ensure good quality and at what points. This allows zero defects according to
Juran (1998).
A company management’s core job is to be committed to ensuring that the quality of a
product is good. This product is to sell and for it to sell, its quality must satisfy the needs
of the customer. Otherwise, the customers will not be interested in it. Management should
put in line the needed arrangements and strategies that constantly improve the quality of
the products that are produced (Sethi, 2000). The continuous improvement is at the core
of good and even higher quality when comparing ones quality to that of the competitor.
According to the fathers of quality Deming (1986), Crosby (1979), Juran (1998)
continuous improvement is key and is the way to great quality and the great success of the
company, in turn industry and eventually the country.
1.2. Statement of the problem
In a good number of countries the apparel industry earnings do a lot to hold up their
economy. In countries such as China (Kane, 2015), Sri Lanka (Embuldeniya, 2015) and
Bangladesh (Blake, 2011), their manufacturing industry is a big money maker and the
apparel industry is always a top player. In Kenya, it is the absolute opposite. We spend so
much money buying from other countries both used and new clothing (Mangieri, 2006).
In the year 2014, we spend about U$ 96.7 million importing SHC. This shows that there
is a very high demand on clothing in Kenya. These imports of both new and used clothing
are not to supplement what we produce here. The apparel production in Kenya is almost
negligible. With thousands of companies that locally produce apparel, we still are not able
to set up an industry that can create apparel here within to satisfy this need. In the early
post independence years, we were doing well with the industry producing garments and
creating jobs (Charmy, 2013). Today, the poor quality of product made locally cannot
allow even the domestic market to buy from the local Kenyan industry (Rael, 2012).

8
Today, Kenya has a rundown industry with barely any textile produced and apparel made
is mainly for export (Dawn, 2015). The smaller designers and local tailors some of whom
have set up companies employing up to 50 people are left to survive with almost zero
support to grow into companies that would produce trendy and high quality garments,
create sustainable jobs and reduce poverty in Kenya (Amolo, 2015).
Good product quality means that a customer is satisfied (Yong Zheng, 2010). If a
customer is happy with the quality of products supplied, they will continue to buy. This is
what the KAI need to focus on, improving the quality of product that is produced here.
This will definitely cost to achieve (Bean, 2010; Crosby, 1979; Dawn, 2015) but the
returns are incomparable. Kenyans as a result of exposure for many years to imported
clothing have a high expectation of the quality of clothing they are willing to purchase.
With improved quality, the KAI can grow across the board from the small to the large
companies (Omolo, 2006). And investment into product quality should be made first
priority and this is through investment into technical education and training, growth of the
KTI, quality education across all levels of the company, creation of set operation
procedures to help achieve the zero defect policy, creation of well trained quality
departments within the companies (Rael, 2012) , government intervention, private sector
intervention and empowerment of workers both through technical and business
management skills (Amolo, 2015).
1.3 Purpose of the study
The purpose of the study was to establish and analyze the factors that affect relative
product quality of the SMEs in the Kenyan Apparel Industry
1.4 Research Questions
1.4.1How does a quality department affect apparel relative product quality?
1.4.2How does employee training affect the apparel relative product quality?
1.4.3How does a set standard operating procedure affect the apparel relative product
quality?

9
1.5 Importance of the Study
1.5.1 To the Apparel Industry
This was to find out where the problems in product quality lie. This is to help focus on
what can be done to improve or solve them for the industry to grow into one that is not
only used to make clothing for foreign countries but to make clothing of good quality for
the domestic market. To create a reputable name for the Kenyan apparel industry in the
world.
1.5.2 To the Domestic Market
To create clothing that is of good quality but is made locally. To ease the availability
affordability of certain garments and to reduce the use of second hand clothing. To allow
the domestic market to enjoy clothing made for them in their sizes and to buy Kenya and
build Kenya.
1.5.3 To the government
To clearly state where the problems are and to advice on how it can come in to support
the growth of the industry and in turn create earnings for the country from the industry
1.5.4 To the private sector
To make it known that the apparel industry is one that can be of great impact as it has
been in other countries such as China and Bangladesh and to encourage investments into
the industry.
1.5.5 Researchers
The findings from this study will also be used by other researchers for future references to
other studies relating to quality of products.
1.6 Scope of the Study
The study was set to analyze the industry and find out that factors lead to the low product
quality in the Kenyan apparel industry especially in the non- EPZ sector of the industry

10
and concentrating on the MSMEs who are closer to the domestic market. The study
showed that product quality in the apparel industry is of top priority to a customer and
that is why even the domestic market opts to buy imported clothing because it is believed
to be of good quality even after it has been already used.
The study was a descriptive one and both qualitative and quantitative data was analyzed.
Primary data was collected using questionnaires issued to individuals running and
managing SMEs in the Apparel industry in Nairobi area over a period of three months.
The study was carried out from April until June 2017. Data was collected and analyzed in
the month of May 2017.
1.7 Definition of Terms
1.7.1 Apparel/Garment
This is a complete clothing item ready to be worn (Phelps, 2008).A clothing item that has
gone through the process of cutting, sewing and finishing (Rajitha, 2005).
1.7.2 Product Quality
Amounts of un-priced attributes contained in each unit of the priced attribute (Garvin,
1984)
1.7.3 Technology Adoption
Taking up new technology to ease a process (Deming, 1986).
1.7.4 Ready to wear
Clothing that is made in general sizes such as large, Small etc (Phelps, 2008)
1.7.5 Made to measure
Clothing that is made to specific measurements that are measured off someone (Phelps,
2008).

11
1.7.6 Quality Orientation
Amount of emphasis that a company lays on the need for quality and their commitment
on the same (Sethi, 2000)
1.7.7 Zero Defect
Avoiding errors during production by setting up a very close monitoring culture (Crosby,
1979)
1.8 Chapter Summary
Chapter one is a brief introduction to the full analysis of the apparel industry in Kenya.
The industry is introduced and its background and its statistics. The chapter also covers
the statement of the problem to be discussed in the report and the purpose of the research.
It also states the research questions that will facilitate the topic of the research. It also
outlines the importance of the study and how various stakeholders will benefit from it. It
also discussed the scope of the study.
In chapter two, literature review on factors that affect product quality in the apparel
industry will be analyzed. This will be guided by the specific objectives of the study. The
different theories that support the main objective of the study will be discussed.
In chapter three the methodology used will be discussed, and this will include the
population of the study, the sampling procedure applied, and the methods of collection
and analysis of data. Chapter four discusses results and findings of the study. Chapter
five provides summaries and findings of the study

12
CHAPTER TWO
2.0 LITERATURE REVIEW
2.1 Introduction
This chapter will cover previously documented information on the topics of importance of
having a set aside quality department, the necessity of having employee training and
having a set operating procedure and their effects on the production of offerings of high
quality. The case of the SMEs in the KAI will be looked at as it is already documented
from prior study. Theories based on product quality will also be covered.
2.2 Effect of Quality Department on Relative Product Quality
Many industries carry many companies and firms that are competing amongst themselves.
Every firm that is in competition works towards having a high relative quality to attract
more buyers to gain a larger market share. The one way of doing this is ensuring that the
quality is good, this is the best way of gaining competitive advantage (Deming, 1986).
One sure way of managing this as a competitive advantage is through use of a well
organized and qualified quality department (Kane, Chur, Janet, & Callagy, 2015). A
quality department allows one to ensure that the quality of product is the highest and in
accordance to the need of the customers. Once one has a high relative quality, this means
that the firm will do well within the industry and this is what customers are looking for
(Ahire, Golhar, & Waller, 1996).
Crosby (1979) states that quality is free and is of the theory of zero defects. This means
that a firm should at the end of the production line give a product that has no defect. This
means that the product is ready to go to the market and will sell without return to
manufacturer. A product with defect becomes very expensive to correct (Giri & Vancza,
2015). Many times, it means that the product is thrown out and it is a total loss. The one
way to ensure that there are zero defects is through the instituting of a quality department.
Carrying a zero defect production means that the general cost of production per unit is
reduced. The qulaity department works to achieve this. However it requires a general
commitment of the entire company and different departments to achieve this. Otherwise,

13
working alone will not make a difference in the quality cause (Badri, Davis, & Davis,
1995). A company has to be quality oriented wholly and placing a quality department
without the rest of the company on board will not improve the quality issue (Sethi, 2000).
If the entire company is on board, each department doing what they should do and the
quality department enuring that they are doing so and making necessary corrections along
the way, it becomes much easier to achieve the zero defect product (Crosby, 1979).
2.2.1 Creation of a Quality Department
A quality department is one that ensures that the final packed product is of the expected
quality. It is a core department in any industry, both product and service industries. A
visible and effective quality department shows results both in quality and cost. A number
of factors have to be considered and put in line to ensure the success of the quality
department (Badri, Davis, & Davis, 1995; Sain & Abhimanyu, 2015).
A majorly important and the core factor of the success or failure of the quality department
is the top management. Just creating a quality department has no effect, the top
management has to be commited to the quality course. The top management has to be
quality oriented in itself (Sethi, 2000). This means that the management has to make and
allow for the necessary arrangments to come to fruition. This includes arranging and
setting apart the needed resources to ensure that the department is effective (Revelle,
2015). The resources are towards the support of the department such as setting up
trainings to improve skill sets, buying new technologies to allow better quality work e.t.c
(Ahire, Golhar, & Waller, 1996).
The top management also needs to create a quality awareness in the entire firm as a goal.
There is need for the clarity of the goals is quality. This influences the quality effort in a
great way and the department is greatly supported (Colledani, Tulio, Fischer, Lung, &
Lanza, 2014). Top management has to ensure that the quality is a priority for the firm.
Quality offers a competitive advantage and this allows the form to do well against their
competitiors and successfully (Deming, 1986). The top management, after it has set these
things in line, creates the quality department.
The quality department is a team that will ensure that the intended quality is achieved. To
achieve this the secret is to ensure that there is continual quality control (Juran, 1998). A

14
firm can do all the quality planning that is needed but will fail due to lack of quality
control (Oker, 2016). He states that, the secret is for the department to have control
measures set up in-process as opposed to waiting to the end when errors are already done.
This is supported by Crosby (1979) the zero defect theory.
Crosby (1979) also states that the system that will work in achievement of this is by
closley monitoring the process at every stage and correcting the errors. It is preventative.
Both Crosby (1979) and Juran (1998) agree on this and many studies have shown this as
successful (Sain & Abhimanyu, 2015). The success of many manufacturing quality goals
are based on this theory. The studies by Arditi & Gunaydin (1998); Adenuga (2013),
Bamber & Dale (2010); Blake (2011) among others support the in-process control as
opposed to the final product inspection used alone. This means that the quality
department has to be made up of people who carry all the necessary techinal skills.
Generally, employee attitude is a factor in the failure or success of the department
(Bamber & Dale, 2010). The people that make up the department have to first be involved
in the planning of the strategies for quality. This allows them to be heard and give
information that is key to the success. This way, due to the inclusion, they are able to
work at it with full ownership and attention (Groselj, 2014). There is training that also is
needed to ensure that they are aware of what exactly one is going to do. Deming (1986)
states that training is key on achievement of quality. They have to be well trained to be
able to be effective as a department.
The individuals chosen to be part of the department have to be people who can interact
with other people. They are accountable to the top management, work with the middle
management and work directly with the production floor people (Oker, 2016). They have
to be individuals who can interact smoothly with all. Since this is a step to step process,
the department has to be multi skilled (Kotey & Folker, 2007). It is best for the team to
have individuals who come from various parts of the process or are well aware of the
entire process. This will allow them to monitor step by step as they are skilled and are
well aware or trained to monitor every step for effectiveness (Arditi & Gunaydin, 1998).
The team has to be accountable to the top management, be able to work with other
departments well, but also carry autonomy when it comes to quality. This allows a whole

15
work cycle that reduces the errors and achieve the Crosby (1979) zero effect.The sole job
of this department is so that the firm employees have to understand and be very clear on
the goal of quality and they should know what specs establish quality for the firm.
2.2.2 Breakdown of the Role of the Quality Department
It is known that the quality department is supposed to ensure that the intended quality
goal of the firm is achieved in accordance with the customer needs. However, the job of
control includes different processes and duties that come together to achieve quality
control (Scott & Ashish, 2016). Total quality control is defined as a culture that is carried
by quality oriented firms which results in increased satisfaction of the customer and is
achieved through continual improvements which are a result of all employees
participating actively (Dahlgaard & Park-Dahlgaard, 2005).
The quality department involes a lot of work beyond ensuring the product is done as
intended at every stage. A big part of their job is to do researches and surveys and
anticipate the problems that could occur on the production floor. Juran (1998) states that
quality planning is key, however it has been noted that that is not enough. Once one has
planned for quality, it does not mean that the quality intended will be achieved. This is
because of the variations that occur on the floor (Colledani, Tulio, Fischer, Lung, &
Lanza, 2014). Sometimes the variations may rise from the type of raw material that comes
in, other times it could be a machine that is not in usual order, sometimes the worker skill
may fail the process even after training and at times it can be a condition maybe a
personal one or an environmental condition (Ahire, Golhar, & Waller, 1996).
These things can affect quality as they cause variations in the process. One can not really
control everything and neither can the quality department (Groselj, 2014). As the
department, they should always stay aware by constantly researching and collecting
information to anticipate some of the things that can be controlled to maintain the goal. If
a department is efficient in the anticipating problems, they are able to avoid certain errors
(Bamber & Dale, 2010). The quality department can apply the use of Statistical Process
Control (SPC) tools that enable them to dectect the causes of the mentioned variations
and more.

16
This allows them to handle them before they become or cause a problem, error or defect.
These tools also allows the department to realize where the problems lie and where there
is need for improvement. This allows the Deming (1986) theory of continous
improvement possible. The tools used for SPC include scatter diagrams, cause and effect
diagrams, pareto charts, control charts, graphs e.t.c (Bamber & Dale, 2010). This also
allows the department to analyze the process internally.
Quality is based largely on customer needs. That is why it is essential to know what the
customers are saying through the use of customer surveys. It is essential also to know
what the competitiors are up to and how the best in the industry are doing and for this
reason, benchmarking is very important (Badri, Davis, & Davis, 1995). The use of
surveys and constant analysis of internal processes is very important also. This allows the
department to look at the process and seek the problems out and act on them to improve
the processes (Gao, Yihai, & Wang, 2015). This continous improvement allows for the
quality of the firm to keep improving.
Continous improvement is a theory by Deming (1986) that insists on the continual
seeking out of problems found both in the quality and the process involved in production,
correcting these problems and hence a continous improvement process. This is a key role
of the quality department as it interacts directly with the product, it understand the specs
that are expected and directly works with the people on the production line (Revelle,
2015). A big part in achievement of continous improvement in collection of data and
relaying possible solutions to the problems to management. This allows for the top
management to plan for the resources needed to insitute these solutions (Joseph,
Rajendran, & Kamalanabhan, 1999).
The department is largely expected to solve the arising problems as it goes. Variations
occur and some may not affect the process marjorly and need be solved, it is the job of
the department to make these decisions (Sallis, 2014). It is said that a good department
interacts and works with the other employees even the technical ones. They collect
information and from this information they are able to make the decisions (Sethi, 2000).
This is a common factor in firms that are successfully quality oriented.

17
Another key role of the department is being a quality resource for the rest of firm
(Crosby, 1979). Top management looks to them to find the problems that are present and
that lead to low quality products. They are to come with proposed solutions to each of
these problems. Secondly, the department as a resource to other departments is a point of
consultation (Kane, Chur, Janet, & Callagy, 2015). In case any other department has a
query on their processe or something unusual is happening, they refer to the quality
department. Also based on the interactions with the firm, they should organize for
trainings where necessary (Joseph, Rajendran, & Kamalanabhan, 1999).
Another major role of the department is the reduction of waste and eventually reduction
of cost (Giri & Vancza, 2015). Waste is described as the increase of the cost of a unit
without the addition of value to the customer. The reason as to why many industries have
grown is as a result of a good quality product. Good quality is used as a competitive
advantage to sell however, quality goes with cost reduction (Gunasekaran, Korukonda,
Virtanen, & Yli-olli, 1993). Waste reduction is a key role in this department. It is to
reduce amount of scrap generated from each unit and also reduce greatly the number of
reworks (Ahire, Golhar, & Waller, 1996).
A way to achieve the intended quality, and the quality cost benefit that has great benefits,
is coming up with a set of standard operating procedures. This is created by interacting
with the department. They observe a lot and collect a lot of information and from this
information from all the departments, they can come up with the most efficient process of
production and this procedure is used as a set standard operating procedure (Sain &
Abhimanyu, 2015). The department is further supposed to inform the rest of the
departments of the standard procedure and ensure that there is clarity on it (Joseph,
Rajendran, & Kamalanabhan, 1999).
2.2.3 Support of the Quality Department
The firm in question is in need of quality as a competitive advantage and also to ensure
that it has a positive or high relative product quality. It is however essential for the firm to
have an orientation to quality. This means that achievement of the intended and needed
quality is a core priority for the entire firm (Sethi, 2000). The intended quality, has to be
oriented as a core part of the firm, and has to conform to the needs of the customer (Juran,

18
1998) and has to be in line and mostly better than the competitors to gain a competitive
advantage.
This burden is largely placed on the quality department. This is the main reason why the
department is put in place, however, it is impossible for the department to be efficient on
their own. They have to work hand in hand with each department playing a particular role
to allow them achieve what they are intended to do and also achieve the intended quality
(Crosby, 1979).
The main support is from the top management. It needs to be commited to the goal that is
quality (Sallis, 2014). Achievement of quality should be in line with the firms strategic
goals. This allows for the management to allow resources to be used to help the
department achieve this. For quality to be achieved there is need of resources to allow
programs such as training of the employees (Bartel, 1994). This study grealty empahsizes
on the need of the top management to arrange for the resources to achieve the needed
quality. Another need of the quality department from the top management is to allow easy
access between the two departments (Dean, 2015).
There is also the need for autonomy in the quality department. The department is in the
best place to see and observe the general production process according to Joseph,
Rajendran, & Kamalanabhan (1999) so they need some leeway to make decision on what
they deem best for the department and the general subject of quality . They are supposed
to be accountable to the top management but autonomy is essential (Oker, 2016). During
production, there are many things that occur on the floor that cause variations according
to the 1996 study done by Ahire, Golhar, & Waller. This means that the department
should be at a place to make these decisions and also make decisions concerning the
department that allows them to run swiftly and efficiently.
The department also needs a lot of support from the departments that deal and interact
with the customers directly. A good example of this is the marketing department. The
marketing department is the department that bridges the firm and the market. They talk
with the clients, know their needs and they need to relay this information to the
department. During the design process of the product, its best to have the marketing
department, manufacturing department, R and D department and the quality department

19
on the design table. According to the study by Dunk in 2007, this allows for the
coordination between these departments to come up with the most innovative, conforming
to customer needs, most possible to manufacture with the best quality. This also is in
accordance with the Crosby study in 1979 on zero defect product.
There is also a need from the concern departments to receive extrernal feed back. This
would be feed back from the customers on the perceived quality according to the 1984
study by Garvin and also feedback or information collected from the competitors through
benchmarking (Ahire, Golhar, & Waller, 1996). Benchmarking involves studying the best
performing firms within the industries and even further studying those that are not in your
industry. This allows the department to get the information on their processes and to learn
how their process is so effective (Gao, Yihai, & Wang, 2015). The customer feedback is
essential to learn what the customers are liking and not liking about the product to make
the necessary changes.
The quality department needs to be fully supported and it is in all the other departments
doing what they need to do and the coordination of the all these departments for smooth
and swift movement of information from one to the other (Giri & Vancza, 2015). This
allows the department to be effective and the quality is achieved leading to the firm
achieving the competitive advantage.
2.2.4 Effect of a Quality Department in an SME Firm
It is generally assumed that the need of a quality department is only for the large firms
that are already established (Colledani, Tulio, Fischer, Lung, & Lanza, 2014). Many
people assume this and it slows down the growth of the a small company because the
focus is lost on the quality of its product (Dunk, 2007). A quality department is a key part
of an SME firm. It aids the firm by ensuring that it puts in line the needed measures and
controls to ensure that the quality is of the highest level. This allows the company to
propel itself within the market with that as a competitive advantage (Bamber & Dale,
2010).
A quality department also allows a SME firm to cut unnecessary costs which helps the
firm use efficiently a budget that is already pressed. This also allows them to have price
as an advantage. The quality department is able to ensure reduced defects and errors and

20
hence no repetition is needed (Rao & Devadas, 2006) . it is also a resource for the
employees on what the quality goal is and how to achieve this. This allows for employees
to avoid errors in the production process. SMEs can appreciate this as they are limited in
financial resources, probably human resources and time as a resource.
Having a department that can find the easiest and most effective was of carrying out the
process helps. It also greatly helps that is helps the management of the SME to organize
and set apart the resources needed to achieve the intended quality. It helps avoid and
solve problems (Yunus & Yamagata, 2012). The quality department for and SME firm is
a key part as it ensures that the offering the firm is producing is of the best quality and
this is how a company is propelled from small and keeps growing.
2.3 Effects of Employee Training on Relative Product Quality
There is a constant increase in skill demand in every manufacturing industry, this as a
result of innovation, technology adoption and change in market trends. This is a problem
faced by many industries and training has to be picked up as fast as the rate of innovation
is moving at. Many industries face skill shortages and skill gaps at one point of the other
(Pye, 2011). In the manufacturing industry, in the era of constant introduction of new and
more improved ways of performing the same processes to improve quality such as use of
technology, for example, computer aided technology; this may be a problem when not
handled well. The adoption of the technology and new ways of performing old processes
has to go hand in hand with skill adoption. As we look at improving the quality in the
KAI, we have to consider the need of instilling of skills to work towards it (Amolo,
2015).
2.3.1 Effect of Well Trained Workers in an Organization
Organizational success is highly pegged on the workforce or the employees it carries. The
employees’ motivation, confidence, discipline and work ethic can determine the success
of the organization. According to Srivastava, Neelam & Agarwal (2016), all of these
aspects can be brought in by basically instilling the technical skills required for the
workers to be productive. When the training is in check, the worker is productive and
produces good quality clothes. According to Ratnakar & Yumiko (2007), the absence of

21
skills or presence of the untrained workers impeded productivity and product quality
greatly.
Training is said to be an activity that is highly skilled and professionally driven that aids
in the overall production process. It ensures that the process is efficient and that the end
product is of high quality (Chen & Ying, 2013). The more trained the work force is, the
better the quality of the product. This shows greatly in China where they remain highly
competitive compared to other Asian countries that have lower wages. This is as a result
of the highly trained workers (Goestch & Davis, 2015). This is as a result of their
investment in training their employees. Their product is of very high quality the buyers
opt for it (Srivastava, Anandita, & Radhika, 2016).
The increase of training has shown to result in high productivity and high product quality.
In Lesotho, manufacturing companies have highly invested in training of their workers
and the results are increased production of over 25% (Ratnakar & Yumiko, 2007). To run
the company there is the need of the management staff and like every other company,
there is always the need of support staff (Kinuthia, Mburugu, & Mutuku, 2014), all of
these staff members need to be highly trained and in turn skilled. People are of higher
value to a firm when they are trained and skilled. Well trained workers result in good
product quality (Stokus, Vaitkuviene, & Balvociute, 2015).
According to Pryor, White, & Leslie (1999), 5p model that is a strategic management
model that is made up of five key components that can make or break a firm. These
include the purposes of the firm, the principles that lead the firm, the processes that the
firm used and have set up to produce its product or services, the people working in the
firm are a key component of the theory and lastly the firms performance which includes
the metrics and the measures put in place. They key ‘P’ here is the people and the firm
should consider the qualifications and the skills carried by the people they intend to
employ. They should also look at the skill gaps in existence within the same employed
people and identify the training that is needed and ensure that it happens. Training of
employees is a major and core part of a firms quality success (Atkinson & Storey, 2016).
According to Juran (1992) quality has to be constantly improved and the achievement of
this is majorly affected by how invested a firm is in upgrading the skills of its workers.

22
This can be achieved through experience, many can argue, however, training is a great
and faster and most effective way to start the process of skill instillation (Manuti, Pastore,
Scardigao, & Giancaspro, 2015). Deming (1986) clearly stated that quality should be
constantly worked on and this can be done through having on the job training. It is
essential as customer preferences and other factors change, skills have to be enhanced.
When technology is upgraded and new ways of doing things are created such as the
seamless production in the manufacturing industry, the skills have to be upgraded along
with these changes (Sweety Jaggal, 2014).
Crosby (1979) states a theory that believes in zero defects. This means that the product
that ends up at the end of the production line has no defect in it and will not need
resources wasted on correcting the wrong or creating a new product. He states that quality
is free. One can achieve quality for free. Deming (1986) states that the only way to
succeed in producing quality products in by having a continuous improvement policy. A
key part of a continuous improvement policy is by ensuring that the skills in the company
keep improving. This is mainly through investments in training by the firm. Yesterdays
quality expectations of the customer is not what they are looking for today. Ensuring that
the skills that are needed to achieve this improved quality are available is the key to this
type of achievement (Cainelli, Marchi, & Grandinetti, 2015). Every day in all industries,
technology keeps improving. If one intends to acquire this, the skills needed to run it are
necessary. The firm needs to continuously train.
2.3.2 Employee Training at Work
Human capital is a key component of the success of the work force. If a company lacks in
this type of capital, the failure of the company is almost assured. Deming (1986), states
that training of the employees is a major factor in the successful production of quality
products. Human capital is defined as any information and knowledge that leads to
acquired skills that are built thorough channels such as educational institutions, vocational
type of training and also experience acquired from working (Behagel, Carol, & Roger,
2014). Human capital can either be generic, specific to task and also specific to firm.
Generic capital is also known as general skills that are not unique to the said firm. This
can be found in people who are employed newly to the company. Many firms when

23
recuriting choose supposedly the best people they can find, the most skilled people
(Deming, 1986).
This leads to many firms feeling that there is no need to train. Many of these generally
skilled employees will work but at the level they know. Many times, this is not the best or
most effective level of skill and may not in line with the copmanys quality goals (Edward,
Sieminski, & Zeldin, 2014). Generic skills are supposed to be converted further into task
specific skills. There are a few ways of achieving this. This could be through vocational
training and also experience from work. For a quality oriented company, training should
be a top priority (Sethi, 2000). Training has to be organized and prepared for by lining up
all the needed elements that are necessary to make it a part of the company. Companies
should all have set training policies. For the employees that work at task level skills, they
also need training to further smoothen their skills to completely be in line with the quality
goals of the company (Koinings & Varnomeligen, 2015).
Skills are best harnessed into firm specific skills. These are skill sthat are only achieved
through in-house training. A curriculum is created to suite the information in line with the
goals of the company. Arditi & Gunaydin (1998), states that in building projects, it is
essential to teach all the concern departments and especially the technical department in
the ways of the firm. This allows the employees to learn the set operating procedures and
do every of their duties as the firm should. This allows quality control (Firescu &
Popescu, 2015). The firms intended quality level is achieved through this.
Employee training systems should be focussed on the needs of the company according to
Alan, Ming, Yochanan, & Josse (2008). In Nigeria, the housing industry has terribly
suffered with errors that keep causing damages and losses to house and business owners.
The Nigerian Public housing sector is faced by many quality problems. This is as a result
of many factors but according to Adenuga (2013). One of the factors that play a big role
according to the the study, is use of poor training systems. This lack of employee training
was a general problem across all departments; the managerial, design and technical. The
lack of labour skills was ranked as the second highest factor that affects quality followed
by poor communication.

24
Arditi & Gunaydin (1998) states that training is teaching the way to high quality. If a
company achieves high quality by itself, it is competitive when it comes to relative
product quality. Sethi (2000) says that a company has to be quality oriented to ensure that
all the things that are needed to achieve qality are of the highest priority. There is an
importance in conducting training in every phase and level of a company (Renwick,
Redman, & Maguire, 2013). Many would argue that the technical department is the most
important to train. There is however value in training the supporting and managerial
departments also to help in the overall success of the quality goal (Arditi & Gunaydin,
1998).
Crosby (1979) states that quality is free. He carries a theory that states that the firm
should learn the customers needs and in line with those create a product that conforms to
those. The item has to be suited for the customer and that should be the quality goal of the
firm (Manuti, Pastore, Scardigao, & Giancaspro, 2015). They only way that the product is
made into this perfect item is through creation of systems that allow the firm to achieve
this. One of these systems is training and instilling the skills that are needed and awreness
of the quality intended into the employees through training (Hasle, 2012) .
Training is required from top to bottom and not focused on only one part of the company.
Both technical and quality training is needed. Technical training is training in your area of
work (Renwick, Redman, & Maguire, 2013). One should carry the needed skills that are
needed to do your part of the entire process. There is a training that is highly neglected
however, that is quality training. Quality training is the creation of awareness of the
quality goals of the firm and the systems set in place to achieve them (Deming, 1986).
The knowledge of this by the employees allows one to do their specific job with this as a
goal (Koinings & Varnomeligen, 2015). This allows for the intended quality to be
achieved.
Training leads to great labour productivity and one of the biggest goal of productivity is
the achievement of good quality (Bartel, 1994). Once a firm prioritizes training, the
general firm becomes competitive within the industry, regionally or even internationally
(Goestch & Davis, 2015). Competitive advantage is having a unique quality to yourself
that sets the firm apart from everyone else. Quality goals across a company are achieved
through training of every individual in the firm to do their jobs in a way that is curated to

25
achieve the quality intended (Stokus, Vaitkuviene, & Balvociute, 2015). In turn,
customers choose to buy your product as opposed to your competitiors. One of the
greatest element of competitive advantage is product quality. If a firm is able to achieve
higher product quality, then their relative product quality is perceived as high. Once the
customers realize this, they are able to buy from you. This is how the chinese
manufacturing industry grew in its leaps and bounds (Kane, 2015).
For training to occur and success to come from the training, it has to be a prioirty for a
firm (Edward, Sieminski, & Zeldin, 2014). There has to be training systems that are put in
place from all departments in the firm, both for technical and quality training. For training
to occur, there must be a cost to it, so a budget has to be set aside for training (Cainelli,
Marchi, & Grandinetti, 2015). Training carries both direct and indirect costs and it is
necessary for the firm to realize this. Direct costs include things like the participants and
facilitators costs. These also include developmental costs for the course, research
development and facility costs. There are other intangible costs such as the opportunity
cost of the training (Bloomberg, 1989). The firm has to put this into consideration for a
good organization plan. The benefits also have to be considered both tangible like the
financial implications of the good quality achieved and intangible such as improved value
of workers to the society. Training should not be looked at as a consumptive good but as
an asset that should be invested in (Behagel, Carol, & Roger, 2014).
2.3.3 Poor Training Policies
According to Kotey & Folker (2007) as the firms grows, the informal management
systems start failing and they are forced to create formal management systems and a core
part of this is create a training policy (Edward, Sieminski, & Zeldin, 2014). These allows
structured plans that covers both the technical training and quality training. This includes
allocation of resources, researches and course developments done (Bartel, 1994).
Many firms as they grow get to this particular place but many of the policies that are set
up many times may have problems here and there. The fact that the firm is transitioning
from small to medium also means that financially there might be a financial strain. This
means that there may be lack of enough investment to be put in the training (Alan, Ming,
Yochanan, & Josse, 2008). The policies are also faced by a recuritment problem (Rael,

26
2012). Many people opt to employ overqualified people with the hope that there will not
be a need to invest in training. Many times, the need and challenges of the overqualified
employees is absent and they end up frustrated and less productive. Many of them leave.
There is a problem of the focus of the training in many SME firms. They focus the
training on especially middle level employees as they assume that they will grow into
superior management and that the investmet will pay back (Firescu & Popescu, 2015). It
is unfortunate that the low level skills in SMEs are ignores and not trained, this is from
the assumption that their jobs are routine jobs and of low skilled. The market is also
thought of as saturated with the supply of low skills. In Nigeria, the construction
employees are a big cause of low quality as they are ignored and not trained (Adenuga,
2013). Lowly ranked individuals are not looked at as worth the investment. They are also
thought of as replaceable (Chen & Ying, 2013).
The level of lack of technical training in the lowly ranked employees who are actually
doing the production in fields such as manufacturing is alarming. This leads to low
quality of the product and low success of the company. This results in low product quality
(Garvin, 1984). According to Crosby (1979) zero defects is only achievable when the
process that leads to the product is error free. This is not possible without technical skills.
Training of the lowly ranked employees is core to the success of a company and great
quality (Atkinson & Storey, 2016).
2.3.4 Employee Training Systems in the SME
Training systems can be classified as informal or formal (Kotey & Folker, 2007).
Informal training systems are not really structured or planned. They happen on the job
and have little to no supervision (Manuti, Pastore, Scardigao, & Giancaspro, 2015). Many
of the smaller firms in the SME industry use this system as its opted training channel.
This explains why many of the small firms are faced by problem of poor quality. The
formal training system is one that is structured and has resources that are set aside for it
(Firescu & Popescu, 2015). These include facilitators, a developed course and a good
research that has been done on the course.
Productivity and good quality is as a result of implementation of mostly formal training
(Hasle, 2012). It is focussed on a certain problem area and the area is made better. This

27
solves a problem (Bartel, 1994). Small firms miss out on this as a result of various
factors. They hence opt for informal training which barely does the job. Smaller firms of
the SME industry avoid formal training mainly because of the cost of formal training
(Atkinson & Storey, 2016). Many small firms are already struggling and this means that
they have a budget only to do what is absolutely needed. Many of these firms feel
uncertain as they are young and may not feel stable so a training investment does not
seem like a good idea (Kotey & Folker, 2007).
As much as training is a good idea, it is called an investment because the benefits may not
show immedietly after (Bloomberg, 1989). Alan, Ming, Yochanan, & Josse (2008) state
that the best way in investing in human capital is through training them. For SMEs, the
long term benefits do not seem like a priority. They are usually concerned that once they
formally invest in training, the employees will move on to bigger and better companies
and that will be a lost investment which they can not afford (Atkinson & Storey, 2016).
Kotey & Folker (2007) also state that the formal training leads to specialization of
employees when in a small company, employees are needed to be mulitskilled for
flexibility of duties.
The SME training system most opted is the informal training system (Manuti, Pastore,
Scardigao, & Giancaspro, 2015). It is in response to a pressing need. There is no structure
in place at all. It is mostly on the job. It is learn as you go and it is difficult in this way to
move generic skills to firm specific need (Bartel, 1994). SMEs and especially the smaller
firms are reluctant to taking up the formal training of employees (Koinings &
Varnomeligen, 2015).
2.4 Effect of a Set Standard Operating Procedure on Relative Product Quality
A standard operating procedure (SOP) has been seen as a great need in many firms and
sectors across the world (Sadgrove, 2015). Sectors like medical and pharmaceutical
industries would not survive without SOPs (Sajdak, Trembath, & Thomas, 2013). The
absence of SOPs in these industries would lead to very negative results. Sectors like
education can not do with an absent SOP as it will cause many problems if people were
left to their devices. Even the financial sector highly needs SOPS in place to avoid errors
that can bring a whole firm down as we have seen happen. SOPs as a core element of a

28
firm (Alhstrom, 1996). This allows an industry such as manufacturing to offer products
that are of the highest qulaity. A firm that is run through a known and well presented SOP
to the employees allows them to clearly know what is expected of them and how to
achieve this (Becker & Kugeler, 2015). They carry a high or positive relative quality and
this gives them such a god competitive advantage.
SOPs are key elements of a firm despite the size or income. Even as indivivuals, everyone
has some sort of routine that they follow at some point in the day. What would turn this
into an SOP is by documenting it (Hale & Boyrs, 2013). Small firms with small business
are require an SOP. This allows anyone who is working in the firm to know excatly what
is expected of him or her and also what precceeds them. An SOP is supposed to cover all
parts of the production process and should be presented in a good organized matter
(Kuratko, Hornsby, & Covin, 2014).
An SOP is defined as a document that contains a detailed instructions of a repetitive
activity that is followed by a firm to achieve the goals the firm has such as uniformity,
good consistent quality and product performance (Peltier, 2014). It is also a document
that clearly states the person who does what activity and how he or she does it and why
this activity is done (Gidey, 2012). This creates a very clear procedure that all employees
can follow and understand. This also allows the creation of a great training program
according to Bloomberg (1989) that is needed once the SOP is created.
In large companies, SOPs carry a great influence on the type of final product produced.
Large firms have very little control over every worker as compared to smaller firms
(Dahlgaard & Park-Dahlgaard, 2005). It is however best to have instructions that guide
everyone. An SOP comes in handy when each worker knows exactly what they are
supposed to do and are held accountable for it (Turker & Altuntas, 2014).
SOPs reduce the variations that affect the product quality. Crosby in his 1979 study stated
that to achieve zero defect, one has to eliminate all the errors that come along the way.
This means that the final product will be carrying no errors and this means that the
product will be of good quality while ensuring the cost of production stays down
(Bolouri-Yazdel & Bozorg-Haddad, 2014).

29
2.4.1 Development of a Standard Operating Procedure
Standard operating porcedures are not a one size fits all. Different firms can not have the
same SOP across the board. This is because each firm is from a different industry and
most importantly the goals of each firm are different and the SOPs are heavily based on
the goals of the firm (Jurado & Fuentes, 2014). In larger firms, with a production process
that is multi level, there is a need for every single activity to have a SOP specific to the
task. These SOPs all tie into the general firms SOP (Garvin, 1984). The main elelment to
consider before creating a SOP is the purpose of the operationor the goals of the company
(Bolouri-Yazdel & Bozorg-Haddad, 2014).
The firms purpose of operation is the core base of the SOP. This procedure is created for
this purpose. A muanufacturing firm’s goal would be to give a good quality product
(Badri, Davis, & Davis, 1995). Once the goal is stipulated, the needed equpiment and any
other material is listed down. With these two stated, the third elelment of the SOP is to
realize the activities that are needed for the process to take place. The activities make up
the SOP when they are put down with detail (Gidey, 2012). The SOP is a core influence
on the quality (Juran, 1998) and hence these three elements of the SOP have to be
considered to ensure that the SOP is developed correctly.
The SOP is made for the workers to use, so it is advisable to involve them in the process
of its development (Jurado & Fuentes, 2014). The inclusion is of most importance when it
comes to motivation of the workers, implementation of the SOP and the adherance of the
same (Arditi & Gunaydin, 1998). The workers should be allowed to include their views
and suggestions as especially they are the ones on the floor and performing the activities
of the procedure (Boin & Van Eten, 2013). The workers will feel like they are heard and
they feel some sense of ownership of the SOP as opposed to the SOP being pushed upon
them (Gunasekaran, Korukonda, Virtanen, & Yli-olli, 1993). When a firm collects the
suggestions and information carried forward by the workers, they should go a head and
test it and futher refine it and implement it as part of the SOP (Kuratko, Hornsby, &
Covin, 2014).
To start the development process, one has to plan and planning involves laying down the
goals that the firm carries and its values (Becker & Kugeler, 2015). This allows the writer

30
of SOP to get the general idea of where the procedure should head based on the goals
(Bamber & Dale, 2010). The goals intended by the firm and the information that is
collected from the workers help to start the process. The writer also should carry a lot of
information and knowledge on the activities of the firm (Bamber & Dale, 2010).
The second part of the process of the SOP development is the drafting. With the goals in
place, workers input and technical know how from the internal environment, the writer
should put together the first draft. The development of the SOP ties in a firms strategic
quality goal (Turker & Altuntas, 2014). This draft is expected to be a detailed
documention of the step to step activities that happen in the general procedure. It is best
that the draft is done from observation. This way the actual detail of the activities are
captured which will lead to a detailed more effective SOP (Gidey, 2012). Once one has
observed, then the next thing is presenting it in an organized way. Crosby in 1979 in his
theory quality is free, he states that the system of quality is prevention. This is what the
SOP allows a firm to do.
An SOP can be very effective if developed right but can led to failure of the firm if not
written well (Sajdak, Trembath, & Thomas, 2013). It needs to be written in a way that is
well observed, presented and reviewed. The third step after drafting is the reviewing of
the draft. It has to be reviewed to ensure that the information is legitimate but also that the
procedure that is proposed is funtional (Hale & Boyrs, 2013). The review is done in two
phases. The internal review. Is done by the people within the organization and
particularly those who directly interact with the intended procedure and its activities.
They will see that their input was appreciated and if they have more suggestions and
correctional input they can forward it to the writer (Alhstrom, 1996).
Alhstrom in his 1996 study also stated that there is a need for the review to be extended to
an external one. This is the presentation of the draft to individuals who are technically
trained to understand the procedure and break it down from that perspective to see the
loopholes and advice on how to best correct them (Bolouri-Yazdel & Bozorg-Haddad,
2014). The fourth step after the review is to revise the draft based on the information
collected from the internal and external sources.

31
This is then followed by a test of the reviewed document (De Treville, Antonakis, &
Edelson, 2012). A test is necessary as the reviewed document is still largley based on
theoretical knowledge and observation. The best way to test this out according to Gidey
(2012) is to ensure that the person testing the document out is a person that is not familiar
with the work. It should be an easy and simple presentation of the document that the
person should be able to follow. The writer should be observing and noting the points of
low clarity to correct them.
After correction, the document is done and should be posted to the concern parties. It
should be clearly documented and placed at a central location or locations where people
can easily access and get the information needed (Peltier, 2014). A copy should be put
away for record. The staff should then undergo a detailed training on all things procedure.
Training leads to understanding of what is expected by the firm. Task specific training
should be offered to the different individuals to learn exactly the skills needed to achieve
the procedure as expected and for the firm to achieve the intended goals (Alan, Ming,
Yochanan, & Josse, 2008). The training also allows for the employees to understand the
SOP and have clarity on it to avoid any sort of misinterpretation that will lead to errors
during the procedure (Badri, Davis, & Davis, 1995).
Training is now followed by control measures of the SOP and the necessary checks to
ensure that the procedure is working well. If there are still loopholes, solutions should be
created and implemented (Bloom, Eifert, Mahajan, & Mackenzie, 2016). In the event that
there is a better way of doing some things, improvements can be made towards efficiency.
Any mistakes that happen as the procedures continues, then the corrections need to be
made. It is a continous process (Gunasekaran, Korukonda, Virtanen, & Yli-olli, 1993).
The SOP has to be developed well and also presented well. The presentation should be
clear. The sentences written in simple language. This allows for everyone to be able to
understand the procedure. This allows adherance and the effectiveness of the Sop. It is
best written in active voice and a present verb tense. This avoids sentences like ‘ you are
expected” which is direct and can cause lack of motivation. It should also not be
redundant. It should be detailed but not lengthy (Sajdak, Trembath, & Thomas, 2013).

32
2.4.2 Who Develops the Standard Operating Procedure
This is a topic that is not totally agreed on. Some studies say that the best individuals to
come up with the SOP is the quality department (Bamber & Dale, 2010). This is because
they are intereacting with the total procedure from start to finish and carry the technical
know how of the activities. They are also advised upon because they are in constant
observation and can make the necessary changes to the SOP to make it the best procedure
possible (Cainelli, Marchi, & Grandinetti, 2015).
Others state that the best people to make the SOP are technical experts of the work. This
is because they believe that the experts are external and hence should be objective (Rao &
Devadas, 2006). They just need to be well informed of the activity and they have the
technical knowledge of the details of the activities. This can be useful especially in firms
that do not carry a quality department for one reason or the other.
It is also adviced highly that if the firm carries a multi-skilled procedure, it is best to
approach the development through a team (Becker & Kugeler, 2015). This team should
have a representative from every concern dpartment. This way, they are able to grasp
even the smallest details to be used in the SOP. Each department representative can create
their own department specific SOP and when the team comes together compares all of
these and comes up with the most effective general procedure (Sajdak, Trembath, &
Thomas, 2013).
2.4.3 Importance of a Standard Operating Procedure to an SME
The greatest importance of a SOP is the achievement of quality as intended in
conformance to the customer needs and providing this quality consitently (Firescu &
Popescu, 2015). An SME’s biggest weapon should be the quality of the product it offers.
The SOP is able to allow the firms production arm to avoid things and situations that
cause variations that lead to these inconsistencies in quality. These inconsistencies lead to
variations that affect the quality of the product or service. It allows each individual to
know what exactly is expect of them in their activity (De Treville, Antonakis, & Edelson,
2012). All workers end up working in a uniform way across departments. And with every
unit every employee performs an activity in the same exact way.

33
The SOP is also a record holder. It allows the SME firm to hold the knowledge and
information. This can then be easily transferred where there is a need. Many time
employees can leave a job or resign or retire or just be on temporary leave (Sallis, 2014).
This is particularly common in a SME firm where there is al ot of employee turnover. The
new person has a resource in the SOP to get to know what exactly is expected of them.
The SOP also largely reduces misinterpretation and miscommunication within the firm. It
creates clarity (Gidey, 2012). It also greatly imcreases the speed of the integration of a
new employee.
SOPs allow the SME firm to stay compliant to any regulations that they need to adhere to.
The SOP is written with this in mind. The firm is always protected when it comes to
compliance. Especially when an SME firm is still young, there are very many things to
put into consideration and a lot that is coming at the management that they can forget
things like regulations. Ignoring these can lead to a firm ending up into a lot of problems
(Sadgrove, 2015). Also the SOP allows the firm to ensure that the workers are working
with a procedure that is concern for their safety (De Treville, Antonakis, & Edelson,
2012). The SOP has a number of importances and this is why all firms, large and small
should adopt the use of a well developed Standard Operating Procedure.
2.4.4 Effect of a Standard Operating Procedure on Quality
An SOP is a key element in achieving the goal of quality (Arditi & Gunaydin, 1998). It is
essential to realize that the main reason of picking up an SOP for a firm is to ensure that
the activities that lead to the production of an offering are well understood by all that are
involved in the production (Badri, Davis, & Davis, 1995). It also allows the people who
are part of the production to have a point of consultancy as to what they should be doing
in their activities (Becker & Kugeler, 2015). These are important factors that affect the
eventual quality of the offering. The SOP allows for people to have no errors in their
production. It reduces quality risk and encourages zero defects (Crosby, 1979)
The SOP is made with the base being the goals intended by the company. So, with an
SOP they are able to communicate in clear and simple language what the expected quality
goal is (Turker & Altuntas, 2014). When everyone is working, they are able to be clear on
what they are working towards. An SOP is able to help the people in the production floor

34
to do their jobs and always give a product that is of the expected quality because they are
clearly told what to do and how to do it and also what level of qualoty they are looking to
achieve (Bolouri-Yazdel & Bozorg-Haddad, 2014).
2.5 Chapter Summary
This section has reviewed literature in line with the topic and research objectives of this
study. This data has been retrieved from journals websites and previous studies done. The
next chapter considers the methodology to be applied for the study.

35
CHAPTER THREE
3.0 RESEARCH METHODOLOGY
3.1 Introduction
The study was conducted and analyzed the factors that affect the relative quality product
of SMES in the KAI. This chapter will seek to outline the methodology that will be
applied to do the research. It consists of a layout for the population choice, the collection
of information, measurement and analysis of the information that was acquired.
Therefore, in this section, the researcher will describe the strategies that were used and
techniques that were utilized in the collection, processing and analysis of data.
3.2 Research Design
The study took up the approach of a descriptive survey. This aided in recognition of the
factors that affect the relative product quality in the SME sector of the KAI. The
descriptive design was taken as the proper one to use because the core interest of the
research was to analyze and establish the relationship between the factors and the
industry’s relative product quality. Cooper & Schindler (2014), states that a descriptive
study is interested in finding the elements that are what, where and how of a
phenomenon. Descriptive research design was chosen because it allowed the researcher to
generalize the results to a larger population.
According to Saunders, Lewis, & Thornhill (2012) it is of essence and necessary to apply
the use of data where subjects are observed in their normal and natural set ups without
introducing of foreign elements into the environment. It comes very much in handy when
there is a need to collect an individual’s opinions and attitudes on a particular case or
problem. It is efficient when it comes to collection of information that is needed to
explain further the attitudes and opinions that are views in their natural environment. In
this case, it thoroughly came in handy when the collection on data on the views of the
SME owners in the Kai over relative product quality.

36
3.3 Population and Sampling Design
3.3.1 Population
A population is a clearly defined group of people, things, elements, events that are being
investigated or from whom a researcher needs to draw inference from. It should be a
homogenous group (Denscombe, 2007). The target population of the study was on KAI
SMEs in Nairobi. It will focus particularly on the owners or those in management of these
SMEs. From the KAM and AFDAK directories, there are 800 in number.
Table 3.1 Target Population
Category Population Percentage
Small Enterprises 600 75
Middle Enterprises 200 25
Total 800 100
Source: KAM and AFDAK directories (2016)
3.3.2 Sampling Design
3.3.2.1 Sampling Frame
A sampling frame is in relation to the target population. It consists of the elements from
which the research sample is chosen from. It is the entirety of the population (Cooper &
Schindler, 2014). The sampling frame of this study was drawn from The Association of
Fashion Designers of Kenya (AFADK) and the Kenya Association of Manufacturers
(KAM) directories. These gave 800 SMEs based in Nairobi.
3.3.2.2 Sampling Technique
The stratified random sampling was used. The target population was subdivided into
groups with identifiable strata which is chosen based on an attribute or a few attributes
(Saunders, Lewis, & Thornhill, 2012). The groups allowed the study to have a sample that
allowed total representation of the entire population. This allowed the researcher to pick a
sample from all groups which makes the entire sample representative in a proportional
way. One, however, has to make sure they are aware of what the strata of the population
that are identifiable are. The advantages of this way are, the total cost of the survey will
be reduced by the reduction of each observation and also having estimates for each sub
population instead of doing the entire which would be very expensive. It also allowed all

37
members and the elements of the entire population are included in the study and that
estimates of the parameters will be used for each sub-population. A random sample was
preferred because it is free from bias and therefore each unit had a chance to be included
in the sample.
3.3.2.3 Sample Size
There is a common discussion as to how large or small a sample should be. According to
Cooper & Schindler ( 2014), a sample size should be dependent on the variation that the
population carries. It is however known that the larger your sample size the lesser the
potential errors. According to Saunders, Lewis, & Thornhill (2012), the choice of sample
size should be a result of a number of factors, the percentage of error allowed in your
study. One needs to figure the allowable error, the choice type of analysis that will be
utilized and the entire size of the population. A census is however expected to be taken
when the population one is focusing on is of 100 elements or less. This means that the
whole population should become the sample. In this case, the total population is of 800
companies. According to Field (2005), anything above a population of 800 should carry a
20% sample size, so our sample was made of 160 companies and the target was the
owners or those in management of the company.
Table 3.2 Sample Size
Category Population Sample Ration Sample Size
Small Enterprises 600 0.20 120
Middle Enterprises 200 0.20 40
Total 800 0.20 160
3.4 Data Collection Methods
Cohen, Manion, & Morrison (2011), state that there are many ways of approaching data
collection. This is done through tools that are chosen after considering the elements of the
samples. One has to consider the attributes of the samples. Other factors that one should
consider when choosing a tool is the topic of research, the problem being researched on,
the intended aim of the research, the type of data that will be expected and the results that
will come from the study. All of these have to be considered because every tool was used
to collect specific information.

38
This study used primary data that was collected from the respondents of the chosen
sample. The respondents in this case were the SME owners or managers in the KAI. The
tool that was of choice in the study was the questioner. It was based on the research
questions that were the guide study. The questionnaire had subsections. One of which
contained the information that tells more of the company, its background, its period of
operation, kind of items it produces and its intended market. It also covered the position
that the respondent held and asked how long the respondent had worked for the company.
The second sub section allowed the researcher to analyze the factors affecting relative
product quality in the SME sector of the KAI. For interval measures, a five- point Likert-
scale (1- ‘strongly agree’ to 5- ‘strongly disagree’)/(1- ‘very high’ to 5-‘very low’) will be
used to measure respondents’ agreement with the concept under investigation.
Secondary data was also collected for this study. This data was useful for generating
additional information for the study from already documented data or available reports on
the KAI and other country’s apparel industries. Kothari (2006) says that secondary data is
an essential quantitative technique for evaluating historical or contemporary confidential
or public records, reports, government documents and opinions.
3.5 Research Procedure
The procedure was started by getting authorization from USIU to collect the data. This
was received by obtaining an introductory letter which was presented to every
respondent. A pilot test of the questionnaire was done by administering it to 20
respondents of which the results were not included in the eventual data. This allowed for
any corrections that were needed to be addressed accordingly. This step was necessary
ensured that the tool was reliable and objective according to Mugenda (2003).
The researcher administered the research instruments individually to a sample of 200
SMEs in the KAI. The researcher exercised care and control and ensured that all
questionnaires were issued to the respondents and to achieve this, the researcher
maintained a register of questionnaires which are administered and those which were
received.

39
3.6 Data Analysis Methods
This is the breaking down of the information collected to answer the questions the study
is based on. One needs to calculate and score each questioner. This is followed by
tabulation and the coding of the data. The procedure for data analysis involved first
coding the data into the Statistical Package for the Social Sciences (SPSS). Coding is
simply assigning a number to a piece of group of information that was collected, with the
intended aim of allowing the collected data to be taken through analysis in quantitative
terms. The statistical tests that were taken were used to draw out a different analysis. The
descriptive statistics tests were used to determine the mean (M) distribution, frequency (f)
and standard deviation (SD) of the data. The mean, as stated by (Cohen, Manion, &
Morrison, 2011), is what most people think of when they are simply thinking of what the
“average” is. The standard deviation, allowed the researcher to measure how far the data
deviate in relation to the mean. Once the descriptive statistics was applied on the
collected data, the results were summarized on different tools such as charts, graphs and
tables this allowed the researcher to investigate and draw conclusions on the relationships
that existed between the independent and dependent variables in question.
3.7 Chapter Summary
This chapter has outlined the strategy layout of data collection and the data analysis. It
has given a proper layout of the choice of research design, the intended population, the
design that will be used to pick sample. It has gone further to describe the choice of data
collection methods, research procedures and the chosen data analysis procedures. Chapter
four looks at the data collected and its analysis.

40
CHAPTER FOUR
4.0 RESULTS AND FINDINGS
4.1 Introduction
This chapter presents the results obtained from analyzing the data collected. The data are
analyzed in line with the specific objectives of the study which were to establish the
effects of quality department, employee training and operating procedure on the quality of
clothing.
4.1.1 Response Rate
A total of 160 questionnaires were distributed to small and medium enterprises and only
119 questionnaires were filled and returned giving a response rate of 74.7%, which was
considered sufficient for the study and the results are presented in table 4.1.
Table 4.1: Response Rate
Variable Distribution
Frequency Percentage
Filled and returned 119 74.7
Non-response 41 25.3
Total 160 100
4.2 Demography
This section presents the findings with regard to the various demographical features of the
respondents.
4.2.1 Gender
An analysis of the gender revealed that female gender had the highest number of
respondents representing 61% of the total while male was only 39% as shown in figure
4.1.

41
Figure 4.1: Gender
4.2.2 Duration of Employment
As shown it table 4.2 respondents who had been in the various firms for Less than 1 year
were 5 representing 4%, while those of 1-2 years were 46 and represented 39%. Those of
3-5 years were the majority at 53 and represented 45%, in addition, those who had been in
employment for 6-8 years were 12 and represented 10%, while those of 9-10 years were 2
and represented 2%. The least were those above 10 years and they represented 1%.
Figure 4.2: Duration of Employment
46
39
73
61
0
10
20
30
40
50
60
70
80
frequency percentage
male female
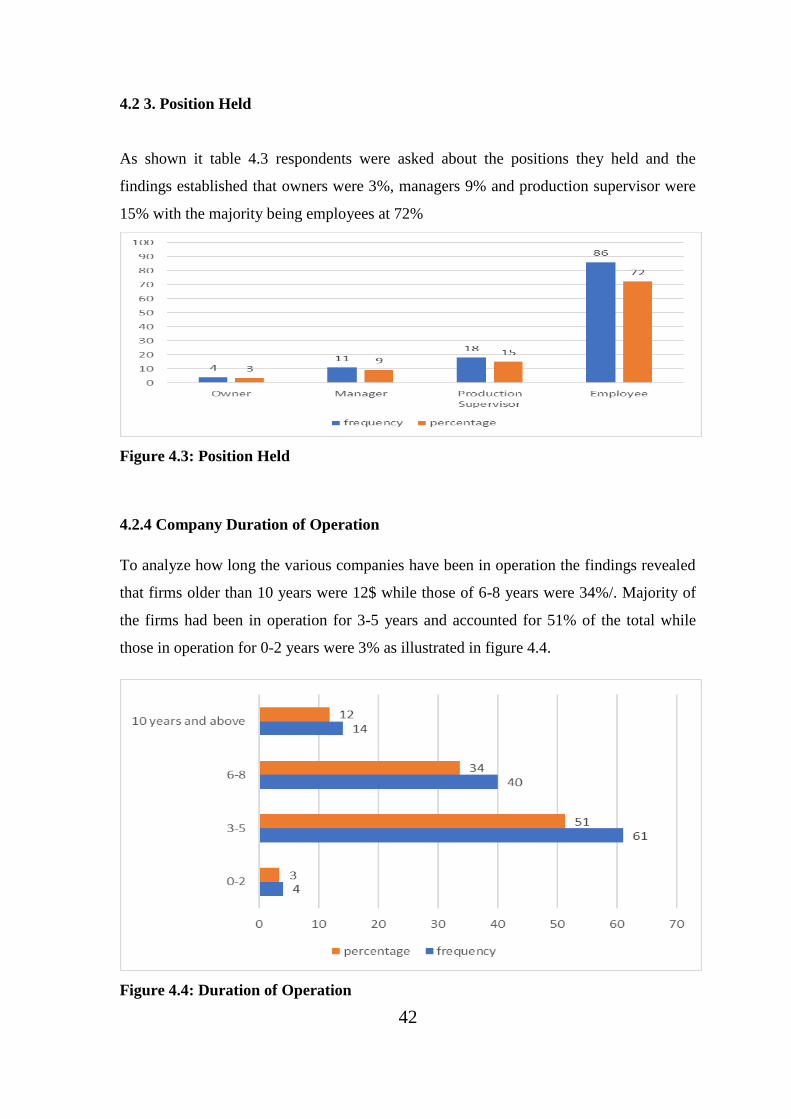
42
4.2 3. Position Held
As shown it table 4.3 respondents were asked about the positions they held and the
findings established that owners were 3%, managers 9% and production supervisor were
15% with the majority being employees at 72%
Figure 4.3: Position Held
4.2.4 Company Duration of Operation
To analyze how long the various companies have been in operation the findings revealed
that firms older than 10 years were 12$ while those of 6-8 years were 34%/. Majority of
the firms had been in operation for 3-5 years and accounted for 51% of the total while
those in operation for 0-2 years were 3% as illustrated in figure 4.4.
Figure 4.4: Duration of Operation

43
4.2.5 Number of Employees
As highlighted in figure 4.5 most of the firms with 0-10 employees represented 73%
while firms with 11-20 employees represented 24% and those with 21-30 employees were
3% and the least were firms with 31-40 at 1%
Figure 4.5: Number of Employees
4.2.6 Clothing Produced
In regard to the nature of clothing produced the findings revealed that firms who process
the adult ready to wear clothing 29%, firms that deal in adult made to measure were 41%,
those who were work wear 25% and baby clothes were 4% as indicated in figure 4.6
Figure 4.6: Clothing Produced

44
4.2.7 Market for the Clothing Produced
As presented in figure 4.7, the findings revealed that most of the market for the clothing
produced was domestic and accounted for 96% of the respondents while those produced
for the regional market was only 4%
Figure 4.7: Market for the Clothing Produced
4.3 Effects of Quality Department on the Clothing Quality
The first objective sought to establish the effects of quality department on the clothing
quality and several statements were posed to the respondents and for each they were
prompted to pick the appropriate number on a scale from 1 to 5 where: 1= Very Low, 2=
Low, 3=Medium 4= High, and 5= Very High
4.3.1 Descriptive on Effects of Quality Department on the Clothing Quality
The findings revealed that there was a high extent of autonomy of the quality department
(Freedom to run the department as they find fit) (4.34), and high extent was also
experienced when quality department coordinates with other departments (4.28), most
respondents also noted to a high extent that there was visible quality department (4.17)
and quality department has access to the top management (4.02).
The study also established that to a medium extent the quality department was considered
effective (3.40) and quality department staff are utilized as a consulting resource (3.37). It
was also noted to a medium extent that quality department was accountable to top
management (3.24) as shown in table 4.2.

45
Table 4.2: Descriptive on Effects of Quality Department on Clothing Quality
Variable MEAN SD
Extent to which there is autonomy of the quality department
(Freedom to run the department as they find fit)
4.34 .397
Extent to which the quality department coordinates with other departments 4.28 .514
Extent to which there is a visible quality department 4.17 .528
Extent to which the quality department has access to the top management 4.02 .394
Extent to which the quality department is effective 3.40 .587
Extent to which the quality department staff are utilized as a consulting
resource
3.37 .687
Extent to which the quality department is accountable to top management 3.24 .607
4.4 Impact of the Employee Training on the Quality Of Clothing
The second objective sought to establish the Impact Of the employee training on the
clothing quality and several statements were posed to the respondents and For each they
were prompted to pick the appropriate number on a scale from 1 to 5 where: 1= Very
Low, 2= Low, 3=Medium 4= High, and 5= Very High.
4.4.1 Descriptive on the Impact of Employee Training on the Quality of Clothing
The finding revealed that to a medium extent there are available resources for employee
training (3.93) and top management is committed to employee training (3.71). However,
to a low extent it was revealed that quality achievement training is given to management
(2.87) and specific technical skill training is given to every employee (2.82). The study
also established that extent to which technical training is a continual process was a low
one (2.76) and employee training was not considered much as a core part of the company
(2.76) as well as quality achievement training is given workers (2.72) as shown in table
4.3.
Table 4.3: Descriptive on the Impact of Employee Training on The Quality of
Clothing
Variable MEAN SD

46
Extent to which top management is committed to employee training 3.71 .633
Extent to which there are available resources for employee training 3.93 .899
Extent to which specific technical skill training is given to every employee 2.82 .799
Extent to which technical training is a continual process 2.76 .736
Extent to which quality achievement training is given workers 2.72 .700
Extent to which quality achievement training is given to management 2.87 .839
Extent to which employee training is a core part of the company 2.76 .663
4.5 Impact of the Operating Procedure on the Quality of Clothing
The third objective sought to establish the impact of the operating procedure on the
clothing quality and several statements were posed to the respondents and for each they
were prompted to pick the appropriate number on a scale from 1 to 5 where: 1= Very
Low, 2= Low, 3=Medium 4= High, and 5= Very High.
4.5.1 Descriptive on Impact of the Operating Procedure on the Quality of Clothing
The findings revealed that to a high extent there was a thorough final inspection of the
clothes (4.08) and incoming raw material (4.06), as well as clarity of work and process
instructions given to employees (4.03). There was also a high extent of continuous self-
inspection (4.00).
The findings also revealed that to a medium extent the process minimizes the chance of
employee error (3.98). In addition, constant preventative equipment maintenance (3.93)
and process inspection (3.88) was also done to a medium extent.

47
Table 4.4: Descriptive on Impact of the Operating Procedure on the Quality
Variable MEAN SD
Extent to which there is clarity of work and process instructions given to
employees
4.03 .356
Extent to which the process minimizes the chance of employee error. 3.98 .411
Extent to which there is a thorough inspection of the incoming raw
material
4.06 .397
Extent to which there is continuous self- inspection 4.00 .432
Extent to which there is in-process inspection 3.88 .679
Extent to which here is a thorough final inspection of the clothes 4.08 .497
Extent to which there is constant preventative equipment maintenance 3.93 .578
4.6 Relative Clothing Quality
The study also sought to establish the factors affecting relative clothing quality clothing
quality and several statements were posed to the respondents and for each they were
prompted to pick the appropriate number on a scale from 1 to 5 where: 1= Very Low, 2=
Low, 3=Medium 4= High, and 5= Very High.
4.6.1 Descriptive on Relative Clothing Quality
Analysis of the variables established that to a medium extent having a quality department
improves the clothing quality (3.68) and clothing the company produces is of superior
quality compared to the competitors (3.58). It was also noted that having a set operating
procedure had a medium extent on improving the clothing quality (3.58). The clothing
produced were also found to be equivalent quality compared to the competitor to a
medium extent (3.24).
Employee training was found to have a medium extent on improving the clothing quality
(3.22) and sales volume was also averagely achieved due to the quality of the clothing
(3.03).On the other hand, sales decline in volume in the past year had minimal association

48
with the quality of clothing produced (2.74) and most of the respondents noted that to a
low extent the clothing produced is of inferior quality compared to the competitor (2.35).
Table 4.5: Descriptive on Relative Clothing Quality
Variable MEAN SD
The clothing the company produces is of superior quality compared to the
competitors
3.58 .707
The clothing we produce is of equivalent quality compared to the competitor 3.24 .747
The clothing we produce is of inferior quality compared to the competitor 2.35 .850
The sales volume in the past year was achieved cause of the quality 3.03 1.053
The sales volume in the past year were reduced cause of the quality 2.74 .764
Having a quality department improves the clothing quality 3.68 .703
Employee training improves the clothing quality 3.22 .865
Having a set operating procedure improves the clothing quality 3.58 .707
4.7 Inferential Statistics
To establish the relationship between the dependent variable and the independent variable
the study undertook a correlation and regression analysis.
4.7.1 Correlation Analysis
As shown in table 4.6 a correlation analysis was done between quality of clothing against
quality department, employee training and operating procedure. The findings established
that there was a positive correlation between quality of clothing and quality department
(r=0.254, p< 0.01). No correlation was established between employee quality of clothing
and Training (r=0.127, p=0.169); operating procedures (r=-.073, p=0.432).
There was also a significant correlation between quality department and employee and
training (r=.620, p<0.01).
Table 4.6: Correlation Analysis
Variable
Clothing
Quality
Employee
Training
Quality
Department
Operating
Procedures
Clothing Quality 1

49
Employee Training .127 1
.169
Quality Department .254** .620** 1
.005 .000
Operating Procedures -.073 -.150 -.094 1
.432 .103 .309
4.7.2 Regression Analysis
A regression analysis was done between quality of clothing against quality department,
employee training and operating procedure. The findings established that the R squared
was 0.069 therefore only 6.9% of the variation in quality of clothing was caused by the
variations in quality department, employee training and operating procedure as shown in
table 4.7
Table 4.7: Model Summary
Model R R
Square
Adjusted
R Square
Std. Error
of the
Estimate
Change Statistics
R Square
Change
F
Change
df1 df2 Sig. F
Change
1 .262a .069 .045 .40785 .069 2.835 3 115 .041
a. Predictors: (Constant), Quality department, operating procedures, employee training
To determine whether any of the differences between the means was statistically
significant, An ANOVA analysis was done at 95% confidence interval and the P-value
was (0.041) and therefore significant. This implied that not all of population means were
equal as indicated in table 4.8.
Table 4.8: Anova Analysis
Model Sum of Squares df Mean Square F Sig.
1 Regression 1.415 3 .472 2.835 .041b

50
Residual 19.129 115 .166
Total 20.544 118
a. Dependent Variable: clothing quality
b. Predictors: (Constant), Quality department, operating procedures, employee training
As per Table 4.9, the equation (Y= β0+ β1X1 + β2X2 + β3X3) becomes:
Y= 1.998-0.038X1 -0.092X2+0.434X3
Where Y is the dependent variable quality of clothing
X1 – employee training
X2 – operation procedures
X3 –quality department
Table 4.9: Coefficient of Quality of clothing and cofactors
Model Unstandardized Coefficients Standardized
Coefficients
t Sig.
B Std. Error Beta
1
(Constant) 1.998 .833 2.398 .018
Employee Training -.038 .077 -.057 -.497 .620
Operating
Procedures -.092 .153 -.055 -.601 .549
Quality Department .434 .175 .284 2.479 .015
The regression equation illustrated in Table 4.9 has established that taking all factors into
account (Quality department, operating procedures, employee training) all other factors
held constant quality of clothing increases by 1.998. The findings presented also showed
that with all other variables held at zero, a unit change in employee training had no
significant effect on clothing quality, and a unit change in operating procedures also had
no significant effect on clothing quality. However, the study showed that a unit change in
quality department would affect a clothing quality at a significant level. From the analysis
only the variable quality department was significant (p<0.05). This implies that at the

51
clothing factories the quality department is the main determinant of the quality of clothing
produced.
4.8 Chapter Summary
This chapter has presented the results and findings from the data analysis undertaken. The
first parthas presented a pictorial presentation from the analysis done on the demographic
data, the second section dealt with data on quality department, the third section looked at
the findings from the analysis done on employee training, and the fourth section shows
the findings from data on operation procedures. In chapter five the results established will
be discussed and conclusions and recommendations made.

52
CHAPTER FIVE
5.0 DISCUSSIONS, CONCLUSIONS AND RECOMMENDATIONS
5.1 Introduction
This chapter presents the discussions in with regard to the findings established in the
previous chapters. This is chapter also presents the conclusions and recommendations
made from the findings.
5.2 Summary
The purpose of the study was to establish the factors that affect product quality of the
SMEs in the Kenyan Apparel Industry. The study was guided by the following research
questions: How does a quality department affect apparel product quality? How does
employee training affect the apparel product quality? And how does a set operating
procedure affect the apparel product quality?
The study took up the approach of a descriptive survey. This aided in recognition of the
factors that affect the relative product quality in the SME sector of the KAI. The
descriptive design was taken as the proper one to use because the core interest of the
research was to analyse and establish the relationship between the factors and the
industry’s relative product quality. The target population of the study was on KAI SMEs
in Nairobi. It will focus particularly on the owners or those in management of these
SMEs. From the KAM and AFDAK directories, there are 800 in number. A random
sampling technique was used. The stratified option was the best to use considering the
population in question. From the population of 800 and by use of the rule of thumb a
20% sample size was considered, so our sample was made of 160 companies and the
target was the owners or those in management of the company.
A total of 160 questionnaires were distributed to small and medium enterprises and only
119 questionnaires were filled and returned giving a response rate of 74.7%, which was
considered sufficient for the study. The procedure for data analysis involved first coding
the data into the Statistical Package for the Social Sciences (SPSS). The descriptive

53
statistics tests were used to determine the mean (M) distribution, frequency (f) and
standard deviation (SD) of the data. Once the descriptive statistics was applied on the
collected data, the results were summarized on different tools such as charts, graphs and
tables this allowed the researcher to investigate and draw conclusions on the relationships
that existed between the independent and dependent variables in question.
The first objective sought to establish the effects of quality department on the clothing
quality. The findings revealed that there was a high extent of autonomy of the quality
department (Freedom to run the department as they find fit), and high extent was also
experienced when quality department coordinates with other departments. Most
respondents also noted to a high extent that there was visible quality department and
quality department has access to the top management. The study also established that to a
medium extent the quality department was considered effective and quality department
staff are utilized as a consulting resource. It was also noted to a medium extent that
quality department was accountable to top management. The findings established that
there was a positive relationship between quality of clothing and quality department (r
=0.254, p<0.01). Similarly, Kaynak (2003) study on the relationship between total quality
management practices and their effects on firm performance established a positive
correlation between quality data and reporting and quality performance (r=0.251,
p<0.01).
The second objective sought to establish the impact of the employee training on the
clothing quality. The finding revealed that to a medium extent there are available
resources for employee training and top management is committed to employee training.
However, to a low extent it was revealed that quality achievement training is given to
management and specific technical skill training is given to every employee. The study
also established that extent to which technical training is a continual process was a low
one and employee training was not considered much as a core part of the company as well
as quality achievement training is given to workers. The findings established that there
was no correlation between quality of clothing and employee training (r=0.127,
p=0.169).However, there was a significant correlation between quality department and
employee training (r=0.620, p<0.01). Similar results have been established by
Algharibeh, Almsafir & Alias (2014) in their study to establish the relationship between

54
training and employee performance at Jordanian public universities where a positive
correlation between quality training and employee performance (r=0.720, p<0.01).
The third objective sought to establish the impact of the operating procedure on the
clothing quality. The findings revealed that to a high extent there was a thorough final
inspection of the clothes and incoming raw material, as well as clarity of work and
process instructions given to employees. There was also a high extent of continuous self-
inspection. The findings also revealed that to a medium extent the process minimizes the
chance of employee error. In addition, constant preventative equipment maintenance and
process inspection was also done to a medium extent. The findings established that there
was no correlation between quality of clothing and operating procedure (r=-0.073,
p=0.432).The findings established that the R squared was 0.069 therefore only 6.9% of
the variation in quality of clothing was caused by the variations in quality department,
employee training and operating procedure.
5.3 Discussion
5.3.1 How Quality Department Affect Apparel Product Quality
The first objective sought to establish the effects of quality department on the clothing
quality. The findings revealed that there was a high extent of autonomy of the quality
department (Freedom to run the department as they find fit) (4.34). Ahire, Golhar, &
Waller (1996) established that a quality department allows one to ensure that the quality
of product is the highest and in accordance to the need of the customers. Once one has a
high relative quality, this means that the firm will do well within the industry and this is
what customers are looking for. Crosby (1979) established that quality is free and is of the
theory of zero defects. This means that a firm should at the end of the production line give
a product that has no defect and is ready to go to the market ad will sell without return.
The one way to ensure that there are zero defects is through the instituting of a quality
department.
The findings also revealed that to a high extent of quality was also experienced when
quality department coordinates with other departments (4.28). Indeed, carrying a zero-
defect production requires a general commitment of the entire company and different
departments to achieve this. Otherwise, working alone will not make a difference in the

55
quality cause (Badri, Davis, & Davis, 1995). A company has to be quality oriented wholly
and placing a quality department without the rest of the company on board will not
improve the quality issue (Sethi, 2000). If the entire company is on board, each
department doing what they should do and the quality department ensuring that they are
doing so and making necessary corrections along the way, it becomes much easier to
achieve the zero-defect product (Crosby, 1979).
Most respondents also noted to a high extent that there was visible quality department
(4.17). Badri, Davis, & Davis (1995) noted that a quality department is one that ensures
that the final packed product is of the expected quality. Badri, Davis, & Davis (1995)
added that it is a core department in any industry, both product and service industries. A
visible and effective quality department shows results both in quality and cost. A number
of factors have to be considered and put in line to ensure the success of the quality
department.
It was also noted that to a high extent the quality department has access to the top
management (4.02). This is very important as established by Sethi (2000) who concluded
that a majorly important and the core factor of the success or failure of the quality
department is the top management. Just creating a quality department has no effect, the
top management has to be committed to the quality course. The top management has to be
quality oriented in its self. Ahire, Golhar, & Waller (1996) noted that this means that the
management has to make and allow for the necessary arrangements to come to fruition.
This includes arranging and setting apart for the needed resources to ensure that the
department is effective. The resources are towards the support of the department such as
setting up trainings to improve skill sets, buying new technologies to allows better quality
work e.t.c.
The findings established that there was a positive relationship between quality of clothing
and quality department (r=.254, p=0.05). This implied that the more the quality
department minimized errors the higher the quality of the clothing will be. Bamber &
Dale (2010) established that for such a development to occur employee attitude is a factor
that either lead to the failure or success of the department. They added that the people that
make up the department have to first be involved in the planning of the strategies for
quality. This allows them to be heard and give information that is key to the success.
Dahlgaard & Park-Dahlgaard (2005) noted that the quality department is supposed to

56
ensure that the intended quality goal of the firm is achieved in accordance to the customer
needs. However, the job of control includes different processes and duties that come
together to achieve quality control.
5.3.2 How Employee Training Affect the Apparel Product Quality
The second objective sought to establish the impact of the employee training on the
clothing quality. The finding revealed that to a medium extent there are available
resources for employee training (3.93). Organizational success is highly pegged on the
workforce or the employees it carries. The employees’ motivation, confidence, discipline
and work ethic can determine the success of the organization. According to Srivastava,
Neelam & Agarwal (2016), all of these aspects can be brought in by basically instilling
the technical skills required for the workers to be productive. When the training is in
check, the worker is productive and produces good quality clothes. According to Ratnakar
& Yumiko (2007), the absence of skills or presence of the untrained workers impeded
productivity and product quality greatly.
The findings revealed that to a medium extent and top management is committed to
employee training (3.71). This could be with the aim of offering the best to the
consumers. Srivastava, Anandita, & Radhika (2016) established that training ensures that
the process is efficient and that the end product is of high quality. The increase of training
has shown to result to high productivity and high product quality. In Lesotho,
manufacturing companies have highly invested in training of their workers and the results
are increased production of over 25% (Ratnakar & Yumiko, 2007). To run the company
there is also the need of the management staff and like every other company, there is
always the need of support staff (Kinuthia, Mburugu, & Mutuku, 2014). All of these staff
members need to be highly trained and in turn skilled. People are of higher value to a firm
when they are trained and skilled.
The findings show that to a low extent specific technical skill training was given to every
employee (2.82). Sweety (2014) highlighted that it is essential as customer preferences
change, factors are also changed, skills have to be enhanced and other things such as
technology is upgraded and new ways of doing things are created such as the seamless
production in the manufacturing industry and training of the employees is a major factor
in the successful production of quality products.

57
The study also established that extent to which technical training is a continual process
was a low one (2.76) and such arrangements has seen other countries fail. For instance, in
Nigeria, the housing industry has terribly suffered with structures that keep causing
damages and losses to house and business owners. The Nigerian Public housing sector is
faced by many quality problems. This is as a result of many factors but according to
Adenuga (2013) one of the factors that play a big role according to the study, is poor
training systems. This lack of employee training was a general problem across all
departments; the managerial, design and technical. The lack of labour skills was ranked as
the second highest factor that affects quality followed by poor communication unique to
the said firm. Deming (1986) added that many firms when recruiting choose supposedly
the best people they can find, the most skilled people This leads to many firms feeling
that there is no need to train. Many of these generally skilled employees will work but at
the level they know. Many times, this is not the best level of skill and not in line with the
company’s quality goals.
There was no significant correlation however, the findings established that there a
positive relationship between quality of clothing and employee training (r=0.127,
p=0.169). However, there was a significant correlation between quality department and
employee training (r=.620, p<0.01).Training is said to be an activity that is highly skilled
and professionally driven that aids in the overall production process. It ensures that the
process is efficient and that the end product is of high quality. Srivastava, Anandita, &
Radhika (2016) in their study noted that the more trained the work force is, the better the
quality of the product. This shows greatly in China where they remain highly competitive
compared to other Asian countries that have lower wages. This is because of the highly-
trained workers. Their product is of very high quality the buyers opt for it.
Sethi (2000) says that a company must be quality oriented to ensure that all the things that
are needed to achieve quality are of the highest priority. There is an importance in
conducting training in every phase of a company. Many would argue that the technical
department is the most important to train. There is however value in training the
supporting and managerial departments also to help in the overall success of quality
(Arditi & Gunaydin, 1998).

58
5.3.3 How a Set Operating Procedure Affect the Apparel Product Quality
The third objective sought to establish the impact of the operating procedure on the
clothing quality. The findings revealed that to a high extent there was a thorough final
inspection of the clothes (4.08) and incoming raw material (4.06). A standard operating
procedure (SOP) has been a great need in many firms and sectors across the world.
Sectors like medical and pharmaceutical industries would not survive without SOPs
(Sajdak, Trembath, & Thomas, 2013). The absence of SOPs in this industry would lead to
very negative results. Sectors like education cannot do with an absent SOP as it will be a
big mess if people were left to their devices. Even the financial sector highly needs SOPS
in place to avoid errors that can bring a whole firm down. SOPs as a core element of a
firm (Alhstrom, 1996). This allows an industry such as manufacturing to produce
products that are of the highest quality. A firm that is run through a known and well-
presented SOPs to the employees, they carry a high or positive relative quality and this
gives them such a good competitive advantage.
The findings also revealed that to a high extent there was clarity of work and process
instructions given to employees (4.03). There was also a high extent of continuous self-
inspection (4.00).Large firms have very little control over every worker as compared to
smaller firms (Dahlgaard & Park-Dahlgaard, 2005). It is however best to have
instructions that guide everyone. An SOP comes in handy when each worker knows
exactly what they are supposed to do and are held accountable for it. SOPs reduce the
variations that affect the product quality.
The findings also revealed that to a medium extent the process minimizes the chance of
employee error (3.98). Crosby in his 1979 study stated that to achieve zero defect, one has
to eliminate all the errors that come along the way. This means that the final product will
be carrying no errors and this means that the product will be of good quality while
ensuring the cost of production stays down. SOPS are key elements of a firm despite the
size and even as individuals. Everyone has some sort of routine that we follow at some
point in the day. What would turn this into an SOP is by documenting it. Small firms with
small business also require an SOP. This allows anyone who is working in the firm to
know exactly what is expected of him or her and also what comes before them and after
them. An SOP is supposed to cover all parts of the production process and should be
presented in a good organized matter.

59
There was no significant correlation, however the findings established that there was a
positive relationship between quality of clothing and operating procedure (r=-0.073,
p=0.432). The findings established that the R squared was 0.069 therefore only 6.9% of
the variation in quality of clothing was caused by the variations in quality department,
employee training and operating procedure. The greatest importance of a SOP is the
achievement of quality as intended in conformance to the customer needs and providing
this quality consistently. The SOP is able to allow the firms production arm to avoid
things and situations that cause variations that lead to these inconsistencies. These
inconsistencies lead to variations that affect the quality of the product or service. It allows
each individual to know what exactly is expect of them in their activity (De Treville,
Antonakis, & Edelson, 2012). All workers end up working in a uniform way across
departments. And with every unit every employee performs an activity in the same exact
way. De Treville, Antonakis, and Edelson (2012) notes that SOPs allow the firm to stay
compliant to any regulations that they need to adhere to. The SOP is written. The firm is
always protected when it comes to compliance. Also, the SOP allows the firm to ensure
that the workers are working with a procedure that is concern for their safety.
5.4 Conclusion
5.4.1 How Quality Department Affect Apparel Product Quality
From the study, it is inferred that there exist a high extent of autonomy of the quality
department and coordination with other departments, In the sector the quality department
is the most visible as errors associated with production can be too costly for the
organization. There is also a high coordination between the quality department and the
top management to ensure operational efficiency.
5.4.2 How Employee Training Affect the Apparel Product Quality
It can be inferred that the industry has ample resources for employee training, and this is
fostered by the top management commitment to ensure employees are well trained. As a
result of the firms hiring qualified staff very little quality achievement training is given to
management and also due to the routine nature of the jobs little specific technical skill
training is given to every employee and employee training is not considered much as a
core part of the company.

60
5.4.3 How a Set Operating Procedure Affect the Apparel Product Quality
It was also inferred that due to high cost associated with correcting errors, a thorough
final inspection of the clothes and incoming raw material is done. There is also a vast
clarity of work and process instructions given to employees as a standard operation
procedure accompanied by continuous self- inspection to minimizes the chance of
employee error.
5.5 Recommendation
5.5.1 Recommendation for Improvement
5.5.1.1 How Quality Department Affect Apparel Product Quality
There should be a continuous autonomy of the quality department (Freedom to run the
department as they find fit) as well as coordination with other departments to ensure
quality is maintained. The quality department also need to improve on areas they deem to
have a weakness in order to be considered effective.
5.5.1.2 How Employee Training Affect the Apparel Product Quality
The sector needs to ensure that available resources for employee training are effectively
used to offer the relevant training to the employees and this should be supported by top
management to ensure its effectiveness. More quality achievement training should be
given to management and technical training given to employees should be a continuous
process.
5.5.1.3 How a Set Operating Procedure Affect the Apparel Product Quality
The firms should maintain a continuous thorough inspection of the clothes and incoming
raw material to ensure the quality of the outputs is not compromised. All employees
should also be informed of the work and process as expected by the firm. There should
also be an increased constant preventative equipment maintenance and process inspection
in order to minimize errors
5.5.2 Recommendation for Further Studies
This study focused on establishing the factors that affect product quality of the SMEs in
the Kenyan Apparel Industry. There is a need to undertake a similar study in other sectors

61
so as to be able to generalize the findings. From the regression analysis, it was established
that only 6.9% of the variation in quality of clothing was caused by the variations in
quality department, employee training and operating procedure. There is a need to
undertake a research in the same industry in order to establish what causes the 94%
variation in quality of clothing.
5.5.3 Chapter Summary
This section has offered the discussion, conclusion and recommendations in line with the
specific research questions of this study were; How does a quality department affect
apparel product quality? How does employee training affect the apparel product quality?
And how does a set operating procedure affect the apparel product quality? This section
has also offered recommendation for further studies.

62
REFERENCES
Adenuga, O. A. (2013). Factors affecting Quality in the Delivery of Public Housing
Projects in Lagos State, Nigeria. International Journal of Engineering and
Technology , 332-344.
Ahire, S., Golhar, D., & Waller, M. (1996). Development and validation of TQM
implementation constructs. Decision Sciences , 23-56.
Alan, K., Ming, A., Yochanan, A., & Josse, R. (2008). Employee Training Needs and
Perceived Value of Training in the Pearl River Delta of China. Journal of
European Industrial Training , 19-32.
Algharibeh, F., Almsafir, M., & Alias, R. (2014). to establish the relationship between
training and employee performance at Jordanian public universities. Journal of
Advanced Social Research V , 4 (12), 01-15.
Alhstrom, C. K. (1996). Assessing Chnages towards Lean Production. Int.J of Operations
and Production Management , 24-41.
Amolo, P. (2015). The Kenyan Textile And Fashion Industry Report. Nairobi: Equity.
Arditi, D., & Gunaydin, M. (1998). Factors that affect procee quality in the life cycle of
building projects. Journal of construction, engineering and management , 194-
203.
Atkinson, J., & Storey, D. (2016). Employment, The Small Firm and Labour Market. New
york: Routledge.
Badri, M., Davis, D., & Davis, D. (1995). A study of measuring the critical factors of
quality managment . International Journal f Quality and Reliability Management ,
36-53.
Bamber, L., & Dale, B. (2010). Lean Production; A study of the application in a
traditional manufacturing environment. Production Planning and control , 291-
298.
Bartel, A. P. (1994). Productivity gains from the implementation of employee training
Systems. Industrial relations , 411-424.
Bean, C. (2010). IMPACT OF AGOA on THE TEXTILE AND APPAREL INDUSTRY OF
KENYA. African Cotton & Textile Industries Federation.
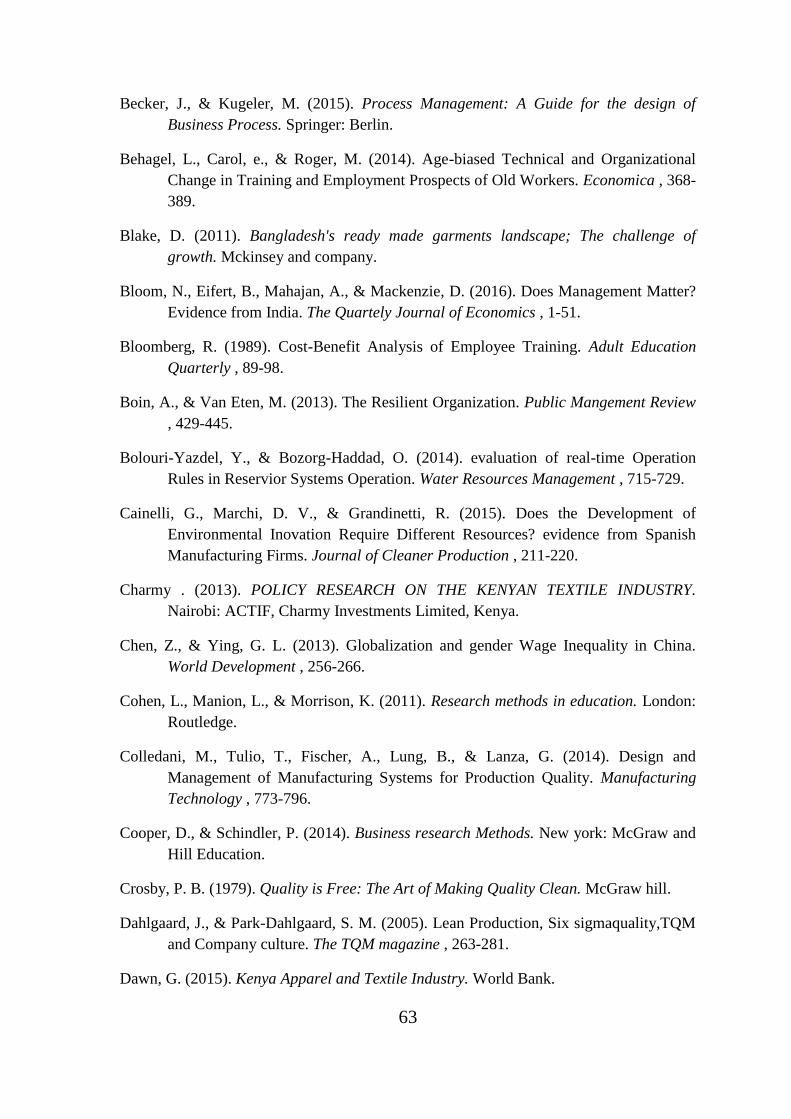
63
Becker, J., & Kugeler, M. (2015). Process Management: A Guide for the design of
Business Process. Springer: Berlin.
Behagel, L., Carol, e., & Roger, M. (2014). Age-biased Technical and Organizational
Change in Training and Employment Prospects of Old Workers. Economica , 368-
389.
Blake, D. (2011). Bangladesh's ready made garments landscape; The challenge of
growth. Mckinsey and company.
Bloom, N., Eifert, B., Mahajan, A., & Mackenzie, D. (2016). Does Management Matter?
Evidence from India. The Quartely Journal of Economics , 1-51.
Bloomberg, R. (1989). Cost-Benefit Analysis of Employee Training. Adult Education
Quarterly , 89-98.
Boin, A., & Van Eten, M. (2013). The Resilient Organization. Public Mangement Review
, 429-445.
Bolouri-Yazdel, Y., & Bozorg-Haddad, O. (2014). evaluation of real-time Operation
Rules in Reservior Systems Operation. Water Resources Management , 715-729.
Cainelli, G., Marchi, D. V., & Grandinetti, R. (2015). Does the Development of
Environmental Inovation Require Different Resources? evidence from Spanish
Manufacturing Firms. Journal of Cleaner Production , 211-220.
Charmy . (2013). POLICY RESEARCH ON THE KENYAN TEXTILE INDUSTRY.
Nairobi: ACTIF, Charmy Investments Limited, Kenya.
Chen, Z., & Ying, G. L. (2013). Globalization and gender Wage Inequality in China.
World Development , 256-266.
Cohen, L., Manion, L., & Morrison, K. (2011). Research methods in education. London:
Routledge.
Colledani, M., Tulio, T., Fischer, A., Lung, B., & Lanza, G. (2014). Design and
Management of Manufacturing Systems for Production Quality. Manufacturing
Technology , 773-796.
Cooper, D., & Schindler, P. (2014). Business research Methods. New york: McGraw and
Hill Education.
Crosby, P. B. (1979). Quality is Free: The Art of Making Quality Clean. McGraw hill.
Dahlgaard, J., & Park-Dahlgaard, S. M. (2005). Lean Production, Six sigmaquality,TQM
and Company culture. The TQM magazine , 263-281.
Dawn, G. (2015). Kenya Apparel and Textile Industry. World Bank.

64
Dawn, G. (2015). Kenya Apparel And Textile Industry. World Bank.
De Treville, S., Antonakis, J., & Edelson, N. (2012). Can Standard Operating Procedures
be Motivating? Reconcilliating Process Variability Issues and Behavioural
Outcomes. Total Quality Management , 231-241.
Dean, J. (2015). Integrated Manufacturing and Job Design;Moderating effects of
Organizational Inertia. Academy of management Journal , 776-804.
Deming, W. E. (1986). Out of the the crisis: Quality, Productivity and Competitive
Position. Cambridge: Cambridge University press.
Denscombe, M. (2007). The good research guide for small scale social research projects.
New delhi: Viva Book Private Limited.
Dunk, A. S. (2007). Assessing the Effects of Product Quality and Environmental
Management Accounting on the Competitive Advantage of Firms. Australasian
Accounting,Business and Finance Journal , 28-38.
Edward, R., Sieminski, S., & Zeldin, D. (2014). Adult Learners Education and Training.
London: Routledge.
Embuldeniya, A. (2015). Impact of Apparel Industry on the Economy of Sri Lanka.
Journal of Social Statistics , 1-14.
Firescu, V., & Popescu, J. (2015). The Cost of Quality;An Important Decision Tool.
International Journal in Economics and Business Administration , 44-52.
Fukunishi, T. (2012). The Kenyan Garment industry, is it able to revivein the economic
boom? IDE-JETRO .
Gao, K., Yihai, H., & Wang, L. (2015). Confidence Based Quality Evaluation for Total
Manufacturing Process using Comprehensive Process Capability. Industrial
Engineering and Engineering Management , 105-127.
Garvin, D. A. (1984). What does Product quality really mean? Sloan Managment Review ,
25-44.
Gerwin, D. (1969). A Process Model of Budgeting in a Public School System. Inst. for
Operations Research and the Management Sciences , 338-361.
Gidey, A. (2012). Values of a Standard Operating Procedure. Ethiop Kournal of Health
Sciences , 205-215.
Giri, B., & Vancza, J. (2015). Optimizing a Closed-loop Supplychain with Manufacturing
Defects & Quality Dependent Return Rate. Journal of Manufacturing Systems ,
92-111.

65
Goestch, D., & Davis, S. (2015). Quality Mangement for Organization Excellence .
London: Pearson.
Groselj, B. (2014). Quality Monitoring Service for Distributed Manufacturing Systems.
International Journal of Computer Integrated manufacturing , 639-649.
Gunasekaran, A., Korukonda, A., Virtanen, I., & Yli-olli, P. (1993). Improving
Productivity and Quality in Manufacturing Organization. Intl. J Production
Economics , 169-183.
Hale, A., & Boyrs, D. (2013). Working to Rule or Working Safely? The Management of
Safety Rules and Proceeds. Safety Science , 222-231.
Hasle, P. (2012). Lean Production-An Evaluation of the Possibilities for an Employee
Supportive Lean Practice. Humand Factors and ergonomics in Manufacturing and
Service Industries , 40-53.
Joseph, I., Rajendran, C., & Kamalanabhan, T. (1999). An Instrument for Measuring
Total Quality Managment Implementation in Manufacturing-Based Business
Units in India. Int. J. of Production Rsearch , 2201-2215.
Jurado, P. J., & Fuentes, J. M. (2014). Lean Management, Supply Chain Management and
Sustainability:A Lit Rev. Journal of Cleaner Production , 134-150.
Juran, J. .. (1998). Jurans's Quality Handbook. McGraw hill.
Kane, G. (2015, February -). Facts on China's Garment Industry. Retrieved July 07,
2016, from Clean clothes campaign: http://www.cleanclothes.org/
Kane, M., Chur, K., Janet, & Callagy, P. (2015). Lean Manufacturing Improves
Department Throughput and Patient Satisfaction. Journal of Nursing
Administration , 429-434.
Kaynak, H. (2003). The relationship between total quality management practices and their
effects on firm performance. Journal of Operations Management , 405–435.
Kinuthia, L. N., Mburugu, K. G., & Mutuku, M. (2014). Fashion marketing: Strategies in
the garment-making micro and small enterprises in Nakuru, Kenya. academic
journals , 68-74.
Koinings, J., & Varnomeligen, S. (2015). The Impact of Training on Productivity and
Wages. The Review of Economics and Statistics , 485-497.
Kotey, B., & Folker, C. (2007). Employee training in SMEs: Effect of firm size and firm
type-family or non family. Journal of small business Management , 214-238.
Kuratko, D. F., Hornsby, J., & Covin, J. (2014). Diagonising a Firms Internal
environment for Corporate Entrepreneurship. Business Horizons , 37-47.

66
Mangieri, T. (2006). African Cloth, Export Production, and Secondhand Clothing in
Kenya.
Manuti, A., Pastore, S., Scardigao, a. F., & Giancaspro, M. L. (2015). Formal ad Informal
Learning in the Workplace:A Research Review. International Journal of Training
and Development , 1-17.
Oker, F. (2016). Time-driven Activity-based Costing:An Implementation in a
Manufacturing Company. Journal of Corporate Accounting and Finance , 39-56.
Omolo, J. O. (2006). The Textiles and Clothing Industry in Kenya. The Future of the
Textile and Clothing Industry in Sub-Saharan Africa , 134-154.
Peltier, T. (2014). Information Security Policies, Procedures and Standards. NW: Taylor
and Francis .
Phelps, N. S. (2008). Missing the GO in AGOA? Growth and constraints of foreign direct
investment in the Kenyan clothing industry. Transnational Corporations , 67-106.
Pye, M. (2011). An Assessment of Skills Needs in the Clothing, Textiles, Footwear and
Leather and Furniture,Furnishings and Interiors Industries. Harrogate: pyetait.
Rael, C. M. (2012). The Kenyan Textile Industry in a Liberalized Economy: An Analysis
of Performance and Challenges . Journal of Emerging Trends in Economics and
Management Sciences .
Rajitha, I. (2005). GARMENT MAKING. 1-69.
Rao, R., & Devadas, A. L. (2006). organizational Learning and Forgetting;The Effect of
Turnover and Structure. European Management Review , 71-85.
Ratnakar, A., & Yumiko, Y. (2007). The textile and clothing Industry:Adjusting to the
post-quota world. Industrial Development for the 21st Century , 183-234.
Renwick, D., Redman, T., & Maguire, S. (2013). Green Human Resource Managment;A
Review and research Agenda. International Journal of Management Reviews , 1-
14.
Revelle, J. (2015). Manufacturing Handbook of Best Practice: An Innovation,
Productivity and Quality Focus. Florida: St.Lucie Press.
Sadgrove, K. (2015). The Complete Guide ro Business Risk Management. New York:
Routledge.
Sain, K. R., & Abhimanyu, S. (2015). A study of quality Practices of Manufacturing
Industries in Gujarat. Procedia-Social and Behavioral Sciences , 320-334.

67
Sajdak, R., Trembath, L., & Thomas, K. (2013). The Importance of Standard Operating
procedures in Clinical Trials. Journal of Nuclear Medicine Technology , 231-233.
Sallis, E. (2014). Total Quality Management in Education. London: Routledge.
Saunders, M., Lewis, P., & Thornhill, A. (2012). Research Methods for Business students.
London: Pearson Education.
Scott, K., & Ashish, K. (2016). Putting Quality on the Global Health Agenda. New
England Journal of Medicine , 371-384.
Sethi, R. (2000). New Product Quality and Product Development Teams. Journal of
Marketing , 1-14.
Stokus, S., Vaitkuviene, L., & Balvociute, R. (2015). The Comparative Analysis of
Employee Motivation Tools;The Case of the Lithuanian and Swedish
Manufacturing Companies. Economic Journal , 97-114.
Sweety Jaggal, P. G. (2014). Seamless (Fully fashioned) clothing theirAdvantages,
Disadvantages, Applications and Design Possibilities. International Journal of
Scientific & Engineering Research, , 1159-1160.
Turker, D., & Altuntas, C. (2014). Sustainable Supply Chain Management in the Fast
Fashion Industry; An Analysisof Corporate Reports. European Management
Journal , 837-849.
Varukolu, V. (2007). TECHNOLOGY ADOPTION OF INDIAN GARMENT
MANUFACTURING FIRMS. Louisiana State University.
Yong Zheng, B. J. (2010). Study on New Garment-Sewing Equipment in Clothing
Application. Proceedings of the 2010 International Conference on Information
Technology and Scientific Management (pp. 205-308). Tianjin, China : Scientific
Research.
Yunus, M., & Yamagata, T. (2012). The Garment Industry in Bangladesh. Fukunushi Ed,
IDE-JETRO , 1-28.

68
APPENDIX I: QUESTIONNAIRE
The purpose of this study is academic only. Your participation is entirely voluntary:
you retain the right to participate in it. All responses are confidential. Thank you for
agreeing to participate in this survey.
Instruction: kindly answer each question to the best of your ability, tick appropriate.
SECTION A: BACKGROUND & DEMOGRAPHIC FACTORS
Please tick the most appropriate answer (√ )
1. Gender: a) Male
b) Female
_______________________________________________________________________________
2. How long have you been employed in the company?
a) Less than a year
b) 1 to 2 years
c) 3 to 5 years
d) 6-8 years
e) 9-10 years
e) 10 years and above
________________________________________________________________________
_
3. Position
a) Owner
b) Manager
c) Production supervisor
d) Other
________________________________________________________________________
_
4. How long has the company been in operation for?
a) 0-2 years
b 3-5 years
c) 6-8 years
d) 10 and above years
________________________________________________________________________

69
5. How many employees does the company have?
a) 0-10
b) 11-20
c) 21-30
d) 31-40
e) 41-50
f) 51 and above
________________________________________________________________________
_
6. What kind of clothing does the company produce?
a) Adult ready to wear
b) Adult made to measure
c) Work Wear
d) Baby clothes
________________________________________________________________________
7. What is the market of the clothing the company produces?
a) Domestic
b) Regional
c) International
d) All of the above

70
SECTION B: RELATIVE CLOTHING QUALITY
For each of the following statements, please tick under the appropriate number on a scale
from 1 to 5 where 1=Strongly Disagree and 5= Strongly Agree
1= Strongly Disagree 2= Agree 3=Neutral 4= Agree 5= Strongly Agree
Relative Clothing Quality 1 2 3 4 5
1 The clothing the company produces is of superior quality
compared to the competitors
2 The clothing we produce is of equivalent quality compared to the
competitor
3 The clothing we produce is of inferior quality compared to the
competitor
3 The sales volume in the past year was achieved cause of the
quality
4 The sales volume in the past year were reduced cause of the
quality
5 Having a quality department improves the clothing quality
6 Employee training improves the clothing quality
7 Having a set operating procedure improves the clothing quality
SECTION C: EFFECTS OF QUALITY DEPARTMENT ON THE CLOTHING
QUALITY
For each of the following statements, please tick under the appropriate number on a scale
from 1 to 5 where 1=Very low and 5= Very high
1= Very Low 2= Low 3=Medium 4= High 5= Very High Quality Department 1 2 3 4 5
1 Extent to which there is a visible quality department
2 Extent to which the quality department has access to the top
management
3 Extent to which there is autonomy of the quality department
(Freedom to run the department as they find fit)
4 Extent to which the quality department coordinates with other
departments
5 Extent to which the quality department staff are utilized as a
consulting resource
6
o
Extent to which the quality department is accountable to top
management
7 Extent to which the quality department is effective
SECTION D: IMPACT OF THE EMPLOYEE TRAINING ON THE QUALITY
OF CLOTHING.

71
For each of the following statements, please tick under the appropriate number on a scale
from 1 to 5 where 1=Very low and 5= Very high
1= Very Low 2= Low 3=Medium 4= High 5= Very High
Employee Training 1 2 3 4 5
1 Extent to which top management is committed to employee
training
2 Extent to which there are available resources for employee
training
3 Extent to which specific technical skill training is given to every
employee
4 Extent to which technical training is a continual process
5 Extent to which quality achievement training is given workers
6 Extent to which quality achievement training is given to
management
7 Extent to which employee training is a core part of the company
SECTION E: IMPACT OF THE OPERATING PROCEDURE ON THE QUALITY
OF CLOTHING.
For each of the following statements, please tick under the appropriate number on a scale
from 1 to 5 where 1=Very low and 5= Very high
1= Very Low 2= Low 3=Medium 4= High 5= Very High
Operating Procedure 1 2 3 4 5
1 Extent to which there is clarity of work and process instructions
given to employees
2 Extent to which the process minimizes the chance of employee
error
3 Extent to which there is a thorough inspection of the incoming
raw material
4 Extent to which there is continuous self- inspection
5 Extent to which there is in-process inspection
6 Extent to which here is a thorough final inspection of the clothes
7 Extent to which there is constant preventative equipment
maintenance
THANK YOU FOR YOUR CO-OPERATION

72