factors influencing the use of e-learning in public
TRANSCRIPT
FACTORS INFLUENCING THE USE OF E-LEARNING IN PUBLIC
UNIVERSITIES IN KENYA
GEORGE NJUGUNA
A RESEARCH PROJECT SUBMITTED IN PARTIAL
FULFILLMENT OF THE REQUIREMENTS FOR THE
AWARD OF THE DEGREE OF MASTER OF BUSINESS
ADMINISTRATION (MBA), SCHOOL OF BUSINESS,
UNIVERSITY OF NAIROBI
NOVEMBER 2013

ii
DECLARATION
This research project is my original work and has not been presented for award of degree
in any University.
Signature:............................................ Date:...............................................
George Njuguna
Registration No: D61/P/7171/2003
This research project has been submitted for examination with my approval as the
University supervisor.
Signature:............................................ Date:...............................................
SNM NZUVE
University of Nairobi, School of Business

iii
DEDICATION
To my dear departed parents, Mr Peter Ndung’u Njuguna and Mrs Lucy Watiri Ndung’u,
though you are no longer physically with us, your vision and mission endures.
To my family, especially my beloved wife, Zipporah and our lovely children Peter, Lucy,
Joe and Jennifer, your unwavering love, support, encouragement and dedication during
this challenging and trying study kept me going.

iv
ACKNOWLEDGEMENT
I thank the almighty God for seeing me through this project.
I sincerely thank my supervisor, SNM Nzuve for the guidance, patience and
understanding in the course of the research project. I sincerely appreciate the dedication
and the efforts shown by the supervisor and moderator in guiding me through the
research project.
To the lecturers at the School of Business who imparted great knowledge to me and to all
my colleagues in the MBA class. I will forever be grateful for your role in my life.
To each and every student in our class, thank you for the friendship and sharing of ideas.
I am grateful to all the respondents to my questionnaire for providing me with useful
information in this research project.
Finally, I thank my entire family for the encouragement and support during the entire
period of my study.
May the almighty God bless you.

v
ABSTRACT
E-learning generally refers to the methods of learning which use electronic instructional
content delivered via the internet and is a term which is synonymous with Web-based or
online learning. In this age of globalization knowledge acquisition has become the critical
means for gaining competitive advantage, and as such learning has become a crucial
element of knowledge acquisition, application and creation. The objective of this study
was to determine the factors influencing the use of e-learning in Public Universities in
Kenya.
E-learning seems unsuitable for those individuals without self-discipline. It requires a lot
of self-discipline, mostly because e-learners are busy working adults as explained earlier.
Besides, e-learners also seemed to need preparatory training especially in ICT skills in
order for them to get used to e-learning environment. On top of these problems, e-
learners also face some problems for instance necessity of computer resources, bandwidth
problems, lacking physical interactions and limited recognition of e-learning courses etc.
These facts show that e-learning is not perfect at the moment and the e-learning providers
should consider these limitations to improve e-learning services.
A descriptive survey design was used in finding out the factors influencing the use of e-
learning in Public universities in Kenya. The Population of this study was the 19,205
employees (Academic and non-Academic staff) in all public universities. The sample size
was 96 employees. A questionnaire was the preferred data collection instrument for this
study. Descriptive and inferential statistics were used to analyze the data.
Results revealed perceived usefulness was important in explaining the use of e-learning.
This is supported by a p value 0.000 which means that perceived usefulness is a
statistically significant predictor of the use of e-learning. Results further revealed that
such perceived ease of use is important in determining use of e-learning as demonstrated
by a p value of 0.000. Analysis showed that supporting infrastructure is a key determinant
in use of e-learning in Universities in Kenya and this was supported by a correlation
coefficient of 0.398

vi
TABLE OF CONTENT
DECLARATION............................................................................................................... ii
DEDICATION.................................................................................................................. iii
ACKNOWLEDGEMENT ............................................................................................... iv
ABSTRACT ....................................................................................................................... v
LIST OF TABLES ......................................................................................................... viii
LIST OF FIGURES ......................................................................................................... ix
CHAPTER ONE: INTRODUCTION ............................................................................. 1
1.1 Background of the Study ...................................................................................... 1
1.1.1 Public Universities in Kenya ............................................................................ 3
1.2 Problem Statement ............................................................................................... 5
1.3 Objectives of the Study ........................................................................................ 6
1.4 Value of the Study ................................................................................................ 6
CHAPTER TWO : LITERATURE REVIEW ............................................................... 8
2.1 Use of E-learning ................................................................................................. 8
2.2 Factors Influencing use of E-Learning ............................................................... 10
CHAPTER THREE: RESEARCH METHODOLOGY ............................................. 21
3.1 Introduction ........................................................................................................ 21
3.2 Research Design ................................................................................................. 21
3.3 Population of Study ............................................................................................ 21
3.4 Sampling Design ................................................................................................ 21
3.5 Data Collection ................................................................................................... 22
3.6 Data Analysis ..................................................................................................... 22
CHAPTER FOUR: DATA ANALYSIS FINDINGS AND DISCUSSION ................ 23
4.1 Introduction ........................................................................................................ 23
4.2 Response Rate .................................................................................................... 23
4.3 Sample Demographics ........................................................................................ 23
4.3.1 Gender of the Respondents ............................................................................. 23
4.3.2 Age of the Respondent ................................................................................... 24
4.3.3 Level of Education.......................................................................................... 25
4.3.4 Years of Internet Use ...................................................................................... 26

vii
4.3.5 Setting a Reading Timetable........................................................................... 27
4.3.6 Adhering to the Timetable .............................................................................. 27
4.4 Descriptive Results ............................................................................................. 28
4.4.1 E-learning ....................................................................................................... 28
4.4.2 Perceived Usefulness and E-learning Use ...................................................... 28
4.4.3 Perceived Ease of Use and Use of E-learning ................................................ 29
4.4.4 Supporting Infrastructure and Use of E-learning ........................................... 30
4.5 Pearson’s Correlation Analysis .......................................................................... 31
4.6 Factor Analysis ................................................................................................... 32
4.7 Summary ............................................................................................................ 36
CHAPTER FIVE: SUMMARY, CONCLUSIONS AND RECOMMENDATIONS 38
5.1 Introduction ........................................................................................................ 38
5.2 Summary ............................................................................................................ 38
5.3 Conclusions ........................................................................................................ 39
5.4 Recommendations .............................................................................................. 39
5.5 Areas for Further Study ...................................................................................... 40
REFERENCES ................................................................................................................ 41
APPENDICES ................................................................................................................. 48
Appendix I: Introduction letter ...................................................................................... 48
Appendix II: Questionnaire ........................................................................................... 49

viii
LIST OF TABLES
Table 4.1: Response Rate .................................................................................................. 23
Table 4.2: Years of Internet Use ....................................................................................... 26
Table 4.3: Setting a Timetable .......................................................................................... 27
Table 4.4: Adhering to the Timetable ............................................................................... 27
Table 4.5: E-learning ........................................................................................................ 28
Table 4.6: Perceived Usefulness and E-learning .............................................................. 29
Table 4.7: Perceived Ease of Use and E-learning ............................................................. 30
Table 4.8: Supporting Infrastructure and E-learning ........................................................ 31
Table 4.9: Pearson’s Correlation ....................................................................................... 32
Table 4.10: Perceived Usefulness ..................................................................................... 32
Table 4.11: Component Matrix for Perceived Usefulness ................................................ 33
Table 4.12: Perceived Ease of Use ................................................................................... 34
Table 4.14: Supporting Infrastructure ............................................................................... 35
Table 4.15: Component Matrix for Supporting Infrastructure .......................................... 36

ix
LIST OF FIGURES
Figure 4.1: Gender ............................................................................................................ 24
Figure 4.2: Age ................................................................................................................. 25
Figure 4.3: Level of Education ......................................................................................... 26

CHAPTER ONE: INTRODUCTION
1.1 Background of the Study
E-learning generally refers to the methods of learning which use electronic instructional
content delivered via the internet and is a term which is synonymous with Web-based or
online learning (Trombley and Lee, 2002). In this age of globalization knowledge
acquisition has become the critical means for gaining competitive advantage, and as such
learning has become a crucial element of knowledge acquisition, application and creation
(Longworth and Davies, 1996).
According to John Chambers (in Rosenberg, 2001), “the biggest growth in the Internet,
and the area that will prove to be one of the biggest agents of change, will be in e-
learning.” The demand for a well-educated workforce has driven many countries to
rethink their education systems. An education system has to be suited to the demands of
the technological age so that a competitive edge can be maintained. Such demand for a
technology savvy workforce is reflected in Alvin Toffler’s declaration (in Rosenberg,
2001: 3), that “the illiterate of the 21st century will not be those, who cannot read and
write but those who cannot learn, unlearn, and relearn.” An ancient proverb says: “if we
don’t change our direction, we’ll end up exactly where we are headed” (in Rosenberg
2001: 41). This indicates that learning institutions will have to constantly change and
adapt in their environments if they are not to lag behind.
According to (Galagan, 2002), “classrooms could not possibly work today, but centuries
ago, they made sense: one literate person reading to the illiterate from what might have
been the town’s only book, but technology and times have changed.” The advantages that
technology provides to training and learning include not only the possibility of one-on-
one interaction for every learner, the ability to simulate new ideas, the chance to try
things out at one’s own pace and to fail in private without the fear of ridicule from other
students (Galagan, 2002). The Internet has also become an important instructional tool to
facilitate the transfer of many types of information from one computer to another, and is

2
rapidly becoming an effective means of communication in schools and colleges. Internet-
based instruction has been manifested in one-to-one (tutor-to-student), one-to-many
(tutor-to-group) and many-to-many (group-to-group) approaches to instruction. The
forms of communication may be synchronous with all parties communicating within the
same time frame; or it may be asynchronous, where there may be a time delay between
the communicators when sending, receiving and replying to any given communicative
event (Webb et al, 2004).
Kenya recognizes that the education and training of all Kenyans is fundamental to the
success of the Vision 2030. Education equips citizens with understanding and knowledge
that enables them to make informed choices about their lives and those facing Kenyan
society. The education sector will, therefore, provide the skills that will be required to
steer Kenyans to the economic and social goals of Vision 2030. Vision 2030 is based on
the creative talents capable of raising Kenya’s international competitiveness through
enhanced productivity at the microeconomic (industry) and national levels. Throughout
the education system, learning will inculcate the use of knowledge in science, technology
and innovation (STI) to create wealth, improve social welfare and promote democratic
governance. Appreciation of the critical role of STI to the Vision is based on the
understanding of today’s knowledge-based economies (KBEs) and the role that
innovation plays in such economies. A knowledge economy creates, adopts, and adapts
information on production and distribution of goods and services, making it the focal
point and the engine of rapid economic growth. That is where Kenya wishes to position
itself (Vision 2030).
Effective use of knowledge is becoming the most important factor for creating wealth and
improving social welfare and for international competitiveness. Implementing Vision
2030 will require more knowledge-based skills. This calls for more training in science-
related and technology-related courses. Kenya’s road to become a KBE will therefore not
be restricted to the realm of high technology, but will extend to the application of science
and technology in the economy, targeting areas such as pharmaceuticals, scientific
instrumentation, and information and communication technologies. These are expected to

3
increase the growth momentum in the priority factors thereby giving a boost to the
economy as a whole.
However, Vision 2030 also notes that, at the college and university level, there is a
serious shortage of capacity, both in public and private institutions, as only about 30 per
cent of those with minimum entry requirements can be admitted. Although enrolment in
public universities has increased over time, the high cost continues to limit access for a
large number of qualified students. As for private universities, enrolment remains low at
12.7 per cent of total admissions. It is therefore justified to employ emerging
technologies such as e-learning to solve the capacity and cost problems stipulated in
Vision 2030.
The Commision of Higher Education (CHE) Handbook Sessional Paper No. 1 of 2005,
recognises The Commision of Higher Education (CHE) as the national quality assurance
agency for university and tertiary education. It affirms that a national accreditation
system is necessary as a means of guaranteeing quality in education and training” (CHE
handbook, 2008, p.12). According to the speech read to the Pan-Africa Conference on e-
learning (in Addis Ababa, Ethiopia) by the then Assistant Minister of Higher Education,
Science and Technology in Kenya, Hon. Beth Mugo the Government stated its
commitment to this Sessional paper as a policy blueprint. She further declared that the
Government had instituted budgetary support for e-learning for basic as well as tertiary
levels of education (Mugo, 2006, p.2).
1.1.1 Public Universities in Kenya
The Kenyan higher education system developed from Makerere Technical College which
from its inception in 1922 served the education needs of the three (3) countries in the East
African region namely: Uganda, Tanganyika and Kenya. In 1949, Makerere became a
university college of the University of London in line with the recommendation of the
Asquith Commission on Higher Education. The Royal Technical College was set up in
1956 as Kenya’s first higher education institution with the primary goal of providing
students with an avenue of enrolling for engineering and commercial courses not offered

4
by Makerere. The programmes offered here led to a higher certification at the University
of London, Britain. In 1958, upon the recommendation of a working party it was renamed
the Royal College of Nairobi and upgraded into a university college offering University
of London degrees. In 1963 when Kenya attained her independence the Royal College
was renamed the University College of Nairobi and together with Makerere and Dar-es-
Salaam Colleges in Uganda and Tanzania respectively formed the Federal University of
East Africa (UEA) which later disbanded in 1970. Each of the East African countries
thereafter concentrated in developing their own national universities (Ngome, 2006,
p.360).
The Asquith model involved the mentoring of institutions in the colonies, consequently
new institutions were linked to established universities as university colleges. This
colonial model was created to guide university expansion through apprenticeship. It was
arguably successful in that the University College of Nairobi (later renamed University of
Nairobi through an Act of Parliament in 1970) was responsible for the conception of the
Kenyatta University College which became autonomous in 1985. The latter was then
responsible for the mentoring of the Jomo Kenyatta University College of Agriculture
and Technology into a fully-fledged university (Davis & Eisemon, 1993, p.83). The name
college was subsequently dropped from the universities titles.
The number of universities in Kenya has been increasing by the day. According to
Wikipedia, there are currently twenty two public universities in Kenya namely:
University of Nairobi (UON), Kenyatta University, Moi University, Egerton University,
Jomo Kenyatta University of Agriculture and Technology, Maseno University, Masinde
Muliro university of Science and Technology, Dedan Kimathi University of Technology,
Chuka University, Technical University of Kenya, Technical University of Mombasa,
Pwani University, Kisii University, University of Eldoret, Maasai Mara University,
Jaramogi Oginga Odinga University of Science and Technology, Laikipia University,
South Eastern Kenya University, Multimedia University of Kenya, University of
Kabianga, Karatina University and Meru University of Science and Technology.
5
1.2 Problem Statement
The education sector has been pinpointed as a crucial sector in ensuring that Kenya meets
the objectives stipulated in Vision 2030 such as the achievement of annual economic
growth of 10%. In addition, the Millennium Development Goals have earmarked the
education sector as crucial in bringing about socio economic change to Kenya and other
developing economies. Nyamute (2007), argues that the reason for the economic
prosperity of the Asian Tigers stems from development of human capital through an
effective education and learning system. It is noted that the education infrastructure in
developing countries in general and Kenya in particular is a far cry from ideal. In
addition, capacity constraints bedevil the education sector; hence, a paradigm shift is
necessary in delivering education and training to citizens through unconventional means
such as e-learning. Advocates of E-learning concept may allude to the concept of mobile
money transfers such as Mpesa, that is, the ability to use technology to leap frog some
stages of socioeconomic development.
While, the e-learning concept is noble and novel, its successful adoption and use by
economic agents such as households and firms has been wanting. This study argues that
there are factors that affect the adoption and use of e-learning by universities. It is also
possible to argue that those universities (teachers and students) who are doing better in
the use of e-learning may possess some distinct factors that distinguish them from the
poor users/non users of e-learning. The study therefore wishes to establish these factors
that influence the use of e-learning.
Local studies on the concept of e-learning are scarce. Mbogo (2008), conducted a study
on the determinants of employee dropout in corporate web-based learning and took a case
study on Hilton Hotel Nairobi. Sang (2003), conducted an assessment of the readiness of
institutions to offer electronic learning and took a case of Egerton University and
concluded that there was no relationship between the attitude, perception and exposure
of-the lecturers and the institution readiness to offer e-learning. Mulwa, Kyalo, Mboroki
and Bowa (2012), conducted a study on the Influence of Human Resource Capacity on

6
Readiness to Adopt E-Learning in Secondary Schools in Kitui District, Kenya and
concluded that that human resource capacity had influence on the readiness to adopt e-
learning. However the influence was not statistically significant as the human resource
capacity was not adequate to support the adoption of e-learning in secondary schools in
Kitui district. Mungania (2003), carried out a study on the seven e-learning barriers
facing employees and concluded that four key factors emerged as significant predictors of
e-learning barriers, namely organization, self-efficacy, computer competence, and
computer training. However, all the above studies seem to indicate a difference of
opinions and lack conclusiveness as to what exactly are the factors influencing e-learning
use in Public Universities in Kenya.
1.3 Objectives of the Study
The objective of the study was to determine the factors influencing the use of e-learning
in Public Universities in Kenya.
1.4 Value of the Study
The study would be beneficial to Universities in Kenya and other worldwide educational
institutions. These institutions’ could use the study findings to identify those factors that
influence the use of e-learning. For instance, if investment in ICT tools such as computers
and internet contribute to the successful completion of e-learning courses, then
universities can make an organization policy which will enhance investment in ICT tools.
The Government of Kenya, specifically, the Ministry of education could find this study
very useful in understanding the determinants of successful use of e-learning. As noted
previously in this study, Vision 2030 has earmarked the education sector as an important
flagship project which will enhance the competitiveness of Kenya.
Private sector firms, parastatals and NGOs would find the study findings useful in an
effort to popularize e-learning in their organizations. Trainings firms could have a field

7
day as the study exposed opportunities in the e-learning market. Such firms would thus
approach firms with challenges in successful completion of e-learning courses and offer
preparation services to students and also technical training in the use of online
courseware

8
CHAPTER TWO : LITERATURE REVIEW
2.1 Use of E-learning
In today's knowledge economy, learning is needed to survive and to thrive. In this sense,
knowledge is power and proliferation of knowledge through E-learning is not a luxury
but a necessity for current and future generations. In this context, distance learning has
become an imperative. The need is constant while the nature of our society and economy
drives the need for learning. The demand and use of alternatives to the typical classroom
setting has been ongoing for more than 100 years from correspondence courses in paper
form through video and computer access (Zu, 2008).
In a world where the power of technology resides in our pockets, it is no longer
acceptable to train and empower our workforce through out-dated and traditional
methods of learning. As the corporate learning culture continues to evolve, employers
and managers are now tasked with ensuring current learning and development models
keep up with changes in technology and in the workforce. At the forefront of this change
is e-Learning, which provides organisations with the tools to integrate readily available
technology to create a holistic and continuous learning platform (Edutech, 2013).
It is also extremely effective to use e-learning in classroom environments where modern
technology may not be available to all students, or in schools where there are not
sufficient resources for all students to be able to use a device. In such a situation, using a
mobile learning device like a single tablet, which may be passed easily from hand-to-
hand or shared amongst a group of students, is a great way to ensure that pupils are still
able to benefit from the diverse opportunities presented by education technology (Bates,
2012).
One of the main benefits of e-learning is being able to do the learning in your own time,
at your own pace and also in your own environment. The benefit of being able to do this
results in a higher uptake, because if you set the learning to take place at a certain time

9
then you’re obviously not going to be able to get everyone involved, but if it is at your
own leisure then people are going to be more inclined to be able to do it. The downside
to this is that if you do allow people the freedom to learn when they want, then some
people may not do it or forget about it, so reminders are necessary. Having a due by date
outlining when to complete the learning also helps. Results can be good and results can
be mixed. You might find that the topic of the learning dictates how people provide
feedback. If you force people to learn for example in the topic of compliance, there can
be a little pushback and resentment around because they might feel they know the topic
well enough already. But at the end of the day they have to learn about it (Edutech,
2013).
E-Learning means that you no longer need to spend long periods travelling to a location
to attend a course; you can now have access to learning when you want it, at the time you
want it - day or night, wherever you want it - at home, at work, in your local library. For
many students this has opened up a new, much more flexible and accessible world of
learning that was previously closed to them due to disability or family circumstances, or
perhaps due to the fact that the course they wanted was on the other side of the world. In
other words, there are now no longer any geographical constraints to learning; e-learning
brings learning to people, not people to learning. E-Learning means that learning no
longer needs to be a passive experience, with the learners all sitting in front of the teacher
and "learning by telling", e-learning makes learning an active experience. The emphasis
is on interactivity or "learning by doing" (Knight, 2003).
The role that communication and interaction plays in the learning process is a critical
success factor in contemporary educational paradigms. It is within this context that e-
learning (electronic learning) and especially m-learning (mobile learning) can and should
contribute to the quality of education. M-learning offers opportunities for optimising
interaction and communication between lecturers and learners, among learners and
members of COPs (communities of practice). M-learning thrives within the contemporary
social constructivist paradigm because of its richness in terms of communication and
interaction, both synchronous and asynchronous. Wireless and mobile technologies also
10
make it possible to provide learning opportunities to learners that are either without
infrastructure for access (e.g. rural or remote learners) or continually on the move (e.g.
business professionals). The relevance of m-learning for Africa lies in the fact that the
majority of learners in Africa are without infrastructure for access. Interesting to note is
that the adoption rate of mobile technologies in Africa’s developing countries, is among
the highest rates globally.
2.2 Factors Influencing use of E-Learning
This section reviewed studies that have investigated the factors that influenced the use of
e-learning. It presented the objective of the reviewed studies, their main findings and
pertinent conclusions and recommendations.
Sun, Tsai, Finger, Chen and Yeh (2008), conducted a study on what drives a successful e-
Learning. The study developed an integrated model with six dimensions: learners,
instructors, courses, technology, design, and environment. A survey was conducted to
investigate the critical factors affecting learners’ satisfaction in e-Learning. The results
revealed that learner computer anxiety, instructor attitude toward e-Learning, e-Learning
course flexibility, e-Learning course quality, perceived usefulness, perceived ease of use,
and diversity in assessments are the critical factors affecting learners’ perceived
satisfaction. The results showed institutions how to improve learner satisfaction and
further strengthen their e-Learning implementation.
Reynolds (2002), conducted a study on Motivational Factors that Influence e-learning
course Completion Rates and argued that currently e- learning technology was being used
to train and educate a myriad of personnel and each year enrolment numbers grow.
Evidence shows, however, that completion rates among e-learners were lower than that of
traditional learners. Motivational theory was applied to this problem to explain why e-
learners initiate, sustain, and terminate behaviour. In particular, an integrative
motivational model, that highlighted distal and proximal processes, was introduced to
identify and measure those factors most likely to influence e-learning course completion
rates. Findings offered recommendations that would be useful to e-learning course
11
instructors, administrators, and designers. Three research questions, guided by 13
hypotheses, were used to investigate motivational theory and its relation to e-learning
course completion rates. Eight (8) e-learning courses were analyzed along with 497
responses received from an on- line survey. Data was coded according to whether the
student completed or dropped the course. Statistical analysis showed that e-learners are
more likely to invest their time, talent, and energy when they encounter fewer technical
problems, fewer distractions, and more environmental support from supervisors and
instructors. Furthermore, lengthy modules and low self-efficacy were found to decrease
the motivational tendency to persist. Overall, results demonstrated that motivational
theory can be used to predict and explain those factors most likely to influence a person's
desire to "go the distance" with e-learning.
Penny and Kay (2011), carried out a study on factors that influence student E-Learning
participation in a UK higher education institution and argued that the higher education
sectors were concentrating on increasing the use of online applications of e-learning by
using the internet to enhance education. With the rapid growth of e-learning, computers
were now being used by students in many different educational processes and were
considered to be valuable tools to enhance-learning in higher education.
Wenger (1998), argued that participation is an intrinsic part of learning; hence a key
challenge for e-learning was to enhance student participation. It was believed that learner
participation would be enhanced by the use of computer-mediated media in both
traditional and e-learning settings (Haythornwaite, 2002; Leidner & Jarvenpaa, 1995;
Bento & Schuster, 2003). Online learner participation has been defined as a process of
learning by taking part and maintaining relations with others, a complex process
comprising doing, communicating, thinking, feeling and belonging, which occurs both
online and offline (Hrastinski, 2008). Hrastinski (2009), provided a review of the
literature in the area of online learner participation and claims that participation and
learning are intricately interrelated and that, in order for learners to take full advantage,
the participation experience needs to be satisfactory.

12
Mahdizadeh, Biemans, Mulder (2007), conducted a study on determining factors of the
use of e-learning environments by university teachers. This study was designed to
identify factors that can explain teachers’ use of e-learning environments in higher
education. A questionnaire was completed by 178 teachers from a wide variety of
departments at Wageningen University in the Netherlands. The authors found that 43% of
the total variance in teacher use of e-learning environments could be explained by their
opinions about web-based activities and their opinions about computer-assisted learning
(predictors) and the perceived added value of e-learning environments (mediating
variable). In other words, teachers’ use of e-learning environments could be explained to
a high extent by their perceptions of the added value of these environments, which in turn
were substantially influenced by their opinions about web-based activities and computer-
assisted learning.
Al-adwan and Smedley (2012), conducted a study on the factors affecting impact of
Implementing e-learning in the Jordanian Higher Education System. The study explored
the factors that influenced the development of learning through technology at two
Jordanian universities, focusing on full-time staff and students. They noted that the
increased involvement of technology in all aspects of our lives places educational
institutions under pressure to include these aspects at the heart of their learning. This
ensures that they continue to be competitive in a constantly changing market with
international and cultural links. The study also considered the general attitude towards
engaging in learning through technology with outcomes demonstrating that training and
development was required prior to implementation to adequately support the e-learning
transition. The organisational infrastructure often presents the greatest barrier to such
developments. Informed by the outcomes of the study, a training and development
programme was designed, developed and implemented to support the cultural change and
increase its impact.
A New Zealand university research study (Butson, 2005), on the use of web-based
technologies suggested that e-learning adoption may be driven by the technology itself
as, according to the survey data, teachers saw no significant advantage in using web

13
based technologies and there were no institutional or faculty drivers for web-based
teaching. If this hypothesis is correct, and the technology does, in fact, drive e-learning
adoption, poor quality of e-learning was to be expected. Rogers (1995), indicated that
providing incentives for adoption of an innovation may change the patterns of adoption;
the use of incentives may lead to adoption by individuals different from those who would
have adopted it otherwise, and may negatively affect sustainability of adoption. It would
increase the rate of adoption, but lead to a reduction in quality. Work done by Elgort
(2005), on E-learning adoption clearly showed that the e-learning adoption decision was
frequently motivated by student pressure. Elgort noted that “like organizational
incentives, student pressure may facilitate the rate of adoption of e-learning at the
expense of its quality, resulting in a ‘surface’ approach to e-learning”.
Abdel-Wahab (2005), wrote on “modeling students’ intention to adopt e-learning: a case
from Egypt”, and the results of the study suggested that the best subset of predictors that
can be used in modeling a student intention to adopt e-learning includes: attitudes
towards e-learning, usefulness of e-learning, ease of e-learning use, pressure to use e-
learning, and the availability or resources needed to use e-learning. Ndubisi (2004), also
found out from his study that ‘attitude has an important direct influence on intention to
adopt e-learning’. Attitude is anchored usefulness, ease of use, and system’s security.
Perceived behavioural control was also noted as another important determinant of
interaction. Ndubisi concluded that “in order to enhance e-learning adoption intention and
in turn acceptance among Malaysian students, interested parties to this learning
arrangement must try to build favourable attitude through enhanced usefulness and ease
of use perceptions, as well as security.
Brown (2009) and Sahlfeld (2009), both agreed that availability of a good variety of
reliable ICT equipment enhanced learners’ ICT competencies and literacy. Gobbo and
Girardi (2001), Ritz (2009), and Sang et al (2009), all indicated that teachers’ ICT
literacy level influenced how learners used ICT in a school. Zhao and Bryant (2009), in
their study found out that besides teachers’ ICT literacy level, availability of ICT support
staff improved learner’s competencies and ICT usage. It was noted in this study that there

14
was total lack of ICT support staff in all the study schools. It could therefore be stated
that this affected the learners negatively since the ICT laboratory remained closed once
the teachers were busy elsewhere.
Friesen (2009), noted that school rules and regulations affected the ICT components
learners access. At the same time, McCarthy and Berger (2008), further indicated that a
school’s ICT policy greatly affected whether a student chooses to pursue studies in
technology. According to Juma (2003), AVU was established because of the realization
that, “tertiary institutions in their present forms, overwhelmed with problems related to
access, finance, quality and internal and external efficiency are unable to bridge the
knowledge gap. Limited space and declining budgets prevent universities from servicing
the growing demands of higher education” (p.210).
E-learning is basically a web-based system that makes information or knowledge
available to users or learners and disregards time restrictions or geographic proximity.
Although online learning has advantages over traditional face-to-face education (Piccoli
et al., 2001), concerns include time, labor intensiveness, and material resources involved
in running e-learning environments. The costly high failure rate of e-learning
implementations discussed by Arbaugh and Duray (2002), deserves attention from
management and system designers. Mason and Weller (2000), in an experiment on a
web-based course, “your computer and the Net”, found that web-creation skills, previous
computing experience, group collaboration and input of time are important factors
affecting students’ acceptance of the long distance education system.
Arising from extensive literature review, Wong (2007), argues that e-learning limitations
can be categorized as technological limitations, limitations compared to traditional
campus, and personal issues. Limitations that do not fit into these categories are
considered as other limitations. Students need necessary hardware for e-learning such as
desktop or notebook computers and printers (Kathawala, Abdou, Elmulti, 2002; Hiltz,
1997). Therefore, one of the major technological limitations of e-learning is the necessity
of computer hardware and relevant resources.

15
Kember et al. (2001), mentioned that preparation is indeed needed for newcomers as they
may think that nontraditional learning such as e-learning is the same as a traditional
learning environment. Another limitation that is related to time is self-discipline.
Working adults are learners who might lack the self-discipline needed to learn while
handling work and family commitments. In order to be successful in e-learning one has to
learn new skills and technologies. Evan & Hasse (2001), found out that learners are
moderately lacking in computer proficiency.
E-learning seems unsuitable for those individuals without self-discipline. It requires a lot
of self-discipline, mostly because e-learners are busy working adults as explained earlier.
Besides, e-learners also seemed to need preparatory training especially in ICT skills in
order for them to get used to e-learning environment. On top of these problems, e-
learners also face some problems for instance necessity of computer resources, bandwidth
problems, lacking physical interactions and limited recognition of e-learning courses and
etc. These facts show that e-learning is not prefect at the moment and the e-learning
providers can consider these limitations to improve e-learning services (Wong, 2007).
Davis’ (1989), TAM is widely used to study user acceptance of technology. The
measures presented in Davis’ study target employee acceptance of organizational
software, but these measures have been tested and validated for various users,
experienced and inexperienced, types of systems, word processing, spreadsheet, email,
voicemail, etc., and gender .Studies have also used TAM to evaluate user adoption of e-
commerce. TAM is based on the theory of reasoned action, which states that beliefs
influence intentions, and intentions influence one’s actions (Ajzen & Fishbein, 1972).
According to TAM, perceived usefulness (PU) and perceived ease of use (PEOU)
influence one’s attitude towards system usage, which influences one’s behavioral
intention to use a system, which, in turn, determines actual system usage.

16
The Diffusion of Innovation theory is often regarded as a valuable change model for
guiding technological innovation where the innovation itself is modified and presented in
ways that meet the needs across all levels of adopters. It also stresses the importance of
communication and peer networking within the adoption process. In simple terms, the
diffusion of innovation refers to the process that occurs as people adopt a new idea,
product, practice, philosophy, and so on. Rogers (1995), mapped out this process,
stressing that in most cases, an initial few are open to the new idea and adopt its use. As
these early innovators ‘spread the word’ more and more people become open to it which
leads to the development of a critical mass. Over time, the innovative idea or product
becomes diffused amongst the population until a saturation point is achieved. Rogers
distinguished five categories of adopters of an innovation: innovators, early adopters,
early majority, late majority, and laggards. Sometimes, a sixth group is added: non-
adopters.
Venkatesh, Morris, Davis and Davis (2003), created an integrated model called Unified
Theory of Acceptance and Use of Technology (UTAUT), in which eight models
previously used in the information technology literature were merged. UTAUT helps
managers assess the likelihood of success for new technologies as well as understand the
drivers of technology acceptance. The UTAUT model identifies the determinants of user
acceptance and usage behavior. Accordingly, there are four core determinants of
intention to use and usage of the technology. Three are direct determinants of intention to
use the technology namely performance expectancy, effort expectancy and social
influence while intention to use and facilitating conditions are two direct determinants of
usage behavior. They also identified four moderators of these key relationships namely
gender, age, experience and voluntariness of use.
Mbogo (2008), conducted a study on the determinants of employee dropout in corporate
web-based learning and took a case study on Hilton Hotel Nairobi. The author concluded
that younger employees were more likely to continue with e-learning courses compared
to older employees. In addition, gender did not seem to matter in the corporate web base
e-learning. Possession of basic computer training was negatively and significantly related

17
with drop out Technical courses such as financial management experienced a higher
dropout rate than basic courses such as customer care and time management. In
conclusion, the author advocated that organizations should take this factor into
consideration when designing corporate web-based learning programs.
Sang (2003), conducted an assessment of the readiness of institutions to offer electronic
learning and took a case of Egerton University. The research study assessed the
institutions readiness for e-learning, it identified the several factors of e-learning
readiness in the literature and through the use of questionnaires and observation. These
factors were explored further to determine the effect of lectures attitude, perception and
exposure, on e-learning readiness. A convenient number of Egerton University lecturers
were sampled through stratified random selection procedure. Correlation analysis was
used to analyze the data and in testing the hypotheses. The data analyzed showed that the
there is no relationship between the attitude, perception and exposure of-the lecturers and
the institution readiness to offer e-learning. The findings can be used by lecturers and
administrators to come up with an effective e-learning strategy.
Mulwa, Kyalo, Mboroki and Bowa (2012), conducted a study on the Influence of Human
Resource Capacity on Readiness to Adopt E-Learning in Secondary Schools in Kitui
District, Kenya. The independent variable of the study was Human resource capacity,
indicated by skills in ICT; availability of support staff; and availability of time to apply e-
learning in the teaching and learning processes. The dependent variable was Readiness to
adopt e-learning indicated by availability of sufficient e-learning equipment; and
availability of relevant skills in handling e-learning. A single questionnaire coupled with
observation schedule were used to collect data from 15 provincial and 36 District public
secondary schools, selected through stratified random sampling. Null hypotheses were
tested using one way ANOVA at 0.05 and regression analysis. The study established that
human resource capacity had influence on the readiness to adopt e-learning. However the
influence was not statistically significant. Generally, the human resource capacity was
not adequate to support the adoption of e-learning in secondary schools in Kitui district.
It was recommended that the government should seek to address the issue of human

18
resource capacity in preparation to adopt e-learning in secondary schools in Kitui District
and indeed all other districts before embarking on full scale implementation of e-learning
in schools
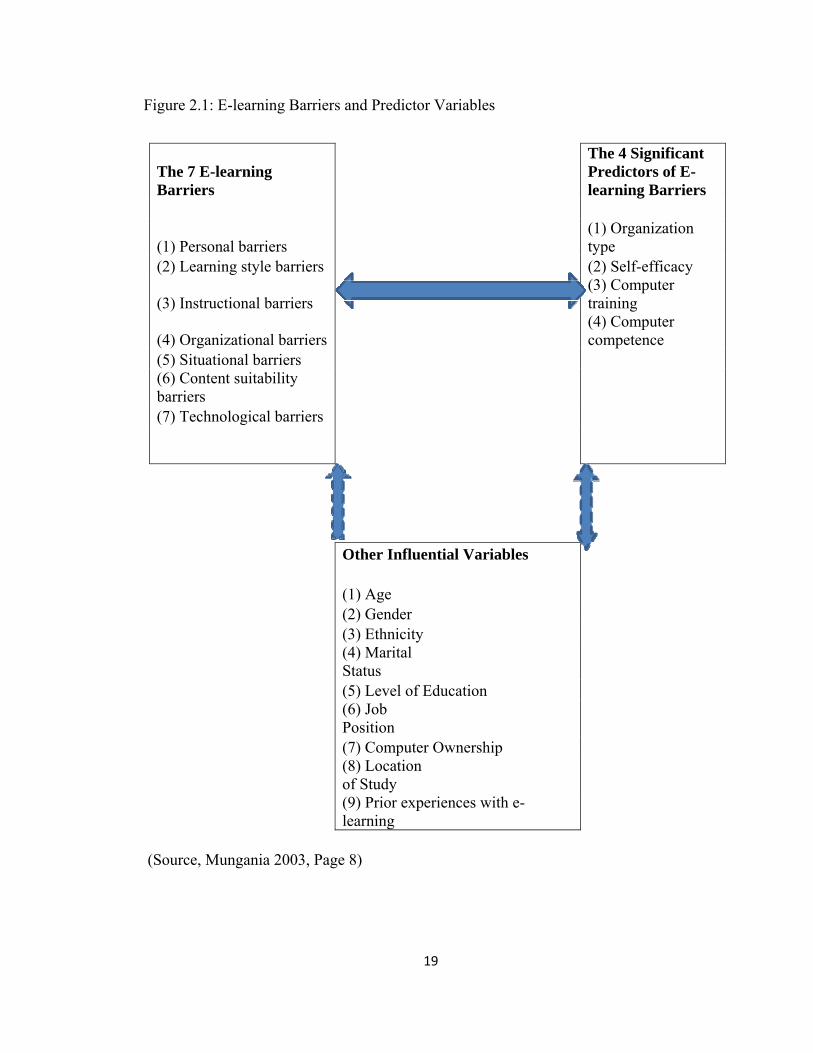
Mungania (2003), carried out a study on the seven e-learning barriers facing employees.
An anonymous validated Web-based survey was used to collect data, showing the
viability of Web-based surveys as a tool for promoting e-learning and organizational
research. The Barriers in E-learning and Self-Efficacy (BELSE) survey was used to
collect self-reported data, administered to a convenient sample of employee volunteers.
The participants were employees in seven organizations in the United States and abroad.
These organizations represent manufacturing, oil exploration & manufacturing, IT
consulting, wholesale distribution, public school district, and a military division. Four
key factors emerged as significant predictors of e-learning barriers, namely: (1)
organization, (2) self-efficacy, (3) computer competence, and (4) computer training.
Computer competence and self-efficacy were negatively associated with barriers. Thus if
one reported high self-efficacy, this was associated with fewer the barriers. Those who
rated themselves as having no computer training and with low levels of computer skills
were more likely to say they encountered barriers. Age, gender, ethnicity, marital status,
level of education, prior experiences with computers and e-learning, computer ownership,
location of study, and job position are not statistically significant predictors of barriers as
presented in figure 2.1.
19
Figure 2.1: E-learning Barriers and Predictor Variables
The 7 E-learning Barriers
The 4 Significant Predictors of E-learning Barriers
(1) Personal barriers (1) Organization type
(2) Learning style barriers (2) Self-efficacy
(3) Instructional barriers (3) Computer training
(4) Organizational barriers(4) Computer competence
(5) Situational barriers (6) Content suitability barriers (7) Technological barriers
Other Influential Variables (1) Age (2) Gender (3) Ethnicity (4) Marital Status (5) Level of Education (6) Job Position (7) Computer Ownership (8) Location of Study (9) Prior experiences with e-learning
(Source, Mungania 2003, Page 8)

20
Ndeta (2003), stated that there is little literature on the use of ICT in Kenya. The
government of Kenya and its partners launched a poverty eradication strategy where the
role of ICT was considered as minimal in poverty eradication. However, in the Kenya's
Poverty Reduction Strategy Paper for the period 2001-2003, the government recognizes
that telecommunication, information services, and IT sectors are important for economic
growth. The reasons for lack of ICT-services in Kenya are bureaucracy, lack of
professionalism in the business sector, corruption, illiteracy, and poverty. She further
observes that “this little-used service” may die before it grows unless more effort is put in
to make it accessible to the people of Kenya (Ndeta, 2003: 94). This has meant that the
Internet is a secondary need especially to rural elites since they first need to learn how to
handle a computer before using it. In addition, the cost is high for average users. This
does not apply to the educated Kenyans who have a good salary. Furthermore, Ndeta
stresses, the Kenyan government intends to strengthen its IT capacity and improve
service delivery for all by working with entrepreneurs to drive down prices by increasing
competition. As a result, the government proposed the provision of digital villages.

21
CHAPTER THREE: RESEARCH METHODOLOGY
3.1 Introduction
This chapter describes the various methodologies that were used in gathering
information, procedures adopted in conducting the research, the techniques used in
analysis and the presentation of data collected. This chapter therefore focuses on the
research design, population, population sample, sample design and data collection and
analysis applied during the study.
3.2 Research Design
A descriptive survey design was used in finding out the factors influencing the use of e-
learning in Public universities in Kenya. A survey study of Public universities in Kenya
were taken. A survey research design is an attempt to collect data from more than one
member of a population. A survey research could be descriptive, exploratory or involving
advanced statistical analyses (Mugenda and Mugenda, 2003). This descriptive survey
research design was preferred because data is collected without manipulation of the
variables (Kothari, 1990). This means that the researcher is able to report things the way
they are (status quo).
3.3 Population of Study
Breakwell (1995), defines population as the set of all “units” of analysis in one’s problem
area. According to Commission for University Education (2013), there are 22 Public
Universities. The Population of this study was the 19,205 employees (Academic and non-
Academic staff) in all public universities (Ethnic Diversity and Audit of public
Universities Report, 2013).
3.4 Sampling Design
According to Nesbary (2000), a sample is a subset of a population that has been selected
to reflect or represent characteristics of a population. The study applied convenient

22
sampling, where 0.5 % of respondents from each public university representing the two
levels of staff were taken. This implies that the sample size was 96 employees.
Table 3.1: Sample Size
Population Sample
Academic staff 14238 71
Non Academic Staff 4967 25
Total 19205 96
Source: Author (2013)
3.5 Data Collection
A questionnaire was the preferred data collection instrument for this study. According to
Kumar (2005), a questionnaire is a written list of questions, the answers to which are
recorded by respondents. The questionnaire comprised both open and closed ended
questions. A questionnaire would be most preferred by respondents for anonymity. Drop
and pick questionnaires ensured that the researcher does not disrupt the respondents
working schedule. To ensure that the respondents of the study have experience in e-
learning, snowballing was used where a respondent was expected to give a referral of
another respondent who has undertaken an e-learning course.
The questionnaire consisted of the following parts; Demographic characteristics,
technological factors, personal factors, design factors and use of e-learning in Public
Universities in Kenya.
3.6 Data Analysis
Descriptive and inferential statistics were used. The data was fed into SPSS version 17
(statistical package for social sciences). The particular inferential statistics to be used
were factor analysis and correlation analysis.
The data was presented using frequency distribution tables and charts.

23
CHAPTER FOUR: DATA ANALYSIS FINDINGS AND DISCUSSION
4.1 Introduction
This chapter comprises of results derived from data analysis. Data was gathered by use of
questionnaires as derived from the research objectives. The data collected from
respondents is presented and summarized using tables and figures. The descriptive results
are presented first followed by the inferential statistics (correlation and factor analysis).
4.2 Response Rate
The target sample for the study was 96 which included 71 of the academic staff while 25
were the non-academic staff. The findings are presented in Table 4.1. The overall
response rate was 71% of the total questionnaires issued.
Table 4.1: Response Rate
Category Sample Responses percent Academic staff 71 56 78.00% Non Academic Staff 25 16 64.00% Total 96 69 71.00% Source: Author (2013)
4.3 Sample Demographics
This section presents the demographic characteristics of the data specifically, the gender,
age, level of education, years of internet use, discipline in setting of a reading timetable
and discipline in adhering to the timetable.
4.3.1 Gender of the Respondents
The study sought to establish the gender of the respondents in relation to e-learning.
From the findings it was found that majority of the respondents were male who
comprised of 55.07%. Female respondents were relatively close range at 44.93% as

24
presented in Figure 4.1. This can be explained by the fact that majority people,
irrespective of gender, have access to e-learning tools in their daily life.
Figure 4.1: Gender
Source: Author (2013)
4.3.2 Age of the Respondent
The respondents were asked to indicate their age and the findings are presented in Figure
4.2. Majority of the respondents 50.72%, were persons aged between 36 to 50 years. This
can be explained by the fact that e-learning is currently predominantly used in non-
academic career enhancing training. This particular age group is involved in this phase of
study. Those aged between 21 to 35 years comprised a statistically large proportion at
31.88%. This can be explained by the factor those in this age bracket are just getting into
employment and starting on career enhancing training which is the area that is
predominantly using e-learning. Respondent who were below 20 years of age comprised
8.70% of the respondents. This can be explained by the fact that majority of people in the
below 20 years age bracket are still pursuing basic education and majority are yet to be
employed. The respondents who were above 51 years were also minimal with 8.70%
which can be explained by the fact that most of them have little exposure to computers as
this technology was recently implemented.

25
Figure 4.2: Age
Source: Author (2013)
4.3.3 Level of Education
The study also sought to establish the level of education of the respondents. The findings
are presented in Figure 4.3. The results indicate that 49.28 % of the respondents were
found to be have master degree qualifications and this can be explained by the fact that
the respondents were university staff and majority facilitate their staff in acquiring
knowledge as well universities as requiring high caliber staff in their ranks. Over thirty
three percent (33.33%) of the respondents had a degree level while 10.14% were of the
PhD level. About 7.25% had diploma as their highest level of education. Overall, this
implies that the respondents were highly educated.

26
Figure 4.3: Level of Education
Source: Author (2013)
4.3.4 Years of Internet Use
The study sought to find out the experience in terms of number of years of internet use.
The findings are presented in Table 4.2. Forty six percent of the respondents were staff
who had experience in internet use for more than ten years. Above thirty seven percent
(37.7%) had used the internet for three to ten years while those who had less than three
years’ experience comprised of 14.50%. The respondents who had no experience
comprised of 1.4%. These findings imply that the respondents were people who had
adequate exposure to internet use.
Table 4.2: Years of Internet Use
Years of Internet Use Frequency Percent No experience 1 1.40% Less than 3 years 10 14.50% 3-10 years 26 37.70% More than 10 years 32 46.40% Total 69 100% Source: Author (2013)

27
4.3.5 Setting a Reading Timetable
The study also sought to establish the discipline rating of people by enquiring whether the
respondents had set a reading timetable. The findings are presented in Table 4.3. Ninety
one percent (91.3%) of the respondents agreed that they had set a reading timetable while
8% had not set such reading timetable. These findings imply that the respondents were
disciplined people.
Table 4.3: Setting a Timetable
I have set a reading timetable Frequency Percent Yes 63 91.30% No 6 8.70% Total 69 100.00% Source: Author (2013)
4.3.6 Adhering to the Timetable
Regarding whether the respondent strictly adhered to the timetable, 88.4% of the
respondents replied in the affirmative while 11.6% stated that they did not strictly adhere
to their timetables. The findings are presented in Table 4.4 and they depict that most of
the staff had a positive rating in terms of discipline.
Table 4.4: Adhering to the Timetable
I have strictly adhered to the timetable Frequency Percent Yes 61 88.40% No 8 11.60% Total 69 100.00% Source: Author (2013)

28
4.4 Descriptive Results
This section presents the descriptive results. These findings comprised the mean and
standard deviations.
4.4.1 E-learning
The study sought to establish the extent of use of e-learning in Public Universities in
Kenya as indicated by the number of online courses the respondents attended. The
findings were presented in Table 4.5. Majority of the respondents undertook business
accounting and finance courses as shown by a mean of 2.81 and a standard deviation of
2.06. The mean number ICT courses undertaken by a respondent were 1.88 while
languages were 1.17 with a standard deviation of 1.399 and 0.985 respectively. The mean
of other courses undertaken by each respondent was 0.83 with a standard deviation of
0.766. The overall mean courses undertaken by each respondent was 1.6725 with a
standard deviation of 1.3025. The findings imply that majority of respondents pursue
social sciences courses and more so business related courses through e-learning.
Table 4.5: E-learning
Minimum Maximum Mean Std.
DeviationBusiness, Accounting and Finance Courses 0 6 2.81 2.06 ICT Courses 0 4 1.88 1.399 Languages 0 3 1.17 0.985 Others 0 2 0.83 0.766 Average 1.6725 1.3025
Source: Author (2013)
4.4.2 Perceived Usefulness and E-learning Use
The study sought to establish the relationship between perceived usefulness and e-
learning use. The findings in table 4.6 indicate that 95.60% of the respondents agreed
with the statement that e- learning saves time compared to face to face learning. Above
seventy eight percent (78.2%) agreed that e-Learning saves money compared to face to

29
face learning ,and 71% also agreed with the statement that e-Learning saves them the
inconvenience of walking to a class. About fifty eight percent (58%) of the respondents
neither agreed nor disagreed with the statement that they scored better marks when they
undertook online courses. On a likert scale of one to five where one represents strongly
disagree and five represents strongly agree, the overall mean of 4.0675 with a standard
deviation of 0.78275 which implies that perceived usefulness is a key determinant of e-
learning use.
Table 4.6: Perceived Usefulness and E-learning
Statement Strongly Disagree Disagree
Neither agree nor disagree Agree
Strongly Agree Mean
Std. Deviation
E- Learning saves time compared to face to face learning 0.00% 1.40% 2.90% 27.50% 68.10% 4.62 0.621 E-Learning saves money compared to face to face learning 2.90% 10.10% 8.70% 56.50% 21.70% 3.84 0.980 E-Learning saves me the inconvenience of walking to a class 1.40% 1.40% 2.90% 23.20% 71.00% 4.61 0.752 I score better marks when I undertake online courses 2.90% 8.70% 58.00% 26.10% 4.30% 3.20 0.778 Average 4.0675 0.78275 Source: Author (2013)
4.4.3 Perceived Ease of Use and Use of E-learning
The study sought to find out whether perceived ease of use influenced e-learning. The
findings are presented in Table 4.7. About fifty six percent (56.5%) of the respondents
agreed that they found it easy to use computers during online lessons while another
59.2% agreed that they found it easy to navigate through online courses. When asked
whether they were comfortable with the online experience, 53.6% agreed that they did
and 71% of the respondents agreed that they found it easy to use online instructions

30
during reading. The overall mean was 3.44 with a standard deviation of 1.03 and these
results indicate that perceived ease of use has a big effect on the use of e-learning in
Universities in Kenya.
Table 4.7: Perceived Ease of Use and E-learning
Statement Strongly Disagree Disagree
Neither agree nor
disagree Agree Strongly
Agree Mean
Std. Deviati
on I find it easy to use the computer during online lessons 1.40% 20.30% 21.70% 50.70% 5.80% 3.10 0.843 I find it easy to navigate through online courses 2.90% 13.00% 24.80% 46.20% 13.00% 3.43 0.977 I am comfortable with the online experience 2.90% 11.60% 31.90% 36.20% 17.40% 3.54 1.008 I find it easy to use online instructions during reading 10.10% 11.60% 7.20% 43.50% 27.50% 3.67 1.280 Average 3.44 1.03 Source: Author (2013)
4.4.4 Supporting Infrastructure and Use of E-learning
The study sought to find out whether supporting infrastructure influences the use of e-
learning in public universities in Kenya. The findings are presented in Table 4.8. 92% of
the respondents agreed with the statement that they had a computer and/or a laptop to
facilitate e-learning. Above seventy five percent (75.4%) agreed that they had adequate
internet access to facilitate e-learning while 84% of the respondents agreed that they had
adequate access to an e-learning centre that is conducive to e-learning. However 94.1%
disagreed to the statement that they had access to a qualified online instructor. The
overall likert mean was 3.66 with a standard deviation of 0.947 and this implies that
supporting infrastructure greatly influence the use of e-learning in Universities in Kenya.

31
Table 4.8: Supporting Infrastructure and E-learning
Statement Strongly Disagree Disagree
Neither agree nor
disagree Agree Strongly
Agree Mean
Std. Deviation
I have a computer and /or a laptop to facilitate e-learning 1.40% 0.00% 5.80% 31.90% 60.90% 4.51 0.740 I have adequate internet to facilitate e-learning 4.30% 13.00% 7.20% 34.80% 40.60% 3.94 1.187 I have adequate access to an e-learning centre/room that is conducive to e-learning 1.40% 8.70% 5.80% 47.80% 36.20% 4.09 0.951 I have access to a qualified online instructor 20.30% 63.80% 2.90% 11.60% 1.40% 2.10 0.910 Average 3.66 0.947 Source: Author (2013)
4.5 Pearson’s Correlation Analysis
Bivariate correlation indicates the relationship between two variables. It ranges from 1 to
-1 where 1 indicates a strong positive correlation and a -1 indicates a strong negative
correlation and a zero indicates lack of relationship between the two variables. The closer
the correlation tends to zero the weaker it becomes. Findings in Table 4.9 indicate that
the correlation between e-learning and usefulness was strong and positive (0.472) and
statistically significant (0.000). The correlation between e-learning and ease of use, and
supporting infrastructure was 0.581 and 0.398 respectively with statistical significance of
0.000 0.001 respectively.

32
Table 4.9: Pearson’s Correlation
Statement E-
learning Usefulness Ease of
use
Supporting infrastructur
e
E-learning Pearson Correlation 1 Sig. (2-tailed)
Usefulness Pearson Correlation 0.472 1 Sig. (2-tailed) 0.000
Ease of use Pearson Correlation 0.581 0.458 1 Sig. (2-tailed) 0.000 0.000
Supporting infrastructure
Pearson Correlation 0.398 -0.029 0.031 1 Sig. (2-tailed) 0.001 0.812 0.802
Correlation is significant at the 0.01 level (2-tailed). Source: Author (2013)
4.6 Factor Analysis
Factor analysis conducted on four statements measuring usefulness indicated that one
factor can be extracted. The findings were presented in Table 4.10. The extracted factor
explains 56.246% of the total variance. The extracted factor used the basis of Kaiser
maximum criteria which indicates that an Eigen value of more than one constitutes a
factor.
Table 4.10: Perceived Usefulness
Component
Initial Eigenvalu
es Extraction Sums of Squared Loadings
Total
% of Varianc
e Cumulative %
Total % of
Variance
Cumulative %
1 2.250 56.246 56.246 2.25 56.246 56.246 2 0.757 18.936 75.182 3 0.598 14.958 90.14 4 0.394 9.86 100
Extraction Method: Principal Component Analysis. Source: Author (2013)

33
The factor loadings indicated that the first statement “E- Learning saves time compared
to face to face learning” attracted a factor loading of 0.855.The second statement “I score
better marks when I undertake online courses” attracted a factor loading of 0.746
The statement “E-Learning saves me the inconvenience of walking to a class” attracted a
factor loading of 0.708 while the statement ‘E- Learning saves time compared to face to
face learning” had a factor loading of 0.679.Overall, all statements loaded heavily
(loadings were above 0.5) on the factor perceived usefulness. The findings are presented
in Table 4.11.
Table 4.11: Component Matrix for Perceived Usefulness
Statement Component E-Learning saves money compared to face to face learning 0.855 I score better marks when I undertake online courses 0.746 E-Learning saves me the inconvenience of walking to a class 0.708 E- Learning saves time compared to face to face learning 0.679 Extraction Method: Principal Component Analysis.
Source: Author (2013)
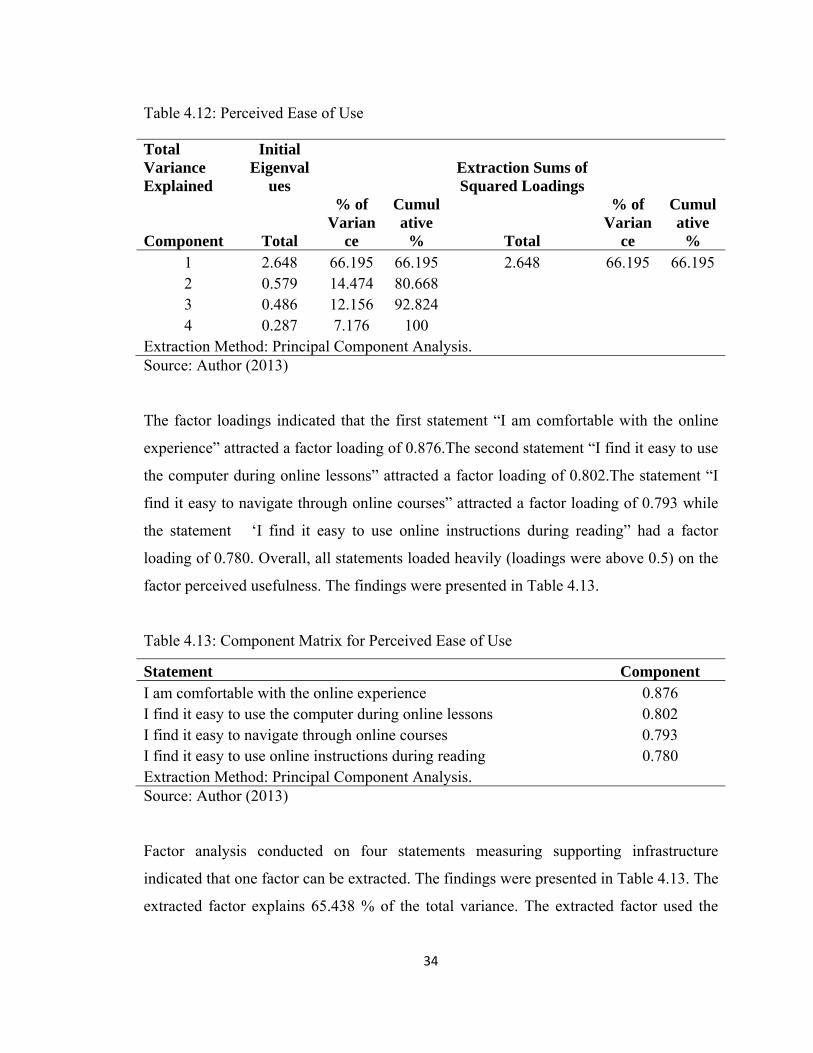
Factor analysis conducted on four statements measuring perceived ease of use indicated
that one factor can be extracted. The findings were presented in Table 4.12. The extracted
factor explains 66.195 % of the total variance. The extracted factor used the basis of
Kaiser maximum criteria which indicates that an Eigen value of more than one
constitutes a factor.
34
Table 4.12: Perceived Ease of Use
Total Variance Explained
Initial Eigenval
ues Extraction Sums of Squared Loadings
Component Total
% of Varian
ce
Cumulative
% Total
% of Varian
ce
Cumulative
% 1 2.648 66.195 66.195 2.648 66.195 66.195 2 0.579 14.474 80.668 3 0.486 12.156 92.824 4 0.287 7.176 100
Extraction Method: Principal Component Analysis. Source: Author (2013)
The factor loadings indicated that the first statement “I am comfortable with the online
experience” attracted a factor loading of 0.876.The second statement “I find it easy to use
the computer during online lessons” attracted a factor loading of 0.802.The statement “I
find it easy to navigate through online courses” attracted a factor loading of 0.793 while
the statement ‘I find it easy to use online instructions during reading” had a factor
loading of 0.780. Overall, all statements loaded heavily (loadings were above 0.5) on the
factor perceived usefulness. The findings were presented in Table 4.13.
Table 4.13: Component Matrix for Perceived Ease of Use
Statement Component I am comfortable with the online experience 0.876 I find it easy to use the computer during online lessons 0.802 I find it easy to navigate through online courses 0.793 I find it easy to use online instructions during reading 0.780 Extraction Method: Principal Component Analysis. Source: Author (2013)
Factor analysis conducted on four statements measuring supporting infrastructure
indicated that one factor can be extracted. The findings were presented in Table 4.13. The
extracted factor explains 65.438 % of the total variance. The extracted factor used the

35
basis of Kaiser maximum criteria which indicates that an Eigen value of more than one
constitutes a factor.
Table 4.14: Supporting Infrastructure
Total Variance Explained
Initial Eigenvalues
Extraction Sums of Squared Loadings
Component Total
% of Varian
ce
Cumulative
% Total
% of Varian
ce
Cumulative
% 1 2.618 65.438 65.438 2.618 65.438 65.438 2 0.635 15.871 81.309 3 0.391 9.766 91.074 4 0.357 8.926 100
Extraction Method: Principal Component Analysis. Source: Author (2013)
The factor loadings indicated that the first statement “I have a computer and /or a laptop
to facilitate e-learning” attracted a factor loading of 0.827.The second statement “I have
adequate internet to facilitate e-learning” attracted a factor loading of 0.852.The
statement “I I have adequate access to an e-learning centre/room that is conducive to e-
learning” attracted a factor loading of 0.844 while the statement ‘I have access to a
qualified online instructor” had a factor loading of 0.780. Overall, all statements loaded
heavily (loadings were above 0.5) on the factor perceived usefulness. The findings were
presented in Table 4.15.

36
Table 4.15: Component Matrix for Supporting Infrastructure
Statement Component I have a computer and /or a laptop to facilitate e-learning 0.827 I have adequate internet to facilitate e-learning 0.852 I have adequate access to an e-learning centre/room that is conducive to e-learning 0.844 I have access to a qualified online instructor 0.705 Extraction Method: Principal Component Analysis.
Source: Author (2013)
4.7 Summary
Results revealed perceived usefulness was important in explaining the use of e-learning.
This is supported by a p value 0.000 which means that perceived usefulness is a
statistically significant predictor of the use of e-learning. Results further revealed that
such perceived ease of use is important in determining use of e-learning as demonstrated
by a p value of 0.000. Analysis showed that supporting infrastructure is a key determinant
in use of e-learning in Universities in Kenya and this was supported by a correlation
coefficient of 0.398 (p value of 0.001)
The findings agree with those of Davis (2009), perceived usefulness is an indicator of the
degree to which the use of an information system will enhance a user’s job performance
Most of the prior studies in e-learning adoption modeled perceived usefulness as a black-
box focusing on an overall benefit of an e-learning system (Larsen et al., 2009). Shee &
Wang (2008), argued that e-learning systems are distinct from other information systems
to some extent. They argued that an e-learning system offers educators and students
“possibilities”, instead of “ready to use” resources. In this regard, while the effectiveness
of a general information system is based on the performance of individuals, an e-learning
system’s effectiveness largely depends on collaboration between individuals (both
educators and students). As such, the prior conceptualization of perceived usefulness fails
to capture the unique characteristics of e-learning.

37
As with significant causal relations of perceived ease of use with perceived usefulness
and attitude toward WebCT considered, an eLearning management system, which is
made to afford clear and favorable interaction between the instructor/content/system and
the learner and between learners may be adopted and used to advantage. With that in
mind, instructors are advised to selectively use available features of an eLearning
management system that best facilitate effective course activities and promote
instructional objectives (Chang,2005).
These finding coincides with the literature suggesting that student perceptions of the
usefulness and effectiveness of the online instructional format has a statistically
significant effect on the emotional processes and learning the student experiences (Dobbs
et al., 2009) Moneta & Kekkonen-Moneta, 2007).Ng, Yeung and Hon (2006), state that it
seems logical that students who are less skilled will have more anxiety that will lessen
their enjoyment of a DE course. Grant, Malloy and Murphy (2009), call attention to the
fact the comprehension, level of skill, and self-efficacy a student possesses of a particular
computer software or e-learning tool is continuously changing, emphasizing the need for
continuous measurement of these factors and subsequent adaptation or realignment of
course content and methodologies. This supports a similar finding by Afari-Kumah and
Achampong (2010), which found a significant relationship between finding e-learning
easy to use and computer ownership (χ² (2) = 17.92; p < 0.001). Other relationships were
found among variables such as e-learning system easy to use and years of using the
internet (χ² (2) = 24.91; p < 0.001), as well as frequency of internet use (χ² (8) = 32.18; p
<0.001).

38
CHAPTER FIVE: SUMMARY, CONCLUSIONS AND RECOMMENDATIONS
5.1 Introduction
This chapter comprises of summary key findings of the study based on results from data
analysis and the objectives of the study. Conclusions and recommendations are also
included and they are aligned to the findings.
5.2 Summary
The study aimed to establish the factors influencing the use of e-learning in public
universities in Kenya.
The literature review presented the uses of e-learning and reviewed studies that have
investigated the factors that influenced the use of e-learning. It presented the objective of
the reviewed studies, their main findings and pertinent conclusions and
recommendations.
Research methodology discussed the type of research design, population of study and
target population, sample, instruments to be used and data analysis.
Data analysis results revealed that perceived usefulness was important in explaining the
use of e-learning. This is supported by a p value 0.000 which means that perceived
usefulness is a statistically significant predictor of the use of e-learning. This implied that
an increase in perceived usefulness leads to an increase in the use of e-learning. Results
also indicated that perceived ease of use influenced the use of e-learning. Results from
data analysis showed that such perceived ease of use is important in determining use of e-
learning as demonstrated by a p value of 0.000. This implied that an increase in perceived
ease of use leads to an increase in the use of e-learning. Further results also revealed that
that supporting infrastructure is a key determinant in use of e-learning in Universities in
Kenya. This was supported by a p value of 0.000. This implied that an increase in support
infrastructure leads to an increase in the use of e-learning.
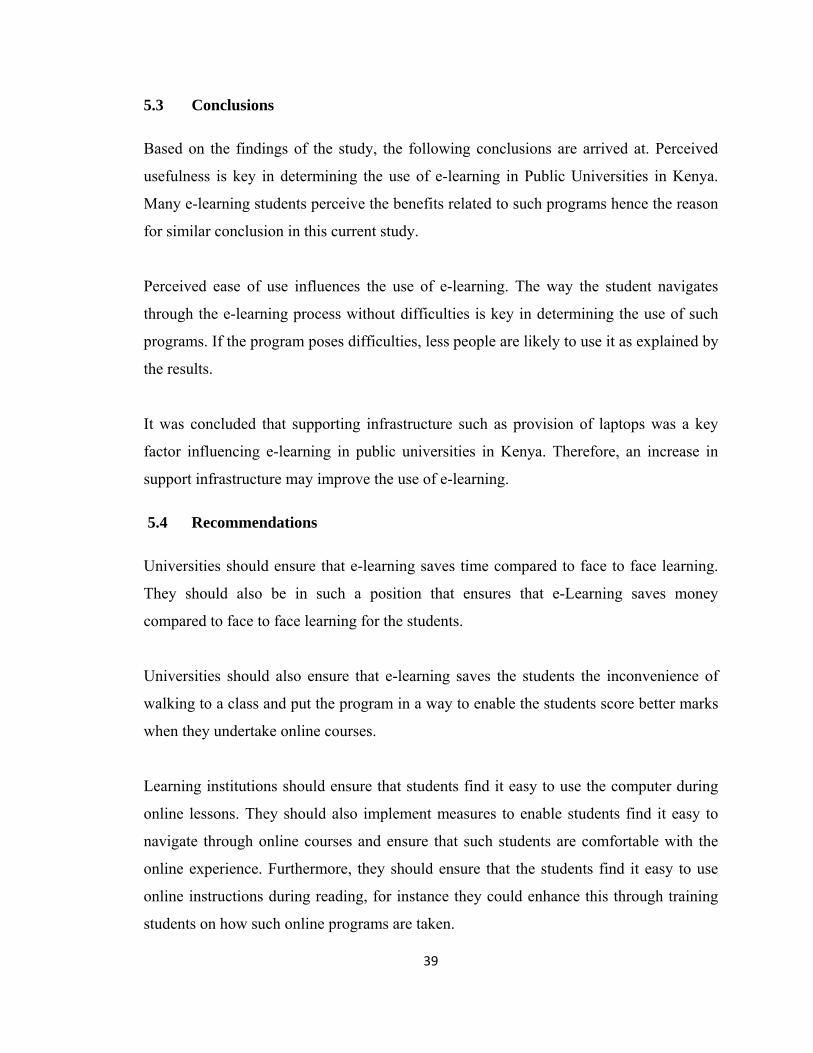
39
5.3 Conclusions
Based on the findings of the study, the following conclusions are arrived at. Perceived
usefulness is key in determining the use of e-learning in Public Universities in Kenya.
Many e-learning students perceive the benefits related to such programs hence the reason
for similar conclusion in this current study.
Perceived ease of use influences the use of e-learning. The way the student navigates
through the e-learning process without difficulties is key in determining the use of such
programs. If the program poses difficulties, less people are likely to use it as explained by
the results.
It was concluded that supporting infrastructure such as provision of laptops was a key
factor influencing e-learning in public universities in Kenya. Therefore, an increase in
support infrastructure may improve the use of e-learning.
5.4 Recommendations
Universities should ensure that e-learning saves time compared to face to face learning.
They should also be in such a position that ensures that e-Learning saves money
compared to face to face learning for the students.
Universities should also ensure that e-learning saves the students the inconvenience of
walking to a class and put the program in a way to enable the students score better marks
when they undertake online courses.
Learning institutions should ensure that students find it easy to use the computer during
online lessons. They should also implement measures to enable students find it easy to
navigate through online courses and ensure that such students are comfortable with the
online experience. Furthermore, they should ensure that the students find it easy to use
online instructions during reading, for instance they could enhance this through training
students on how such online programs are taken.

40
Regarding infrastructure learning institutions should ensure that the students have a
computer and /or a laptop to facilitate e-learning and that they have adequate internet to
facilitate e-learning. They should also ensure that the students have adequate access to an
e-learning centre or room that is conducive to e-learning. Moreover they should ensure
the students have access to a qualified online instructor. This will help the students to
have more appreciation of the program.
5.5 Areas for Further Study
This study was not exhaustive by any means and therefore it is recommended that another
study be conducted in other institutions like colleges and include other variables like cost
of such programs and the time they consume. The same study can be conducted in
another sector to test whether the findings of this study will hold true in a different
context.

41
REFERENCES
Abdel-Wahab. (2008), Modeling Students’ Intention to Adopt E-Learning: a case from
Egypt. EJISDC (2008) 34, 1, 1-13.
Afari-Kumah, E & Achampong, A. (2010), Modeling computer usage intentions of
tertiary students in a developing country through the Technology Acceptance
Model. International Journal of Education and Development using Information
and Communication Technology
Ajzen, I. & Fishbein, M. (1972), Attitudes and normative beliefs as factors influencing
intentions. Journal of Personality and Social Psychology, 21, 1–9.
Arbaugh, J. B and Duray, R. (2002), Technological and Structural Characteristics,
Student learning and satisfaction with Web-based courses – An exploratory study
of two online MBA programs. Management Learning, 33 (3), 331-347
Bates, L. (2012), The Different Uses of E-learning and M-learning. Retrieved from http://
www.fractuslearning.com/ 2012/ 09/12 /e-learning-and-m-learning/
Bento, R. and Schuster, C. (2003), Participation: The online challenge. In Web-based
education: Learning from experience (Aggarwal, A., Ed), pp 156-164, Idea Group
Publishing, Hershey, Pennsylvania.
Brown, R. A. (2009), Curriculum consonance and dissonance. Journal of Technology
Education, 20(4).
Butson, R. (2005), Determination of New Zealand tertiary institution e-learning
capability: an application of an e-learning maturity model – Report on the e-
learning maturity model evaluation f the New Zealand tertiaty sector.Report to
the New Zealand Ministry of Education. Retrieved from
http://www.tdc.vuw.ac.nz/research/emm/Documents.html#sector report.
Commission for Higher Education. (2008), Status of Universities in Kenya URL: http://
www.che..or.ke/status.html (retrieved November 26, 2009), (2008)

42
Commission for University Education. (2013), Status of Universities in Kenya URL:
http:// www.che..or.ke/status.html (retrieved July 31st 2013), (2013)
Davis, C and Eisemon, T. (1993), In Ahmed, A. (Ed) Universities and Research Capacity
Sceince and Technology Polivy for Economic Development in Africa: E. J. Brill,
pp. 68-93
Davis, F. (1989), perceived usefulness, perceived ease of use and user acceptance of
information technology. MIS quarterly, 13, 319-340
Davis, F.D. (2009), Perceived usefulness, perceived ease of use, and user acceptance of
information technology. Management Information S Quarterly, 13 (3).
Dobbs, R., Waid, C., & del Carmen, A. (2009), Students’ perceptions of online courses:
The effect of online course experience. Quarterly Review of Distance Education,
10(1), 9-26.
Edutech. (2013), The importance of eLearning in learning and development models.
Retrieved from http://edutech.net.au/ articles / The-importance-of-elearning-in-ld-
models.pdf
Elgort, I. (2005), E-learning adoption: bridging the chasm, ascilite 2005: Balance,
Ethnic Diversity and Audit of Public Universities Report. (2013), NCIC wants university
councils reshuffled. Retrieved on 30th July 2013 from http://www.the-
star.co.ke/news/article-122373/ncic-wants-university-councils-
reshuffled#sthash.UsD3O9DC.dpuf
Evans, J.R. & Haase, I.M. (2001), ‘Online business education in the twenty-first century:
an analysis of potential target markets’, Internet Research: Networking
Applications and Policy, vol.11, no.3, pp.246-260.
Friesen, N. (2009), Rethinking e-learning research. New York: Peter Lang. Funded by
the Masie Center
Galagan, P. (2002), The-learning Revolution. In Woods, J .A. & Cortada, J. W. (Eds.).
(2002). The 2002 ASTD Training and Performance Yearbook, 75-82. New York:
McGraw-Hill.

43
Gobbo, C. & Girardi, M. (2001), Teachers’ beliefs and integration of information
communication technol-ogy in Italian schools. Journal of Technology, Pedagogy
and Education, 10 (1&2), 63-85.
Grant, D. M. Malloy, A. D. & Murphy, M. C. (2009), A comparison of student
perceptions of their computer skills and their actual abilities. Journal of
Information Technology Education, 8, 141-160. Retrieved from
http://www.jite.org/documents/Vol8/JITEv8p141-160Grant428.pdf
Haythornthwaite, C. (2002), Building social networks via computer networks: Creating
and sustaining distributed learning communities. In Building virtual communities:
Learning and change in cyberspace (Renninger, K. A. and Schumar, W., Eds), pp
159-190, Cambridge University Press, Cambridge.
Hiltz, S.R. (1997), ‘Impacts of college level courses via Asynchronous Learning
Networks: Some Preliminary Results’, Journal of Asynchronous Learning
Networks, vol.1, no.2, pp.118.
Hrastinski, S. (2008), “What is online learner participation? A literature review,”
Computers & Education, volume 51, number 4, pp. 1,755–1,765
Hrastinski, S. (2009, January), A theory of online-learning as online participation.
Computers & Education, 52(1), 78-82. R Retrieved January 13, 2009, from the
Science Direct database.
Juma, M. N. (2003), The African Virtual University. Challenges and Prospects. In M.
Beebe;B.O. Oyeyinka; K. M. Kouakpou; M. Rao (Eds.), AfricaDotEdu. IT
Opportunities and Higher Education in Africa. New Delhi: Tata McGraw Hill.
Kathawala, Y., Abdou, K. & Elmulti, D.S. (2003), ‘The global MBA: a comparative
assessment for its future’, Journal of European Industrial Training, vol.26, no.1,
pp.14-23.
Kember, D., Armour. R., Jenkins. W., Lee. K., Leung, D.Y.P., Li. N., Ng. K.C., Siaw. I.,
& Yum, J.C.K. (2001), ‘Orientation to enrollment of part-time students: A
classification system based upon their perceived lifelong learning needs’, Higher
Education Research and development, vol.20, no.3, pp.265-280.

44
Knight, J. (2003), Why is E-learning so important?. Retrieved from
http://www.google.co.ke
Kothari, C. (2004), Research Methodology: Methods & Techniques, 2nd edition. New age
International Publishers, New Delhi, India
Kumar, R. (2005), Research Methodology: A Step-by-step Guide for Beginners, London:
Sage.
Larsen, T. J., Sorebo, A.M. and Sorebo, O. (2009), The role of task-technology fit as
users’ motivation to continue information system use. Computers in Human
Behavior, 25 (778-784).
Leidner, D. & Jarvenpaa, S. L. (1995), 'The use of information technology to enhance
management school education: a theoretical view', MIS Quarterly ,vol.19, no.3,
pp.265.
Longworth, N. and Davis, W.K. (1996), Lifelong Learning, Kogan Page, London
Mahdizadeh, Biemans, Mulder. (2007), Determining factors of the use of e-learning
environments by university teachers. management school education: a theoretical
view', MIS Quarterly ,vol.19, no.3, pp.265.
Mason, R. and Weller, M. (2000), “Factors affecting student’ satisfaction on a web
course”, Australian Journal of Educational Technology, Vol. 16 No. 2, pp. 173-
200.
Mbogo, G.G. (2008), Determinants of employee dropout in corporate web-based learning
and took a case study on Hilton Hotel Nairobi. Unpublished MBA Thesis.
University of Nairobi
McCarthy, R. R. & Berger, J. (2008), Moving beyond cultural barriers: Successful
strategies of female technology education teachers. Journal of Information
Technology 23, 133-149.
Moneta, G. & Kekkonen-Moneta, S. (2007), Affective learning in online multimedia and
lecture versions of an introductory computing course. Educational Psychology,
27(1), 51-74.

45
Mugenda, Olive M. and Mugenda, Abel G. (2003), Research methods: Quantitative and
Qualitative Approaches, Acts press, Nairobi-Kenya
Mugo, B. (2006), Key note Address. http://.elearning-africa.com/ pdf /div/
keynote_Beth_Mugo_Kenya.pdf
Mulwa, A.S., Kyalo, D.N., Mboroki, G. and Bowa O.(2012), The Influence of Human
Resource Capacity on Readiness to Adopt E-learning in Secondary Schools in
Kitui District, Kenya. The Africa Management Review. Department of Business
Administration, School of Business, University of Nairobi.
Mungania, P. (2003), The Seven E-learning Barriers Facing Employees. A Research
Report
Ndeta, P. (2003), ICT Integration Social and Economic Development: Kenya's
Perspective. In: Marshall, S., Taylor, W. & Yu, X.H. (ed.) (2003). Closing the
digital divide: transforming regional economies and communities with
information technology. Westport, Conn.: Praeger.
Ndubisi, N. O., Gupta, O. K and Ndubisi, G. C. (2004), The Mijuls’ model of computing:
Integrating the moderating impact of users’ persona into the technology
acceptance model, Journal of Global Information Technology Management.
Ngome, C. (2003), Kenya. In Altbach & Teferra (Ed) African Higher Education: An
International Reference Handbook: Bloomington: Indiana University Press, pp
359-371
Penny and Kay, I. (2011), Factors That Influence Student E-Learning Participation in a
UK Higher Education Institution. Interdisciplinary Journal of E-Learning and
Learning Objects, Vol. 7,
Piccoli, G., Ahmad, R. & Ives, B. (2001), Web-based virtual learning environments: a
research framework and a preliminary assessment of effectiveness in basic IT
skill training. MIS Quarterly, 25 (4), 401-426.
Ritz, J. M. (2009), A new generation of goals for technology education. Journal of
Technology Education, 20(2).

46
Rosenberg, Marc. J. (2001), E-learning: Strategies for building online-learning in the
digital age. New York: McGraw-Hill
Rosenberg, Michael. (November, 2001), E-Leaning Basics: A guide to the e-learning
industry. [Online], Available: archive http://elearning2.nosapo.pt/bibliografia.htm,
[10 December 2002].
Sahlfeld, M. (2009), How does ICT work for development? A review of challenges and
opportunities. ADTF Journal, 4 (1), 22-36.
Sang, B.K. (2003), An Assessment of The Readiness of Institutions to Offer Electronic
Learning A Case of Egerton University. Unpublished MBAThesis. Egerton
University.
Sang, G., Valcke, M., Braak, J. V. & Tondeur, J. (2009), Student teachers’ thinking
processes and ICT integration: Predictors of prospective teaching behavior with
educational technology. Computers and Education Journal, 54(1), 103-112.
Trombley, K.B. and Lee, D. (2002), “Web-based learning in corporations: who is using it
and why, who is not and why not?”, Journal of Educational Media, Vol. 27 No. 3,
pp. 137-146
Venkatesh, V., Morris M., Davis G. & Davis F. (2003), ‘User Acceptance of Information
Technology: Toward a Unified View’, MIS Quarterly, Vol. 27, no. 3, pp. 425-
479.
Wang, Z., Wang, Y. & Haggerty N. (2008), Why people benefit from e-learning
differently: The effects of psychological processes on e-learning outcomes.
Information & Management, 45, 513-521.
Webb, E., Jones, A., Barker, P. & Schaik, P. (2004), Using e-learning dialogues in higher
education. Innovations in Education and Teaching International, 41(1), 93-103.
Wenger, E. (1998), Communities of practice: Learning, meaning and identity.
Wong, D. (2007), A critical Literature Review on e-learning limitations. Review Papers.
School of Management & Information Technology, UCSI.

47
Zhao, Y. & Bryant, F. L. (2009), Can teacher technology training alone lead to high
levels of technology integration? A qualitative look at teacher technology
integration after state mandated technology training. Electronic Journal for the
Integration of Technology in Education, 5, 54-62
Zu, S. (2008), E-Learning Importance and Design. Whiter Paper ITEC 860 Distance
Education

48
APPENDICES
Appendix I: Introduction letter
Date: ………………..
RESEARCH QUESTIONNAIRE FOR EMPLOYEES IN PUBLIC
UNIVERSITIES
Dear Respondent,
I am George Njuguna, a graduate student of Master of Business Administration at
University of Nairobi. I am carrying out a Research study of “FACTORS
INFLUENCING THE USE OF E-LEARNING IN PUBLIC UNIVERSITIES IN
KENYA”.
It would be of great value if you could share your wealth of knowledge by completing
this questionnaire. Your answers will be handled with highest anonymity and
confidentiality; this will be achieved by no indication of names. Kindly return the
completed questionnaire to me.
Regards,
GEORGE NJUGUNA

49
Appendix II: Questionnaire
SECTION A: DEMOGRAPHIC DATA (Please tick as appropriate)
Personal Factors
1) Please specify your gender Male [ ]
Female [ ]
2) Please specify your age?
a. Below 20 yrs [ ]
b. 21 to 35yrs [ ]
c. 36-50 years [ ]
d. 51 years and above [ ]
3) What is your highest level of education?
a. Diploma [ ]
b. Degree [ ]
c. Masters [ ]
d. PhD [ ]
4) Years of Internet Use
i. No experience [ ]
ii. Less than 3 years [ ]
iii. 3-10 years [ ]
iv. More than 10 years [ ]
5) Rating in terms of Discipline ( Tick Appropriately)
a) I have set a reading timetable ( Yes) (No)
b) I have strictly adhered to the time table (Yes) (No)

50
Section B: Technological Factors influencing use of E-Learning.
Section B1: Perceived Usefulness and E-learning Use. This subsection is concerned with assessing whether perceived usefulness affects e-learning. Please mark (x) in the box which best describes your agreement or disagreement on each of the following statements.
Statement
Strongly Disagree
Disagree Neither agree nor disagree
Agree Strongly agree
E- Learning saves time compared to face to face learning
E-Learning saves money compared to face to face learning
E-Learning saves me the inconvenience of walking to a class
I score better marks when I undertake online courses
Section B2: Perceived Ease of Use and use of E-learning.
This subsection is concerned with assessing whether perceived ease of use inflences e-learning. Please mark (x) in the box which best describes your agreement or disagreement on each of the following statements. Statement
Strongly Disagree Disagree
Neither agree nor disagree Agree
Strongly agree
1 2 3 4 5 I find it easy to use the computer during online lessons
I find it easy to navigate through online courses
I am comfortable with the online experience
I find it easy to use online instructions during reading

51
Section B2: Supporting Infrastructure and E-learning Use.
This subsection is concerned with assessing whether supporting infrastructure influences e-learning. Please mark (x) in the box which best describes your agreement or disagreement on each of the following statements. Statement
Strongly Disagree Disagree
Neither agree nor disagree Agree
Strongly agree
1 2 3 4 5 I have a computer and /or a laptop to facilitate e-learning
I have adequate internet to facilitate e-learning
I have adequate access to an e-learning centre/room that is conducive to e-learning
I have access to a qualified online instructor
Section B3: E Learning Use
This subsection is concerned with assessing the extent of use of e-learning in Universities in Kenya. Please indicate the number of online courses you have attended.
Course Number of Online courses attended
Business, Accounting and Finance Courses
ICT Courses Languages Others Total