factors influencing the transformation and fate of sulphur
TRANSCRIPT

Copyright is owned by the Author of the thesis. Permission is given for a copy to be downloaded by an individual for the purpose of research and private study only. The thesis may not be reproduced elsewhere without the permission of the Author.

FACTORS INFLUENCING THE TRANSFORMATION AND
FATE OF SULPHUR AND NITROGEN IN GRAZED
HILL COUNTRY PASTURES
A thesis presented in partial fulfilment of the
requirements for the degree of
Doctor of Philosophy in Soil Science
at Massey University
KARUPPANSAKADEVAN
1991

Massey University Library Thesis Copyright Form
T. I f h . f/tc..To�S LiPL.tJ£:-NC!Nh ril£ �Sf-VRMA-'mA/Tb../.._b It e o t es1s: f*Tt::. � SVU'Ifr/¥{. A-"(}) /11 l'f"1'U �<S'fl/ NI/ fi?RA-Z-el.) HtL{_ tt:Jthl'r'o/
(1) (a) I give permission for my thesis to be made available tof>ilt!"'Tl.l�.
readers in Massey University Library under conditions determined by the Librarian.
(b) I do .... J:J..ot-wish my thesis to be made available to r�aders .JA'ithout my writt€m consent fur months.
(2) (a) I agree that my thesis, or a eopy, may be sent toan-e-t-her institution under conditions determined by the .Li.b.r:aftan-.-
(b) I do not wish my thesis, or a copy, to be sent to another institution without my written consent for .4. months.
(3) (a) I agree that my thesis may be copied for Library use.
(b) I do not wish my thesis to be copied for Library use for .ft. months.
Signed
Date
The copyright of this thesis belongs to the author. Readers must sign their name in the space below to show that they recognise this. They are asked to add their permanent address.
NAME AND ADDRESS
I<. . s 4/<:.A- j} {£ V -+tJ J�. tl? .J'of(_ SLt£.NC.b M A: s � r=r u NI VC--1'{ sI ry
pA-t_ 11-1 bQ ..r ION No I<.Tfl
15
DATE
19- 6 -17 1'1
ABSTRACT
The increasing cost of agricultural grade sulphur and the high leaching losses of
sulphate sulphur(S) from superphosphate fertilized pastures in New Zealand create a
need to develop more efficient S fertilization techniques. The objective of the present
study was to identify the main origins of the sulphate being leached from
superphosphate fertilized hill country pastures with soils (Typic Dystrachrepts)
developed from underlying sedimentary parent materials.
Origins of leached sulphate were categorized as S leached directly from fertilizer,
from zones enriched in animal excreta and from the mineralization of soil organic
matter. Mineralization studies, both in la�oratory and in field were conducted to
establish the extent of and the relationship between sulphur and nitrogen
mineralization and the fate of mineralized nutrients in pasture soils that contrasted in
their superphosphate fertilizer history.
In the preliminary laboratory study in which an open incubation technique was used
to measure potential net mineralization, top soils (0-7.5cm) taken from sites that had
received higher rates of superphosphate in the past, mineralized more soil organic
sulphur and nitrogen than soils taken from sites that had received smaller amounts of
superphosphate in the past. In addition top soils collected from low slope (0-12°) sites
where a greater proportion of animal excreta is returned, mineralized more S and N
than the soils from medium slope (13-25°) sites. The ratio of N to S mineralized was
narrower (2. 0 to 3. 6 ) than the N to S ratio of the whole soil (7 .1 to 8. 9) suggesting
that in these soils relatively more S remains in a mineral form in the soil and is more
susceptible to leaching than N which is conserved in the soil.
Cylindrical, mini-lysimeters with ion exchange resin traps for collecting solutes from
drainage water were developed to measure the net mineralization of soil organic S and
N under field conditions. Leaching losses of S and N, pasture uptake of S and N and
changes in mineral S and N pools in the soil at the same site were measured
simultaneously and the rate of mineralization calculated. A laboratory evaluation of
the lysimeter showed that the resin trap was capable of removing all the sulphate from
ii

iii
drainage water at several different flow rates. The main advantage of these lysimeters
over the conventional methods of measuring the leaching losses of anions and cations
in the field is that regular drainage collection was not necessary. By introducing
mixtures of both anion and cation exchange resins in the trap in the lysimeter it was
possible to monitor the amount of anions and cations in field drainage over long
periods of time before it was necessary to change the resin mixtures.
In the initial field lysimeter study the net mineralization and pasture uptake of N ( 119
to 251 kg N ha-1) was 10 times more than that of S ( 12 to 27.5 kg S ha-1) , yet
approximately 10 times more sulphate S ( 2.0 to 17.3 kg S ha-1) than mineral N (0. 19
to 1.3 kg N ha-1) was lost by leaching. Previous fertilizer history had a marked effect
on the leaching losses of sulphate with seven times more S lost ( 2.1 vs 1 5.3 kg S ha-1)
from sites which received greater rates of superphosphate and had higher stocking
rates. During the initial seven month period S leaching losses on the low and high
fertility sites were equivalent to 1 5% and 3 3% of the annual fertilizer application.
More sulphate was leached from areas identified as animal camping areas. The lack
of any change in sulphate below the 150mm soil depth during a period of active plant
growth and no leaching suggested that any sulphate that moved below 1 50mm of the
soil could be considered to be effectively lost from the system. Increased leaching
losses of calcium and magnesium were associated with increased sulphate losses. The
amount of calcium lost by leaching ( 4.7 5 to 12. 5 ,kg Ca ha-1) was far greater than
potassium (0.8 to 3 . 6 kg .K ha'1) , although twice the amount of potassium ( 240 kg K
ha·1 vs 120 kg Ca ha'1) was. cycled through the plant-animal system. The amount of
magnesium lost by leaching was greater than the amount of potassium lost by
leaching.
In a second lysimeter study the direct effects of freshly applied fertilizer on the
mineralization of S and N from soil organic matter, their plant availability and losses
by leaching were studied under field conditions using 35S labelled superphosphate.
Fertilizer application significantly increased the mineralization of both organic S and
N. The recovery and measurement of 35S activity over a nine month period showed
that major proportions of pasture S ( 8 5 and 8 6% of the pasture S for low and high
fertility farmlets, respectively) and leached S (75 and 87% of the leached S for low

the mineralization of soil organic matter and not recently applied fertilizer. The
amounts of both S and N mineralized from soil organic matter depends upon the past
fertilizer history of the site and the present fertilizer application rate (22 and 40 kg
S ha-1 and 125 and 204 kg N ha-1 for low and high fertility farmlets, respectively).
Further, when the net mineralization of S was greater a greater proportion (59%) of
mineralized S was lost by leaching than removed by pasture (39%). Irrespective of
the amount N mineralized virtually all was removed by pasture. The results
suggested that low N availability was a major factor limiting carbon fixation and the
formation of organic S in these pasture soils.
In a third lysimeter study, field simulated sheep dung and urine events boosted
pasture growth and S and N uptake by approximately (50%), whereas the leaching
losses of S and N were not influenced by the their application.
A preliminary computer simulation model describing the mineralization of soil organic
S, pasture S uptake and leaching losses in grazed pasture was developed. The
preliminary model gave reasonable predictions of the changes in soil sulphate
concentrations in the soil up to a depth of 25cm, pasture uptake of S and leaching
losses of S at four pasture sites varying in their fertilizer history. Further refinement
of the model is necessary before it can provide the basis for predicting fertilizer S
requirement for hill country pastures.
The experimental results and model output confirm balance study predictions that
large leaching losses of S occur and these are derived mainly from the mineralization
of soil organic matter which accumulates in well fertilized soils. The extent of S
losses appear to be a function of the general levels of soil productivity and the data
suggested that only a small, probably less than 20% reduction in this loss could be
achieved by changing to slow release S fertilizers.
iv

ACKNOWLEDGEMENTS
I would like to express my sincere thanks to the following people for their
contribution towards the completion of this thesis.
Dr M. J .Hedley for his supervision, encouragement, patience, guidance and friendship
during my study.
Dr A.D .Mackay for his supervision, encouragement, patience, guidance and
friendship during my study.
Other members of the Soil Science Department, particularly Dr D.R.Scotter for
valuable discussions.
The DSIR Grasslands for providing the experimental site.
Members of the DSIR Grasslands' hill country research group, particularly Roanne
Poi, Venessa Pokiya, Des Costall, Phil Budding, Nick Dimmock and Brian Devantier
for their help in conducting the field experiment.
Mr Donald Tambunan, Ms Sylvia Weil and Sathien Phimsarn for their help with
proof reading part of the thesis.
Messrs G.N.Magesan, S.Mahimairaja and S.Baskaran for their help and friendship
during my study.
The University Grants Committee for providing Post Graduate Fellowship.
Lastly, but most important, to my family.
V

ABSTRACT . . . . . . . . . . . . . . . . . . . . . . . . . . . . . . . . . · · . . · · · · ii
ACKNOWLEDGEMENTS . . . . . . . . . . . . . . . . . . . . . . . . . . . . . . . . v
TABLE OF CONTENTS . . . . . . . . . . . . . . . . . . . . . . . . . . . . . . . . · vi
LIST OF FIGURES . . . . . . . . . . . . . . . . . . . . . . . . . . . . . . . . . . . . xiv
LIST OF TABLES . . . . . . . . . . . . . . . . . . . . . . . . . . . . . . . . . . . . xix
LIST OF APPENDICES . . . . . . . . . . . . . . . . . . . . . . . . . . . . . . . . xxiii
CHAPTER-I
1 IN'1RODUCTION . . . . . . . . . . . . . . . . . . . . . . . . . . . . . . . . 1
CHAPI'ER-2
REVIEW OF LITERATURE
2.1 INTRODUCTION TO SULPHUR IN THE BIOSPHERE . . . . . . . . . 4
2.2 AMOUNT AND FORMS OF SULPHUR IN THE SOIL . . . . . . . . . 4
2.3 NATURE OF SOIL SULPHUR . . . . . . . . . . . . . . . . . . . . . . . . . 6
2.3.1 Soil Organic Sulphur . . . . . . . . . . . . . . . . . . . . . . . . . . . 7
2 . 3 . 1 . 1 Chemical Nature of Organic Sulphur . . . . . . . . . . . . 7 2 . 3 . 1 . 2 Hydriodic Acid Reducible Sulphur . . . . . . . . . . . . . . 9 2 . 3 . 1 . 3 Carbon Bonded Sulphur . . . . . . . . . . . . . . . . . . . . 10
2.3.2 Soil Inorganic Sulphur . . . . . . . . . . . . . . . . . . . . . . . . . . 11
2 . 3 . 2 . 1 Soil Inorganic Sulphate . . . . . . . . . . . . . . . . . . . . 1 1 2 . 3 . 2 . 2 Water Soluble Sulphates . . . . . . . . . . . . . . . . . . . 1 2 2 . 3 . 2 . 3 Adsorbed Sulphate . . . . . . . . . . . . . . . . . . . . . . . 1 2 2 . 3 . 2 . 4 Insoluble Sulphate . . . . . . . . . . . . . . . . . . . . . . . . 13
2.3.3 Plant Available Sulphur in the Soil . . . . . . . . . . . . . . . . . . . 14
2.4 TRANSFORMATION OF SULPHUR IN SOILS . . . . . . . . . . . . . . 17
2.4.1 Microbial Biomass Sulphur . . . . . . . . . . . . . . . . . . . . . . . 19
2 . 4 . 1 . 1 Factors Affecting Microbial Sulphur . . . . . . . . . . . . 1 9 2.4.2 Mineralization by Microorganisms . . . . . . . . . . . . . . . . . . . 21
2 . 4 . 2 . 1 Mechanism of S Mineralization . . . . . . . . . . . . . . . 2 1
vi
2 . 4 . 2 . 2 Factors Affecting Mineralization . . . . . . . . . . . . . . 2 3 2 . 4 . 2 . 2 . 1 Temperature . . . . . . . . . . . . . . . . . . . . . 2 3 2 . 4 . 2 . 2 . 2 Moisture . . . . . . . . . . . . . . . . . . . . . . . 2 3 2 . 4 . 2 . 2 . 3 pH . . . . . . . . . . . . . . . . . . . . . . . . . . . 2 4 2 . 4 . 2 . 2 . 4 Availability of Substrate and other
Nutrients . . . . . . . . . . . . . . . . . . . . . . . 2 4 2 . 4 . 2 . 3 Relationship Between Sulphur and Nitrogen
Mineralization . . . . . . . . . . . . . . . . . . . . . . . . . . 2 5
2.4.3 Immobilization . . . . . . . . . . . . . . . . . . . . . . . . . . . . . . . 2 6
2 . 4 . 3 . 1 Biochemistry of Immobilization ................ 2 9
2.4.4 Leaching of Sulphate . . . . . . . . . . . . . . . . . . . . . . . . . . . 2 9
2 . 4 . 4 . 1 The Influence of Soil Texture . . . . . . . . . . . . . . . . 3 1 2 . 4 . 4 . 2 Factors Affecting the Accumulation of Soluble
S-pool . . . . . . . . . . . . . . . . . . . . . . . . . . . . . . 3 1 2.5 SULPHUR CYCLING IN GRAZED PASTURE SYSTEM . . . . . . . . 3 4
2.5 .1 Fertilizer Sulphur Inputs . . . . . . . . . . . . . . . . . . . . . . . . . 3 4
2.5.2 Sulphur Returned in Plant Litter . . . . . . . . . . .. . . . . . . . . 3 5
2.5.3 Sulphur Return in Animal Excreta . . . .. . . . . . . . . . . . . . . 3 6
2 . 5 . 3 . 1 Dung and Urine Sulphur Content . . . . . . . . . . . . . . 3 7 2 . 5 . 3 . 2 Dung and Urine Distribution by Grazing
Stock . . . . . . . . . . . . . . . . . . . . . . . . . . . . . . . 3 7 2 . 5 . 3 . 3 Decomposition of Dung Sulphur . . . . . . . . . . . . . . 38 2 . 5 . 3 . 4 Urine in the Sulphur Cycle ... . . . .. . . . .. . . . . . . 3 9
2.5.4 Losses Through Animal . . . . . .. . . . . . . . . . . . . . .. . . . 3 9
2 . 5 . 4 . 1 Losses in Animal Products . . . . . . . . . . . . . . . . . . 3 9 2 . 5 . 4 . 2 Losses by Transfer . . . . . . . . . . . . . . . . . . . . . . . 40 2 . 5 . 4 . 3 Losses of Sulphur from Dung and Urine
Patches . . . . . . . . . . . . . . . . . . . . . . . . . . . . . . 4 0
2.6 SUMMARY AND CONCLUSION . . . . . . . . . . . . . . . . . . . . . . 4 0
vii

CHAPTER-3
LABORATORY INCUBATIONS TO DETERMlNE THE POTENTIAL OF
SOILS TO MINERALIZE SULPHUR AND NITROGEN
3.1 INTRODUCTION ................................. 4 3
3.2 MATERIALS AND METHODS ........................ 4 4
3.2.1 Description of Soils ............................ 4 4
3.2.2 Incubation Techniques .......................... 4 6
3.2.3 Leaching Procedures ........................... 4 6
3.2.4 Analytical Measurements ......................... 4 9
3.2.5 Presentation of Results .......................... 5 0
3.3 RESULTS AND DISCUSSION ...................... . .. 5 0
3.3.1 Characteristics of the Soils Prior to Incubation ... . .... . . . 5 0
3. 3. 2 Effect of Incubation System on Organic Matter
Mineralization . . . . . . . . . . . . . . . . . . . . . . . . . . . . . . . 5 3
3.3.3 Mineralization Measured Using the Open Incubation
System .................................... 5 5
3.3.4 Fertilizer History ......................... . ... 5 7
3.3.5 Topography ................................. 5 9
3.3.6 Relationships between C, N and S mineralized ........... 6 1
3.4 GENERAL DISCUSSION AND CONCLUSION .............. 6 7
CHAPTER-4
DEVELOPMENT OF AN ION EXCHANGE RES IN TRAP LYSIMETER
SYSTEM FOR MONITORING SULPHATE SULPHUR LOSSES BY
LEACHING IN GRAZED HILL COUNTRY PASTURES .
4.1 INTRODUCTION ................................. 6 9
4.2 MATERIALS AND METHODS ........................ 7 0
4.2.1 Construction of Lysimeters ....................... 7 0
4.2.2 Preparation of Anion Exchange Resin ................. 7 2
4.2.3 Leaching ................................... 7 4
viii
4.2.4 Herbage and Soil Analysis .. . . . . . . . . . .. . .... . . . . . 7 5
4.3 RESULTS AND DISCUSSION . . . . . . .. . . . . . . . . . . . . . . . . . 7 5
4.3.1 Sulphate Leaching ............................. 7 5
4.3.2 Drymatter Production and S Removed . . . . . . . .. . . . . . . .. 7 6
4.3.3 Net Mineralization of Sulphur ...................... 7 9
4.4 GENERAL DISCUSSION AND CONCLUSION . . . . . . . . . . . . . . 7 9
CHAPTER-S
FIELD INVESTIGATION OF THE NET :MINERALIZATION OF SULPHUR
AND NITROGEN, THEIR RELATIVE PLANT UPTAKE AND LEACHING
LOSSES IN GRAZED HILL COUNTRY PASTURES
5.1 INTRODUCTION . . . . . . . . . . .. . . . . . .. .. . . . . . . . . . . . . 8 1
5.2 MATERIALS AND METHODS . . . . . . . . . . . . . . . . . . .... . . 8 2
5.2.1 Field Site . . . . . . . . . . . . . . . . . . . . . . . . . . . . . . . . . . 8 2
5 .2.2 Lysimeter Installation . . . . . . . . . . . . . . . . . . . . . . . . . . . 8 2
5.2.3 Measurements ............................... 8 4
5.2.3.1 Drainage . . . . . . . . . . . . . . . . . . . . . . . . . . . . 8 4 5 . 2 . 3.2 Pasture Production . . . . . . . . . . . . . . . . . . . . . . 8 5 5.2 . 3 . 3 Ion Exchange Resin
and Resin Care . . . . . . . . . . . . . . . . . . . . . . . . . 8 5 5.2 . 3.4 Soil Sampling ........................... 8 7
5.2.4 Analytical Measurements ......................... 8 7
5.2.5 Statistical Analysis ............................. 8 8
5.3 RESULTS AND DISCUSSION ......................... 8 8
5.3.1 Rainfall and Drainage ........................... 8 8
5.3.2 Soil Sulphate ................................ 90
5.3.3 Mineral Nitrogen ............................. 93
5.3.4 Leaching Losses of S and N . . .. . . .. . . . . .... . . . . . . . 96
5.3.5 Leaching Losses of Cations ....................... 99
5.3.6 Pasture Production ............................ 102
5.3.7 Pasture S and N Concentration .................... 102
ix

5.3.8 Sulphur and N Removed in Pasture ................. 105
5.3.9 Net Mineralization of S and N .................... 108
5.3.9.1 Quantitative Estimation of Excreta Return ........ 108 5.3.9.2 Net mineralization of S and N .............. . . 111
5.4 GENERAL DISCUSSION AND CONCLUSION . . . . . . . . . . . . 12 0
CHAPTER-6
FATE OF FERTILIZER SULPHUR APPLIED TO GRAZED
HILL COUNTRY PASTURES
6.1 INTRODUCTION . . . . . . . . . . . . . . . . . . . . . . . . . . . . . . . . 12 2
6.2 MATERIALS AND METHODS . . . . . . . . . . . . . . . . . . . . . . . 12 3
6.2.1 Preparation of Radioactively Labelled 35S
Superphosphate .............................. 1 2 4
6.2.2 Application of Fertilizer . . . . . . . . . . . . . . . . . . . . . . . . 12 5
6.2.3 Rainfall, Drainage and Pasture Measurements ........... 12 5
6.2.4 Analytical Measurements ................... . .... 1 2 7
6.2.5 Preparation of Scintillation Cocktail . . . . . . . . . . . . . . . . . 12 7
6.3 RESULTS AND DISCUSSION ........................ 1 2 8
6.3.1 Rainfall and Drainage .......................... 1 2 8
6.3.2 Pasture Production ..... . ................... . . 12 8
6.3.3 Herbage Sulphur and Nitrogen Concentrations ........... 1 3 4
6.3.4 Sulphur and N Removed by Pasture ................. 1 39
6.3.4.1 Contribution of Soil and Fenilizer S to S
Removed by Pasture . . . . . . . . . . . . . . . . . . . . . . 1 39
6.3.5 Sulphur Lost by Leaching ....................... 14 3
6.3.5.1 Contribution of Soil and Fenilizer S to S
Leaching Losses ........................ 14 5
6.3.6 Soil Sulphate and Mineral Nitrogen ............... . . 15 1
6.3.7 Net Mineralization of S and N .................... 15 4
6.4 GENERAL DISCUSSION AND CONCLUSION . . . . . . . . . . . . . 1 5 7
X

CHAPTER-7
THE INFLUENCE OF SHEEP EXCRETA ON THE PASTURE UPTAKE
AND LEACHING WSSES OF SULPHUR IN GRAZED HILL COUNTRY
PASTURES.
7.1 INTRODUCTION . ...... .. .... ...... ..... ........ 1 60
7.2 MATERIALS AND METHODS .. ...... ... .. .......... 1 6 2
7. 2.1 Application of Dung and Urine . . . . . . . . . . . . . . . . . . . . 1 6 2
7.2.2 Measurements .......... ...... .. . ........... 1 6 3
7. 2. 2.1 Rainfall and Drainage . . . . . . . . . . . . . . . . . . . . 16 3 7. 2. 2. 2 Pasture Production . . . . . . . . . . . . . . . . . . . . . . 16 3 7.2.2.3 Resin Replacement .. .......... ... ...... .. 1 6 5
7.2.3 Analytical Measurements . ... .... .. .......... ... 1 6 5
7.2.4 Statistical Analysis ... ........... .... ...... . ... 1 6 5
7.3 RESULTS AND DISCUSSION . ... ... ... ....... . .. .... 1 6 6
7.3.1 Pasture Production . .. ........ ........ ....... . . 1 6 6
7.3.2 Sulphur, N and K concentrations in pasture . ........... 1 68
7.3.3 Sulphur, N and K Removed in Pasture .............. . 170
7. 3.4 Leaching Losses of S, N and K . . . . . . . . . . . . . . . . . . . . 17 3
7.3.5 Leaching losses of Calcium and Magnesium ............ 17 5
7.4 GENERAL DISCUSSION AND CONCLUSION . . . . . . . . . . . . . 1 7 7
CHAPTER-S
MODELLING THE FATE OF SULPHUR IN THE SOIL-PLANT SYSTEM
IN GRAZED PASTURE
8.1 INTRODUCTION . ............. ..... ......... ... . 17 9
8.2 MATERIALS AND METHODS .. .. ..... ............. . 180
8.2.1 Determination of the relationship between extractable
and solution sulphate . . . . . . . . . . . . . . . . . . . . . . . . . . 18 2
x i

8.3
xii
MODEL DEVELOPMENT .......................... 18 2
8.3.1 Water balance . . . . . . . . . . . . . . . . . . . . . . .. . .. .. . 18 2
8. 3 . 1 . 1 Calculating drainage volumes . . . . . . . . . . . . . . . . 18 2 8. 3 . 1 . 2 Estimating actual daily evapotranspiration . . . . . ... 18 3
8.3.2 Testing the concept of single sulphate pool for plant
and leached sulphate . . . . . . . . . . . . . . . . . . . . . . . . . . 18 6
8.3.3 Modelling the fluxes of S between various pools . . . .. . .. . 195
8. 3 . 3 . 1 Predicting the soil solution sulphate
concentration . . . . . . . . . . . . . . . . . . . . . . . . . . 196 8. 3 . 3 . 2 Accounting for Leaching of Sulphate . . . . . . . . . .. . 202 8. 3 . 3 . 2 . 1 A layered drainage model with mobile and
immobile water phases. . . . . . . . . . . . . . . . . . . . 20 2 8. 3 . 3 . 2 . 2 Estimating the mobile volume (ex) . . . . . .. ... .. 205 8. 3 . 3 . 3 Plant Uptake of Sulphur . . . . . . . . . . . . . . . . . . . 205 8. 3 . 3 . 4 Accounting for mineralization of soil organic
Sulphur . . . . . . . . . . . . . . . . . . . . . . . . . . . . . 207 8. 3 . 3 . 5 Executing the Model ..................... 2 07
8.4 RESULTS AND DISCUSSION . . . . . . . . . . . . . . .. . . . . .. . . 2 08
8.4.1 Comparison of model output with field measurements . . . . . . 2 08
8.4.2 Sensitivity analysis of Kd and ex values .. . . . . . .. . . .. .. 2 14
8.5 CONCLUSION . . . . . . . . . . . . . . . . . . . . . . . . . . . . . . . . . . 2 2 1
CHAPTER-9
SUMMARY
9.1 REVIEW OF LITERATURE . . . . . . . . . . . . . . . . . . . . . . . . . 2 2 3
9.2 LABORATORY MINERALIZATION STUDIES . . . . . . . . .. .. . 2 2 3
9.3 DEVELOPMENT OF A TECHNIQUE TO MEASURE
MINERALIZATION RATES IN FIELD SOILS . . . . . . .. .. . . . . 2 2 4
9.4 MEASURING MINERALIZATION RATES IN FIELD SOILS . .. . 2 2 5
9.5 THE FATE OF FRESHLY APPLIED SUPERPHOSPHATE
SULPHUR . . . . . . . . . . . . . . . . . . . . . . . . . . . . . . . . . . . . . 2 2 7
9. 6 THE FATE AND INFLUENCE OF DUNG AND URINE . . . . . . . 227
9.7 MODELLING THE FATE OF SULPHUR IN GRAZED
PASTURES . . . . . . . . . . . . . . . . . . . . . . . . . . . . . . . . . . . . 228
9.10 APPLICATION OF CONCLUSIONS TO FUTURE RESEARCH . . . 229
REFERENCES . . . . . . . . . . . . . . . . . . . . . . . . . . . . . . . . . . . . . . . 230
xiii

Fig.2.1
Fig.3.1
Fig.3.2
Fig.3.3
Fig.3.4
Fig.3.5a
Fig.3.5b
Fig.3.5c
Fig.3.5d
Fig.4.1
x iv List of figures
The S Cycle . . . . . . . . . . . . . . . . . . . . . . . . . . . . . . . . . . . . . 1 8
Incubation system used in the experiment. . . . . . . . . . . . . . . . . 47
Effect of incubation system on the net mineralization of
S, N and C, change in the amounts of HI-reducible S
and change in pH during 1 40 days of incubation in soils
from all four farmlets (see Table 3.1 for full description
of symbols). . . . . . . . . . . . . . . . . . . . . . . . . . . . . . . . . . . . . . 5 4
Effect of fertilizer application on the net mineralization
of S, N and C and the decrease in HI-reducible S in
soils from all four farmlets during 1 40 days of
incubation in open system (see Table 3.2 for full
description of symbols). . . . . . . . . . . . . . . . . . . . . . . . . . . . . . 5 8
Effect of land slope on the net mineralization of S, N
and C and the decrease in HI-reducible S in soils from
all four farmlets during 140 days of incubation in open
system (see Table 3.2 for full description of symbols) . . . . . . . . 60
Relationship between nitrogen mineralized and the total
soil nitrogen during 1 40 days of incubation in open
system for soils from all four farmlets. . . . . . . . . . . . . . . . . . . 6 2
Relationship between sulphur mineralized and the total
soil sulphur during 140 days incubation in open system
for soils from all four farmlets . . . . . . . . . . . . . . . . . . . . . . . . 6 3
Relationship between nitrogen mineralized and the soil
N:C ratio during 140 days of incubation in open systems
all four farmlets . . . . . . . . . . . . . . . . . . . . . . . . . . . . . . . . . . 6 4
Relationship between sulphur mineralized and the C: S
ratio during 140 days of incubation in open systems for
soils from all four farmlets . . . . . . . . . . . . . . . . . . . . . . . . . . 6 5
The mini lysimeter with ion exchange resin trap used in
the experiment. . . . . . . . . . . . . . . . . . . . . . . . . . . . . . . . . . . . 71

Fig.5.1
Fig.5.2
Fig.5.3
Fig.5.4
Fig.5.5
Fig.5.6
Fig.5.7
Fig.5.8
Fig.5.9
Exclusion cage and lysimeter installation in the field (A,
Exchange resin above ground access tube; B, Soil
XV
suction cup sampler). . . . . . . . . . . . . . . . . . . . . . . . . . . . . . . 8 6
Rainfall and predicted net drainage for the period from
Jun. 19 89 to Jan. 1990 and the long term ( 1979-19 8 8)
average rainfall for the same period. . . . . . . . . . . . . . . . . . . . . 89
Soil sulphate present for the depths 0-7 5 mm (--),
7 5-150 mm (-+-) and 150-250 mm (-*-) at all sites
from Jun. 19 89 to Jan. 1990. Soil samplings were done on
3 1/ 5/ 89, 4n, 24/ 8, 5/9, 6/10, 30/11 and 8/1/1990.
The L.S.D values are given in Appendix-5.3. . . . . . . . . . . . . . . 9 1
Soil mineral nitrogen present for the depths 0-7 5 mm (--),
7 5-150 mm (-+-) and 150-250 mm (-*-) at all sites
from Jun. 19 89 to Jan. 1990. Soil samplings were done
on 3 1/ 5/ 89, 4n, 24/8, 5/9, 6/10, 30/11 and 8/1/1990.
The L.S.D values are given in Appendix-5.4 . . . . . . . . . . . . . . 9 4
Cumulative amounts of sulphur removed by pasture
from Jun. 19 89 to Jan. 1990 at all four sites. Harvests
were made on 5/9/89, 6/10, 6/11, 30/11 and 8/1/90
(Vertical bars=LSD,p<0.0 1) . . . . . . . . . . . . . . . . . . . . . . . . . 106
Cumulative amounts of nitrogen removed by pasture
from Jun. ' 19 89 to Jan. 1990 at all four sites. Harvestsy
were made on 5/9/89, 6/10, 6/11, 30/11 and 8/1/90
(Vertical bars=LSD,p<0.0 1) . . . . . . . . . . . . . . . . . . . . . . . . . 107
Net mineralization of S and N from Jun. 19 89 to Jan.
1990 at all four sites (Vertical bars=LSD,p<0.0 1). . . . . . . . . . . 113
Relationship between nitrogen net mineralized and
pasture dry matter production from Jun. 19 89 to Jan.
1990 at all four sites. Values for 40 individual
lysimeters . .
Relationship between nitrogen net mineralized and
pasture dry matter other than legumes produced from
Jun. 19 89 to Jan. 1990 at all four sites. Values for 40
individual lysimeters.
117
118

Pig.5.10
Pig.6.1
Pig.6.2
Pig.6.3
Pig.6.4
Pig.6.5
Pig.6.6
Pig.6.7
Pig.6.8
Pig.6.9
Pig.6.10
Relationship between sulphur net mineralized and
pasture dry matter production from Jun. 19 89 to Jan.
1990 at all four sites. Values for 40 individual
xvi
1 ysimeters.. . . . . . . . . . . . . . . . . . . . . . . . . . . . . . . . . . . . . . 1 119
Rainfall and predicted drainage from Jan. to Sep. 1990,
rainfall for the year 19 89 and the long term average
rainfall ( 1979- 19 89) for the same period. . . . . . . . . . . . . . . . . 129
Predicted and measured drainage for the experimental
period across all four sites. Symbols refered to four
different sites. . . . . . . . . . . . . . . . . . . . . . . . . . . . . . . . . . . . 130
Pasture production for fertilized and unfertilized plots at
all sites during the period from Jan to Oct. 1990
(Vertical bars= LSD,p<0.0 1). . . . . . . . . . . . . . . . . . . . . . . . . 13 3
Amounts of S removed by pasture in fertilized and
unfertilized plots at all four sites during the period from
Jan. to Oct. 1990 (Verical bars=LSD,p<O.Ol). . . . . . . . . . . . . . 137
Amounts of N removed by pasture from fertilized and
unfertilized plots at all four sites during Jan. to Oct.
1990 (Vertical bars=LSD,p<0.0 1). . . . . . . . . . . . . . . . . . . . . . 13 8
Changes in specific activity of 35S in pasture with time
at all sites from Jan. to Oct. 1990. . . . . . . . . . . . . . . . . . . . . . 140
Amounts ·of S lost by leaching from fertilized and
unfertilized plots at all four sites during the period from
Jan. to Oct. 1990 (Vertical bars=LSD,p<0.0 1). . . . . . . . . . . . . 1 4 4
Changes in specific activity of 35S in leachate with time
at all four sites during the period from Jan. to Oct. 1990
(Vertical bars=LSD,p<0.0 1). . . . . . . . . . . . . . . . . . . . . . . . . . 146
Amounts of N lost by leaching from fertilized and
unfertilized plots at all four sites during the period from
Jan. to Oct. 1990 (Vertical bars=LSD,p<0.0 1). . . . . . . . . . . . . 1 49
Amounts of fertilizer(P) and soil(S) sulphur removed by
pasture and lost by leaching between Jan. to Oct. 1990
in LP-LS, LP-MS, HP-LS and HP-MS sites. . . . . . . . . . . . . . . 150

Fig.6.11
Fig.6.12
Fig.8.1
Fig.8.2
Fig.8.3a
Fig.8.3b
Fig.8.4
Fig.8.5
Fig.8.6
Fig.8.7
Soil sulphate present for the depths 0-75 mm (--),
7 5-150 mm (-+--) and 150-250 mm (-*-) at all sites
from Jan. to Oct. 1990. Soil samplings were done on
8/1, 1 5/2, 26/3, 30/ 4, 11/6, 14n, 23/8 and 10/10.
xv ii
The L.S.D values are given in Appendix-6.1. . . . . . . . . . . . . . 1 5 2
Soil mineral nitrogen present for the depths 0-7 5 mm (--) ,
7 5-150 mm (- +--) and 150-250 mm (-*-) at all sites
from Jan. to Oct. 1990. Soil samplings were done on
8/1, 15/2, 26/3, 30/ 4, 11/6, 1 4n, 23/8 and 10/10.
The L.S.D values are given in Appendix-6.2. . . . . . . . . . . . . . 1 5 3
A simple conceptual dynamic sulphur model for grazed
pastures. . . . . . . . . . . . . . . . . . . . . . . . . . . . . . . . . . . . . . . . . 181
Effect of increasing soil water deficit on the amount of
evapotranspiration for 0-7 5mm soil depth from LF-LS
site. . . . . . . . . . . . . . . . . . . . . . . . . . . . . . . . . . . . . . . . . . . 18 5
Cumulative amounts of 35S activity removed by pasture
with time at all four sites from Jan. to Oct.
1990. . . . . . . . . . . . . . . . . . . . . . . . . . . . . . . . . . . . . . . . . . 18 8
Cumulative amounts of S removed by pasture with time
at all four sites from Jan. to Oct. 1990. . . . . . . . . . . . . . . . . . 189
Relationship between predicted and measured specific
activity of S 'in pasture for the period from Jan. to Oct.
1990 at all four sites. . . . . . . . . . . . . . . . . . . . . . . . . . . . . . . 19 2
Relationship between predicted (from plant S specific
activities) and observed specific activity of the leached
S at all four sites from Jan. to Oct. 1990 . . ............... 19 4
Hierarchical order of the processes in the S-cycle . . . . . . . . . . 197
Relationship between the soil solution sulphate
measured in the laboratory (- - -) or in the field (_)
and 0.0 4M calcium phosphate extractable sulphate for
the 150-250mm soil layer. . . ........................ 200

Fig.8.8
Fig.8.9
Fig.8.10
Fig.8.1 1
Fig.8.12
Fig.8.1 3
Fig.8.1 4
Fig.8.1 5
Fig.8.16
Relationship between extractable sulphate and solution
sulphate measured in the laboratory for the soils from 0-
7 5, 7 5-1 50 and 1 50-250mm depths for LF and HF
xviii
fannlets. . . . . . . . . . . . . . . . . . . . . . . . . . . . . . . . . . . . . . . . 20 1
Predicted ( --+--) and measured ( _._) cumulative
amounts of sulphur removed by pasture at LF-LS and
LF-MS sites. . . . . . . . . . . . . . . . . . . . . . . . . . . . . . . . . . . . . 209
Predicted ( --+--) and measured ( _._) cumulative
amounts of sulphur removed by pasture at HF-LS and
HF-MS sites. . .................................. 210
Predicted ( --+--) and measured L._) extractable soil
sulphate present in the profile (0- 25cm) at LF-LS and
LF-MS sites. . . . . . . . . . . . . . . . . . . . . . . . . . .. . . . . . . . . . . 212
Predicted (--+--) and measured L._) extractable soil
sulphate present in the profile (0-25cm) at HF-LS and
HF-MS sites. . .................................. 21 3
Effect of changing the value of a (by 10%) on the
cumulative amount of sulphate leached at HF-LS site
during the period from Jun. 19 89 to Oct. 1990 (No
leaching occurred from Oct. 19 89 to Jan. 1990) .......... . 21 5
Effect of changing the values of Kd (by 10%) for each
soil layer on the cumulative amount of sulphate leached
at HF-LS site during the period from Jun. 19 89 to Oct.
1990 (No leaching occurred from Oct. 19 89 to Jan.
1990) ......................................... 216
Effect of changing the value of a (by 10%) on the
cumulative amount of sulphur removed by pasture at
HF-LS site during the period from Jun. 19 89 to Jan.
1990. . . . . . . . . . . . . . . . . . . . . . . . . . . . . . . . . . . . . . . . . . 217
Effect of changing the values of Kd (by 10%) for each
soil layer on the cumulative amount sulphur removed by
pasture at HF-LS site during the period from Jun. 19 89
to Jan. 1990 ..................................... 21 8
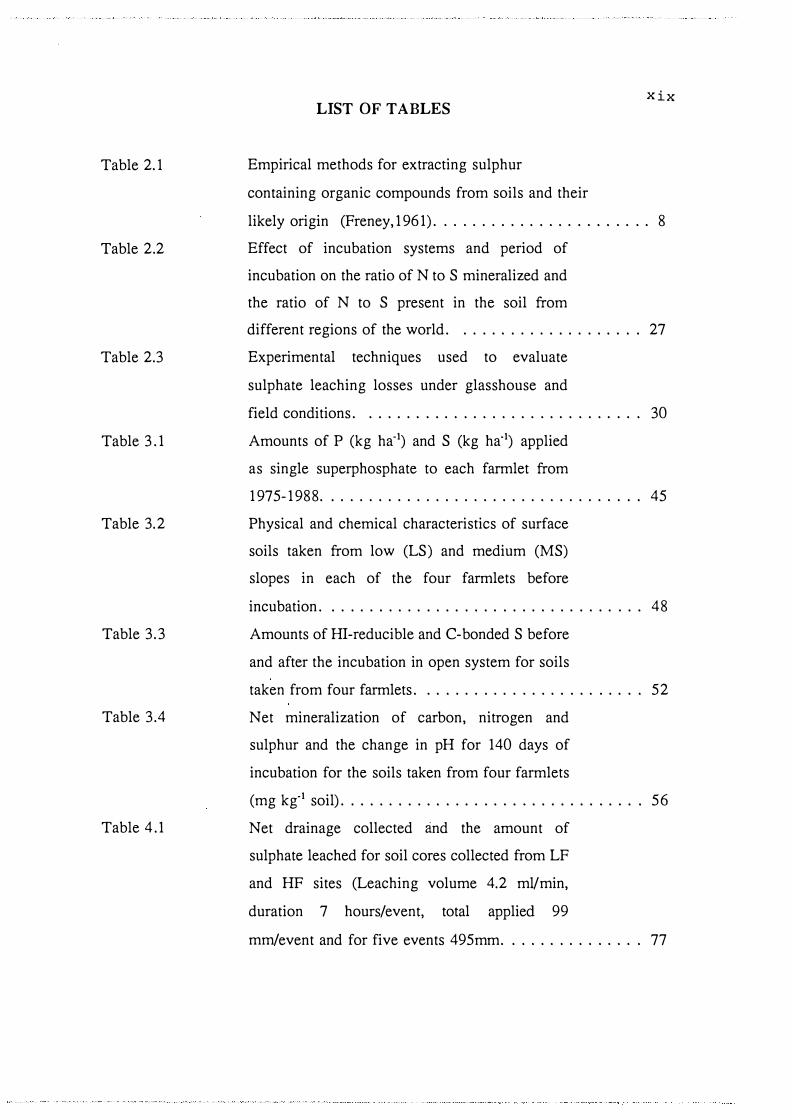
Table 2.1
Table 2.2
Table 2.3
Table 3.1
Table 3.2
Table 3.3
Table 3.4
Table 4.1
LIST OF TABLES
Empirical methods for extracting sulphur
containing organic compounds from soils and their
xix
likely origin (Freney, 196 1 ). . . . . . . . . . . . . . . . . . . . . . . 8
Effect of incubation systems and period of
incubation on the ratio of N to S mineralized and
the ratio of N to S present in the soil from
different regions of the world. . . . . . . . . . . . . . . . . . . . 27
Experimental techniques used to evaluate
sulphate leaching losses under glasshouse and
field conditions. . . . . . . . . . . . . . . . . . . . . . . . . . . . . . 30
Amounts of P (kg ha-1) and S (kg ha"1) applied
as single superphosphate to each farmlet from
1975-19 8 8 . .............................. . . . 4 5
Physical and chemical characteristics of surface
soils taken from low (LS) and medium (MS)
slopes in each of the four farmlets before
incubation. . . . . . . . . . . . . . . . . . . . . . . . . . . . . . . . . . 4 8
Amounts of HI-reducible and C-bonded S before
and after the incubation in open system for soils
taken from four farmlets. . . . . . . . . . . . . . . . . . . . . . . . 5 2
Net mineralization of carbon, nitrogen and
sulphur and the change in pH for 1 40 days of
incubation for the soils taken from four farmlets
(mg kg"1 soil). . . . . . . . . . . . . . . . . . . . . . . . . . . . . . . . 56
Net drainage collected and the amount of
sulphate leached for soil cores collected from LF
and HF sites (Leaching volume 4.2 ml/min,
duration 7 hours/event, total applied 99
mm/event and for five events 49 5mm. . . . . . . . . . . . . . . 77

Table 4 .2
Table 5.1
Table 5.2
Table 5.3
Table 5.4
Table 5.5
Table 5.6
Table 5.7
Table 5.8
Table 5.9
Initial and final sulphate present in the soil for
three depths, S lost by leaching, S removed by
plant and the net mineralization of S for the soils
from HF and LF sites . ......................... 78
The fertility, land slope and percentage
occurrence of each slope class in each of the two
farrnlets. . . . . . . . . . . . . . . . . . . . . . . . . . . . . . . . . . . . 8 3
Amounts of Nitrate (N) and Ammonium (A)
present at three depths in the soil for all the four
sites during the experiment. No nitrate was
observed in some of the samplings . ..... ......... . . 9 5
Predicted net drainage and the amounts of
sulphate and mineral N lost by leaching
in winter and spring at all four sites. . . . . . . . . . . . . . . . 97
Amounts of cations leached for all the four sites
XX
between Jun. 19 89 and Jan. 1990. . . . . . . . . . . . . . . . . 100
Pasture production from Jun. 19 89 to Jan. 1990
at all four sites. . . . . . . . . . . . . . . . . . . . . . . . . . . . . . 10 3
Effect of fertilizer history and land slope on
pasture S and N concentrations and N/S ratios. . . . . . . . 104
Amounts of dry matter and S and N consumed
and the amounts of readily available S and N
returned in excreta in whole farmlets and the
calculated amounts of excretal S and N taken up
by pasture. . . . . . . . . . . . . . . . . . . . . . . . . . . . . . . . . 1 10
Calculation of the net mineralization of S and N
during the periods of early winter and late spring
for LF-LS and HF-LF sites (the symbols are
described in text). . . . . . . . . . . . . . . . . . . . . . . . . . . . 1 12
Amounts of S and N net mineralized* during the
experiment ( 3 1/5/19 89 to 8/ 1/ 1990) for all four
sites . ...... ............................ . . 1 1 5

Table 6.1
Table 6.2
Table 6.3
Table 6.4
Table 6.5
Table 6.6
Table 6.7
Table 7.1
Initial sulphate and mineral N present in the soil,
fertilizer sulphate and 35S activity applied to each
core and the specific activity of fertilizer S for
xxi
all four sites. . . . . . . . . . . . . . . . . . . . . . . . . . . . . . . 1 26
Amounts of pasture produced in fertilized and
unfertilized plots at each site from Jan. to Oct.
1990. . . . . . . . . . . . . . . . . . . . . . . . . . . . . . . . . . . . . 1 3 2
Pasture S concentrations for fertilized and
unfertilized plots for all four sites from Jan. to
Oct. 1990. . . . . . . . . . . . . . . . . . . . . . . . . . . . . . . . . 1 3 5
Pasture N concentrations for fertilized and
unfertilized plots for all four sites from Jan. to
Oct. 1990. . . . . . . . . . . . . . . . . . . . . . . . . . . . . . . . . 1 3 6
Amounts of 35S activity, % fertilizer S removed,
amounts of fertilizer and soil S removed by
pasture and the percentage contribution of
fertilizer and soil S to pasture at all sites from
Jan. to Oct. 1990. . . . . . . . . . . . . . . . . . . . . . . . . . . . 1 4 1
Amounts of 35S activity, % of applied fertilizer
S leached, amounts of soil and fertilizer S lost
by leaching and the % contribution of fertilizer
and soil S to leaching losses at all sites from
Jan. to Oct. 1990. . . . . . . . . . . . . . . . . . . . . . . . . . . . 1 47
Net mineralization of S and N from soil organic
matter and the percentage of mineralized S and
N removed by pasture and lost by leaching at all
four SSP fertilized sites from Jan. to Oct.
1990. . . . . . . . . . . . . . . . . . . . . . . . . . . . . . . . . . . . . 1 56
Chemical composition of major plant nutrients in
dung and urine and the amounts of nutrients
applied to both dung and urine treatments. . . . . . . . . . . 1 6 4

Table 7. 2
Table 7. 3
Table 7.4
Table 7. 5
Table 7.6
Table 8. 1a
Table 8. 1b
Table 8. 2
Table 8. 3
Pasture dry matter response to fertilizer plus
dung or urine application for a period of 1 50
days. . . . . . . . . . . . . . . . . . . . . . . . . . . . . . . . . . . . . 167
Effect of fertilizer and fertilizer plus dung or
urine on pasture S, N and K concentrations for
all treatments in three harvests. . . . . . . . . . . . . . . . . . . 1 69
Effect of fertilizer and fertilizer plus dung or
urine on the amounts of S, N and K removed in
pasture during 1 50 days. . . . . . . . . . . . . . . . . . . . . . . 171
Effect of fertilizer and fertilizer plus dung or
urine on the amounts of S, N and K lost by
leaching during 1 50 days. . . . . . . . . . . . . . . . . . . . . . 174
Effect of fertilizer and fertilizer plus dung or
urine on the amounts of Ca and Mg lost by
leaching during 1 50 days. . . . . . . . . . . . . . . . . . . . . . 176
Regressions for the cumulative uptake of 35S
activity (cpm/core) with time for all four sites. . . . . . . . 190
Regressions for the cumulative uptake of S (mg
S/core) with time for all the four sites. . . . . . . . . . . . . 190
Soil solution sulphate concentrations sampled by
suction cup and amounts of 0.04 M Ca(H2P04)2
extractable sulphate present in the soil from the
1 5-25cm depth for LF-LS and HF-LS sites for
seven sampling events. . . . . . . . . . . . . . . . . . . . . . . . 199
Measured and predicted leaching losses of
sulphate during the experimental period at all
four sites. . . . . . . . . . . . . . . . . . . . . . . . . . . . . . . . . . 21 1
xxii

Appendix-5.1
Appendix-5.2
Appendix-5.3
Appendix-5.4
Appendix-5.5
Appendix-6.1
Appendix-6.2
Appendix-7.1
Appendix-8.1
Appendix-8.2
Appendix-8.3a
Appendix-8.3b
Appendix-8.4
xxiii
LIST OF APPENDICES
Soil moisture content for the period from
Jun. 19 89 to Jan. 1990 (seven sampling occasions)
for three depths at all four sites . . . . . . . . . . . . . . . . . 25 4
Soil bulk densities for the depths 0-7 .5, 7.5-1 5 and
1 5-25cm at all four sites measured during July 19 89 ... 25 5
Sulphate (kg/ha) present in the soil for three depths
during the experimental period. . . . . . . . . . . . . . . . . . 256
Mineral nitrogen (kg/ha) present in the soil for
three depths during the experimental period. . . . . . . . . . 257
Sulphur and nitrogen returned in excreta. . . . . . . . . . . . 25 8
Sulphate (kg/ha) present in the soil for three
depths during the experimental period. . . . . . . . . . . . . . 26 1
Mineral nitrogen (kg/ha) present in the soil for
three depths during the experimental period. . . . . . . . . . 26 2
Distribution of excreta in grazed hill country
pastures . . . . . . . . . . . . . . . . . . . . . . . . . . . . . . . . . . 26 3
Change in specific activity of plant and leached
S-3 5 with time and the days on which major
drainage (vertical bars) occurred for all four
sites from Jan. 1990 to Oct. 1990. . . . . . . . . . . . . . . . . 26 4
Ratio of shoot and root for the months from
Jun. to Jan. . . . . . . . . . . . . . . . . . . . . . . . . . . . . . . . . 26 5
Rainfall during the experimental period
(Jun. 19 89 to Jan.1990) . . . . . . . . . . . . . . . . . . . . . . . 266
Evapotranspiration (E1) during the experimental
period (Jun. 19 89 to Jan.1990) ................... 267
Predicted and measured extractable soil sulphate
present in the soil for three depths at all four sites. . . . . 26 8

1
CHAPTER-I
INTRODUCTION
In New Zealand legume based pastures adequate supplies of plant available sulphur
(S) are second only in importance to supplies of phosphorus. Sulphur requirements
for pastures in New Zealand are estimated using a mass balance model developed by
Sinclair and Saunders (1982). The model estimates the S gains from rainfall, the
losses in animal products and leaching and the within system losses of S to
unproductive areas by uneven transfer of S in excreta. A negative balance of S
requires the addition of fertilizer S to maintain the equilibrium .status of the pasture
(Sinclair, 1983).
Little research has been done to quantify the fluxes of S between various components
of the pasture S cycle and verify that the estimates of S losses calculated by the
model, particularly those relevant to immobilization of soil S, S leaching loss and
animal excreta transfer, represent those occurring in practice. Such research is
important as S becomes an increasingly costly input into New Zealand pastoral
farming. Currently New Zealand imports S worth NZ$40 million every year mainly
for the fertilizer industry. At present about 90% of this S is applied to pastures as
single superphosphate (SSP).
Recent research in this area by Saggar et al. (1990a) showed that an amount
equivalent to 46-77% of the annual fertilizer S application to Southern North Island
hill country pasture was lost by leaching. The extent of leaching loss increased with
increasing rate (125-375 kg ha-1) of annual SSP application. These losses represent a
very inefficient use of fertilizer S. Management strategies to reduce this loss could
be developed if the origins of the leached S are identified.

2
Leached sulphate can originate 1. directly from the sulphate in the SSP fertilizer, 2.
from dung and urine spots excreted by the grazing animals and 3. from the
decomposition and mineralization of soil organic S, which includes plant litter, animal
excreta and older soil organic matter (humus) which has built up through regular
fertilizer application.
In hill country pastures the interaction between land slope and aspect on the camping
behaviour of the grazing animals also effects the spatial distribution of the soil organic
S and evidence indicates this influences S leaching loss (Saggar et al., 1990a,b). In
North Island hill country low slope areas commonly receive proportionately more dung
and urine and can be expected to have potentially greater S leaching losses. Also on
low slopes a greater proportion of rainfall water passes through soil profile and may
increase the leaching losses of sulphate.
Although some information on the direct leaching loss of sulphate from fertilizer under
field conditions (Smith et al., 19 8 3) and from dung and urine using repacked
lysimeters (Hogg, 19 81) exists, no detailed information exists on the amount of S
mineralized from soil organic matter and the contribution this makes to pasture uptake
and leaching loss. The relative fate of fertilizer and mineralized S as determined by
pasture uptake and leaching may well be controlled by not only the factors mentioned
above but also the availability of another plant growth limiting nutrient. For example
in nitrogen (N) deficient legume based pastures fertilizer S may be used inefficiently
by pasture until the mineralizable pool of soil N is increased through biological N
fixation.
If the amount of S lost by leaching directly from fertilizer inputs could be quantified
and the understanding improved of the processes resulting in indirect S losses by
leaching from mineralized soil organic matter, plant litter and dung and urine spots,
it might be possible to design procedures to reduce the overall S losses.

The objectives of the study reported in this Thesis were to:
1. Determine the effect of fertilizer history and land slope on the net
mineralization rates of soil organic S and N,
2. Develop techniques to measure net mineralization of S and N in grazed
hill country pastures under field conditions,
3. Determine the effect of superphosphate application and excreta
deposition on pasture production, S and N uptake and leaching losses
under field conditions and finally,
4. To assemble this information to provide advice on how to use S
fertilizer more efficiently on pasture soils.
3
Central to these studies was the availability of a series of sheep grazed research
farmlets at the DSIR, Grasslands, Ballantrae Research Station which forms part of a
long term study on the effects of varying rates of fertilizer application on grassland
productivity. The importance of having such sites available to study the long term
sustainability of the pastoral system cannot be over emphasised.
2.1
CHAPTER-2
REVIEW OF LITERATURE
INTRODUCTION TO SULPHUR IN THE
BIOSPHERE
4
Sulphur(S) is a nutrient essential for metabolism in plants, animals and
microorganisms. In the biosphere it exists in a wide variety of compounds in various
oxidation states ranging from -2 in sulphide to +6 in sulphate and is originally derived
from the oxidative weathering of plutonic rocks. The oxidative weathering can take
place chemically (Avrahanui and Golding, 1968; Zehnder and Zinder, 1980) and/or
biochemically (Buchanan and Gibbons, 1974). Sulphur compounds of various
oxidation states are further involved in a variety of chemical and biological reactions.
In its various forms it can be a highly mobile element which can lead to deficiencies
occurring in some terrestrial systems. It is the amounts, forms and reactions of these
compounds in the soil which are of importance to agriculturists interested in plant
nutrition.
2.2 AMOUNT AND FORMS OF SULPHUR IN THE
SOIL
The total S content and S forms present in surface soils varies widely depending on
their geographical location (Freney, 1986). In mineral soils, the S content ranges from
less than 20 to over 2000 mg S kg"1 soil (Lowe and Delong, 1963; Korkman, 1973;
Freney and Williams, 1980). In peat and swamp soils, with the majority of S present
in organic residues, concentrations of up to 5000 mg S kg-1 have been measured (Chae
and Lowe, 1980; Freney and Williams, 1980). In saline soils values in excess of
6000 mg S kg-1, mostly as sulphate, are not uncommon (Delver, 1962; Dabin, 1972).
In tidal marsh soils values as high as 35,000 mg S kg-1 mostly as sulphide have been
reported (Fleming and Alexander, 1961; Gallagher, 1969).

5
Most agricultural soils have S contents ranging from 50 to 1000 mg S kg-1 in the
surface 15 cm (Tabatabai and Bremner, 1972a,b; Bettany et al., 1973). In subsoils,
wide variation again occurs, depending particularly on drainage and rainfall. Values
ranging from <10 mg S kg-1 in the soils of silicious sands to as high as 10,000 mg S
kg-1 in the deeper horizons of soils from arid regions have been reported (Freney and
Williams, 1983). The total amount of S in the surface metre of Australian soils have
been estimated to range from less than 0.01 to over 500 tonnes S ha·1 depending on
soil type (Freney and Williams, 1980). Similar ranges could be expected for soils
from other regions of the world. In New Zealand agricultural soils, the total S in the
top 150mm ranges from 240 to 1360 mg S kg-1 soil (Walker and Adams, 1958;
Metson and Blakemore, 1978) depending upon the soil forming factors and upon
fertilizer application and type of farming.
In well drained, non-calcarious soils of humid temperate regions, where annual rainfall
exceeds evapotranspiration, most (>90%) of the S in the surface horizons appears to
be in organic forms. The inorganic forms which are almost entirely sulphates are low
(<10%) because sulphate is either leached or readily absorbed by plants (Donald and
Williams, 1954; Walker and Adams, 1958; Williams and Steinberg, 1958; Freney,
1961; 1986; Tabatabai and Bremner, 1972a,b; Fitzgerald, 1976; 1978; Lambert et al.,
1988). Organic S generally decreases with soil depth except in soils in which organic
matter has accumulated in the B-horizon and in soils which have formed under
conditions were erosive deposition have led to buried profiles (Williams, 1974).
Soil organic S fractions provide the major long term S reserves for plant nutrition
(Biederbeck, 1978), but because plants can only absorb inorganic sulphate, the rate of
its production by organic matter mineralization and translocation are the key processes
in the S cycle (Blair, 1971). As with nitrogen(N) and to a less extent with
phosphorus(P), organic matter mineralization is a key source of sulphate in soils.
Microorganisms present in the soil derive energy for respiration by oxidizing the
carbon(C) of organic residues. Any S released during the process can either be
utilized by microorganisms or left to enter the soil solution as sulphate ion or in a
lower oxidation state. Clearly factors influencing the rate of organic matter turnover
6
are as important in determining the supply of S to plants as the forms and amounts
of S in the soils. Thus the plant availability of soil organic S and its chemical
characteristics should be considered in the context of understanding the S cycle in soil
plant-animal systems.
2.3 NATURE OF SOIL SULPHUR
In addition to the weathering of S bearing minerals the soil S is derived from the
atmosphere as dry deposition and in precipitation.
Scott (1980) estimated that although about 44% of addition of S to atmosphere are as
H2S, it is rapidly converted in to S02, S03 and sulphate ions within the atmosphere.
Till (1975) reported that S02 concentration in air ranged from 0.3 to 4000 mg S m-3•
Galbally (1980) reported S02 uptake rates of 0.1 to 0.3 kg S ha-1 year-1 for desert and
semiarid areas of Australia and 0.6 to 2.7 kg S ha-1 year-1 for temperate and tropical
areas from the atmosphere by the plant.
Global additions of S in precipitation account for 8.6x10⁶ tonnes S year-1 (Davey,
1980). The pattern of deposition of S in precipitation is very uneven being
concentrated near industrial areas (Peverill, 1980) and in coastal regions (Walker and
Gregg, 1975). An average value for coastal Australian sites (within 10 km of the
coast) would appear to be 5kg S ha-1 year-1 (Probert, 1976). The values can be
expected to decline away from the coast to about 1kg S ha-1 year-1 in central New
Zealand (Walker and Gregg, 1975; Metson, 1979) and Northern table lands of N.S.W
(Till, 1975). Till ( 1975) considered that much of the grazing areas in Australia
received less than 1.5 kg S ha-1 year-1• A similar value applies to most of the grazing
area in New Zealand (Ledgard and Upsdell, 1991).
Plants and microorganisms are responsible for transforming these mineral forms of S
in to organic forms and compounds of other oxidation states. Organic S in the form
of root, plant litter, animal matter and excreta becomes the most important secondary
inputs of S into soil. To understand the transformation of S in the soil it is therefore
very important to know the forms of the various soil S fractions.
2.3.1 Soil Organic Sulphur
7
The total annual amount of C fixed for the earth is estimated to be 1.5x10¹¹ tonnes
(Trudinger, 1975). Based on an average C:S ratio of 100 (commonly the C:S ratio of
the soil organic matter is 100: 1) this would correspond to a rate of synthesis of
organic S of about 1-2x10⁹ tonnes per annum making soil S an important pool for
both plants and animals.
The mean C:N:S ratios for groups of individual soils from different regions of the
world are very similar, for example agricultural soils seem to have a mean C:N:S ratio
of about 130:10: 1.3, native grass and woodland soils have ratios of the order of
200:10:1 and peat and organic soils have ratios, approximately 160:10:1.2 (Freney,
1986). Differences in C:N :S ratios of soils are due to the effect of parent material,
weathering, pasture improvement and climate; examples have been reported by Walker
and Adams (1958, 1959), Williams and Steinberg (1958), Lowe (1965), Bettany et al.
(1973), Neptune et al. (1975), Mukhopadyay and Mukhopadyay (1975) and Lambert
et al. (1988). Little is still known of the exact chemical nature of the organic S
compounds in soils. Freney (1961) listed a wide variety of S containing compounds
known to be produced by soil microorganisms, plants and animals (Table 2.1).
Normally all these compounds are susceptible to decomposition and do not accumulate
in uncombined forms. This creates difficulties in detecting their presence in soils.
The existing knowledge about the nature of organic S in the soil is reviewed in the
next section.
2.3.1.1 Chemical Nature of Organic Sulphur
Some soil organic S occurs in amino acid form. In two podzolic soils amino acid S
was found to account for 21-30% of the total organic S (Freney et al., 1970).
Approximately 60% of the amino acid S was cysteine. Apart from the amino acid S
group little is known about the nature of the remaining organic S in soil even though
it can amount to more than 60% of total organic S (Freney, 1967). Present

Table 2.1 Empirical methods for extracting sulphur containing organic
compounds from soils and their likely origin (Freney, 1961)
----·--········�--S Containing Compounds Method of Extractions
Amino acids HI-S1 and C-S2/R.N3
Sulphonium compounds HI-S
Ester sulphate HI-S
Vitamin C-S/R.N
Sulphides C-S/R.N
Sulphoxides C-S/R.N
Isothiocyanate HI-S
Other compounds HI-S and C-S/R.N
1 HI-reducible S (HI-S)
2 Carbon bonded S (C-S)
3 Raney-Ni S (R.N)
Origin of organic Sources
Proteins and Bacteria
Microorganisms, red and green algae
Microorganism tissue
Microorganisms
Plant litter
Microorganisms
Microorganisms and plant litter
Microorganisms, plant litter and animal
products
(X)

9
knowledge only permits a very broad grouping of organic S compounds on the basis
of their reactions with reducing agents. These are as follows.
1. Organic S which is reduced to H2S by hydriodic acid(lll). This S is
not bonded directly to C and is believed to be mainly ester sulphate
such as C-0-S and C-N-S (Freney� 1961; Hougton and Rose, 1976).
2. Organic s which is not reduced by m. This s is thought to be bonded
directly to C such as C-S and C-S-S-C (Freney, 1961).
3. Organic S which is reduced to inorganic sulphide by Raney nickel.
2.3.1.2
This makes up a substantial proportion the of C bonded fraction and
may consist mainly of S in the form of amino acids (Freney, 1961;
Freney et al., 1975).
Hydriodic Acid Reducible Sulphur
Analysis covering a wide range of soils have indicated that the m-reducible S fraction
can account for as little as 30% of the total organic S or as much as 70% of total
organic S (Williams and Steinberg, 1959; Freney, 1961; Lowe and Delong, 1963;
Cooper, 1972; Tabatabai and Bremner, 1972b; Bettany et al. , 1973; Neptune et al.,
1975; Williams, 1975). This fraction appears to be readily hydrolysed to inorganic
sulphate by acid or alkali and consequently has been considered by some workers
(Lowe, 1965; Freney et al., 1971; Cooper, 1972) to represent the most labile soil
organic S fraction. This fraction could include aryl sulphates, sulphate esters of
steroids, amino acid 0-sulphate, ascorbic acid 2-0-sulphate which occurs in animal
excreta, chrondroitin sulphate which occurs in many invertebrates that inhabit soils,
alkyl sulphate esters, occurring in a variety of microorganisms, and choline sulphate,
occurring in lichens, algae, fungi and plants (Fitzgerald, 1976, 1978).
The environment in which a soil develops also may have a large effect on the
proportion of total S present in the m reducible pool. For example in Canadian soils
the amount of m reducible S decreases as the regional temperature falls and moisture
(rainfall) increases (Bettany et al., 1982). The amount and rate at which this fraction
is mineralized to inorganic sulphate, and the amount of soil S cycled through this
fraction annually has been the subject of little detailed study.

10
2.3.1.3 Carbon Bonded Sulphur
This fraction, in which S is directly bonded to C, is measured by the difference
between the total organic S and that fraction of the total which is reduced to H2S by
HI. About 50% of the C-bonded S occurs as amino acids (Freney et al., 1970). This
fraction is not hydrolysed into inorganic sulphate by hot acids or alkalis and would
include mercaptans, disulphides, sulphones and sulphonic acids (Freney, 1986). The
amounts of C-bonded S tend to decrease with soil depth and is more closely related
to organic N than the HI reducible S fraction (Williams, 1974). Since the C-bonded
S fraction in soil organic matter is resistant to reducing agents and correlated with
several humus properties of soils this fraction is thought to be associated with the
aromatic core of humic acids. For Australian soils Williams (1975) showed that the
C-bonded S fraction accounted for about 84% of the soil organic S in a range of soils.
The C-bonded S fraction accounted for about 84% of the soil organic S accumulated
under clover pasture and 81% of organic S lost as a result of continuous cereal
cropping (Williams, 1975). Presumably the loss results from increased soil erosion
and from increased decomposition of soil organic matter brought about by continuous
cultivation of soils.
Attempts have been made to measure C-bonded S directly by reaction of the soil with
Raney Ni (Lowe and Delong, 1963; Freney et al., 1970; Tabatabai and Bremner,
1972b; Scott and Anderson, 1976). This reagent reacts with all the reduced S bonded
to C and oxidized S in the form of sulphoxides (R-C-SO-CH3), sulphonic acid
(R-C-SO-OH) or sulphonic acid attached to aromatic nucleus or aliphatic sulphonic
acid (Freney et al. , 1970). This fraction has been found to account for up to 60% of
the total organic S. The amount of C-bonded S determine in this manner does not
account for the difference between the total organic S and HI reducible S fraction
(Lowe and Delong, 1963; Freney et al., 1970). Studies in Australia (Freney et al.,
197 5) and Scotland (Scott, 1981) showed a very good relationship between the amount
of Raney Ni reducible S and amino acid S, suggesting that this extractant determines
mainly amino acid S.

11
Fractionating soil organic S into discrete pools using reducing agents does not permit
the biological significance of various fractions to be assessed (Bettany et al., 1974,
1979). Some attempts have been made to develop extraction techniques which
fractionate the more labile S from more inert components. For example, Bettany et al.
(1979) used 0.1M NaOH-0.1M Na4P207 at pH 13 under nitrogen gas and dispersion
(sonification), acidification and centrifugation to extract the labile pool. The
fractionation method extracted 63-73% of the total organic S and the S was distributed
as follows. Fulvic acid A,36%; fulvic acid B,3%; humic acid A, 13%; humic acid
B,21 %; humin >2pm, 15% and humin <2pm, 11%. Both fulvic acid A and B are
believed to contain microbial metabolites and extra cellular enzymes. The humic acid
A and B are regarded as chemically stable and more resistant to microbial degradation.
2.3.2. Soil Inorganic Sulphur
Inorganic S is found in aerobic soils almost entirely as sulphate and this is the form
in which S is absorbed by plant roots. Sulphur compounds of lower oxidation states
such as sulphides and sulphites are usually restricted to wetland and submerged soils
where anaerobic conditions exists. Where reduced S is found in well drained soils its
presence could be indicative of atmospheric pollution (Wainwright, 1984) or possibly
by a recent application of elemental S fertilizers. In time reduced S added to topsoil
would be oxidized to sulphate. Accurate determination of the amount of these reduced
forms of inorganic S in the soil is rarely possible, mainly because limitations of
analytical procedures available.
2.3.2.1 Soil Inorganic Sulphate
Inorganic sulphate in the soil may occur as water soluble salts, adsorbed by soil
colloids or as insoluble sulphates.

12
2.3.2.2 Water Soluble Sulphates
This is the form which is directly available for plant uptake. The charge on
this solution sulphate is mostly balanced by ea++, Mg++, Na+ and K+. Extraction with
water, sodium salts, lithium chloride, potassium chloride and calcium chloride
solutions have been used for the determination of soluble sulphate. Calcium chloride
is preferred because it does not disperse soil aggregates and the solubility of organic
matter is lower in this reagent.
Considerable seasonal fluctuations occur in the amounts of soluble sulphate present
in surface soils. This is mainly due to the influence of environmental conditions on
microbial mineralization of organic S, leaching of the soluble sulphatt1 and the uptake
of sulphate by plant roots and microorganisms (Williams, 1968;1975). The sulphate
content of soil is also affected by the application of fertilizers and to a lesser extent
rainfall and irrigation. For soils of high or medium anion exchange properties the
soluble sulphate often increases with soil depth (Williams, 1974; Probert, 1974; 1977).
Subsoil sulphate is readily available to deep rooted plant species and may be important
in reducing the incidence of S deficiency in cereal crops and deep rooted pasture
species (Lipsette and Williams, 1971; Gillman, 1973; Walker and Gregg, 1975; Gregg
and Goh, 1979).
2.3.2.3 Adsorbed Sulphate
Soils vary widely in their capacity to adsorb sulphate. Sulphate anions are adsorbed
by ligand exchange with aquo(-OH2) and hydroxyl(-OH) groups on the surface of soil
colloids (Parfitt and Smart, 1978; Rajan, 1979; Bohn et al. , 1986). Sulphate
adsorption is readily reversible and the amount of sulphate adsorbed is dependent on
the concentration of sulphate in solution (Chang and Thomas, 1963; Chao et al.,
1962a; Kamprath et al., 1956; Ensminger, 1954).
Conditions favouring the adsorption of sulphate includes
1. Lower pH increases the electrostatic potential of the adsorption plane
(Williams and Steinberg, 1962; Harward and Reisenauer, 1966; Marsh
et al., 1983),

13
2. Higher clay contents are associated with greater amounts of iron and
aluminium oxides having higher adsorption capacities (Ensminger, 1954;
Marsh et al., 1983),
3. Clay mineralogy, kaolinite and allophane kaolinite intermediates
contain hydroxyl groups bonded to octahedral aluminium atoms which
are active in sulphate adsorption. Soils which contain 2: 1 lattice clays
shows little capacity to adsorb and retain sulphate (Metson, 1979) and
4. More divalent cations, cations with higher valency are adsorbed more
readily than cations with lower valency (Chao et al., 1963) and create
a less diffuse double layer which holds more sulphate ions.
Soils with low levels of native adsorbed sulphate invariably have negligible capacity
to retain added sulphate (Barrow, 1969; Metson, 1979).
In surveys of New Zealand topsoils (0-200mm) Blakemore et al. (1968) and later
Metson (1979) found that the levels of adsorbed sulphate were generally low ( < 10 mg
kg-1 of soil) and often increased with increasing soil depth.
Adsorbed sulphate is readily available to plants and in many soils it provides a major
source of plant available S (Freney and Spencer, 1960; Fox et al., 1964; Williarns and
Steinberg, 1964; Barrow, 1967a). Adsorbed sulphate is readily displaced by
phosphate. This is one of the reasons for low sulphate adsorption capacity of top soils
which have received heavy dressings of superphosphate as fertilizer. The smaller
sulphate adsorption capacity may also be associated with higher pH in surface soils.
Most methods for its determination involve the use of phosphate solutions as
extractants. Calcium dihydrogen phosphate would be the most common and widely
used (Searle, 1979) extractant for adsorbed sulphate in New Zealand.
2.3.2.4 Insoluble Sulphate
Several forms of insoluble sulphates are found in soils, including barium and strontium
sulphates, S04= associated with calcium carbonate and basic iron and aluminium
sulphates (Williarns, 197 5). Sulphate occurring in calcareous soils as eo-crystallized
impurity in calcium carbonate is probably the most common of these and in some
Australian soils this may account for upto 95% of the total soil sulphur. In subsoil
14
horizons of calcareous soils it frequently accounts for 40 to 50% of the total sulphur.
This fraction of soil S is determined by extraction with hydrochloric acid (Williams
and Steinberg, 1962). This method may underestimate the amount of sulphate
occurring in these forms due to the presence of barium and other forms of acid
insoluble sulphate (Williams et al. , 1960).
2.3.3 Plant Available Sulphur in the Soil
Almost all of the sulphur taken up by plants is in the form of sulphate which is taken
up from soil solution. This sulphate is in rapid equilibrium with adsorbed sulphate.
The amount of soluble sulphate in soil solution at any time is the net result of
complex interactions in the sulphur cycle. The major factors affecting the soluble
sulphate in most grazed pastures are plant uptake, adsorption/desorption rates,
immobilization/mineralization rates, leaching losses and fertilizer application rates
(Freney and Spencer, 1960; Barrow, 1961a; Fox et al. , 1964a; Williams and Steinberg,
1964; Hasan et al., 1970).
The rate of entry of sulphate from fertilizer to plant available sulphate is dependent
on the type of fertilizer, available soil moisture and the time elapsed since application.
Sulphate from gypsum and superphosphate is more likely to be available
comparatively rapidly and in large doses (fill, 1980) compared with the slow release
from the oxidation of elemental S (Shedley et al., 1979; White and Currie, 1988).
Under cool, temperate New Zealand conditions, particles of <150J.Im diameter are
required for the elemental S to be effective for releasing sulphate to soil solution in
the year of application. In environments in which moisture is growth limiting, the rate
of oxidation to sulphate may be too slow to provide plant available sulphate at an
adequate rate.
As mentioned earlier the amount of soluble sulphate varies widely between soil types
(Blakemore et al. , 1968; Williams, 1974) and between seasons (Barrow, 1966;
Williams, 1968). In addition to adsorbed sulphate in surface soil horizons, in some
situations subsoil sulphate can play an important part in providing plant available S
particularly for deep rooted plants (Gregg and Goh, 1978; Hue and Cope, 1987).

15
In general chemical analysis of soil as means of evaluating the S status of soils under
field conditions have not been very helpful (Brogan and Murphy, 1980; Murphy, 1980;
Spencer and Freney, 1980; Burmester et al., 198 1 ; Jones et al., 1983). Those efforts
made have invariably concentrated on extractable sulphate as the estimate of plant
available S (Ensminger and Freney, 1966).
When the sulphate adsorption capacity of the soil is low, a 0. 15% calcium chloride
solution or distilled water is adequate to determine the plant available pool. In New
Zealand 0.01M Ca(H2P04)2 (Saunders et al. , 1981) or 0.04M Ca(H2P04)2 (Searle,
1979) have been used to determine the sulphate in soil solution and adsorbed on
surfaces and used to identify pastoral soils at risk of S deficiency (Saunders et al. ,
1981) . This extractant, however, has been found to be a poor indicator of S deficiency
in not only pastoral soils in New Zealand but also in field grown crops in U.K.(Hoque
et al., 1987; Skinner, 1987).
Often the S tests have been evaluated in conjunction with greenhouse pot studies
rather than under field conditions (Jones, 1986). Good correlations between
extractable sulphate and plant uptake have been measured in many of these studies.
This is mainly because in glasshouse studies losses of S by leaching can be controlled,
the inputs of S through animal excreta and rainfall are eliminated and uniform
conditions for S mineralization are maintained. In the field it is more difficult to
control losses and gains to the soil sulphate pool. As a result the ability of soil tests
to predict S response are far more variable. For example in a Californian field study
Jones et al. ( 1983) reported that on clay loam and loam soils with C/S ratios ranging
from 137 to 267 and organic matter from 3.1 to 8.6%, there was no significant
relationship between subterranean clover-grass forage production and soil test S value.
In Western Australia, Spencer and Glendenning (1980) in a field study also found no
relationship between extractable S and yield of subterranean clover pasture. In
tropical Queensland, however, the response of a tropical legume-grass mixture to
gypsum was well correlated to Ca(H2P04)2 extractable sulphate concentrations (Probert
and Jones, 1977). Rayment (1983) also found a good relationship between extractable
sulphate and grass-legume mixture. In Canadian Prairie soils the immediately
available S pool is considered to be extracted with water since the adsorbed sulphate
is not present in significant amounts (Bettany et al., 1982).
16
In summing up, the inaccuracy of chemical soil testing procedures to predict S
requirements based on the levels of extractable sulphate can be due to a number of
factors,
1 . The potential of the soil to mineralize organic S during the growing
season is not measured. With more than 95% of the soil S is in the
organic fraction, failure to assess the contribution from this source
seriously limits the usefulness of any chemical extractant.
2. Because sulphate is weakly held in many soils, a considerable degree
of temporal variability is to be expected were, leaching is important
(Ghani et al., 1990). In such a situation it is difficult to see how the
measurement of the sulphate at a single point in time could give a
realistic indication of S supply to crops throughout the growing season.
Soil testing is likely to be most useful when leaching of sulphate is low
such as in the most arid part of the world (Hamm et al., 1973) or
where soils have high sulphate adsorption capacities.
3 . Plant roots are capable of using sulphate to great depth. Soil samples
for practical reasons are invariably collected from the top soil (0-75 or
0-150mm). Failure to account for subsoil reserves of plant available
S in the past been used to explain why apparent S response sites did
not respond to applied S.
Clearly a good knowledge of a soil and its properties and environmental conditions
are necessary if soil test values derived from single chemical extractant are to be
useful in predicting S responses. Under New Zealand conditions it is necessary to
obtain information on organic S levels, subsoil sulphate, the soil infiltration
characteristics, rainfall and past S fertilizer history to be able to predict S response
using calcium phosphate extractable S values (Saunders et al., 1981).
Having already discussed the various forms of S in the soil and the proportion of S
in each fraction present in different environments and their plant availability, it is
appropriate now to discuss the chemical and biochemical transformations that occur
between these, various soil S fractions. Emphasis will be placed on transformations
occurring in grazed pastures because of its importance to the objectives of this thesis.

17
2.4 TRANSFORMATION OF SULPHUR IN SOILS
The transformation of S in soil are many and varied and often the changes are cyclic.
The element changes from inorganic to organic forms and back again due to the action
of living organisms. Because the transformations are cyclic it is appropriate to discuss
the S cycle before discussing the individual transformations.
The S cycle in a grazed pasture is an interactive system comprising soil, plants and
animals and their interaction with climate. The S cycle for a well drained grassland
soils in humid temperate climate was first proposed by Walker (1957). During the last
three decade or so, S cycles for different agricultural systems have been developed by
several workers (fill, 1975; Metson, 1979; Bettany et al. , 1982; Freney and Williams,
1983; Stevenson, 1986). A generalized S cycle for a grazed pasture is shown in
Fig.2. 1 .
Considering the previous discussion (section 2.2) it is clear that soil organic pool is
the largest reserve of S in a grazed pasture. Even though plants absorb a small
amount of S as S02, the majority of atmospheric and fertilizer inputs of S must also
pass through the soil pool before entering the plant and animal components of the
cycle. The plant system contributes much to the S cycle because most of the carbon
bonded S in soil organic matter is derived from plant litter. The grazing animal
contributes S to the soil as primarily inorganic S in urine and both inorganic and
organic S in dung.
As mentioned in section 2.3.3, one of the factors influencing the size of the sulphate
pool is the balance between the organic matter formation and its decomposition. The
rates of soil organic matter formation from plant and animal residues and its
decomposition are essentially controlled by the activity of soil microorganisms. So
it is appropriate to understand the factors which control the nature and activity of soil
microorganisms.

Figure 2. 1
Off farm produce losses
/ ,___, Atmosphere J I Plants '" so2 .., )o so4=,c-o-s. c-s
en CD D rn C CD co rn .Q rn o CD > u
_ o
Fe rtilizer so4=, so Roots
so4=. C-0-S ,C-S
m '- 0.. CD ::l a:l - ;::: � U) rn ::l o "O
LL .E
Primary min e rals
s=. so Chemical weathering -- -- -- �
. ',o1.
't-(9 <9,.,_ r _.,__ i nputs to farm I i mmobilization M mineralization R reduction 0 oxidatio n
�/'..<'\. -�c. '/(9 ' Q>/ "-?. ' � �
Weakly adsorbed Strongly adsorbed soli= Secondary minerals, s=
en CD en (/)
..9 ;:::;-, c � u CO CD
_J
t
Animals so4=, e-o-s,c-
! 1 Residues + Excreta so4=, c--o-s, c-s
Oraanic c-o::-s. c-s
The S cycle (Hedley, M.J., 1990. Lecture J:?.Otes of soil fertility and the environment, 89.412 Soil Science, Massey University). ......
00
2.4.1 Microbial Biomass Sulphur
1 9
Soil microorganisms contain S in the form of amino acids (C-bonded) and ester
sulphates (HI-reducible S). This fraction is generally referred to as the microbial
biomass S and in soil is considered to be both an important sink (immobilization) and
a source (mineralization) of plant available S (Voroney et al., 1981). The soil
microbial biomass is included with the soil organic matter and contains about 2% of
total C, N and S of the soil even though much of the other soil organic S compounds
must pass through this pool before being available for plant uptake. Size and activity
of the microbial biomass is affected by the soil nutrient status as well as by temporal
and seasonal changes. Changes in the activity of biomass in response to
environmental changes therefore have important implications in S availability for plant
growth.
A major advance in estimating the size of the microbial biomass in soils came with
the development of the chloroform-fumigation and extraction techniques of Jenkinson
and Powlson (1976). The first attempt to measure biomass S was made by Saggar et al. (198 1a) by fumigating soil with alcohol free chloroform and then extracting the
soil with N aHC03 or CaC12 solution. This method has been used to determine
biomass S in other soils although the extractant used varies (David et al., 1982;
Maynard et al., 1983; Chapman, 1987; Ghani et al., 1988). In bacteria the majority
of S appears to be in amino acid form with only about 10% present as ester-S (Saggar
et al., 198 1a). Again in fungi the majority of S is in the amino acid form. Fungi also
contain a significant amount of organic sulphate as cholin sulphate (Fitzgerald, 1978).
2.4.1.1 Factors Affecting Microbial Sulphur
Microbial activity is often limited by a lack of substrate and nutrient. This is evident
by the fact that the addition of substrate (carbon source) to soil generally results in a
rapid increase in microbial activity, total biomass and in short-term net
immobilization. For example in incubation studies the incorporation of 35S labelled
sulphate into the soil organic S fraction can be increased by the addition of glucose

20
(Freney et al., 197 1 ; Saggar et al. , 198 1b; McLaren et al., 1985; Ghani et al., 1988).
Under field conditions the main source of substrate for microbial growth is from plant
residues, in the form of roots, stem and leaf litter and in grazed pasture 50% of
substrate is returned in the form of dung and urine from the grazing animals. In a
grazed pasture it was estimated that about 85% of the S taken up by above ground
plant is returned to soil in these forms (Scott, 1985). More recent estimates (Saggar
et al., 1990a) would put this at a lower level with pasture utilization by animals
commonly 70% of the above ground plant uptake.
In general soils that have the highest organic matter inputs also tends to have the
greatest microbial activity and largest biomass. Practices which reduce organic return
to soils will affect microbial activity, for example cultivation of natural vegetation
such as forest and prairie reduces the soil biomass. Fertilizers in the organic form will
on the other hand increase microbial activity more so than the inorganic forms because
of the additional carbon substrate added. However, where inorganic S fertilizers
stimulate plant growth, increased inputs of carbon will occur.
Saggar et al. (1981b) showed that the percent of total S present as ester-S in the
microbial pool increases significantly as the sulphate content of the growing medium
is raised. Thus it may be expected that additions of inorganic S fertilizers may also
increase the microbial ester pool.
Even though the amount of S in the microbial pool has been quantified in a number
of studies, no attempt has been made to measure the amount and rate at which S is
cycled through this pool. The activity of this pool is important for a number of
reasons discussed below.
1 . Most of the plant S (both shoot and root) is cycled through this pool
before becoming available for plant uptake,
2. About 75-90% of dung S must pass through this pool before becoming
available for plant uptake and
3. Soil microflora and fauna activity must occurbefore organic S can be
hydrolysed to plant available forms.
2 1
As discussed earlier the amount of plant available S at any time is the balance
between the amount of S released as sulphate from soil organic matter by
decomposition and the microbial need for S. Having discussed the factors
affecting the form and activity of the organisms, it is now appropriate to discuss the
processes of organic matter decomposition and the factors affecting it.
2.4.2 Mineralization by Microorganisms
The conversion of organic S to inorganic sulphate (mineralization) is regulated by
same factors that control the activity of microorganisms and the functions of their
extracellular enzymes. The chemistry of mineralization in different soils whether they
be from forest or grassland ecosystems is almost identical (David et al., 1982).
2.4.2.1 Mechanism of S Mineralization
The conversion of ester sulphate to inorganic sulphate is actioned by sulphohydrolase
enzymes (sulphatases), which are produced by microorganisms, plants and mammals.
The hydrolysis is given by the equation (Fitzgerald, 1978)
R- C-0-S0-3 + H20 - R-C-OH + so; + H+
This can occur either intracellularly or in the periplasmic space, depending on the
organism and substrate (Dodgen and Rose, 1975; Fitzgerald, 1978). Enzyme
formation in pure systems is suppressed by the sulphate ion and S containing amino
acids (Dodgen and Rose, 1975; Fitzgerald, 1976). The activity of sulphatase is
thought to be inhibited by an accumulation of end product (Cooper, 1972) so that the
amount of S mineralized by this mechanism depends on the sulphate level in the soil.
It has been suggested (McGill and Cole, 198 1) that the release of inorganic S from
ester S by the sulphohydrolase enzyme is controlled by the microorganisms' need for
S rather than energy. More extensive mineralization of organic S in cropped
compared to uncropped soils has been attributed to the fact that by maintaining soluble
sulphate at low concentrations in the cropped soils plants stimulate the production of
sulphatase by rhizosphere microorganisms (Maynard et al., 1985). In a pot experiment

22
with New Zealand soils of low S status sulphatase activity was a good indicator of
mineralized S taken up by plants (Spier, 1977). In the absence of growing plants,
however, Tabatabai and Bremner (1972a) showed in an incubation study no clear
relationship between sulphatase level and sulphate production.
Although many aspects of S mineralization are still poorly understood (Scott, 1985)
it is well established that the rate of S mineralization is regulated by same factors
which influence the growth of microorganisms and their extra cellular enzymes. Soil
temperature, moisture and water movement appear to play a regulatory role in the
level of arylsulphatase activity in the soil (Speir, 1977; Neal and Herbein, 1983) and
variation in these factors explain in part the difference in activity between cropped and
fallow soils (Speir et al., 1980). In planted soil however there is a greater opportunity
for sulphohydrolase to be replaced either by plant roots and higher microorganism
members associated with rhizosphere (Speir et al., 1980), both of which are absent in
a fallowed soil. It seems unreasonable to expect a strong relationship between
sulphate released and aryl sulphatase activity because only part of the mineralized
sulphate originates from ester sulphate fraction and arylsulphatase is only one of many
enzymes involved in organic matter decomposition. Further research is required if the
complex nature of S mineralization processes are to be unravelled in soils.
Very little is known about S mineralization rates in field soils. Most of the work in
USA (Tabatabai and AL-Khafaji, 1980), UK (Bristow and Garwood, 1984; M'Laren
et al., 1985), Canada (Maynard et al., 1983), Australia (Freney et al., 197 1 , 1975) and
New Zealand (Ghani et al., 1988) studied the mineralization rates of soils only under
laboratory conditions. The practical significance of these results is uncertain because
the apparent rate of mineralization of soil in laboratory depends upon the type of
incubation system used (Maynard et al., 1983). To provide effective information
related to plant uptake and S fertilizer requirements, the mineralization study must be
conducted under field conditions. In order to achieve this appropriate techniques need
to be developed to measure the losses of S from soil by plant uptake and leaching and
in so doing, determine the net mineralization of soil organic S and the rate of
mineralization.

23
2.4.2.2 Factors Affecting Mineralization
As mentioned earlier, mineralization is essentially controlled by the activity of the
microorganisms, which is controlled by several factors. These include the
temperature, moisture, Ph and the availability of substrate and other nutrients.
2.4.2.2.1 Temperature
Laboratory studies have shown that mineralization of S is considerably retarded below
10°C (Stevenson, 1986), but increases with increase in temperature up to 40°C. Work
in Iowa (Tabatabai and Al-Khafaji, 1980) showed that the quantity of S mineralized
over a 6 week incubation period increased by a factor of 2.5 to 3.7 when temperature
was raised from 20°C to 35°C. Similar effects of temperature on S mineralization
have been reported by Williams (1967) and Ghani et al. ( 1988) for soils from
Australia and New Zealand respectively. Under field conditions, the effect of
temperature on the amount of S mineralized are not fully understood for agricultural
ecosystems, because increased temperature also increases carbon fixation and S
immobilization. Sulphate-S levels in pasture soils are often highest during moist cool
periods when plant growth is slow (Ledgard et al., 1991). The high levels of mineral
S in summer due to S released from organic matter by desiccation under Australian
cultivated soil conditions (Barrow, 1961a, 1966; Williams, 1967) is also an effect of
temperature.
2.4.2.2.2 Moisture
In laboratory incubated soils moisture contents close to field capacity are optimal for
S mineralization and the rate of sulphate production declines sharply at moisture
contents above and below this point. The decline of S mineralization at high soil
moisture contents could be expected to be due to the occurrence of anaerobic
conditions (Williams, 1967). It has been shown that the effect of moisture on the
mineralization of S and N was similar (Williams, 1967). When soils are dried and
remoistened prior to incubation they release appreciably more sulphate than they do
when incubated without prior drying (Williams, 1967). This occurs because drying
24
lyses some of the microorganisms and releases S. But Freney et al. (1975) showed
that for Australian soils which presumably normally undergo severe wetting and
drying in the field, drying and rewetting of planted soils in the greenhouse did not
stimulate S mineralization. For New Zealand soils the effect of moisture on the
mineralization of S has not been studied under either laboratory or field conditions,
but West et a/.(1989) studied the effects of laboratory and field drying on microbial
P release in soils and concluded that soils prone to drought produced lysis resistant
microbial populations whereas humid soils produce organisms susceptible to lysis on
drying.
2.4.2.2.3 pll
Australian work in laboratory incubations (Williams, 1967) has shown that the amount
of S mineralized is proportional to Ph up to 7.5. Above Ph 7.5 mineralization occurs
more rapidly suggesting that chemical hydrolysis is also affecting the process. In
some soils the amount of S mineralized was more related to the amount of calcium
carbonate added, than to the Ph after incubation (Williams, 1967).
Addition of calcium carbonate to soils has been shown to lead to an increase in
soluble sulphate on incubation (White, 1959; Nelson, 1964; Williams, 1967) because,
in addition to increased mineralization, adsorbed sulphate may be desorbed from soil
exchange sites because of the increased Ph (Chao et al., 1965; Williams and Steinberg,
1962), and sulphate may be released from soil organic matter by chemical hydrolysis
under alkaline condition (Barrow, 1960).
2.4.2.2.4 Availability of Substrate and other Nutrients
It has been suggested that the S content of organic matter recently added to soil rather
than total soil S regulates S mineralization. It has been shown that sulphates usually
accumulate in the soil when the C:S ratio is below 200 and is highly immobilized
when the ratio exceeds 400 (Barrow, 1960). At ratios between 200 and 400 the
picture is less clearcut. In a study investigating the effect of N addition on the S
mineralization, Kowalenko and Lowe (1975, 1978) found that both immobilization and

25
mineralization occurred. This lead them to the conclusion that simple generalization
on the effect of changing the N :S ratio on S transformation should be avoided.
Sulphur mineralization in presence of growing plants was greater than that which
occurred in an identical fallow soil (Freney et al., 1975; Barrow, 1967b; Cowling and
Jones, 1970; Jones et al., 1972a; Tsuji and Goh, 1979; Maynard et al., 1985; Nicolson,
1970). The reason for this is partly due to increased rhizosphere activity in presence
of plants.
No detailed information is available on the effect of rate of fertilizer application and
the return of excreta by grazing animals on the amount of S mineralized in grazed
pastures. The animal itself can be considered to be a mineralizing agent because on
average about 35% of the organic S entering the animal is returned to the soil as
sulphate (section 2.5.2).
2.4.2.3 Relationship Between Sulphur and Nitrogen
Mineralization
Even though both S and N mineralization are the result of the decomposition of soil
organic matter considerable controversy still exists in the literature regarding the
factors influencing the relative rates of mineralization of the two nutrients.
In a comparison of New Zealand soils White (1959) reported that the relative rates of
S and N mineralization from soil organic matter were similar and that they were
released in the same ratio as that occurring in the soil organic matter. In contrast,
most other incubation studies, for example in soils from Australia (Williams, 1967),
Iowa (Tabatabai and Bremner, 1972a), West Indies (Haque and Walmsley, 1972) and
Canada (Kowalenko and Lowe, 197 5) the ratio of N to S mineralized was found to be
much wider than the soil organic matter, suggesting that
1 . The proportion of potentially mineralizable N pool may different from
S pool.
2. Sulphur and N may not occur in the same organic compounds or
fractions of soil organic matter and thus may not be released at same
time or rate (Freney, 1961; Biederbeck, 1978),

3. The inclusion of plant or animal residues with large N to S ratios
would cause greater immobilization of S relative to N,
4. The processes affecting N and S mineralization may be different,
especially the type of microorganisms and the stability of extra cellular
enzymes (Biederbeck, 1978).
26
In all the above studies a closed soil incubation system was used. This allows for
reimmobilization of mineralized S and N. When S is limiting microbial activity
presumably the mineralized S reimmobilized. This would result in an apparently
wider N/S ratio mineralized than present in the soil organic matter. The reverse is
also possible. Recent studies (Tabatabai and Al-Khafaji, 1980; Maynard et al., 1983;
Ghani et al., 1988), in which soils were leached periodically (open incubation system)
with extractants such as 0.01M KCl and 0.15% CaC12 suggest that the ratio of N to
S mineralized was very close to the N to S ratio of the soil organic matter (Table 2.2).
In the open incubation system the mineralized products can be removed by leaching.
This limits the reimmobilization of the mineralized products. In addition to the
incubation system, there are a number of other factors, such as temperature, moisture,
pH and the type of organisms, which can be used to explain the difference between
the rates of N and S mineralization (Freney, 1986).
In all the New Zealand studies (White, 1959; Ghani et al., 1988) the relationship
between S and N mineralization has been examined only in laboratory incubation
studies. Mineralization rates of S and N under field conditions have not been
investigated in any detail. It is particularly important to measure these processes
under legume based grazed pastures, the dominant agricultural land use, for which
superphosphate is the main fertilizer applied and the only source of soil N is the
fixation of atmospheric N.
2.4.3 Immobilization
Some authors considered this to be the consumption of inorganic S by soil
microorganisms and eventual incorporation into humus. It also includes any S taken
up and combined with carbon by plant roots and other microorganisms which remains
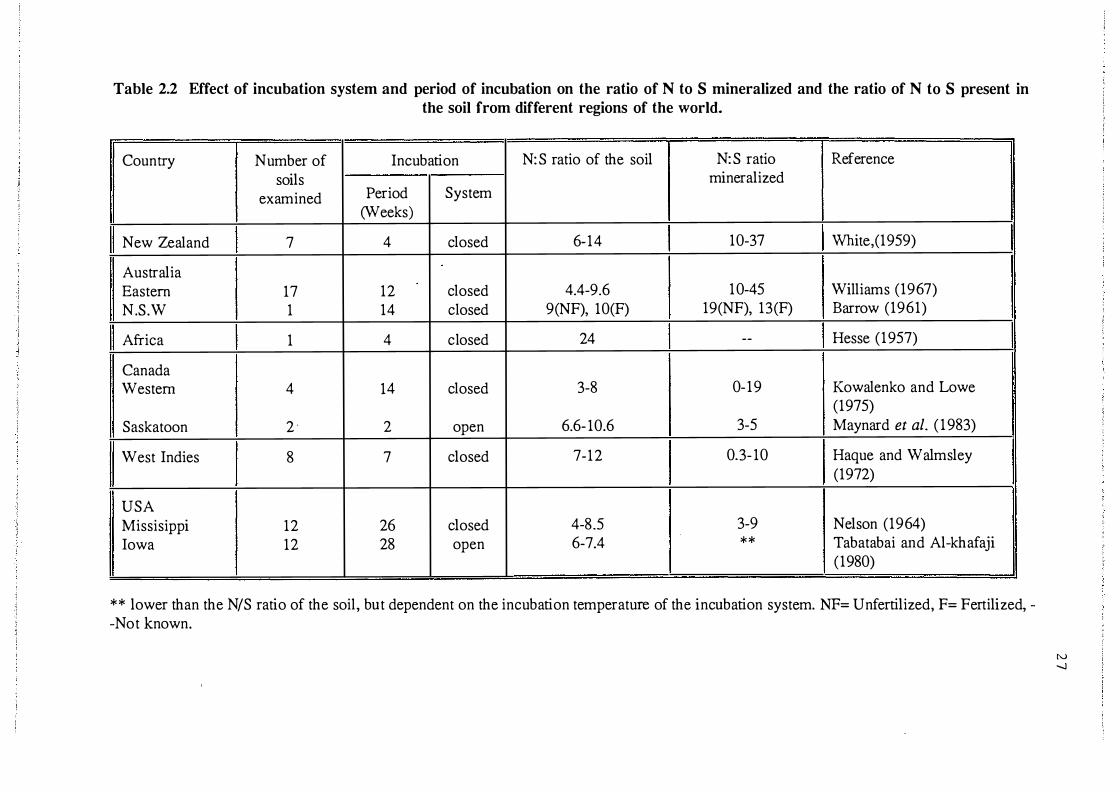
Table 2.2 Effect of incubation system and period of incubation on the ratio of N to S mineralized and the ratio of N to S present in the soil from different regions of the world.
Country Number of Incubation N :S ratio of the soil N:S ratio Reference soils mineralized
examined Period System (Weeks)
New Zealand 7 4 closed 6-14 10-37 White,(1959)
Australia Eastern 17 12 closed 4.4-9.6 10-45 Williams (1967) N.S.W 1 14 closed 9(NF), 10(F) 19(NF), 13(F) Barrow (1961)
Africa 1 4 closed 24 -- Hesse (1957)
Canada Western 4 14 closed 3-8 0-19 Kowalenko and Lowe
(1975) Saskatoon 2 · 2 open 6.6- 10.6 3-5 Maynard et al. ( 1 983)
West Indies 8 7 closed 7-12 0.3- 10 Haque and Walmsley (1972)
USA •
Missisippi 12 26 closed 4-8.5 3-9 Nelson (1964) Iowa 12 28 open 6-7.4 * * Tabatabai and Al-khafaji
(1980)
* * lower than the N/S ratio of the soil, but dependent on the incubation temperature of the incubation system. NF= Unfertilized, F= Fertilized, --Not known.
N -....)
28
below ground. Immobilization conserves S04 = against loss by leaching and the
immobilized S provides a potential source of S for subsequent plant uptake (Voroney
et al., 1981). The biochemical pathways in the immobilization of sulphate are
reasonably well understood and have recently been outlined (Scott, 1985). Under
conditions where organic materials are rapidly accumulating, considerable amount of
inorganic S are incorporated into soil organic matter. For example in South Australia
vigorous legume growth is associated with the immobilization of S applied in
superphosphate (Williams and Donald, 1957).
The incorporation of sulphate to organic S forms can be very rapid. In New Zealand,
field work with 35S-labelled gypsum showed that about 40% of the S applied to a three
year old pasture soil was converted into organic S in the top 0-50mm soil layer within
six weeks of application (Gregg and Goh, 1979). Work in Australia showed that
about 50% of the added 35S04-S was incorporated into organic forms in 168 days in
a laboratory incubation study (Freney et al., 197 1). Added 35S was recovered in both
ester S and C-bonded S fractions. When a carbon source was also added, the
incorporation of sulphate into organic S was further increased (Freney et al., 197 1)
demonstrating the importance of substrate for microbial activity. Several workers have
demonstrated this phenomena (Maynard et al., 1983; Ghani et al., 1988).
Less is known about subsequent S transformations during the breakdown of
plants,animals and microbial compounds which lead to S immobilization into soil
humic and fulvic acids and humin materials (Bettany et al., 1979). Studies in which
rye plants were grown with labelled 35S-sulphate and the residues then incorporated
into soil organic matter showed that appreciable amounts of labelled S were found in
soil humic acid when sodium bicarbonate was used to extract the labelled organic
matter (Freney et al., 1971) . When NaOH was used to extract the soil organic matter,
however little 35S was found in humic acid fraction (Freney et al., 197 1 ; Scharpenseel
and Krausse, 1963). This showed that most of the added S was incorporated in to
more resistant C-bonded S fraction while some of the inorganic S was incorporated
in to ester S, the quantity of ester S that may have been converted into C-bonded S
and vice versa is not known.

29
Under steady state conditions the rates of immobilization and mineralization are
balanced with organic soil S levels remaining comparatively constant. In many soils,
however, the establishment of grass-clover association begins a phase of soil organic
matter accumulation which is enhanced by the application of fertilizer P and S
(Walker, 1956). Australian studies showed net immobilization of 10-15 kg S ha-1(0-
150mm) year-1 in several fertilized pastures for 3-27 years (Hingston, 1959). In New
Zealand During and Cooper( 197 4) showed that about 30% of the fertilized S applied
to yellow brown loam over a period of 5 years was immobilized in to soil organic
matter.
2.4.3.1 Biochemistry of Immobilization
In the process of immobilization sulphate ions are activated in a two step process,
leading to the production of the energy-rich sulphate nucleotides APS (Adinosine
5'-phosphosulphate) and PAPS (3 '-phosphoadinosine-5'-phosphosulphate) (Scott,
1985). The nucleotides are then used in the synthesis of S containing amino acids.
The pathways are still uncertain, but it is thought that PAPS is reduced to sulphide via
sulphite. The amino acid serine is then combined with sulphide to produce cysteine.
Thiosulphate is readily used by microbes in place of sulphate and is thought to be a
direct pathway. The overall reaction may be represented as follows.
so;�APS�PAPS�Ac ti vesulphide�Sulphide+cyseine �serine
Cysteine is then used as the building block for other S containing amino acids, which
are then combined into proteins.
2.4.4 Leaching of Sulphate
Soil S in the form of sulphate is lost from agricultural soils mainly by leaching.
Sulphate leaching has been investigated in laboratory, greenhouse and field studies.
Losses ranging from 0- 100% of the applied S have been reported in different soils
with various fertilizer and experimental techniques. The results of a number of these
studies and the experimental techniques used are given in Table 2.3.

Table 2.3 Experimental techniques used to evaluate sulphate leaching losses under greenhouse and field conditions.
Soil group Experimental techniques Sulphur treatment (kg S Sulphate leached Reference
ha-1)
Soils with widely varying Soil leaching column study 45 as 35S in gypsum 0-15 % of Chae et al. , ( 1962)
characteristics fertilizer S
Podzol Undisturbed soil leaching U nfertilized 2 kg S ha-1 Peverill and Douglas,
column study ( 1976)
Podzol Soil leaching column study 1 10 as gypsum 90% , 8 1 % and Hogg and Cooper,
50 as SSP 19-33 % of ( 1964)
3 1 as so fertilizer S
Yellow grey earth Greenhouse pot trial 106 or 264 in SSP 20% of fertilizer Muller and
s McSweeny, ( 1977)
Yellow grey earth Field study 45 as SSP 15 kg S ha-1 Smith et a/. , ( 1983)
I .
1 w 0

3 1
The amount of S lost by leaching depends upon soil texture, sulphate retention
capacity, biological properties, the amount of water passing through the soil profile
and factors which affect the size and rate of renewal of the solution sulphate pool in
the soil.
2.4.4.1 The Influence of Soil Texture
Severe leaching of S occurs from sandy soils in Australia (Barrow, 1 967b; Watson et
al., 1973; Lewis and Clarke, 1975), in New Zealand (Cooper and Hogg, 1966) and in
USA (Rhue and Kamprath, 1 973). This is due to the poor retention of sulphate
(Cooper and Hogg, 1966) in these soils due to lack of organic matter to act as
substrate for immobilization and the absence of hydrous Fe and Al oxides for sulphate
adsorption. The low water retention capacity of these soils also leads to higher losses
of sulphate. The lack of sulphate retention in a sandy soil was highlighted by Rhue
and Kamprath ( 1973) where almost all of the applied S (sulphate and oxidized
elemental S before leaching) was leached from the top 450mm of a sandy soil in 1 80
days, while in a silty loam of similar pH there was no downward movement of S was
observed. A sand texture, however, is not the only prerequisite for S leaching (Till
and McCabe, 197 6).
2.4.4.2 Factors Affecting the Accumulation of Soluble S-pool
The amount of sulphate leached is influenced by all those factors that affect the
soluble inorganic sulphate pool in the soil, namely, the timing of the last S fertilizer
application, the form and size of the fertilizer S particle, factors affecting the net rate
of mineralization and soil water characteristics (section 2.4.2.2).
The sulphate adsorption capacity of the soil has a major bearing on the rate of
sulphate leaching. Work in New Zealand showed that under similar rainfall conditions
(500-600 mm year-1) large differences in the movement of sulphate can occur in
pasture soils with contrasting sulphate adsorption capacities (Gregg et al., 1 977).
When sulphate adsorption capacity is negligible the mobility of sulphate can be as
high as that of chloride (Aylmore and Karim, 1968). A recent study on the North
Island hill country pasture soil in New Zealand with low phosphate adsorption

32
capacity (<30%), Saggar et al.( 1990a) calculated that about 46 to 77% of S applied
as superphosphate was lost by leaching depending on the rate of application of S.
This leaching loss was more pronounced in the low slopes (camp areas) than in
moderate hill slopes. In a similar study (Saggar et al., 1990b) with the soil of high
P retention showed that the loss was very low when the fertilizer application rate was
low but it increased when the fertilizer application rate increased. In South Island, it
was shown that when the fertilizer application rate was increased from 186 to 372 kg
SSP ha-1 year-1 about 50% of the additional S applied was lost by leaching (Nguyen
and Goh, 1990).
In some areas of New Zealand S applied to p�stures in spring is less susceptible to
leaching than S applied in autumn mainly due to a greater plant uptake and
immobilization into soil organic matter, which reduces the soil solution sulphate before
the next winter. In high rainfall environments this is reflected in increased S response
in spring to spring applied S (Nguyen et al., 1989). In another study it was shown
that when the fertilizer was applied during previous spring about 1 1kg S ha-1 was lost
by leaching but when applied in late autumn the loss was increased by 4 to 5kg S ha-1
(Smith et al., 1983).
Work in U.K, where soils have little or no capacity to retain sulphate showed that
losses of sulphate can represent a large proportion of S input. For example work at
Rothamsted (Bromfield and Williams, 1974) showed that the amount of sulphate
leached (50 kg ha-1) from an uncropped soil exceeded S inputs from rainfall and
fertilizer. But this may not occur continuously for a long time. Cropping the soil
reduced the leaching of sulphate significantly, but still substantial losses occurred
(Bristow and Garwood, 1984).
Farming practices such as liming and phosphate fertilization both decreases the
sulphate adsorption capacity and can accelerate sulphate leaching (Curtin and S millie,
1986; Bolan et al., 1988; Marsh et al., 1988). Little work has been done to compare
the losses of S by leaching from soils which have been fertilized with superphosphate
and soils with other form of sulphate fertilizers, but such research is currently
33
underway at Massey University (Heng, 1991). But generally, soils with regular
superphosphate application lose more S by leaching than soils with other sulphate
fertilizers. Leaching and adsorption studies conducted in U .K showed that a sizeable,
although a variable proportion, of added S was lost from the zone of root activity by
leaching (Syers et al., 1987).
The intensity and duration of rainfall affect the degree of wetting of the soil and thus
the time taken to approach the maximum leaching rates. Singh et al. ( 1980) showed
greater losses of S by leaching at greater rates of rainfall in lysimeter studies. The
effect of previous rainfall can also affect the rate of leaching; e.g. Scotter ( 1978)
found that preferential flow is most likely in saturated soils. In some cases
preferential flow may lead to less sulphate leaching than if greater displacement of soil
water occurs.
Despite many studies conducted in New Zealand, Australia and U.K on leaching losses
of sulphate no quantitative information is available on the possible origin of this
leached sulphate. In a grazed pasture, sulphate can be leached directly from fertilizer
sulphate, sulphate in animal excreta and sulphate mineralized from soil organic matter.
Even though lysimeter (Steele et al., 1984), mole and tile drain (Smith et al., 1983)
and 35S tracer (Gregg and Goh, 1979) studies have been used in field have measured
indirectly the leaching losses of S, none of these studies measured the amount
of S lost by leaching and the origin of the leached sulphate. For example in the
experiment using 35S labelled fertilizers (Gregg and Goh, 1979) the amount of S lost
by leaching was not measured directly, instead it was calculated indirectly by balance
from inputs and the percentage isotope recovery from the soil. In the experiment
using mole and tile drain system (Smith et al., 1983) to recover the leached sulphate,
the amount of drainage moved below the mole drain was not accounted. In the
lysimeter study (Steele et al., 1984) not all drainage was collected, instead the
drainage at the start and end of each rainfall event was collected and the average
sulphate concentration was used to calculate leaching losses. Further studies are
required to provide information on the actual amounts and origins of this leached
sulphate. New techniques to measure these losses need to be developed. If the main
34
origin of the leached sulphate was identified management practices could be changed
inorder to reduce or minimize the losses of S by leaching. For example in situations
where leached sulphate is derived mostly from fertilizer, elemental S fertilizer may be
useful in reducing leaching loss. Elemental S based fertilizers have been successful
in maintaining S supply to pastures in strongly leaching environments (Boswell, 1987).
2.5 SULPHUR CYCLING IN GRAZED PASTURE
SYSTEM
So far the literature review has considered the forms of soil S and the transformations
of these forms that influences their fate in the soil. In grazed pasture systems, in
addition to applied fertilizer, the grazing animal and its management, as it influences
the return of plant litter and animal excreta, have a considerable influence on the fate
of S (Saggar et al., 1990a).
2.5.1 Fertilizer Sulphur Inputs
In New Zealand, superphosphate (0 9 0 12, N-P-K-S) is the main fertilizer applied to
legume based pastures in order to overcome key P and S deficiencies in pastures and
stimulate nitrogen fixation by the legume component of the sward. Sulphur is
particularly important because grasses depend upon clover for their nitrogen
requirements. At the same time grasses are stronger competitors for S than clovers.
When S supply limits clover growth nitrogen fixation rates are also limited. This
inturn limits the nitrogen supply to the grass component of the sward. This inturn
limits total pasture production. Overcoming the S limitation builds up soil organic
matter by allowing more carbon to be fixed by growing plants and increases the
accumulation of S in soil organic matter (Barrow, 1969). In the early stages of
pasture development this build up of organic S may induce S deficiency (Walker and
Adams, 1958) until immobilization and mineralization rates become balanced.
The cost of fertilizer transportation in recent years have made high analysis forms of
S fertilizers more attractive to manufacture and distribute. To achieve high analysis
S fertilizer it is preferable incorporate S into fertilizers in the form of elemental S (S0)
rather than sulphate form. Elemental S is the most concentrated form of S and hence
the addition of so to higher analysis fertilizers will not greatly dilute other nutrients,

35
and unlike sulphate in superphosphate, the slow oxidation of so may reduces the
leaching losses of sulphate.
Research has indicated that fertilizers in the elemental S form can be suitable as a
pastoral fertilizer in New Zealand provided specific particle sizes of so are used
(Boswell, 1985). Elemental S must be oxidized to sulphate in soils before it becomes
plant available. The plant availability of so applied to soil has been shown to be
greatly affected by its particle size distribution (Fox et al., 1964; Palmer et al., 1983;
Sinclair and Enright, 1983). Sulphuric acid grade so of particle size range 100%
<250pm and 50% < 150pm, is recommended by the Ministry of Agriculture and
Fisheries for annual applications to pasture in warm temperate climate zones or
biennial application in cool temperate climate zones.
In grazed pasture systems, S returned in plant litter and animal excreta (dung and
urine) are the major above ground sources of recycled S for maintaining the fertility
of soil.
2.5.2 Sulphur Returned in Plant Litter
The amount of S involved in recycling from above ground plant litter depends on the
amount of plant production and the amount of herbage utilized by the grazing animal
(King and Hutchinson, 197 6) which depends upon the stocking rate. In well grazed
pastures with high stocking rate utilization can be as high as 90% (Gillingham and
During, 1973) while in less intensively managed system pasture utilization by the
grazing animal can be as low as 50% (Lambert et al., 1983). With good grazing
management ensuring high pasture utilization more S in the above ground herbage will
be returned to the soil in the excreta. Under Australian conditions, 70% of net
primary production of tops in intensively stocked pastures were utilized by grazing
animals (Hutchinson, 1971). The amount of S cycled in root litter and exudate is
dependent on the pasture species and the frequency and intensity of grazing.
The rate of release of S by mineralization of excised white clover tops and roots was

36
studied by Dalal et al. (1978). After 8 weeks about 44.4% of 35S applied in roots and
38% in tops was taken up by plants indicating that relative to tops root decompose
quicker. But this trend may not follow for nonexcised root or for other plant species.
The rate of cycling of S through plant litter is dependent on the S content of the plant
and those factors that affect the decomposition of the litter. Root decomposition also
provides plant available S as roots senesce or are harvested by root feeding arthropods
and nematodes (Evans, 197 1).
2.5.3 Sulphur Return in Animal Excreta
Sulphur cycling via grazing animals is considered to avoid the slow process of the
decomposition of plant residues, effectively increasing the turnover rate of S cycle
(Wilkinson and Lowery, 1973; Till, 1975). In part this is true as a large proportion
of S (50-60%) in excreta is in an immediately plant available form (Till, 1975).
However, faecal S is mineralized more slowly than plant S (Barrow, 196lb). The
trampling of dung by grazing animals, especially at high stocking rate, does encourage
the decomposition process and in doing this reduces this difference. Inefficiencies,
however results from the return of S in animal excreta. Dung and urine are not
returned evenly, but to only a small part of the grazing sward (see section 2.5.2.2).
This represents a loss of S from the soil-plant system. The ability of plants
immediately after grazing to absorb S is often severely restricted. This leads to further
reduction in the efficiency of S cycling because sulphate can be readily leached from
dung and urine patches and is not incorporated into the organic matter or plant pool.
Of the S returned by the grazing animal approximately 40% of S is in dung and 60%
of S in urine, respectively (Wilkinson and Lowery, 1973). The plant availability of
S, in dung is dependent on the S content, its rate of breakdown and the distribution
pattern of dung returned to the grazed pasture.
37
2.5.3.1 Dung and Urine Sulphur Content
Values for S content of grazing animal dung range from a low of 0.07% (fresh
weight) in fresh cow manures to a high of 0.4% S (fresh weight) in sheep dung.
Faecal organic S consists of undigested protein, microbial protein S and compounds
such as indican which are water insoluble and are somewhat resistant to microbial
breakdown (Walker, 1957; During, 1984). The amount of S excreted in faeces is
relatively constant, but the S content of the urinary excretion depends on the S content
of herbage and season (Walker, 1957; Barrow, 1961b). According to During and
Cooper (1974) and Till (1975), 50 to 60% of the S (mostly as sulphate) is excreted
in urine when animals graze pastures adequately supplied with S, the remainder occurs
as faecal S some of which is in the inorganic sulphate form susceptible to leaching
(Walker, 1957; During, 1984).
The grazing animal can influence the losses from the plant available soil S pool in
several ways. These include
1 . Losses in animal products
2 Losses by transferring excreta and
3. Losses of S by leaching from excreta deposits.
2.5.3.2 Dung and Urine Distribution by Grazing Stock
A major factor influencing the accumulation of S in pastoral soils is the dung and
urine distribution pattern which is dependent upon the type of grazing stock and the
physical nature of the grazing environment. Sheep develop permanent, defined camp
or resting areas where heavy rates of dung are deposited. Hilder (1964) studied the
faecal return in the New England area of Australia using Merino sheep and found that
stock camps, which comprised 3% of the total area, contained about 22% of the total
faeces and that 10% of the total area contains 34% of the total faeces. Work of
Gillingham and During (1973), with cattle, demonstrated that the campsites usually
were freshly chosen at each grazing although some areas (eg. near shelter or gateway)

38
tend to receive high levels of excreta. Influence of topography and aspect on the
pattern of excreta return from sheep have also been described by Gillingham (1980)
and Saggar et al. (1990a).
Although it is recognized that campsites receive frequent applications of dung as
evidenced predominantly by higher soil P and K levels than in the surrounding
paddocks (Hilder and Mottershead, 1963; Rowarth, 1987; Saggar et al., 1990a) there
has been few attempts to quantitatively determine dung distribution patterns on the
remainder of a grazed paddocks and its influence on pasture production and S leaching
losses (Gillingham, 1980; Lambert et al., 1983).
2.5.3.3 Decomposition of Dung Sulphur
Mineralization of dung S is controlled by same factors that affect the mineralization
of other forms of organic S. Barrow (1961b) reported that, like nitrogen, the rate of
mineralization of S is closely related to the S content of the dung. The S not
mineralized was considered to be due to the resistance of the organic matter to
decomposition, rather than to organic matter decomposition and subsequent
immobilization. Dung mineralization rates are more rapid in crushed samples than in
pellet samples, which intum, are greater than pad samples (Bromfield and Jones , 1970;
Rowarth, 1987) and similarly arthropods such as earthworms (Barley, 1964) and dung
beetles (Bomemissza and Williams, 1970) can be expected to enhance the
mineralization rate through the action of communition of the material and transporting
it to the vicinity of microorganisms (Macfadyen, 1978). Similarly dung decomposition
rates are slow in dry conditions compared to cold moist conditions. For example
Hilder (1966) reported sheep pellets remaining for 10 weeks in cold moist conditions
and for unspecified longer periods in dry conditions in Armidale. However in New
Zealand, Rowarth (1987) reported that pellets samples decompose within 20 days by
physical disappearance in cold moist winter periods, while longer periods (up to 60
days) were observed during summer. Even though much work has been done to study
the decomposition and availability of dung phosphorus, little work was done to study
the decomposition and fate of dung S in New Zealand under pastoral conditions.

39
2.5.3.4 Urine in the Sulphur Cycle
Most (70-90%) of the urine sulphur is in the sulphate form (Kennedy, 1974), either
organic or inorganic. Non-sulphates in urine S is largely carbon bonded S. This is
largely comprised of cysteine, methyl mercaptans, ethyl sulphides, thiocyanates and
taurine derivatives.
Direct measurements of the distribution of urine by grazing animals are not available.
In the absence of any definitive data, various authors have accepted that the
distribution of urine is similar to that of dung (Petersen et al., 1956). The volume of
urine excreted by the grazing animals can be expected to vary with the moisture
content of the diet. Quinn (1977) reported urine outputs of 1-3 litres sheep·1 day·1 on
pasture of similar quality. Even though much work has been done to study the
availability of urine N and K, no precise information exists on the availability of urine
S to plants and its leaching losses under field conditions. Nguyen and Goh ( 1990)
indirectly calculated the amount of urine S lost by leaching (see section 2.5.3.3).
2.5.4 Losses Through Animal
The main losses of S through animal are in animal products and through the transfer
to unproductive areas.
2.5.4.1 Losses in Animal Products
Only a small proportion of ingested S (usually less than 1 5%) is used by animals in
the production of body tissues, milk and wool. The remainder (85%) is returned to
the soil in the animals' excreta (During, 1984; Wilkinson and Lowery, 1973; Till,
1 975).

40
2.5.4.2 Losses by Transfer
Large losses of S from the cycle (Fig.2. 1) through the uneven return of dung and urine
occur in grazed pastures. For example in hill country, excreta transfer to the areas of
stock camps from the areas of steep and moderate slopes is well documented (During,
1984; Gillingham, 1978; Saggar et al., 1990a).
2.5.4.3 Losses of Sulphur from Dung and Urine Patches
Goh and Nguyen (1991) estimated indirectly leaching losses of S from urinary patches
around 70-80%. No direct measurements have been made to quantify such losses for
either dairy or sheep grazed pastures in New Zealand.
The effect of freshly returned dung and urine on the availability of soil S to plant
uptake and losses by leaching and the mineralization potential of soil organic S has
also received little attention in New Zealand. The level of adsorbed sulphate can be
reduced in the vicinity of a dung patch because dung increases the pH of the soil and
in addition to S it contains phosphate and organic anions which compete for sulphate
adsorption sites in the soil, all of those factors increased the leaching losses (During
and Martin, 1968).
2.6 SUMMARY AND CONCLUSION
From this review it is clear that most agricultural soils have S contents ranging from
50 to 1000 mg S kg-1 soil. In New Zealand, agricultural soils contain 240 to 1 360 mg
S kg-1 soil of which more than 90% occurs in the organic fraction. The inorganic S
fraction is small because either sulphate can be immobilized into the soil organic
matter or leached down the profile. The organic S fraction is the major, long term
source for plant uptake and the rate of mineralization from and immobilization to
organic matter are the key processes in the S cycle. Temperature, moisture, pH and
availability of substrate are the main factors which affect the mineralization and
immobilization processes. The rate of mineralization or immobilization also

4 1
determines the size of the plant available pool at any one time. B y establishing the
relative efficiencies and inefficiencies of these processes in the S cycle it may be
possible to identify the pools and processes which limit the recycling of S to the plant
available pool in agricultural systems. Such information is necessary for predicting
S fertilizer requirements.
Even though mineralization of the organic S in the soil is considered to be the major
long-term source for plant uptake and presumably for leached sulphate, no detailed
studies have been done to quantify the proportion of mineralized S taken up by plants
and lost by leaching under field conditions. The relationship between S and N
mineralization has also not been studied for grazed pasttires for which superphosphate
is the main fertilizer applied to stimulate legume growth and the source of N is the
fixation of atmospheric N2 by the legumes.
Further research is needed to study the relationship between the rates of
mineralization of S and N for legume based grazed pastures and their contribution to
plant uptake and losses under field conditions. To achieve this, it is necessary to know
the spatial variability of mineralization rates in field soils. It is possible that the
potential of field soils to mineralize S and N could be identified by conducting
laboratory incubation studies. Field mineralization studies could then be established
in areas that show different mineralization potentials.
In order to measure the net mineralization of S and N under field conditions, the
amounts of soil sulphate and mineral N, the amounts of S and N removed by pasture
and the amounts of S and N lost by leaching need to be measured simultaneously. The
soil sulphate and mineral N pools and plant uptake of S and N can be measured
directly by taking soil and pasture samples, respectively, over time, but for measuring
leaching losses directly, field techniques which measures leaching of S and N in situ
in undisturbed soil need to be developed. The net mineralization of S and N could
then be calculated.
42
The literature review indicated that the level of nutrient inputs into grazed pastures
influences pasture production, soil organic matter levels and therefore the rate of
cycling of S and N. The field technique should be suitable for studying the effect of
previous fertilizer applications on the fate of mineralized S and N and by use of
radioactively labelled sulphur fertilizer would allow the fate of fertilizer and native
soil S could be distinguished. Likewise the effect of fresh excreta return on the
mineralization of S and N and their fate can also be studied. By establishing all the
above information it is possible that the major origins of the S being taken up by
pasture and lost by leaching can be identified.
The objectives of this thesis were therefore to study the mineralization of S and N in
grazed pastures and the origins of the sulphate being leached from these grazed
pastures.

43
CHAPTER-3
LABORATORY INCUBATIONS TO DETERMINE THE POTENTIAL OF
SOILS TO MINERALIZE SULPHUR AND NITROGEN
3.1 INTRODUCTION
A review of current literature (Chapter 2) indicates that at present the use of imported
S fertilizer on pasture soils may be inefficient with large leaching losses occurring in
certain circumstances. For example, recently Saggar et al. (1990a,b) predicted that
about 14 to 77% of S applied as single superphosphate (SSP) to sheep grazed pasture
in North Island of New Zealand was lost by leaching depending upon the rate of SSP
application. In a South Island study Nguyen and Goh ( 1990) showed that when the
SSP application rate was increased from 186 to 372 kg SSP ha-1 year·1 about 50% of
the additional S applied was lost by leaching. At present few programmes to achieve
reduced losses can be introduced because little detailed information exists on the
possible origins of this leached sulphate. For example sulphate can be leached directly
from fertilizer, sulphate in dung and urine patches and the mineralization of soil
organic S, which has been accumulated over the preceding years by regular application
of SSP. By identifying the main origins of leached sulphate, the potential for reducing
S fertilizer input by changing, for example, the form of S or the time of application
can be investigated.
Whereas information on the direct losses of sulphate by leaching from recently applied
SSP under field conditions (Smith et al., 1983) and sulphate losses by leaching from
urine patches using repacked columns (Hogg, 1981) are available, no precise
information exists on the amount of sulphate mineralized from soil organic matter and
the percentage of this fraction that could potentially be lost by leaching.
It has been shown that large increases in soil organic matter occur in soils that
developed under legume based pastures by regular application of fertilizer under
Australian conditions (Donald and Williams, 1954; Williams and Donald, 1957;
Barrow, 1969). This accumulation increases the more labile soil organic S and the
mineralization potential of the soil for S. It is expected that the same build up of
more labile fractions of soil organic S occurred in New Zealand soils, because

44
fertilizer was applied to increase the pasture development index. When mineralized,
this labile S may be an important source of leached S.
To establish the potential losses of sulphate caused by leaching of recently mineralized
soil organic S, a laboratory incubation study was conducted to measure S
mineralization rates for soils where S had accumulated from different SSP application
histories over the preceding 13 years and different rates of animal excreta returned to
soils due to the effect of topography on animal behaviour. Since both carbon( C) and
nitrogen(N) mineralization rates influence the rate of net S mineralization (McGill and
Cole, 1981), the rates of mineralization of these two macronutrients were also
measured. As part of the study a comparison of open (leached) and closed
(unleached) incubation system was made because the amounts of S and N mineralized
are affected by the type of incubation system used (Maynard et al., 1983).
3.2 MATERIALS AND METHODS
3.2.1 Description of Soils
Eight surface soil samples (0-75 mm) (5 kg each) were taken from two slope
categories, low (0-12°) and medium (13-26°), within each of four farmlets on
Ballantrae, the Hill Country Research Station of DSIR, Grasslands, 20 kms north-east
of Palmerston North in the southern Ruahine range. The total amounts of fertilizer
P and S that had been added to each of the four farmlets and their codes are given in
Table 3. 1 . Two farmlets had received SSP at rates of 576 (HF) and 125 (LF) kg ha-1
year-1 from 1975 to 1980 and 375 and 125 kg ha-1 year-1 from 1981 to 1988 and the
remaining two farmlets received SSP at rates of 576 (HN) and 125 (LN) kg ha-1 year-1
from 197 5 to 1980. A full description of the soils, pastures, animals and climate of
the farmlets were given elsewhere (Lambert et al., 1985a,b; 1988; 1990; Saggar et al.,
1990a). The soils were yellow-brown earth to yellow-grey earth intergrades (Typic
Dystrocrepts) with P retention <30% and pH values of <6.00. Several of the physical
and chemical properties of the

Table 3.1 Amounts of P (kg ha-1) and S (kg ha-1) applied as single
superphosphate to each farmlet from 1975-1988.
Farmlet Phosphorus Sulphur
4 5
Total
1975-80 1981-88 1975-80 1981-88 1 975-88 1975-88
HF 3 1 1 270 414 360 5 8 1 774
LF 68 90 90 120 158 210
HN 3 1 1 NIL 414 NIL 3 1 1 414
LN 68 NIL 90 NIL 68 90

46
soils at the time of sampling are given in Table 3.2. The field moist soils were
sieved to pass through a 2 mm sieve and stored at 4°C until required.
3.2.2 Incubation Techniques
Soil (25g oven dried) was placed in a 120mm length PVC pipe with an inner diameter
of 22 mm that was covered at the bottom with a fine nylon mesh of size (200 Jlm).
Triplicate soil columns were established for each of the eight surface soils. The soil
moisture content was adjusted to 75% of the laboratory determined field capacity
(Table 3.2). Soils were incubated under aerobic conditions in 1 litre preserving jars
using the technique developed by Ruz (Ruz et al. , 1988). The incubation system is
illustrated in Fig.3. 1 . The carbon dioxide (C02) respired was absorbed in 10 mls of
1M NaOH kept in a small vial inside the jar. An air pressure equalizer in the form
of a balloon was connected to the jar. When the balloon collapsed due to the
consumption of oxygen (02) by soil micro-organisms, 02 was supplied from outside
until the balloon reinflated. The preparation of soil columns and the incubation
conditions were the same for both 'open' and 'closed' systems. The incubation was
continued for 140 days at a temperature of 18-20°C.
3.2.3 Leaching Procedures
After packing the soil columns and before incubation, the soil columns used for the
'open system' were leached with 0.01M KCl at a soil:solution ratio of 1 :5 to remove
inorganic nitrate(N03-) , ammonium(NH/) and sulphate(S04 =) from soil solution.
During the 140 day incubation these columns were leached at 14 day intervals with
0.01M KCl, at a soil:solution ratio of 1 :5, and the concentration of NQ3-, NH4+ and
S04= in the leachate measured. After each leaching excess water was removed from
soil cores by vaccuum filtering by placing the cores on filter paper suspended on a
scintred glass filter. A neutral solution, 0.01M KCl was preferred over a low pH
solution of 0. 15% CaC12 which has been used by other workers (Barrow, 1961a;
Maynard et al., 1983). For the last two leaching events the soil columns had
compacted and leaching took upto 1 day for some cores.

Fig. 3 . 1 Incubation System Used in the Experiment
Air Pressure Equalizer (Balloon)
10 mls of lM NaOH -++--€f.':::::::
Balloon for Supplying Oxygen
..........,.-+-+--- Soil in PVC Pipe
4 7
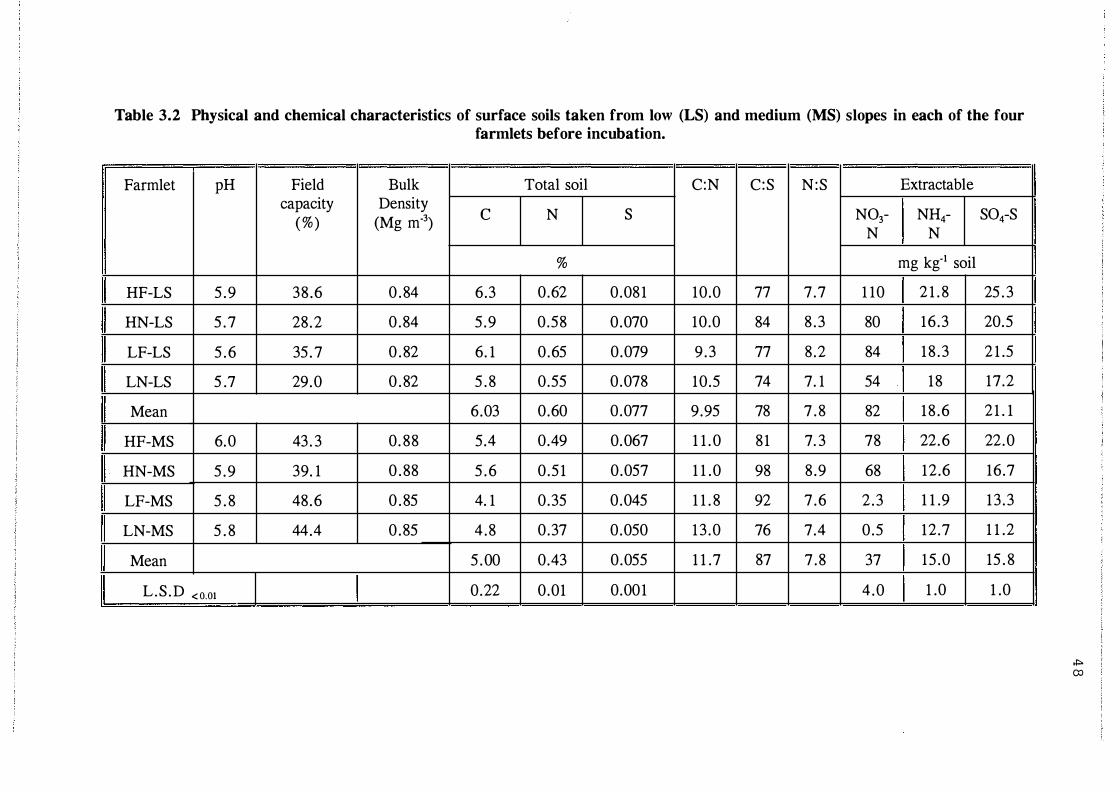
Table 3.2 Physical and chemical characteristics of surface soils taken from low (LS) and medium (MS) slopes in each of the four farmlets before incubation.
-- -� Farmlet pH
HF-LS 5 .9
HN-LS 5 .7
LF-LS 5 .6
LN-LS 5 .7
Mean
HP-MS 6.0
HN-MS 5 .9
LP-MS 5 . 8
LN-MS 5 . 8
Mean
L.S .D <o.o1
Field capacity
(%)
38 .6
28.2
35 . 7
29.0
43 . 3
39. 1
48.6
44.4
Bulk Total soil Density c N (Mg m-3)
%
0 .84 6.3 0.62
0 .84 5 .9 0.58
0 . 82 6. 1 0 .65
0 . 82 5 . 8 0.55
6.03 0.60
0. 88 5.4 0.49
0 . 88 5 .6 0 .5 1
0 . 85 4. 1 0 .35
0 .85 4 .8 0.37
5 .00 0.43
0.22 0.01
C:N C:S N:S Extractable
s N03- NH4- S04-S N N
mg kg-1 soil
0.081 10.0 77 7 .7 1 10 2 1 . 8 25 . 3
0.070 10.0 84 8 .3 80 16 .3 20.5
0.079 9 .3 77 8 .2 84 18 .3 2 1 .5
0.078 10.5 74 7. 1 54 18 17.2
0.077 9.95 78 7 . 8 82 18 .6 21 . 1
0.067 1 1 . 0 81 7. 3 78 22.6 22.0
0.057 1 1 .0 98 8 .9 68 12.6 16.7
0.045 1 1 . 8 92 7 .6 2 .3 1 1 .9 13 .3
0.050 13 .0 76 7.4 0 .5 12.7 1 1 .2
0.055 1 1 .7 87 7 .8 37 15 .0 15 . 8
0.001 4 .0 1 .0 1 .0
,j:::. (X)
49
The use of 0.0 1M KCl also avoids the potential precipitation of calcium sulphate that
can occur with 0. 15% CaC12 (Tabatabai and Al-Khafaji, 1980). In the closed
incubation system the soil columns were not leached prior to and during incubation.
3.2.4 Analytical Measurements
The soil pH was measured with a soil:solution (water and 0.01M KCl) ratio of 1 :2.5
using a glass electrode. The difference in pH values between water and 0.01M KCl
were very small ( <0.01 pH unit) ; values reported were obtained with water. Soil pH
measurements were made at the start and at the end of the incubation study.
The total S in the soil was determined by the method of Steinberg et al. ( 1962). The
S04= formed was reduced with hydriodic acid mixture to hydrogen sulphide which was
determined colorimetrically using a methylene blue finish (Johnson and Ulrich, 1959).
Organic ester-S (HI-reducible S) in the soil was determined by the method of Freney
et al. ( 1969). The difference between the ester-S and the initial calcium phosphate
extractable S04= value was equal to organic ester-S. The C-bonded S was determined
by the difference between the total organic S and the organic ester-S .
The total soil N was determined by Kjeldahl digestion and the NH/ formed was
measured using a Technicon Auto Analyzer (Technicon, 1976).
Pre- and post- incubation extractable N03- and NH/ were determined by extracting
the soil with 2M KCl at a soil:solution ratio of 1 : 10 for 1h; the N03- and NH4+
concentrations in the extract were measured by the methods of Downes ( 1978) and
Technicon ( 1976) using a Technicon auto analyzer.
Pre- and post- incubation extractable SO/ contents of soil were determined by
extracting soils with 0.04M Ca(H2P04)2 (Searle, 1979), and S04= concentrations in the
extract were measured as above. The total soil carbon was measured using a Leco
induction furnace.
The total S in the 0.01M KCl leachate from the open system was measured by
evaporating 50 mls of solution to dryness and digesting with sodium hypobromide
(Landers et al. , 1983). The S04= in the digest was determined as above. The
difference between the total S and the S04= S was attributed to C-bonded S.

3.2.5 Presentation of Results
50
The net mineralization of C, N and S and change in HI-reducible S for the 140 day
incubation period was calculated as follows for the open system
Carbon: The amounts of C02 released during 140 days of
incubation.
Sulphur: The amounts of S leached from soils during the 140
days of incubation, plus the difference between the
amounts of Ca{HzP04)2-extractable S (post and prior to
incubation).
Mineralized S (mg kg-1 soil)= Amount of S leached+extractable SOiFinal- Initial)
Nitrogen: Same as S.
Ester sulphate-S: The difference between the ester sulphur
(HI-reducible S) before and after
incubation.
Since the soils were not periodically leached in the closed system, the net
mineralization of S and N was calculated as the difference between initial and final
extractable soil S and N. For mineralized C and ester sulphur (HI-reducible S) the
measurements were same as the open system.
Data representing total soil C, N and S , soil S04= and mineral N, the net
mineralization of C, N and S and the decrease in HI-reducible S were subjected to
analysis of variance to determine the simple and interactive effects of fertilizer history
and land slope. Least significance differences were calculated to compare treatment
effects.
3.3 RESULTS AND DISCUSSION
3.3.1 Characteristics of the Soils Prior to Incubation
In all four farmlets, soils from low slopes contained more C, N and S than that of
medium slopes (Table 3.2), even though both slopes within each farmlet had received
the same amount of S, as calcium sulphate in SSP for the preceding 13 years (Table
3. 1). In addition to containing greater amounts of soil C, N and S , the C/N and C/S
5 1
ratios of low slopes were lower than those of medium slopes. These trends in soil
nutrient content and ratios are due in part to the proportionately greater amounts of
dung and urine returned to areas of low slopes (0- 12°) (Gillingham and During, 1973;
Gillingham, 1978) and to the fact that the C:nutrient ratio of excreta is narrower than
the consumed pasture (Boswell, 1983) and plant litter returns.
Soils from low slopes contained more extractable N03- and S04= than the medium
slopes (Table 3.2). This was particularly marked for N03- in LF and LN farmlets
where the soil N03- concentrations of the low slopes were 84 and 54 mg kg-1 soil,
while in the medium slopes they were only 2.3 and 0.5 mg kg-1 soil, respectively.
Differences in inorganic S levels between the HF and LF farml,ets were greater on
medium than low slopes. On low slopes the amount of soil S accumulation resulted
from both fertilizer S inputs and an above average return of excretal S per unit area.
Accumulation of soil S on the medium slopes, where excretal return of S is less than
S consumed by the grazing animal, is dependent primarily on S inputs from fertilizer
(Saggar et al. , 1990a). Both HI-reducible S and C-bonded S were present in greater
amounts in soils of the low slopes (Table 3.3) again reflecting the above average
excretal return rates to these land units. The observed increase in soil ID-reducible
S in soils of low slopes could be caused by ester formation due to short term excesses
of soil so4= mainly originating from dung and urine deposition, in which
approximately 3-21% and 82-100% of total S respectively, is S04= (Nguyen and Goh,
1990). Added S04 = can be incorporated into both the ID-reducible S and C-bonded
S fractions (Freney et al., 1971 ; 1975; Schindler et al., 1986), with more entering the
ID-reducible S fraction when C:S ratios of microbial substrate are narrow (Ghani et // al., 1988). In the long term however, most added S04= is incorporated in to C-bonded
S fractions (Donald and Williams, 1954).

Table 3.3 Amounts of HI-reducible and C-bonded S before and after
incubation in the open system for soils taken from four farmlets.
Farmlet ID-reducible S C-bonded S *
52
Initial Final Decrease Initial Final Decrease
mg S kg-1 soil
HF-LS 146 107 39 638 638
HN-LS 100 80 20 579 570
LF-LS 144 1 13 3 1 625 617
LN-LS 1 1 8 95 23 644 632
Mean **
127 99 3 1 .2
HF-MS 91 84 7 557 545
HN-MS 77 56 21 476 460
LF-MS 64 47 5 372 369
LN-MS 59 95 12 429 419
Mean ** 73 62 15.3
L.S.D 5.5 2.8 4.9
p<O.Ol
* L.S.D was not calculated because the values were the difference
between the total and the ID-reducible S .
* * Significance at p<0.01 for land slope.
nil
9
8
12
12
16
3
10

3.3.2 Effect of Incubation System on Organic Matter
Mineralization
53
Four main differences in the amounts of C, N and S net mineralized in the eight soils
were found between the open and closed incubation systems. The results discussed
in this section are the means of 24 soil cores, comprising 3 replicates of each soil for
each incubation system.
Firstly, the amount of S and N net mineralized were greater in the open than in the
closed system (Fig.3.2). Either less S and N were mineralized in the closed system
or because the S and N mineralized were not removed by leaching they were
reimmobilized by microorganisms.
The latter explanation is probably correct because more C02 was evolved from the
closed system indicating greater microbial activity. In a similar incubation study of
Canadian Prairie soils Maynard et al. ( 1983) also found more S and N net mineralized
in open than in closed systems.
Secondly in the open system more NH/ was net mineralized than N03- while in the
closed system the reverse occurred (Fig.3.2). The apparent lack of nitrification in the
open system can be explained by either a limited supply of 02 or an elevated chloride
concentration during the biweekly leaching. Both inhibit the activity of nitrifying
bacteria (Darrah et al., 1985). As little as 1 1 Jlmoles Cl- g-1 soil inhibits the
nitrification process (Darrah et al., 1985). Concentrations of upto 8 umoles g-1 soil of
er would have been found in the columns during the leaching process. The formation
of NH/ can also be explained in part by the relatively coarse soil aggregates
containing soil organic matter that are formed in the pasture soils. It is possible that
mineralization occurs rapidly within these particles and micro regions of anaerobicity
are created resulting in the accumulation of NH/ (Swift, 1977). All of the above
factors may be responsible for the apparent slow rate of nitrification observed in the
study. Associated with the build up in NH/ in the open incubation system was an
increase in the pH while in the closed system the pH decreased (Fig.3.2). These pH
changes are expected considering that

� 4� {J) v
.:::L "--. 2 z {)) 1 E
!3j .:::.t. 2 "--.
111
Fig.3.2 Effect of incubation system on the net-mineralization of S, N and C, change in HI-reducible S and pH during 140 days of
incubation in soils from all four farmlets (see Table 3 . 1 for full description of symbols). Vertical bars=L S D,p<O.Ol .
N itro gen Su l phur C arbon
�1��ll!ll!�������:i!lilil1llllf1lli 0 1 · - 2 0 (f) (f)
{J) {J) .:::.t. 1 .:::.t. 1 "--. 0- 1 (/)
I {J) {J) E E
Ol Open Closed O p en C l osed O pen C l osed
Ester s u l phate - S Chan g e i n p H 1 0. 0 Nitrate
(f) -+--J 1!1 Ammonium · -c :l -0.5
I - 1 0..
- 1 . 5 -2
O p en C l osed O p en C l os e d V\ .j::.

55
ammonification generates net OH ions and ammonification and nitrification generates
net H+ ions (Bolan et al., 1991).
Thirdly more C was released in the closed than open system despite the fact that net
mineralization of S and N was less in the closed system. The C02 evolved was
consistently greater in the closed system (data not shown) than in the open system
throughout the incubation period of 140 days. As discussed earlier, either higher
chloride levels or lower 02 concentrations in the open system may have caused
reduced microbial activity. Alternatively, while recently mineralized S and N in the
open system was removed by biweekly leaching, in the closed system mineralized S
and N remained available for additional microbial growth and subsequently more C02
was released. In both open and closed systems the C02 evolution peaked between day
70 and 100 and then it decreased. The incubation was stopped at 140 days because
increases in column packing density caused water to pond for approximately 1 day
before leaching through the open system. This was seen as an undesirable change and
the experiment was terminated.
Finally, the decrease in ester sulphur (Ill-reducible S) was greater in closed than in
the open system. This again reflects a greater rate of mineralization of S in the closed
incubation system. This associated with the greater C02 release in the closed system,
supports the view that more organic S was turned over (mineralized and
reimmobilized) in the closed system.
3.3.3 Mineralization Measured Using the Open Incubation
System
Although there was more microbial activity in the closed system mineralization was
more easily quantified in the open system because the accumulated net mineralization
of S and N can be measured in the open system. The remaining discussion
concentrates on the open incubation system. During the 140 days incubation period,
1 1 to 25 mg S kg-1 soil (2 to 3% of the total organic S) and 25 to 65 mg N kg-1 soil
( 1% of the total organic N) were mineralized in the open incubation system (Table
3.4). The total amounts of soil

Table 3.4 Net mineralization of carbon, nitrogen and sulphur and the change in pH for 140 days of incubation for the soils taken from four farmlets (mg kg·1 soil).
---Farm let Sum of amounts in 0.01M KCI
leachates·
N03-N �-N S04-S
HF-LS 139 19 29 HN-LS 56 54 17 LF-LS 82 62 20 LN-LS 4 1 59 20 Mean 80 49 21
HF-MS 93 21 27 HN-MS 46 46 16 LS-MS 8 27 16 LN-MS 6 47 13
Mean 38 35 18 L.s.n·· 1 . 1 1 .6 1 .23
---------·-·····-···-·--··-·-····--····-----� -----·········-�--�-----------Amount extracted post Net mineralization during
incubation incubation
N03-N �-N S04-S N s c
19 5.0 21.7 50 25.2 2355 20 2.4 14.8 37 15.3 1768 21 2.2 19.4 65 18.1 2264 22 2.2 13.6 5 1 16.0 2138 21 2.9 17.4 5 1 17.7 2131 18 5.9 13.7 38 18.3 2493 1 1 2.0 13.2 25 12.2 1826 6 2.7 10.0 29 12.4 . 2593 2 2.2 10.0 28 11 . 1 2401 9 3.2 1 1. 1 30 12.6 2328
0.86 0 1 . 1 5.0 LO 15.6
* Amount of mineral N and S04-S leached before incubation was included, ** Significance at p<O.Ol
C/N C/S Final Increas pH - e in
pH
47 93 6.4 0.5 48 1 16 6.5 0.8 35 . 125 6.3 0.7 42 134 6.2 0.5
66 136 6.3 0.3 72 150 6.6 0.7 89 209 6.5 0.7 85 216 6.2 0.4
Ul 0\

57
carbon released varied from 1768 to 2593 mg C kg-1 soil. This constitutes 3 to 6%
of the total soil organic C (Table 3.4). The amounts of N and S mineralized were
much lower than those estimated by multiplying the amount of respired C by both
C/N and C/S ratios of the total soil organic matter. Unlike mineralized C (COz), the
N and S mineralized (NH/, N03- and SO/) are not lost from the soil in gaseous
forms and therefore remain susceptible to immediate reimmobilization by soil
microorganisms.
The m -reducible S content of the soil had decreased by the end of the incubation
period by 5 to 39 mg kg-1 soil (Table 3.3). Thus a significant amount of this S
fraction was mineralized during the incubation period. Other studies (Freney et al.,
197 1 ; Goh and Tsuji, 1979; McLaren et al., 1985; Ghani et al., 1988) have shown that
the ID-reducible S fraction is an active pool, at least in short term S cycles. In
contrast the net decreases in the larger C-bonded S fraction were much smaller (Table
3.3), indicating that, of the ester-S that was mineralized most was reimmobilized into
the C-bonded S fraction.
3.3.4 Fertilizer History
The amounts of S mineralized were greater in soils from two farmlets (HF and LF)
that had continuously received SSP for the preceding thirteen years (Fig.3.3) indicating
that recently applied fertilizer contributes significantly to the readily mineralizable soil
organic S pool. Greater amounts of S mineralization are also associated with a
narrower soil C/S ratio (Table 3.2). Barrow (1961a) has already reported that SSP
application increased the mineralization of S in Australian soils by increasing the
fraction of easily decomposable soil organic matter. The extent of N mineralization
was similarly related to S mineralization (Table 3.4; Fig.3.3), even though the amount
of N mineralized in all four farmlets would be indirectly influenced by fertilizer
application (Fig.3.3). For example, SSP application increased the production of the
legume component of the sward (Lambert et al., 1990) which could increase the
fixation of atmospheric nitrogen by root nodules. Thus more N accumulated in the
soil organic matter and subsequently more nitrogen was mineralized. Similarly the
soils from HF and LF farmlets respired more C02 than the HN and LN farmlets which
is again probably an indirect effect of the application of SSP (Fig.3.3).

Fig.3.3 Effect of fertilizer application on the net mineralization of S, N and C and the decrease in HI-reducible S during 140 days of
incubation in the open system for soils from all four farmlets (see Table 3.2 for full description of symbols). Vertical bars=L S D,p<O.Ol .
(J) � := 3 '-.... a 01(1) 2 E
(J) 1 50 � -'-...... "o (J) (f) 1 0 E
N i tro gen
HF HN LF
C arbon
H F H N LF
Su l phur
LN HF HN LF LN
H I - Su l phur
LN HF HN LF LN U1 Q:l
59
Even though fertilizer history influenced the accumulation of ID-reducible S, and
considerable amounts of ID-reducible S were mineralized during the incubation,
fertilizer history had no effect on the change in this fraction observed during the
incubation (Fig.3.3). This might be due to rapid transformations of soil organic S, i.e.
mineralization of ID-reducible S fraction and immobilization as carbon bonded S
fractions during the incubation. Such transformations have been noted by other
authors (Freney et al., 197 1 ; 1975; Mc:Laren and Swift, 1977; Maynard et al., 1985;
N guyen and Goh, 1990).
3.3.5 Topography
The amounts of N and S mineralized were greater in soil samples taken from low
slopes than medium slopes (Fig.3.4). In contrast the amounts of C02 evolved, an
indicator of the microbial activity, was significantly greater in medium than low slope
soils. The differences in the amounts of N and S mineralized can be explained, in
part, by the differences in the C/N and C/S ratios of soil organic matter on the two
slope classes if one assumes that mineralization is controlled by carbon availability
and not N or S limitation. These were lower on low slopes (Table 3.2) indicating that
the amounts of potentially mineralizable N and S in organic matter were greater in the
soil from low slopes. This is due in part to the fact that more dung and urine were
returned to the low slope areas through animal transfer (Saggar et al., 1990a), and to
the fact that the dung and urine have a narrower C:nutrient ratio than plant litter
(Boswell, 1983). Infact Barrow (1961b) showed that the proportion of S mineralized
from faeces is greater than proportion of S mineralized from plant material added
directly to the soil. Higher C content of soils from medium slopes may lead to
increased reimmobilization of mineralized N and S. Several authors (e.g. Saggar et al., 1981b; Maynard et al., 1985; Mc:Laren et al., 1985; Ghani et al., 1988) have
already shown that the addition of a C source increases the immobilization of soil
solution sulphate. Evidence for greater S04 = immobilization during the incubation of
the medium slope soils is provided by the smaller net decrease in ID- reducible S per
unit of C02 evolved from these soils.

Fig.3.4 Effect of land slope on the net mineralization of S, N and C and the decrease in HI-reducible S during 140 days of incubation in
open system for soils from all four farmlets (see Table 3.2 for full description of symbols). Vertical bars=L S D,p<O.Ol .
()) ..:Y. '-..,.. 0 ()) (f) E
� = 1 500 '-..,. 0 ()) (f) 1 000 E
50
N i tr o g en
MS
C arbon
LS MS
Su l phur
LS MS
I H I - Su l phur
LS MS 0\ 0

3.3.6 Relationships between C, N and S mineralized
61
A positive relationship exists between the amounts of N and S net mineralized during
incubation and the total soil N and S (r=0.739 and r=0.775) respectively (Fig.3.5a and
3.5b). This indicated that accumulation of N and S in soil organic matter and the
narrowing of the C:N :S ratios by the addition of fertilizer and/or plant litter and
animal excreta generally increased the mineralization of N and S. Some aspects of
this phenomena are already presented in the literature e.g. an increase in total organic
C and S contents increases the mineralization of S (Nelson, 1964), high organic matter
content, particularly from soils with low C/N/S ratios increases the mineralization of
S (Harward et al., 1962; Haque and Walmsley, 1972; Bettany et al., 1974; Kowalenko
and Lowe, 1975) and the nature of organic N and S in the soil (Tabatabai and AI
Khafaji, 1980).
From Figure 3.5c and 3.5d it becomes clear that the relationships between N and S
net mineralized and the C/N and C/S ratios of the soils from different sites are
curvilinear. For N, a simple relationship can be derived to show that the amount of
N mineralized (Nmin; mgN kg"1 soil) during the incubation can be related to the C/N
ratio of the soil by the equation
Nmin = Cc [k ( � soil ) - 0 . 4 ( � mic) ]
where C1 = C02 evolved(mg kg·1 soil)/0.6 (the calculated amount of soil carbon turned
over, k, is a constant which determines the fraction of soil organic matter
mineralized); (N/Cson) is the bulk soil N/C ratio, the constant 0.4 provides for the
assumption that the microorganisms utilize only 40% of the carbon mineralized for
growth, the remaining 60% is released as C02 (Paul and Vanveen, 1978); and the
(N/Cmic) is the N/C ratio of the microbial biomass and is estimated to be 0 . 1 1 by
assuming that biomass consists of 20% bacteria and 80% fungi (Shields et al. , 1974)
and the C/N ratio in bacteria is on average 5 and in fungi is 10 (Follet et al., 1981).
This relationship is similar to the

-o := <1> 0
.� en 0 0'1
Fig.3 .5a Relationship between nitrogen mineralized and the total soil nitrogen during 140 days of incubation in open systems for soils from all four farmlets
80
60
Nmin= 99 . 2N r- 1 0 . 7 R = 0 . 739
*
�� 40 ·- Z E O'I z E
20
0 �--------+---------�--------�--------� 0.3 0.4 0.5
Tota i-N{%) 0.6 0.7 0'\
l'V
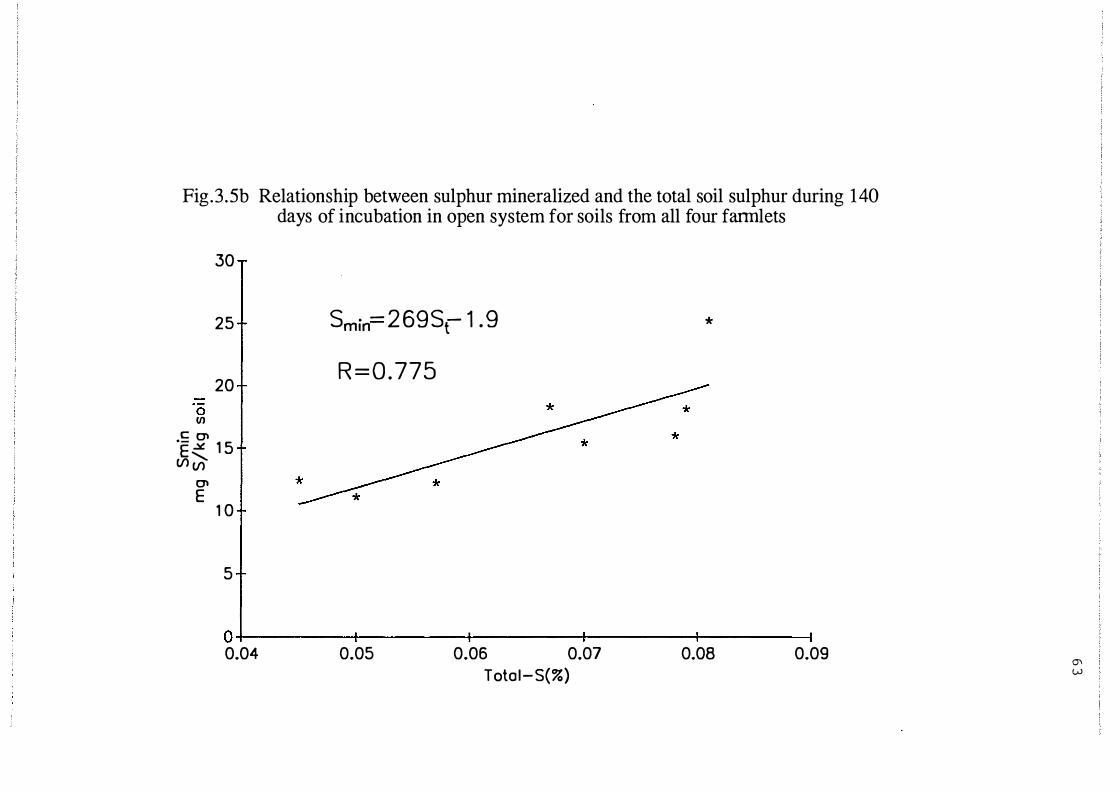
Fig.3.5b Relationship between sulphur mineralized and the total soil sulphur during 1 40 days of incubation in open system for soils from all four farmlets
30
25
20 0 (/)
.� Cl E � 1 5
(/) .......... (/) Cl E
1 0
5
Smin- 2 69St- 1 . 9 *
R = 0 . 775
0 +-------�---------r--------+-------��------� 0.04 0.05 0.06 0.07 0.08 0.09
Tota l-S(%) 0\ w

IQ) >
0.0 1 8
0.0 1 6
0.0 1 4
g 0.0 1 2 '::I ...... � 0.0 1
'U Q)
.� 0.008 0 '-� 0.006 E z 0.004
0.002
Fig.3 .5c Relationship between nitrogen mineralized per unit of carbon turnover (mg N/mg C) and the soil N:C ratio during 140 days of
incubation in open system for all four farmlets
Nmin Ct � 2 . 2 (N/CJoi l -0 .069 ! *
R2
0.776 *
* *
*
0 �--------�---------+--------�--------� 0.07 0.08 0.09
N/C ratio 0. 1 0. 1 1 0'\
,!:>.
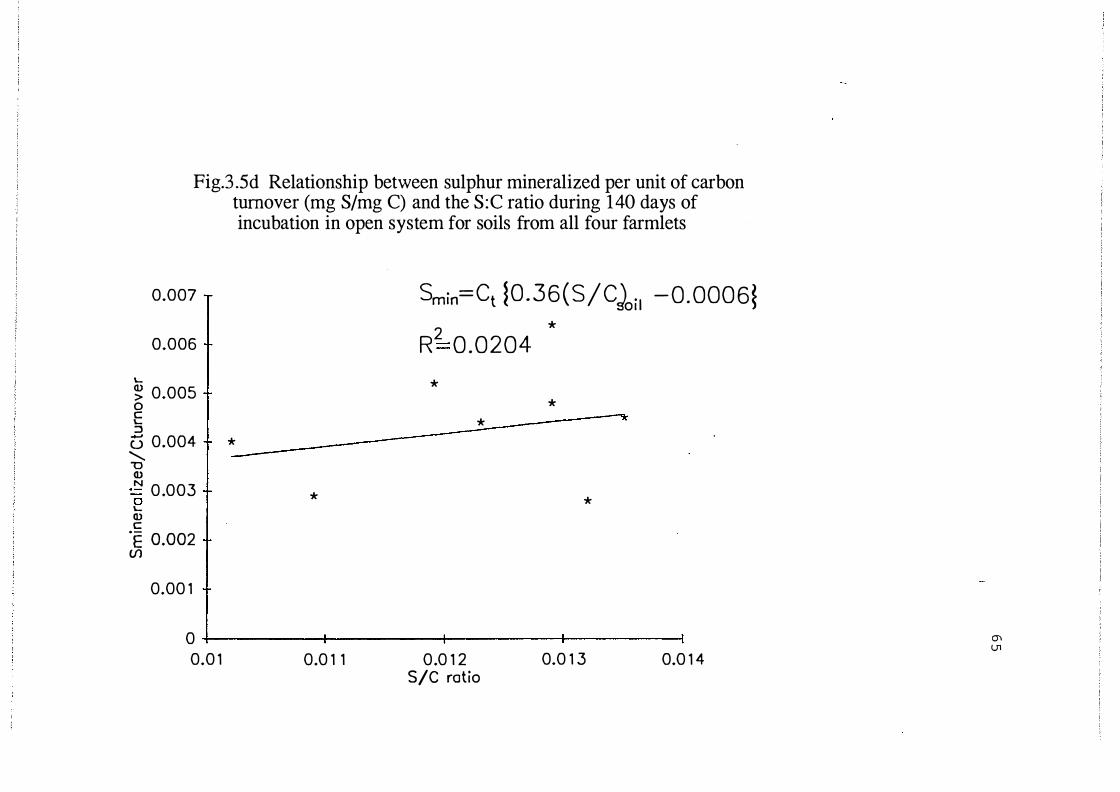
Fig.3 .5d Relationship between sulphur mineralized per unit of carbon turnover (mg S/mg C) and the S :C ratio during 1 40 days of incubation in open system for soils from all four farmlets
0.007 T Smin=Ct �0 .36 (S/C�oi l -0.0006�
R2 0 .0204
* 0.006
'- * � 0.005 0 * c '- * """'A" ::J u 0.004 *
......... "0 Q.) N -� 0.003 T * * '-Q.) c .E o.oo2
Vl
0.00 1
0 0.0 1 0.0 1 1 0.0 1 2 0.0 1 3 0.0 1 4
S/C ratio
(j\ Ul

66
relationship used by Fenchel and Blackburn (1979) and modified by White ( 19 80) to
describe phosphorus mineralization.
The curvilinear relationship provides a good explanation (:r=0.766) of N
mineralization (Fig.3.5c) in the different soil samples. When constrained by the
assumptions listed above, the relationship indicates that the mean NIC ratio of soil
organic matter mineralized is approximately 2.23 times (k=2.23) the bulk soil NIC
ratio.
A similar relationship, derived to explain the observed S mineralization gave a poor
explanation (i=0.0204) of the amount of S net mineralized, using the SIC ratios of the
soil samples and a value of 0.014 for the SIC ratio in microbial microorganisms
derived from Chapman (1987). The reason for this could be that some soil organic
S is mineralized irrespective of the soil microbial biomass demand for C. McGill and
Cole (1981) suggested that the rate and extent of S mineralization is less related to C
mineralization than N mineralization because S is also released from soil organic
matter by biochemical processes which can be envisaged as extracellular enzymatic
hydrolysis of organic ester sulphate (HI-reducible S). In support of this, it was shown
that a substantial decrease (8-26%) in the ID-reducible S occurred during this
incubation study (Table 3.3).
The ratios of C02-C evolved to N or S mineralized (35-89 and 93-216 respectively)
were greater than the total soil C:N and C:S ratios (9.3- 13.0 and 74-92 respectively)
of the eight soils. Either the C/N and C/S ratios of the readily mineralizable fraction
of the soil are greater than that of the bulk soil organic matter or a significant fraction
of the N and S mineralized was immediately reimmobilized as suggested earlier.
The ratio of N:S (2.0-3.6) mineralized was lower than that of the bulk soil organic
matter (7 . 1-8.9) suggesting again that soil organic N and S are mineralized at different
rates as noted by Kowalenko and Lowe (1975), or, relatively more N may be
reimmobilized while more S remains in the soil solution. Ball et al. (1982) have
already suggested that these hill country soils are N deficient with both plants and

67
micro-organisms strongly competing for mineral N supply. The results of this study
support this view and suggest that relative to S, N conservation is greater.
3.4 GENERAL DISCUSSION AND CONCLUSION
The results from this study have shown that the open incubation system with
periodical leaching of the soil during incubation offers an approach that simulates the
removal of S and N by plants and leaching losses of these two nutrients under field
conditions. In the closed incubation system mineralization can be greater but is not
measurable because mineralized S and N are subjected to reimmobilization. The
closed incubation system cannot be used to measure the accumulated net
mineralization of S and N without the use of isotopic tracers of these nutrients.
Carbon dioxide evolved alone overestimate the potentially mineralized S and N pool,
because for a given substrate of constant C to nutrient ratio the S and N not removed
by leaching are available for reimmobilization by microbial activity.
The study further showed that the rate of application of S and P fertilizer and the
continuity of application to legume based hill pasture and the land slope had a large
influence on the accumulation of N and S in soil organic matter and the amounts of
readily plant available (extractable) mineral N and S04=-S. In continuously fertilized
soils, organic matter had narrower C/N and C/S ratios than discontinuously fertilized
soils. The amounts of ester-S (HI-reducible S) and the fraction of the soil organic
matter that was ester S also increased under continuous fertilizer application.
Continuously fertilized soils mineralized more S and N to readily available forms than
soils from farmlets which had not received fertilizer in recent years. Most of the
mineralized S was derived from the HI-reducible S fraction of the soil organic matter
but some of the mineralized S were immobilized into the C-bonded S fraction of the
soil organic matter. The ratio of N to S mineralized was low when compared to the
N to S ratio of the soil organic matter. This suggested that N is conserved while S
is readily released to the soil solution and mineralized S may be more relatively
susceptible to leaching than mineralized N in these hill country pastures.

68
There were greater accumulations of S and N in soil organic matter on low slopes
than on medium slopes and mineralization of S and N were greater in soils taken from
low slopes when compared to medium slopes. This result was associated with the
narrower C to N and C to S ratios in the soils from low slopes. The narrower C:N
and C:S ratios of soils taken from low slopes mainly results from the greater
deposition of dung and urine on the low slopes. These results and others reported by
Barrow (1961b) support the conclusion that inputs of S through both fertilizer and
excreta will increase the amount and mineralization potential of organic N and S in
legume based pasture soils. In addition areas where more organic N and S accumulate
(e.g. low slopes which are animal camping sites) are likely to be sites of increased
N and S leaching.
These laboratory incubations clearly demonstrated that the potential of hill country
soils to mineralize and perhaps leach S varies with the previous fertilizer history and
land slope. The differences observed between different fertilizer histories and between
different land slopes on mineralization potential are such that field studies should be
undertaken to confirm that these differences are important under field conditions. The
results from this laboratory incubation study will be important in deciding where to
make S mineralization and leaching measurements in the field such that an accurate
quantitative assesment of these process can be made. In order to measure
mineralization under field conditions the losses of S and N by leaching and plant
uptake should be measured. For measuring leaching losses appropriate techniques
have to be developed, particularly for hill country pastures. The development of the
technique will be examined in Chapter-4 and the field study on the mineralization of
S and N will be examined in Chapter-5.2.

6 9
CHAPTER-4
DEVELOPMENT OF AN ION EXCHANGE RESIN TRAP LYSIMETER
SYSTEM FOR MONITORING SULPHATE SULPHUR LOSSES BY
LEACHING IN GRAZED HILL COUNTRY PASTURES.
4.1 INTRODUCTION
Laboratory incubation studies carried out in Chapter-3 established that there was
considerable variation in the capacity of hill country legume based pasture soils to
mineralize organic S and N to plant available forms. This variation appeared to be
dependent upon the previous fertilizer application rates and land slope which
influences the extent of excreta return to soil from grazing animals. In general high
pasture production under field conditions (Lambert et al., 1988; Mackay et al., 1988)
was associated with soils which showed high mineralization levels in laboratory
(Chapter 3). Under field conditions, however, the relationship between the extent of
S mineralization and its quantitative fate to either plant uptake and/or leaching losses
is poorly understood. Recent field studies (Saggar et al., 1990a) indicated that the
amount of S lost by leaching was the greatest from soils of low slopes which normally
received the greatest amounts of S in excreta. It has subsequently been shown that
these soils had high mineralization levels measured in laboratory incubations (Chapter
3). The study of Saggar et al. (1990a) did not identify the immediate origins of the
leached S, although it is evident that as well as direct leaching of input sulphate (SSP
and animal excreta) mineralized organic S was also a possible source of leached
sulphate. Further field studies are therefore required to establish the contribution from
each of these sources.
Mineralization studies conducted using incubation methods under controlled laboratory
conditions cannot be extrapolated to explain the field situation, where the rate of
mineralization can be changed by many factors such as variable soil temperatures,
moisture contents, the availability of substrate, differences in soil structure and the rate
of plant growth. Also the amount of sulphate formed in laboratory incubation studies
depends on the type of incubation system and experimental conditions used (Chapter
3) (Maynard et al., 1983).

7 0
In field studies both extractable soil sulphate and plant growth can be measured
direcdy by taking soil samples and harvesting the plant. Sulphur leaching losses can
be measured in various ways either direcdy or indirectly by balance studies. Smith
et al. (1983) measured the leaching losses direcdy by measuring the sulphate in the
drainage water collected from drained plots. Indirect balance methods are suitable for
long-term (10 years) studies but are of litde use for mineralization studies. Small
lysimeters have been used to determine the leaching losses of nutrient anions such
as S and N and cations such as Ca and Mg in low land soils (Steele et al., 1984). The
main draw back with lysimeter techniques is the necessity to collect and analyze large
amounts of drainage water from a large number of replicated plots on a continuous
basis. This difficulty could be overcome by the introduction of an ion exchange resin
trap in to the lysimeter. This would reduces the number of samplings required for a
particular period of time by trapping ionic nutrients from drainage water. Such a
lysimeter system would be particularly useful for monitoring nutrient losses from
remote hill country pasture.
The objective of the study reported in this Chapter was to design and test the
efficiency of an ion exchange resin trap-lysimeter system to remove sulphate from
drainage water using two undisturbed soil cores collected from low (LF) and high
fertility (HF) farmlets at Ballantrae hill country research station. The net
mineralization of S was also calculated by measuring the plant uptake and losses by
leaching of S from soils of both farmlets over a 45 day period.
4.2 MATERIALS AND METHODS
4.2.1 Construction of Lysimeters
The lysimeters (Fig.4. 1 ) were constructed by using 150mm diameter and 250mm long
galvanized steel cylinders, 150mm diameter plastic plates, L-joints (20mm internal
diameter), T-joints (25mm internal diameter) and 22mm internal diameter plastic pipes
normally used to construct domestic waste water system (Hardie IPLEX, Palmerston
North). A small hole (22mm diameter) was made near the edge of the plastic base

Fig .4. 1 The M i n i Lysimeter With Ion Exchange Resin Trap Used i n the
Sand Filter (2mm)
Nylon Sieve (50 1J.m)
t L - joint
Cap
---+---+-- Soil
Above - Ground Access Tube (22mm ID)
---1---+-- Galvanised Cylinder 15cm diameter 25cm length
�-+--- Plastic Base
T - joint
Mixed Resin Outflow
Resin Trap
7 1

7 2
plate. The L-joint was glued in to the hole using a plastic glue (Novaki). While
connecting the L-joint the pipe opening was covered with a fine nylon mesh (50J..Lm).
The L-joint was again connected to the side arm of T-joint. This is connected to the
resin trap which was lOOmm long and an internal diameter of 22mm (Fig.4. 1).
On 15 April, 1989 two galvanized steel cylinders were driven in to pasture soils on
LF and HF low slope sites to a depth of 260mm (Ballantrae Hill Country Research
Station, DSIR Grasslands) and then removed immediately. Inorder to minimise
preferential flow of water, the soil surface with turf was kept lOmm above the
cylinder height. Five soil cores were collected around each cylinder in the field,
bulked in to two samples and used for sulphate determination. During the week
before sampling 1 Omm of rainfall were recorded. Soil moisture content at the time
of sampling for two sites is given in Table 4.2. A thin layer of sieved, acid (HCl)
washed sand (1-2mm) was spread over the plastic base in order to act as a filter and
allow free drainage and the soil cores were placed on plastic bases. The resin trap
was divided into three compartments, the first for trapping sediments, the second for
the anion exchange resin and the third for the cation exchange resin. In the
preliminary laboratory experiment both anion and cation resin compartments were
filled with anion exchange resin.
4.2.2 Preparation of Anion Exchange Resin
The anion exchange resin used for trapping sulphate was 'Amberlite' resin IRA-
400(Cl), a strongly basic anion exchanger. Its basic character is derived from
quaternary ammonium groups. The density is 7 10g (wet) 1"1 • The exchange capacity
of the resin is 1.4 meq ml-1 wet resin, about 80 to 85% of the total exchange capacity
can be utilized. Before filling the resin into the traps it was eluted (regenerated) with
1M HCl ( 1 : 10 ratio) for a minimum period of 5 hours to remove any background
anions including sulphate present in the resin. The excess HCl was removed by
washing several times with deionised water. The acid washed resin was eluted
(regenerated) again with 1M NaCl to remove the excess W ions in the resin and
washed with deionized water to remove the excess chloride and sodium. The

7 4
regenerated resin was always kept under water to keep it moist. About 20g of the
regenerated resin was packed into each of the resin traps. The purpose of using an
excess of resin was to provide a longer path length for drainage from the soil core at
the highest flow rate to pass through the resin. Infact the resin compartment from
which the effluent discharged out (the end compartment) was filled to capacity with
the resin. The resin trap was constructed in such a way that all the drainage should
pass through both the compartments in the resin trap. Another 20g of resin was used
to prepare eluant NaCl solutions as standard blanks for subsequent sulphate analysis.
After the leaching sulphate trapped by the resin was measured as described in section
4.3.2.
4.2.3 Leaching
Both cores were leached with simulated rainfall using deionized water. The intensity
of rainfall was calculated on the basis of rainfall records for the Ballantrae field
farmlet from where the soil cores were collected and the lysimeters were installed
(Chapter 5, 6 and 7). 99mm rainfall was recorded in one day in one single rainfall
event at Ballantrae in 1988. Rainfall intensities around this value were chosen to test
the efficiency of the resin trap to exchange anions at expected field drainage flow
rates. The rates of flow used and their duration are shown in Table 4. 1 . The amount
of simulated rainfall was calculated as follows:
Area of the soil core = 17 6. 8cm2
Total amount of rainfall for seven hours = 99mm
Rainfall per minute = 0.235mm
Amount of water added per minute = 4. 17ml
A peristaltic pump was used to keep the flow rate constant throughout the leaching
period which was seven hours for each leaching event. Effluent from the resin trap
was collected in aliquot of lOOml for each core. After leaching the cores were left
overnight in order to drain. The weight of the cores before and after leaching was
measured in order to calculate the amount of water each core retained. The resin was
removed from the resin traps and were eluted with 50ml of lM NaCl. The
concentration of sulphate in the NaCl eluate was measured by reducing the sulphate
to H2S using HI-reducing mixture and reacting the H2S with bismuth nitrate to produce
bismuth sulphide which was determined turbidimetrically using an auto analyzer

7 5
(CSIRO Division of Forest Research, Method No. PS 17). Five leachings were carried
out over a period of 45 days. The same procedure was used at each leaching event.
4.2.4 Herbage and Soil Analysis
Herbage was harvested twice during the experiment, first 15 days after starting the
experiment and the second at the end of the experiment Herbage was dried and
weighed. A subsample of the dried, ground herbage was used to measure the S
content Herbage S content was measured after digesting the herbage using NaOBr
(Tabatabai and Chae, 1982) and was diluted with 28ml of water and 2ml of formic
acid. The sulphate formed was measured as mentioned above.
The initial extractable soil sulphate levels in samples of field soils were determined
separately for the 0-75, 75-150 and 150-250mm soil depths as mentioned in Chapter-3.
The extractable soil sulphate levels were also determined for soil samples removed
from lysimeters at the end of the experiment
4.3. RESULTS AND DISCUSSION
4.3.1 Sulphate Leaching
During the first three leaching events only 14mm of the total of 99mm rainfall was
retained by the soil. The remaining 85mm drained from the soil (Table 4. 1) . A
longer drying period between leaching (12days) was given for the last two leaching
events, this increased the time taken for drainage water to appear from 1 hour to 1
hour and 40 minutes and increased the amount of rainfall retained to 24mm. The
weight of the cores after leaching were similar to the initial field weight of the soil
core when the experiment was commenced demonstrating that each core drained freely
throughout the experiment in a manner similar to field conditions. At the soiVsand
boundary at the bottom of each core the soil is however expected to be wetter than
under field conditions since little suction will influence this area of the core in the
laboratory. The amount of rainfall applied and the drainage collected were almost
equal (steady state) for six hours for each leaching event. This showed that soil did
not block the sand filter at any one leaching event or with successive leachings. The

7 6
1M NaCl eluate of the resin neither contain any suspended particles nor coloured
indicating that the sand filter and nylon sieve were effective in trapping organic matter
and sediments.
A total of 3 and 20 kg S ha-1 sulphate-S was recovered in the 1M NaCl eluates of the
ion exchange resin when the soils from LF and HF cores, respectively were leached.
No sulphate was detected in the effluent that had first passed through the resin traps,
suggesting that the resin was effective in exchanging sulphate ions even at a rate of
drainage of 4.2ml minute-1 equivalent to a drainage flow of 85mm for approximately
six hours. The total exchange capacity of the resin in the trap was 23.8 milli
equivalent (for 20g of resin). Less than 0.7 (<3%) milli equivalent of exchange
capacity was used to exchange sulphate ions.
The amount of sulphate leached in the final leaching event was considerably lower
than the first leaching event for both cores (Table 4. 1) even though both leaching
events received the same amount of rainfall. This showed that the amount of sulphate
leached is influenced by both rainfall and the amount of sulphate present in the soil.
The amount of sulphate leached in the soil core collected from HF site was greater
than the soil core collected from LF site in all five leaching events (Table 4. 1) . This
result reflects the different fertilizer histories of the two farmlets (HF= 375kg SSP ha-1
year-1 for 14 years and LF= 125kg SSP ha-1 year-1 for 14 years) and reflects the greater
leaching loss of S from the high fertility farmlet predicted by Saggar et al. ( 1990a).
The amount of sulphate-S in 0-75 and 75-150mm soil depths in the soil core from HF
farmlet decreased while the sulphate S in 150-250mm depth remained largely
unchanged. This showed that mineralization in the surface layers and movement to
and adsorption of sulphate at lower depths (subsurface layers) are the most likely
mechanisms of S movement in these soils. A similar mechanism was suggested by
Chao et al. (1962). Even though there was an increase in soil sulphate level at the
150-250mm soil depth in the soil core from HF farmlet, the increase was very small
in the soil · core from LF farmlet (Table 4.2).
4.3.2 Drymatter Production and S Removed
The herbage dry matter produced and the amount of S removed by herbage from the

Table 4.1. Amount of net drainage collected and the amount of sulphate
leached for soil cores collected from LF and HF sites (Leaching
volume 4.2 ml/min, duration 7 hours/event, total applied
99 mm/event and for five events 495mm).
Date of Drainage Sulphate leached
leaching collected (mgS/core)
(mm) LF HF
21-4-89 85.0 2.01 9.00
28-4-89 85.0 1 .43 9.9
5-5-89 85.0 0.966 1 1 . 13
17-5-89 75.0 0.740 5.79
29-5-89 75.0 0.63 1 .72
Total 405.0 5.8 37.5
7 7

Table 4.2 Initial and final sulphate present in the soil for three depths, S lost by leaching, S removed by plant and the net
mineralization of S for the soils from HF and LF sites.
Fannlet Depth (cm) Soil Soil sulphate Plant Uptake3 Leaching
Moisture kg S ha-1 loss3
gig soil Initial1 Final2 kg S ha-1
HF 0-7.5 0.44 37. 1 29.7 5 . 1
7.5- 15 0.35 22. 1 17.7
15-25 0.30 41 .5 44.3
LF 0-7.5 0.45 8.9 8.4 1 .5
7.5- 15 0.37 9.4 7.6
15-25 0.3 1 20.7 21 .9
* Net mineralization= Final Sulphate- Initial sulphate+ Plant uptake+ Leaching losses
1 Results are mean of four replicates (duplicate for two field samples).
2 Results are mean of duplicate samples taken from soil cores after leaching.
3 Individual results from a single core.
20.0
3.0
*Net mineralization3
16.1
3.4
-J o::>
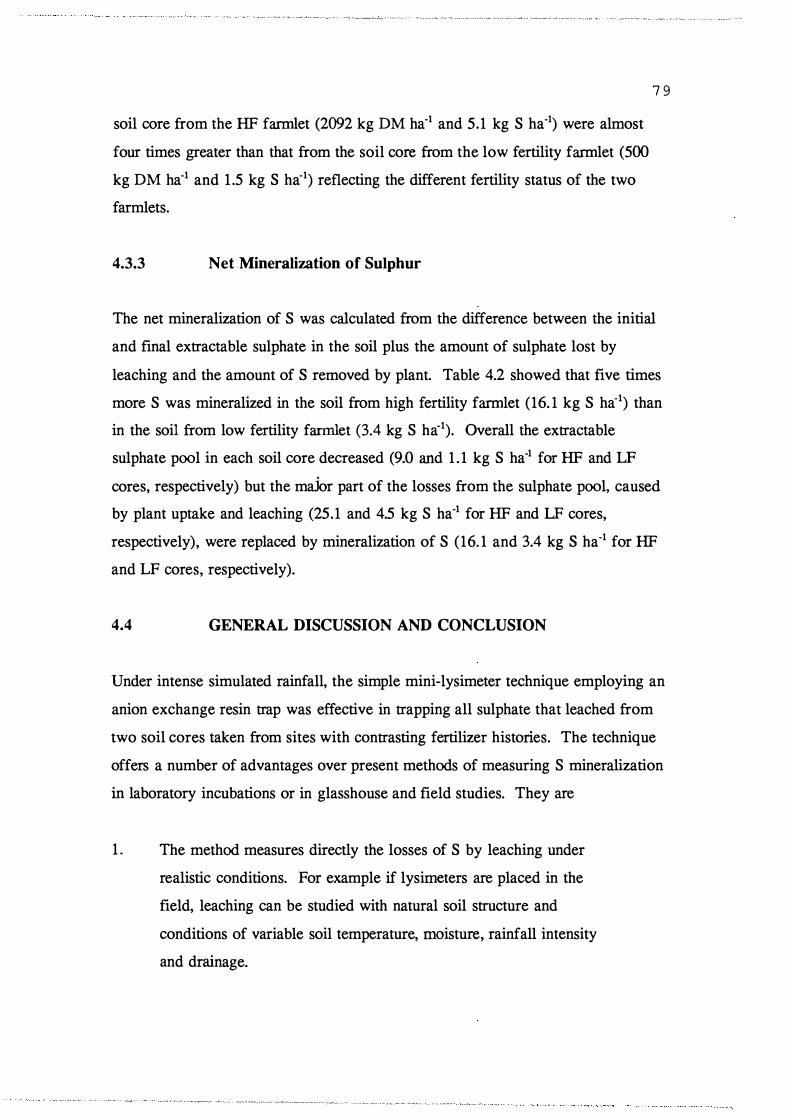
soil core from the HF farmlet (2092 kg DM ha-1 and 5.1 kg S ha-1) were almost
four times greater than that from the soil core from the low fertility farmlet (500
kg DM ha-1 and 1 .5 kg S ha-1) reflecting the different fertility status of the two
farmlets.
4.3.3 Net Mineralization of Sulphur
7 9
The net mineralization of S was calculated from the difference between the initial
and final extractable sulphate in the soil plus the amount of sulphate lost by
leaching and the amount of S removed by plant. Table 4.2 showed that five times
more S was mineralized in the soil from high fertility farmlet (16. 1 kg S ha-1) than
in the soil from low fertility farmlet (3.4 kg S ha-1). Overall the extractable
sulphate pool in each soil core decreased (9.0 and 1 . 1 kg S ha-1 for HF and LF
cores, respectively) but the major part of the losses from the sulphate pool, caused
by plant uptake and leaching (25.1 and 4.5 kg S ha-1 for HF and LF cores,
respectively), were replaced by mineralization of S (16. 1 and 3.4 kg S ha-1 for HF
and LF cores, respectively).
4.4 GENERAL DISCUSSION AND CONCLUSION
Under intense simulated rainfall, the simple mini-lysimeter technique employing an
anion exchange resin trap was effective in trapping all sulphate that leached from
two soil cores taken from sites with contrasting fertilizer histories. The technique
offers a number of advantages over present methods of measuring S mineralization
in laboratory incubations or in glasshouse and field studies. They are
1 _ The method measures directly the losses of S by leaching under
realistic conditions. For example if lysimeters are placed in the
field, leaching can be studied with natural soil structure and
conditions of variable soil temperature, moisture, rainfall intensity
and drainage.

2. Because undisturbed soil cores were used, the physical and chemical
changes occurring in the core are similar to those occurring in field
soil. For example the soil infiltration characteristics, adsorption
desorption characteristics and mineralization-immobilization
characteristics are similar to field soils. There may however be a
wetter zone at the 250mm soil depth (at the soil/sand interface, core
base) than in the natural continuous soil profile.
3. There is no need to collect samples immediately after heavy rainfall
if the system is used in the field as has been necessary in the past.
4. Leaching losses and plant uptake of S can be measured
simultaneously without disturbing the soil structure and estimates of
soil sulphate can be made in soil cores immediately around the
lysimeter cores. This is not possible in mineralization studies
conducted in laboratory and glasshouse.
5 . The amount of S lost from a specified area by leaching can be
measured accurately by trapping all the ions using the ion exchange
resin. The variability in the amount of S leached in the field can be
overcome by using replicated lysimeters. Preliminary studies on the
spatial variability of S leaching would be required to determine the
appropriate diameter of the lysimeter.
6. Since leaching studies are normally conducted during winter,
lysimeters can be inserted during summer or autumn and turf
allowed to regrow to minimize edge effects on cores.
7. By introducing cation exchange resin both cations and anions lost by
leaching can also be measured in the field.
8 0
The large differences in the dry matter production, S uptake and leaching losses of
S from soil cores taken from HF and LF sites indicated that field studies using
lysimeters would be worthwhile to quantify the actual S budgets in the field. The
above results and the S losses predicted by Saggar et al., ( 1990a) indicate that large
differences in S leaching losses can be expected in the field on pastures with
different fertilizer histories.

8 1
CHAPTER-S
FIELD INVESTIGATION OF THE NET MINERALIZATION OF SULPHUR
AND NITROGEN, THEIR RELATIVE PLANT UPTAKE AND LEACHING
LOSSES IN GRAZED HILL COUNTRY PASTURES
5.1 INTRODUCTION
The mini-lysimeter with ion exchange resin trap developed in Chapter-4 proved an
effective method for calculating the net mineralization of organic S in undisturbed soil
cores by measuring insitu, both plant uptake and leaching losses of S. Although the
study reported in Chapter-4 used unreplicated cores the results indicated that a greater
mineralization of S from soil organic matter lead to greater amounts of plant S uptake
and S leaching loss. The undisturbed soil cores taken from LF and HF field sites at
Ballantrae lost 3 and 20 kg S ha-1 by leaching, respectively. This difference between
the cores in soil sulphate leaching losses was in the same order of S loss as that
predicted from field sites (46 to 77% of the applied S) by the model developed by
Saggar et al. (1990a).
The objective of the study reported in this Chapter was to place a number of
lysimeters at Ballantrae field sites to measure directly the S leaching losses under field
conditions and compare the results to the leaching losses of S predicted by S aggar et
a/. (1990a). The net mineralization of soil organic S and pasture uptake were also
studied. By installing lysimeters at sites on different topographic units and contrasting
fertilizer history, it was possible to examine the influence of previous fertilizer
application, rate and land slope on these S transformations. In applying the technique
to field conditions provisions were also made to monitor the leaching losses of N
(both nitrate and ammonium) and other cations such as Ca, Mg, K, Fe and Al. The
net mineralization of N and its uptake by pasture was also investigated because the
primary purpose of SSP application is to increase legume growth and N fertility of the
pasture. Increased N availability in soil increases the rate of S cycling by increasing
plant biomass production (McGill and Cole, 198 1 ) and therefore S requirements of the
pasture increase (Gilbert and Robson, 1984).

5.2 MATERIALS AND METHODS
5.2.1 Field Site
8 2
The experiment was carried out at Ballantrae, the Hill Country Research Station of
DSIR Grasslands, Palmerston North from which soil samples and cores were collected
for the previous two studies. A detailed description of farmlets used for the study,
their soils, pastures, animals, climate and experimental procedures were discussed in
Chapter-3. The fertilizer history of the experimental farmlet was described in Chapter-
3 . The annual rainfall for the farmlet is approximately 1 200 mm. Four experimental
sites were selected in two of the four farmlets on the basis of contrasting fertilizer
history and land slope. These four sites along with the percentage distribution are
given in Table 5. 1 .
The farmlets are 1 0-ha each and are set stocked with sheep. The last fertilizer
application before the start of the experiment was made in December 19 8 8. Since
19 8 3 the low fertility farmlet was set stocked at 1 0 . 3 SU ha-1 (SU= Stock unit defined
by Coop, 196 5) and the high fertility farmlet was stocked at 1 6. 1 SU ha-1• These had
increased from a base of 6.0 SU ha-1 in 1975 when annual fertilizer input commenced.
5.2.2 Lysimeter Installation
The experiment was started on 3 1-5-19 89. The lysimeters used in this study were
similar to those described in Chapter-4. The installation of lysimeters in the field is
described below.
Eight galvanized steel cylinders ( 1 50mm diameter and 250mm length) were driven
into field soils at each of the four sites. Cylinders of this diameter were chosen
because of their successful use in field studies carried out by Williams et al. ( 1 990).
After pushing the cylinders into the soils to a depth of 250mm, the cylinders were
removed and fitted with plastic bases and resin traps (Chapter-4). Joints at the
interface of the cylinder and base were sealed with silicone sealant . A plastic pipe
was connected to the resin trap to provide above ground access to remove resins

Table 5.1 The fertility, land slope and percentage occurrence of
each slope class in each of the two farmlets.
8 3
Fertility Land slope(Angle) Distribution Description
%
Low fertility Low(0-12°) 33 LF-LS
Low fertility Medium(12-26°) 42 LF-MS
High fertility Low(0-12°) 23 HF-LS
High fertility Medium(12-26°) 44 HF-MS

8 4
whenever necessary (see Fig.4. 1). The whole system was reinserted in to the soil
(Fig.5. 1). Coarse sand was used to pack around the resin trap outlet to provide easy
drainage to a small 20mm mole drain which was pulled away from each installation.
The soil and turf were then carefully repacked around each cylinder. All the cores
were covered with cages (0.5nr) to measure pasture production. Pasture yields were
recorded from opposite end of the cage to the cylinder. After each harvest the cages
were rotated with the lysimeter as the pivot. This allowed pasture growth to be
measured (section 5.2.3.2) on a new area of pasture after each harvest and would
include the effect of excreta on growth. In this way the lysimeters were always inside
the cage so that no excreta entered inside the lysimeter.
5.2.3 Measurements
5.2.3.1 Drainage
The predicted daily net drainage (D mm) for all the four sites was calculated using the
following water balance equation.
D = R - Et + w - W:rc
where R, Daily rainfall (mm); Et, Daily potential evapotranspiration (mm); w, depth
of water (mm) for the soil measured at the beginning of the experiment; Wrc• depth of
water for the soil at field capacity (mm).
Daily rainfall was recorded at Ballantrae meterological site. Rain gauges were also
installed at all four sites and the rainfall was measured every week from the beginning
of the experiment. This weekly rainfall was correlated to the accumulated weekly
rainfall recorded at the meterological site. Potential evapotranspiration was calculated
using Priestly and Taylor ( 1 972) equation and temperature (both air and soil) and
sunshine hours recorded at the meterological site. The volumetric water content of the
field soil was measured at the beginning of the experiment and also when soil samples
were taken for analysis during the experiment (Appendix-5. 1). The volumetric water
content of soils at field capacity were measured by determining soil water content and
bulk density immediately after heavy rainfall. The water balance was calculated using
a Multiplan spread sheet version 4. 1 .
8 5
5.2.3.2 Pasture Production
Pasture production at all sites was measured by harvesting the pasture grown under
an exclusion cage (1m 0.5m). Pasture was harvested from one half of (Fig.5 . 1 ) the
cage area (0.25m2). Weighed subsamples of pasture were dried at 60°C and the
pasture dry matter yield recorded. Pasture production was expressed on a per hectare
basis as follows
where
X= Y X A X � x ____!__ kg DM ha -1 B 0 . 2 5 103
X= Amount of dry matter produced (kg ha-1)
Y = green weight of herbage produced (gm) in 0.25m2 area
A= Dry sample weight (gm)
B= Green sample weight (gm)
Five harvests were taken (5/9, 6/10, 6/1 1 , 30/1 1/89 and 8/1/90). Harvest intervals
depended on pasture growth rates. The first harvest was not made until three months
after the beginning of the experiment because winter pasture growth was slow.
Thereafter harvests were made at approximately four week intervals. Separate pasture
samples were dissected for species composition. A subsample of the oven dried
mixed pasture was grounded and used to determine pasture S and N content (see
analytical methods).
5.2.3.3 Ion Exchange Resin and Resin Care
The type of anion exchange resin (15g/trap) and its loading into the trap were
described in Chapter-4. The cation exchange resin ( 15g/trap) used in this experiment
was 'amberlite-IR120' . The exchange capacity of the resin was 1 .9meq ml"1(wet) and
5.0meq ml"1(dry). Prior to use, both anion and cation exchange resins were first eluted
(regenerated) with 1M HCl followed by 1M NaCl and then thoroughly washed with
deionised water to remove background ions present in the resin and placed in the
resin-trap compartments.
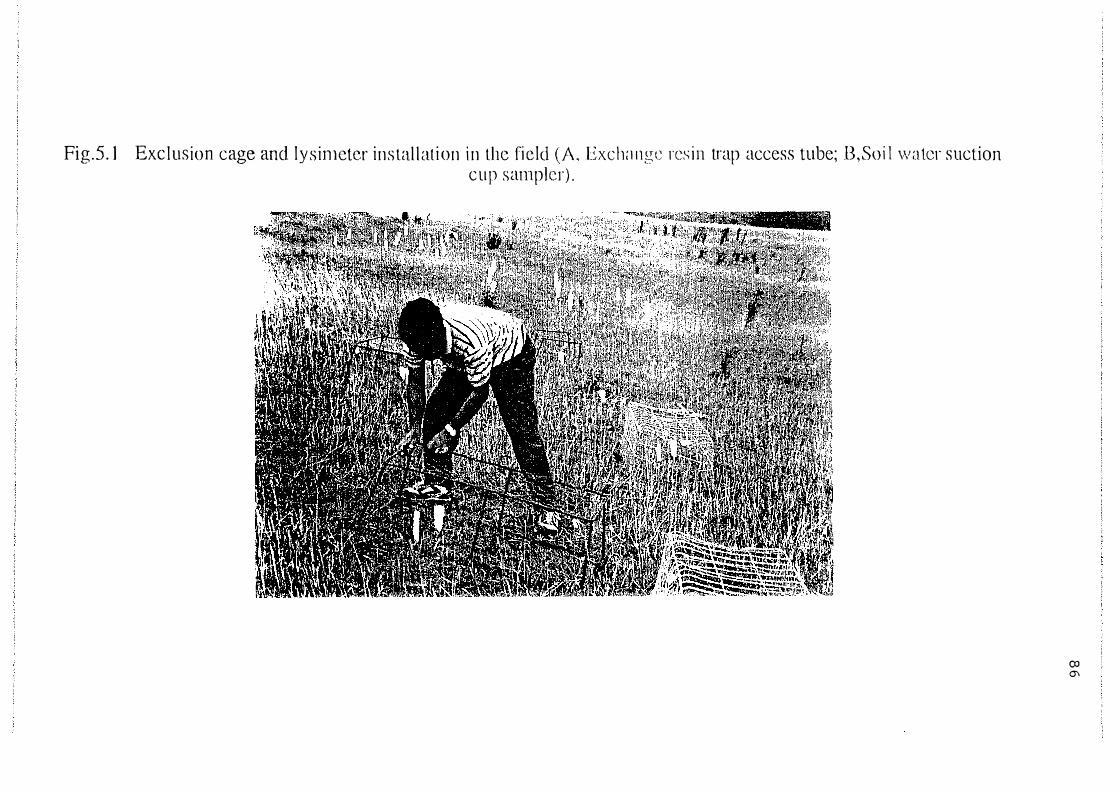
Fig.5. 1 Exc l usion cage and lys imetcr ins tal l at i on i n the fi eld ( A . Exch;mgc res i n trap access tube; B,Soi l w a ter suction cup sam.plcr) .
CO 0\

8 7
The resins were replaced four times during the experiment depending upon the
frequency and intensity of rainfall. Each coincided with a harvest. After removing
the resins from the trap, they were washed thoroughly with deionized water before
eluting with 50mls of 1M NaCl. A portion of the eluant was used for the
determination of S04=, N03-, NH/ and other cations such as Ca+�-, Mg+�-, K+, Fe+!- or
Fe3+ and Al3+. Eluates from resin blanks were used to prepare standard curves for
each element. The eluted resin was washed thoroughly with deionised water and used
again for subsequent samplings.
5.2.3.4 Soil Sampling
Soil samples were collected from outside the lysimeters at the start of the experiment
in early winter ( 1/6/89), mid winter(5n), late winter(25/8), early spring(5/9), mid
spring(6/1 1 ), late spring(30/1 1/89) and early summer (8/1!90 final). Samples were
collected from 0-75, 75- 150 and 1 50-250 mm soil depths. The extractable sulphate
and mineral N contents were determined for field moist soils using the methods
described in Chapter 3, section 3 .2. Moisture content of the soil was also recorded
at each sampling (Appendix-5 . 1 ) . Soil bulk density was measured for all four sites
at the beginning of the experiment (Appendix-5.2).
5.2.4 Analytical Measurements
The soil sulphate and mineral N were extracted and measured as mentioned in
Chapter-3, section 3 .2.4. The sulphate and mineral N in resin eluates were measured
as mentioned in Chapter-3 , section 3 .2.4. Appropriate matrices were used for the
preparation of standard curves in the determination of S and N in soil and resin
eluates.
The concentrations of cations in the resin eluates were measured using atomic
absorption spectroscopy. Appropriate ionic suppressants (Sr, Cs and K ) were used
for the determination of ea-, K+ and Fe- or Fe3+. The final solution for the
determination of cations was acidified with 1ml of 1M HCl per 50ml.

8 8
Pasture S content was determined as described in Chapter-4, section 4.2. Pasture N
content was determined by digesting the sample with a mixture of concentrated H2S 04,
K2S04 and Se (a micro Kjeldal method) and the N was measured using an auto
analyser. Final results for the above analyses are expressed as the mean of eight
replicate measurements derived from eight replicate lysimeters.
5.2.5 Statistical Analysis
Soil sulphate, mineral N, the amount of S and N lost by leaching, the pasture S and
N content and net mineralization of S and N were subjected to analysis of variance
(Hull and Nie, 1981) to determine the statistical significance of the simple and
interactive effects of site location and soil depth.
5.3 RESULTS AND DISCUSSION
In a grazed pasture, the net mineralization of any nutrient in the soil under field
conditions can be calculated at any one site by measuring the changes in the amount
of that nutrient in the plant available pool (in the soil), the amount of nutrient taken
up by plant and lost by leaching and the amount of nutrient returned in excreta which
could be potentially available for plant growth. Such measurements for both S and
N are now discussed before an attempt is made to calculate the net mineralization of
these two nutrients.
5.3.1 Rainfall and Drainage
The total rainfall (625mm) during the experimental period was lower than the long
term average (754mm) for that period (Fig.5.2). The winter (June to August 1 989)
rainfall in particular was lower than the long-term average. Drainage occurred in only
three of the seven months of measurement (Fig.5.2). The total drainage during winter
( 1 1 8mm) was greater than the total drainage during spring (103mm), but the intensity
of drainage was greater during spring. In spring drainage occurred over a period of
17 days whereas in winter drainage extended over a longer period (42
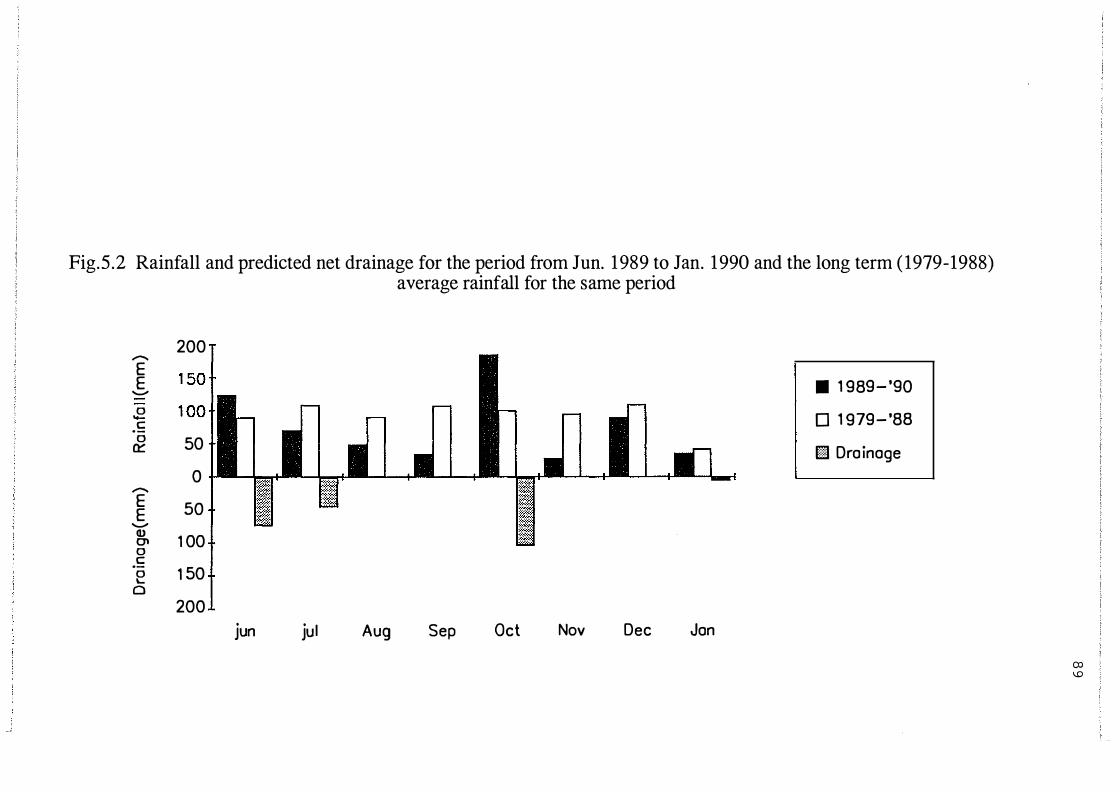
Fig.5 .2 Rainfall and predicted net drainage for the period from Jun. 1 989 to Jan. 1 990 and the long term ( 1979-1988) average rainfall for the same period
200 -E 1 50 1 E • I • 1 989- '90 ......., 0 1 00 1 11-1 I I I I . , n 1111 1 I D 1 979- '88 - n .s 0 50 lll I 0::: Il l Il l al l Il l � I Il l Ill I m Dra inage
0 -E 50 E ......., Cl,) 1 00 0'1 0
.s 1 50 0 \.. 0 200
jun jul Aug Sep Oct Nov Dec Jan
CXl �

9 0
days). The significance of this drainage pattern on sulphate leaching and soil sulphate
levels are discussed in a later section (section 5.3 .2). Even though the rainfall
intensity was greater in spring than in winter, no runoff occurred in spring. In a
similar study conducted on a Tokomaru silt loam Heng et al. ( 1991 ) also did not
observe any surface runoff for a rainfall of 7.2 mm hr-1 for 6 hours, even though for
the same time the soil remained at its field moisture holding capacity. The rainfall
intensity during the experimental period for these sites never exceeded 4mm hr-1 •
5.3.2 Soil Sulphate
At the beginning of the experiment average extractable soil sulphate for the profile (0-
250mm) were higher at high fertility sites (45.0 and 34. 1 kg S ha-1 for low and
medium slopes, respectively) than at low fertility sites (15 .8 and 19.5 kg S ha-1 for low
and medium slopes, respectively) (Appendix-5 .3). In the high fertility farmlet the
amount of sulphate present at the low slope was greater than the amount of sulphate
present at medium slopes even though both slope categories have same fertilizer
history. At the low fertility farmlet, however, there was no difference between the
amounts of sulphate present in the soil at low and medium slopes. At all sites the
amounts of sulphate S present in the soil fluctuated throughout the experimental period
(Fig.5.3). During the period of maximum plant growth in spring and early summer
(Sep. to Early Jan.) the amount of sulphate in the upper 1 50mm of the soil steadily
decreased (Fig.5.3). This is due to the depletion of sulphate in the top 1 50mm soil
depth by plant uptake and microbial immobilization. Sulphate in the 1 50-250mm soil
depth was consistently higher than those at 1 - 150mm soil depths during this period.
The greater amount of sulphate S in the subsoil than in the surface layers is due also,
in part, to the sorption of sulphate by iron and aluminium hydrous oxides surfaces in
the absence of HP04- ions that in the top soil may compete with sulphate ions for
sorption sites (Bolan et al., 1988). Further, because of lower root (Barker et al. , 1988)
and microbial activities in the lower soil layers the sulphate concentration at this depth
is influenced to a much lesser degree by organic matter turnover, mineralization and
immobilization processes. Seasonal changes in the rate of uptake of S by plant roots
and soil microbial activity brought about by changes in soil temperature and moisture
(rainfall) (Harward and Reisenauer, 1966; Metson, 1979) will lead to more frequent
or greater fluctuations in the amount of sulphate in the top soil.

Fig .5 . 3 . Soil sulphate present for the depths 0-75 mm ( ), 75- 150 mm (--+--) and 150-250 mm (--*--) at all sites from
Jun. 1989 to Jan. 1990. Soil samplings were done on 3 1/5/89, 4/7, 24/8, 5/9, 61 10, 30/ 1 1 and 8/ 1/ 1990. The L. S .D values are given in
0 ..r:
40
30
'-- 20 (/) (J'l �
1 0
Appendix-5 . 3 .
L F - L S 40
30
20
1 0
0�----+-----�----�----�----� 0 0 50 1 00 1 50 200 250 0
40T 40 H F - LS
30t /\ 30 0 ..r: � 20f'-. / .. 20 (J'l
�
1 0+ � \ 1 0
0 0 0 50 1 00 1 50 200 2 50 0
T ime (Days)
50
50
L F - MS
1 00 1 50
H F - M S
1 00 1 50 T ime (Days)
200 250
200 250 ID 1-'

92
Soil sulphate S in low fertility sites increased during the initial period (31/5 to 4n /89)
of the experiment (early winter), but in high fertility sites the sulphate S decreased
(Fig.5.3). This decrease may be due to immobilization and greater leaching of
sulphate in these two HF sites in the absence of significant plant growth.
Immobilization of sulphate is possible in HF farmlet because the initial sulphate in the
two high fertility sites were as high as 24 and 17.6 kg S ha-1 in the top 1 50mm of the
soil (Appendix-5.3) which is almost 2 to 3 times more than the sulphate in the low
fertility sites (8.0 and 8 .7 kg S ha-1, respectively) (Appendix-5.3). Previous S balance
studies in New Zealand and Australia have shown that, when rainfall was low large
amounts of applied sulphate were incorporated in to soil organic matter (Goh and
Gregg, 1982; Goh and Tsuji., 1979; Freney et al., 1975).
Further evidence for immobilization of sulphate was that even though there was
considerable drainage (73mm) (equivalent to 100% of water stored in the top 150mm
of the soil) during this period the amount of sulphate lost by leaching was low (4.0
and 3.5 kg S ha-1 for low and medium slopes) compared to the amount of sulphate (24
and 17.6 kg S ha-1 for low and medium slopes) (Appendix-5.3) present in the top
1 50mm of the soil (Appendix-5.3). The greater sulphate concentration in the soil
might have also decreased the mineralization of soil organic sulphur because the rate
of sulphate production by biochemical enzymatic hydrolysis of ester sulphate in soil
decreases as the concentration of the sulphate in the soil solution increases (Cooper,
1972; Fitzgerald, 1976).
The concentrations of sulphate S increased to its highest level at the end of winter
(24-8-1989) at all sites (Fig.5.3) and thereafter the concentrations steadily decreased,
particularly for the 0- 150mm soil depths due to increased plant uptake and leaching,
which occurred in mid spring (Oct. 1989, for a period of 17 days, Fig.5.3). After the
leaching events in spring (Oct. 1989) the sulphate concentrations are constant in the
150-250mm soil depth at all sites during the period of maximum plant growth
(Fig.5.3).
At low fertility sites the amount of sulphate present in the soil (0-250mm) at the
beginning (1 -6- 1989) and at the end (8- 1 - 1990) of the experiment was almost same
(Fig.5.3, Appendix-5.3), showing that mineralization of organic S replenished the soil

9 3
solution sulphate lost by leaching and pasture uptake during that period. At high
fertility sites the soil sulphate level (0-250mm) had decreased by the end of the
experiment. Nearly all of this decrease was observed in the upper 0-150mm of the
soil, showing that plant and leached S was derived in part from the sulphate pool and
the remainder from the mineralization of soil organic S . During the period of rapid
plant growth the amount of sulphate present in the 150-250mm soil depth showed
little change. Although previous studies have demonstrated that subsurface S O/ is
available to plants (Gregg and Goh, 1979) the extent to which this pool contributes
to the overall S nutrition of the plant depends on soil texture and bulk density as it
influences the quantities and activity of plant roots in the subsoil and to lesser degree
the extent of refluxing of the subsoil sulphate to the topsoil when the soil water table
increases (Risk and Boswell, 1988). The small changes in the amount of sulphate S
in 1 50-250mm soil depth at all four sites during a period when there was no leaching
occurred ( 19/9/89 to 8/1/90), plant growth depleted soil sulphate level at 0- 150mm soil
depth but not at 150-250mm depth indicating that once sulphate moved beyond the
top 150mm of the pasture soil it is essentially not available for plant uptake.
5.3.3 Mineral Nitrogen
Unlike S , at the beginning of the experiment mean soil mineral N (N03"+NH/)
contents of low ( 10.3 kgN ha-1) and high fertility (9.8 kgN ha-1) sites (Appendix-5.4)
were very similar as they were between slope classes within low and high fertility
sites. Like S, however, the amount of mineral N (both nitrate and ammonium)
increased during winter and there after decreased throughout the spring and early
summer (Fig.5.4). This coincided with rapid plant uptake. For HF sites this increase
in mineral N in winter occurred before the increase in soil S04-S (Fig.5 .3).
Ammonium was the dominant inorganic N form present at all sites and made up 100%
of the inorganic N in spring and summer. Nitrate was present only in the winter
months (Table.5.2, Appendix-5.4) . These trends are typical of seasonal observations
of mineral N content of soil under grasslands (Jackson et al., 1988). Rapid
immobilization of nitrate or denitrification however are not suitable

Fig .5 .4 . Soil mineral nitrogen present for the depths 0-75 mm ( ) , 75-150 mm (--+--) and 150-250 mm (--*--) at all
sites from Jun. 1989 to Jan. 1990. Soil samplings were done on 3 1/5/89, 417, 24/8, 5/9, 6/ 10, 30/ 1 1 and 8/ 1/ 1990. The L.S .D values are
given in Appendix-5 .4. 30 30
25 L F - LS 25 LF -MS
0 20 ..c 20 ';? 1 5 1 5 (jl
� 1 0 1 0 5 5 0
0 200 2 50 0 0 50 50 1 00 1 50 1 00 1 50 200 250
3Q T 30
25
! H F - LS 25 1 H F - M S
0 20 /\ 20 ..c '-. 1 5 + z / \ 1 5 (jl 1 0 �
5 I 0
250 0 50 1 00 1 50 200 250 T ime {Days) 1.0 ""'

Farmlet
LF-LS
LF-MS
HF-LS
HF-MS
Table 5.2 Amounts of Nitrate (N) and Ammonium (A) present at three depths in the soil for all the four sites during the experiment. No nitrate was observed in some of the samplings.
--Soil Depth 3 1 -5-89 4-7-89 24-8-89 5-9-89 6- 1 1-89 30-1 1 -89
(mm) mg N kg-1 soil
A N A N A A A A
0-75 7.5 1 .5 9.8 4. 1 14.9 5.6 6.4 5 . 1
75- 150 3.5 1 .4 5.9 3.9 7.9 3.4 4.6 3.8
150-250 3.8 1 .5 6.8 3.0 4. 1 2.6 4. 1 3.3
0-7.5 5.8 1 .6 1 1 .6 8 . 1 42.9 7.9 8 .1 5.6
7.5-15 2.6 1 .6 7.3 6.6 19.5 3.6 5.2 4.4
150-250 3.5 1 .7 5.9 4.7 12 3.5 5.2 4
0-7.5 7.3 6.6 9.6 9 18 .4 12.6 13.1 5.9
7.5- 15 4.4 4.7 4.4 5.2 4.4 7.3 7.9 4.3
150-250 2 3.5 3.5 4.2 4. 1 2.6 7.35 3.4
0-7.5 7.2 9.7 12.2 6.5 5.6 6 7.8 4.9
7.5- 15 4. 1 8.3 8.5 4.7 3 3.9 7.2 4.4
150-250 1 .8 6.9 5.7 3 . 1 2.9 3.7 5.4 4.3
1L s Dp<O.Ql 0.82 2.0 1 .9 2.3 5.2 0.96 0.65 1 .0
1 for comparison of means between depths
8-1-90
A
3.7
2.2
2.1
3 . 1
4.2
1 .9
3.5
3.2
1 .8
3.5
2.1
1 .9
0.85
\!) (J1

9 6
explanations for the absence of nitrate in these soils in the spring. Microbial
heterotrophs prefer ammonium as a N source and are able to out compete the
nitrifying bacteria for the ammonium ions (Jones and Richards, 1977). Ammonium
rather than nitrate is also central to microbial growth and decomposition (Paul and
Juma, 1981) . However it is not clear which form of inorganic N, N03- or NH4+ is
preferred by pastures. Previous work (Jackson et al., 1989) shows that ammonium is
the dominant N source for not only microbes but also plants. Earlier laboratory
incubation results (Chapter-3.3.2) showed that considerable amounts of ammonium
rather than nitrate was the major byproducts of mineralization of soil organic matter.
But the absence of nitrate during spring and early summer may be due to the rapid
removal of nitrate by plants during active periods of plant growth. The decrease in
the amounts of mineral N throughout the spring resulted from plant uptake and
immobilization by microorganisms and was not the result of leaching, since most of
the mineral N was in the form of ammonium and retained on cation exchange sites
rather than nitrate which is susceptible to leaching. This shows that the presence of
ammonium as the major inorganic N species would limit the amount of N lost by
leaching in these hill country pastures. In fact very little N was lost (section 5.3 .4).
5.3.4 Leaching Losses of S and N
Over the seven months of measurement more S and N were leached from high fertility
sites (15 .3 kg S ha·1 and 1 .3 kg N ha·1 ) than low fertility sites (2. 1 kg S ha·1 and 0.24
kg N ha-1) (Table 5.3). Land slope did not affect leaching losses from low fertility
sites. The reasons for the low fertility medium slope site behaving like a low slope
campsite are discussed in section 5.3.6. At the high fertility farmlet more S and N were lost from the low slope than the medium slope. As expected S leaching loss was
much greater on the HF farmlet where soil solution sulphate was greater than 8 mg
r1 (measured using suction cups) for most of the year. At the LF site, where leaching
much less, soil solution sulphate concentrations were <2mg 1"1 throughout the year.
Even though the net drainage during winter was slightly greater than during spring at
both slope classes of each farmlet (Fig.5.2 and Table 5.3) different patterns for the
downward movement of S through the different soil profiles emerged at the two sites.
A greater amount of S ( 1 .2 and 1 .3 kg S ha·1 for low and medium slopes) was lost by
leaching at the low fertility farmlet during winter, while

Farmlet
LF-LS
LF-MS
Average
LSD
p < 0.01
HF-LS
HF-MS
Average
L.S . D
p < 0.01
Table 5 .3 Predicted net drainage and the amounts of sulphate and mineral N lost
by leaching in winter and spring at all four sites.
winter spnng total
drainage s N drainage s N drainage s N
mm kg/ha mm kg/ha mm kg/ha
136 1 .2 0 .29 99 0.78 0 235 2 .0 0.29
146 1 . 3 0 . 17 130 0 .91 0 276 2 .2 0 . 19
141 1 .3 0 .23 1 15 0 . 85 0 256
12 0 .2 0. 1 22 0 .23 3 1 0 .34 0 .2
138 6 .6 1 . 5 120 10 .7 0 258 17 .3 1 .5
132 5 .9 1 . 1 102 7 . 1 0 234 13 .2 1 . 1
135 6 .3 1 .3 1 1 1 8 .9 0 246 15 .3 1 . 3
14 2 .5 0 .3 13 2 .3 24 3 .3 0 .6
� -..1
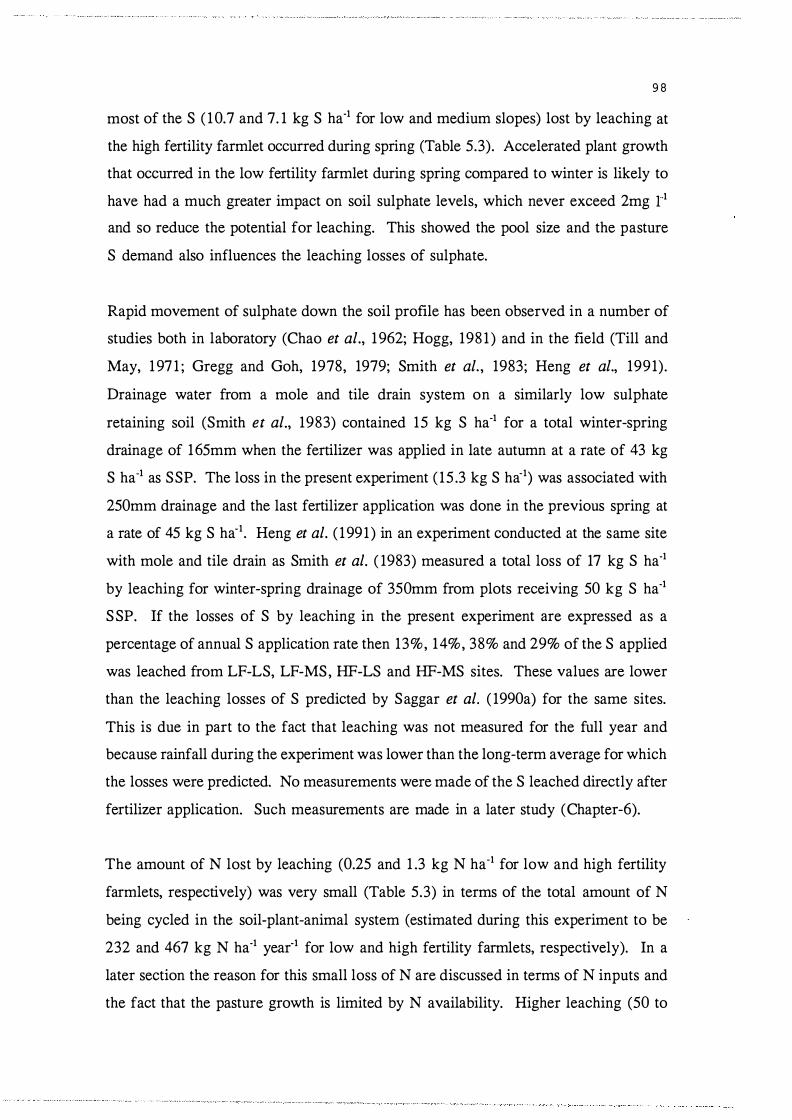
9 8
most of the S ( 10.7 and 7. 1 kg S ha·1 for low and medium slopes) lost by leaching at
the high fertility farmlet occurred during spring (Table 5.3). Accelerated plant growth
that occurred in the low fertility farmlet during spring compared to winter is likely to
have had a much greater impact on soil sulphate levels, which never exceed 2mg 1"1
and so reduce the potential for leaching. This showed the pool size and the pasture
S demand also influences the leaching losses of sulphate.
Rapid movement of sulphate down the soil profile has been observed in a number of
studies both in laboratory (Chao et al., 1962; Hogg, 198 1 ) and in the field (Till and
May, 197 1 ; Gregg and Goh, 1978, 1979; Smith et al. , 1983; Heng et al., 1991).
Drainage water from a mole and tile drain system on a similarly low sulphate
retaining soil (Smith et al., 1983) contained 15 kg S ha-1 for a total winter-spring
drainage of 165mm when the fertilizer was applied in late autumn at a rate of 43 kg
S ha·1 as SSP. The loss in the present experiment ( 15 .3 kg S ha-1) was associated with
250mm drainage and the last fertilizer application was done in the previous spring at
a rate of 45 kg S ha"1 • Heng et al. ( 1991 ) in an experiment conducted at the same site
with mole and tile drain as Smith et al. ( 1983) measured a total loss of 17 kg S ha·1
by leaching for winter-spring drainage of 350mm from plots receiving 50 kg S ha·1
S SP. If the losses of S by leaching in the present experiment are expressed as a
percentage of annual S application rate then 13%, 14%, 38% and 29% of the S applied
was leached from LF-LS, LF-MS, HF-LS and HF-MS sites. These values are lower
than the leaching losses of S predicted by Saggar et al. ( 1990a) for the same sites.
This is due in part to the fact that leaching was not measured for the full year and
because rainfall during the experiment was lower than the long-term average for which
the losses were predicted. No measurements were made of the S leached directly after
fertilizer application. Such measurements are made in a later study (Chapter-6).
The amount of N lost by leaching (0.25 and 1 .3 kg N ha-1 for low and high fertility
farmlets, respectively) was very small (Table 5.3) in terms of the total amount of N
being cycled in the soil-plant-animal system (estimated during this experiment to be
232 and 467 kg N ha·1 year·1 for low and high fertility farmlets, respectively). In a
later section the reason for this small loss of N are discussed in terms of N inputs and
the fact that the pasture growth is limited by N availability. Higher leaching (50 to
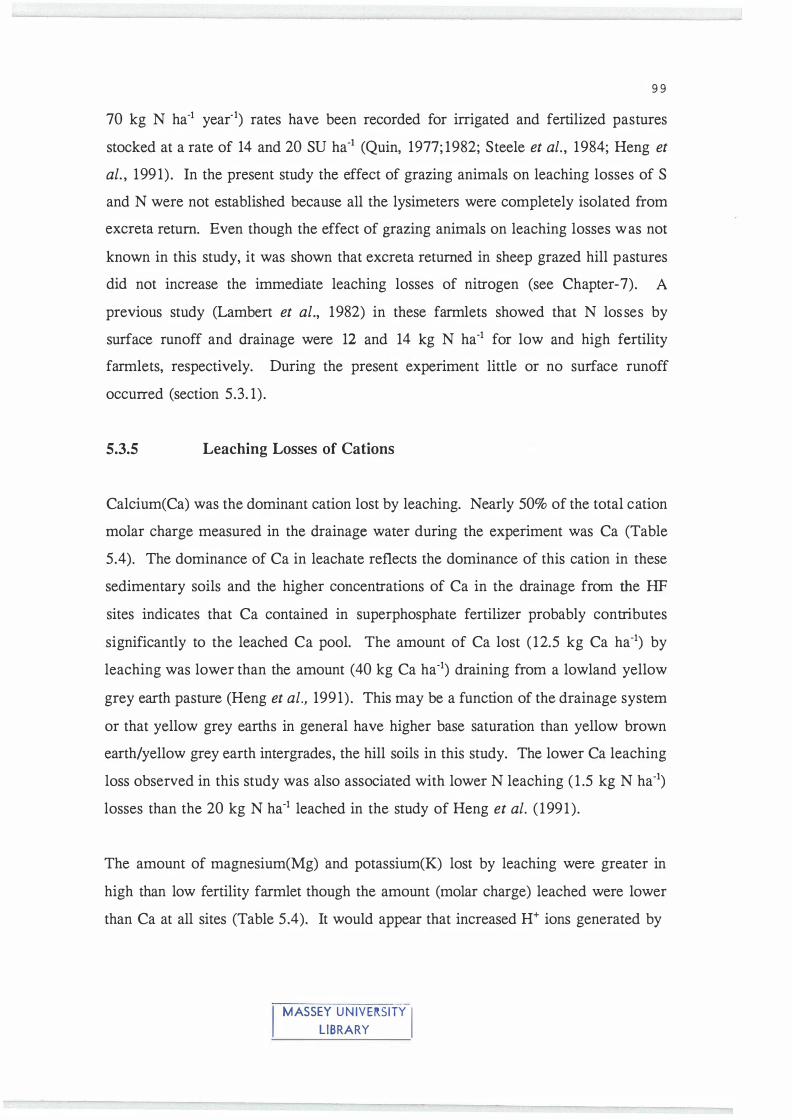
9 9
70 kg N ha-1 year-1) rates have been recorded for irrigated and fertilized pastures
stocked at a rate of 14 and 20 SU ha-1 (Quin, 1977; 1982; Steele et al. , 1984; Heng et
al. , 199 1). In the present study the effect of grazing animals on leaching losses of S
and N were not established because all the lysimeters were completely isolated from
excreta return. Even though the effect of grazing animals on leaching losses was not
known in this study, it was shown that excreta returned in sheep grazed hill pastures
did not increase the immediate leaching losses of nitrogen (see Chapter-7). A
previous study (Lambert et al., 1982) in these farmlets showed that N los ses by
surface runoff and drainage were 12 and 14 kg N ha-1 for low and high fertility
farmlets, respectively. During the present experiment little or no surface runoff
occurred (section 5.3. 1) .
5.3.5 Leaching Losses of Cations
Calcium(Ca) was the dominant cation lost by leaching. Nearly 50% of the total cation
molar charge measured in the drainage water during the experiment was Ca (Table
5.4). The dominance of Ca in leachate reflects the dominance of this cation in these
sedimentary soils and the higher concentrations of Ca in the drainage from the HF
sites indicates that Ca contained in superphosphate fertilizer probably contributes
significantly to the leached Ca pool. The amount of Ca lost ( 12.5 kg Ca ha-1) by
leaching was lower than the amount (40 kg Ca ha-1) draining from a lowland yellow
grey earth pasture (Heng et al., 199 1) . This may be a function of the drainage system
or that yellow grey earths in general have higher base saturation than yellow brown
earth/yellow grey earth intergrades, the hill soils in this study. The lower Ca leaching
loss observed in this study was also associated with lower N leaching ( 1 .5 kg N ha-1)
losses than the 20 kg N ha-1 leached in the study of Heng et al. ( 1991 ).
The amount of magnesium(Mg) and potassium(K) lost by leaching were greater in
high than low fertility farmlet though the amount (molar charge) leached were lower
than Ca at all sites (Table 5.4). It would appear that increased H+ ions generated by
I MASSEY U N IVErt.SITY I LIBRARY

Table 5.4 Amounts of cations leached for all the four
sites between Jun. 1989 and Jan. 1990
Farmlet Amount of cations leached
Kg/ha
ea Mg K Al Fe
LF-LS 5 . 00 0.78 0 .78 1 .36 2 .95
LF-MS 4 .75 0.28 1 .2 1 1 .09 0 . 89
Average 4.9 0 .53 1 .00 1 .2 1 .9
LSDp<O.Ol 0.45 0 .36 0 .56 0 .49 0 . 85
HF-LS 12.49 1 .9 1 3 . 62 0.53 0 .56
HF-MS 6 .37 1 . 19 3 . 09 1 . 49 1 . 22
Average 9 .4 1 . 6 3 .4 1 . 0 0 .90
LSDp<O.Ol 3 .2 0 .74 0. 64 0. 85 0.48
l O O

1 0 1
increased N cycling (Bolan et al. , 1991 ) in HF farmlet exchanged with and cause
increased Mg++ and K+ leaching in this farmlet. Also increased anion leaching will
enhance the greater leaching of Mg++ and K+ in the high fertility farmlet. The amount
of K+ lost by leaching in terms of annual K cycling (240 kg K ha-1 observed during
the experiment for HF farmlet) in sheep grazed pastures was very low (0.78 to 3 .6 kg
K ha-1), lower than the amount of ea++ lost by leaching (4.8 to 1 2.5 kg Ca ha-1) for
which the annual turnover is about 125 kg Ca ha-1• Over this experimental period a
greater amount of K was taken up by pasture ( 100 to 1 80 kg K ha-1) and returned to
soil by sheep than Ca (53 to 95 kg Ca ha-1), most of the K returned in excreta by
sheep to the soil is retained by displacing ea++ and Mg++ from exchange sites. The
amount of K lost is even lower than the amount of Mg lost from some sites. The
small amount of K leached was consistent with the findings of other studies (Hogg,
198 1 ; Smith et al. , 1983; Steele et al. , 1984; Williams et al., 1990) conducted in New
Zealand.
In the present study the summed amounts of cation charge leached was not balanced
with the measured summed amounts of anion charge leached. This is partly because
some of the main anions (Cl, HC03- and oH-) and the cation (Na+) could not be
measured from the 0.5M NaCl resin eluate and because the oxidation states of Fe and
AI species appearing in the leachate is unclear. In fact, the drainage water collected
from 0-250mm soil depth using porous suction cups contained about 3 to 5 mg Cl 1"1
of water. The higher amounts of Fe and AI during winter period may be due to the
initial disturbance of the soil cores when they were inserted in the field, or may be
due to reduced conditions during winter. While the anions and cations could not be
balanced the amounts of both anion and cation leached were greater in high fertility
farmlets than in low fertility farmlets.
At this stage it is useful to note that the amount of Ca lost by leaching from both LF
and HF sites are lower than the amount of Ca applied in the fertilizer to the soil but
increased fertilizer application is definitely causing accelerated leaching losses of Mg
and K from these hill country soils even though these nutrients were not applied in
the fertilizer. The mechanism of cation leaching in grazed pasture is unclear, but

1 0 2
these results showed that the amounts of K returned to soil in excreta particularly in
urine is much higher than the amounts of Ca and Mg returned but the losses of K by
leaching were much lower than the amounts of Ca and Mg lost by leaching. The
results along with the results of Heng et al. ( 199 1) suggest that in sheep grazed
pasture both fertilizer and excreta K exchanges with Ca and probably with Mg and
enhances the leaching losses of both Ca and Mg. The accelerated losses of Mg and
K in the HF farmlet may be due to an enhanced recycling of Mg and K through plant
and animal because of a greater growth and stock numbers. This aspect is
investigated further in Chapter-?.
5.3.6 Pasture Production
For the seven month period, pasture production (Average of 8 replicates) at high
fertility sites was greater (2 times) than at low fertility sites (Table 5.5). Land slope
did not effect the pasture production at the high fertility farmlet, but at the low
fertility farmlet the medium slope produced more pasture than the low slope. The
increase in pasture production at this particular site can be explained by the effect of
the prevailing North Westerly wind on the camping behaviour of the grazing animal.
In the low fertility farmlet the low slope site was exposed to the full force of the
westerly wind. Whereas the medium sloped easterly aspect was sheltered, received
greater excretal returns as a result was more fertile than the low slope site. S aggar
et al. ( 1990a) have already reported that wind direction prevailing from North West
influenced stock behaviour and excretal return in this hill country.
Late winter pasture growth rates were very low (3.2 to 14.2 kg DM ha-1 day-1).
Thereafter growth rate steadily increased and by late spring it ranged from 48 to 73
kg DM ha-1 day-1 • By early summer growth rates had slowed because of moisture
stress (see Chapter-8).
5.3.7 Pasture S and N Concentration
Pasture S and N concentrations are dependent upon the plant availability of soil
nutrients, amount of fertilizer application, pasture yield, plant species composition,

1 0 3
Table 5.5 Pasture production from June. 1989 to Jan. 1990 at all four sites.
Farmlet Harvest Total
5/9 6/ 10 6/ 1 1 30/ 1 1 8/1/90 Production kg
DM ha-1
Late Spring Early
winter Summer
kg DM ha-1
LF-LS 307 425 628 1 168 1246 3 774
LF-MS 378 759 1 133 1454 1465 5 198
Average 343 592 881 13 1 1 1356 4486
LSDp<o.os 50 205 293 190 102 3 12
HF-LS 1370 1506 1580 1740 2109 8307
HF-MS 1375 1475 1609 1766 2294 85 19
Average 1373 1490 1595 1753 2202 8413
LSDp<o.os 25 53 42 73 202 293

Farmlet 5-9- 1989
Late winter
% S % N N/S
LF-LS 0.28 3 .22 1 1 .5
LF-MS 0.28 3 .20 1 1 . 8
Average 0.28 3 .2 1 1 1 . 7
LSD 0 .03 0 .2
I P < 0.01
HF-LS 0.33 3 . 6 1 10 .9
HF-MS 0 .32 3 .59 1 1 .2
Average 0.33 3 . 6
LSD 0 .01 0 . 1
p < 0.01
Table 5.6 Effect of fertilizer history and land slope on
pasture S and N concentrations and N/S ratios.
6-10-89 6- 1 1-89
Spring
% S %N N/S % S % N N/S % S
0 .32 3 . 65 1 1 .4 0 .31 3 .29 10. 6 0.25
0 .32 3 . 6 1 1 1 .3 0 .32 3 .72 1 1 . 6 0.24
0 .32 3 . 63 1 1 .4 0.32 3 .5 1 1 1 .5 0 .25
0 .01 0 .2 0.02 0 .5 0 .01
0 .34 3 .93 1 1 . 6 0.35 3 . 67 10 .5 0 .30
0 .32 4 .05 12 .6 0 .38 3 . 82 10 . 1 0 .29
0 .33 4 .0 0.37 3 .74 0 .30
0. 0 1 0. 1 0 .03 0.25 0 .01
30-1 1-89
%N N/S
3 .20 12. 8
3 .01 12 .5
3 . 1 12 .7
0.2
3 .34 1 1 . 1
3 .01 10 .4
3 . 1 8
0 .3
8- 1- 1990
Early summer
% S %N N/S
0 .21 2 .43 1 1 . 6
0 .21 2.04 9 .7
0 .2 1 2.24 10 .7
0 .02 0 .6
0 .29 2.46 8 . 5
0.27 2 .5 1 9 .3
0.28 2.49
0.0 1 0.3
t-' 0 ..,.

1 0 5
season of sampling, slope and aspect. The higher S and N concentrations of mixed
pasture at HF sites reflects the higher fertility of these sites (Table 5 .6). At all sites
the concentrations of S and N in pasture increased from Jun. to Oct. and thereafter
steadily decreased. The decrease was associated with an increase in pasture
production in spring and decrease in soil sulphate and mineral N in the top 1 50mm.
By Jan. the pasture S and N concentrations were lower than the critical S and N
concentrations of 0.23% and 3 .00%, respectively (Jones et al. , 1972; M�aught, 1970)
even though pasture production decreased during this period suggesting that adequate
S and N were not supplied for maximum plant growth.
The N/S ratio of mixed pasture samples ranged from 10- 1 2 from early winter till the
end of spring at all sites (Table 5 .6). By early summer it decreased to less than 10.
According to Metson (1973) N/S ratios of 14 or greater occur when either S is
deficient or N is more than adequate; while a value of 1 1 indicates inadequate N and
more than adequate S . Pasture S concentrations were always greater than 0.25% in
late winter and throughout spring. Thus the low N/S ratios indicate that more than
adequate S was supplied, because the pasture S concentrations was always greater than
0.25%. Concentrations above 0.25% S are adequate for maximum growth of a mixed
clover-rey grass pasture (Metson and Saunders, 1978). The low N/S ratio and low N
and S concentrations in early summer indicate that adequate S and N were not
available from the soil for maximum pasture production suggesting that the low soil
moisture content during the summer reduces the availability of both S and N by
reducing N and S transport to roots and the mineralization rates of S and N.
5.3.8 Sulphur and N Removed in Pasture
The total amounts of S and N removed in pasture were much greater at high fertility
sites ( 25.3 and 26.6 kg S ha·l, 267 and 282 kg N ha-1 for low and medium slopes,
respectively) than low fertility sites (9.8 and 13 .5 kg S ha-1 , 1 13 and 155 kg N ha-1 for
low and medium slopes) (Fig.5.5 and 5.6). In the low fertility farmlet greater amounts
of S and N were removed by pasture from the medium than low slope area. The
reason for this apparent anomaly have been discussed in section 5 .3 .6.

Fig.5.5 Cumulative amounts of sulphur removed by pasture from Jun. 1 989 to Jan . 1 990 at all sites . Harvests were made on 5/9/89, 6/10/, 6/1 1 , 30/1 1 and 8/1/90.
(Vertical bars = L S D, p<0.01 ) .
30
2 5
"'0 � 20 0 E Q.) '- o (/) � 1 5 Q.) CJ'l
> � · -..... 0 :::1 E 1 0 :::1
(.)
5
0 !� I ";:= I I I 0 50 1 00
No.of days
1 50 200 250
- LF - LS
+ LF -MS
-*- HF - LS
6 HF-MS
1-' 0 C1)

Fig.5 .6 Cumulative amounts of nitrogen removed by pasture from Jun. 1 989 to Jan. 1 990 at all sites. Harvests were made on 5/9/89 , 6/10, 6/1 1 , 30/1 1 and 8!1/90.
(Vertical bars = L S D, p<O.Ol) .
300
250
"'0 � 200 0 E Q) '- o z � 1 50 Q) CJl > �
:;::; 0 E 1 oo :J
u
50
�� I O k� I I I v
0 50 1 00 1 50 200 250 No. of days
- LF - LS
+ LF -MS
-*- HF - LS
B HF-MS
I-' 0 -.J
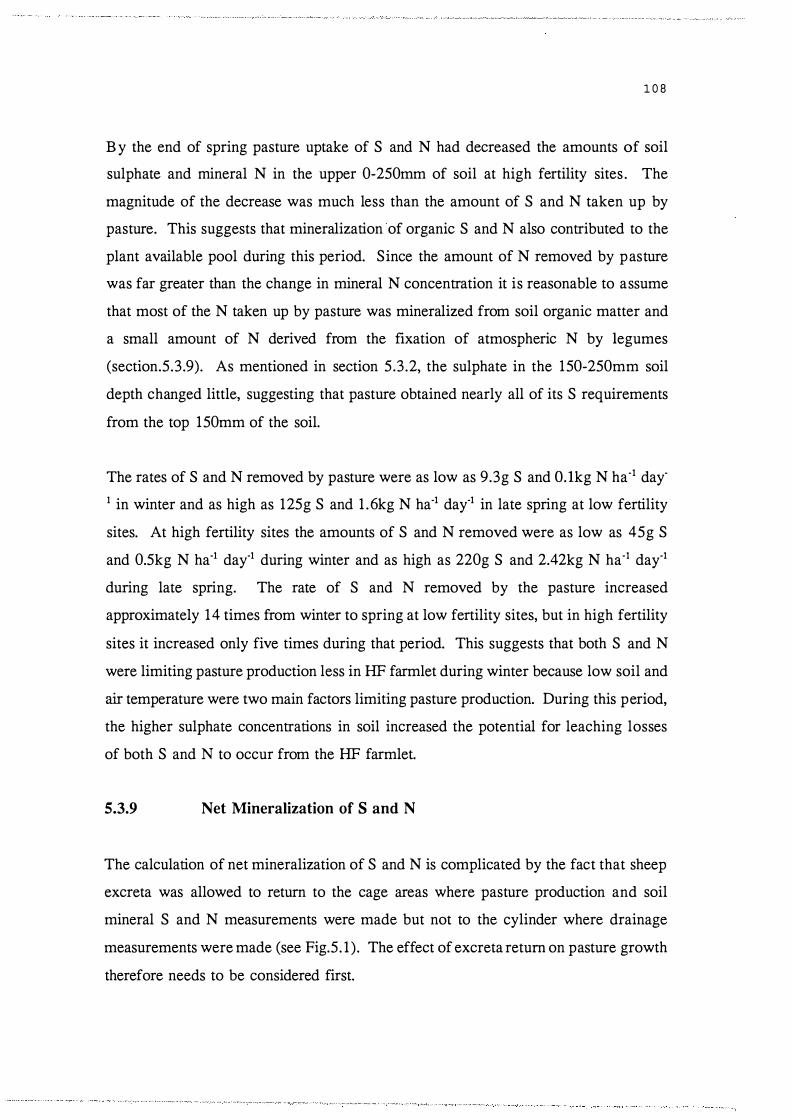
1 0 8
B y the end of spring pasture uptake of S and N had decreased the amounts of soil
sulphate and mineral N in the upper 0-250mm of soil at high fertility sites . The
magnitude of the decrease was much less than the amount of S and N taken up by
pasture. This suggests that mineralization of organic S and N also contributed to the
plant available pool during this period. Since the amount of N removed by pasture
was far greater than the change in mineral N concentration it is reasonable to assume
that most of the N taken up by pasture was mineralized from soil organic matter and
a small amount of N derived from the fixation of atmospheric N by legumes
(section.5.3.9). As mentioned in section 5.3.2, the sulphate in the 150-250mm soil
depth changed little, suggesting that pasture obtained nearly all of its S requirements
from the top 150mm of the soil.
The rates of S and N removed by pasture were as low as 9.3g S and O. lkg N ha-1 day-
1 in winter and as high as 125g S and 1 .6kg N ha-1 day-1 in late spring at low fertility
sites. At high fertility sites the amounts of S and N removed were as low as 45g S
and 0.5kg N ha-1 day-1 during winter and as high as 220g S and 2.42kg N ha-1 day-1
during late spring. The rate of S and N removed by the pasture increased
approximately 14 times from winter to spring at low fertility sites, but in high fertility
sites it increased only five times during that period. This suggests that both S and N were limiting pasture production less in HF farmlet during winter because low soil and
air temperature were two main factors limiting pasture production. During this period,
the higher sulphate concentrations in soil increased the potential for leaching losses
of both S and N to occur from the HF farmlet.
5.3.9 Net Mineralization of S and N
The calculation of net mineralization of S and N is complicated by the fact that sheep
excreta was allowed to return to the cage areas where pasture production and soil
mineral S and N measurements were made but not to the cylinder where drainage
measurements were made (see Fig.5. 1 ). The effect of excreta return on pasture growth
therefore needs to be considered first.

1 0 9
5.3.9.1 Quantitative Estimation of Excreta Return
Distribution of excreta in grazed pastures is dependant upon factors such as stocking
rate, camping behaviour, grazing pattern, animal type and frequency of excretion
(Wilkinson and Lowery, 1973; Gillingham et al. , 1980). For S returned in sheep
excreta it has been calculated that the ratio of S excreted in dung:urine is 40:60
(Wilkinson and Lowery, 1973). They also reported that an increase in the
concentration of S in pasture increases the amount of S in urine. In the case of N it
has been shown that about 30% of the N is excreted in dung and the remaining 70%
returned in urine (Barrow and Lambourn, 1962). At the Ballantrae farmlets pasture
utilization has been estimated at 70%. Therefore it is assumed that 70% of the pasture
S is consumed by the sheep and 15% of the consumed S and N is removed in animal
product (Wilkinson and Lowery, 1973). The amounts of S and N that is returned in
excreta is given in Table 5.7. In hill country the return of nutrient in excreta per unit
surface area is confounded by land slope, regional climate and their influence on the
grazing and camping behaviour of the sheep (Saggar et al., 1990a). Of the excretal
return it was assumed using the data of Gillingham et al. ( 1980) that 60%, 30% and
10% of dung and 55%, 3 1 % and 14% of urine were returned to low, medium and
steep slopes, respectively. Calculations on the amount of S 04= returned to both low
and medium slope are given in Appendix-5.3. A similar calculation was also made
for N (Wilkinson and Lowery, 1973; Gillingham et al., 1980). The amount of S and
N ingested by the animal and returned in excreta is given in Table 5.7. Even though
considerable amounts of sulphate and readily available N are returned in excreta, the
amounts of this excretal S and N taken up by pasture plant are low (about 7% of S
and 6% N in urine and 1 .9 % of S and 3.7% N in dung over 1 50 days of pasture
growth, see Chapter-7). Remaining excretal S and N enters the soil organic S and N
pools and becomes plant available over a longer period. Goh and Nguyen (1990) also
reported only 7% recovery of urinary S by mixed ryegrass-white clover pasture after
270 days. The immediate and direct contribution of excreta S and N to plant uptake
and growth can be considered small (see Chapter-7).

Fannlet
LF-LS
LF-MS
HF-LS
HF-MS
Table 5.7. Amounts of dry matter and S and N consumed and the amounts of
readily available S and N returned in excreta in whole farmlets and
the calculated amounts of excretal S and N taken up by pasture.
Pasture consumed· S and N returned in Plant uptake of
excreta Excreta S and N
kg/ha
Dry matter s N s N s N
2642 6.9 79.3 6.8 64.4 0.45 3.8
3632 9.5 108.5 2.9 27.5 0.21 1 .7
5815 17.7 186.2 15.3 137.0 1 . 1 8.0
5963 18.6 196.7 6.2 57.2 0.4 3.5
* Assuming 70% ingestion of total pasture production.
I-' I-' 0

5.3.9.2 Net mineralization of S and N
The net mineralization of S was calculated using the following formula.
Where
Sm= Sulphur net mineralized (kg S ha-1) for an experimental period.
Sr= Soil sulphate S (kg S ha-1) at the end of the experimental period as
measured by extracting the soil with 0.04M Ca(H2P04)z.
Si= Soil sulphate S (kg S ha-1) at the beginning of the experimental period
as measured by extracting the soil as mentioned above.
P = Total S removed by plants (kg S ha-1) over the experimental period.
L = Total S lost by leaching (kg S ha-1) over the experimental period.
E = Total excretal S taken up by plants and lost by leaching (kg S ha-1)
over the experimental period.
1 1 1
The net mineralization of N was calculated in the same way as S . Mineral N in the
soil at the beginning and at the end was measured using 2M KCl extract and the
pasture uptake of N includes an unknown amount of N (usually < 10% of the total
pasture N) contributed by clover fixation (see same section below). The same
procedure was used to calculate the net mineralization of S and N for various seasons
during the experiment. An illustration of the calculation of the net mineralization of
S and N is described in Table 5 .8 for LF-LS and HF-LS sites. Based on the results
in Chapter 7 and those of Goh and Nguyen (1991 ) it was estimated that 7% of total
excretal S and N deposited was recovered in plant uptake over the whole experimental
period (217 days, Jun. 1989 to Jan.1990).
Over the 217 day period 27.5 kg S ha-1 and 25 1 kg N ha·\ respectively, were
mineralized at the high fertility farrnlet and 1 2 kg S ha-1 and 1 19 kg N ha·\
respectively, were mineralized at the low fertility farrnlet (Fig.5.7). The greater
amounts of S and N mineralized at HF sites reflect the greater amounts of fertilizer
previously applied and the impact this has had on legume growth, nitrogen fixation,

Table 5.8 Calculation of the net mineralization of S and N during the periods of early winter and late spring for LF-LS and HF-LS
sites (the symbols are described in text).
-------------Season Nutrient Farm let si Sr
kg ha·1
Winter s LF-LS 15.8 22.5
1-IF-LS 44.0 33.0
N LF-LS 1 1 .3 17.6
1-IF-LS 10.0 17.5
Spring s LF-LS 16.8 14.4
1-IF-LS 34.0 3 1.9
N LF-LS 1 1.5 6.1
1-IF-LS 22.5 6.7
p L
0.3 0.75
1 .6 3.6
3.6 0.2
18.2 0.8
3.0 0.0
5.3 0.0
37.8 0.0
58.1 0.0
E
0.0
0.8
0.1
0.7
0.1
0.2
1.2
1 .8
sm
7.7
-6.6
10.0
25.8
0.5
3.0
3 1 . 1
40.5
..... ..... N
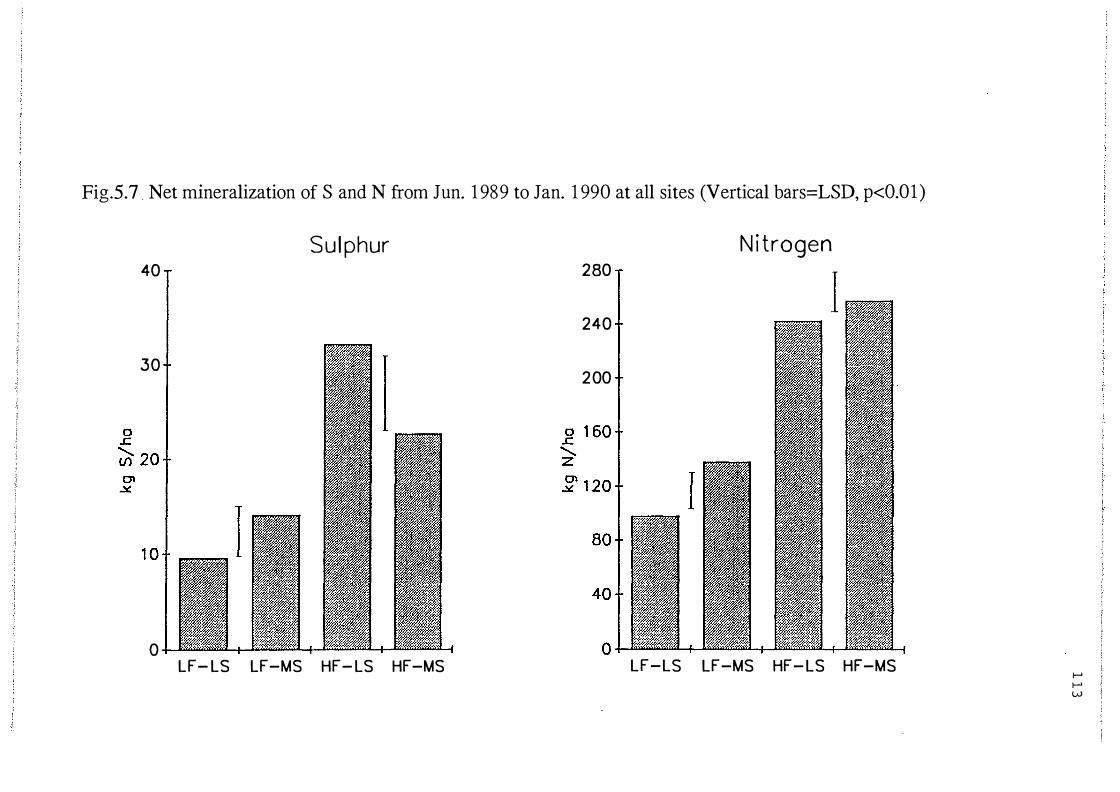
Fig.5.7 Net mineralization of S and N from Jun. 1 989 to Jan. 1 990 at all sites (Vertical bars=LSD, p<0.01 )
S u l phur N i trogen 40 280
240
30 200
0 0 ( r--r-·...-.-.-.-........... fi'"? [ 'i·iW??!:?i?Vt? .. n (
LF- LS LF-MS HF- LS HF-MS LF-LS LF-MS HF-LS HF-MS t-' t-' w

1 1 4
pasture production, carrying capacity and the amount of dung and urine returned.
Compared to the LF farmlet for an additional 250kg SSP ha·1 year·1 applied, which is
equivalent to an addition of 30 kg S ha·1 year·1, an additional 22.5 kg S ha·1 was
mineralized at the HF low slope. At the medium slope of LF and HF sites the
difference (7 .5 kg S ha-1) was much smaller reflecting the smaller amounts of dung
and urine returned to the medium slopes. Also compared to the LF farmlet additional
amounts (144 and 1 19 kg N ha-1) of N were mineralized at low and medium slopes
and available for pasture uptake at the HF farmlet.
Fertilizer and excretal S inputs have increased the amount of S in the labile sulphate
ester pool. It has already been demonstrated (Chapter-3) that fertilizer and excretal
deposition increased the ester sulphate pool, the pool from which most of potentially
mineralized S originates in these soils.
There was no difference in the amounts of S and N net mineralized at low and
medium slopes in the low fertility farmlet. The effect of the prevailing North
Westerly wind on animal camping behaviour and the impact this had on excreta return
at these two sites explains the lack of difference found at this site. At the high
fertility sites the amount of S net mineralized was significantly greater on the low
slope (Fig.5.7). This difference did not extend to the amounts of N mineralized.
Although net mineralization of S and N was observed over the eight months of the
study, net mineralization of S and N was not continuous over that period (Table 5 .9).
In early winter net immobilization of S occurred in high fertility sites while N was
mineralized at all sites (Table 5.9). This immobilization of S occurred because the
decrease in extractable soil sulphate could not be accounted for in the plant uptake or
losses by leaching. It is unclear why the pattern of S and N turnover should differ in
early winter. For mid to late winter net mineralization of both S and N occurred at
all sites. Within a short period between late winter to early spring ( 15 days) net
immobilization of both S and N was observed. With one exception (Table 5.9), from
early spring onwards net mineralization of both S and N was observed at all sites.
The ratio of N to S mineralized were approximately 10 and 9.5 for low and high

---···-····----Farmlet 3 1/5-4n
s N
LF-LS 7.7 10_0
LF-MS 4.7 15 .6
HF-LS -6.8 25.8
HF-MS -3.6 28.8
Table 5.9 Amounts of S and N net mineralized• during the experiment
(31/5/1989 to 8/111990) for all four sites
4n-25/8 25/8-5/9 5/9-6/1 1 6/1 1-30/1 1
s N s N s N s N
kg ha-1
6.5 16_5 -5.3 -15.5 -2.0 34.0 0.5 3 1 . 1
19.7 55.9 - 18.3 -52.7 4.9 67.2 2.3 36.0
32.4 46.4 -21 . 1 0.7 15 .1 89.0 3.0 40.5
1 6.7 28.4 -5.4 5.8 13 . 1 1 17.3 6.6 41 .6
minus sign indicates net immobilization during the period.
30/1 1 -8/1/90
s N
2.3 29.0
1 .0 29.7
8.3 49.8
5 .9 56.9
t--' t--' U1

1 1 6
fertility sites, respectively, which unlike the ratio of N to S mineralized in the
laboratory study (N to S ratio of 2 to 3), is very close to the N to S ratio of the soil
organic matter in these soils (Chapter-3, Table 3 .2 and 3.4) . While the total C, N and
S for the soil around each of the 48 individual lysimeters were not measured the total
C, N and S in the bulked soil samples for each site were measured. Using the means
of the four site data sets no significant relationship between C/N and N mineralized
or C/S and S mineralized could be found to explain the amounts of N and S
mineralized at each site.
The total amount of N net mineralized for the individual lysimeters was strongly
correlated to the total pasture production (Fig.5.8). In this study the exact amount of
N mineralized from soil organic matter was slightly over estimated, since the total
amount of N removed by pasture included an unknown amount of N fixed from the
atmosphere by the legumes. This amount is likely to be small, because total N uptake
by legumes was less than 10% of the total pasture production and not all the N taken
up by legumes is derived from the fixation. Legumes in established pastures may
derive about 50% of their N requirements from soil (Field and Ball, 1978). The
correlation coefficient (r=O. 98 1 ) for the relationship between the net mineralization of
N and the total pasture production (Fig.5.8) was not changed much from the
correlation coefficient (r=0.970) obtained for the relationship between the net
mineralization of N and the pasture production other than legumes (Fig.5.9). This
showed that a majority of the pasture N was derived from the mineralization of the
soil organic matter. The linear nature of the regression indicates that N availability
was limiting pasture production even on the high fertility low slope site and probably
explain why little N was leached from these hill country pastures.
In the case of S , at mineralization rates of <15 kg S ha-1 the majority of S was taken
up by pasture (Fig.5 . 10) . At higher mineralization rates a much greater fraction of S
was lost by leaching. The data indicates that at the high fertility sites S is not limiting
pasture growth, but is being utilized inefficiently because of limited supply of N for
pasture growth. This aspect will be examined and discussed in greater detail in
Chapter-6.

r-rl 'ri
Fig.5 . 8 Relationship between N net mineralized and pasture dry matter production from Jun. 1 989 to Jan. 1 990 at all sites. Values for 40 individual lysimeters.
1 2000 I
+ Y= 787+30.6X
1 0000 + R4:0.964
+ I c 8000 0 ...... u o ::J .c I / .L + -o , e � 6000 a.. o d) (J"' s � ...... (() 0 4000 a..
2000
0+-----�---4----�----4-----�----�--� 0 50 1 00 1 50 200 250 300 350
N Net Minera l ized (kg/ha)

Fig.5. 9 Relationship between nitrogen net mineralized and pasture dry matter other than legumes produced from Jun. 1 989 to Jan. 1 990 at all sites. Values for 40 individual lysimeters.
1 2000 I +
1 0000 t Y= 603+29X
R2=0.957 I "0
Q) 8000 u :J o "O ..c o , a:: � 6ooo T 0 Q) v + +
\... (1\ .a � (/) 0 4000 Cl..
2000
0 +---�-----r----r----+-----r----+---� 0 50 1 00 1 50 200 250 300 350
Net N minera l ized(kg N/ha)
I-' I-' CO

Fig.5. 1 0 Relationship between S net mineralized and pasture dry matter production from Jun. 1 989 to Jan. 1 990 at all sites. Values for 40 individual lysimeters.
1 2000
1 0000
c 8000 0 o+J u o :::l ..c I "'() ............ 2 ::?; 6000 CL o � Ol :::J �
o+J (f) 0 4000 Q_
2000 I /
I 0
0
Y=938+ 1 0073•( 1 -exp(-0.045X))
R2
=0.693
+
I++ + +
1 0 20 30 40 S Net Minera l ized (kg/ha)
+
50 60
...... ...... 1.0

1 2 0
5.4 GENERAL DISCUSSION AND CONCLUSION
The mini-lysimeters with ion exchange resin traps developed in Chapter-4 are effective
for measuring the leaching losses of both anions and cations in hill pastures under
field conditions. The technique allows the net mineralization of S and N in the field
to be calculated by establishing losses by leaching to be added to the N and S taken
up by pasture and that remaining in the soil solution. Previously calculation of net
mineralization of S and N under field conditions has not been measured mainly
because there has been no direct measurement of the losses of S and N by leaching.
The lysimeter method was successfully used to calculate the mineralization of S and
N in presence of grazing animals. The study clearly showed that a greater
mineralization of S increased the leaching losses of S but a greater mineralization of
N increased the uptake of N.
Application of 375 kg SSP ha·1 year·1 to the high fertility farmlet, a three fold increase
in S application over the low fertility farmlet ( 125 kg SSP ha·1 year-1), doubled the
pasture production of the high fertility sites and increased S leaching losses by
approximately 7 times. Nitrogen leaching was not increased. This demonstrates that
cycling of S in low fertility farmlet was more efficient with a greater proportion of the
S returned in excreta and mineralized from soil organic matter being either taken up
by pasture or soil microorganisms. Less S remained in the soil solution to be lost by
leaching. Although N mineralization doubled the amount of N lost by leaching, the
amount of N lost by leaching was insignificant in terms of agricultural efficiency. In
general N was efficiently used in both low and high fertility farmlets. Increased SSP
application also increased the leaching losses of Ca, Mg and K.
It has been shown that although approximately 10 times more N than S was taken up
by pasture and cycled via animal to soil, sulphate and not nitrate was the dominant
anion in the drainage waters. The concentration of ammonium in the drainage was
also low. An average of ten times more S than N was found in the drainage waters
below 25cm depth suggesting that in hill country pastures of even high fertility, N
cycling is more efficient than S cycling and that much of the mineralized N is used
1 2 1
by pasture and microorganisms. Nitrate leaching in these hill country pastures does
not appear to be an important process affecting the soil N levels,the N economy of the
sward and contributes only small amounts to fresh water and aquatic ecosystems.
Nitrogen was the key nutrient limiting plant biomass production in the hill country
pasture used in this study. Sulphur plays a secondary role so that much of the S
mineralized was lost by leaching from the system.
The amounts of sulphate and mineral N present in the soil throughout the experimental
period clearly showed that in the low fertility farmlet most of the S and N taken up
by pasture and lost by leaching was derived from the mineralization of soil organic
matter. In the high fertility farmlet there was a greater source of S and N in the
mineral pools in the soil solution. For the majority of the growing season the mineral
S and N present below 1 50mm of the soil showed little availability for plant uptake.
Mineral S and N below 1 50mm of the soil can be regarded as lost from the plant
animal cycle.
An issue not examined in this Chapter was the fate of freshly applied fertilizer S and
the relative contributions of freshly applied fertilizer S and mineralized S to plant
uptake and the quantities of each lost by leaching. The direct effect of freshly applied
fertilizer S has on the mineralization of soil organic S and N was also not examined
in this study. These aspects will be examined in the next Chapter where further
studies are carried out using the same mini-lysimeters.

6.1
CHAPTER-6
FATE OF FERTILIZER SULPHUR APPLIED TO GRAZED
HILL COUNTRY PASTURES
INTRODUCTION
122
In the previous field study it was shown that variable amounts of S and N were
mineralized from pasture soils, depending upon their past fertilizer history ( Chapter
5). The study showed that most of the N mineralized was utilized by plants leaving
an insignificant amount of mineral N in the soil solution which was lost by leaching.
In contrast, substantial amounts of the S mineralized were lost from the soil by
leaching.
The influence of a current fertilizer application on the amounts of S mineralized, taken
up by plants and lost by leaching has not been studied. It has been suggested that the
losses of S immediately after fertilizer application may represent a substantial
proportion of S losses from these hill country pastures (Saggar et al., 1990a). Further
studies are required to provide information on the proportions of mineralized and
fertilizer S taken up by plant and lost by leaching. Such information can be obtained
by using 35S labelled fertilizer and by monitoring the transformation of 35S in soil and
the movement of the tracer to plants and drainage water.
In New Zealand (Gregg and Goh,1979) and Australia (Till and May, 197 1), only a
limited number of field studies have used 35S labelled fertilizer to investigate the fate
of fertilizer S applied to grazed pastures. In each of the studies conducted the
recovery of fertilizer S in soil-plant-animal system did not include a direct
measurement of 35S losses by leaching. Generally the 35S unaccounted for or the
difference between the applied and recovered 35S was assumed to be lost from the soil
by leaching. Fertilizer leaching losses calculated from mass balances can overestimate
the actual losses because applied fertilizer may influence the mineralization of soil
organic S (priming effect) which can also be lost along with fertilizer S . Neither the
work of Gregg and Goh,(1979) nor Till and May,( 1971) examined the effect of the

123
previous fertilizer history on the mineralization of soil organic S and subsequent plant
uptake and losses by leaching. In both the above studies radioactively labelled
gypsum was used to trace the movement of S in the soil-plant-animal system rather
than 35S labelled SSP, the common S fertilizer for pastoral system in New Zealand and
Australia. The presence of phosphate may enhance the losses of sulphate by leaching
in some soils (Bolan et al., 1988). Therefore under certain situations, experiments
using gypsum may underestimate the losses of S by leaching from fertilizers
containing both S and P. Compounding this effect pasture growth may be P
responsive, thus SSP fertilization rather than gypsum may lead to an increased plant
uptake of S .
The objective of this study was to investigate the fate of recent (fresh) fertilizer S
applied to legume based hill country pastures as 35S labelled SSP. In addition the
effect of freshly applied fertilizer on the mineralization of soil organic S and N and
subsequent plant uptake and losses by leaching under field conditions were also
investigated. By working at more than one site it was possible also to examine the
effect that the rate of fertilizer application and the residual effect of previously applied
fertilizer had on plant uptake, losses by leaching and the mineralization of soil organic
S and N.
6.2 MATERIALS AND METHODS
The study built on the previous field experiment ( Chapter-5), that investigated the
mineralization rates of organic S and N, plant uptake and losses by leaching of these
two nutrients from two slope categories in fertilized grazed hill pastures ( Chapter-5).
Of the eight cores monitored in the previous study in each of the two farmlets and two
slopes, 4 cores were topdressed with radioactively labelled 35S-SSP and the remaining
4 cores remained unfertilized. Cores not receiving fertilizer enabled the residual effect
of the previous fertilizer applications to be examined

6.2.1 Preparation of Radioactively Labelled 35S
Superphosphate
1 2 4
Apatite rock reacts with concentrated sulphuric acid and produces SSP. The
stoichiometric equation for the reaction is ·
According to the stoichiometric equation the amount of sulphuric acid required for
100% acidulation of one gram of rock which contains 18 .45% of phosphorus is
6 8 6 x1 = 0 6 8 1 g 1 0 0 8 .
Where 686 is the amount of sulphuric acid (g) required to acidulate completely one
molecular weight (1008) of apatite rock. In the experiment the SSP was prepared by
using 50:50 mixture of Nauru:Christmas Island rocks which contains approximately
15% phosphorus. So the amount of sulphuric acid required to acidulate 1g of this
mixture is
0 . 6 8 1 x 1 5 . 0 0 = 0 _ 5 5 3 g 1 8 . 4 5
The volume of concentrated sulphuric acid required for 100% acidulation
0 · 55 3 = 0 . 3 0 1m1 1 . 8 4
where 1 . 84 is the specific gravity of concentrated sulphuric acid. The acid is normally
diluted to 65% by addition of water. The amount of 65% sulphuric acid required for
100% acidulation
0 · 3 0 1 = 0 . 4 6 6 m1 0 . 6 5
Two separate quantities of SSP were prepared for both low and high fertility farmlets.
For both low fertility sites, 1 .4 grams of phosphate rock was mixed with 0.625ml of
65% sulphuric acid which had been previously labelled with 5mCi 35S-sulphate.
Approximately 2 grams of SSP were prepared. For both high fertility sites, 4.2 grams
of rock was mixed with 1 .96ml of 65% sulphuric acid previously labelled with 5mCi
1 2 5
35S-sulphate. Approximately 6 grams of SSP was prepared. Before mixing, the
sulphuric acid was warmed to about 60-70°C. After acid addition, drops of water
were added to improve the uniformity of mixing. The mixture was then dried in the
oven at 60°C.
6.2.2 Application of Fertilizer
To avoid the loss of labelled SSP the fertilizer was not granulated in a drum.
Granulation was simulated by weighing exactly 0.073g of radioactively labelled SSP
in to gelatin capsules. Three capsules of fertilizer were placed on each core in low
fertility sites at a rate of 125 kg SSP ha-1 (see Figure of cage and core placement,
section 5.2) . Similarly 0. 134g of radioactively labelled SSP was weighed into gelatin
capsules and five capsules of fertilizer were placed on each core in high fertility sites
at a rate of 375 kg SSP ha-1 • The amounts of labelled fertilizer sulphur applied, the
activity of the added 35S and the specific activity of the fertilizer for each of the four
sites are presented in Table 6. 1 . The fertilizer was applied on 12 January 1990.
6.2.3 Rainfall, Drainage and Pasture Measurements
The daily rainfall was measured throughout the experiment at all four sites. Predicted
net drainage was calculated for each site (calculations are described in Chapter-S,
section 5.2.3. 1 ). In addition, two additional mini-lysimeters with drainage water
collection vessels (instead of resin trap) were inserted in each of the four sites and the
drainage water was collected. The amounts of drainage collected at each site were
compared with the predicted net drainage.
The pasture was harvested depending upon growth. A total of six cuts were made for
the period from January to October 1990. Pasture samples were oven dried at 60°C
and the dry matter weighed. The bulk sample was ground and a subsample was used
to determine total N and S and the 35S activity.
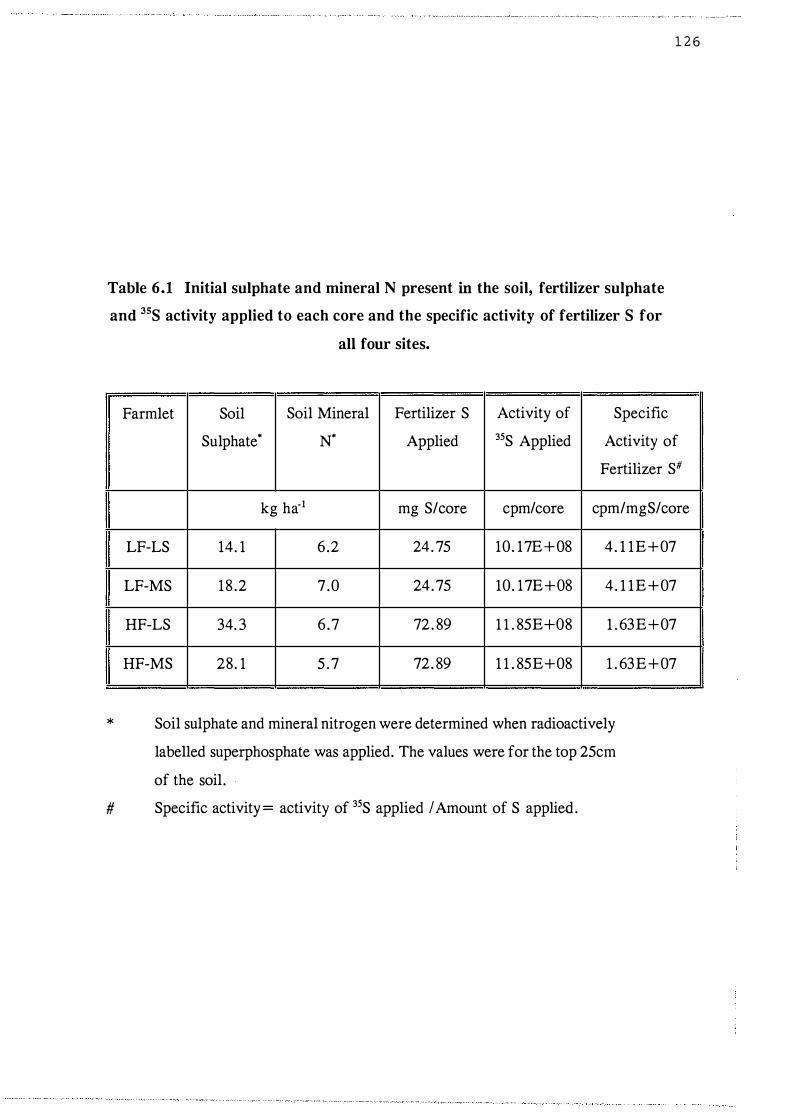
1 2 6
Table 6.1 Initial sulphate and mineral N present in the soil, fertilizer sulphate
and 35S activity applied to each core and the specific activity of fertilizer S for
all four sites.
*
Farmlet Soil Soil Mineral Fertilizer S Activity of Specific
Sulphate* N* Applied 35S Applied Activity of
Fertilizer su
kg ha-1 mg S/core cpm/core cpm/mgS/core
LF-LS 14. 1 6 .2 24. 75 10. 17E+08 4. 1 1E+07
LF-MS 18 .2 7 .0 24.75 10. 17E+08 4. 1 1E+07
HF-LS 34. 3 6 .7 72 . 89 1 1 . 85E+08 1 . 63E+07
HF-MS 28. 1 5 .7 72. 89 1 1 . 85E+08 1 . 63E+07
Soil sulphate and mineral nitrogen were determined when radioactively
labelled superphosphate was applied. The values were for the top 25cm
of the soil.
# Specific activity = activity of 35S applied I Amount of S applied.

1 2 7
Resin collection from the resin trap lysimeter (as in Chapter 5, section-2) coincided
with pasture harvests which were approximately at five week intervals. The resins
were eluted with 50ml lM NaCl as described in Chapter-4, section 2.2.3. The
amounts of sulphate, mineral N and 35S activity in the eluates were measured in order
to calculate the losses of S and N by leaching.
Each time the resin was changed in the lysimeter, soil samples were collected from
all four sites from outside the cores. All four pasture cage sites were topdressed with
SSP at the same time the cores were topdressed, equivalent to the labelled SSP applied
to the cores. When cage sites were topdressed the core surfaces were completely
covered using plastic saucers. Soil samples were collected in the cage sites from Jan.
to Oct. 1990. Extractable sulphate and mineral N were measured for three soil depths
(0-75, 75-150 and 150-250mm) ( Chapter-5, Section 5.2).
6.2.5 Analytical Measurements
The pasture S and N content, the concentrations of sulphate and mineral N in the resin
eluates and the extractable soil sulphate and mineral N were measured as described
in Chapter-5, section 5.2. The 35S activities of the pasture and the resin eluates were
measured by counting the activity of the herbage digest or the eluate of the resin using
a Beckman LS 3801 liquid scintillation counter. The scintillation cocktail for
measuring the activity of 35S was prepared as mentioned in the following section.
6.2.5 Preparation of Scintillation Cocktail
Two litres of cocktail were prepared by mixing 8g of 2,5-diphenyl oxazole (POP),
0.2g of dimethyl 1 ,4-di-[2-(5-phenyl oxazoyl)]-benzene (POPOP), 1340ml of toluene
and 660ml of triton-X 100. This cocktail was stirred for a minimum of 6 hours. The
activity of 35S was measured in a clear emulsion of 10 mls of cocktail and lml of the
resin eluate (or the diluted herbage digest) . All measurements of radioactivity were
corrected for decay and normalized to the day on which the 35S labelled SSP was
applied to the cores. A standard reference solution which was prepared from the
labelled SSP by dissolving labelled SSP in dilute hydrochloric acid. Quench
correction curves were prepared for each type of counting matrix.
1 2 8
6.3 RESULTS AND DISCUSSION
When fertilizer S is applied to grazed pasture, it rapidly enters the S cycle. Sulphur,
first enters to the soil solution sulphate pool. The rate of entry of fertilizer S to
sulphate pool depends upon, among other factors, the soil moisture which is
influenced by the amount of rainfall. Once S enters the sulphate pool, the fate is
determined by several factors such as plant uptake, leaching losses in drainage waters,
immobilization by soil microorganisms and adsorption onto soil sesquioxide surfaces
(Rhue and Kamprath, 1973; Freney et a/. , 1975; McLaren et a/. , 1985). In order to
monitor the fate of fertilizer S all of the components mentioned above should be studied.
6.3.1 Rainfall and Drainage
Drainage is a major vector for S loss, which is influenced by the amount of rainfall.
The monthly rainfall during the experimental period (from Jan. 1990 to Oct. 1990)
ranged from <50mm during Feb. to >250mm during Mar. 1990. Except for the
months of Feb. and Sep. drainage occurred at all four sites (Fig.6 .1 ) throughout the
experiment. The total rainfall during the experiment was higher (948mm) than the
long term average (800mm), in particular the rainfall was higher than the
corresponding period for the year 1989 (61 6mm). Winter rainfall during the
experiment was also higher than the year 1989 for the same period. The predicted net
drainage was significantly correlated to a 1 : 1 relationship with the measured drainage
collected from the lysimeters at all sites (Fig.6.2). About 9 1 . 1 % of the variation was
explained by the relationship. The close relationship between the predicted and
measured drainage also showed that surface runoff was negligible. Thus a simple
water balance model predicts drainage events and their size adequately.
6.3.2 Pasture Production
Increases in pasture production will influence the efficiency of S fertilizer use by
removing more S in the above ground plant material and causing a greater transfer of
S away from the site of uptake; plus extra 'root carbon' (Nei and Tinker, l980) may
be generated, increasing the immobilization of soil solution so4=.

Fig.6. 1 Rainfall and predicted drainage from Jan. to Sep. 1 990, rainfall for the year 1 989
300
250
200 -0 'E 1 50 ·c; 0:::
1 00
50
0
50
Q) 1 00 Ol -� 1 50 0 \....
0 200
250
300
and the long term average rainfall ( 1 979-1989) for the same period.
Jan Feb Mar Apr May Jun Jul Aug Sep
• 1 990 kill 1 9 7 9 - 1 989 D 1 989 11 Dra inage
t-' N 1.0

,......, E E
Fig.6.2. Predicted and measured drainage for the experimental period across all four sites. Symbols refered to four different s ites.
1 60 I Y=X
I 1 40 I
R2= 0.9 1 1 I
1 20
a:> 1 00 Ol 0 c 0 80 l..
"0 "0 Q) l.. 60 I ::l Q ik # Ul � 0 Q) :2 40
20
o kA\1 I I I I I I I 0 20 40 60 80 1 00 1 20 1 40 1 60
Predicted dra inage(mm)
.... w 0

131
Throughout summer (8/1/1990 to 26/3/1990) fertilizer application did not increase
pasture production at any site (Table 6.2). Superphosphate is primarily applied to
stimulate legume growth and biological N fixation. But the P and S applied might
have not been fully available during the early periods after application due to dry
conditions which prevailed during summer preventing SSP dissolution and/or the
pasture uptake of P and S. Differences in pasture responses to applied fertilizer were
first observed in autumn. By spring total pasture production for the 9 month period
was greater (p<0.01) in the fertilized than in the unfertilized plots at all sites (Fig.6.3).
Winter growth rates were slow (5.5 kg DM ha·1 day-1) compared to summer (29.6 kg
DM ha·1 day-1), autumn (17.9 kg DM ha·1 day-1) and spring (12.9 kg DM ha-1). The
positive effect of freshly applied fertilizer on pasture production had a cumulative
effect over the nine months of measurement. The fertilized plots at low fertility sites
produced an average of 24% more pasture than the unfertilized plots, while at high
fertility sites the fertilized plots produced an average only of 10% more pasture. Also,
fertilizer caused a greater absolute increase in pasture production at the low fertility
sites. This indicated that the residual effect of previously applied fertilizer was more
pronounced in high fertility sites than in low fertility sites and pasture growth was less
responsive to freshly applied fertilizer at this farmlet. This residual effect of
previously applied fertilizer on pasture production was observed in earlier studies by
Stephen,(1970), Gregg and Goh,(1979), Nguyen et al. (1989) and Lambert et al. ( 1990) for soils of both the South Island and the North Island of New Zealand. In
fact Stephen,(1970) did not observe growth responses even after withdrawing S
application for several years but Lambert et al. ( 1990) observed 1 .5% and 5%
decreases in pasture production during seven years after ceasing SSP application to
the low and high fertility farmlets at Ballantrae. Nguyen et al. ( 1989a) observed a
much greater decline (19%) in pasture production in the first year after cessation of
SSP application to irrigated pasture.
Mean pasture production was higher ( 1 8%) at high than at low fertility sites for the
nine month period. There was no significant difference in pasture production between
low and medium slopes at the high fertility farmlet, but the medium slope in the low
fertility farmlet produced more pasture than the low slope. This increased growth on

1 3 2
Table 6.2 Amounts of pasture produced in fertilized and unfertilized plots at
each site from Jan. to Oct. 1990.
*
Parmlet Treatment 8/ 1 to 26/3 27/3 to 1 /6 to 16/8
3 115
kg DM ha-1
LP-LS Pert 2067 803 224
Unfert 1724 505 101
LP-MS Pert 278 1 1089 341
Unfert 2344 808 209
L.S .D* 566 260 123
L.s .n·· 400 184 87
HP-LS Pert 2389 1662 643
Unfert 2689 1 189 467
HP-MS Pert 1622 1966 877
Unfert 1924 1246 642
L.S .D* 869 478 139
L.s .n·· 615 338 98
L.S .D. for fertilized and unfertilized treatments within a slope
catagory.
** L.S .D. for slopes and fertilized and unfertilized treatments within a
farmlet.
17/8 to
10/ 10
3 1 8
173
865
538
295
208
953
601
924
9 1 1
409
289

Fig.6.3 Pasture production for fertilized and unfertilized plots at all sites during the period from Jan. to Oct. 1 990 (Vertical bars=LSD, p<O.Ol) .
6000
5000
c 0
':;::# 4000 0 0 ::::IJ: u -....... £� 3000 (1) 0'1 5 � 1i) 2000 0 a..
1 000
0 LF- LS LF-MS
Farmlet HF- LS HF-MS
• Fert
D Unfert
1-' w w

134
the easterly facing medium slope was mainly due to camping behaviour of the grazing
animal brought about by the effect of the prevailing north westerly wind. This has
already been discussed in Chapter-S, section.S.3 .6.
6.3.3 Herbage Sulphur and Nitrogen Concentrations
The S and N concentrations of the pasture are indicators of the S and N status of the
pasture. This reflects the soil' s ability to supply S and N for maximum plant
production. The amounts of S and N removed by pasture is a function of S and N
concentrations of the pasture and the pasture growth rates. Sulphur and N
concentrations of the mixed pasture were low during summer and the concentrations
reached maximum during autumn. In winter they decreased slightly and were lower
than the autumn (Table 6.3 & 6.4) . During early spring the pasture S and N
concentrations were low and almost equal to the S and N concentrations of summer.
The low S and N concentrations during summer is due in part to greater pasture
growth rates and also due to the declining mineralization rates as moisture becomes
increasingly limiting ( Chapter-S) . The pasture S and N concentrations in spring of
this experiment were lower than the spring S and N concentration measured during
the previous year ( Chapter-S, section S.3) even though pasture production was also
lower. The greater leaching losses of S during the period from Jan. to Aug. 1990
prior to spring growth occurring might explain the lower S and N concentrations (see
section 6.3.5 on leaching). Nguyen et al. ( 1989) h�/-already shown that pasture S
concentrations decreased in spring due to winter leaching even in situations where
fertilizer was applied in the autumn.
Pasture S concentrations were lower than the critical S concentration of 0.25% at low
fertility sites during the summer and early autumn. Despite adequate S levels at the
end of April, the concentrations of N remained lower than the critical N concentration
of 3.00% at low fertility sites until end of May. At high fertility sites, the
concentrations of S and N were in general higher than at low fertility sites with the
concentration of S adequate through the nine months of measurement. Nitrogen
concentrations were lower than the critical N concentration (3.00%) in the first ( 16-2-
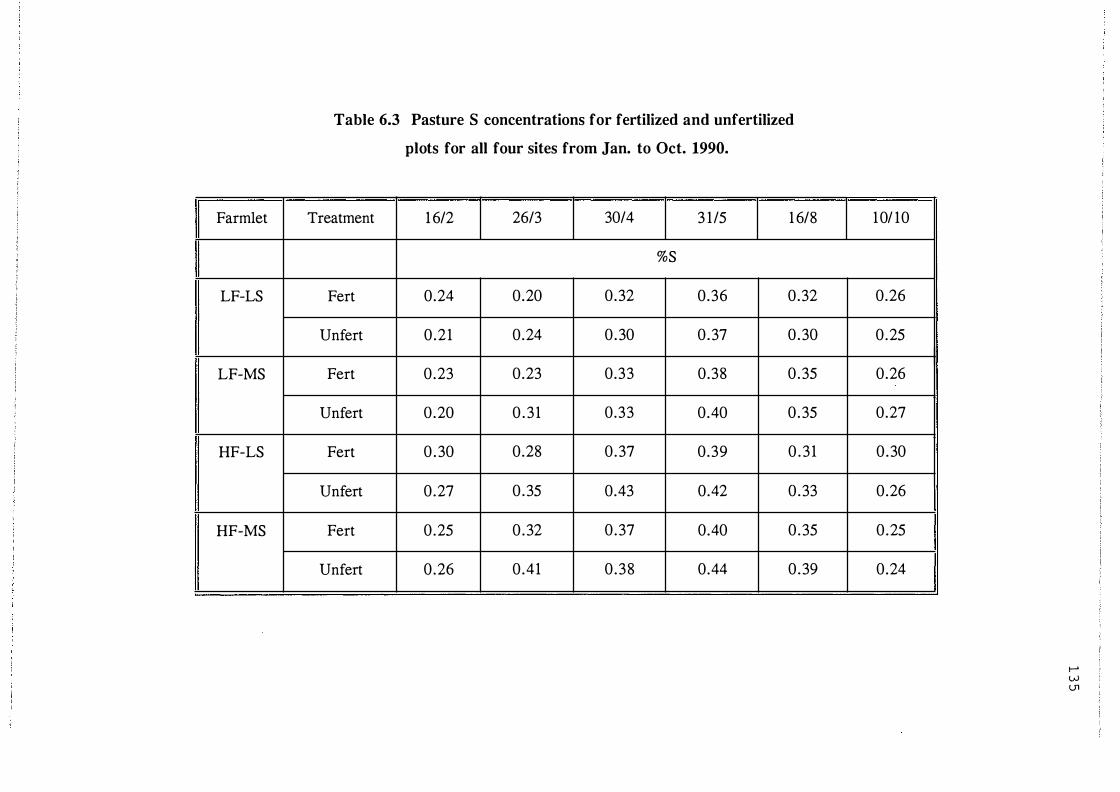
Farmlet
LF-LS
LF-MS
HF-LS
HF-MS
Table 6.3 Pasture S concentrations for fertilized and unfertilized
plots for all four sites from Jan. to Oct. 1990.
Treatment 1 6/2 26/3 30/4 3 1/5 1 6/8
%S
Fert 0.24 0.20 0.32 0.36 0.32
Unfert 0.21 0.24 0 .30 0 .37 0 .30
Fert 0.23 0.23 0.33 0.38 0 .35
Unfert 0.20 0 .3 1 0.33 0.40 0 .35
Fert 0 .30 0.28 0 .37 0.39 0 .3 1
Unfert 0.27 0 .35 0.43 0.42 0 .33
Fert 0.25 0 .32 0 .37 0.40 0 .35
Unfert 0.26 0 .41 0 .38 0.44 0 .39
101 10
0.26
0 .25
0.26
0.27
0 .30
0.26
0 .25
0.24
I
I
1-' w U1

--Parmlet
LP-LS
LP-MS
HP-LS
HP-MS
Table 6.4 Pasture N concentrations for fertilized and unfertilized
plots for all four sites from Jan. to Oct. 1990.
Treatment 16/2 26/3 30/4 31 /5 16/8
Pert 2 .5 1 2. 19 2 .76 2 .92 3 . 10
Unfert 2 .33 2.03 2.47 3 . 10 3 .25
Pert 2 .49 2. 14 2.56 3 .22 3 .43
Unfert 2 .26 2 .37 2.77 3 . 39 3 . 80
Pert 3 . 13 3 .25 3 .28 3 .53 3 . 68
Unfert 2 . 16 2 .77 3 . 30 3 . 74 3 .78
Pert 2 .40 2 .99 3 . 16 3 .53 3 .48
Unfert 2 .71 3. 15 3 .43 3 .73 3 . 72
10/ 10
2 .60
2 .31
2 .75
2 .62
2 . 88
2 .72
2 .55
2 . 8 1
!-' w (j\

Fig.6.4 Amounts of S removed by pasture in fertilized and unfertilized plots at all four sites during the period from Jan. to Oct. 1 990 (Vertical bars=LSD, p<O.Ol) .
(!) :X
20
1 6
.B 0 1 2 a...c :::> ........_ (!) (/) '::::I (Jl 1n � a 0 a.
4
0 LF- LS LF-MS
Formlet HF- LS HF-MS
• Fert
D Unfert
t-' w --.1
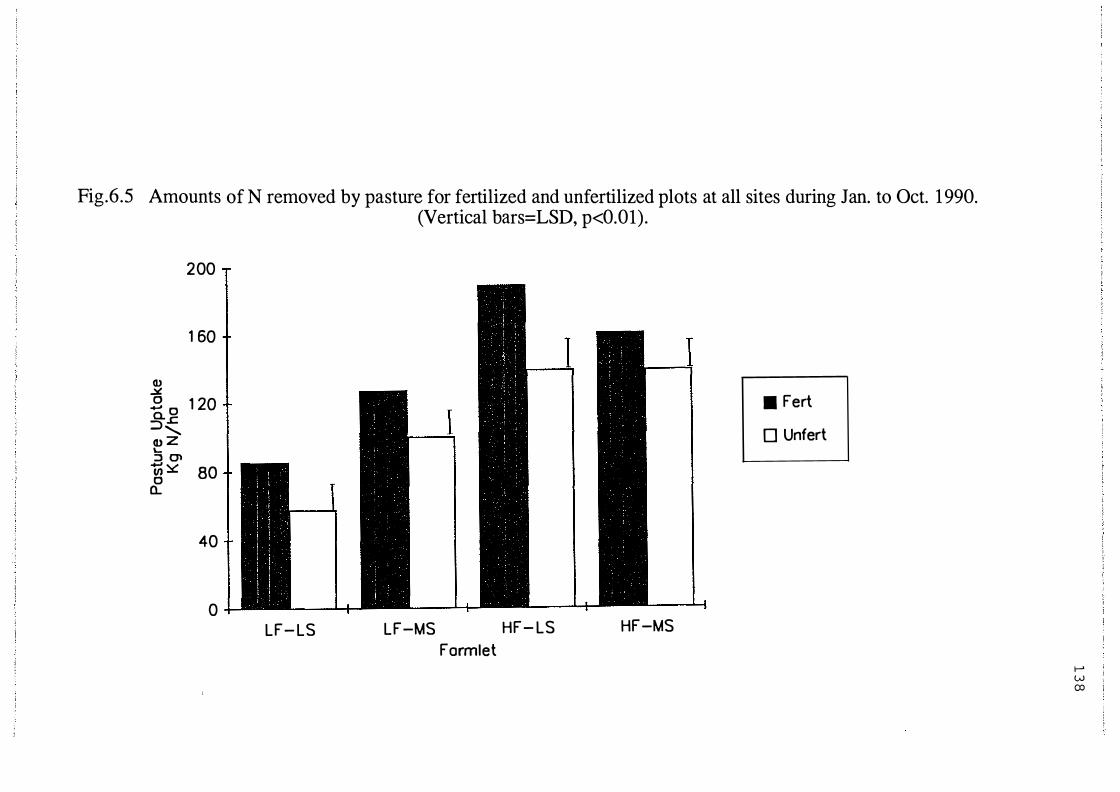
Fig.6.5 Amounts of N removed by pasture for fertilized and unfertilized plots at all sites during Jan. to Oct. 1 990. (Vertical bars=LSD, p<O.Ol).
200
1 60
Q) "5 1 20 ..... 0 O..c � , a> Z S Ol en � ao 0 a..
40
0 LF-LS LF-MS
Farmlet HF- LS HF-MS
• Fert
0 Unfert
1-' w (X)

1 3 9
1990) and the last ( 10-10- 1990) cuts. Although the rate of fertilizer application i s to
maintain N fixation through increasing plant S and P status, fertilizer application did
not consistently maintain pasture S and N concentrations at a high level in the
fertilized plots (Table 6.3 and 6.4).
6.3.4 Sulphur and N Removed by Pasture
The total amounts of S removed by pasture was greater (p<0.01) in fertilized plots
than in unfertilized plots at low fertility sites (Fig.6.4). At high fertility sites the total
amounts of S removed by pasture was not significantly different between fertilized and
unfertilized plots. This reflects the smaller response to freshly applied fertilizer at the
two high fertility sites. Freshly applied fertilizer has a much more important role in
supplying S directly to pasture at the low fertility sites. In the high fertility farmlet
there was no significant difference in pasture S uptake on low and medium slopes.
But in the low fertility farmlet more S was removed in medium slope than in low
slope. The reason for this was discussed in section 6.3.3.
The total amounts of N removed by pasture was significantly increased (p<O.O l ) by
fertilizer application at all sites (Fig.6.5). This showed that freshly applied fertilizer
encouraged greater mineralization of N and more pasture uptake at the fertilized plots.
Greater amounts of N were taken up by pasture at the two high fertility sites than at
the two low fertility sites. Pasture removed more N on low slopes than on medium
slopes at the high fertility farmlet, but at the low fertility farmlet pasture at medium
slope removed more N than the low slope. The reason for this reversal was discussed
earlier and is reflected in the higher fertility status of the medium slope site as shown
by the initial soil test results presented in Table 6. 1 .
6.3.4.1 Contribution of Soil and Fertilizer S to S Removed
by Pasture
The specific activity of pasture samples at all harvests were always much lower than
the specific activity of the fertilizer S applied (LF=4.1 1E+07 and HF=1 .63E+07
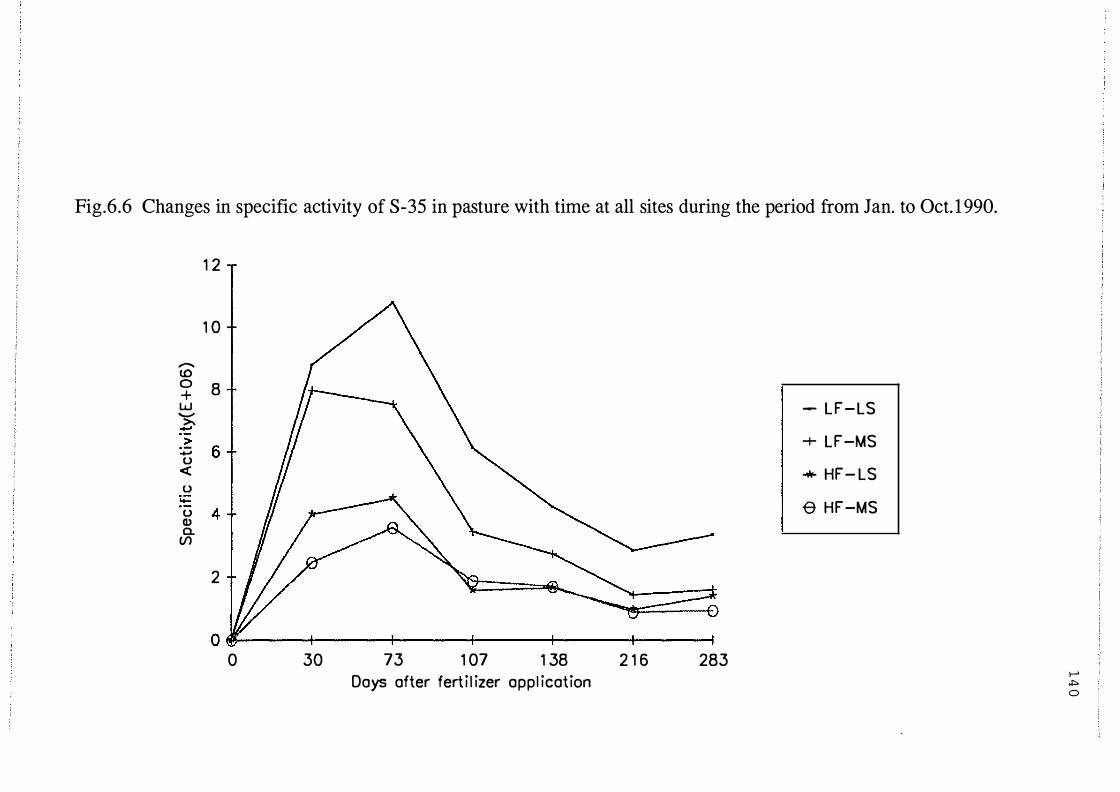
Fig.6.6 Changes in specific activity of S-35 in pasture with time at all sites during the period from Jan. to Oct. 1 990.
1 2
1 0
-tD 0 8 + w I 11 � \ I - LF-LS "-" >. ...... >
61 11 \ \ I + LF-MS :;; u <( I 11 \ ""- I + HF- LS
u t;: 4 1 If ._-------'\. \ ' I e HF-MS u Q) a. (/)
2
o�-------�---------+------�----------r------�----� 0 30 73 1 07 1 38 2 1 6 283
Days after fert i l izer appl ication I-' ,j:>. 0

*
* *
# 1
2
Table 6.5 Amounts of 35S activity, % fertilizer S removed, amounts of fertilizer and soil S removed by pasture and the
percentage contribution of fertilizer and soil S to pasture at all sites from Jan to Oct 1990.
--···--········ ----··-········---·········- - ---·········---············---······· - -------------
Farmlet 35S activity % fertilizer S S uptake by plant % contribution to plant S
removed removed"' Total Fertilizer
.... SoW Fertilizer1
(cpm/core) kg S ha-1
LF-LS 1 . 12E+08 1 1 .0 8 . 8 1 .5 7 .3
LF-MS 1 . 17E+08 1 1 .5 13 .5 1 .7 1 1 . 8
HF-LS 7 . 88E+07 6 .7 18 .4 2 .7 15 .7
HF-MS 6.56E+07 5 . 6 17 .7 2 .3 15 .4
% fertilizer S removed by plant= Activity removed by plant X l OO/Total activity applied
Fertilizer S removed = Amount of fertilizer S applied X percentage fertilizer S removed/l OO
Soil S removed = Total S removed by plant- Fertilizer S removed by plant
% contribution of fertilizer S = Fertilizer S taken up by plant X l OO/total S taken up by plant
% contribution of soil S = Soil S taken up by plant X l OO/total S taken up by plant
17
13
15
13
Soi12
83
87
85
87 ! I
� """ �

1 4 2
cpm mg-1 S ) at the beginning of the experiment (Fig.6.6), indicating that S taken up
by pasture was not derived solely from freshly applied fertilizer and freshly applied
SSP meets only part of the pasture S requirements. The considerable amounts of non
fertilizer S taken up by pasture during the growing period must have been derived
from the mineralization of soil organic matter. Immobilization of S into soil organic
matter and the downward movement of sulphate out of the rooting depth of pasture
plants are the other two fates of fertilizer S. To quantify the amounts of plant S
derived from the fertilizer S pool and from the soil organic matter by mineralization,
the percentage fertilizer S removed by pasture was calculated using the accumulated
activity of 35S removed by pasture harvested from each core and the original activity
and specific activity of SSP applied to each core at the beginning of the experiment.
The total amount of activity removed by pasture from Jan. to Oct. 1990, the
percentage of fertilizer S in the pasture, the amount of fertilizer and soil S taken up
by pasture and the percentage contribution of fertilizer and soil S to total pasture S
uptake are presented in Table 6.5.
The absolute amounts of fertilizer S taken up by pasture were greater (2.7 and 2.3 kg
S ha-1 for low and medium slopes, respectively) at high fertility sites than at low
fertility sites (1 .5 and 1 .7 kg S ha-1 for low and medium slopes, respectively) (Table
6.5). The amounts of fertilizer S taken up by pasture as a percentage of applied S,
however, was greater ( 1 1 .0% and 1 1 .5% in low and medium slopes, respectively) at
low fertility sites than at high fertility sites (6.7% and 5.6% for low and medium
slopes, respectively). This indicates that pasture at low fertility sites is more
dependent on freshly applied fertilizer than at high fertility sites.
At high fertility sites S from the mineralization of organic matter, that has
accumulated from regular topdressing of SSP and dung and urine return by grazing
animal, provided a greater absolute amount of pasture S (15 to 1 6 kg S ha-1) than soil
at low fertility sites 7 to 12 kg S ha-1). Thus the rate at which fertilizer was applied
over the preceding years and the current rate of fertilizer application had a major
affect on the mineralization of S from soil organic matter. Even though the amounts
of both fertilizer and soil S taken up by pasture were greater in the high fertility sites
1 4 3
than in the low fertility sites, pasture derived similar proportions of S from fertilizer
and soil S in both low and high fertility farmlets. On average pasture derived 1 4.6%
and 13.6% of their S from fertilizer and the remaining 85.4 and 86.4% from the soil
at the low and the high fertility sites (Table 6.5).
While both fertilizer and soil S were taken up by pasture (Table 6.5), most of the N
(86 and 87% of the mineralized N for low and high fertility farmlets) taken up by
pasture was derived from the mineralization of soil organic matter. Only a small
amount of plant N (<10%) was derived directly from fixation of atmospheric N by the
clover component of the pasture (see discussion in Chapter 5, section-5.3. Field and
Bal1,(1982) suggested that clover substitute almost half of their mineral soil N uptake
for N fixation in meeting their N requirements for growth. The different rates of
mineralization of N in both low and high fertility farmlets indicates that the extent of
N availability in pasture depends on the past SSP fertilizer history.
6.3.5 Sulphur Lost by Leaching
Freshly applied SSP significantly (p<0.01) increased ( 16.6 kg S ha1 more) the losses
of S by leaching in high fertility sites (3 1 .9 vs 1 5.3 Kg S ha-1 for fertilized and
unfertilized plots, respectively), but this increase (4.8 kg S ha-1 more) was not
significant at low fertility sites (Fig.6.7). The amounts of S lost by leaching from low
fertility sites (10.9 and 6. 1 kg S ha-1 for fertilized and unfertilized plots, respectively)
were also lower than high fertility sites. Previous fertilizer history also had a large
impact on the losses of S by leaching (Fig.6.7). Where fertilizer was not applied
(unfertilized), approximately 2.5 times more S was lost by leaching at high fertility
farmlet than at the low fertility farmlet ( 15.3 vs 6 . 1 kg S ha-1 for high and low fertility
farmlets, respectively) during the 9 months of measurement from Jan. to Oct. 1 990.
Where SSP was freshly applied (fertilized) approximately 4 times more S was lost by
leaching at the high fertility farmlet than at the low fertility farmlet (3 1 .9 vs 8.9 kg
S ha-1 for high and low fertility farmlets, respectively). This again demonstrates the
marked impact that the rate of SSP application has on S losses by leaching.

Fig.6. 7 Amounts of S lost by leaching from fertilized and unfertilized plots all sites during the period from Jan. to Oct. 1 990 (Vertical bars=LSD, p<O.Ol) .
40
D' 30 c :.c u 0 Q) -l o ..c: � 20 u; D' 0 � _J ':J ..c: c. :J (/)
1 0
0 LF-LS LF-MS
Form let HF- LS HF-MS
• Fert
D Unfert
1-' ,j:::. ,j:::.
145
Even though the total drainage for summer and autumn (269mm) was more (19%)
than the total drainage for winter (226mm) at all sites, the losses of S by leaching
from both fertilized and unfertilized plots was greater in winter. Extractable sulphate
concentrations remained similar (Fig.6. 1 1) for both periods, but the longer less
intensive drainage events during winter (Fig.6. 1 ) probably caused the greater leaching
in winter.
The leaching losses reported in this study were similar to the results reported by Smith
et al. (1983), showing that withholding fertilizer application to sheep grazed pasture
on Tokomaru silt loam can reduce the losses of S by leaching (4 to 5 kg S ha-1) but
still substantial losses occur. In the present study the losses were reduced by 50%
when the fertilizer application was discontinued after one year. In the study of Smith
et al. (1983) the losses were reduced by 30% by withholding fertilizer application for
one year. The fertilizer history for the site studied by Smith et al. (1983) was
different from that of the present study and the drainage was monitored only for
winter by Smith et al. (1983). Fertilizer was not applied continuously during the
previous years. Also the drainage was collected at a depth of 450mm. In the present
study drainage was monitored over a longer period of time ( 485mm drainage for a
period of 9 months) and it was collected at a depth of 250mm. This indicates that
there may be some adsorption of sulphate at 250-450m soil depth in the study of
Smith et al. ( 1983).
The total losses of S by leaching for the 9 months of me'asurement expressed as a
percentage of annual SSP application were 48.5%, 77.7%, 77.6% and 76.8% for the
LF-LS, LF-MS, HF-LS and HP-MS sites respectively for a total drainage of 495mm.
These losses are in close agreement with the S losses (46% to 78%, depending upon
the land slope and fertilizer history) calculated from a mass nutrient balance model by
Saggar et al. (1990a) for this hill country pasture. These losses include both soil and
fertilizer S lost by leaching.
6.3.5.1 Contribution of Soil and Fertilizer S to
Leaching Losses
The specific activity of S in the leachate was lower than the specific activity of the
applied fertilizer throughout the experiment (Fig.6.8). This again shows that not all

Fig.6. 8 Changes in specific activity of S-35 in leachate with time at all sites during the period from Jan. to Oct. l 990.
1 2
1 0
-1.0 0 8 + w I J!:;-.....__ \ I '\ I - LF- LS ......... >-....... · -
6 1 11 \ ' \ I \ I + LF-MS > ':;:; 0 <( I 11 \. \ \ V \ I -w- HF- LS 0 t;: 4 1 If '\.\ \ � \ I e HF-MS · -0 Q) 0. (/)
2
OM---�-----+----�----�---+----�--� 0 30 73 1 07 1 38 1 72 2 1 6 283
Days after fert i l izer appl ication � ,j::>. 0'1

Table 6 .6 Amounts of 358 activity, % of applied fertilizer S leached, amounts of soil and fertilizer S lost by leaching and the
% contribution of fertilizer and soil S to leaching losses at all sites from Jan. to Oct. 1990.
*
* *
# 1
2
-� Farmlet 35S activity % fertilizer S S leached % contribution to leached S
leached leached• Total Fertilizer
++ Soil' Fertilizer1
(cpm/core) Kg S ha-1
LF-LS 9.40E+07 9 .2 6 .7 1 . 3 5 .4 19
LF-MS 5 . 92E+07 5 . 8 15 . 1 0 . 8 14. 3 5
HF-LS 2.53E+08 2 1 . 4 32.0 8 . 8 23 .2 28
HF-MS 2 . 1 8E+08 18 .4 3 1 .7 7 . 6 24. 1 24
% fertilizer S lost= activity lost by leaching X l OO/total activity applied
Fertilizer S lost= Amount of fertilizer S applied X percentage fertilizer S lost by leaching/ l OO
Soil S removed = Total S removed - fertilizer S removed
% contribution of fertilizer S = Fertilizer S lost by leaching X 1 00/total S lost by leaching
% contribution of soil S = Soil S lost by leaching X l OO/total S lost by leaching
Soil2
8 1
95
72
76
1-' """ --..J

1 4 8
the S lost by leaching was derived directly from fertilizer. Soil S was also lost. Here
also it is necessary to quantify the amounts of fertilizer and soil S lost by leaching
based on the activity of 35S removed and the total amounts of S lost by leaching. The
total 35S activity, the amounts of fertilizer and soil S lost by leaching and the
percentage contribution of fertilizer and soil S to leaching losses are given in Table
6.6. Approximately 7 times more fertilizer S was lost by leaching from the high
fertility farmlet (8.8 and 7.6 kg S ha-1 for low and medium slopes, respectively) than
from the low fertility farmlet ( 1 .3 and 0.8 kg S ha-1 for low and medium slopes,
respectively). As a percentage of applied fertilizer S the losses of S by leaching were
approximately 3 times more from the high (21 .4% and 1 8.4% for low and medium
slopes, respectively) than low fertility farmlet (9.2% and 5.8% for low and medium
slopes, respectively) (Table 6.6).
In contrast the contribution from freshly applied fertilizer to total pasture uptake
(Table 6.5) at both the low and high fertility sites were very similar (14%). The small
S loss by leaching from freshly applied fertilizer at the LF sites demonstrate the
efficient manner in which applied S is utilised within the low fertility system. In
contrast in the high fertility system where no response to added fertilizer S was
measured, the S losses by leaching were much greater.
At all sites pasture S uptake and losses by leaching accounted for only 19 and 26%
(15 vs 45 kg S ha-1) of the applied fertilizer S for low and high fertility farmlets,
respectively (Fig.6. 10). The amount of S remaining in the extractable sulphate pool
was very small (2.7 and 10.7 kg S ha-1 for low and high fertility farmlets, respectively,
Fig.6. 1 1 ). Thus the majority of the fertilizer S was either immobilized into soil
organic S or adsorbed by soil sesquioxides in the subsoil and not extractable (8 1 and
74% for low and high fertility farmlets, respectively) in 0.04M Ca(HP04)2•
Immobilization of fertilizer S was also observed by Gregg and Goh,( 1979).
The amounts of N lost by leaching (Fig.6.9) were much less than the losses of S by
leaching and when expressed as a percentage of the N taken up by pasture (ranging
from 60 kg N ha-1 for LF-LS unfertilized, to 190 kg N ha- 1 for HF-LS fertilized )

Fig.6.9 Amounts of N lost by leaching from fertilized and unfertilized plots at all sites during the period from Jan. to Oct. 1 990 (Vertical bars=LSD, p<O.Ol)
6
5
0\ .s: 4 ..c::: u 0 G> o ....J ..c::: >.. ........... 3
.o O\ � ...... en 0 .....1 z 2
1
0 LF- LS LF-MS
Form let HF- LS HF-MS
• Fert
D Unfert
I-' """ \.0

Fig.6 . 1 0 Amounts of fertilizer(F) and soil(S) sulphur removed by pasture and lost by leaching between Jan. to Oct. 1 990 at LF-LS, LF-MS, HF-LS and HF-MS sites.
'-::l .c a. ::l (/) -0
40
30
0� 20 �� Cl) ......,;
Leach
Plant
Leach > 0 Plant u Q)
0::: 1 0 Plant
..-------, Leach
0 I lii MWiliiiii! 11!111 I • LF-LS LF-MS HF- LS
F armlet - Slope
Leach
Plant
HF-MS
D Derived from soi l
11 Derived from fert i l izer
1--' Ul 0
151
the amounts lost were small at all sites (Fig.6.9). The amounts of N lost by leaching
were only slightly greater than the losses observed in the preliminary field experiment
(Chapter 5). The slightly greater loss of N by leaching in the present experiment (Jan
Oct) may be due to a greater loss during summer and autumn than in winter and
spring period when the preliminary experiment was conducted. Even though the
amounts of N lost by leaching were very small in terms of the total amount of N
uptake by pasture, and so from an agricultural standpoint, of little significance at high
fertility sites the amounts of nitrogen lost by leaching in the present experiment
approached 6 kg N ha-1 • These values are much lower than those calculated by Field
et al. ( 1985) for intensive cattle grazed lowland pastures (73 kg N ha-1) and measured
by Steele et al. (1984) for intensive beef-cattle systems (88 kg N ha-1). The losses in
this study are again lower than the losses ( 1 5 to 20 kg N ha-1) observed in a series of
experiments conducted on the Tokomaru silt loam under permanent pasture grazed
intensively by dairy cattle (Sharpley and Syers,1979) and sheep (Turner et al., 1 979;
Heng et al. , 1991 ). The N losses by leaching measured in this study represent the first
estimates of likely losses of N from less intensively farmed hill country farming
systems. The losses from low fertility sites ( < 2 kg N ha-1) would be indicative of the
N losses from larger tracks of South and North Island hill country where stocking
rates are < 12 SU ha-1 and fertilizer inputs have been low for the past 10 years.
6.3.6 Soil Sulphate and Mineral Nitrogen
Immediately after fertilizer application (second soil sampling on 15-2- 1990) which
occurred on 1 8-1- 1990 the soil sulphate concentrations increased in the top 0-7 5mm
soil depth at all sites (Fig.6. 1 1). This increase was very small for low fertility sites
and particularly marked at the high fertility sites. After this initial increase, sulphate
concentrations decreased slowly with time (Fig.6. 1 1) . The soil sulphate at 150-250mm
soil depth was generally greater than the top two layers (Fig.6. 1 1) except for the early
stages after fertilizer application. In the low fertility farmlet the sulphate
concentrations for 150-250mm soil depth was always greater than the top two layers,
even immediately after fertilizer application (Fig.6. 1 1 ). The buildup of sulphate in the
150 to 250mm soil depth indicates that sulphate in the soil solution of the top two

Fig. 6. 1 1 . Soil sulphate present for the depths 0-75 mm ( ) , 75- 150 mm (--+ --) and 150-250 mm (--*--) at all sites
from Jan. to Oct. 1990. Soil samplings were done on 8/ 1 , 15/2, 26/3 , 30/4, 1 116, 1417, 23/8 and 10/10 . The L.S.D values are given in
50
40
_g 30 ......... (/) Ol 20 .::t:.
L F - LS
1 0t �� A w w _., *
250 300 0 �---+----+----+----+---���
0 50 1 00 1 50 200 50
40
_g 30 ......... (/) Ol 20 .::t:.
H F - LS
1 0� ---==:- ! ::::;::;+= !-=== O r----+----+----+----+----+--�
0 50 1 00 1 50 200 250 300
T ime (Days)
Appendix-6. 1 .
50 LF -MS 40
30
20
1 0
0 0 50 1 00 1 50 200 250 300
50
40 HF -MS 30
20
1 0
0 �---+----�---r----�---+--� 0 50 1 00 1 50 200 250 300
T ime (Days) 1-' 01 1\)

Fig .6. 12. Soil mineral nitrogen present for the depths 0-75 mm ( ) , 75-150 mm (--+--) and 150-250 mm (--*--) at all
sites from Jan. to Oct. 1990. Soil samplings were done on 8/ 1 , 15/2, 26/3 , 30/4 , 1 1/6, 1417 , 23/8 and 10/ 10. The L.S .D values are given
in Appendix-6.2.
30 25
0 20 ..c � 1 5 CJl � 1 0
0 0 301 25
0 20+ ..c � 1 5+ CJl � ,
; 0
LF- LS
50 1 00 1 50 200
H F - LS �
I X \ �
50 1 00 1 50 200 T ime (Days)
250 300 /
/
I 250 300
30 25
0 30 25 20 1 5 1 0 5 0
0 50
0 50
LF-MS
1 00 1 50 200 250 300
1 00 1 50 200 250 300 T ime (Days)
I-' Ul w

154
layers (0- 150mm) leached to this soil depth is not significantly depleted by pasture
growth. Infact considerable amounts of sulphate were leached beyond 250mm soil
depth and collected in the resin between each successive soil sampling (Table 6.6).
The amounts of mineral N were greater in top layer than the other two layers
(Fig.6. 12). This trend was similar to that reported in the previous study period (June
1989 to Jan 1990). Ammonium was the dominant form of mineral N present in the
soil at all four sites. This was particularly marked for the low fertility sites where the
nitrate form was very low. Nitrate N did accumulate during summer and late spring,
but was still present at much lower levels than ammonium.
6.3.7 Net Mineralization of S and N
The amounts of S and N net mineralized were calculated using the formula described
in Chapter-5. In this experiment the amounts of S and N returned in excreta need not
be considered because both pasture uptake and losses by leaching of S and N were not
influenced by excreta return because no excreta was allowed to return to the lysimeter
cores from which both pasture uptake and leaching losses of S and N were measured.
It was also possible to separate the S uptake by pasture and losses by leaching of both
fertilizer and soil S because the fertilizer S was labelled with 35S . A modified
equation for calculating net mineralization of S is given below.
where
Ms= Sulphur mineralized from Jan to Oct 1990 (kg S ha-1)
Esp= Final soil sulphate extracted with 0.04M Ca(H2P04)2 (kg
S ha-1)
Es1= Initial soil sulphate extracted with 0.04M Ca(H2P04)2 (kg S ha-1)
Pss= Total soil S taken up by plant from Jan to Oct 1990 (kg
S ha-1) from Table 6.5
Lss= Total soil S lost by leaching from Jan to Oct 1990 (kg
S ha-1) from Table 6.6
1 5 5
The net mineralization of N was calculated as mentioned above, except the extractant
used was 2M KCl (see Chapter-S) and also included a small amount of N fixed from
atmosphere by legumes.
It was established that most of the extractable soil sulphate present at the end of the
experiment was soil derived sulphate and not fertilizer derived sulphate because during
the last leaching and pasture growth period (1-9-1990 to 10-10- 1990) isotopic data
showed that less than 2% of the S taken up by pasture or lost by leaching was derived
from the fertilizer. Thus the fertilizer made little contribution to the extractable
sulphate pool and this amount (2% of the pool) was not considered in the calculation
of the amount of S mineralized.
The amounts of S net mineralized was greater ( 40.2 and 39.5 kg S ha-1 for low and
medium slopes, respectively) at the high fertility sites than ( 1 5.7 and 28.3 kg S ha-1
for low and medium slopes, respectively) at the low fertility sites, demonstrating that
previous fertilizer history had caused more S to accumulate in the soil organic matter
which inturn had a major influence on the mineralization of soil organic S (Table 6.7).
An average of 44% of the mineralized S was taken up by pasture at the low fertility
sites while an average of 39% of the mineralized S was taken up by pasture in high
fertility sites. About 42% of the mineralized S was lost by leaching in the low
fertility farmlet and 60% of the mineralized S was lost by leaching in the high fertility
farmlet (Table 6.7). The remaining mineralized S accumulated in the inorganic
sulphate pool. This showed that when the mineralization rate was greater, a greater
amount of mineralized S was lost by leaching while at a low rate of mineralization a
greater amount of mineralized S was taken up by pasture.
The amounts of N net mineralized was greater (204 kg N ha-1) at the high fertility
sites than at the low fertility sites (125 kg N ha-1) again reflecting the long term effect
that previous fertilizer have had on legume growth and nitrogen fixation. Irrespective
of the amounts of N mineralized most of the mineralized N was taken up by pasture
and the losses of N by leaching were very low ( <2% of the total mineralized). This
confirms the results from the earlier field experiment which demonstrated a linear
relationship between N mineralized and pasture dry matter production.

156
Table 6.7 Net mineralization of S and N from soil organic matter and the
percentage of mineralized S and N removed by pasture and lost by leaching at
all four SSP fertilized sites from Jan. to Oct. 1990.
*
* *
1
Farmlet Net mineralization % plant uptake1·" % leached1·""
kg ha-1 s N
s N
LF-LS 15.7 100 46 86
LF-MS 28.3 149 42 86
HF-LS 40.2 224 39 85
HF-MS 39.5 184 39 88
Total S and N removed by plant X 100/Net mineralization.
Total S and N leached X 100/Net mineralization.
s
34.4
50.0
58.0
61 .0
The recovery of mineralized S and N by plant and leaching losses is
not 100%. The remaining S and N is accumulated in the soil solution.
N
1 .3
1 . 1
2.0
1 .5

1 5 7
Assuming that extractable soil sulphate and mineral N concentrations were the same
in both fertilized and unfertilized plots at the end of the experiment, the amounts of
S and N net mineralized in the unfertilized plots were 10, 20, 22 and 21 kg S ha-1 and
72, 122, 172 and 159 kg N ha-1 for the LF-LS, LF-MS, HF-LS and HF-MS sites
respectively. These values were lower than the amounts of S and N net mineralized
in the fertilized plots (Table 6.7) suggesting that freshly applied fertilizer has a
stimulating and priming effect on the mineralization process. The proportions of
mineralized S removed by pasture and/or lost by leaching in the unfertilized plots
could not be quantified because during the period of plant growth extractable soil
sulphate decreased indicating that a substantial part of pasture uptake and leaching
could have been derived from this pool. Most of the N taken up by pasture was
derived from the mineralization of soil organic N because the initial soil mineral N
level was very low compared to the total amount of N taken up by pasture (see Table
6. 1 and Fig 6.5) and leaching losses were small.
6.4 GENERAL DISCUSSION AND CONCLUSION
The results from these lysimeter studies showed that for the study period of 9 months
from Jan. to Oct. 1990, the losses of S from SSP fertilized hill country farmlets ranged
from 48 to 77% of the annual fertilizer application depending upon the rate of annual
fertilizer application and the past fertilizer history and the bulk of this loss was
derived from the mineralization of soil organic matter and not directly from freshly
applied fertilizer. These leaching losses were in accordance with the predicted losses
for these hill country systems (Saggar et al., 1990a). Freshly applied fertilizer
increased both the mineralization of S from organic matter and leaching losses of S .
On the other hand withholding fertilizer application significantly reduced S losses by
leaching.
Previous fertilizer history had a major effect on the fate of freshly applied fertilizer
S . At the low fertility farmlet which had a history of 125 kg SSP ha-1 year-1 , a greater
proportion of the freshly applied fertilizer S was removed by pasture compared to the
proportion lost by leaching. At the high fertility farmlet which had a history of 375
1 5 8
kg SSP ha"1 year·1, a greater amount and percentage of freshly applied fertilizer S was
lost by leaching rather than pasture uptake. Even though the high fertility farrnlet had
higher pasture production than the low fertility farrnlet, the losses of S by leaching
were nearly four times greater than the low fertility farrnlet suggesting that at low
fertilizer application rate, more efficient use of both fertilizer and soil S is made
without a major loss of S by leaching. ; By measuring the fate of the 35S labelled I
fertilizer it was possible to demonstrate that most of the S removed by pasture and lost
by leaching were derived from the mineralization of soil organic S which was
influenced by the current fertilizer application. Less than 12% of the freshly applied
fertilizer S was removed by pasture. But most (7 4 to 8 1%) of the applied S in SSP
was either immobilized in to soil organic matter in top soil or adsorbed by soil
sesquioxides in the sub soil. Direct losses of S by leaching from freshly applied
fertilizer represents < 22% of applied S and was lower in the low fertility farmlet.
This suggests that there is only limited scope for reducing S losses directly from
applied fertilizer. It is clear from this study that most of the leached sulphate and that
removed by pasture originated from the mineralization of soil organic S .
This study has shown that there i s a fundamental difference in cycling of S and N in
these sheep grazed hill country pastures and that N rather than S limits pasture
production. With N, irrespective of the level of pasture productivity maintained by
different fertilizer strategies, nearly all of the mineralized N was taken up by pasture.
The fraction of mineralized N lost by leaching was very small (<2%) showing that
even though both N and S are biologically mobile nutrients, N is conserved in these
soil-plant systems, while more S is available in the soil solution and susceptible to
leaching. In these legume based pasture system where superphosphate is used to
supply both P and S and the only nitrogen source is the fixation of atmospheric N2, the system is continuously under N stress and any N released by mineralization from
soil organic matter is either utilized by plants or microorganism immediately and
keeping the soil mineral N level very low and the quantities available for leaching
low. Since S is not limiting pasture production, all S as sulphate in excess of the
pasture requirements is susceptible to leaching.
159
Increasing the N status of the soil without increasing the S application rate may offer
a solution for reducing the leaching losses of S from grazed hill country pasture.
Normally in legume based grazed pastures the N status is increased by increasing the
S status through SSP application. Either more efficient N fixing legumes are required
or perhaps current levels of N fixation could be maintained with fertilizers of lower
S:P ratios. If the N status of the pasture increased without increasing the S status,
more pasture will be grown fixing more carbon, translocating more carbon to the root
and to the soil which would immobilize more sulphate in the soil. More plant growth
also increases the uptake of sulphate from the soil.
Alternatively the leaching losses of S may be reduced by applying fertilizer material
which provide both S and N. The proportion of pasture S derived from fertilizer
( <17%) did not vary much with the rate of fertilizer application but the proportion of
leached S derived from fertilizer was greater at high fertility sites (28 and 24%) than
in low fertility sites ( 19 and 5%). Therefore at higher rates of fertilizer application
not only is more S leached as mentioned earlier but more of this leached S is directly
derived from fresh fertilizer applications.
The data generated from the isotopic studies in this Chapter will be more fully
discussed in Chapter 8, where attempts are made to estimate the actual rates of
mineralization and immobilization of S in these pasture soils.

1 60
CHAPTER-7
THE INFLUENCE OF SHEEP EXCRETA ON THE PASTURE UPTAKE
AND LEACHING LOSSES OF SULPHUR IN GRAZED HILL COUNTRY
PASTURES.
7.1 INTRODUCTION
In the previous Chapter (Chapter-6), investigating the fate of fertilizer S applied to
grazed hill country pastures, it was shown that most of the S removed by pasture
plants (85-86%) or lost by leaching (75-87%) was derived from the mineralization of
soil organic matter and not from a current superphosphate application. The amount
of S mineralized was influenced by previous superphosphate topdressing history. The
study however did not examine the contribution of recently returned excreta from the
grazing animals to pasture uptake and to the losses of S by leaching. As
approximately 70% of S removed by pasture may be ingested by the grazing animal
and returned to the pasture in excreta on an annual basis (Saggar et al., 1990a), this
represents a large flux of S that is potentially available for pasture uptake. Little
information is available on the efficiency with which this excretal S is reutilized by
pasture.
Nutrient cycling through grazing animals was for a long time considered beneficial to
the fertility of grazed pastures (Walker, 1956; Sears et al. , 1965; Till et al., 1 987).
However, more recently it has been recognised as an inefficient process resulting in
considerable loss of effective nutrients from productive areas of paddocks (Carran et
al. , 1982; Goh and Nguyen, 1991 ; Hedley et al., 1990; Saggar et al., 1990a) which
may accelerate leaching losses.
Unlike N and K, for which the majority (>70%) of the excreted nutrients are in the
urine, S is distributed approximately 40% in dung and 60% in urine (Wilkinson and
Lowery, 1973; Syers et al., 1987). A knowledge of the fate of both dung and urine
S, once deposited on the soil is therefore important for determining long term S
fertilizer requirements.

1 61 The fate of S in sheep dung and urine, after deposition to soil, has been investigated
by a few researchers in New Zealand and overseas using either a balance approach in
laboratory simulations (Hogg, 1981) or radioactively 35S labelled dung and urine in
field studies (Kennedy and Till, 198 1a; Goh and Nguyen, 1991). The results in the
laboratory using repacked soil columns (Hogg, 1981) established that a greater amount
of S was lost by leaching in the urine treated lysimeter when compared to the control
treatment. It is debatable whether results from repacked soil columns are applicable
to naturally structured field soils. In field studies on pasture soils (Goh and Nguyen,
1991) it was shown that about 16 to 20% of the simulated sheep urine S was
recovered in pasture (above ground plant material and root) but a substantial amount
of S was not recovered and suggested that it was lost by leaching. The amount of S
lost by leaching was not quantified by direct measurement.
Under normal field conditions it is very difficult to establish average influences of
excreta return on pasture production, nutrient uptake and leaching losses of nutrients
because of the spatial variability with which excreta is deposited by the grazing
animals. For example Petersen et al. (1956) have shown that if random deposition is
assumed little more than 1 6% of a flat paddock will receive excreta in any one year,
Jackman (1960) assumed completely random behaviour by grazing animals to estimate
that with 19 sheep ha-1 about 30% of grazed area would receive urine over a year.
When topography and climate influence the animal camping behaviour this area may
be even less (Gillingham, 1978; Lambert et al., 1983; Saggar et al., 1990a). The mini
lysimeters installed in the field at Ballantrae (Chapters 5 and 6) provided an
opportunity to study the effect of individual excreta return on the pasture uptake and
leaching losses of S in grazed hill country pastures.
The objective of this study was to investigate the effect of excreta return, both dung
and urine, on pasture production, pasture uptake and leaching losses of S in fertilized
grazed hill country pastures. The effect of excreta return on the amounts of N and K
removed by pastures and lost by leaching was also investigated because N and K are
major plant nutrients returned in excreta along with S .

1 62 7.2 MATERIALS AND METHODS
This experiment was a continuation of the earlier field experiment investigating the
origins of leached sulphate in fertilized grazed hill country pastures which was
described in Chapters 5 and 6. Of the four sites used for the previous studies, the LF
LS site was selected for this study, because the pasture response to and the losses of
nutrients by leaching from applied excreta can easily be identified due to the low
fertility of the site. The sixteen rnini-lysimeters installed at this site were divided
randomly to take four treatments, namely
1 . Control, for which no fertilizer had been applied for the previous
eighteen months
2. Fertilizer, applied at the rate of 125 kg SSP ha-I, which was applied
along with the normal annual top dressing in January, 1990.
3 . Fertilizer applied as above plus dung applied in early winter (in this
Chapter it is referred to as dung treatment).
4. Fertilizer applied as above plus urine applied in early winter (in this
Chapter it is referred to as urine treatment).
Each treatment was replicated four times.
7 .2.1 Application of Dung and Urine
The dung and urine used in the experiment were collected in early winter from
approximately 20 ewes from the experimental site, and applied to the cores on the
same day (21-06- 1990), during light rain. The chemical composition of nutrients in
both the composite dung and urine samples are given in Table 7 . 1 . About 225g of
fresh dung (774, 1 15 and 376 kg N, S and K ha-1 , respectively) which is equivalent
to the amount of dung excreted by a grazing sheep for one defecation (Sears and
Newbold, 1942) was applied to each core in treatment 3 , and 150 mls of fresh urine
(280, 2 1 and 146 kg N, S and K ha-1 , respectively) which is equivalent to the amount
of urine excreted by the grazing sheep for one urination event (Sears, 1950, 1953;
Quinn, 1977; Hogg, 1981) was applied to each core in treatment 4. To simulate one

1 63 urination event urine was applied to the cores from a height of 2 feet above each core.
At the time of application the soil moisture content was 0.78g water/g soil and urine
drained rapidly into all lysimeters with negligible runoff occurring. Urine was also
applied to one of the lysimeters which contained a collection vessel instead of a resin
trap (see Chapter-6, section-6.2).
The partitioning of S between dung and urine during winter collection differs from the
S partitioning between dung and urine proposed by Wilkinson and Lowery (1973).
The concentration of S in urine was very low (0.0246%) compared to dung (0.273%)
which represents an excretal return of 0.3g S sheep-1 day-1 in urine and 1 . 1g S sheep-1
day-1 in dung and a partioning of 79% S in dung and 21% S in urine. But earlier S
analysis of spring dung and urine samples take from the same site showed much
higher S concentration (0. 13%) in urine and 0.3% S in dung. This represents a
partitioning of 46% and 54% S in dung and urine respectively. It is important
therefore in experiments simulating the effect of dung and urine return to use a sample
which is representative of season, site and resident animals. Irrespective of the total
S concentration in urine, the sulphate concentration as a fraction of total S was 70%
in both winter and spring. In dung the sulphate concentration as a fraction of total S
content increased from 9% in winter to 14% in spring. Similar results were also
observed for N and K, in which both N and K were distributed in both dung and urine
(Table 7. 1) .
7.2.2 Measurements
7.2.2.1 Rainfall and Drainage
Rainfall and predicted and measured net drainage for the site were obtained from the
values reported in Chapter-6 for the period from Jun. to Sep. 1990. Equipment failure
prevented rainfall measurements, however, no drainage was measured during this
period.
7.2.2.2 Pasture Production
The amount of pasture produced in all the four treatments was measured as described
in Chapter-6. Pasture was harvested 21 days before dung and urine application. After
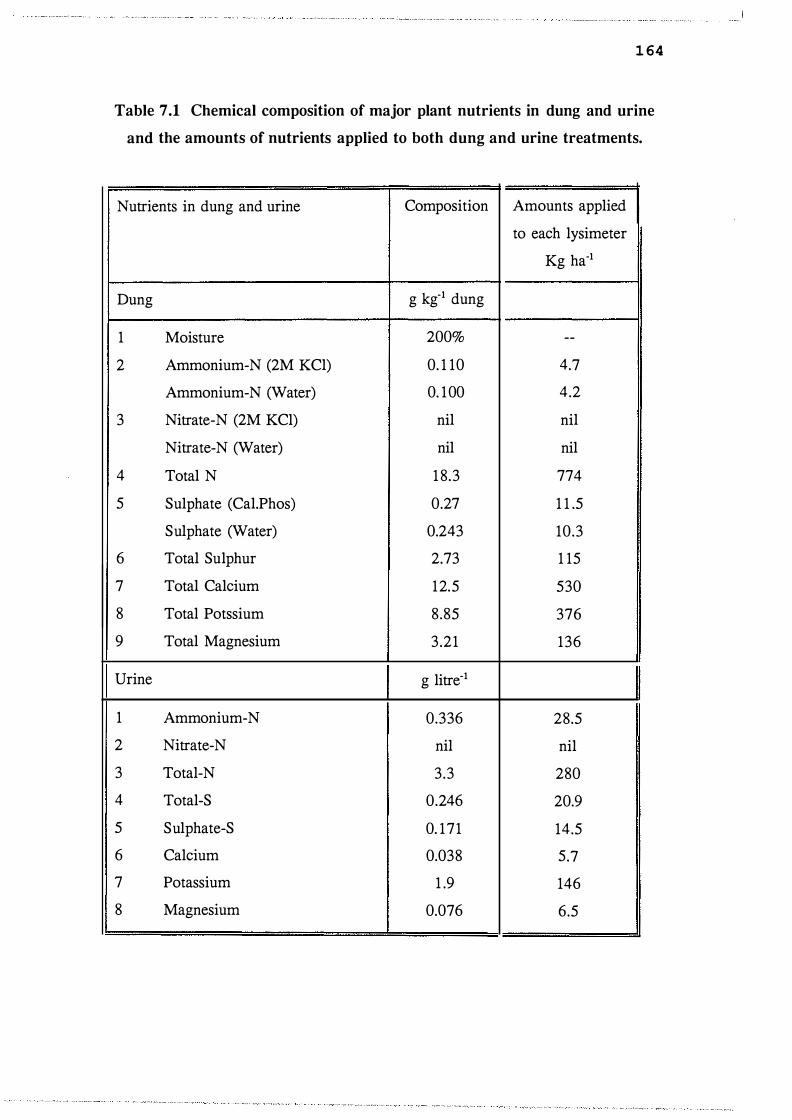
1 64
Table 7.1 Chemical composition of major plant nutrients in dung and urine
and the amounts of nutrients applied to both dung and urine treatments.
Nutrients in dung and urine Composition Amounts applied
to each lysimeter
Kg ha-1
Dung g kg-1 dung
1 Moisture 200% --
2 Ammonium-N (2M KCl) 0. 1 10 4.7
Ammonium-N (Water) 0. 100 4.2
3 Nitrate-N (2M KCl) nil nil
Nitrate-N (Water) nil nil
4 Total N 1 8.3 774
5 Sulphate (Cal.Phos) 0.27 1 1 .5
Sulphate (Water) 0.243 10.3
6 Total Sulphur 2.73 1 15
7 Total Calcium 12.5 530
8 Total Potssium 8.85 376
9 Total Magnesium 3.21 136
Urine g litre-1
1 Ammonium-N 0.336 28.5
2 Nitrate-N nil nil
3 Total-N 3.3 280
4 Total-S 0.246 20.9
5 Sulphate-S 0. 171 14.5
6 Calcium 0.038 5.7
7 Potassium 1 .9 146
8 Magnesium 0.076 6.5
1 65 application three harvests were taken over 150 days. The first harvest after dung and
urine application was made at the end of winter (21-8-90, two months after dung and
urine application or 8 1 days after the previous harvest), the second during the middle
of spring ( 16-10-90) and the third during the late spring (17-1 1 -90). Pasture S, N and
K concentrations were measured.
7.2.2.3 Resin Replacement
Resin samples in the lysimeter traps (see Chapter 4, 5 and 6) were replaced with new
resin before the application of dung and urine. Immediately after dung and urine
application (2 days) the resin was replaced with new resin. Thereafter the resin was
replaced depending on the frequency and intensity of rainfall and predicted drainage
volumes. After removal to the laboratory, the resins were eluted as described in
Chapter-6 and the concentrations of S04=, mineral N and basic cations such as Ca, Mg
and K in the eluates were measured.
7.2.3 Analytical Measurements
The pasture S and N concentrations were measured as mentioned in Chapter-5.
pasture K, Ca and Mg concentrations were measured by digesting pasture sub samples
with concentrated HN03, then evaporating the digest to dryness at 250°C. 5ml of 2M
HCl were added to the dried digest sample and then diluted to 50mls with deionised
water. The amounts of K, Ca and Mg in the final solution were measured using
atomic absorption spectroscopy. Appropriate ionic suppressors such as Cs and Sr
were added to the final solution at 1000mg 1"1 •
The amounts of S04=, mineral N, ea++, Mg++ and K+ in the resin eluate were measured
as mentioned in Chapter-5.
7 .2.4 Statistical Analysis
Analysis of variance was performed on pasture produced in each harvest and the total
pasture produced for 150 days, pasture S, N and K concentrations for all the three
harvests, the total amounts of S, N and K removed by pasture and the total amounts
of S, N, K, Ca and Mg lost by leaching to determine the statistical significance of the
1 6 6 simple and interactive effects of fertilizer and dung or urine applications. In the
discussion, treatments which are significantly different from each other at p<0.01 are
denoted by ***, significantly different at p<0.05 are denoted by ** and non significant
by NS.
7.3 RESULTS AND DISCUSSION
7.3.1 Pasture Production
Application of fertilizer alone did not increase pasture production until late spring
(Table 7 .2.) . From the outset, application of dung or urine with fertilizer increased
pasture production (p<0.01) . Urine treated plots initially produced more pasture than
dung treated plots, reflecting the presence of readily plant available S, N and K in the
urine, and this effect carried over to total pasture production for winter and spring.
Addition of dung with fertilizer did not significantly increase pasture production over
fertilizer alone, despite the addition of over 700kg N ha·1 in the dung.
Even though the amounts of S, N and K applied to the cores in dung treatment was
greater than the amount of these nutrients applied to the cores in urine treatment, the
readily available forms of S, N and K such as sulphate, ammonium and soluble K
applied were greater in the urine treatment than in the dung treatment (Table 7 . 1 ).
Dung has to decompose before the majority of the nutrients become available for
pasture growth.
In this experiment, which was conducted mainly during winter and spring it took 60
days for the dung to physically disappear and chemically decompose. Rowarth (1987)
reported that faecal pellets decomposed completely in 20 days and pad samples in 30
days during winter, a period when earthworms are active. Similar faecal
decomposition studies elsewhere showed that arthropods such as earthworms (Barley,
1964) and dung beetles (Bornemissza and Williams, 1970) enhance mineralization
through the action of communition of the material and transporting it to the vicinity
of soil microorganisms (Macfadyen, 1978). Rowarth ( 1987) also showed that in
summer much longer periods are required for decomposition of dung to take place.

1 67
Table 7.2. Pasture dry matter response to fertilizer plus dung and urine
application for a period of 150 days.
Treatment Late Winter Mid Spring Late Spring
(21/8/90) ( 16/10/90) ( 17/1 1/90)
Kg ha-1
Control 102 175 429
Fertilizer 226 3 1 6 882
Fertilizer+D 289 532 921
Fertilizer+U 430 667 1 170
L s Dp<O.Ol 164 221 255
Total
707
1425
1742
2268
470

1 68 Moisture generally limits the activity of earthworms at this time. The effectiveness
of freshly returned dung as a source of S, N and K for pasture growth would therefore
be limited during this period.
Over the whole winter-spring period pasture production was increased by 100%, 1 50%
and 220% in fertilized, dung and urine treatments respectively, compared to the
control. Compared to fertilizer alone, pasture production was increased in dung and
urine by 22% (NS) and 59% (***) , respectively. The poor pasture production in
unfertilized and excreta-free control treatment demonstrates the significance of both
fertilizer application and animal excreta return in stimulating pasture growth at this
low fertility site.
With a stocking rate of 10 SU ha-1 for the experimental site, the annual input of dung
and urine is approximately 4925 kg fresh dung ha-1 and 4380 litres of urine ha"1
respectively (see Appendix-7. 1). About 60% of dung and 55% of the urine is returned
to low slopes which constitute 33% of the total area (Gillingham, 1980; Saggar et al. , 1990a). This gives an amount equal to 2950 kg of fresh dung which covered an area
of 0.232 ha (0.02m2/event), and 2190 litres of urine, which covered an area of 0.258
ha (0.018m2/event). The total low slope area in the LF farmlet was 0.33 ha. It is
evident from the calculations that some areas of the low slope are likely to receive
both dung and urine deposition or multiple dung and urine depositions and the whole
of the low slope area probably receives dung and/or urine. The combined effect of
dung and urine on pasture production was not studied, but the values calculated
separately for dung and urine showed that the fertilizer alone treatment produced
1425kg DM ha-1 whereas application of fertilizer plus dung or urine increased the
pasture production to an average of 2100kg DM ha-1 for 150 days. This amount may
be further increased on an annual basis. Over the time period studied dung and urine
return are likely to be responsible for up to 700kg DM ha-1 by excreta on low slope
areas, which represents a yield increase of 50%.
7.3.2 Sulphur, N and K concentrations in pasture
Application of dung and urine to fertilized pastures had an immediate and positive
effect on the concentrations of S and N in pasture (Table 7 .3). With S this effect

Table 7.3 Effect of fertilizer and fertilizer plus dung or urine on pasture S , N and K concentrations for all treatments in three
harvests.
Treatment Late Winter (23-8-1990) Mid Spring ( 16- 1 0- 1990) Late Spring (18-1 1- 1990)
s N K s N K s N K
%
Control 0.30 3 .25 0 .84 0 .25 2 .3 1 1 . 12 0.26 2. 14 2 .08
Fertilizer 0 .31 3 . 10 1 . 06 0 .26 2 .60 1 .41 0 .24 2 .26 2. 16
Fertilizer+ D 0.38 4 .32 1 .55 0 .27 2 .82 1 .76 0 .25 2 .37 2.39
Fertilizer+ U 0.37 4 .83 1 .39 0 .26 3 . 03 1 . 70 0.25 2.27 2.45
I L s D <O.Ol 0.05 0 .52 0.49 0 .07 0 .24 0.21 0 .06 0 .39 0 .64
I-' 0\ 1.0

1 7 0 was short lived, reflecting the smaller amounts of this nutrient in both dung and urine.
The effects of dung and urine on the N dynamics of the sward persisted till late
spring. While S and N concentrations decreased into spring, the reverse was true for
K. Both dung and urine had a positive effect on K concentration. This effect
persisted until late spring, 120 days after application. For dairy pasture, Williams et
al. (1990) showed that the concentration of K in the pasture increased (2.0% and 2.5%
for control and urine treated plots, respectively) immediately after urine application
and it decreased to the concentration of the pasture which was not affected by urine
after 130 days. It is clear from this study that while S and N concentrations decreased
with .. increased pasture production, the concentration of K increased as pasture
production increase. These seasonal changes in the pasture nutrient composition have
been documented by Metson and Saunders (1978).
7.3.3 Sulphur, N and K Removed in Pasture
Both fertilizer and fertilizer plus dung or urine increased the amounts of S and N
removed by pasture (p<0.01) (Table 7.4). The effect of fertilizer plus dung or urine
was greater than fertilizer alone on S and N uptake by pasture, reflecting the effect of
greater application of readily available S and N in dung and urine. In general the
amounts of S and N removed by pasture were in the order urine > dung > fertilizer
> control for a period of 150 days (Table 7.4). While the increased N uptake by
pasture in the fertilizer only treatment must have resulted from increased organic
matter mineralization and/or N fixation brought about by the effect of fertilizer on
legume growth, the organic and inorganic N in dung and urine provides an immediate
sources of N for pasture uptake. The effects of dung and urine return on the S uptake
by pasture have not been studied in detail for fertilized pastures in New Zealand.
However, the effects of urine and to a lesser extent dung on the N dynamics of a
sward have been studied in great detail. The classical work of Sears (Sears et
a/. , 1965) first demonstrated the large positive effect of urine, and more recently Ball
et al. (1979) working with a sheep/cattle pasture and Williams et al. ( 1990) on dairy
pastures, have shown the effect of urine N on pasture production.
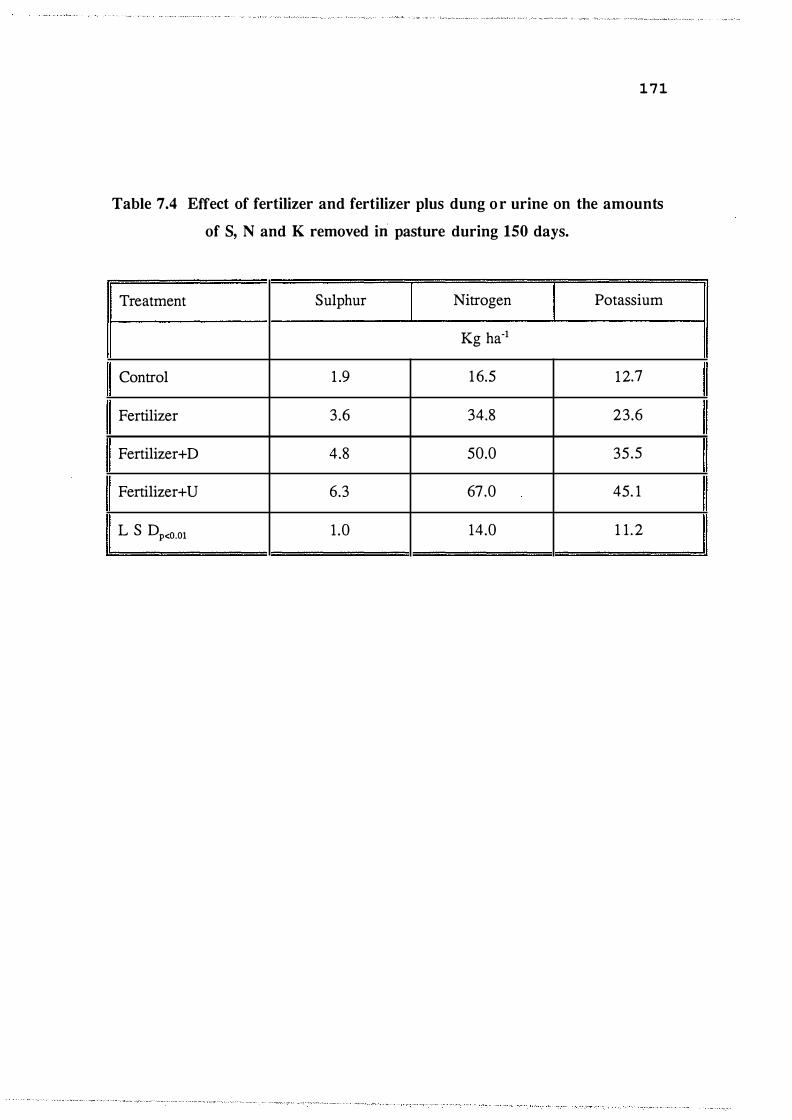
1 7 1
Table 7.4 Effect of fertilizer and fertilizer plus dung o r urine on the amounts
of S, N and K removed in pasture during 150 days.
Treatment Sulphur Nitrogen Potassium
Kg ha-1
Control 1 .9 1 6.5 1 2.7
Fertilizer 3.6 34.8 23.6
Fertilizer+D 4.8 50.0 35.5
Fertilizer+ V 6.3 67.0 45. 1
L s Dp<O.Ol 1 .0 14.0 1 1 . 2

172 Both dung and urine had a large positive effect on K uptake by pasture (Table 7 .4).
Williams et al. (1989) also showed that urine application increased the K uptake by
pasture. Despite the fact that nearly two and a half times as much K was applied in
dung as in urine (Table 7. 1), the K uptake was not increased in dung treatment
compared to urine treatment (Table 7.4) . This demonstrates the higher, short term
availability of urine K as compared to dung K. The amounts K removed by pasture
were significantly greater in dung and urine treatments than in the control and
fertilizer treatments (Table 7.4) but there was no difference in the amounts of K
removed by pasture between dung and urine treatments and between the control and
fertilizer treatments. In high fertility lowland pastures more K and N uptake can be
expected, but as discussed below, the percent recovery of excretal nutrients may not
differ from those measured in this study. For example over a longer experimental
period (240 days) greater amounts of K and N (345kg N ha-1 and 297kg K ha-1) were
taken up by urine affected pasture in the study of Williams et al. (1990) than in the
present study. In the study of Ball et al. (1979) the amount of N removed by urine
affected pasture during 53 days in spring was again higher (143 to 202 kg N ha-1) than
this study.
In the study apparent recoveries by pasture of the S and N applied in excreta was very
low (1.9% and 3.7% of S and N applied respectively, in dung and 7.3% and 6.2% of
the S and N applied respectively, in urine). This showed that very small amounts of
S and N applied in excreta were used by pasture. In the South Island using 35S
labelled urine (Goh and Nguyen, 1990), the recovery of urine S from grazed pasture
was 7% of that applied for a period of over 270 days. The amount of urine N
recovered by pasture was also low, in keeping with the findings of this study, and that
of Williams et al ( 1990), where the amount of N recovered by the pasture from urine
was even lower (<5%) than the value reported in the present study. Ball et al. (1979)
reported much greater recoveries (23 to 37%) when urine was mixed with urea.
The amounts of K applied in dung and urine that were subsequently recovered by
pasture ( <1% in either dung or urine) were even lower than S and N. This showed that
pasture derived K mainly from soil, but excreta application boosted the pasture
production and hence more soil K was removed.

7.3.4 Leaching Losses of S, N and K
1 7 3
Leaching losses of nutrients from an urination event can occur by direct flow of urine
through the soil macropores, such as earthworm channels and root cracks (Williams
et al., 1990), or by subsequent percolation of rain water through the nutrient rich urine
affected soils. Willams et al. (1990) identified that a substantial proportion (up to
40%) of cow urine may move directly out of the top soil by macropore flow. In order
to examine the extent of macropore flow of urine through the soil in the lysimeter or
test for a cylinder/soil edge effect, drainage water was collected from the lysimeter
with a drainage collection vessel immediately after urine application (just after
application). The soil moisture content at the time of urine application was 0.78g g·1
soil.
The amount of drainage water collected from the lysimeter (just after application) was
equal to the amount of urine applied to the surface. There were no increases in the
concentrations of S, N and K found in the drainage water collected immediately after
urine application, suggesting piston displacement of soil water by the applied urine.
The lack of any increase in the concentrations of S , N and K on the resin traps in the
lysimeter treated with dung and urine collected two days after application confirmed
that sheep urine applied to the surface did not pass beyond the 250mm soil depth as
preferential flow down macropores and cracks or as edge flow around the cylinder
edge of the lysimeter.
Application of fertilizer increased the amount of S lost by leaching (Table 7 .5). An
amount equivalent to 13% of the fertilizer S was lost by leaching for the period from
late June to late August. The addition of dung or urine along with fertilizer, which
amounts to an additional 20.9kg S ha·1 in urine and 1 15 kg S ha·1 in dung, actually
resulted in decreases in the losses of S by leaching. These lower S losses must be due
largely to increased immobilization of S in soil and the small increased uptake of S
by pasture receiving dung and urine in addition to fertilizer (Table 7 .4). This suggests
that S leaching losses are not related to pasture production, but that in these N
deficient soils given an adequate supply of N, S can be conserved more effectively.
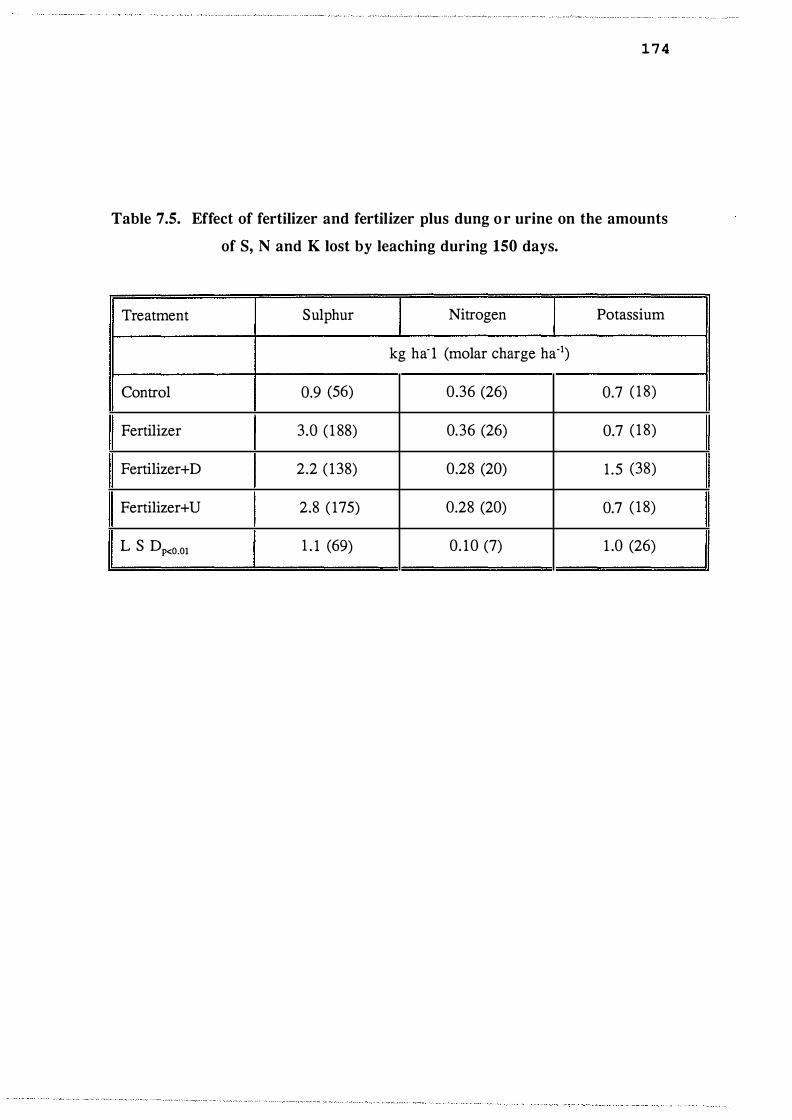
1 7 4
Table 7 .5. Effect of fertilizer and fertilizer plus dung o r urine on the amounts
of S, N and K lost by leaching during 150 days.
Treatment Sulphur Nitrogen Potassium
kg ha· 1 (molar charge ha-1)
Control 0.9 (56) 0.36 (26) 0.7 ( 18)
Fertilizer 3.0 ( 1 88) 0.36 (26) 0.7 ( 18)
Fertilizer+D 2.2 ( 138) 0.28 (20) 1 .5 (38)
Fertilizer+ V 2.8 ( 175) 0.28 (20) 0.7 ( 18)
L s Dp<O.Ol 1 . 1 (69) 0. 10 (7) 1 .0 (26)

1 7 5 Addition of 77 4kg N ha·1 in dung and 280kg N ha·1 in urine did not increase the
amount of N lost by leaching (Table 7 .5). Losses of N were even lower than the
amounts of S lost by leaching from either dung or urine applied plots. This supports
and confirms our previous results suggesting that N is by and large conserved in these
hill soils (Chapters 3, 5 and 6) . In comparison S is readily lost from the soil solution
(Chapter 5 and 6). Previous studies of the losses of N by leaching from grazed
pastures have in general shown that much greater losses (65% of the total N applied
in urine for 18 days) of N occurred (Ball et al., 1979) and have been attributed mainly
due to the preferential movement of urine by macropore flow down cracks and
channels to drainage tiles (Sharpley and Syers, 1979; Heng et al., 199 1 ; Williams et
al., 1990; Steele et al. , 1984) in nitrogen rich lowland environments.
The amount of K lost by leaching was not influenced by either fertilizer application
or the return of dung and urine (Table 7 .5). The amount of K lost by leaching in this
experiment (on average 0.7kg K ha-1) was lower than the amounts (35 to 55% of the
applied K in urine) lost in the study of Williams et al. ( 1989). In that study most of
the K was lost by preferential flow down macropores . But in low K environment of
these hill pastures preferential movement of urine did not occur.
7 .3.5 Leaching losses of Calcium and Magnesium
The equivalent amounts (moles of charge) of calcium(Ca) and magnesium(Mg) lost
by leaching in all four treatments were greater than the equivalent amount of K lost
by leaching (Table 7.5 and 7.6). This can be explained by considering the native
exchange capacity (centimolar charge kg·1 soil) of the individual cations in these soils.
The exchange capacity of K (1 .00 centimolar charge kg-1 so.i.!) was lower than the
exchange capacity of both Ca(6.5 centimolar charge kg-1 soil) and Mg(2.5 centimolar
charge kg-1 soil). Even though the amount of K (3700 molar charge ha-1) applied in
urine was much greater than Ca the amount of Ca (160 molar charge ha-1) and Mg
(540 molar charge ha-1) applied most of the applied K in urine was retained by the soil
while Ca and Mg (soil and urine) were lost by leaching. It is

1 7 6
Table 7.6. Effect of fertilizer and fertilizer plus dung or urine on the amounts
of Ca and Mg lost by leaching during 150 days.
Treatment Ca Mg
Kg ha-1 (molar charge ha-1)
Control 3.9 ( 195) 1 .7 (142)
Fertilizer 5.4 (270) 2. 1 ( 175)
Fertilizer + D 6.6 (330) 2.4 (200)
Fertilizer + U 8.3 (415) 3.0 (250)
L s Dp<0.01 2.6 ( 130) 0.7 (58)
1 7 7
probable that urine K exchanges with soil Ca and Mg, so that the amount of C a and
Mg leached immediately after urine application (190 vs 70 molar charge ha-1 Ca and
100 vs 50 molar charge ha-1 Mg for urine and fertilizer treatments) significantly
increased compared to the fertilizer treatment but the amount of K lost by leaching
was not significantly increased ( 18 vs 18 for fertilizer vs fertilizer plus urine). Heng
et al. (1991) demonstrated that K applied in fertilizer was retained by the soil in
exchange for Ca and Mg which were lost by leaching.
7.4 GENERAL DISCUSSION AND CONCLUSION
The results from this study quantifies common visual observations that the return of
excreta by grazing animals to fertilized hill pastures boosts pasture growth and
increases the pasture uptake of S and N in the vicinity of deposition. The proportions
of excretal S and N taken up by pasture however were low. Even though greater
amounts of K were applied in excreta, the proportion of excretal K taken up by
pasture was even lower than the proportion of excretal S and N taken up by pasture,
despite the fact that K fertilizer has not been applied to this hill country pasture since
the fertilizer trial began in 1975. This may reflect the greater pool of plant available
K present in these soils relative to S and N, in relation to the amount of S, N and K
deposited in excreta.
Preferential flow of urine through macropores to soil depths below 25cm following
urination was not a factor determining the leaching losses of N, S or K from these hill
country pastures. This is in contrast to observations made with dairy cow urine in
lowland dairy pastures (Williams et al., 1989), where preferential flow has been shown
to be a major vector by which N, K and S are lost from the root zone. For the short
winter-spring growing season studied, deposition of dung and urine did not increase
the leaching losses of S, N or K from these annually topdressed low fertility pasture
soils. This aspect remains to be examined in different climatic conditions and for pastures which receive higher fertilizer application rate and have higher stocking rates.
1 7 8 The low amounts of freshly applied excreta S , N and K recovered by pasture and lost
by leaching suggested that most of the S and N removed by plants was derived from
the mineralization of organic S and N which had accumulated from previous
application of fertilizer and excreta return.
The results presented here and those of Chapter-6 further suggest that the majority of
excretal and fertilizer S may be immobilized in to soil organic matter in the short-term
and not immediately cause accelerated nutrient leaching losses. It is apparent that the
input of excretal S into the soil organic matter eventually leads to higher soil S
mineralization rates, increased pasture uptake and losses by leaching of soil S.

179
CHAPTER-S
MODELLING THE FATE OF SULPHUR IN THE SOIL-PLANT SYSTEM
IN GRAZED PASTURE
8.1 INTRODUCTION
As discussed in Chapter- 1, a prerequisite for managing the efficient use of fertilizer
S in agricultural systems is a knowledge of the processes and interactions occurring
within each system that influence the fate of S. In New Zealand, the Ministry of
Agriculture and Fisheries scientists have considered that S requirements of grazed
pastures can be maintained if all S losses from the system are replaced. A simple
mass balance model has been developed for calculating the maintenance S
requirements of such grazed pastures (Sinclair and Saunders, 1982). The model
assumes that the fluxes of S between various pools within the pasture system (S-cycle)
are in steady state and estimates the balance between gains and losses from the
grazing system in order to make fertilizer recommendations.
For most soils the mass balance model does not take into account the losses occurring
within the soil system such as immobilization. It is not a dynamic model in the sense,
that it deals simply with calculating the annual balance whereas seasonal rainfall, plant
growth and organic matter mineralization are not considered and therefore the model
cannot be used to predict any seasonal limitations in S availability caused by leaching
frequency and/or soil organic matter turnover (Nguyen and Goh, 1990). Such
descriptions are useful to identity the time of the year when S fertilizer is best applied
to overcome the growth limitations due to the lack of S in the plant available pool or
minimize losses of fertilizer S from the system.
Partially dynamic models have been formulated for grazed pastures under Australian
conditions in two separate studies using information gained from tracing the fate of
radioactively labelled gypsum (Till and May, 197 1) and examining the fate of S in a
long term grazing study (McCaskill and Blair, 1990). Although the data in both
studies suggested that active cycling occurs in nearly all segments of the system,
180
except for some less labile organic sulphur fractions, no direct measurements of many
of the processes were made, particularly the rates of mineralization, immobilization
and leaching and their seasonal and climatic dependency. These Australian models
cannot be applied to New Zealand situations, because sulphate leaching, an important
process in New Zealand was not considered in detail in either of the Australian
studies.
Few (Gregg and Goh, 1978, 1979; Goh and Nguyen, 1991) attempts have been made
to quantify the fluxes of S between various soil S pools in New Zealand grazed
pasture systems. There is a need therefore to provide information for agronomist on
the movement of S within soil-plant-animal system and between plant available and
organic pools, and how they influence the fertilizer requirements of New Zealand
pasture system. This may be achieved by constructing a mechanistic model that
describes the important processes using information gained from field experiments and
then evaluating this model by applying it to New Zealand farming systems. A simple,
conceptual dynamic model for S cycling that describes the important processes and
their major controlling factors would take the form as shown in Fig.8 .1 . A successful
simulation of these processes over time, would provide information about the timing,
frequency and rate of S fertilizer application.
In this Chapter a simple computer simulation model was constructed to describe the
movement, transformation and losses of S from the soil-plant system only, adhering
as closely as possible to the concepts outlined in Fig.8. 1 . These concepts are
explained in more detail in the discussion section (section 8.3). The model output was
compared to field observations made in Chapters 5 and 6. This modelling exercise
is an attempt to summarise information gained in this thesis on the soil-plant part of
S cycle in a form which is useful to agronomists.
8.2 MATERIALS AND METHODS
Methods employed in making the field observations were discussed in Chapters 5 and
6.

Fig. 8 . 1 . A Simple Conceptual Dynamic Model Showing the S - Cycle
Fertilizer I
~
Plant
Soil Solution Sulphur
Immobilization f(T,w,Kd,S il OMAoJ
Mineralization
Leaching f<Ji ,Kd ,Sr)
Animal
f(A)
Soil Organic Sulphur
= Rainfall N = Soil Sulphate Adsorption Coefficient U
= Growth Limiting Nutrient = Pasture Utilisation
= Temperature f = Transpiration = Stocking Rate = Plant Organic Matter, Quality = Atrima1 Organic Matter, Quality = Particle Size plus Oxidation or Solubility Constant = Extractable Sulphate = Drainage = Atrima1 Excretion Patterns = Soil Volumetric Water Content
= function of a variable list
1 8 1

8.2.1 Determination of the relationship between extractable
and solution sulphate
182
The relationship between extractable sulphate and solution sulphate for the yellow
brown earth soils from the Ballantrae research farmlets (sections 5.2, 6.2 and 7 .2)
were determined for three soil depths (0-75mm, 75-150mm and 150-250mm) for two
of the four sites, namely, LF-LS and HF-LS. Field moist soil core samples were used
for establishing the relationship. Samples of field moist soil (7 .5g net, approximately
5g oven dry < 2mm sieve size) sample were weighed into a 10ml plastic centrifuge
tube, which had a hole in its base, which was covered with glasswool. This centrifuge
tube with the soil was placed inside another centrifuge tube of similar dimensions.
Five millilitres of sulphate solution was added. The soil was left (not shaken)
overnight in order to attain equilibrium. A range of sulphate solution concentrations
were used (e.g. 0, 20, 40, 80, 160 and 320 mg S t1). After 24 hours the soil solution
was collected in the outer tube by centrifugation at 15,000 RPM for 15 minutes. After
collecting the soil solution the soil (approximately 0.5g water g·1 soil) was extracted
with 0.04M Ca{HzP04)2 for 16 hours at a soil:solution ratio of 1 :5 and the sulphate
was determined in the extract by the method described in section 3.2 (Chapter-3). The
soil solution sulphate concentration was plotted against 0.04M Ca(H2P04)2 extractable
sulphate (Fig 8.8) rather than adsorbed sulphate because 0.04M Ca{HzP04)2 can be
routinely used to measure adsorbed plus solution sulphate in field soils (see discussion
section,8.3.3.1) .
8.3 MODEL DEVELOPMENT
8.3.1 Water balance
8.3.1.1 Calculating drainage volumes
The vector for the movement of plant nutrients in the soil is the soil water. A
drainage model is required to predict the movement of water through the soil because
loss of sulphate by drainage was a major fate of both applied fertilizer S (Chapter-7)
and mineralized soil organic S (Chapter-6). Daily drainage water volumes for a soil
183
column ofknown depth were predicted using the following simple balance equations.
( 8 . la)
where
wi= the initial depth of water (mm) in a soil column of specified depth.
wr= the final depth of water (mm) in a soil column of same depth.
R= Daily rainfall (mm).
�= Daily potential evapotranspiration (mm) (see section 5.2)
Initially it was assumed that rainfall intensity does not exceed the infiltration rate of
water into the soil. This assumption was tested by comparing actual and predicted
drainage volumes (Chapter 6, section 6.3. 1).
when Wr is greater than the depth of soil water at field capacity (wee), drainage (Dmm)
occurs. The amount of drainage (Dmm) occurring is given by the equation
( 8 . lb)
The drainage for the first experimental season (Chapter-5, section 5.3.1) was not
measured but for the second experimental season (Chapter-6, section 6.3. 1) the
drainage was measured and could be predicted well using equation 8.1a and 8 . 1b
(Chapter-6, Fig.6.2) which explained 98% of the variation in the observed data. The
close relationship between predicted and measured drainage (description of
calculations is given in Chapter-5) indicated that surface runoff during this
experimental period was negligible. Thus the simple water mass balance model is
adequate for predicting the volume of daily drainage events.
8.3.1.2 Estimating actual daily evapotranspiration.
The actual evapotranspiration (.AEJ from these pasture soils will be used to estimate
the flux of water from the soil through the plant. This will be the vector which carries
soil solution sulphate into the plant (Fig.8. 1 , Section 8.2.3.3). With complete cover
of the soil by pasture plants evaporation from the soil surface is negligible and 100%
of evapotranspiration � can be considered to occur from leaves of pasture plants
(Coulter, 1973; Jensen, 1973; McNaughton et al., 1979; Payne, 1990).
The effect of decreasing soil water content is to decrease the rate of evapotranspiration

184
(Payne, 1990; Gregory, 1990). This effect can be approximated by the relationship
given by Scotter et al. (1979) and Rickard et al. (1986). Rickard et al. ( 1986)
considered that for the Lismore stony silt loam plant growth completely stops
(permanent wilting point, PWT) when the soil water deficit was approximately 70%
of the maximum soil water deficit and the potential evapotranspiration (A�/EJ could
be achieved when the soil water deficit was less than 50%. In the absence of data on
pasture growth soil water deficit comparisons, for the Ballantrae field site, the
relationship derived by Rickard et al. (1986) has been applied. The soil water depth
(w, mm) shown in Fig.8.2. are those applicable to the top 75mm of the soil at the
LF-LS site where Wrc was measured at 34.7mm and the maximum observed deficit was
26mm (see below). Actual evapotranspiration (� equals the potential
evapotranspiration � at soil water contents between w1c and 0.5(w1c-PWT). The ratio
of AE/Et decreased linearly, however, when the soil water content declines from
0.5(w1c-PWT) to PWT). The soil water depth at which the soil water deficit is zero
(w1c) were measured as 34.7mm, 32.7mm and 4l .Omm for 0-75mm, 75-150mm and
150-250mm soil depths by measuring the moisture content of field soil cores samples
one day after a heavy winter rainfall event during which drainage occurred from LF
LS site. Similar values (g water g·1 soil) for the other three sites were given in
Appendix-5 .1 . The maximum soil water deficit at which plant growth completely
stopped (permanent wilting point) for the three layers (increasing depth) were
measured at -24.3mm, -22.9mm and -28.7mm in November 1989 after a twenty day
period without rain when no significant pasture growth was observed in the last three
days of the drought. So applying the relationship of Rickard et al. (1986) the
reduction of � to � was predicted to occur when the soil water deficit reached -
12. 15mm, -1 1 .5mm and -14.4mm for the three layers (increasing depth). Using this
relationship the � was calculated from a knowledge of daily � and the soil water
content using the Multiplan spreadsheet version 4.01 .
Water leaving the sward as evapotranspiration from the pasture herbage will be drawn
from different soil depths and the extent of extraction from each soil depth will
depend upon root distribution and the difference in water potential between the soil

Fig.8.2 Effect of increasing soil water deficit on the amount of evapotranspiration for 0-7 .5cm soil depth from LF-LS site.
o+J w ........ o+J w <(
1
0.8
0.6
0.4
0.2
0�----------------------�----------------------� - 24.25 - 1 2. 1 3 -0.0 1
Soi l water deficit (mm)
� CX> LT1
186
water at the root surface and that within the root and the resistance to flow (resistivity)
attributed to the root membrane. The flow of water from the plant root to the leaf will
depend upon the difference in water potential between water in the root and the water
in the stomatal cells and the length and resistivity of the xylem vessels connecting the
two. In turn the water potential in the stomatal cells is determined by the water
vapour pressure in the stomatal cavity which itself is determined by the extent of the
stomatal pore opening and the atmospheric water vapour pressure (Gregory, 1990).
Modelling the above processes to explain the evapotranspiration loss from pastures is
beyond the scope of this thesis. However in this simple model it is assumed that the
amount of water removed by plant from the soil depends only upon the distribution
of root weight in each soil depth. There is some evidence (Payne, 1990) that this
method provides a reasonable description of water removal from different soil depths.
Barker et al. (1988) showed that, the root distribution of a hill country pasture
containing browntop, perennial ryegrass and white clover was 65%, 30% and 5% for
0-75mm, 75-150mm and 150-250mm soil depth. The total � was partitioned to draw
water from each depth relative to the percentage root distribution in each soil layer.
� from ilh soil layer was calculated as follows
( 8 . 2 )
where :ErT is the total root mass for all the layers (i=1 to 3) and ri is the root mass for
the ilh layer. Et from each depth was then converted to AI; based on the relationship
between .AEfEt and soil water deficit in each depth.
8.3.2 Testing the concept of single sulphate pool for plant
and leached sulphate
The simple configuration in Fig.8 . 1 assumes that there is one available sulphate pool
from which S is taken up by plant and lost by leaching (Syers et al., 1987; McCaskill
and Blair, 1988). In the experiment described in Chapter-6, 35S labelled
superphosphate was used to label this sulphate pool and other soil S pools. If the
simple concept outlined above is correct, then the specific activity of S ess cpm/mgS)
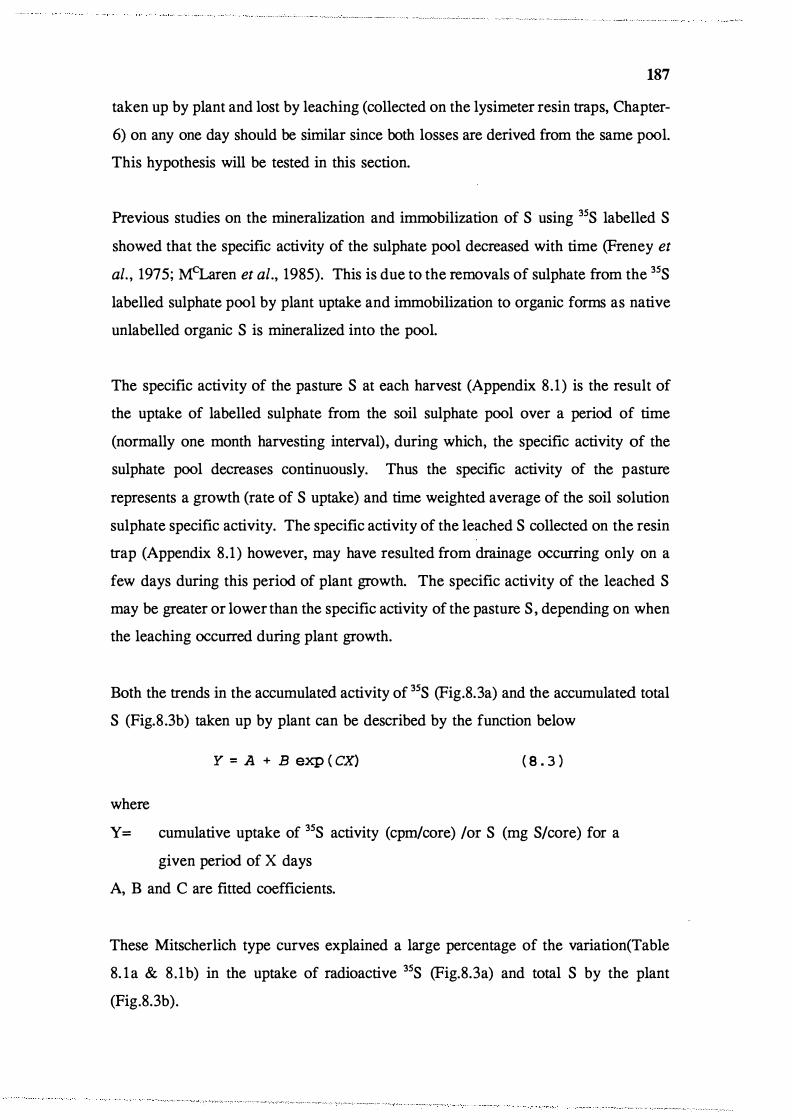
187
taken up by plant and lost by leaching (collected on the lysimeter resin traps, Chapter-
6) on any one day should be similar since both losses are derived from the same pool.
This hypothesis will be tested in this section.
Previous studies on the mineralization and immobilization of S using 35S labelled S
showed that the specific activity of the sulphate pool decreased with time (Freney et al. , 1975; M_<Laren et al., 1985). This is due to the removals of sulphate from the 35S
labelled sulphate pool by plant uptake and immobilization to organic forms as native
unlabelled organic S is mineralized into the pool.
The specific activity of the pasture S at each harvest (Appendix 8 .1) is the result of
the uptake of labelled sulphate from the soil sulphate pool over a period of time
(normally one month harvesting interval), during which, the specific activity of the
sulphate pool decreases continuously. Thus the specific activity of the pasture
represents a growth (rate of S uptake) and time weighted average of the soil solution
sulphate specific activity. The specific activity of the leached S collected on the resin
trap (Appendix 8.1) however, may have resulted from drainage occurring only on a
few days during this period of plant growth. The specific activity of the leached S
may be greater or lower than the specific activity of the pasture S , depending on when
the leaching occurred during plant growth.
Both the trends in the accumulated activity of 35S (Fig.8.3a) and the accumulated total
S (Fig.8 .3b) taken up by plant can be described by the function below
Y = A + B e:xp ( CX) ( 8 . 3 )
where
Y= cumulative uptake of 35S activity (cpm/core) /or S (mg S/core) for a
given period of X days
A, B and C are fitted coefficients.
These Mitscherlich type curves explained a large percentage of the variation(Table
8. 1a & 8.1b) in the uptake of radioactive 35S (Fig.8.3a) and total S by the plant
(Fig.8.3b ).

Fig.8 .3a Cumulative amounts of S-35 activity removed by pasture with time at all four sites from Jan. to Oct. 1 990.
1 20000000
+
1 00000000 - I /� T X Q) '-0 � 80000000 a.
If -
1 60000000 t X
-0 � 40000000 I 11 : / � >
:.;:; I 11 / - / (.) <( 20000000
X
0�------+-------�------�------�------�------� 0 50 1 00 1 50
T ime (days) 200 250 300
X LF- LS
- LF-MS
. HF- LS
+ HF-MS
t-' CO CO
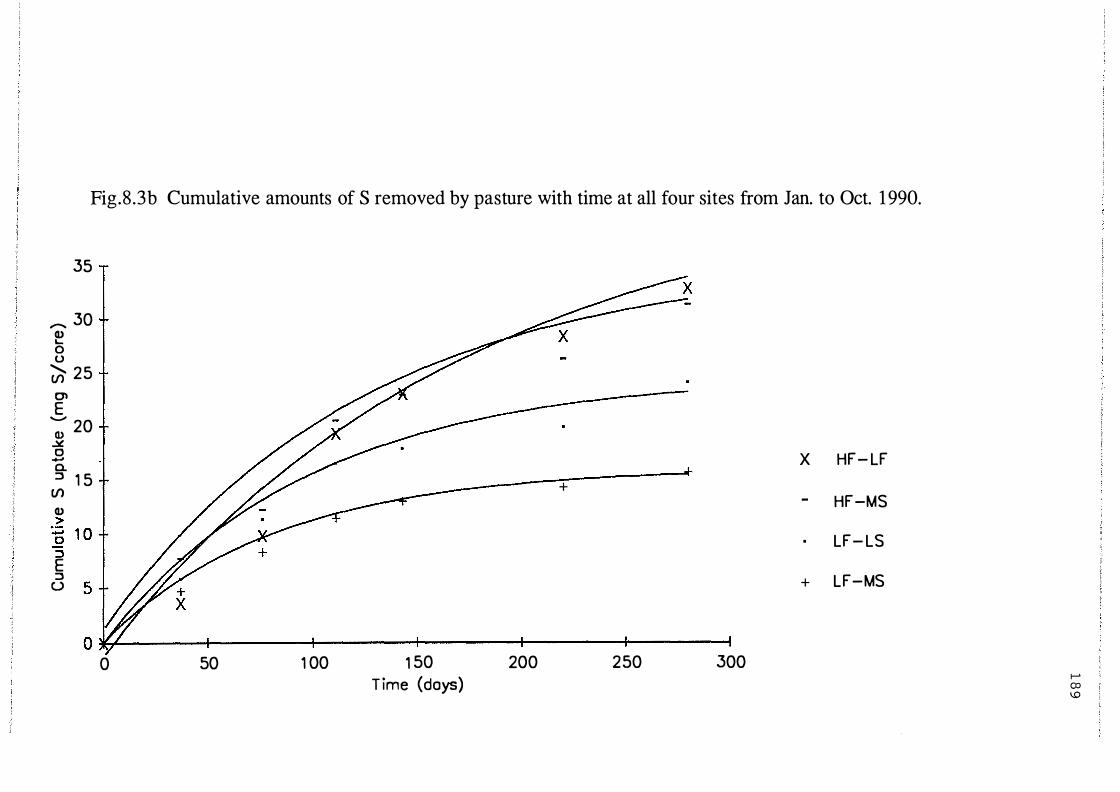
Fig.8.3b Cumulative amounts of S removed by pasture with time at all four sites from Jan. to Oct. 1 990.
35
.- 30 Q) "-0 u � 25 0' E
........ 20 Q) � 0 · I / / � ..... a. ::J 1 5
/� + (/) I Q) > "§ 1 0 T / / � ::J E ::J s l ////. (.)
0�------------+-------------�------------�------------�------------�------------� 0 50 1 00 1 50
T ime (days) 200 250 300
X HF- LF
- HF-MS
. LF- LS
+ LF-MS
t-' OJ �

Table 8.la Regressions for the cumulative uptake of 358 activity (cpm/core)
with time for all four sites.
Farmlet Regression equation R2
LF-LS y = 1 1 .2-1 1 .3 X exp(-0.012x) 99.4
LF-MS y = 1 1 .6- 1 1 .7 X exp(-0.012x) 99.5
HF-LS y = 7.7-7.6 X exp(-0.0 18x) 99.2
HF-MS y = 7.0-7.3 X exp(-0.012x) 97.3
Table 8.lb Regressions for the cumulative uptake of S (mg S/core)
with time for all four sites.
Farmlet Regression equation R2
LF-LS y = 16. 1 - 16.0 X exp(-0.012x) 99.4
LF-MS y = 24.7-24.7 X exp(-O.O l Ox) 98.0
HF-LS y = 34.5-34.2 X exp(-0.088x) 97.7
HF-MS y = 43. 1 -44.3 X exp(-0.06x) 96.6
1 9 0

191
These functions were differentiated to allow uptake of 35S activity and S to be
predicted for each day (equation 8.4). The time dependant differential function for the
uptake of 35S and S is given below
: = BCexp ( CX} ( 8 . 4 }
where Y, X, B and C were described in equation 8.3.
The differential function explaining the rate of 35S activity uptake was divided by the
differential function explaining the rate of S uptake by plants in order to calculate the
time dependent function for describing the specific activity of daily plant S uptake.
The calculated time dependent specific activities were related well (r2=0. 799), but
slightly underestimated the observed specific activities of the pasture for all harvests
(all six cuts from Jan. to Oct. 1990) from all four sites (Fig.8.4).
As mentioned earlier, both the resin from the resin trap and pasture from the core
were collected at the same time. Leaching might have occurred for only a few days
and not continuously during a period plant growth. The amount of sulphate lost by
leaching and the specific activity of the leached S on a daily basis was calculated in
the following way :
Using the model developed to predict the drainage (Chapter 5 & 6), the days during
a growth period in which drainage occurred were identified and the total volume of
drainage was calculated between two successive harvests(H), namely Hn to Hn+ 1 ,
which is given by the equation
( 8 . sa)
where D is the total predicted drainage (mm) between two successive harvests and Dn
is one of a number of daily drainage events (mm) between two successive harvests.
From the above equation the fraction (p) of total drainage for a growth period
occurring on a particular day was calculated as

Fig.8.4 Relationship between predicted and measured specific activity of S in pasture for the period from Jan. to Oct. 1 990 at all four sites.
1 0 - Y = 0.82X ID-'-o I 0 R2=0.799
.-* Q.) I... 8 0 (.)
.......... en 0\ E
.......... 6 E a. (.) ........, .?;- I * · -
4 > � (.) <( ci. (/) "'0 2 Q.) ...... I * * (.) "'0 e
a.. 0�----�r-----��----�-------+-------r----�
0 2 4 6 8 1 0 1 2 Measured Sp.Activ ity (cpm/mg S/core• 1 0 � t-'
� tv

193
( 8 . 5b)
Assuming that the amount of sulphate leached is proportional to the drainage volume,
the amount of sulphate leached on a particular day can be calculated as
Sulphate leached = p x Total sulphate leached from HN to HN+l
The specific activity of the leached S on a particular day was considered to be same
as that predicted from the time dependent functions describing the specific activity of
daily plant S uptake. The amount of 35S activity leached by a particular rainfall event
was estimated by multiplying the amount of S leached on that date by the specific
activity of daily plant S. By summing the amounts of 35S activity leached by each
rainfall event (between harvest � to harvest f4t.1) and dividing this by the amount of
sulphate leached�the specific activity of S collected on the resin trap between harvests
� and f4t.1 could be predicted. The predicted specific activity of the leached sulphate
was lower (r=0.61, slope=0.73) than the measured specific activity of leached
sulphate collected on the resin (Fig.8.5). The predicted plant specific activity
(Fig.8.4), however was also lower (slope=0.82) than the measured specific activity of
plant. This suggests that if measured plant specific activities could be used (the
intermittent nature of drainage events prevented this) to predict drainage water specific
activities the slope of the relationship would be 0.73/0.82 = 0.9. On that basis the
specific activity of the plant available sulphate pool is slightly, but consistently lower
than that of the pool susceptible to leaching. Reasons for this could include
1 . Initial leaching of fertilizer 35S to depths where root activity (Barker e t
al., 1988) and sulphate pool turnover rate (Hedley, unpublished) are
lower, would lead to less 35S uptake by the plant and a slower decline
in the specific activity of the sulphate pool at depth which remains
susceptible to leaching during subsequent rainfall events.

Fig.8 .5 Relationship between the predicted (from plant S specific activities) and observed specific activity of the leached S at all four sites from Jan. to Oct. 1 990 .
.-. 1 0 UIO
..* Q} '-0 � 8 (/) 0'1 E .......... K 6 (..)
-
>-....... >
� 4 0 (..)
-:.;::: · -(..) Q}
Y = 0.73X
R 2=0.6 1
*
* //
/ � * "" * � 2
"0 Q} ....... (..)
// *
:.0 �
� 0 *
* * *
//
*
//
*/
//
*
*
* / 1 : 1
*
*
*
ll. 0 2 4 6 8 1 0
Leachate specific activ ity (cpm/mg S/core• 1 0 � 1-' 1..0 ..,.
2. In the plant rhizosphere which includes micropores exploited by fme
roots and root hairs (Barber, 1984), the rate of sulphate turnover may
be more rapid than in the bulk soil or in macropores. More leached S
may be derived from the larger pores (mobile phase) rather than
micropores (immobile phase). Plant root hairs normally derive S from
the immobile phase by diffusion (Barber, 1984). The sulphate in the
immobile phase may be diluted rapidly because of increased
mineralization associated with root activity. Thus in general the
specific activity of sulphate in larger pores may be diluted at a slower
rate than that in areas of intense root activity.
195
Irrespective of the cause of this small difference in S transformation rates it would be
wise to partition the soil into defined zones of differing root activity. In this respect
a vertically layered model with root activity and mineralization decreasing down the
soil profile would seem acceptable.
8.3.3 Modelling the fluxes of S between various pools
The amount of sulphate present in the soil solution for a given layer (i), which is
potentially available for plant uptake and loss by leaching at any time 't' is given by
the balance equation
( 8 . 6 )
where
E.r,= sulphate (kg S ha-1) present in the plant available pool at any time t for ith
layer,
Es,�_1= sulphate (kg S ha-1) present in the plant available solution at time t-1
for ith layer,
P5= sulphate taken up by plant (kg S ha-1) during the period from t-1 to t
from the ith layer,
L5= sulphate lost by leaching (kg S ha-1) during the period from the ith layer,
�= Amount of sulphate (kg S ha-1) mineralized to the sulphate pool from
soil organic matter in one day in ith layer,

�= Amount of sulphur (kg S ha-1) entering the sulphate pool in the ith layer
from rainfall or other solution inputs,
Fs= Amount of sulphate (kg S ha"1) entering the sulphate pool from
fertilizer.
196
The S input through rainfall is negligible (<2 kg S ha-1 y-1 , see Ledgard and Upsdell,
1991) for the Ballantrae experimental site and no fertilizer was applied during the
experimental period to be modelled. The majority of the S input to the sulphate pool
is from the mineralization of soil organic matter, which includes the decomposition
of animal excreta, plant litter, root and older soil organic matter. In the following
discussion the contribution of both fertilizer and rainfall sulphur to sulphate pool were
not included. In the model plant S and leached S are derived from solution sulphate
and that the order in which the processes occur leaching, plant uptake and
mineralization (Fig.8.6). The following sections construct submodels to describe the
dynamic features of the components of equation 8.6
8.3.3.1 Predicting the soil solution sulphate concentration
For a model to predict the amounts of S taken up by plants or leached (Fig.8. 1 ) the
soil solution sulphate must be estimated on a regular basis. To do this ideally
functions are required to describe the relationship �) between adsorbed and solution
sulphate in field soils. The relationships between amounts of adsorbed sulphate and
soil S solution concentrations varies from soil to soil depending upon the extent of
positively charged soil surfaces (Barrow, 1967b), the past fertilizer history and the
present fertilizer application rate (Freney, 1986). Most positive charge in soils is
present as protonated hydrous oxide surfaces and organic functional groups or as a
layer of cations adsorbed to negatively charged clays and organic matter. The
distribution of these components varies with depth for a particular type of soil and
with them the ability of the soil to adsorb sulphate (Rhue and Kamprath, 1973).
It is difficult to measure the soil solution sulphate concentrations in field soils,
particularly when the soil moisture content is lower than field capacity. In dry periods
the soil solution cannot be collected using porous, porcelain cups and suction
sampling. It is however, relatively easy to core sample soils and carryout laboratory

197
Fig. 8 .6. Hierarchical Order of the Processes in the S Cycle
Mineralization Submodel
i = 1 i = 2 i = 3
Sorption Submodel
i = 1 . 1 3 l = -
Daily End Tn + 1
Daily Start T n
i = 2 i = 3
Leaching Submodel
i = 1 i = 2 i = 3 i - 1 - 3
R ,w. ,wc n z 1C
L s S = Soil Solution Sulphate if = Extractable Soil Sulphate cYther symbols were described in Fig.8. 1 .
i = 1 i = 2 i = 3
Plant Uptake Submodel
{AEt,w . } l l
198
measurements. The common soil test to measure solution plus adsorbed sulphate in
the soil is to extract the soil with 0.01M or 0.04M Ca(H2P04)2 (Searle, 1979; Saunders
et al., 198 1). Some of the S extracted from pasture top soils is in organic form
(W atkinson and Perrott, 1990). The extractable soil sulphate was measured in this
experiment using 0.04M Ca(HzP04)2 (1 :5 soil:solution ratio) (Chapters 5 & 6).
The soil solution sulphate concentration for the 150-250mm soil depth in the field was
able to be measured on seven occasions by collecting the soil solution using pre
washed porous ceramic suction cups (Heng et al., 1991) (Table 8.2). The
concentration of sulphate in the soil solution (Table 8.2) was related to the soil
extractable sulphate (Fig.8.7). This relationship could hot be developed for top two
soil layers because the soil solution was not collected for those two layers.
A relationship, however, was required between soil solution sulphate and extractable
sulphate for the top two soil depths because in the absence of any measurement of soil
solution sulphate concentrations such a relationship is required to predict the sulphate
concentration in solution present during the experimental period for all soil depths.
For sampling purposes the soil profile was divided into three layers, namely 0-75, 75-
150 and 150-250mm. For all the three depths the relationship between soil solution
sulphate and the 0.04M Ca{HzP04)2 extractable sulphate was established using
'adsorption isotherms' conducted in the laboratory for soils from both the LF and HF
farmlets as mentioned in section 8.2. 1 . The relationships were not strictly adsorption
isotherms, because the extractable sulphate measured using 0.04M Ca(H2P04)2
contains solution, adsorbed and some organic sulphur (W atkinson and Perrott, 1990).
For this reason true adsorption isotherms were not generated using plots of adsorbed
sulphate vs solution sulphate. Linear relationships between extractable sulphate and
soil solution sulphate however, were established for all the three layers (Fig.8.8). The
extractable sulphate concentrations normally found in the field soil throughout the
experiment (Table 8.2) were used to limit the range in which the relationships were
derived. There was no significant difference between the slopes of the relationships
for soils taken from the LF and HF farmlets (data not shown). Data therefore were
pooled and combined regression models were generated for each of the three soil
depths (Fig.8.8). The relationships show that the soil solution sulphate as a proportion
of the extractable sulphate decreased as the soil depth increased (Fig.8.8). The

Table 8.2 Soil solution sulphate concentrations sampled by suction cup
amounts of 0.04M Ca(H2POJ2 extractable sulphate present in the soil from the
15-25cm depth for LF-LS and HF-LS sites for seven sampling events.
Farmlet Suction cup sulphate
Extractable Solution
mg S kg-1 soil mg S 1-1
LF-LS 9 .0 1 . 3
8 .0 1 . 0
6 .5 0 .9
9 .3 1 . 0
8 . 3 1 . 0
9 .4 0. 8
10. 1 1 . 0
HF-LS 18 .4 8 . 5
16 .6 7 .5
1 8.4 9 . 2
22. 8 9 . 4
1 9 . 3 8 .4
17 .9 8 . 0
1 8 . 3 8 .5
1 9 9

Fig.8. 7 Relationship between the soil solution sulphate measured in the laboratory (- - - ) or in the field ( ----1 and 0.04M calcium phosphate extractable sulphate for the 1 50-250mm soil layer.
35
::- 30 0
(/) Cl
..Y. 25 ......... (/) Cl ..§, 20 Q) ..... 0 ..r: _g. 1 5 ::J en Q)
..0 1 0 0 ..... (.J 0 I.. ..... X 5 w
0
* /
0 1 2
/
/ / *
3
t
2 / Y= 1 .32+5.2X (R =0.635)
/ / *
/ *
4 5 6 So lution sulphate {mg S/ 1 )
7
I •
Y=7.3+ 1 .4X (R 2=0.94)
8 9 1 0 N 0 0

Fig.8 .8 Relationship between extractable sulphate and solution sulphate measured in the laboratory for the soils from 0-75, 75-1 50 and 1 50-250mm depths for LF and HF farmlets.
Q) o+J o ,-... ..c: _ 0.·- o ::l cn en
40
30
Q) C1) 20 - � .0 ......... 0 (/) o+J CJ) g E L. o+J X w
1 0
* 1 5-25cm
Y= 1 .3+5.24X {R2=0.64)
7.5- 1 5cm
• Y=4.42+2.68X (R2=0.978)
*
* 0-7.5cm
Y=4.4+0.9X {R2=0.896)
0+-----�--��---1-----+-----+-----r----�--� 0 2 4 6 8 1 0 1 2 1 4 1 6
So lution sulphate (mg S/ 1 ) I 'V 0 f-'

202
functions derived from this relationship were used to calculate the soil solution
sulphate for each layer.
For soils from the 150-250mm depth of the low fertility sites (solution sulphate
concentrations around 1mg 1"1) there was little difference between the function derived
from the laboratory data and the function derived from the field suction cup data
however, for the high fertility sites (solution sulphate concentrations around 9mg 1"1)
these functions are different for 150-250mm depth (Fig.8.7). In the model, the linear
function derived from the suction cup data was used to calculate the soil solution
sulphate concentration from extractable sulphate data for 150-250mm depth at the high
fertility sites only. The laboratory derived relationships were used for all other soil
depths. Reasons for this are given in the discussion (section 8.4).
8.3.3.2
8.3.3.2.1
Accounting for Leaching of Sulphate
A layered drainage model with mobile
and immobile water phases.
Few mechanistic models have been published describing sulphate leaching from grazed
pastures (Heng et a/. ,1991). As the sulphate adsorption capacities for each soil depth
were widely different (see Section 8.3.3. 1), decreasing with depth, it was considered
that a three layered (0-75mm, 75-150mm and 150-250mm) leaching model may be an
appropriate way of dealing with these differences.
The main assumption in this three layer model is that an input of water, either rainfall
or drainage, from the layer above (i- 1)(R, mm) moves into a layer i of the soil profile,
once the soil water depth (wi, mm) is equal to soil water depth at field capacity (w1c,
mm) the incoming water displaces an unknown proportion of native soil water in
relation to the input volume (the condition when R exceeds w1c is discussed later).
This assumption simulates the condition where some of the input water, Ra mm (a
fraction a) will move through larger pores interacting little with the native soil water,
while in smaller capillaries native soil water will be displaced ahead of the incoming
water, R(l-a) mm.

203
The soil solution sulphate concentration (Cs,i• kg S mm-1, per ha slice) for a given
amount of extractable sulphate for ith layer before input water passes through the layer
is given by the equation
( 8 . 7 a )
where
Es i is the amount of extractable sulphate (kg S ha-1) present in ith layer .and Kd,i is the
function explaining the relationship between extractable sulphate and the soil solution
sulphate for the ith layer. The functions for all the three layers were given in Fig.8.7
and 8.8. Prior to reaching field capacity (wrc• mm) for the layer i=1 i.e. Ri + wi � Wrc then the new soil solution concentration for layer i=1 is given by the equation
( 8 . 7b}
where �.i is the concentration of sulphate (kg S mm-1) in the incoming water and Ri
is the amount of input water to the i=1 layer and the remaining parameters have been
described earlier. In the case of surface layer the incoming water is rainfall and the
concentration of S is negligible. Under such conditions the concentration of sulphate
in the soil solution is the one given in equation 8.7a i.e. the change in concentration
of sulphate in the soil solution of layer i=1 due to incoming rainwater is assumed to
be negligible unless leaching occurs.
When the soil water depth of the ith layer (wi, mm) has reached w1c, then the drainage
volume (Di,mm) is equal to the input water volume (Ri, mm) and the total amount of
sulphur lost by leaching (Ls,i• kg S ha-1) from the ith layer is sum of two components.
1 . The amount of native soil solution sulphate displaced by the slow moving input
volume water (Di( l-a)) entering the layer (Ld,i• kg S ha-1) which is given by the
equation
(8 .Sa)

204
and 2. the mobile fraction (Lm;) of the incoming water (Dia) which passes directly
through the soil layer. When the input water passes rapidly through the surface layer
without interacting with the native soil water its drainage path to lower soil depths is
presumed to be un-impeded. Therefore this water will pass through the rest of the
layers without any interaction with the native soil water. For the purposes of the
model wi for the layers i=2 and 3 is only increased by the water volume D(l-a)
displaced from the i-1 layer. Also this means that drainage Di=1a occurs from the
whole soil profile as soon as R=1 + wi=1 > Wrc,i=1, irrespective of the wi=Z and wi=3• The
input water sulphate concentration (�) must now have two distinct components 1 .
the fast moving drainage water volume Dia with S concentration � a• and 2 . the slow
moving drainage water Dl1-a) with S concentration �. 1.a. The amounts of S in the
mobile leached volume would be given by the equation
( 8 . 8b)
Therefore
( 8 . 8 c)
In the case of rainwater at the Ballantrae site, which contains negligible sulphate � i
is zero then �.i is equal to zero. At other sites closer to coast �.i would require a
positive value.
If the displaced drainage water volume (D(l-a)i_1 + wi -wrc) is negative then D(l-a)i=O
and no leaching occurs. i.e. Ls,i is zero in equation 8.8c. After leaching
reequilibrium between adsorbed and solution sulphate occurred prior to plant uptake.
The amount of extractable sulphate (kg S ha- 1) remaining in the ith soil layer after an
input event or a drainage event is given by the size of initial extractable sulphate pool,
Es,i• plus the amount of sulphate leached from the layer above (Ls i-1) minus the
sulphate leached from that layer (L8 J
( 8 . 9 )

205
where Es.i.<t+1> is the amount of extractable sulphate (kg S ha-1) present after leaching.
The new concentration of sulphate in the solution is
Cs, i , ( t+l) = Kd, i [ Es, i> - Ls, i + Is, l-o: .i Di-1 ( 1 -u ) ] ( 8 . 10 )
where t is a time or volume step (see discussion later). This is the solution
concentration that is used to calculate plant uptake on a day when leaching occurs
(section 8.3.3.3).
8.3.3.2.2 Estimating the mobile volume (a)
Having constructed this simple drainage model it was necessary to obtain by iterative
procedures the value for a. The value of a was estimated in the laboratory using
intact soil cores collected from the same Ballantrae LF-LS and HF-LS farmlets
(Chapter-4). The initial soil solution sulphate concentration for all the three depths
and for both the cores were calculated using the relationship between extractable
sulphate and the solution sulphate determined in the laboratory measurements (Fig.8.8)
and the measured extractable sulphate of the soil for the three depths (Chapter-4). The
soil cores were leached with simulated rainfall at a rate of 0.23mm per minute for
seven hours (a total of 99mm rainfall was applied) and 85 mm of drainage was
collected from each core for the f'rrst leaching event. The amount of sulphate leached
for both cores were 1 . 14 and 5.04 kg S ha-1 for LF-LS and HF-LS sites (Chapter-4).
It was assumed that sulphate leached from each layer depends upon the earlier model
description. The value of a was adjusted to predict the amounts of measured sulphate
leached. The best fit a values were 0.250 for the soil from LF-LS and 0.3 for HF-LS
sites respectively. But in the field this value may change slightly due to seasonal soil
compaction and swelling. An a value of 0.3 was used in the subsequent model.
8.3.3.3 Plant Uptake of Sulphur
The second step in the process is the plant uptake of S from the soil solution. The
amount of any nutrient taken up by plant for a particular period of time is a function
of the amount of water removed by the plant (Scotter et al., 1979; Hayman and

206
Stocker, 1982; McAneney and Judd, 1983; Rickard et al., 1986; Martin, 1990) and the
soils ability to supply nutrient to the soil solution. The amount of water removed by
plant can be considered to be the actual evapotranspiration (A.EJ from pasture soils
(see discussion 8.3. 1 .2). So, assuming that most sulphate moves to plant roots by
mass flow (Barber, 1984) the amount of sulphur removed by plant is proportional to
the � (mm) multiplied by the soil solution sulphate concentration (kg S mm·1).
The amount of water removed from each layer was calculated from daily Et and that
multiplied by the soil solution sulphate concentration (calculated from equations 8.7a
and 8.7b and 8.10 in each layer) to give the amount of sulphur removed from each
layer was calculated. Initially it has been assumed in this model that all of the sulphur
removed by the plant was moved to the root zone by mass flow. The limitations of
this assumptions are explained in the discussion section. The amount of sulphur
removed from each of the three layers depends upon the rainfall and drainage.
Drainage was considered to be immediate (instantaneous) relative to plant uptake and
mineralization (a continuous process). Therefore in this model leaching of S followed
by the reestablishment of the equilibrium between adsorbed and solution S occurred
prior to plant uptake and mineralization. Thus when drainage occurs from the soil,
the amount of sulphur removed from the particular layer by plant uptake will be lower
than that removed without drainage.
Mathematically, the amount of sulphur removed by plant from ith layer is given by the
equation
( 8 . 1 1 }
Where Ps; is the amount of S (kg S ha-1) removed by plant from the ith layer, � is
the proportion of � removed from the ith layer and Cs,i was discussed earlier. As
mentioned in section 8.3.3.2. there exist an equilibrium between the soil solution
sulphate and adsorbed sulphate. As the soil solution sulphate decreased by plant
uptake, sulphate will be removed to soil solution depending upon the amount of
sulphate on the surface of the soil.
A fraction of the total S taken up by plant was considered to be accumulated in the
root because for every unit of shoot growth a small amount (8-10% of shoot growth
depending upon season) of root growth also occur (Mathew et al., 1989). It was
207
assumed that the distribution of S between root and shoot and shoot was similar to the
distribution of dry matter production measured by Mathew et al. ( 1989) (Appendix-
8.2).
8.3.3.4 Accounting for mineralization of soil organic Sulphur
At the outset of planning this study it was hoped that isotopic dilution data in Chapter
6 could be used to calculate the actual mineralization and immobilization rates for
these soils. This has not been achieved due to lack of time and therefore the rates of
S mineralization used in the model are the net values measured in Chapter 5 by S
balance studies using the lysimeters.
In the model, it was assumed that all of the S mineralized from the soil organic
matter, plant litter, root and animal excreta are considered to enter into the soil
solution sulphate pool (Fig.8 .1 ). The amount of sulphate mineralized to solution
sulphate of each soil layer was predicted from the knowledge of the measured amount
of S net mineralized under field conditions (chapter-S, section.5.3, Table 5.9). The
amount of S mineralized in each soil layer was predicted on the basis of the
distribution of root in each layer. The limitations of this assumption are discussed in
the discussion section. The amount of S mineralized (�) for layer i was predicted
using the following equation
( 8 . 12 )
where rT; is the root distribution for the ith layer and ErT is the total root mass for the
profile and MT is the measured amount of S mineralized per day in � ;soil layer._,
8.3.3.5 Executing the Model
The whole model was executed by entering all calculations and input data into a
Multiplan spreadsheet version 4.01. A separate spreadsheet was used for data for each
of the four field study sites, namely, LF-LS, LF-MS, HF-LS and HF-MS. Plant
uptake of S, leaching losses, mineralization to sulphate pool and extractable soil

208
for all the four sites on a daily basis for 220 days from June 1989 to Jan. 1990. The
model was initiated with the measured values for the amounts of soil extractable
sulphate (kg S ha-1) for all the three layers from at all four sites day 1 , June 1989.
The amount of extractable sulphate CEs.r,i kg S ha-1) present in the soil at the end of
each day (after leaching, plant uptake and mineralization) was calculated using the
equation given below
E = E - L - P + M s , f, i s , i s, i S, i s , i ( 8 . 13 }
where �.i is the amount of sulphur mineralized to sulphate pool and the remaining
parameters were discussed in earlier sections. The other main inputs to the model
were daily rainfall (Appendix-8.3a), evapotranspiration (Appendix-8.3b), initial soil
moisture content (Appendix-5.1) and the seasonal pattern of S distribution between
shoots and roots.
8.4 RESULTS AND DISCUSSION
8.4.1 Comparison of model output with field
measurements
The predicted and measured S uptake by pasture for 220 days are given in Fig.8.9 and
Fig.8. 10 for all the four sites. The model predicted the amounts of sulphur removed
by pasture tops for all four sites reasonably well. After allowing for the uptake of
sulphur by root the total accumulated amounts of sulphur removed by pasture were
slightly under estimated (approximately 1 and 3 kg in low and high fertility sites).
Initially the amounts of sulphate lost by leaching were under estimated (17 .3 vs 7.4
kg S ha-1 at the HF-LS and 13.3 vs 6.2 kg S ha-1 at the HF-MS site) at high fertility
sites when the function derived under laboratory conditions to explain the relationship
between extractable sulphate and the soil solution sulphate were used for the 150-
250mm soil depths. However, when this function was replaced with the function
derived from field data (Fig.8.7) the model predicted the leaching of sulphate at both

Fig . 8 . 9 Predicted (-- + --) and measured (- - • - -) cumulative amounts of sulphur taken up by pasture at
LF-LS and LF-MS sites .
1 Q T 1 4 L F - LS I I LF - MS
9 ! 1 2 +
0 8 I I .c ......... I (/) 7 I 1 0 Ol
:; �
I .._ 6 8 Q) y � 0 I 0. 5 :::> (/) fj 6 Q) 4
I > :;::;
3 0 4 :::> E :::> 2 u 2
I "' 1
o J� I I I I 0 0 50 1 00 1 50 200 250 0 50 1 00 1 50 200 250 T ime (days) T ime (days) N
0 \.0
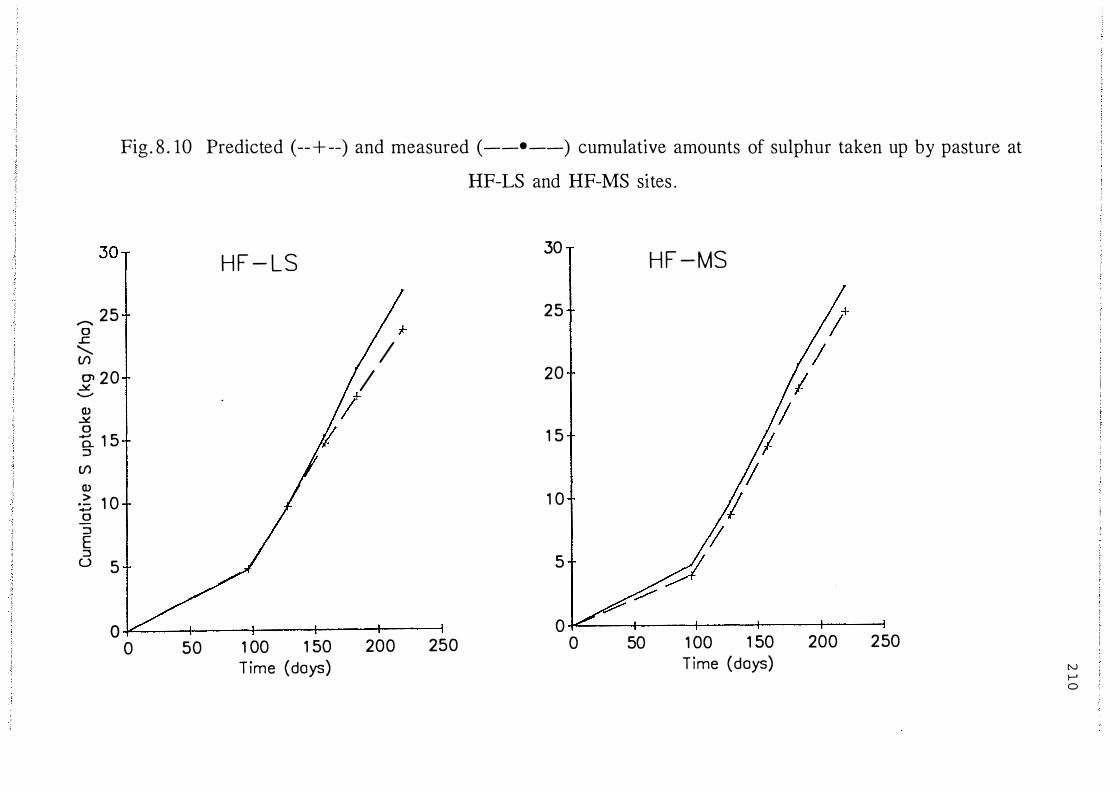
Fig . 8 . 10 Predicted (-- + --) and measured (--•--) cumulative amounts of sulphur taken up by pasture at
HF-LS and HF-MS sites .
30 T HF - LS 3o I HF -MS
.- 25 25 /+ 0 * .c ' I I (/) CJl 20 I 20 I .Y. ...........
1 (1) '/ .Y. 0 0. 1 5 1 5 r; ::l (/) r; (1) > 1 0 (/ :;:. 1 0 0 ::l 1 E ::l
u 5 5 � -;::/' I �
0 0 0 50 1 00 1 50 200 250 0 50 1 00 1 50 200 250
T ime (days) T ime (days) N ....... 0
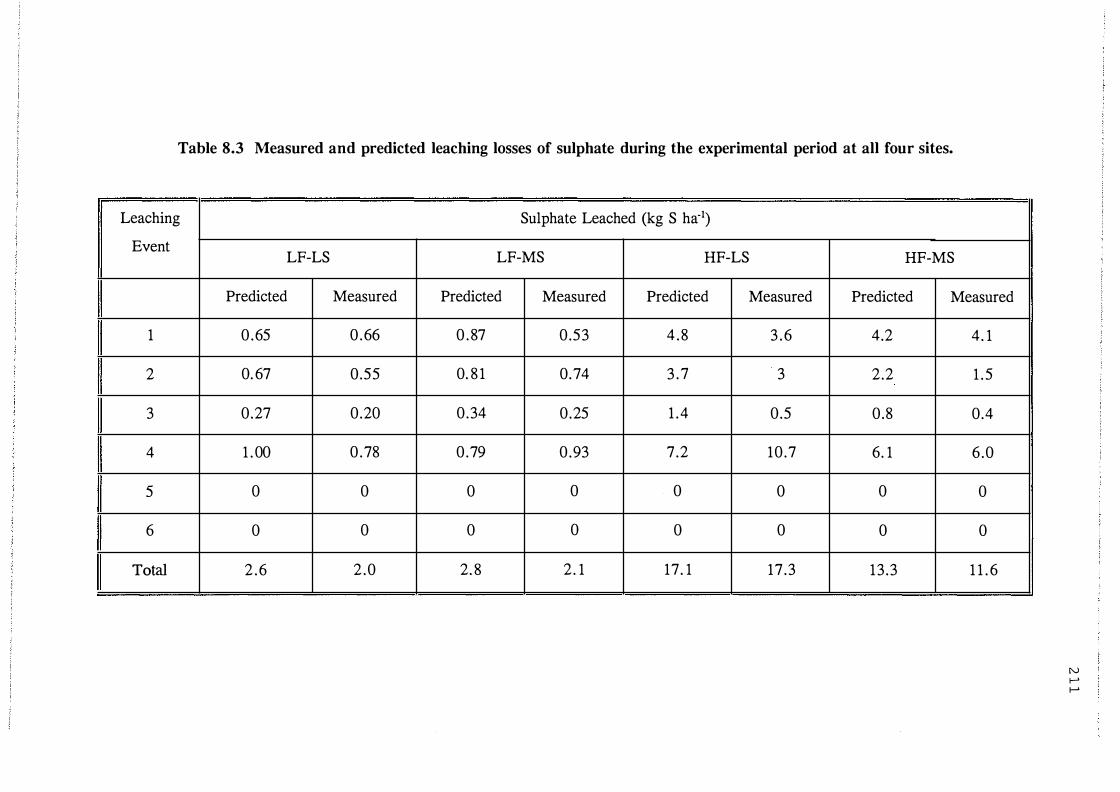
Table 8.3 Measured and predicted leaching losses of sulphate during the experimental period at all four sites.
Leaching Sulphate Leached (kg S ha-1)
Event LF-LS LF-MS HF-LS HF-MS
Predicted Measured Predicted Measured Predicted Measured Predicted Measured
1 0 .65 0 .66 0 . 87 0.53 4 . 8 3 . 6 4.2 4. 1
2 0. 67 0.55 0. 8 1 0.74 3 . 7 3 2.2 1 . 5
3 0.27 0.20 0 .34 0.25 1 .4 0.5 0.8 0.4
4 1 . 00 0 .78 0 .79 0 .93 7 .2 10 .7 6. 1 6 .0
5 0 0 0 0 0 0 0 0
6 0 0 0 0 0 0 0 0
Total 2 . 6 2 .0 2. 8 2 . 1 17 . 1 17 .3 13 .3 1 1 . 6
N I-' I-'

45 40 35
........ 0 � 30 (/) Cl
-=- 25 (]) ..... _g 20 a. ::l � 1 5 0
(/) 1 0 5
Fig . 8 . 1 1 Predicted (-- + --) and measured (- -• - -) extractable soil sulphate present in the profile (0-25cm) at
LF-LS and LF-MS sites .
LF - L S 45
40
25
20
� v
L F - MS
/
/ � / '.
/
0 �---+----r---�----r---� 1 5+---�----�---r--��--� 0 50 1 00 1 50 200 250 T ime (days)
0 50 1 00 1 50 200 250 Time (days) N
t-' N

Fig . 8 . 12 Predicted (- - + - -) and measured (--• - -) extractable soil sulphate present in the profile (0-25cm) at
HF-LS and HF-MS sites .
80 H F - L S
,-.... 60 + M 0 ..c: .......... [/) 0'
,:..,:: .._.....
� 4of\. I �- - - · ..c: a. ::::l
[/) -0
[/) 20 +
0+----+----�--�r---�--� 0 50 1 00 1 50 200 250
T ime (days)
80 HF -MS
60
40
20
0+----+----+----+----+---� 0 50 1 00 1 50 200 250
T ime (days)
N � w

214
the high fertility sites reasonably well. In the low fertility sites the model slightly
over estimated the leaching losses (Table 8.3).
The model was able to predict the amount of extractable sulphate present in the soil
for the whole profile (Fig.8. 1 1 and 8 . 12) for most of the experimental period, but it
failed to predict the amount of extractable sulphate present in the individual layers
(Appendix 8 .4).
Plant uptake, mineralization rate, leaching losses and the amounts of extractable soil
sulphate are interrelated in all layers thus incorrect estimates of a single factor in an
upper layer would leads to incorrect rates of S accumulation or depletion in the layers
below.
8.4.2 Sensitivity analysis of Kd and a values
Of the measured parameters required to run this model the Kd functions which relate
the amount of extractable sulphate S with soil solution S concentrations and a value
which measures the volume of input water that passes directly through the soil without
interacting with the native soil water for field conditions must either be assumed or
estimated from measurements made under laboratory conditions. It is useful to know
whether errors in obtaining these values cause major changes to the model outputs
such as plant uptake or leaching. Using data for the HF-LS site a simple sensitivity
analysis of the model was carried out by varying separately the value of a and the Kd functions for each soil layer by ±10%.
An increase in the value of a (by 10%) simulates a larger mobile water fraction and
thus decreased the leaching of sulphate by 15% (Fig.8. 13) . A decrease in the value of
a (by 10%) which simulates larger native soil water displacement increased the
leaching of sulphate by 15% (Fig.8. 13).
An increase in the slope (by 10%) of the function of each layer (Kd function) which
simulates greater adsorption of sulphate decreased sulphate leaching by 5%, while a

Fig.8 . 1 3 Effect of changing the value of et (by 10%) on the cumulative amount of sulphate leached at HF-LS site during the period from Jun. 1 989 to Oct. 1989. No leaching occurred from Oct. 1 989. to Jan. 1 990.
'U Q)
20
1 8
1 6
1 4
-5 1 2 o o Q) ..c _ , Q) (/) 1 0 ...... o Ol ..c ..:Y. 9- 8 :J Ul
6
4
2
/ /
/ ,;le
/ / / /
/ / / / /
// / / /
----� '* /
...-- ...-- / /
............. ............. - - *"'
� ...--- - -
- --
/r *" - -
/r /
b �/
....:: �
0�----�------;-----�------�------�-----r----�
0 20 40 60 80 1 00 1 20 1 40
T ime (days)
- a = 0.4
+ a = 0.2
-* a = 0.3
N t-' Ul

Fig.8 . 1 4 Effect of changing the values of Kd (by 10%) for each soil layer on the cumulative amount of sulphate leached at HF-LS site during the period from Jun. 1 989 to Oct. 1 989. No leaching occurred from Oct. 1 989 to Jan.
1 99 1 .
1 8
1 6
1 4
-g 1 2 .s:: () g _g 1 0 _ , Q) Vl
..... 0 Cl 8 .s:: � a. ::I (/) 6
4
2
/ / ?
/ / /
/
/ ,. "'
/ ,. "'
//,. "' /
,.-/ / *
/
� ,.-*" / � � .... --
,.-� .... ....
£- ,.- .... .... ....
.... ....
.... ....
/,. *'" / /. / �
/ � .J /9 �
Kd for top, midd le and bottom layers
- Kd = 0.98, 1 .28, 1 .56
+ Kd = 0.80, 1 .03, 1 .26
.., Kd = 0.89, 1 . 1 5, 1 .40
o�-----+------+-----�------4-----��----�----� 0 20 40 60 80
Time (days) 1 00 1 20 1 40
N t-' 0'1

Fig.8 . 1 5 Effect of changing the value of d. (by 1 0%) on the cumulative amount of sulphur removed by pasture at HFLS s ite during the period from Jun. 1 989 to Jan. 1 990.
25
20
Q.) � 1 5 .8 o o..c :l '-._ \.... (/) :l _c (Jl �� 1 0
(/)
5
;k
/ /)/ /
/ / / /;/
v / / �
. // r 'l '//
/'� r �
0�--------�------�---------+---------+--------� 0 50 1 00 1 50 200 250
T ime (days)
- a = 0.4
+ a = 0.2
"* a = 0.3
N 1-' -..J

Fig.8. 1 6 Effect of changing the value of Kd (by 10%) on the cumulative amount of S removed by pasture at the HF-LF site during the period from Jun. 1 989 to Jan. 1 990.
30
25
20 Q) .::1! 0 ..... a a...c ::J .......... '- (/) 1 5 ::J _e O'\ a..::t: ::J
(/) 1 0
5
Kd for top. midd le and bottom layers
- Kd = 0.98. 1 .28. 1 .56
+ Kd = 0.80. 1 .03, 1 .26
--�t Kd = 0.89. 1 . 1 5. 1 .40
0�--------�------�---------+--------�--------�
0 50 1 00 1 50 200 250 T ime (days)
N ...... CP

219
decrease in the values of the slope of the function (Kd) which simulates less adsorption
of sulphate increases the leaching of sulphate by 9% (Fig.8 . 14) .
Changing either � or a values by 10%, only had a small effect on the amount of S
removed by pasture (Fig.8. 15 & Fig.8. 16). This suggests that pasture uptake of S is
less sensitive to changes in Kd and a values than the amounts of S leached. The
greater effect of � change on leaching rather than plant uptake occurs because most
of the leached sulphate originated from the 15-25 soil layer where the slope of the �
function was much steeper than the slope of the Kd function for the soil layer 0-7 5mm
from which 65% of the plant uptake occurs. Compared with the changes in Kd changes
in a value had a much greater effect on leaching, indicating that if leaching of S is
to be modelled an accurate measure of the fraction of input water that moves through
the soil layer interacting little with the native soil water should be developed.
In general the model has given very good predictions of all outputs but users of the
model should be aware of limitations that may show up when used on other sites or
for extended periods of time.
1 . The major limitation is that the current form of the model requires measured
mineralization rates. Future work on the isotopic dilution data from this thesis may
resolve this. Also in the model it was assumed that the mineralization and
immobilization rates are constant throughout each growth period. In practice this may
not occur for the whole period, because mineralization and immobilization rates
depends upon soil temperature, moisture and the sulphate concentration in the soil
solution as explained in Chapter 2.
2. In the model it was assumed that at a given AEt value the amount of S removed by
pasture was linearly related to the sulphate concentration in the soil solution (equations
8. 1 6 and 8 . 17). In practice it is not true because plant growth may be limited by the
availability of other nutrients particularly nitrogen. Evidence provided in Chapter 5
indicates that these hill country pastures are nitrogen limited. In particular the ratio
of N/S mineralized from soil organic matter at the low fertility farmlet was low

220
(average of 10.0 kg N ha-1 and 7.7 kg S ha-1 for first 35 days) compared to the high
fertility farmlet (an average of 25 kg N ha-1 mineralized while 6.6 kg S ha-1 was
immobilized for fust 35 days). This indicated that N was limiting plant growth and
S uptake in LF farmlet. This however does not appear to have affected the prediction
of plant S uptake at these sites, but such mechanisms may be one of the reasons for
the slight overprediction of plant S uptake on the LF-LS and LF-MS sites (Fig.8.9)
during winter (fust 96 days).
3. If ground cover of the pasture was sparse this would also affect the amount of
sulphate uptake by plant During winter, particularly in low fertility areas the rate of
pasture growth may be low. With low ground cover � will not be completely
derived from the pasture and soil will also contribute to the Et. The model assumes
that all Et is derived from the pasture. The effect of a proportion of Et coming from
the soil would be to decrease plant S uptake and increase the concentration of
extractable S in the top 75mm of the soil. In this case plant uptake would be
overpredicted and the amounts of extractable soil S underpredicted.
4. The fraction of the input water (a.) that passes directly through the larger pores
(mobile phase) without interacting with the native soil water may also change under
field conditions. However, this concept is an over simplification. In the model it was
assumed only two phases may exist in a layer namely macropores (rapidly mobile
water) and micropores (immobile). In practice a range of pore sizes exists giving a
continuous spectrum of soil water from rapidly mobile to completely immobile. If the
input water which enters the soil matrix does not mix or displace all the micropore
water then this would lead to overprediction of S leaching. This would be corrected
by increasing the value of a., but a more sophitiscated drainage model may be more
appropriate.
5. In the model it was assumed that re-equilibrium between the less mobile and mobile
phases established immediately after leaching. The time taken for this equilibration
depends upon the diffusion coefficient of the sulphate ion in the soil, the diffusion
path length and the soil sulphate buffer power (Barber, 1984). Assuming that the
221
diffusion coefficient of sulphate is approximately 10-7 mm2 s·1 in soil water
and there is no concentration gradient between the mobile and less mobile phases the
distance moved (self diffusion) by sulphate ion in one day is given by (2Dt)112, where
D is the diffusion coefficient (rn.ni s·1) and t is time (days), which is equal to 0. 13mm
day·1 • However a concentration gradient between mobile and less mobile phases will
exist after drainage. For example the amount of S in soil solution in the top 75 mm
of the soil were calculated to be 3.0 and 8.0 kg S ha-1 for low and high fertility
farmlets respectively. After drainage the concentration gradient between mobile and
immobile phases in the HF farmlet would be greater than the concentration gradient
of LF farmlet. This indicates that the time taken for re-equilibrium to establish in the
low fertility farmlet would be approximately three times greater than that for the high
fertility farmlet. The model may be improved by accounting for slower equilibration
time for lower sulphate concentrations in the soil solution. This may be necessary to
explain S leaching behaviour in different textured soils.
8.5 CONCLUSION
The ratio of the specific activities of the plant S and leached S from the lysimeters
which were fertilized with 35S labelled superphosphate indicated that the specific
acticity of the pool of sulphate-S taken up by pasture plants was slightly, but
consistently lower than that of the pool of sulphate-S lost by leaching. The
explanation for this is that initial leaching of fertilizer 35S to depths where root activity
and sulphate pool turn over rate are lower leading to less 35S uptake and a slower
decline in the specific activity of the sulphate pool at depths which remains
susceptible to leaching during subsequent leaching events. There are also spatial
differences between the soil zones exploited by roots and those zones from where
major drainage flow passes in the soil.
Therefore in attempting to model of sulphate movement in soils, root distribution and
the differences in the movement of water the larger soil pores and the interaction with
less mobile water in the smaller pores should be considered. It is the water in the
larger soil pores which may be displaced and move downwards while water in the
smaller soil pores is likely to supply plants with water.

222
A mechanistic computer simulation model, in which daily evapotranspiration, drainage
in conjunction with soil solution sulphate concentration, which was predicted from
knowing the soil sulphate retention characteristics, predicted reasonably well the plant
uptake and leaching losses of S from four field sites, differing in their soil fertility
status.
The simple sensitivity analysis of the model showed that it is important to accurately
measure the value of a, the fraction of the input water that moves through the larger
pores interacting little with native soil water. A 1 0% change in this parameter resulted
in a 15% change in the amount of S leached.
Some suggestions have been made for making the model portable to other field sites.
In particular it is important that the mineralization rates of soil organic matter and its
spatial and temporal variation in the soils are known. Further research is required
before the short term fluctuations in net S mineralization rates can be accurately
modelled.
In general the model was able to predict S uptake and losses by leaching well at the
Ballantrae farmlets. It should be possible to complete the modelling of the full S cycle
in these farmlets by adding to this model the above ground nutrient transfer model for
S developed by Saggar et al. ( 1990a). The rates of return of plant litter and animal
excreta and their rates of decomposition may help predict S mineralization rates in the
top soil.

223
CHAPTER-9
SUMMARY
9.1 REVIEW OF LITERATURE
A review of literature (Chapter-2) revealed that in legume based grazed pastures
quantitative information on the possible sources of leached sulphate is scarce, in
particular the effect of previous fertilizer history on the rate of mineralization of S and
its losses by leaching and plant uptake is lacking. Further, quantitative relationships
between the mineralization of S and N in grazed pasture were poorly understood both
in New Zealand and overseas. In hill country pastures the effect of land slope on the
camping behaviour of the grazing animals and subsequently this influence on the rate
of mineralization of both S and N and their losses by leaching and plant uptake was
also poorly understood.
This study was conducted with the general objectives of identifying and quantifying
the main origins of leached sulphate in grazed hill country pastures. As part of the
study a preliminary laboratory study investigated the potential of hill country pasture
soils to mineralize organic S and N. This was followed by a series of field studies in
hill country. These included a study to measure the net mineralization of organic S
and N and their relative contribution to S leaching losses and pasture S uptake. The
fate of fertilizer and dung and urine S in grazed pastures and the effect of these inputs
on the mineralization of soil organic S and N and its contribution to pasture uptake
and losses by leaching were also studied. Finally a simple computer simulation model
was constructed to predict the fate of S in grazed hill country pastures.
9.2 LABORATORY MINERALIZATION STUDIES
In the preliminary laboratory study (Chapter-3), in which both open and closed
incubation systems were used to measure the net mineralization of S , N and C, greater
amounts of S and N were net mineralized in the open system. In contrast more C was
mineralized and released as C02 in the closed system, suggesting that microbial

224
activity is greater in the closed system than in the open system and the S and N
mineralized were reimmobilized into organic S and N in the closed system. The
closed system is not suitable for measuring accumulated net mineralization of nutrients
other than carbon.
In the open incubation system, the amount of S and N mineralized were greater in
soils taken from sites that had received high amounts of single superphosphate (SSP)
in the past than in soils taken from sites that had received small amounts of SSP in
the previous years. This indicated that the accumulation of soil organic matter by
regular application of SSP to legume based pastures increased the mineralization of
both S and N. In addition soils collected from low slope (0-12°) sites, where a greater
proportion of animal excreta is returned, mineralized more S and N than soils taken
from medium slope (12-25°) sites. In contrast the amount of C mineralized and
respired was greater in soils taken from medium slope sites than in soils taken from
low slope sites. The greater amounts of excreta returned to low slope sites decreased
the C to N and C to S ratios and thus per unit of C02 respired more N and S were
mineralized, but in medium slope sites due to the small amount of excreta returned
the C to N and C to S ratios were greater than the low slope sites and less N and S
were mineralized per unit of C02 respired. The ratio of N to S mineralized was
narrower than the N to S ratio of the bulk soil suggesting that relative to N more S
is available in the soil solution and susceptible to leaching, while N is conserved in
the soil. From this preliminary laboratory study it became clear that the
mineralization of S from soil organic matter could be an important source of leached
sulphate.
9.3 DEVELOPMENT OF A TECHNIQUE TO
MEASURE MINERALIZATION RATES IN FIELD
SOILS
Cylindrical, mini-lysimeters with ion exchange resin traps for collecting solutes from
drainage water were developed to measure the net mineralization of S and N in hill
country pastures. Pasture uptake of S and N, leaching losses of S and N and the
changes in mineral S and N pools in the soil at the same site were measured

225
simultaneously and used to calculate mineralization rates. An evaluation of the
lysimeter in the laboratory (Chapter-4) showed that the resin trap was capable of
removing all the sulphate from drainage water at several different flow rates. The
main advantage of the lysimeters over the conventional methods of measuring the
leaching losses of anions and cations in .the field is that regular drainage collection
was not necessary. By introducing mixtures of both anion and cation exchange resins
in the trap in the lysimeter, it was possible to monitor the amounts of anions and
cations in field drainage over long periods of time before it was necessary to change
the resin mixture.
9.4 MEASURING MINERALIZATION RATES IN
FIELD SOILS
In a preliminary field study (Chapter-5) using the lysimeters developed in Chapter-4,
the net mineralization of S and N was measured at four sites from June 1989 to
January 1990 by simultaneously measuring the leaching losses of S and N, the pasture
uptake of S and N and the extractable sulphate and mineral N pools in the soil. In
addition the leaching losses of cations such as Ca, Mg, K, Fe and Al were also
measured (Chapter-5). While, approximately 10 times more N than S was mineralized
from soil organic matter, removed by pasture and recycled back to soil through animal
excreta, sulphate was the dominant anion found in the drainage water. Approximately
ten times more sulphate (2. 1 and 15.2 kg S ha-1 for low and high fertility farmlets,
respectively) than mineral nitrogen (0.25 and 1 .3 kg N ha-1 for low and high fertility
farmlets) was lost by leaching. Previous fertilizer history had a marked effect on the
leaching losses of sulphate with seven times more S lost in the high fertility farmlet
which received 375 kg SSP ha-1 y-1 with a stocking rate of 16 SU ha-1 than the low
fertility farmlet which received 125 kg SSP ha-1 y- 1 with a stocking rate of 10 SU
ha-1• While a three fold increase in fertilizer application doubled pasture production
the associated losses of S by leaching increased approximately seven fold.
The lack of any change in sulphate level below the 15cm soil depth during the active
growth period suggests that any sulphate that moved below the 15cm soil depth could
be considered to be effectively lost from the system. The amounts of S and N net

226
mineralized were greater in soils from the high fertility farmlet (27 .5 and 25 1 kg S
and N ha-1) than in the soils from low fertility farmlet (12 and 1 19 kg S and N ha-1),
which leads to greater leaching losses of S from the high fertility farmlet than from
the low fertility farmlet. This suggests that when the mineralization rate was greater
a greater proportion of the mineralized S was lost by leaching while at lower
mineralization rate a greater proportion of the mineralized S was removed by pasture.
Associated with the losses by leaching of S04 = and N03- were losses of cations . Of
the basic cations, Ca was the dominant cation found in the drainage water followed
by Mg and K. Despite the fact that the amount of K cycled in the soil-plant-animal
system was greater than amounts of both Ca and Mg, less K was lost by leaching.
This suggests that in sheep grazed pastures the K returned in excreta is mainly
exchanged with soil Ca and Mg and enhances the leaching losses of both Ca and Mg.
The amounts of Ca, Mg and K lost by leaching from the high fertility sites (9.5, 1 .6
and 3.4 kg of Ca, Mg and K ha-1) was greater than those lost from low fertility sites
(4.8, 0.6 and 1.0 kg of Ca, Mg and K ha-1) . The higher stocking rates at the high
fertility sites resulted in greater amounts of excretal return to these sites. This
increased the mineralization of S and N which increased the leaching losses of S and
N causing the greater losses of basic cations by leaching from these high fertility sites.
The summed amounts of anion charge lost by leaching could not be balanced with the
summed amounts of cation charge lost by leaching. This was partly because some of
the main anions such as er, HC03- and oH- and cations such as Na+ and H+ could not
be measured from the resin eluate. The oxidation states of Fe and Al species
appearing in the leachate was also unknown. In general as the amount of anions lost
by leaching increased the associated losses of cations also increased.

9.5 THE FATE O F F R E S H L Y APPLIED
SUPERPHOSPHATE SULPHUR
227
In a second series of field studies, 35S labelled SSP was applied to lysimeters
(Chapter-6) to study the fate of freshly applied fertilizer S and the effect of freshly
applied fertilizer on the mineralization of S and N from the soil organic matter.
For a 9 month period from Jan. to Oct. 1990 about 19% and 26% of the fertilizer S
was recovered by pasture and lost by leaching at the low and high fertility farmlets,
respectively. Of this 61% was taken up by pasture at the low fertility farmlet, while
at high fertility farmlet only 24% was taken up by pasture. The remaining S (39% at
low fertility farmlet and 76% at high fertility farmlet) were lost by leaching at both
farmlets. The amounts of S removed by pasture and lost by leaching clearly showed
that pasture at low fertility farmlet removed a greater percentage of the fertilizer S
than the pasture at high fertility farmlet. At both the low and high fertility farmlets
S derived from the mineralization of soil organic matter contributed more to pasture
S uptake and losses by leaching than the fertilizer S. The study further showed that
the amounts of both S and N mineralized ( 40 and 204 kg S and N ha·1 at the high
fertility farmlet and 22 and 125 kg S and N ha·1 at the low fertility farmlet) were
strongly influenced by the current fertilizer application, the rate of application and the
past fertilizer history . In particular, the amount of N mineralized and removed by
pasture was strongly influenced by current fertilizer application and the rate of
application (375 and 125 kg SSP ha·1 for high and low fertility farmlet). The total
losses of S by leaching observed in the study were approximately 48% to 78% of the
annual fertilizer application.
9.6 THE FATE AND INFLUENCE OF DUNG AND
URINE
In order to quantify the effect of excreta on the pasture uptake and losses by leaching
of S and N, a field experiment was conducted by applying sheep dung and urine to
the lysimeters (Chapter-7).

228
Application of both dung and urine boosted pasture production and increased the
uptake of both S and N. Even though large amounts of K were returned in excreta
(376 kg K ha-1 in dung and 146 kg K ha-1 in urine) along with S and N, the amount
of K removed by pasture was not increased by the application of dung and urine. The
percent of excretal S , N and K (either dung or urine) that was taken up by pasture was
very small, suggesting that nutrients returned in excreta are, initially at least, an input
of nutrient into the soil organic S and N or mineral K pool in the soil and not directly
available for pasture uptake. The amounts of S, N and K lost by leaching were not
increased by the application of either dung or urine suggesting that in sheep grazed
pastures leaching losses of nutrients directly from excreta patches were far less
important than the subsequent losses that can occur once it has been incorporated into
soil organic matter and then remineralized. Further investigations under different
climatic conditions are necessary before the general applicability of these observations
can be confirmed. During periods of low temperatures, slow pasture growth and high
rainfall more S , N and K may be leached from urine spots.
9.7 MODELLING THE FATE OF SULPHUR IN
GRAZED PASTURES
A preliminary computer simulation model describing the mineralization of soil organic
S, pasture uptake and losses by leaching in grazed pasture was developed using the
35S specific activity, and the soil sulphate data generated in Chapters 5 and 6.
The ratio of the specific activities of the plant S and leached S from the lysimeters
fertilized with 355 SSP indicated that the pool of sulphate-S that was taken up by the
pasture plants was slightly but consistently lower than the pool of sulphate-S that was
lost by leaching. The explanation for this is that there are spatial differences between
the soil zones exploited by roots and those zones from where major drainage flow
passes in the soil. Therefore in computer simulations of sulphate movement in soils
root distribution and the differences in the movement of water between mobile water
in the larger soil pores and less mobile water in the smaller pores should be
considered. It is the water in the larger soil pores which may be displaced and move

229
downwards while water in the smaller soil micropores is likely to supply plants with
water and nutrients. The study further showed that in modelling sulphate leaching it
is important to measure accurately the fraction of input water that moves through the
larger soil pores interacting little with native soil water.
The preliminary model gave reasonable predictions of the changes in soil sulphate
concentrations in the soil upto a depth of 25cm, pasture uptake of S and losses of S
leaching at four pasture sites varying in their fertilizer history. Further refinement of
the model is necessary before it can provide the basis for predicting fertilizer S
requirements for hill country pastures.
9.10 APPLICATION OF CONCLUSIONS TO FUTURE
RESEARCH
By developing a new drainage lysimeter technique and field studies using the
technique have shown conclusively that the mineralization of soil organic S was the
main origin of the leached sulphate in grazed hill country pastures even though direct
leaching of fertilizer S also occurred. The low N availability in the soil was a major
factor limiting S uptake by plants and the formation of organic S in these pastures.
When the N status of the soil was increased greater uptake of N by pasture occurred,
which leads to a greater S uptake and reduced the leaching losses. Increasing the N
status of the soil increased the plant production and therefore fixed more carbon which
increased the immobilization of sulphur.
Manipulating the N supply by applying small amounts of N with fertilizer S may offer
one option for making better use of not only applied S but S made available to the
plant by the mineralization of soil organic matter. Alternatively, S fertilizers should
be applied during the periods when carbon fixation rates are high. Less than 30% of
the loss was directly from the applied superphosphate, this portion has the potential
to be reduced by the use of elemental S based fertilizers or decreasing the S :P ratio
in fertilizers. Further research is required to investigate the effect of N availability on
the leaching losses of S by investigating the use of fertilizers containing not only S
and P in different forms but also N, at different N:S:P ratios.

REFERENCES
Aylmore,L.A.G. and Karim,M. 1968. Leaching of fertilizer ions in soil
columns. Transactions 9th International Congress of Soil Science,
1 : 143-155.
230
A vrahanui,M. and Golding,R.M. 1968. The oxidation of sulphide ion at very low
concentrations in aqueous solutions. J. Chem. Soc. 647-651 .
Baii,P.R., Luscombe,P.C. and Grant,D.A. 1982. Nitrogen in hill country. In.
Nitrogen fertilizers in New Zealand Agriculture.(Ed.) P.B.Lynch. P133-147.
Baii,P.R., Keeny,D.R., Theobald,P.W. and Nes,P. 1979. Nitrogen balances in urine
affected areas of New Zealand pasture. Agron. J. 7 1 :309-314.
Barber,S.A. 1984. Soil Nutrient Bio Availability. A Mechanistic Approach.
A Wiley Interscience Publication.
Barker,DJ., Zhang,D.M. and Mackay,A.D. 1988. Root distribution in a low
fertility hill country sward by sheep. N. Z. J. Expt. Agri. Res. 16:73-76.
Barley,K.P. 1964. Earthworms and the decay of plant litter and dung-A review. Proc.
Aust. Soc. Animal. Production. 5 :236-240.
Barrow,NJ. 1960. Stimulated decomposition of soil organic matter during the
decomposition of added organic materials. Aust. J. Agri. Res. 1 1 :960-969.
Barrow,NJ. 1961a. Studies on mineralization of sulphur from soil organic matter.
Aust. J. Agri. Res. 12:306-319.
Barrow,NJ. 1961b. Mineralization of nitrogen and sulphur from sheep faeces. Aust.
J. Agri. Res. 12:644-650.
Barrow,NJ. 1966. The residual value of the phosphorus and sulphur
components of superphosphate on some Western Australian soils. Aust.
J. Expt. Agri. Animal. Husb. 6:9-16.
Barrow,NJ. 1967a. Studies on extraction and availability to plants of adsorbed plus
soluble sulphate. Soil Sci. 104:242-252.
Barrow,NJ. 1967b. Studies on the adsorption of sulphate by soils. Soil Sci.
104:342-349.
Barrow,NJ. 1967c. Some aspects of the effect of grazing on the nutrition of pastures.
J. Aust. Inst. Agri. Sci. 33:254-262.
231
Barrow,NJ. 1969. The accumulation of soil organic matter under pasture and its
effect on soil properties. Aust J. Expt Agri. Anim. Husb. 9:437-444.
Barrow,NJ. and Lambourne,LJ. 1962. Partition of excreted nitrogen, sulphur and
phosphorus between the faeces and urine of sheepfed pasture. Aust. J. Agri.
Res. 13:461-471 .
Bettany,J.R., Janzen,H.H. and Stewart,J.W.B. 1982. Sulphur cycling in soils.
p767-785. In. A.More (Ed.) Sulphur-82. British Sulphur Corporation,
London.
Bettany,J.R., Stewart,J.W.B. and Halstead,E.H. 1973. Sulphur fractions and
carbon, nitrogen and sulphur relationships in grassland, forest and associated
transitional soils. Soil Sci. Soc. Am. Proc. 37:915-918.
Bettany,J.R., Stewart,J.W.B. and Halstead,E.H. 1974. Assesment of available soil
sulphur in a 35S growth chamber experiment. Can. J. Soil Sci. 54:309-3 1 5.
Bettany,J.R., Stewart,J.B.W. and Saggar,S. 1979. The nature and forms of
sulphur in organic matter fractions of soils related along an
environmental gradient. Soil Sci. Soc. Am. J. 43:981-985.
Biederbeck,V.O. 1978. Soil organic sulphur and fertility. in. Soil organic matter.
p273-310. (Ed.) M.Schinitzer and S.U.Khan Elsevier, Amsterdam.
Blair,GJ. 1971. The sulphur cycle. J. Aust. Inst Agri. Sci. 37: 1 13- 121.
Blakemore,L.C., Collie,T.W. and Metson,AJ. 1968. Sulphur. In "Soils of
New Zealand". New Zealand Soil Bureau Bulletin. 26 (2): pp. 103-109.
Bohn,H.L., Barrow ,NJ., Rajan,S.S.S. and Parfitt,R.L. 1986. Reactions of
inorganic sulphur in soils. Sulphur in Agriculture. (Ed.) Tabatabai,M.A.
Agronomy. No.27. 233-249.
Bolan,N.S., Hedley,MJ. and White,R.E. 1991. Process of soil acidification during
nitrogen cycling with emphasis on legume based pastures. Plant and Soil.
134:53-63.
Bolan,N.S., Scotter,D.R., Syers,J.K. and Tillman,R.W. 1988. Effect of timing and
phosphate addition on sulphate leaching in soils. J. Soil Sci. 39:493-504.
Bornemissza,G.F. and Williams,C.H. 1970. An effect of dung beetle activity on
plant yield. Pedobiologia. 10:1-7.
Boswell,C.C. 1983. An assesment of phosphorus and sulphur interactions on aspects
of the sulphur cycle in pasture. Ph.D. Thesis. University of New England,
Armidale, Australia.

Bosweli,C.C. 1985. Sulphur fertilizer strategies for the post superphosphate
era Proceedings of 2Qlh Technical Conference of New Zealand Ferilizer
Manufucturers Research Association. 584-603.
232
Bosweli,C.C. 1987. Elemental sulphur fertilizers for pastures in New Zealand.
Procedings of International Symposium on elemental sulphur in agriculture.
Volume 2. 493-507. Syndicate Francis du Soufre, Marseille.
Bristow ,A. W. and Garwood,E.A. 1984. Deposition of sulphur from the
atmosphere and the sulphur balance in four soils under grass. J. Agri.
Sci. 103:463-468.
BroganJ.C. and Murphy,M.D. 1980. Sulphur nutrition in Ireland. Sulphur in
Agriculture. 4:2-6.
Bromfield,A.R. and Williarns,RJ.H. 1974. Sulphur supplied by dry
deposition. Rothamsted Experimental Station Report. p.87.
Bromfield,S.M and Jones,O.L. 1970. The effect of sheep on the recycling
of phosphorus in hayed off pastures. Aust. J. Agri.Res. 21 :699-7 1 1.
Buchanan,R.E. and Gibbons,N.E. 1974. Bergeys manual of determinative
bacteriology. 8th edition. Williams and Wilkins, Baltimore.
Burmester,C.H., Adarns,F. and Healand,R.C. 1981. Effects of nitrogen and sulphur
fertilizer on sulphur content of tall fescue and phalaris. Agron. J. 73:614-61 8.
Carran,R.A., Ball,P.R., Theobald,P.W. and Collins,M.E.G. 1982. Soil nitrogen
balances in urine affected areas under two moisture regimes in Southland. N.Z.
J. Expt. Agri. 10:377-381 .
Chae, Y .M. and Lowe,L.E. 1980. Distribution of lipid sulphur and total lipids in soils of British columbia. Can. J. Soil Sci. 60:633-640.
Chang,M.L. and Thomas,G.W. 1963. A suggested mechanism for sulphate
adsorption in soils. Soil Sci. Soc. Am. Proc. 27:281-283.
Chao,T.T., Harward,M.E. and Fang,S.C. 1962. Movement of 35S tagged sulphate
through soil columns. Soil Sci. Soc. Am. Proc. 26:27-32.
Chao,T.T., Harward,M.E. and Fang,S.C. 1962a. Adsorption and desorption of
sulphate ions in soil. Soil Sci. Soc. Am. Proc. 26:234-237.

233
Chao,T.T., Harward,M.E. and Fang,S.C. 1963. Cationic effects on sulphate
adsorption by soils. Soil Sci. Soc. Am. Proc. 27:35-38.
Chao,T.T., Harward,M.E. and Fang,S.C. 1965. Exchange reaction between
hydroxyl and sulphate ions in soils. Soil Sci. 99: 104-108.
Chapman,SJ. 1987. Microbial sulphur in some Scottish soils. Soil Biol. Biochem.
3:301-305.
Coop,LE. 1965. A review of the ewe equivalent system. N.Z. J Agri. Sci. 1 : 1 3- 18.
Cooper ,P J.M. 1972. Arylsulphatase activity in Northern Nigerian soils. Soil Biol.
Biochem. 4:333-337.
Cooper ,M. and Hogg,D.E. 1966. Leaching losses of sulphate from
superphosphate and gypsum applied on a soil from rhyolitic pumice.
N.Z. J. Agri. Res. 9:345-349.
Coulter ,J.D. 1973. Prediction of evapotranspiration from climatological data. Proc. Soil Plant Water Symposium Inf. Ser. No. 96, pp. 38-45.
Cowling,D.W. and Jones,L.H.P. 1970. Sulphur deficiency of red clover and rey
grass in England. Sulphur Ins. J. 6:8-13.
Cowling,D.W. and Jones,L.H.P. 1978. Sulphur and amino acid fractions in perennial
rye grass as influenced by soil and atmospheric supplies of sulphur. In.
Sulphur in forages, 15-31. An Forais Taluntais, Dublin.
Curtin,D. and Smillie,G.W. 1986. Effects of timing on soil chemical
characteristics and grass growth in laboratory and long term field
amended soils. 2. Growth of Italian Ryegrass (Lolium muUiforum) and bentgrass (Agrostis tenuis). Plant Soil. 95:23-31 .
CSIRO Division of Forest Research. Method No. PS 17.
Dabin,B. 1972. Preliminary results of a survey of the sulphur contents of soils of
trophical Africa. Int Symp. Sulphur in Agriculture. Ann. Agron. 72: 1 13-136.
Dalai,R.C., Till,A.R. and Blair,GJ. 1978. Utilization of phosphorus and
sulphur from plant materials added to soils. Aust Soc. Soil Sci. Inc.
N.S.W. branch conference, Armidale, N.S.W. pp. 54-61.
Darrah,P.R., White,R.E. and Nye,P.H. 1985. Simultaneous nitrification and
diffusion in soil. 1 . The effects of the addition of a low level of ammonium
chloride. J. Soil Sci. 36:281-292.

Davey,T.R.A. 1980. Anthropogenic sulphur balance for Australia 1976. In
"Sulphur in Australia" Eds. J.R.Freney and A.J.Nicolson. Australian
Acadamy of Science. Canberra. pp. 75-87.
David,M.B., Mitchell,MJ. and Nakas,J.P. 1982. Organic and inorganic
sulphur soil constituents of a forest soil and their relationship to
microbial activity. Soil Sci. Soc. Am. J. 46:847-852.
234
Delver,P. 1962. Properties of saline soils in Iraq. Netherland J. Agri. Sci.
10: 194-210.
Dodgen,K.S. and Rose,F.A. 1975. Sulphohydrolases. p.359-43 1. In.
D.M.Greenberg(Ed.) Metabolic pathways. Vol.7. Acadamic press, New York.
Donald,C.M. and Williams,C.H. 1954. Fertility and productivity of podzolic soil as
influenced by subterranean clover (Trifolium subterraneum L) and
superphosphate. Aus. J. Agri. Res. 5:664:687.
Downes,M.T. 1978. An improved hydrazine reduction method for the automated
determination of low nitrate levels in fresh water. Water Res. 12:673-675.
During,C. 1984. Fertilizers and soils in New Zealand farming. pp79-92.
Government printer, New Zealand.
During,C. and Cooper,M. 1974. Sulphate nutrition and movement in a soil with
sulphate sorption characteristics. N.Z. J. Expt. Agri. 2:45-5 1 .
During,C. and Martin,P J. 1968. Sulphate nutrition, movement and sorption with
special reference to a gley podzol, west coast, South Island. N .z. J. Agri. Res.
1 1 :665-676.
Ensminger ,L.E. 1954. Some factors affecting the adsorption of sulphate by
Alabama soils. Soil Sci. Soc. Am. Proc. 1 8:259-264.
Ensminger ,L.E. and Freney J.R. 1966. Diagnostic techniques for
determining sulphur deficiencies in crops and soils. Soil Sci. 101 :283-
290.
Evans,P.S. 1971. Root growth of Lolium Perenne L. 2.Effects of defoliation
and shading. N.Z. J. Agri.Res. 14:552-562.
Fenchei,T. and Blackburn,T.H. 1979. Bacteria and mineral cycling, Acadamic
press, London.
Field,T.R.O. and Baii,P.R. 1978. Tactical use of fertilizer nitrogen. Proc.
Agron. Soc. N.Z. 8:129-133.

Field,T.R.O. and Bali,P.R. 1982. Fertilizer nitrogen inputs in pastures. In Nitrogen in New Zealand Ecosystems. (Ed.) P.W. Gandar, Palmerston
North, New Zealand.
Field,T.R.O., Theobald,P.W., Bali,P.R. and Clothier,B.E. 1985. Leaching
losses of nitrate from cattle urine applied to a lysimeter. Proc. of
Agron. Soc. N.Z. 15: 1 37-141.
Fitzgerald,J.W. 1976. Sulphate ester formation and hydrolysis: a potentially
important yet often neglected aspect of sulphur cycle of aerobic soils.
Bacteriol. Rev. 40:698-721.
235
Fitzgerald,J.W. 1978. Naturally occurring organo sulphur compounds in soil. p. 391-
443. In J.O.Nriagu (Ed.) Sulphur in the environment, part 2. John Wiley &
Sons Inc., New York.
Fleming,J.F. and Alexander,C.T. 1961. Sulphur acidity in South Carolina tidal
marsh soils. Soil Sci. Soc. Am. Proc., 25:94-95.
Follet,R.H., Murphy ,L.S. and Donahue,R.L. 1981. Fertilizers and soil amendments.
Prentice-Hall. p458-506.
Fox,R.L., Atesalp,H.M., Kampbeii,D.H. and Rhoades,H.F. 1964. Factors
influencing the availability of sulphur fertilizers to alfalfa and corn.
Proc. Soil Sci. Soc. Am. 28:406-408.
Fox,R.L. and Hue,N.V. 1986. Sulphur cycling in the tropics and sulphur
requirements for agriculture. Sulphur in Agricultural soils. Proc. Intrn. Symp.
Dhaka 139- 162.
Fox,R.L. Olsen,R.A. and Rhoades,H.F. 1964a. Evaluating the sulphur status
of soils by plant and soil tests. Proc. Soil Sci. Soc. Am. 28:243-246.

236
Freney,J.R. 1961. Some observations on the nature of organic sulphur compounds
in soil. Aust. J. Agri. Res. 12:424-432.
Freney,J.R. 1967. Sulphur containing organics. In "Soil Biochemistry". Eds. A.D. McLaren and G.H. Petersen. Marcel Dekker. Inc. New York.
Ch. 10:pp 229-259.
Freney ,J.R. 1986. Forms and reactions of organic sulphur compounds in
soils. p. 207-232. In M.A.Tabatabai (Ed.) Sulphur in Agriculture,
Agronomy No.27, Madison, Wisconsin.
Freney,J.R., Barrow,NJ. and Spencer,K. 1962. A review of certain aspects of
sulphur as a soil constituent and plant nutrient Plant Soil 17:295-308.
Freney ,J.R., Melville,G.E. and Williams,C.H. 1969. Extracion, chemical nature and
properties of soil organic sulphur. J. Sci. Food Agri. 20:440-445.
Freney,J.R., Melville,G.E. and Williams,C.H. 1970. The determination of carbon
bonded sulphur in soil. Soil Science 109:3 10-3 18.
Freney,J.R., Melville,G.E. and Williams,C.H. 1971. Organic sulphur fractions
labelled by addition of 35S-sulphate to soil. Soil Biol. Biochem. 3: 133-141.
Freney,J.R., Melville,G.E. and Williams,C.H. 1975. Soil organic matter fractions
as sources of plant available sulphur. Soil Biol. Biochem. 7 :217-221.
Freney,J.R. and Spencer,K. 1960. Soil sulphate changes in the presence and
absence of growing plants. Aust. J. Agri. Res. 1 1 :339-345.
Freney,J.R., Spencer,K. and Jones,M.B. 1978. The diagnosis of sulphur deficiency
in wheat. Aust. J. Agri. Res. 29:729-738.
Freney,J.R. and Williams,C.H. 1980. Forms and amounts of sulphur in soils. In
"Sulphur in Australia". (Eds.) J.R. Freney and A.J.Nicolson. Australian
Acadamy of Science. Canberra, pp. 170-175.
Freney,J.R. and Williams,C.H. 1983. The sulphur cycle in the soils. In. The global
biogeochemical sulphur cycle. (Ed.) M. V. Ivonov and J.R.Freney. p. 129-201.
Galbally,I.E. 1980. Sulphur dioxide uptake at the earths surface. In "Sulphur in
Australia". (Eds.) J.R.Freney and A.J.Nicholson. Australian Acadamy of
Science. Canberra, p. 7 1 -74.
Gallagher,P.A. 1969. The effect of sulphur in fertilizers, rain water and soils
on crop nutrition. Sci. Proc. R. Dublin Soc. 2B. 191-204.

237
Ghani,A., M�aren,R.G. and Swift,R.F. 1988. The incorporation and
remineralization of35S in soil organic sulphur fractions. In Towards the more
efficient use of soil and fertilizer sulphur. (Eds.) R.E. White and L.D. Currie.
Massey University. New Zealand. P32-46.
Ghani,A., Hedley,M..J., Roberts,A.C.H., Mackay,A.D., Saggar,S. and
Gillingham,A.G. 1990. Use of a simplistic nutrient transfer model in
explaining the fate of added P and S in a dairy pasture. Middle East
Sulphur Symposium, Cairo, Egypt, p. 27.
Gillingham,A.G. 1978. Phosphorus cycling in grazed steep hill country. Ph.D Thesis.
Massey University, Palmerston North, New zealand.
Gilingham, A.G. 1980. Phosphorus uptake and return in a grazed steep hill
pasture. 1 . Pasture production and dung and litter accumulation. N. Z.
J. Agri. Res. 23:313-321.
Gillingham,A.G., Syers,J.K. and Gregg,P.E.H. 1980. Phosphate uptake and
return in grazed steep hill pastures. 2. Above ground components of
the phosphorus cycle. N. Z. J. Agri. Res. 23:323-330.
Gillingham,A.G. and During,C. 1973. Pasture production and transfer of fertility
within a long established hill pasture.N.Z. J. Expt. Agri. 1 :227-232.
Gilbert,M.A. and Robson,A.D. 1984. Sulphur nutrition of temperate pasture species.
Effect of nitrogen supply on the external and internal sulphur requirements of
subterranean clover and ryegress. Aust. J. Agri. Res. 35 :379-388.
Gillman,G.P. 1973. Studies on some deep sandy soils in Cape York Peninsula, North
Queensland. 3. Losses of applied phosphorus and sulphur. Aust. j. Expt. Agri.
Anim. Husb. 13:418-422.
Goh,K.M. and Gregg,P.E.H. 1982. Field studies on the fate of radioactive sulphur
fertilizer applied to pasture. Fert. Res. 3:337-35 1 .
Goh,K.M. and Nguyen,M.L. 1991. Effect of grazing animals on the plant
availability of sulphur fertilizers in grazed pastures. Proc. N.Z. Grassld. Ass.
Gob,K.M. and Tsuji,T. 1979. Changes in soil sulphur fractions during incubation
with and without added sulphur. N.Z. J. Agri. Res. 22:585-594.
Gregg,P.E.H. and Goh,K.M. 1978. Field studies with radioactive sulphur labelled
gypsum fertilizer. 1 . Soil factors affecting the movement of fertilizer sulphur.
N. Z. J. Agri. Res. 21 :593-601.

238
Gregg,P.E.H. and Goh,K.M. 1979. Field studies with radio active sulphur-labelled
gypsum fertilizer. 1 . Climatic and management factors affecting the movement
of fertilizer sulphur in soils. N.Z. J. Agri. Res. 22:421-429.
Gregg,P.E.H., Goh,K.M. and Brash,D.W. 1977. Isotopic studies on the
uptake of sulphur by pasture plants. 2. Uptake from various soil
depths at several field sites. N.Z. J. Agri. Res. 20:229-233.
Gregory,P.J. 1990. Growth and functioning of plant roots. pp. 1 13- 167. In
Russell's Soil Conditions and Plant Growth. (Ed.) Alan Wild. John
Wiley & Sons, New York.
Hamm,J.W., Bettany,J.R. and Halstead,E.H. 1973. A soil test for sulphur
and interpretive criteria for Saskatchewan. Comm. Soil Sci. Plant Anal.
Haque,I. and Walmsley,D. 1972. Incubation studies on mineralization of organic
sulphur and organic nitrogen. Plant and Soil. 37:255-264.
Harward,M.E., Chao,T.T., Fang,S.C. 1962. The sulphur status and sulphur
supplying power of Oregon soils. Agron. J. 54: 101- 106.
Harward,M.D. and Reisenauer,H.M. 1966. Reactions and movement of inorganic
soil sulphur. Soil Sci. 101 :326-335.
Hasan,S.M., Fox,R.L. and Boyd,C.C. 1970. Solubility and availability of
sorbed sulphate in Hawaiian soils. Soil Sci. Soc. Am. Proc. 34:897-901 .
Hayman,J.M and Stocker,R.V. 1982. Soil water extraction patterns under
pasture and Lucerne on two soil types in Mid Canterbury. Proc. Agron.
Soc. New Zealand. 12:61-63.
Hedley,M.J., Tillman,R.W. and Bali,P.R. 1990. Nutrient losses from New Zealand
agriculture. Proc. N.Z. Fert. Manuf. Res. Ass. pp. 62-91 .
Heng,L.K. 1991. Measurement and modelling of chloride and sulphate
leaching from a mole drained soil. Ph.D Thesis, Massey University.
Heng,L.K., White,R.E., Bolan,N.S. and Scotter,D.R. 1991. Leaching losses of
major nutrients from a mole drained soil under pasture. N.Z. J. Agri. Res.
34:325-334.
Hesse,P.R. 1957. Sulphur and nitrogen changes in forest soils of East Africa,
Plant Soil. 1 :86-96.
Hilder,E.J. 1964. The distribution of plant nutrients by sheep at pasture.
Proceedings Australian Society of Animal Production. 5:241-248.

Hilder ,EJ. 1966. Distribution of excreta by sheep at pasture. Proceedings of
the 1Q'h International Grassland Congress. Helsinki, pp.977-8 1 .
Hilder ,EJ. and Mottershead,B.E. 1963. The redistribution of plant nutrients
through free grazing sheep. Aust. J. Sci. 25:209-21 3.
Hingston,F J. 1959. The loss of applied phosphorus and sulphur from soils
under pasture in Western Australia. J. Aust. Ins. Agri. Sci. 25:209-213.
239
Hogg,D.E. 1981. A lysimeter study of nutrient losses from urine and dung
application on pastures. N. Z. J. Expt. Agri. 9:39-46.
Hogg,D.E. and Cooper,M. 1964. Laboratory studies on losses of phosphorus,
sulphur and potassium from Te Kopuru sand. N.Z. J. Agri. Res. 7:364-379.
Hogg,D.E. and Toxopeus,M.RJ. 1966. Studies on the retention of sulphur by
yellow brown pumice soils. NJ. J. Agri. Res. 9:93-97.
Houghton,C. and Rose,F.A. 1976. Liberation of sulphate from sulphate
esters by soils. Appl. Environ. Microbiol. 3 1 :969-976.
Hoque,S. Heath,S.B. and Killham,K. 1987. Evaluation of methods to assess
the adequacy of potential soil S supply to crops. Plant Soil. 101 :3-8.
Hue,N.V. and Cope Jr. J.T. 1987. Use of soil profile sulphate data for
predicting crop response to sulphur. Soil Sci. Soc. Am. J. 5 1 :658-664.
Hutchinson,K.J. 1971. Productivity and energy flow in grazing fodder
conservation systems. Herbage Abstacts. 41 : 1 -10.
Hull,C.H. and Nie,N.H. 1981. SPSS update 7-9. McGraw Hill Book Co. New York.
Jackman,R.H. 1960. Pasture and Soil improvement. N.Z. Soc. Soil Sci. Proc.
4: 13-29.
Jackson,L.E., Strauss,R.B., Firestone,M.K. and Bartolome,J.W. 1988. Plant and
soil nitrogen dynamics in California annual grassland. Plant Soil. 1 10:9-17.
Jackson,L.E., Schimei,J.P. and Firestone,M.K. 1989. Short term partitioning of
ammonium and nitrate between plants and microbes in an annual grassland.
Soil Bioi. Biochem., 21 :409-415.
Jenkinson,D.S. and Powlson,D.S. 1976. The effects of biocidal treatments
on metabolisms in soils. 1 . Fumigation with chloroform. Soil Bioi.
Biochem. 8 : 1 67- 177.
Jensen,M.E. (Ed.). 1973. 'Consumptive use of water and irrigation water
requirements.' American Society of Civil Engineers, New York.

240
Johnson,C.M. and Ulrich,A. 1959. Analytical methods for use in plant analysis.
Calf. Agri. Expt. Sta. Bull. 766.
Jones,M.B. 1975. Plant assays for the recognition of sulphur deficiency. p. 175- 1 8 1 .
In. Sulphur in Australasian Agriculture. (Ed.) K.D. McLachlan. Sydney
University Press.
Jones,M.B. 1986. Sulphur availability indexes. In. Sulphur in Agriculture. (Ed.) Tabatabai,M.A. Agronomy Monograph. Madison, Wisconsin.
Jones,L.H.P.,Cowling,D.W. and Lockyer,D.R. 1972a. Plant available and
extractable sulphur in some soils of England and Wales. Soil Sci. 1 14: 104-1 14.
Jones,M.B., Williams,W.A. and Vaughn,E.C. 1983. Soil characteristics
related to yields on trifolium subterranium grass range. J. Range
Manag. 36:444-446.
Jones,M.B. and Richards,B.N. 1977. Effect of deforestation on turnover of 15N
labelled nitrate and ammonium in relation to changes in soil microflora. Soil
Bioi. Biochem. 8:209-213.
Jones,M.B., Ruckman,J.E. and Lawler,P.W. 1972. Critical levels of sulphur in
Bur clover. Agron. J. 64:55-59.
Kamprath,EJ., Nelson,W.L. and Fitts,J.W. 1956. The effect of pH,
sulphate and phosphate concentrations on the adsorption of sulphate in
soils. Soil Sci. Soc. Am. Proc. 20:463-466.
Kennedy,P.M. 1974. The utilization and excretion of sulphur in cattle fed on
tropical forages. The sulphur Institute J. 1 1 (1 ):6- 1 1 .
Kennedy,A.P. and Tiii,A.R. 1981a. The distribution in soil and plant of 35S from
sheep excreta. Austr. J. Agri. Res. 32:339-35 1 .
Kennedy ,A.P. and Till,A.R. 1981b. Effect of rate of application of gypsum and
rainfall on the movement of 35S04 in soil and plant. J. Austr. Inst. Agri. Res.
47: 1 10- 1 1 3.
King,K.L. and Hutchinson,K.J. 1976. The effects of sheep stocking intensity
on the abundance and distribution of mesofauna in pastures. J. Appl.
Ecol. 1 3:41-55.
Kowalenko,C.G. and Lowe,L.E. 1975. Mineralization of sulphur from four soils and
its relationship to soil carbon, nitrogen and phosphorus. Can. J. Soil Sci.
55:9- 14.
241
Kowalenko,C.G. and Lowe,L.E. 1978. Effect of added nitrogen on the net
mineralization of soil sulphur from two soils during incubation. Can. J. Soil
Sci. 45:297:309.
KorkmanJ. 1973. Sulphur status of Finnish cultivated soils. Maatalousteit Aikak.,
45: 121-215.
Lambert,M.G., Clark,D.A., Costaii,D.A. and Budding,P ..J. 1988. Phosphorus and
sulphur accumulation after long term superphosphate application to grazed hill
country. In Towards the more efficient use of soil and fertilizer sulphur. (Eds.
R.E.White and L.D.Currie.) Massey University. New Zealand. P95-100.
Lambert,M.G., Clark,D.A., Grant,D.A., Costaii,D.A. and Fletcher,R..H. 1983.
Influence of fertilizer and grazing management on North Island moist hill
country. 1 . Herbage accumulation. N. Z. J. Agri. Res. 26:95- 108
Lambert,M.G., Clark,D.A., Grant,D.A., Costaii,D.A. and Fletcher,R.H. 1 985a.
Influence of fertilizer and grazing management on North Island moist hill
country. 1 . Pasture botanical composition. N. Z. J. Agri. Res. 29: 1-10
Lambert,M.G., Clark,D.A. and Mackay,A.D. 1990. Long term effects of
with holding phosphate application to North Island hill country;
Ballantrae. Proc. N.Z. Grasld. Assoc. 5 1-25-28.
Lambert,M.G., Devantier,B.P., Nes,P. and Penny,P.E. 1985b. Losses of
nitrogen, phosphorus and sediments in runoff from hill country under
illm'MBB18rtilizer and grazing regimes. N.Z J. Agri. Res.
Lambert,M.G., Renton,S.N. and Grant,D.A. 1982. Nitrogen balance studies
in North Island hill pastures. p. 35-39. In Nitrogen in New Zealand
Ecosystems. (Ed.). P.W.Gandar, Palmerston North, New Zealand.
Landers,D.H., David,M.B. and Mitcheii,M..J. 1983. Analysis of organic and
inorganic sulphur constituents in sediments, soils and water. International J.
Envi. Anal. Chem. 14:245:265
Ledgard,S.F. and Upsdeii,M.P. 1991. Sulphur inputs from rainfall
throughout New Zealand. N.Z. J. Agri. Res. 34: 105- 1 1 1 .

Ledgard,S.F., Sprosen,M.S. and Saunders, W.M.IL 1991. Temporal changes
in various soil and plant sulphur analysis in relation to the development
of pasture to sulphur fertilizer. In. proceedings. Soil and Plant Testing
for Nutrient Deficiencies and Toxicities. (Eds) R.E.White and
L.D.Currie. Massey University, Palmerston North, New Zealand.
pp, l 15-121.
Lewis,D.C. and Clark,A.L. 1975. Superphosphate for acid South East sands.
J. Agri. South Australia. 78(3) 74-77.
242
Lipsett,J. and Williams,C.H. 1971. The sulphur status of wheat in red brown earth
in Southern New South Wales. Austr. J. Expt Agri. Anim. Husb. 1 1 :59-63.
Lowe,L.E. 1965. Sulphur fractions of selected Alberta soil profiles of the
Chemozemic and Podzolic orders. Can. J. Soil Sci. 45:297-303.
Lowe,L.E. and Delong,W.A. 1963. Carbon bonded sulphur in selected Quebec soils.
Can. J. Soil Res. 43: 151- 155.
MacDiarmid,B.N. and Watkins,B.R. 1971. The cattle dung patch. 1. Effect of dung
patches on yield and botanical composition of surrounding and underlying
pastures. J. Brit Grassld Soc. 26:238-245.
Macfadyen,A. 1978. The role of the fauna in decomposition processes in grasslands.
In. Proceedings of the symposium of grassland fauna. Scientific proceedings
of the Royal Dublin Society Series A. Vol-6. No. 1 1. pp. 197-206.
Mackay,A.D., Lambert,M.G., Clark,D.A., Saggar,S.K. and Hedley,MJ. 1988.
Pasture response to sulphur and phosphorus application in Southern North
Island Hill country. In Towards the More Efficient Use of Fertilizer and Soil
Sulphur. (Eds.) R.E.White and L.D.Currie, Massey University, Palmerston
North, New Zealand.
Marsh,K.B., SyersJ.K. and Tillman,R.W. 1983. Retention and leaching of
sulphur in soils. In. Proceedings of the Technical workshop on Sulphur
in New Zealand Agriculture. 9- 17. J.K.Syers and P.E.H.Gregg (Eds.) Massey University, Palmerston North, New Zealand.
Martin,R.J. 1990. Measurement of water use and pasture growth on
Templeton silt loam. N.Z. J. Agri. Res. 33:343-349.

Mathew,C., XiaJ.X., HodgenJ., Chu,A.C.P. 1989. Effect of late spring
grazing management on litter dynamics and autumn pasture growth
rates in a perennial ryegrass (Lolium perenne L.) sward. Proceedings
XVI International Grassland Congress, Nice, France, 521-522.
243
Maynard,D.G., Stewart,J.W.B. and Bettany,J.R. 1983. Sulphur and nitrogen
mineralization in soils compared using two incubation techniques. Soil Biol.
Biochem. 15:25 1-256.
Maynard,D.G., Stewart,J.W.B. and BettanyJ.R. 1985. The effect of plants on soil
sulphur transformation. Soil Biol. Biochem. 17: 127-134.
McAneney,K.J., Judd,M.J. 1983. Pasture production and water use
measurements in the Waikato. N.Z. J. Agri. Res. 26:7-13.
McCaskill, M.R. and Blair,G.J. 1988. Development of a simulation model
of sulphur cycling in grazed pastures. Biogeochemistry 5 : 165-181 .
McCaskill, M.R. and Blair,G.J. 1990. A model of S, P and N uptake by a
perennial pasture. Calibration and predictions. Fert. Res. 22:173-179.
McGili,W.B and Cole,C.V. 1981. Comparative aspects of cycling of organic C,N,S
and P through soil organic matter. Geoderma 26:267-286
M�aren,R.G., Keer J.I. and Swift,R.S. 1985. Sulphur transformation in soils using
sulphur-35 labelling. Soil Biol. Biochem. 17:73-
M�aren,R.G. and Swift,R.S. 1977. Changes in soil organic sulphur fractions due
to long term cultivation of soils. J. Soil Sci. 28:445-453.
McNaught, K.J. 1970. Diagnosis of mineral deficiencies in grass legume pastures
by plant analysis. Proc. Inter. Grassld. Cong. 1 1:334-338.
McNaughton,K.J., Clothier ,B.E. and Kerr J.P. 1979. 'Evaporation from
land surfaces. In Physical Hydrology- A New Zealand
Experience. '(Eds. D.L.Murray and Ackroyd), pp. 97-1 19. (New
Zealand Hydrological Society: Wellington.
Metson,A.J. 1969. Sulphur status of New Zealand soils. p73-84. Proc. 1 2th Ann. Conf. N .Z. Fert. Manf. Res. Ass.
Metson,A.J. 1973. Sulphur in forage legumes. Plant analysis as a guide to the
sulphur status of the forage grasses and legumes. Sul. Inst. Tech. Bull.
NO. 20.
Metson,A..J. 1979. Sulphur in New Zealand soils. 1. A review of sulphur in
soils with particular reference to adsorbed sulphate-sulphur. N.Z J.
Agri. Res. 22:95- 1 14.
244
Metson,A..J. and Blakemore,L.C. 1978. Sulphate retention by New Zealand soils in
relation to the competitive effect of phosphate. N.Z J. Agri. Res. 21 :243-253.
Metson,A..J. and Saunders, W.M.H. 1978. Seasonal variations in chemical
composition of pasture. 2. Nitrogen , sulphur and soluble carbohydrate. N.Z.
J. Agri.Res. 21 :355-364.
Mukhopadhyay,P. and Mukhopadhyay,A.K. 1979. Rethinking of the similarity in
N:S and C:N:S ratios of soils. J. Indian Soc. Soil Sci. 27: 1 89-190.
Muller,F.B. and McSweeny.G. 1977. Movement of plant nutrients through
Tokomaru silt loam. p.87-97. In Proc. Tech. Conf. N.Z. Fert. Manu.
Res. Asso.
Murphy,M.D. 1980. Essential micronutrients. 3. Sulphur. In: Applied soil trace
elements. 235-258. Davis,B.E.(Ed.}, John Wiley, Chichester.
Neal,J.L. and Herbein,1983. Abiotic enzymes in Arctic soils. Changes in
sulphatase activity following vehicle disturbance. Plant Soil. 70:423-
427.
Nelson,L.E. 1964. Status and transformation of sulphur in Mississippi soils.
Soil Sci. 97:300-306.
Neptune,A.M.L., Tabatabai,M.A. and HanwayJ..J. 1975. Sulphur fractions
and carbon-nitrogen-phosphorus-sulphur relationships in some Brazilian
and Iowa soils. Soil Sci. Soc. Am. Proc. 39:5 1-55.
Nguyen,M.L. and Goh,K.M. 1990. Accumulation of soil sulphur fractions in grazed
pastures receiving long term superphosphate applications. N. Z. J. Agri. Res.
33: 1 1 1- 128.
Nguyen,M.L., Rickard,D.S. and McBride,S.D. 1989a. Pasture production and
changes in phosphorus and S status in irrigated pastures receiving long term
application of superphosphate fertilizer. N.Z. J. Agri. Res. 32:245-262.

245
Nguyen,M.L., Rickard,D.S. and Quinn,B.F. 1983. Sulphur requirements under
irrigated pastures. In P.E.H.Gregg and J.K.Syers(Eds.), Proc. Tech. Workshop
on Sulphur in N.Z. Agriculture, Massey University, Palmerston North, May 23-
24, 1983.
Nguyen,M.L., Tillman,R.W. and Gregg,P.E.H. 1989. Evaluation of sulphur status
of East Coast pastures of the North Island, New Zealand. 2. Field trials. N.Z.
J. Agri. Res. 32:273-280.
Nicolson,A.J. 1970. Soil sulphur balance studies in the presence and absence
of growing plants. Soil Sci. 109:345-350.
Nie,P.H. and Tinker,P.B. 1980. Solute movement in the soil root system.
Blackwell Scientific publication.
Palmer,B., McCaskill,M., Friesen,D. and Hammond,L. 1983. Sulphur
containing fertilizers, past, present and future. Sulphur in South East
Asian and South Pacific Agriculture, (The University of New England,
Australia), 301-3 14.
Parfitt,R.G. and Smart,R.St.C. 1978. The mechanism of sulphate adsorption on iron
oxides. Soil Sci. Soc. Am. J. 42:48-50.
Paul,E.A. and Juma,N.G. 1981. Mineralization and immobilization of soil nitrogen
by microorganisms. In Terrestrial Nitrogen cycles (F.E. Clark and Rosswall,
Eds.), Ecological Bulletin (Stockholm) 33: 1779-1795.
Paul,E.A. and Van V een,J. 1978. The use of tracers to determine the dynamic nature
of organic matter. p. 61-102. Int. Congr. Soil Sci., trans. 1 1th {Edmonton,
Canada}
Payne,D. 1990. The behaviour of water in soil. pp. 3 15-337. In Russell's
Soil Conditions and Plant Growth. (Ed.) Alan Wild. John Wiley &
Sons, New York.
Petersen,R.G., Lucas,H.L. and Woodhouse,W.W.Jr. 1956. The distribution of
excreta by freely grazing cattle and its effect on pasture fertility: 2. Effect of
returned excreta on the residual concentration of some fertilizer elements.
Agron. J. 444-448.
Peverill,K.I. 1980. Removal of sulphur from the atmosphere by rain. In 'Sulphur in
Australia'. (Eds.) J.R.Freney and A.J.Nicholson. Australian Acadamy of
Science, Canberra, pp 105-1 13.

Peverili.K.L and Douglas,L.A. 1976. Use of undisturbed cores of surface
soils for investigating leaching losses of sulphate and potassium.
Geoderma 16: 193- 199.
Priestly,C.H.B. and Taylor,R..J. 1972. On the assesment of surface heat flux
and evaporation using a large-scale parameters. Monthly Weather
Review 100:81-92.
Probert,M.E. 1974. The sulphur status of some North Queensland soils. In.
McLachlan,K.D. (Ed.). handbook on Sulphur in Australian Agriculture.
CSIRO, Melbourne,pp.64-68.
246
Probert,M.E. 1976. Studies of available and isotopically exchangeable sulphur in
some North Queensland soils. Plant Soil 45:461-475.
Probert,M.E. 1977. The distribution of sulphur and carbon-nitrogen-sulphur
relationships in some North Queensland soils. Australia CSIRO
Division of Soils, Technical Paper No.3 1 . pp.20.
Probert, M.E. and Jones,R.K. 1977. The use of soil analysis for predicting
the response to sulphur of pasture legumes in the Australian tropics.
Aust. J. Soil Res. 15 :137-146.
Quinn,B.F. 1977. The fate of sheep-urine nitrogen on surface irrigated pasture in
New Zealand. N.Z. Soil News Supplement, 25:No.4
Quinn,B.F. 1982. The influence of grazing animals on nitrogen balances. In
Nitrogen Balance in New Zealand Ecosystems. (Ed.) P.W. Gandar,
Palmerston North, New Zealand, pp.95-102.
Rajan,S.S.S. 1979. Adsorption and desorption of sulphate and charge relationships
in allophinic clays. Soil Sci. Soc. Am. J. 43:65-69.
Rayment,G.E. 1983. Predictions of response to sulphur by established
Sirato/grass pasture in Southeastern Queensland. Aust. J. Expt. Agri.
Anim. Husb. 23:280-287.
Rhue,R.D. and Kamprath,E..J. 1973. Leaching losses of sulphur during winter
months when applied as gypsum, elemental S or prilled S. Agron. J. 65:603-
605.

Rickard,D.S., McBride,S.D. and Fitzgerald,P.D. 1986. The effect of soil
moisture on pasture yield. N.Z Agri. Sci. 20:7-1 2.
Risk,W.H. and Boswell,C.C. 1988. Sulphate sulphur in the sub soil of some
Southland and Otago soils. p. 1 18- 127. In Towards the More Efficient
Use of Fertilizer and Soil Sulphur. (Eds.) R.E.White and L.D.Currie,
Massey University, Palmerston North, New Zealand.
247
Rowarth,J.S. 1987. Phosphate cycling in grazed hill country pastures. Ph.D. Thesis,
Massey University, Palmerston North, New Zealand.
Rowarth,J.S., Gillingham,A.G., Tillman,R.W. and Syers,J.K. 1985. Release of
phosphorus from sheep faeces on grazed hill country pastures. N.Z. J. Agri.
Res. 28:497-504.
Ruz,B.E., Baii,P.R. and Tillman,R. W. 1988. The role of earthworms in nitrogen
release from herbage residues. In Nitrogen Efficiency in Agricultural soils
(Eds.) D.S.Jenkinson and K.A.Smith. Elsivier Appl.Sci. 355-370.
Saggar ,S., Bettany,J.R. and Stewart,J.W.B. 1981a. Measurement of microbial
sulphur in soil. Soil Biol. Biochem. 13:493-488.
Saggar,S., Bettany,J.R. and Stewart,J.W .B. 1981b. Sulphur transformations in
relation to carbon and nitrogen in incubated soils. Soil Biol. Biochem.
13:499-5 1 1.
Saggar ,S., Hedley,M.J., Gillingham,A.G., Rowarth,J.S., Richardson,S., Bolan,N.S.
and Gregg,P.E.H. 1990b. Predicting the fate of fertilizer sulphur in grazed hill
country pastures by modelling the transfer and accumulation of soil
phosphorus. N.Z. J. Agri. Res. 33: 129-1 38.
Saggar,S., MacKay,A.D.,Hedley,M.J., Lambert,M.G. and Clark,A.D. 1990a. A
nutrient transfer model to explain the fate of phosphorus and sulphur in a
grazed hill country pasture. Agri. ecosys. environ. 30:295-3 15.
Saunders,W.M.H., Cooper,D.M. and Sinclair,A.G. 1981. Use and interpretation of
sulphur soil tests for pasture. Aglink FPP 649. Ministry of Agriculture and
Fisheries, Wellington, NZ.
Scharpenseai,H.W. and Krausse,R. 1963. Radiochromatographic
investigations on the cycle of sulphate and of the S-amino acids cystine
and methionine. Z. pflanzenernahr Dung Bodenk. 101 : 1 1-23.

248
Schindler,S.C., Mitcheii,MJ., Seott,TJ., Fuller,R.D. and Driscoli,C.T. 1986.
Incorporation of 35S sulphate in to organic and organic sulphur constituents of
two forest soils. Soil Sci. Soc. Am. J. 50:457-462.
Scott,W.D. 1980. Chemical reactions of sulphur compounds in the
atmosphere. The formation of sulphate particles. In Sulphur in
Australia. (Eds.) J.R.Freney and A.J.Nicolson. Australian Acadamy of
Science, Canberra pp.45-52.
Scott,N.M. 1981. Evaluation of the sulphate status of soils by plant and soil
tests. J. Sci. Food Agri. 32: 193-199.
Scott,N.M. 1985. Sulphur in Soils and Plants. In. Soil organic matter and
biological activity, 379-401 . D.Vaughan and R.E.Malcolm (Eds.) Developments in Plant and Soil Science Number 16, Martinus Nijhoff/
Dr W Junk, Publishers.
Scott,N.M. and Anderson,G. 1976. Sulphur, carbon and nitrogen contents of
organic fractions from acetyl acetone extracts of soils. J. Soil Sci.
27:324-330.
Scotter ,D.R. 1978. Preferential solute movement through larger soil voids. 1 .
Some computations using simple theory. Aust. J . Soil Res. 16:257-267.
Scotter ,D.R., Clothier ,B.E. and Turner ,M.A. 1979. The soil water balance
in a fragiaqualf and its effect on pasture growth in central New
Zealand. Aust. J. Agri. Res. 17:455-465.
Searle,P.L. 1979. Measurement of adsorbed sulphate in soils. Effect of
varying soil:extractant ratios and methods of measurement. N.Z. J.
Agri. Res. 22:287-290.
Sears,P .D. 1950. Soil fertility and pasture growth. J. British Grasld. Soc.
5:267-280.
Sears,P.D. 1953. Pasture growth and soil fertility. vii. General discussion of
the experimental results and of their application to farming practice in
New Zealand. N.Z. J. Sci. and Tech. 30A:23 1-250.
Sears,P.D., Goodai,V.C., Jackman,R.H. and Robinson,G.S. 1965. Pasture growth
and soil fertility. 8. The influence of grasses, white clover, fertilizers and the
return of herbage clippings on pasture production of an impoverished soil. N .Z.
J. Agri. Res. 8:270-288.

249
Sears,P.D. and Newbold,R.P. 1942. The effect of sheep droppings on yield ,
botanical composition and chemical composition of pasture. 1 . Establishment
of trial, technique of measurement and results for the 1940-41 season. N.Z. J.
Sci. Tech. A24:36-61.
Sharpley,A.N. Syers,J.K. 1979. Loss of nitrogen and phosphorous in tile drainage
as influenced by urea application and grazing animals. N.Z. J. Agri. Res.
22: 127- 131.
Shedley,C.D., Till,A.R. and Blair,G..J. 1979. A radio tracer technique for
studying the nutrient release from different fertilizer materials and its
uptake by plants. Commun. Soil Sci. Plant Anal. 10:737-745.
ShieldsJ.A., Paul,E.A., and Lowe, W.E. 1974. Factors influencing the stability of
labelled microbial materials in soils. Soil Biol. Biochem. 6: 31-37
Sinclair,A.G. 1983. Problems in modelling sulphur requirements in New Zealand.
Sulphur in New Zealand Agriculture, (Eds.) Gregg,P.E.H. and Syers,J.K.,
Massey University, Palmerston North, New Zealand.
Sinclair,A.G. and Enright,D.P. 1983. Effectiveness of elemental sulphur
fertilizers. Proceedings of the Technical workshop on sulphur in New
Zealand Agriculture. (Ed. P.E.H. Gregg and J.K. Syers), Massey
University, Palmerston North, New Zealand, pp. 164- 175.
Sinclair,A.G. and Saunders,W.M.H. 1882. In " Fertilizer recommendation to
pastures and crops." pp 14-15. (Eds.) I.S.Cornforth and A.G.Sinclair, Ministry
of Agriculture and Fisheries, Wellington, NZ.
Singh,B.R., Abrahamsen,G. and Stuanes,A. 1980. Effect of simulated acid
rain on sulphate movement in acid forest soils. Soil Sci. Soc. Am. ].44:75-80.
Skinner ,R.J. 1987. Growth response in grass to sulphur fertilizer.
Proceedings of an International symposium on Elemental sulphur in
Agriculture. Volume 2. 525-535. Syndicate Francais du Soufre,
Marseille.
Smith,F.W. and Dolby,G.R. 1977. Derivation of diagnostic indices for assessing the
sulphur status of panicum maximum var. trichoglumi. Commun. Soil Sci. Plant
Anal. 8:221-240.

250
Smith,C.M., Gregg,P.E.H. and Tillman,R.W. 1983. Drainage losses of sulphur
from fellow grey earth soils. N.Z. J. Agri. Res. 26:363-37 1 .
Speir,T.W. 1977. Studies on a climosequence of soils in tussock grasslands.
2. Urease, Phosphotase and sulphatase activities of top soils and their
relationship with other properties including plant available sulphur.
N.Z. J. Sci. 20: 159- 1 66.
Speir,T.W., Lee,R., Pansier,E.A. and Cairns,A. 1980. A comparison of
Sulphatase, Urease and protease activities in planted and fallow soils.
Soil Bioi. Biochem. 12:281-29 1 .
Spencer,K. and Freney,J.R. 1960. A comparison of several procedures for
estimating the S status of soils. Aust. J. Agri. Res. 2:948-959.
Spencer,K. and Freney,J.R. 1980. Assessing the sulphur status of field grown wheat
by plant analysis. Agron. J. 72:469-472.
Spencer,K. and Glendennings,J.S. 1980. Critical soil test values for
predicting the phosphorus and sulphur status of subhumid temperate
pastures. Aust. J. Soil. Res. 1 8:435-445.
Steele,K.W., Judd,M..J. and Shannon,P.W. 1984. Leaching of nitrate and
other nutrients from grazed pastures. N.Z. J. Agri. Res. 27:5-1 1.
Steinbergs,A., Lismaa,O., Freney,J.R. and Barrow,N..J. 1962. Determination of
total sulphur in soil and plant material. Anal. Chim. Acta 27: 158-164.
Stephen,R.C. 1970. Responses by Lucerne and associated volunteer species to
applied fertilizer in North Canterbury. Proc. N.Z. Grassld Conf. 32: 1 17-126.
Stevenson,F..J. 1986. Cycles of soils, John Wiley, New York.
Swift,R.S. 1977. Mineralization of nitrogen and sulphur from soil organic matter. A
comparison of pasture arable soils. In. 'Soil organic matter studies' pp
275-28 1. proceedings, IAEA symposium, Vienna.
Syers,J.K, Skinner,R..J. and Curtin,D. 1987. Soil and Fertilizer Sulphur in U.K.
Agriculture. The Fertilizer Society, Proc. No.264.
Tabatabai,M.A., AI-Khafaji,A.A. 1980. Comparison of nitrogen and sulphur
mineralization in soils. Soil Sci. Soc. Am. J. 44: 1000-1006.
Tabatabai,M.A. and Bremner ,M..J. 1972a. Distribution of total and available sulphur
in selected soils and soil profiles. Ag. J. 64:40-44.

251
Tabatabai,M.A. and Bremner,M.J. 1972b. Forms of sulphur and carbon, nitrogen
and sulphur relationships in Iowa soils. Soil Sci. 1 14:380-386.
Technicon, 1976. Technicon mannual for ammonium analysis.
Tabatabai,M.A. and Chae, Y .M. 1982. Alkaline oxidation method for the
determination of sulphur in plant materials. Agron. J. 74:404-406.
Till, A.R. 1975. Sulphur cycling in grazed pastures. In. "In Sulphur in Australasian
Agriculture". pp 68-75. KD.McLachlan (Eds.), Sydney University Press.
Till,A.R. 1980. Sulphur cycling in soil-plant-animal systems. In. Freney,J.R.
and Nicolson,A.J. (Eds.). Sulphur in Australia. Australian Acadamy of
Science, Canberra, pp. 402-217.
Till,A.R. and Blair ,B.J. 1978. The utilization by grass of sulphur and phosphorus
from clover litter. Aust. J. Agri. Res. 29:235-242.
Till,A.R. and May,P.F. 1971. Nutrient cycling in grazed pastures. 4. The fate of
sulphur-35 following its application to a small area in a grazed pasture. Aust.
J. Agri. Res. 22:391-400.
Till,A.R., May,M.F., Saunders,W.M.H. and Sinclair,A.G. 1987. Plant nutrient
sulphur requirements. Oceania. p63-73. In. Sulphur-87. World regional
requirements. Plant nutrient sulphur. Co-sponsored by the sulphur Institute and
the British sulphur corporation.
Till,A.R. and McCabe,T.P. 1976. Sulphur leaching and lysimeter
characterization. Soil Sci. 121:44-47.
Trudinger ,P.A. 1975. The biogeochemistry of sulphur. In "sulphur in
Australasian Agriculture". (Ed.) KD. McLachlan. Sydney University
Press. pp. 1 1-20
Tsuji,T. and Goh,K.M. 1979. Evaluation of soil sulphur fractions as sources of plant
available sulphur using radio active sulphur. N.Z. J. Agri. Res. 22:595-602.
Turner,M.A., Tillman,R.W. and SyersJ.K. 1979. Losses of phosphorous and
nitrogen forms in subsurface drainage water as influenced by phosphate
fertilizer, grazing animals and irrigation treatments. Progress in Water
Technology. 1 1 :287-294.
Voroney,R.P., VanveenJ.A. and Paui,E.A. 1981. Organic C dynamics in
grassland. 2. Model validation and simulation of the long term effects
of cultivation and rainfall erosion. Can. J. Soil Sci. 61:21 1-224.

Wainwright,M. 1984. Sulphur oxidation in soils. Advances in Agronomy,
37:349-396.
252
Walker,T.W. 1956. The nitrogen cycle in grassland soils. J. British Grassland Soc.
12: 10- 18.
Walker,T.W. 1957. The sulphur cycle in grassland soils. J. Brit. Grassld Soc. 12: 10-
18.
Walker,T.W. and Adams,A.F.R. 1958. Competition for sulphur in grass
clover association. Plant Soil. 9:353-356.
Walker,T.W. and Adams,A.F.R. 1959. Studies on soil organic matter. 2.
Influence of increased leaching at various stages of weathering on
levels of carbon, nitrogen, sulphur and organic and total phosphorus.
Soil Sci. 87: 1-10.
Walker,T.W. and Gregg,P.E.H. 1975. The occurrence of sulphur deficiency
in New Zealand. In "Sulphur in Australasian Agriculture. " (Ed.)
K.D.McLachlan, Sydney University Press. pp.145-153.
Watkinson,J.H. and Perrott,K.W. 1990. A new soil test for sulphate and
mineralized organic sulphur. Proc. N.Z. Fert. Manu. Res. Ass. pp. 188-
198.
Watson,E.R., Lapins,P. and Greenwood,E.A.N. 1973. Changes in nitrogen
and sulphur content and other soil properties after application of
ammonium sulphate to grazed pastures in Western Australia Aust. J.
Expt. Agri. Anim. Husb. 13:69-74.
West,A.W., Sparling,G.P. and Spier,T.W. 1989. Microbial activity in
gradually dried soil or rewetted soils as governed by water and
substrate availability. Aust. J. Soil. Res.
White,G.J. 1959. Mineralization of nitrogen and sulphur in sulphur deficient soils.
N.Z. J. Agri. Res. 2:255-258.
White,R.E. 1980. Pathways of phosphorus in soil. p21-44. In "Phosphorus in
Sewage Sludge and Animal Waste Slurries. (Eds.) Hucker,T.W.G. and
Catroux,G., D. Reidel publishing company.
White,R.E. and Currie,L.D. 1988. Towards the more efficient use of soil and
fertilizer sulphur. Massey University, Palmerston North, New Zealand.

253
Wilkinson,S.R. and Lowery,R.W. 1973. Cycling of mineral nutrients in pasture
ecosystem. In; G.W.Butler and R.H.Baily (Eds.) Chemistry and biochemistry
of herbage vol.2. Acadamic Press, London. pp 247-315.
Williams,C.H. 1967. Some factors affecting the mineralization of organic sulphur in
soils.
Williams,C.H. 1968. Seasonal fluctuations in mineral sulphur under subterranean
clover pastures in Southern New South Wales. Aust. J. Soil Res. 6: 131 : 139.
Williams,C.H. 1974. The chemical nature of sulphur in some New South
Wales soils. In. "Handbook on Sulphur in Australian Agriculture." (Ed.)
K.D.McLachlan, CSIRO, Melbourne, pp. 16-23.
Williams,C.H. 1975. The chemical nature of sulphur compounds in soils. Sulphur in
Australasian Agriculture. pp.21-30. K.D.McLachlan (Ed.). Sydney University
Press.
Williams,C.H. and Donald,C.M. 1957. Changes in organic matter and pH in a
podzolic soil as influenced by subterranean clover and superphosphate. Aust.
J. Agri. Res. 8 : 179: 189.
Williams,P.H., Gregg,P.E.H. and Hedley,MJ. 1990. Fate of potassium in dairy cow
urine applied to intact soil cores. N.Z J. Agri. Res. 33: 151-158.
Williams,P.H. Hedley,M..J. and Gregg,P.E.H. 1989. Uptake of potassium and
nitrogen by pasture from urine affected soil. N.Z J. Agri. Res. 415-421 .
Williams,C.H. and Steinbergs,A. 1958. Sulphur and phosphorus in some eastern
Australian soils. Aust. J. Agri. Res. 9:483-491 .
Williams,C.H. and Steinbergs,A. 1959. Soil sulphur fractions as chemical indices
of available sulphur in some Australian soils. Aust. J. Agri.Res. 10:340:352.
Williams,C.H. and Steinbergs,A. 1962. The evaluation of plant available sulphur
in soils. 1 . The chemical nature of sulphate in some Australian soils. Plant
Soil. 21 :50-62.
Williams,C.H. and Steinbergs,A. 1964. The evaluation of plant available sulphur in
soils. 2. The availability of adsorbed and insoluble sulphates. Soil Sci.
99: 104-108.
Williams,C.H., Williams,E.G. and Scott,N.M. 1960. Carbon, nitrogen,
sulphur and Phosphorus in some Scottish soils. J. Soil Sci. 1 1 :334-346.
Zebnder ,A..J.B. and Zinder ,S.H. 1980. The sulphur cycle. pp. 105-145. In
O.Hutzinger (Ed.). The natural environment and the biogeochemical cycles.
Springer-Verlag, Berlin.

APPENDIX-5.1
Soil Moisture content for the period from Jun. 1989 t o Jan. 1990 (seven
sampling occasions) for three depths at all four sites.
Farmlet Depth 1 2 3 4 5 6
(cm) g water g-1 soil
LF-LS 0-7 .5 0.50 0.54 0.55 0.5 0 .60 0 .38
7 .5-15 0. 36 0 .44 0 .43 0 .44 0 .43 0 .38
15-25 0 .35 0 .40 0 .38 0 .34 0 .39 0.34
LF-MS 0-7 .5 0 .51 0 .59 0 .63 0 .55 0. 64 0 .44
7.5-15 0.41 0 .47 0 .49 0.48 0 .52 0 .41
15-25 0 .39 0.52 0 .42 0 .38 0 .45 0.35
HF-LS 0-7.5 0 .61 0 .51 0 .59 0 .64 0 . 68 0 .37
7.5-15 0 .42 0 .37 0 .45 0 .44 0 .42 0 .34
15-25 0 .39 0 .33 0 .38 0 .37 0 .39 0 .33
HF-MS 0-7.5 0 .49 0 .54 0 .49 0 .52 0.53 0.28
7.5-15 0 .32 0 .35 0 .37 0 .41 0 .39 0 .23
1 5-25 0.29 0 .33 0 .32 0 .37 0 .34 0.24
2 5 4
7
0.40
0 .36
0 .36
0.46
0 .37
0 .38
0 .41
0 .35
0.33
0 . 3 1
0.27
0 .38

APPENDIX-5.2
Soil bulk densities for the depths 0-7.5, 7.5-15 and 15-25cm at all four sites measured
during July 1989.
Farmlet Bulk Density (kg dm-3)
0-7.5cm 7.5-15cm 15-25cm
LF-LS 0.77 0.97 1 . 1 8
LF-MS 0.75 0.95 1 . 16
HF-LS 0.79 0.99 1 .20
HF-MS 0.77 0 .97 1 . 18
2 5 5

Appendix-5.3
Sulphate (kg/ha) present in the soil for three depths during the experimental period.
Fannlet
LF-LS
LF-MS
HF-LS
. HF-MS
.L s Dp<O.Ql br .... nr.rYI p
---Depth(mm)
31/5 4n
0-75 3.8 5.5
75-150 4.2 6.1
150-250 7.8 1 0.9
0-75 3 .9 4.7
75-150 4.9 6.1
150-250 10.7 12.2
0-75 8.7 8.2
75-150 15.2 10 .0
150-250 21 .1 14.8
0-75 7 .7 6.0
75-150 9.9 7 .4
150-250 1 6.5 12.4
0.9 0.7 ·• • - · - • �- · - - - · • - - - ori rir- J1 p hs.
From 31-5-1989 to 8-1 -1990
24/8 5/9 6/1 1 30/1 1
8.0 6.1 4.3 3.1
7.2 6.1 4.8 3.7
13.0 10.6 9.5 7 .6
14.4 5.3 4.2 3.4
9.9 5.9 6.7 3.1
19.4 12.3 1 0.6 12.0
14.4 7.2 . 5.7 3.5
15.3 9.3 8 .3 3.2
30.5 22.0 20.0 19.4
6.7 4.4 3 .7 2.8
9.2 7.7 5.5 3.2
21.1 19.6 16.6 1 6.9
2.3 1 .3 0.9 1 .2
8/1/91
2.9
3.6
7 .7
3 .3
4.6
10.4
4.7
8.0
21 .6
2.8
2.1
16.1
1 .7 1\) (.)1 0'\

Appendix-5.4
Mineral nitrogen (kg/ha) present in the soil for three depths during the experimental period.
Farmlet Depth( mm) From 3 1 -5- 1989 to 8-1- 1990
3 1/5 4n 24/8 5/9 6/1 1 30/1 1
LF-LS 0-75 4.3 6.5 1 1 . 1 4. 1 3.7 2.9
75-150 2.6 5 .1 8.9 3.5 3 . 1 2.8
150-250 4.5 6.0 8.9 4.5 4.8 3 .9
LF-MS 0-75 3.3 7.4 29.9 5.8 4.6 3. 1
75-150 1 .9 6.3 19.6 3.6 3.7 3 . 1
150-250 4. 1 6.6 20.2 6. 1 6. 1 4.6
HF-LS 0-75 4.4 7.4 20.8 14.0 7.8 3 .5
75-150 3.2 5 .1 7.2 9.6 5 .9 3.2
150-250 2.4 5.0 8.9 7.2 8.8 4. 1
HF-MS 0-75 4.1 7.9 7.0 6.3 5.9 2.8
75- 150 2.9 5.8 5.6 5.0 5.3 3.2
150-250 2.1 5.6 7 . 1 8.2 6.3 5 . 1
.L s Dp<O.Ol 0.6 0.6 4.3 2. 1 0.7 0.5
rf' .. ''�"'fYJ.I p Jths. p
8/l/91
2. 1
1 .6
2.4
1 .7
3.0
2.2
2.1
2.4
2.2
2.0
1 .5
2.3
0.7 N tn -...!

2 5 8
Appendix-5.5
Sulphur and nitrogen returned in excreta
The amount of S and N returned in animal excreta and taken up by pasture was calculated
as follows
Readily plant available sulphur returned for the period 31-5-1989 to 10-1- 1990
Low fertility fannlet
Dry matter produced(31-5-1989 to 10-1-1990)
LF-LS
LF-MS
=3774 kg dm ha-1-----------1
=5 189 kg dm ha-1-----------2
Based on the percentage area of each 10 ha farmlet in a slope category (Saggar et al., 1990a)
the total dry matter production for the total low slope (31 .5% of the total area) and medium
slope (41.5% of the total area) areas were calculated as (expressed for the area)
3774*0.3 15 =1 185 kg dm for 0.315 ha ----------------------3
5 198*0.415 =2157 kg dm for 0.415 ha ----------------------4
adding 3+4 =3342 kg dm which represents 77% of the total drymatter
production and for an area of 0.73 ha in the LF farmlet
according to Saggar et al. (1990a)
The remaining 27.1% of the farmlet area is occupied by steep slope which produced the
remaining 23% of the total dry matter production. The total dry matter produced for all the
three slope was
3342/.77 =4340 kg dm ha1
Dry matter utilized and S ingested
Of the total dry matter 70% is utilized by sheep
4340*.7 =3038 kg dm ha-1

The weighted mean average S content of the herbage =0.259%
Amount of S ingested =7.9 kg S ha-1
85% of the ingested S is returned in excreta (Gillingham et al., 1980)
7.9*.85 =6.7 kg S ha-1
2 5 9
S is partitioned in dung(40%) and urine(60%) (Wilkinson and Lowery, 1973) and dung
contains 10% sulphate and urine contains 75% sulphate (Table 1, Chapter-7). Of the total S
returned in dung, about 60% and 30% returned to low and medium slopes and of the urine
returned about 55% and 31% returned to low and medium slopes (Saggar et al., 1990a). This
gives a total return of 6.8 kg so4=-s ha-1 to low slope and 2.9 kg so4= ha-1 to medium slope.
But the amount of S04 =_ S taken up plant is only 7% of the total S04= returned in excreta
(discussed in Chapter-7, Goh and Nguyen, 1990) and no excreta so4=-S was lost by leaching
(Chapter-7). So the amount of potentially available plant S04=-S returned were 0.45 and 0.21
kg S ha-1 for low and medium slopes.
Similarly the amount of potentially available plant S returned in high fertility farmlet is 1 . 1
and 0.4 kg S ha-1 for low and medium slopes. The distribution of slope areas in the high
fertility farmlet was given in table 1 and stocking rate for this farmlet was described in
section 2.
Readily available nitrogen returned excreta
Low fertility farmlet
Weighted mean N content of the herbage= 2.97%
Total nitrogen ingested =91 kg N ha-1
85% of the ingested N returned in excreta (Wilkinson and Lowery, 1973)
Total N returned in excreta =77 kg N ha-1
About 30% of the N returned in dung which is equivalent to 24.3 kg N ha-1 • The remaining
42.7 kg N (70%) returned in urine. Of the dung N, 60% is returned to low slope and 30%
returned to medium slope. In urine 55% returned to low slope and 3 1 % returned to medium
slope. About 6% of the dung N readily available form while 70% of the urine N is in readily
available form. Again 6% of the readily available N is being taken up by plant and none of

2 6 0
the mineral N was lost by leaching. So the readily available N in the available pool is 3.8
and 2.1 kg N ha-1 for low and medium slopes. Similarly the amount of N returned in high
fertility farmlet was 8.0 and 3.5 kg N ha-1 for low and medium slopes.

Appendix-6.1
Sulphate (kg/ha) present in the soil for three depths during the experimental period.
Farmlet Depth(mm) From 8-1- 1990 to 10-10- 1990
16/2 26/3 30/4 31/5 15n 23/8
LF-LS 0-75 4.2 4.4 4. 1 4.3 5.3 3.6
75-150 4.6 5.2 5.0 6.2 6.3 5.6
150-250 8.5 1 1 .0 9.9 1 1 . 1 1 1 .9 10.0
LF-MS 0-75 7.0 5.1 5.5 4.6 6.4 4. 1
75- 150 7 .8 8.2 7.8 6.9 8 . 1 6.0
150-250 1 6.7 17. 1 19.5 18. 1 20.8 1 8.9
HF-LS 0-75 10.8 6.8 5 .3 4.9 . 6.3 4.7
75-150 9.4 10.9 8.2 7.2 6.7 7 .5
150-250 2 1 .6 27.2 23.0 21 .6 2 1 .9 23.5
I-IF-MS 0-75 24.4 9.0 8.8 3 .6 5 . 1 4. 1
75- 150 1 3.2 13 . 1 10.8 7.3 7.5 5.7
150-250 22.2 29.0 28.9 20.6 2 1 .8 16 . 1
.L s Dp<O.Ol 2.2 1 .4 3. 1 2.7 3.4 3.8
p JlhS. p
10/10
3 .0
6.4
10. 1
4.0
6.2
1 3.2
4.9
9.2
1 8. 1
4.4
6.8
16. 1
4.5
I I I 1\.)
0\ ,_.

Appendix-6.2
Mineral nitrogen (kg/ha) present in the soil for three depths during the experimental period.
Farmlet Depth(mm) From 8-1- 1990 to 10-10- 1990
1 6/2 26/3 30/4 3 1/5 15n 23/8
LF-LS 0-75 6.0 4.9 4.8 5.2 8.7 5.8
75- 150 5.4 4.9 2.7 4.2 4. 1 4.7
150-250 7.6 7 .7 2.7 4.3 4.0 5.4
LF-MS 0-75 8.5 5.8 9.3 5.9 10.8 14.0
75-150 12.7 5.8 3 . 1 3 .9 6. 1 5.3
150-250 19.4 8.2 2.7 6.0 4.2 9.7
HF-LS 0-75 13 .2 17.7 19.8 7..8 12.6 16.8
75-150 9.7 1 1 .2 9.3 5 .9 6.8 1 .6
150-250 17.6 12.5 7.0 8.5 5.9 13.5
HF-MS 0-75 12.0 9.8 1 6.7 5.2 19.7 14.6
75- 150 1 1 .7 6.5 4.2 3 .7 7.6 7.3
150-250 2 1 .9 9.5 4.9 5 . 1 5.6 9.8
*L s Dp<O.Ol 3.3 2.6 2.9 2.5 2.2 4.6
l-'1 p p ths.
10/10
12. 1
5.9
6.5
22.6
9.2
6.6
25.9
12.8
8 .3
10.0
8.5
10.4
5.6
I I N 0\ N

2 6 3
APPENDIX-7.1
Distribution of excreta in grazed hill country pastures.
Amount of dung and urine deposited to the low slope and the total area covered on an annual
basis (Wilkinson and Lowery, 1973).
Amount of dung deposited and area covered
Stocking rate = 10 SU ha-1
Number of defaecation = 6 events daf1
Amount of dung excreted per event = 225g defaecation-1
Total dung excreted = 225x6x10x365 = 4927 kg FD ha-1 yr-1
Area covered = 176.8x6x10x365 = 0.387 ha
60% returned to low slope = 2956 kg FD Area covered for 2956 kg dung = 0.387x2956/4927
= 0.232 ha
Amount of urine returned and area covered
Amount of urine deposited = 1-2 litres day-1
On an average it is = 1 .2 litres day-1
Number of urination events = 8 events day-1
Amount of urine voided = 150ml evenf1
Total urine deposited = 150x8x10x365 = 4380 lit yr-1
Area covered = 176.8x8x10x365 = 0.5 16 ha
55% returned to low slope = 2190litres
Which covered an area of = 0.516x2190/4380 =0.258 ha
Total area of the low slope on a hectare basis = 0.33ha

Appendix 8 . 1 . Change in specific activity of plant and leachate S-35 with time and the days on which drainage (verical bars) occurred for all four sites from Jan. to Oct. 1 990.
1 2
1 0 .......... (/) (Jl I � I E 8 .......... E V 0. u
lD < 6 0 ...-......... >-...... > 4 ...... u � 0.
(/) 2 -t Il l
0 +---L---+-----l 0 50
70
- 60
'\ I " + 50
40 .......... E E ........, 30 �
0 c 0 '-
I 20 Cl
I I l l I I I 0 I I I J.. 1 0
1 I 11 D I l l 1 1 11 01 , a 1 1 1 nu 1 a ' m 1 " 1 1 g. 1 0 1 00 1 50
T ime (days)
200 250 300
"*- Plant
e Leachate
N 0'1 .1>-

2 65
APPENDIX-8 . 2
Ratio of shoot and root growth for the experimental period1
Month Shoot /Root
June 1 1 . 6
July 1 4
August 1 0 . 2
September 1 2 . 5
October 1 5
November 1 6
December 1 3
January 1 7
1 Cal cu l ated us ing the shoot /root distribut i on given by Mathew et al . ( 1 9 8 9 ) .

45
40
35
30 .......... E E 25 ..........
.E 20 c: 0 er
1 5
1 0
5
0 1
Appendix-8. 3 a Rainfall during the experimental period (Jun. 1 989 to Jan. 1 990)
2 1 4 1 6 1 8 1 1 0 1 1 2 1 1 4 1 1 6 1 1 8 1 20 1 Day from the beginning of the experiment
N 0) 0)

Appendix-8.3b Evapotranspiration (Et) during the experimental period (Jun. 1 989 to Jan. 1 990) .
4.5
4
3.5
.......... E E 3 . o+J w
........,
c 2.5 0
o+J e · -g. 2 c e o+J 0 g. 1 .5 >
w
1
0.5
0 11111111111
1 5 1 1 0 1 1 5 1 20 1 Day from the beginning of the experiment
t'V (j) -J

2 6 8
APPENDIX-8.4
Predicted and measured extractable soil sulphate present in the soil for three depths at all the four sites.
Site Sampling Predicted sulphate Measured sulphate
0-7.5 7 .5-15 15-25 0-7 .5 7 .5-15 15-25 kg S ha·1
LF-LS 1 3 . 8 4.2 7 . 8 3 . 8 4.2 7 . 8
2 7 .9 6 .4 8 .9 5 .5 6 . 1 10 .8
3 9 .5 8 .8 10.5 8 .0 7.2 12.9
4 4. 8 7. 1 10 .9 6. 1 6 . 1 10.6
5 9.2 4.2 8.6 4.3 4 . 8 9 . 5
6 14.4 0 6. 8 3 . 1 3 .7 7 .6 7 8 .5 4. 1 '7 .6 2.9 3 . 6 7.7
LF-MS 1 3 . 9 4.9 10.7 3 . 9 4.9 10.7 2 5 .4 6 .9 10 .8 4.7 6. 1 12.2 3 12.3 14.2 1 3 . 6 12.4 9 .9 19 .4 4 3 .4 7 .6 1 1 .9 5 . 3 5 .9 12.4 5 8 .4 8. 1 12.6 4.2 6.7 10.6 6 10.7 7.0 12.5 3 .4 5 10.2 7 7 8.2 12.2 3 . 3 4 .6 10 .4
HF-LS 1 8 .7 15 .2 21 . 1 8 .7 15.2 21 . 1 2 3 .6 9 . 1 19 .9 8.2 10 14 .8 3 27 . 1 15 .6 20.2 14.5 1 5 . 3 30.5 4 7 .9 1 1 . 3 19 .6 7 .2 9 .3 22 5 1 3 . 1 9 . 3 15 .3 5 .7 8 . 3 2 1 6 14 .3 7 .3 15 .3 4 .5 8 2 1 . 4 7 9 . 8 12.9 15 .5 4 .7 8 2 1 . 6
HF-MS 1 7.7 9 .9 16 .5 7 .7 9 .9 16 .5 2 6 .3 7 .9 15 .2 6 7 .4 17 .4 3 1 3 .4 1 3 .2 1 5 .2 6.7 9 . 1 2 1 .2 4 7 12 1 5 . 8 4 . 4 7 . 7 19 .6 5 1 3 .2 3 . 9 12.5 3 .7 5 .5 16.4 6 12.7 4.4 12.5 4.5 6.9 16 .9 7 8 .5 9 12.9 2. 8 2.7 16 . 1