factors influencing the success of an erp system: a study ... · the study examined factors in user...
TRANSCRIPT

Silpakorn U Science & Tech J8(1): 18-45, 2014
Research Article
ISSN 1905-9159
Factors Influencing the Success of an ERP System: A Study in the Context of an Agricultural Enterprise in Thailand
Somsit Duangekanong
Faculty of Science and Technology, Assumption University of ThailandCorresponding author. E-mail address: [email protected]
Received June 20, 2013; Accepted September 20, 2013
Abstract The study examined factors in user satisfaction with ERP implementation pig farming and processing organization in northern Thailand. The target population included ERP users and government advisers involved with its implementation. A theoretical model with six determinants (Business Process of Reengineering, Top Management Support, Education and Training, Information Quality, System Quality and Perceived Usefulness) of User Satisfaction was developed. Data was collected using a questionnaire (n =228). From a theoretical perspective the findings supported most of those in previous studies whereby Top Management Support had the greatest effect on User Satisfaction followed in order by Perceived Usefulness, System Quality, and Information Quality while Business Process Reengineering and Education and Training had relatively small effects on User Satisfaction. New findings showed that contrary to those in previous studies: Top Management Support and Education and Training did not have significant effects on System Quality; Business Process Engineering only had significant indirect effects on Perceived Usefulness and User Satisfaction; and Education and Training only had a significant indirect effect on User Satisfaction. From a practical perspective the findings enabled the formulation of a hierarchy of objectives aimed at increasing user satisfaction each with an associated hierarchy of actions.
Key Words: Enterprise resource planning (ERP); Critical success factors (CSF); Information and system quality and net benefits
Introduction An Enterprise Resource Planning (ERP) system is an information technology based system used to collect data about business processes spanning supply chain management, production, distribution, marketing and sales, and administrative practices. The organization then uses the information collected by the system to control and refine its
existing practices and modify them in order to improve efficiency and productivity. Implemented properly, an ERP system may provide a substantial competitive advantage for the organization due to increased knowledge about the organization and the ability to implement changes in its operation based on these findings (Umble, et al., 2003). ERP systems also improve production efficiency by rationalizing

Silpakorn U Science & Tech J Vol.8(1), 2014S. Duangekanong
19
work processes, reducing or eliminating duplication, and improving record keeping compared to manual systems or piecemeal software programs (such as accounting systems, manufacturing control systems, and so on) (Umble, et al., 2013). ERP systems may also offer user benefits such as improved IT department interaction and improved and more efficient workflow processes (Longinidis & Gotzamani, 2009). Given these potential benefits, many organizations are interested in the use of an ERP system. Knowing how many organizations use an ERP system is difficult because of the diffusion of the market. A report by Panorama Consulting (2012) indicated that the largest ERP vendors by market share include SAP (22 percent), Oracle (15 percent), and Microsoft Dynamics (10 percent). However, the composition of the remainder of the market (53 percent) includes a wide range of mid-level, small or targeted, and open source systems, which are not necessarily tracked in terms of implementation (Monk and Wagner, 2008). This means that there are few statistics about how many companies have implemented ERP systems globally. However, there is some evidence for its popularity in specific areas. For example, one industry survey found that 70 percent of top firms use ERP systems to drive ordering, production, fulfillment, and billing cycles (Aberdeen Group, 2007). These firms see substantial benefits from the implementation, including complete and on-time shipment, inventory accuracy, and increased efficiency in payment collections (Aberdeen Group, 2007). A more recent study by Panorama Consulting (2012) suggested that organizations expected to realize increased information availability and interaction between business units and decreased labor costs and production lead time. Thus, there are many reasons for an organization to implement an ERP system.
While there are significant benefits from an ERP system, it is not an unproblematic choice for an organization. The implementation of ERP systems is exceptionally prone to failure and even when implementation is completed it can be substantially over time and over budget. A rough estimate of failure rates for large-scale software programs including ERP systems is that about 60 percent of all such projects fail (Simon, 2010). One recent implementation survey of the most frequently used large ERP systems (SAP, Oracle, and Microsoft Dynamics) found that successful Oracle implementations took on average four months longer than the planned 18 months, while both SAP and Microsoft Dynamics took two or three months longer than expected (Panorama Consulting, 2012). This study also showed that the cost of implementation was high, with payback periods averaging 2.4 years and 29 percent of the organizations experienced no financial benefit from the implementation (Panorama Consulting, 2012). Even when implementation succeeds in terms of time and budget, only 3 percent of organizations realize 81 percent or more of the expected benefits. Particularly problematic are benefits such as decreased labor costs and improved lead time, which are only realized in 7 percent of the organizations (Panorama Consulting, 2012). As a study in Jordanian manufacturing shows, ERP failure can be particularly problematic in developing countries due to a significant gap between the organization’s capacity and resources and the requirements and assumptions of the ERP software (Hawari and Heeks, 2010). Overall, this means that firms in Thailand that are hoping to implement ERP software have a significant challenge in realizing this goal given the wide range of potential failure points for implementation. This high rate of failure and the potential gap between
Silpakorn U Science & Tech J Vol.8(1), 2014 Factors Influencing the Success of an ERP System
20
resources and ERP design requirements mean that Thai companies hoping to implement ERP systems need to be aware of important success factors in implementation. Identifying these important success factors for an ERP implementation in a specific sector (the agricultural production sector) was the main aim of this study. A description of the research design and methodology for the study is presented next (section 2). This is followed by a review of the related literature (section 3) which forms the basis for the formulation of the theoretical model for the study (section 4). Section 5 presents the results of the data preparation and preliminary statistical analyses of the prepared data. This leads to the analysis and development of the theoretical model in order to produce a final model (section 6). The findings of the study are discussed in section 7 and conclusions are drawn in section 8.
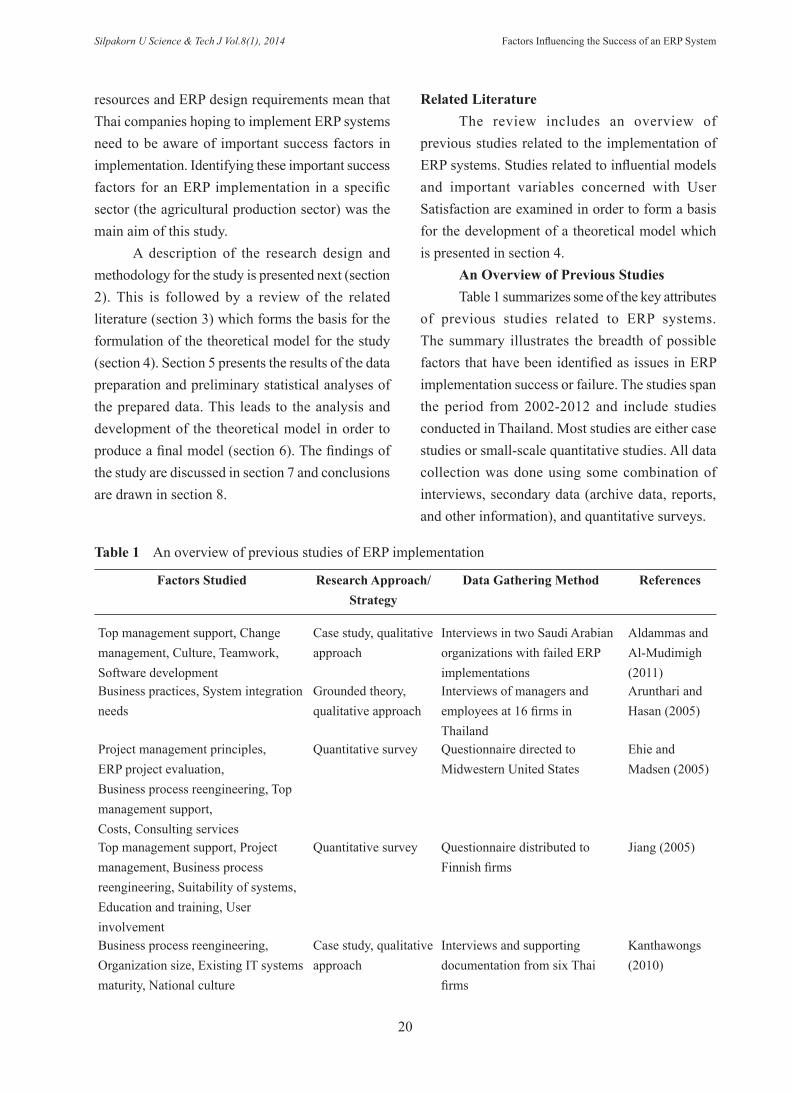
Related Literature The review includes an overview of previous studies related to the implementation of ERP systems. Studies related to influential models and important variables concerned with User Satisfaction are examined in order to form a basis for the development of a theoretical model which is presented in section 4. An Overview of Previous Studies Table 1 summarizes some of the key attributes of previous studies related to ERP systems. The summary illustrates the breadth of possible factors that have been identified as issues in ERP implementation success or failure. The studies span the period from 2002-2012 and include studies conducted in Thailand. Most studies are either case studies or small-scale quantitative studies. All data collection was done using some combination of interviews, secondary data (archive data, reports, and other information), and quantitative surveys.
Table 1 An overview of previous studies of ERP implementation
Factors Studied Research Approach/Strategy
Data Gathering Method References
Top management support, Change management, Culture, Teamwork, Software development
Case study, qualitative approach
Interviews in two Saudi Arabian organizations with failed ERP implementations
Aldammas and Al-Mudimigh (2011)
Business practices, System integration needs
Grounded theory, qualitative approach
Interviews of managers and employees at 16 firms in Thailand
Arunthari and Hasan (2005)
Project management principles,ERP project evaluation,Business process reengineering, Top management support,Costs, Consulting services
Quantitative survey Questionnaire directed to Midwestern United States
Ehie and Madsen (2005)
Top management support, Project management, Business process reengineering, Suitability of systems, Education and training, User involvement
Quantitative survey Questionnaire distributed to Finnish firms
Jiang (2005)
Business process reengineering, Organization size, Existing IT systems maturity, National culture
Case study, qualitative approach
Interviews and supporting documentation from six Thai firms
Kanthawongs (2010)

Silpakorn U Science & Tech J Vol.8(1), 2014S. Duangekanong
21
The studies in Table 1 show a number of clusters of common factors, although these factors were often conceptualized slightly differently in different studies. The first is a cluster of cultural factors (leadership and management support, national and organizational culture, effective change management, and training and development).
A second cluster of factors concerned business needs and resources (cost and budget, availability of consulting resources, and technical capability). The third cluster focused on IT-related processes and resources (business process re-engineering, project management, and existing IT systems). Overall, little attention was given to business
Factors Studied Research Approach/Strategy
Data Gathering Method References
Top management support, Leadership,Training and development, Decision making, Power sharing, Communication,Risk and conflict tolerance
Theoretical discussion (secondary research)
Literature review Ke and Wei (2008)
Readiness for change, Perceived organizational commitment, Individual competence
Quantitative survey of 72 Korean organizations
Questionnaire (n = 312) Kwakh and Lee (2008)
Change management, Cultural readiness,Project implementation scope (controlled or exploratory vs. uncontrolled or revolutionary)
Case study, qualitative approach
Interviews and supporting documentation in two organizations
Motwani et al. (2002)
Change management, Cultural readiness,Network relationships
Exploratory case study, qualitative approach
Interviews and supplementary data (memos, reports, feasibility studies, and other documentation) from four firms (country not disclosed)
Motwani et al. (2005)
Functional performance, Acquisition cost, Operating cost, Ease of use, Reliability, Serviceability, Compatibility
Case study, qualitative approach
Interviews with managers and secondary data in two Thai organizations
Suebsin and Gerdsri (2009)
Cultural factors (partnership, business process reengineering, human resources, reports and tables, language), Environmental factors (price, cost control)
Case study, qualitative approach
Interviews in five Chinese firms with failed ERP implementations
Xue et al. (2005)
Cultural issues, Technical capability, Business process reengineering
Case study, qualitative approach
Interviews and secondary documentation from a single firm (Rolls-Royce) that had a troubled, though ultimately successful, ERP implementation
Yusuf et al. (2004)
Table 1 An overview of previous studies of ERP implementation (continued)
Silpakorn U Science & Tech J Vol.8(1), 2014 Factors Influencing the Success of an ERP System
22
requirements although a few studies mentioned system integration needs (Arunthari and Hasan, 2005), feasibility evaluation (Ehie and Madsen, 2005), and organizational commitment (Kwahk and Lee, 2008). Factors were studied primarily as qualitative constructs and the number of quantitative studies was relatively small. Models and Model Variables An influential model of the success of the adoption of an information system in an organization is the DeLone and McLean (1992) model (D&M). This model was based on a comprehensive review of information system success frameworks that had been used up to the early 1990s in an attempt to identify critical success factors. The initial model specification involved the variables System Quality, Information Quality, Use, and User Satisfaction as determinants of User Impact, which in turn affected Organizational Impact. The D&M model has not remained static and its development continued with empirical testing and the identification of additional success factors and relationships. Seddon and Kiew (1996) confirmed the importance of three variables (System Quality, Information Quality, and Importance of the System) as determinants of User Satisfaction directly or indirectly through their influence of Usefulness. Seddon (1997) further simplified and respecified the D&M model in order to eliminate ambiguous or duplicated meanings of the constructs and to provide measurable constructs that could be more easily tested. This respecification was required because at the time there were several different notions for the variable Use in the D&M model (Seddon, 1997). Seddon found that the D&M model combined and confused process and output variables making it unclear as to what were intended to be the outputs from model. Ultimately, Seddon concluded that the original D&M model represented at least three distinct concepts of use and success.
By respecifying the model in an empirically testable way Seddon (1997) created a more usable model of information systems success which was influential in the development of the theoretical model used in this study. A recent comprehensive literature review by Petter et al. (2008) of 180 studies using the D&M model found that Seddon (1997) was not alone in identifying the need to respecify and reconfigure this foundational model. Some other variations of the D&M model have included the addition of constructs such as Service Quality, and Net Benefits (Petter et al., 2008). Petter et al. (2008) also found that various researchers had proposed and tested a number of different relationships between the upstream variables (System Quality, Information Quality, Perceived Usefulness, and User Satisfaction) and downstream variables (Individual Impact and Organizational Impact) in the D&M model or Net Benefits in the Seddon (1997) respecification. Changes to the D&M model have met with varying success. However, the outcomes of Seddon’s (1997) respecification related to the use of a set of variables addressing Net Benefits other than only individual and organizational impacts were included in a combined model by Petter et al. (2008). In addition to the role of System Quality, Information Quality, and Perceived Usefulness in explaining User Satisfaction Seddon’s (1997) respecification of the D&M model allows for the inclusion of behavioral constructs as part of the explanation. However, it does not specify in detail which behavioral constructs should be used. Based on the overview of previous studies of ERP systems (Table 1) three behavioral critical success factors were identified (Top Management Support, Business Process Reengineering, and Education and Training). In previous studies Top Management Support was established as a factor that contributed to the

Silpakorn U Science & Tech J Vol.8(1), 2014S. Duangekanong
23
success or failure of the ERP implementation process. It had a positive influence on Perceived Usefulness and User Satisfaction (Seddon, 1997) and Ifinedo (2008) and Umble et al. (2003) found that it had a positive effect on System Quality. Business Process Reengineering was an acknowledged part of an ERP implementation, as well as other organizational change processes. It can significantly shift the organization’s work routines and practices through the stages of: identifying vision, business objectives, and processes; measuring existing processes and understanding how information technology can be used as a lever for improvement; and then making and testing changes to the new process (Swamidass, 2000). Business Process Reengineering can be prone to failure, particularly if there is insufficient attention paid to existing processes and the role of information technology within them, if change management is insufficient, or if other opportunities for process involvement are missed (Eardley et al.,
2008). Seddon (1997) identified the positive influence of Business Process Reengineering on User Satisfaction and its positive influences on Perceived Usefulness and System Quality were suggested by Finney and Corbett (2007). Although effects of Education and Training were not described by Seddon (1997) they were identified in several studies related to ERP systems (Ehie and Madsen, 2005; Finney and Corbett, 2007; Jiang, 2005; Ke and Wei, 2008). It has been identified to have important positive influences on Perceived Usefulness and User Satisfaction. Based on the overview of previous studies (Table 1), the respecification of the D&M model by Seddon (1997), and the identification of behavioral constructs (Top Management Support, Business Process Reengineering, and Education and Training) a theoretical model aimed at determining User Satisfaction was formulated.
Figure 1 Theoretical model

Silpakorn U Science & Tech J Vol.8(1), 2014 Factors Influencing the Success of an ERP System
24
Theoretical Model The theoretical model is shown in Figure 1. The model is notated to indicate the direct causal effects associated with the 18 research hypotheses in Table 2. The theoretical model in Figure 1 was strongly influenced by the detailed restructuring of the DeLone and McLean (2003) model of information systems success by Seddon and Kiew (1996) and Seddon (1997). This is evident in the
effects among the four variables System Quality, Information Quality, Perceived Usefulness, and User Satisfaction. In addition, the model incorporates three variables (Business Process Reengineering, Top Management Support, and Education and Training) which represent important critical success factors identified in previous studies to have an influence on at least two of the three variables (System Quality, Perceived Usefulness, and User Satisfaction).
Table 3 presents the operational definition used for each of the seven variables in the theoretical
model. References to previous studies are included as the sources for the definitions.
Table 2 Research hypotheses associated with the theoretical model
Research Hypothesis Reference
H1: System Quality has a significant positive direct effect on Perceived Usefulness
Seddon (1997), Seddon and Kiew (1996)
H2: System Quality has a significant positive direct effect on User Satisfaction
Seddon (1997), Seddon and Kiew (1996), DeLone and McLean (2003)
H3: Information Quality has a significant positive direct effect on Perceived Usefulness
Seddon (1997), Seddon and Kiew (1996)
H4: Information Quality has a significant positive direct effect on User Satisfaction
Seddon (1997), Seddon and Kiew (1996)
H5: Perceived Usefulness has a significant positive direct effect on User Satisfaction
Seddon (1997), Seddon and Kiew (1996)
H6: Business Process Reengineering has a significant positive direct effect on System Quality
Swamidass (2000), Eardley et al. (2008), Finney and Corbett (2007)
H7: Business Process Reengineering has a significant positive direct effect on Perceived Usefulness
Finney and Corbett (2007), Aldammas and Al-Mudimigh (2011)
H8: Business Process Reengineering has a significant positive direct effect on User Satisfaction
Seddon (1997)
H9: Top Management Support has a significant positive direct effect on System Quality
Umble, et al. (2003), Ifinedo (2008)
H10: Top Management Support has a significant positive direct effect on Perceived Usefulness
Seddon (1997), Aldammas and Al-Mudimigh (2011), Motwani et al. (2002)
H11: Top Management Support has a significant positive direct effect on User Satisfaction
Seddon (1997)
H12: Education and Training has a significant positive direct effect on Perceived Usefulness
Jiang (2005), Arunthari and Hasan (2005)
H13: Education and Training has a significant positive direct effect on User Satisfaction
Arunthari and Hasan (2005)
Note: Significant effects are statistically significant at a level of 0.05 or less.

Silpakorn U Science & Tech J Vol.8(1), 2014S. Duangekanong
25
Table 4 shows details associated with the measurement of each of the seven variables in the theoretical model. Labels for the variables are shown with references to existing measuring instruments
which were used as sources for the questions and measurement scales used in the study questionnaire (Appendix A1).
Table 3 Operational definitions and labels for model variables
Categories of Variables
Variable Operational Definition References
Critical Success Factors
Top Management
Support
The extent to which the ERP project received approval and support from top management.
Aldammas and Al-Mudimigh, (2011), Ehie and Madsen (2005), Jiang (2005), Ke and Wei (2008), Umble, et al. (2003)
Business Process
Reengineering
The extent to which the organization’s business processes were reengineered to align with the ERP system software.
Aldammas and Al-Mudimigh (2011), Arunthari and Hasan (2005), Ehie and Madsen (2005), Jiang (2005), Kanthawongs (2010), Xue, et al. (2005), Yusuf, et al. (2004)
Education and Training
The extent to which ERP concepts were introduced to users and training was provided on features of the ERP software.
Ehie and Madsen (2005), Finney and Corbett (2007), Jiang (2005), Ke and Wei (2008)
Information and System
Quality
Information Quality
The extent to which an individual believes that the information produced by the ERP system meets their needs and is relevant, comprehensible, accurate, complete, reliable, and timely.
DeLone and McLean (1992), DeLone and McLean (2003), Seddon and Kiew (1996), Seddon (1997)
System Quality
The extent to which and individual believes that the ERP system is well documented, easy to use and learn, user friendly, accessible, and free of bugs.
DeLone and McLean (1992), DeLone and McLean (2003), Seddon and Kiew (1996), Seddon (1997)
Net Benefits Perceived Usefulness
The extent to which an individual believes that using the ERP system has enhanced their job performance, increased their productivity at work, and made them more effective in their work.
Seddon and Kiew (1996), DeLone and McLean (2003), Seddon (1997), Davis (1989)
User Satisfaction
The user’s overall level of satisfaction with the efficiency and effectiveness of the ERP system and the manner in which the system satisfies their information processing needs.
Seddon (1997), DeLone and McLean (2003), Seddon and Kiew (1996)

Silpakorn U Science & Tech J Vol.8(1), 2014 Factors Influencing the Success of an ERP System
26
In Table 4 each of the three interval scale variables was measured on a five-point Likert scale with the measures treated as interval scale measures in the analyses. For the four latent variables each indicator was measured on a five-point Likert scale with the measures treated as interval scale measures in the analyses. Research Design and Methodology The research was: partly basic and applied; partly descriptive and explanatory; and cross-sectional in time. The study used descriptive statistical techniques for data preparation and analysis and structural equation modeling (SEM) techniques for the analysis and further development of a theoretical model which was derived from existing theory. The target population was individuals that were involved with an ERP system implemented in the largest pig farming and processing organization in northern Thailand. These individuals had variable levels of involvement with the ERP system so it was decided that in addition they must be full-time or part-time employees of the organization or government advisers who worked with the company and its subsidiaries to implement the ERP system. Individuals must be: at least 18 years of age; have at least one year of work experience; and have at least one year of experience with the ERP system. These
constraints aimed to ensure that the participants understood organizational practices and procedures with some understanding of the potential issues that faced the organization and sufficient knowledge and experience related to the ERP system. The size of this target population was estimated to be 300-350 individuals. Based on a level of precision of 0.05 and a 95 percent confidence interval the sample size for the study was determined to be at least 180 (Israel, 2013). This minimum sample size also ensured the statistical validity of the SEM and other statistical techniques used in the data analysis (Kline, 2005). A self-administered questionnaire was prepared in the English language in order to measure characteristics of the respondents and the variables in the theoretical model. The questionnaire was reviewed by a focus group of five individuals with expertise in questionnaire design and knowledge of the organization and the ERP system. Suggested modifications were included in a revised version of the questionnaire which was then administered in a pretest study using a sample of 10 suitable participants. Their responses and comments were noted and any modifications were incorporated into the final version of the questionnaire which was then used in the full study. A notated version of the questionnaire is included in Appendix A1.
Table 4 Measurement of model variables
Variable (Label) Measuring InstrumentInterval Scale VariablesTop Management Support (TMS) Yingjie (2005)Business Process Reengineering (BPR) Yingjie (2005)Education and Training (ET) Yingjie (2005)Latent Variables Number of Indicators and
Labels Information Quality (IQ) 10 indicators; IQ1 to IQ10 Seddon and Kiew (1996)System Quality (SQ) 8 indicators; SQ1 to SQ8 Seddon and Kiew (1996)Perceived Usefulness (PU) 6 indicators; PU1 to PU6 Seddon and Kiew (1996)User Satisfaction (US) 4 indictors; US1 to US4 Seddon and Kiew (1996)
Silpakorn U Science & Tech J Vol.8(1), 2014S. Duangekanong
27
It was possible to distribute questionnaires to almost the entire target population by making contact with participants through access provided by the organization. Questionnaires were made available in both hard and soft copy forms and a cover letter introduced the purpose of the study and provided instructions for its completion and return and a contact address for enquiries. Three hundred and twenty two questionnaires were returned and among these 23 were from respondents with less than one year of experience with the ERP system and this group also included all of the 11 respondents who had less than one year of work experience. None of the respondents was less than 18 years of age. These 23 respondents were removed from the sample leaving a sample size of 299. Data was entered into an SPSS (Version 19) worksheet and a random 10 percent of the responses were checked for accuracy of data entry and no errors were found. Nineteen questionnaires were found to include at least one outlier value for a model variable (i.e. a value 3 or more standard deviations from the mean). These 19 questionnaires were removed from the sample to give a final sample size of 280 which satisfied the minimum sample size of 180 described above.
Data Preparation and Preliminary Analyses Data Preparation Principal Component factor analysis was used to test the construct (discriminant and convergent) validity of the measures of the latent model variables. Satisfactory construct validity required that each latent variable was measured by a set of indicators with factor loadings of magnitude at least 0.4 and an associated eigenvalue of at least 1 (Straub et al., 2004). The results for the final factor analysis are shown in Appendix Table A1 where it is seen that some of the indicators for Information Quality (7), System Quality (5), and Perceived
Usefulness (3) were deleted because they did not meet the requirements for satisfactory construct validity. However, among the four latent variables in the model each was measured finally using at least three indicators with satisfactory construct validity. The internal consistency reliability of the indicators for the latent variables which displayed satisfactory construct validity was measured using Cronbach alpha coefficients. The coefficients are shown in Appendix Table A2 and the reliability of the sets of indicators was at least acceptable and mainly good (George and Mallery, 2003). Characteristics of Respondents Appendix Table A3 displays personal and work characteristics of the respondents determined from the responses to the items in section 1 of the questionnaire. The sample of 280 individuals included 153 males (55 percent) and 127 females (45 percent). The average age of respondents was 39 years with respondents mainly in the age categories 33-37 years (25 percent) and 38-42 years (20 percent) and 75 percent were between age 28 years and age 47 years. The sizes of the age groups were consistent with the age groups in the Thai population as a whole (NationMaster, 2013a). Sixty percent of the respondents had a Bachelor degree and all of the respondents had a Bachelor degree or higher. Thus the respondents were well educated particularly in comparison to the Thai population as a whole where the rate of tertiary education in Thailand is currently 36 percent (NationMaster, 2013b). In summary, the sample was approximately evenly divided between male and female respondents, the respondents were close to a mid-point in their careers according to their age, and they were well educated compared to the population as a whole. In terms of work characteristics the employees of the organization were divided almost equally between full-time (46 percent) and part-time (49

Silpakorn U Science & Tech J Vol.8(1), 2014 Factors Influencing the Success of an ERP System
28
percent) employment and only 5 percent of the respondents were government advisors. With regard to work experience 44 percent had less than five years experience and a further 39 percent had 5-10 years experience but only 17 percent had 10 years or more experience. This was consistent with age distribution of the respondents, their educational status, and their career stage. There was a very shallow depth of experience with ERP systems. Sixty three percent had less than five years experience with ERP systems and all of the respondents had less than 10 years experience. However, this was expected given that ERP systems were a relatively new innovation in Thailand and it was consistent with the respondents’ levels of work experience. In summary, the work characteristics of the participants indicated that: most were full-time or part-time employees of the organization with only a small number of government advisors; most had less than 10 years work experience; and most had less than five years experience with ERP systems. Descriptive Analysis of Model Variables Appendix Table A4 shows the values of descriptive statistics for each of the model variables. In the case of the four latent variables these statistics are shown for each of the indicators. In addition, each of the four latent variables was reduced to a single interval scale variable with values determined for each respondent by taking the mean of the values that the respondent assigned to the indicators. Descriptive statistics for these single interval scale measures of the four latent variables are also shown in Table A4. These simplified measures of the latent variables were used in the preliminary descriptive analyses presented in this section but the full set of measures for the indicators were used in the SEM analyses throughout section 6. From Appendix Table A4 it is seen that the magnitudes of the values for skewness and kurtosis are well within the acceptable limits of 3 and 7, respectively, required for the use
of maximum likelihood estimation in subsequent SEM analyses (Kline, 2005). The model variables and indicators were measured on 5-point Likert scales where 3 represented a neutral attitude to the construct being measured. T-tests showed that the mean values of all of the model variables and their indicators were significantly greater than a neutral value (p < 0.001). This indicated that the respondents expressed very positive attitudes towards the range of aspects of the ERP system measured by the model variables. T-tests were used to compare the mean values for males and females of the four profile variables (Age, Education, Work Experience, and ERP Experience) and the seven model variables. There was a statistically significant difference between males and females for only the two model variables Top Management Support and Business Process Reengineering and in both cases the mean for females was significantly greater than the mean for males (p < 0.01). Appendix Table A5 shows the correlations among profile and model variables. Not surprisingly, there were significant positive correlations (p < 0.05) among the profile variables Age, Level of Education, Work Experience, and ERP Systems Experience. Other significant correlations involving profile variables were between: both Level of Education and Work Experience and Information Quality; and Work Experience and both Top Management Support and User Satisfaction. There were significant positive correlations among the three critical success factors (Top Management Support, Business Process Reengineering, and Education and Training). There were significant correlations between Systems Quality and Perceived Usefulness and between Perceived Usefulness and User Satisfaction which were associated with causal effects in the theoretical model (Figure 1). Although significant correlations do not guarantee significant
Silpakorn U Science & Tech J Vol.8(1), 2014S. Duangekanong
29
causal effects they often suggest significant causal relationships and the causal relationships proposed in the theoretical model are examined in detail in the next section.
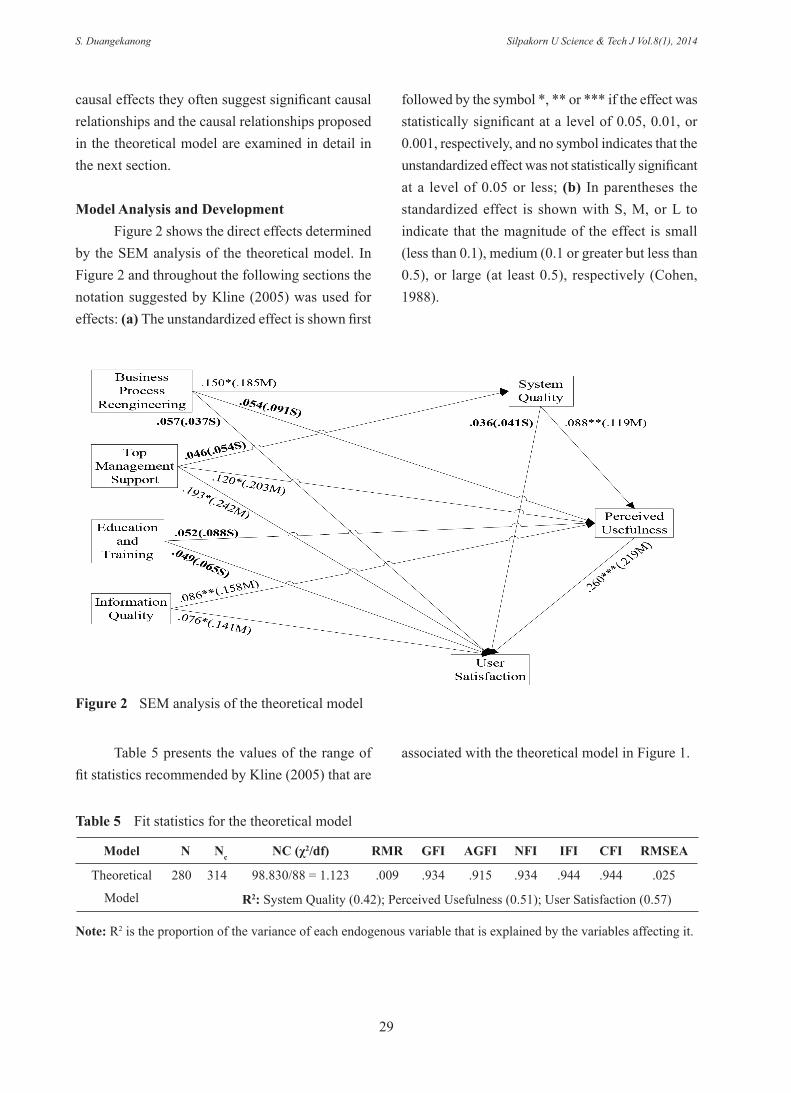
Model Analysis and Development Figure 2 shows the direct effects determined by the SEM analysis of the theoretical model. In Figure 2 and throughout the following sections the notation suggested by Kline (2005) was used for effects: (a) The unstandardized effect is shown first
followed by the symbol *, ** or *** if the effect was statistically significant at a level of 0.05, 0.01, or 0.001, respectively, and no symbol indicates that the unstandardized effect was not statistically significant at a level of 0.05 or less; (b) In parentheses the standardized effect is shown with S, M, or L to indicate that the magnitude of the effect is small (less than 0.1), medium (0.1 or greater but less than 0.5), or large (at least 0.5), respectively (Cohen, 1988).
Figure 2 SEM analysis of the theoretical model
Table 5 presents the values of the range of fit statistics recommended by Kline (2005) that are
associated with the theoretical model in Figure 1.
Table 5 Fit statistics for the theoretical model
Model N Nc NC (χ2/df) RMR GFI AGFI NFI IFI CFI RMSEA
Theoretical
Model
280 314 98.830/88 = 1.123 .009 .934 .915 .934 .944 .944 .025
R2: System Quality (0.42); Perceived Usefulness (0.51); User Satisfaction (0.57)
Note: R2 is the proportion of the variance of each endogenous variable that is explained by the variables affecting it.

Silpakorn U Science & Tech J Vol.8(1), 2014 Factors Influencing the Success of an ERP System
30
From Table 5 it is seen that, although the fit statistics are reasonably satisfactory, in Figure 2 there are six highlighted direct effects that are small in magnitude and not statistically significant at a level of 0.05 or less. This raises the possibility that their removal from the theoretical model may produce a simpler model with an improved set of fit statistics. The six direct effects were made optional
and, using the specification search facility in Amos 18 computer software, the resulting hierarchy of 26 (64) models was analyzed and in accordance with the recommendation by Kline (2005) the model with the smallest value for Normed Chi-square (NC) was selected as the final model shown in Figure 3 with the fit statistics in Table 6.
Figure 3 Final model
From Figure 3 it is seen that four of the six direct effects in the theoretical model which were considered for removal remained in the final model and all of the direct effects in the final model are medium in magnitude and statistically significant at a level of 0.05 or less. From Table 6 it is seen that the final model has very acceptable and improved fit statistics and reasonable proportions of the variance
of the endogenous variables are explained. All the effects in the final model are shown
in Table 7 where: (a) the variables on indirect paths are shown; (b) the same notations are used for effects as used in Figures 2 and 3; and (c) all of the effects are statistically significant at a level of 0.05 or less. The determination of the statistical significance of effects followed the methods proposed by Sobel
Table 6 Fit statistics for the final model
Model N Nc NC (χ2/df) RMR GFI AGFI NFI IFI CFI RMSEAFinal
Model
280 313 102.948/92 = 1.119 .008 .957 .936 .958 .994 .994 .021R2: System Quality (0.43); Perceived Usefulness (0.58); User Satisfaction (0.61)
Note: R2 is the proportion of the variance of each endogenous variable that is explained by the variables affecting it.

Silpakorn U Science & Tech J Vol.8(1), 2014S. Duangekanong
31
(1986) for indirect effects with one intervening variable, Cohen and Cohen (1983) for indirect effects with more than one intervening variable,
and the results of nonparametric bootstrapping with Amos 18 using 1,000 random samples for the totals of indirect effects and the totals of all effects.
Table 7 Analysis of the final model
Variable EffectIntervening Dependent
System Quality Perceived Usefulness User Satisfaction
Exogenous
Business
Process
Reengineering
Direct .183*(.190M) Nil Nil
Indirect NilBPR-SQ-PU
.017*(.023S)
BPR-SQ-US
.017*(.027S)
BPR-SQ-PU-US
.004*(.005S)Total Indirect Nil 017*(.023S) .021*(.032S)Total .183*(.190M) 017*(.023S) 021*(.032S)
Top
Management
Support
Direct Nil .139**(.206M) .184**(.201M)
Indirect Nil NilTMS-PU-US
.034**(.042S)Total Indirect Nil Nil .034**(.042S)Total Nil .139**(.206M) .218**(.243M)
Education
and
Training
Direct Nil .067*(.107M) Nil
Indirect Nil NilET-PU-US
.016*(.022S)Total Indirect Nil Nil .016*(.022S)Total Nil .067*(.107M) .016*(.022S)
Information
Quality
Direct Nil .088**(.180M) .078*(.106M)
Indirect Nil NilIQ-PU-US
.022**(.037S)Total Indirect Nil Nil .022**(.037S)Total Nil .088**(.180M) .100*(.143M)
Intervening
System
Quality
Direct Nil .093*(.126M) .095**(.140M)
Indirect Nil NilSQ-PU-US
.023*(.026S)Total Indirect Nil Nil .023*(.026S)Total Nil .093*(.126M) .118*(.166M)
Perceived
Usefulness
Direct Nil Nil .245**(.206M)Indirect Nil Nil NilTotal Indirect Nil Nil NilTotal Nil Nil .245**(.206M)

Silpakorn U Science & Tech J Vol.8(1), 2014 Factors Influencing the Success of an ERP System
32
Discussion of the Findings Characteristics of the Respondents The characteristics of the respondents identified them as sufficiently qualified, experienced, and mature to be able to provide answers to the issues raised about the ERP system and its implementation in the questionnaire. Respondents indicated a very positive attitude to the features of the ERP system and the issues concerned with its implementation. There were only two variables (Top Management Support and Business Process Reengineering) where there was a significant difference between the male and female respondents. Although both groups considered that these two critical success factors had been addressed very well as part of the ERP system implementation the females felt this more so than
the males. Correlations showed expected significant positive associations among the respondents: ages, levels of education, amounts of work experience, and amounts of ERP experience. In addition, those with high (low) levels of education or with more (less) work experience considered the quality of the information provided by the ERP system to be high (low). Also, those with more (less) work experience considered the level of top management approval and support for the ERP project to be high (low) and expressed high (low) overall satisfaction with the ERP system. Interpretation of Causal Effects Table 8 presents the effects in the final model based on the total effects shown in Table 7.
The final model included a single dependent variable User Satisfaction defined as the level of satisfaction with the efficiency and effectiveness of the system and the manner in which the system satisfies the user’s information processing needs. Top Management Support had the most
important influence on User Satisfaction followed in decreasing order of importance by the medium effects of Perceived Usefulness, System Quality, and Information Quality, and finally the small effects due to Business Process Reengineering and Education and Training.
Table 8 Summary of effects in the final model
VariableIntervening Variable Dependent Variable
System Quality Perceived Usefulness User Satisfaction
Exogenous Variable
Business Process ReengineeringMedium,
only directSmall,
only indirectSmall,
only indirect
Top Management Support NilMedium,
only directMedium,
mainly direct
Education and Training NilMedium,
only directSmall,
only indirect
Information Quality NilMedium,
only directMedium,
mainly direct
Intervening Variable
System Quality NilMedium,
only directMedium,
mainly direct
Perceived Usefulness Nil NilMedium,
only direct
Note: All effects are statistically significant at a level of 0.05 or less and all effects are positive.

Silpakorn U Science & Tech J Vol.8(1), 2014S. Duangekanong
33
There were two intervening variables (Perceived Usefulness and System Quality). Perceived Usefulness was defined as the perception that the ERP system enhanced job performance, productivity and effectiveness. Perceived Usefulness only influenced User Satisfaction but as an intervening variable it was involved in the indirect effects of all of the other variables on User Satisfaction. The influences on Perceived Usefulness in decreasing order of importance were due to the medium effects of Top Management Support, Information Quality, System Quality, and Education and Training as well as the small effect of Business Process Reengineering. The other intervening variable System Quality referred to the extent to which an individual found the ERP system to be well-documented, easy to use and learn, user-friendly, accessible, and bug-free. It only had effects on User Satisfaction and Perceived Usefulness both of which were medium and the effect on User Satisfaction was larger. The only variable that had an influence on System Quality was Business Process Reengineering and it was medium and direct. There were four exogenous independent variables (Business Process Reengineering, Top Management Support, Education and Training, and Information Quality) and they influenced at least one of the intervening variables. The first three variables represented critical success factors and they are discussed first. Business Process Reengineering was defined as a process of analysis and redesign of business processes in order to improve efficiency,
reduce redundancy, and fit outlines of tasks to specific requirements of the ERP system. Business Process Reengineering only had indirect small effects on Perceived Usefulness and User Satisfaction but as noted it was the only variable to have an effect on Systems Quality. Top Management Support was defined as vocal and material support for the ERP implementation process. As noted above Top Management Support had important medium effects on User Satisfaction and Perceived Usefulness. Education and Training referred to the pre and post-implementation provision of information about the new ERP system and the ways it could be used. Education and training had a small effect on User Satisfaction, similar to that of Business Process Reengineering, but it had a direct medium effect on Perceived Usefulness. The other exogenous variable was Information Quality which was defined as the extent to which the individual finds the information produced by the ERP system relevant, comprehensible, accurate, complete, and timely. Information Quality, like Top Management Support, had medium effects on Perceived Usefulness and User Satisfaction. Comparison of the Findings with those from Previous Studies There were thirteen hypotheses (Table 2) associated with direct effects among the variables in the theoretical model. Tables 9(a), (b), and (c) summarize the hypotheses that were fully supported, partially supported, or not supported, respectively.

Silpakorn U Science & Tech J Vol.8(1), 2014 Factors Influencing the Success of an ERP System
34
Table 9(a) Hypotheses supported by the findings
Research Hypothesis SourceMagnitude of the
EffectH1: System Quality has a significant positive direct effect on Perceived Usefulness
Seddon (1997), Seddon and Kiew (1996) Medium
H2: System Quality has a significant positive direct effect on User Satisfaction
Seddon (1997), Seddon and Kiew (1996), DeLone and McLean (2003)
Medium
H3: Information Quality has a significant positive direct effect on Perceived Usefulness
Seddon (1997), Seddon and Kiew (1996) Medium
H4: Information Quality has a significant positive direct effect on User Satisfaction
Seddon (1997), Seddon and Kiew (1996) Medium
H5: Perceived Usefulness has a significant positive direct effect on User Satisfaction
Seddon (1997), Seddon and Kiew (1996) Medium
H6: Business Process Reengineering has a significant positive direct effect on System Quality
Swamidass (2000), Eardley et al. (2008), Finney and Corbett (2007)
Medium
H10: Top Management Support has a significant positive direct effect on Perceived Usefulness
Seddon (1997), Aldammas and Al-Mudimigh (2011), Motwani et al. (2002)
Medium
H11: Top Management Support has a significant positive direct effect on User Satisfaction
Seddon (1997) Medium
H12: Education and Training has a significant positive direct effect on Perceived Usefulness
Jiang (2005), Arunthari and Hasan (2005)
Medium
From Table 9(a) it is seen that there was full support for nine of the 13 hypotheses proposed in the theoretical model. Hypotheses 1 through 5 and hypotheses 10 and 11 were directly based on either the original model of information systems adoption success proposed by DeLone and McLean (D&M) (1992) or the reformulations by Seddon and Kiew (1996) and Seddon (1997) which introduced the effects of Top Management Support specified in hypotheses 10 and 11. The support for these nine hypotheses confirmed a basic level of validity in the Seddon (1997) reformulation of the D&M model.
Hypotheses 6 and 12 concerned causal effects due to the two exogenous variables Business Process Reengineering and Education and Training, respectively. Business Process Reengineering was
a factor that was specific to ERP systems and referred to preparatory activity that is required for success. Thus it was expected to have a significant positive direct effect on System Quality since it is a process that is directly designed to improve system quality. Education and Training had a significant positive direct effect on Perceived Usefulness as proposed by Arunthari and Hasan (2005) and Jiang (2005). The support for Hypotheses 6 and 12 was compatible with the general notion in the literature that preparing the workforce for the introduction of the ERP system through education and training and the realignment of work practices to better fit the ERP system have important positive influences on the users’ perceptions of the usefulness of the system and its quality.
Silpakorn U Science & Tech J Vol.8(1), 2014S. Duangekanong
35
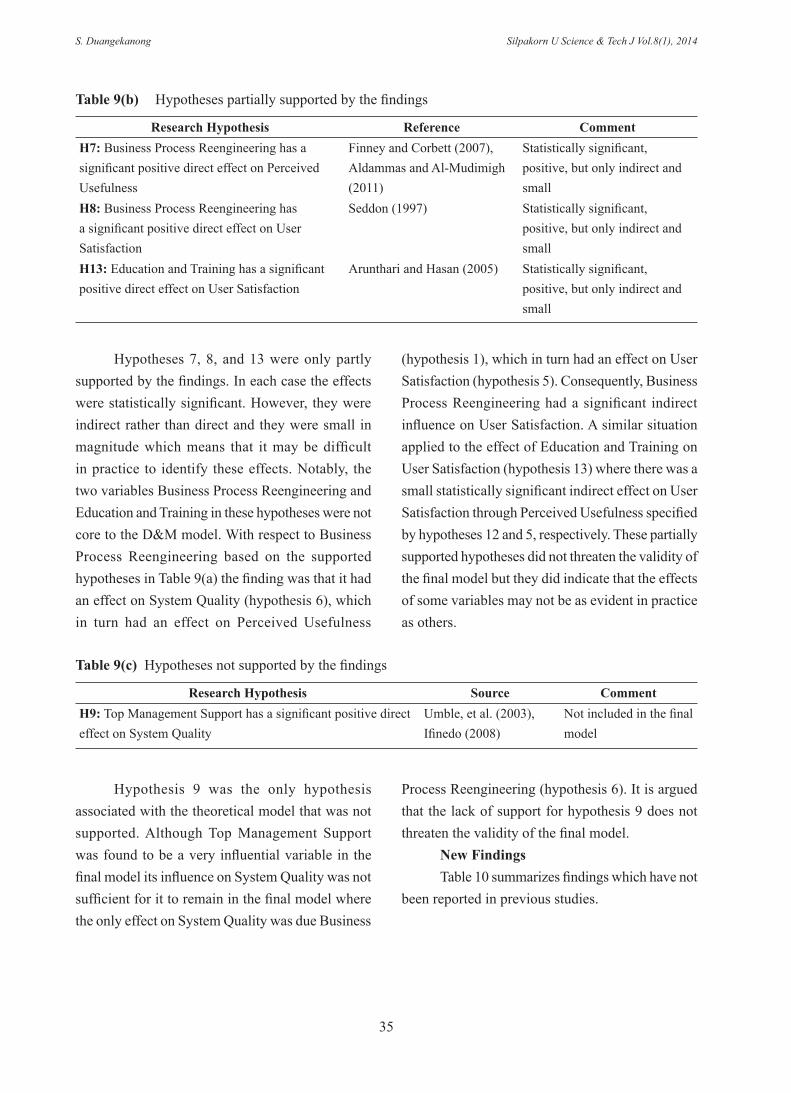
Hypotheses 7, 8, and 13 were only partly supported by the findings. In each case the effects were statistically significant. However, they were indirect rather than direct and they were small in magnitude which means that it may be difficult in practice to identify these effects. Notably, the two variables Business Process Reengineering and Education and Training in these hypotheses were not core to the D&M model. With respect to Business Process Reengineering based on the supported hypotheses in Table 9(a) the finding was that it had an effect on System Quality (hypothesis 6), which in turn had an effect on Perceived Usefulness
(hypothesis 1), which in turn had an effect on User Satisfaction (hypothesis 5). Consequently, Business Process Reengineering had a significant indirect influence on User Satisfaction. A similar situation applied to the effect of Education and Training on User Satisfaction (hypothesis 13) where there was a small statistically significant indirect effect on User Satisfaction through Perceived Usefulness specified by hypotheses 12 and 5, respectively. These partially supported hypotheses did not threaten the validity of the final model but they did indicate that the effects of some variables may not be as evident in practice as others.
Hypothesis 9 was the only hypothesis associated with the theoretical model that was not supported. Although Top Management Support was found to be a very influential variable in the final model its influence on System Quality was not sufficient for it to remain in the final model where the only effect on System Quality was due Business
Process Reengineering (hypothesis 6). It is argued that the lack of support for hypothesis 9 does not threaten the validity of the final model. New Findings Table 10 summarizes findings which have not been reported in previous studies.
Table 9(c) Hypotheses not supported by the findings
Research Hypothesis Source CommentH9: Top Management Support has a significant positive direct effect on System Quality
Umble, et al. (2003), Ifinedo (2008)
Not included in the final model
Table 9(b) Hypotheses partially supported by the findings
Research Hypothesis Reference CommentH7: Business Process Reengineering has a significant positive direct effect on Perceived Usefulness
Finney and Corbett (2007), Aldammas and Al-Mudimigh (2011)
Statistically significant, positive, but only indirect and small
H8: Business Process Reengineering has a significant positive direct effect on User Satisfaction
Seddon (1997) Statistically significant, positive, but only indirect and small
H13: Education and Training has a significant positive direct effect on User Satisfaction
Arunthari and Hasan (2005) Statistically significant, positive, but only indirect and small

Silpakorn U Science & Tech J Vol.8(1), 2014 Factors Influencing the Success of an ERP System
36
As shown in Table 10, most of the unexpected findings were associated with small, positive, and indirect effects even though they were statistically significant. This means that they may be difficult to detect in practice. However, they do pose some avenues for further exploration of relationships among variables to be examined in subsequent studies. The strength of these relationships may vary in different contexts. Business Process Reengineering had small, positive, indirect effects on Perceived Usefulness and User Satisfaction and previous studies suggested that these effects would be direct (Aldammas & Al-Mudimigh, 2011; Finney & Corbett, 2007; Seddon, 1997). Instead, effects due to Business Process Reengineering resulted from its direct influence on System Quality which indicated that the relationships between Business Process Reengineering and the outcomes of an ERP implementation were not directly due to improvements in Perceived Usefulness or User Satisfaction. Instead, Business Process Reengineering served to improve perceptions about aspects of the performance of the system captured by the mediator System Quality, which in turn led to improved outcomes. Thus, Business Process Reengineering should be viewed as an important means of improving System Quality rather than
user centered outcomes directly. Top Management Support and Education and Training are both people related constructs and they did not have important influences on the performance oriented construct System Quality. Instead, both had important effects on the user centered construct Perceived Usefulness and, in particular, Top Management Support had a very important effect on User Satisfaction.
Conclusion The study aimed to develop theoretical knowledge with practical implications about factors that influence the extent to which users are satisfied with an ERP system. The theoretical contribution has been discussed in detail in the preceding section and it may be concluded that the findings were largely consistent with the findings of previous studies and with theoretical models of information systems adoption success. The practical implications of the findings are explained in the following Table 11 where the findings have been deconstructed into a hierarchy of practical objectives each with an associated hierarchy of actions arranged in decreasing order of their likely effect on the achievement of the objective.
Table 10 Summary of new findings
Exogenous VariableIntervening Variable Dependent Variable
System Quality Perceived Usefulness User SatisfactionBusiness Process
Reengineering-
Small, positive, only
indirectSmall, positive, only indirect
Top Management SupportNot included in the final
model- -
Education and TrainingNot included in the final
model- Small, positive, only indirect

Silpakorn U Science & Tech J Vol.8(1), 2014S. Duangekanong
37
Table 11 Hierarchies of practical objectives and actions
Objective ActionRelevant Model
Variable
Primary Objective: Increase the user’s satisfaction with the ERP system
1.1 Ensure that there is support for senior management for the ERP project.
Top Management Support
1.2 Ensure that users perceive the ERP system to be useful. See Secondary Objective 1.
Perceived Usefulness
1.3 Ensure that users perceive that the ERP system is of high quality. See Secondary Objective 2.
System Quality
1.4 Ensure that users perceive that the information provided by the ERP system is of high quality.
Information Quality
1.5 Conduct appropriate business process reengineering as part of the ERP project.
Business Process Reengineering
1.6 Provide users with appropriate education and training to use the ERP system.
Education and Training
Secondary Objective 1: Increase the user’s perception that the ERP system is useful.
2.1 Ensure that there is support for senior management for the ERP project.
Top Management Support
2.2 Ensure that users perceive that the information provided by the ERP system is of high quality.
Information Quality
2.3 Ensure that users perceive that the ERP system is of high quality. See Secondary Objective 2.
System Quality
2.4 Provide users with appropriate education and training to use the ERP system.
Education and Training
2.5 Conduct appropriate business process reengineering as part of the ERP project.
Business Process Reengineering
Secondary Objective 2: Ensure that users perceive that the ERP system is of high quality.
3.1 Conduct appropriate business process reengineering as part of the ERP project.
Business Process Reengineering
The information in Table 11 offers important practical information for managers and others on the range of issues that need attention for an effective ERP system implementation. The importance of education and training for staff members is particularly important. As the literature review and research has shown, the benefits of ERP implementation cannot be realized if the staff members intended to use the system cannot do so because they do not know how. Courses such as Basic ERP Use, ERP Reporting, and others of concern to the users would be very helpful. Providing extensive training in the use of
the ERP system, whether this is through in-house or outsourced programs, is essential for success. This study did not set out to conduct an in-depth examination of implementation success factors from a technical perspective (e.g. user interface selection and design, network and database design, and other technical aspects) and further studies that consider these technical implementation issues would complement the findings from this study and provide further information on how an organization can engage in a successful ERP system implementation. There has not been much

Silpakorn U Science & Tech J Vol.8(1), 2014 Factors Influencing the Success of an ERP System
38
research done on ERP implementation in Thailand, which means that there could be a useful expansion of the current study into other industrial sectors. For example, the same study could be performed in the manufacturing sector, which is likely to be an area where ERP implementation is critical to organizational competitiveness. There is also the question of user benefits. To date, a limited amount of research has been done on user benefits of ERP implementation, as most research has focused on organizational benefits (Longinidis & Gotzamani, 2009). There is also the need for further research about the knowledge management (KM) plays in the effective implementation of ERP systems, which has also been under-examined in the literature. Such further studies may use the same research design but there are also some possible modifications. For example, additional exogenous variables may be identified in other contexts. The pool of respondents could also be widened, and this may result in an increased ability to detect effects. The repetition of this study and its expansion into other sectors may produce more generalizable outcomes than was possible from this single study and further test the validity and reliability of the measures and overall design of the study.
References Aberdeen Group. (2007) Aberdeen: 70% of top
companies use integrated ERP for order-to-cash cycle. [Online URL: www.ihs.com/news/aberdeen-integrated-erp.htm.] accessed on March 10, 2013.
Aldammas, A. and Al-Mudimigh, A. S. (2011) Critical success and failure factors of ERP implementations: Two cases from Kingdom of Saudi Arabia. Journal of Theoretical and Applied Information Technology 28(2): 73-82.
Arunthari, S. and Hasan, H. (2005) A grounded
study of ERP adoption and vendor selection in Thailand. ACIS 2005 Proceedings, (p. Paper 3).
Cohen, J. (1988) Statistical Power Analysis for the Behavioral Sciences, 2nd ed., Academic Press, New York.
Cohen, J. and Cohen, P. (1983) Applied Multiple Regression/correlation Analysis for the Behavioral Sciences, 3rd ed., Mahwah, NJ, Erlbaum.
Davis, F. (1989) Perceived usefulness, perceived ease of use, and user acceptance of information technology, MIS Quarterly: Management Information Systems 13: 319-339
DeLone, W. H. and McLean, E. R. (1992) Information systems success: The quest for the dependent variable. Information Systems Research 3: 60-95.
DeLone, W. H. and McLean, E. R. (2003) The DeLone and McLean model of information systems success: A ten-year update. Journal of Management Information Systems 19(4): 9-30.
Eardley, A., Shah, H., and Radman, A. (2008) A model for improving the role of IT in BPR. Business Process Management Journal 14(5): 629-653.
Ehie, I. C. and Madsen, M. (2005) Identifying critical issues in enterprise resource planning (ERP) implementation. Computers in Industry 56: 545-577.
Finney, S. and Corbett, M. (2007) ERP implementation: A compilation and analysis of critical success factors. Business Process Management Journal 13(3): 329-347.
George, D., Mallery, P., (2003) SPSS for Windows step by step: A simple guide and reference. 11.0 update, Allyn and Bacon, Boston.
Hawari, A. and Heeks, R. (2010) Explaining ERP failure in developing countries: A Jordanian

Silpakorn U Science & Tech J Vol.8(1), 2014S. Duangekanong
39
Case Study. Working Paper. Manchester, UK: Manchester Centre for Development Informatics.
Ifinedo, P. (2008) Impacts of business vision, top management support, and external expertise on ERP success. Business Process Management Journal 14(4): 551-568.
Israel, G. (2013) Determining sample size. [Online URL: www. edis.ifas.ufl.edu/pd006.] accessed on March 10, 2013.
Jiang, Y. (2005) Critical success factors in ERP implementation in Finland (Master’s thesis). Swedish School of Economics and Business Administration.
Kanthawongs, P. (2010) Organizational and cultural factors influencing ERP systems implementation in a developing country: Case studies from Thailand. IADIS International Conference e-Society 2010 (pp. 173-179).
Ke, W. and Wei, K. K. (2008) Organizational culture and leadership in ERP implementation. Decision Support Systems 45(2): 208-218.
Kline, R.B., (2005) Principles and Practice of Structural Equation Modeling, Guilford Press, London.
Kwahk, K. and Lee, J. (2008) The role of readiness for change in ERP implementation: Theoretical bases and empirical validation. Information and Management 45: 474-481.
Longinidis, P. and Gotzamani, K. (2009) ERP user satisfaction issues: Insights from a Greek industrial giant. Industrial Management and Data Systems 109(5): 628-645.
Monk, E. F. and Wagner, B. J. (2008) Concepts in Enterprise Resource Planning. Cengage Learning EMEA., London.
Motwani, J., Subramanian, R., and Gopalakrishna, P. (2005) Critical factors for successful ERP implementation: Exploratory findings from four case studies. Computers in Industry 56:
529-544.NationMaster. (2013a). Age Distribution, Thailand.
[Online URL:www.nationmaster.com/country/th/Age_distribution.] accessed on March 16, 2013.
NationMaster. (2013b). Education in Thailand. [Online URL:http://www.nationmaster.com/country/th-thailand/edu-education.] accessed on March 16, 2013.
Oliver, P. (2012) Suceeding with your literature review: A handbook for students. McGraw-Hill International, London.
Panorama Consulting. (2012) Clash of the titans: An independent comparison of SAP, Oracle, and Microsoft Dynamics. [Online URL: www.panorama-consulting.com/Documents/Clash-of-the-Titans-2012.pdf.] accessed on March 15, 2013.
Petter, S., DeLone, W., & McLean, E. (2008) Measuring information systems success: Models, dimensions, measures, and interrelationships. European Journal of Information Systems 17: 236-263.
Seddon, P. B. (1997). A respecification and extension of the DeLone and McLean model of IS success. Information Systems Research 8(3): 240-253.
Seddon, P. B. and Kiew, M. -Y. (1996) A partial test and development of Delone and McLean’s model of IS success. Australian Journal of Information Systems 4(1): 90-109.
Simon, P. (2010) The Next Wave of Technologies: Opportunities from Chaos. John Wiley & Sons, London.
Sobel, M. E. (1986) Some new results on indirect effects and their standard errorsin covariance structure models, In N. B. Tuma (Ed.), Sociological Methodology, San Francisco, Jossey-Bass, 159-186.
Straub, D., Boudreau, M-C., Gefen, D., (2004)

Silpakorn U Science & Tech J Vol.8(1), 2014 Factors Influencing the Success of an ERP System
40
Validation Guidelines for IS Positivist Research, Communications of the Association of Information Systems 13: 380-427.
Suebsin, C. and Gerdsri, N. (2009) Key factors driving the success of technology adoption: Case examples of ERP adoption. PICMET 2009 Proceedings, (pp. 2638-2643). Portland, Oregon, US.
Swamidass, P. M. (Ed.). (2000) Encyclopedia of Production and Manufacturing Management. Springer, London.
Umble, E. J., Haft, R. R., and Umble, M. M. (2003) Enterprise resource planning: Implementation
procedures and critical success factors. European Journal of Operational Research 146: 241-257.
Xue, Y., Liang, H., Boulton, W. R., and Snyder, C. A. (2005) ERP implementation failures in China: Case studies with implications for ERP vendors. International Journal of Production Economics 97: 279-295.
Yusuf, Y., Gunasekaran, A., and Abthorpe, M. S. (2004) Enterprise information systems project implementation: A case study of ERP in Rolls-Royce. International Journal of Production Economics 87: 251-266.
APPENDIX
A1. Notated QuestionnaireNotations include labels for variables/indicators and measuring scales. Section 1: Personal Information 1.1 Gender (G): □ Male (1) □ Female (2)1.2 Age in Years (A): □ 18-22 (20) □ 23-27 (25) □ 28-32 (30) □ 33-37 (35) □ 38-42 (40) □ 43-47 (45) □ 48-52 (50) □ 53-57 (55) □ 58-62 (60) □ more than 62 (65)1.3 What is your highest level of formal education (E)? □ High school (12) □ Bachelor degree (16) □ Master degree (18) □ Doctoral degree (22)1.4 Type of current work position in the organization (WP): □ Full-time (1) □ Part-time (2) □ Government advisor (3)1.5 Years of work experience (WE): □ Less than 1 year (1) □ 1 to less than 5 years (3) □ 5 to less than 10 years (8) □ 10 years or more (13) 1.6 Years of work experience in using the ERP system (SE): □ Less than 1 year (1) □ 1 to less than 5 years (3) □ 5 to less than 10 years (8) □ 10 years or more (13)
Section 2: A five-point measurement scale was used: (1) Very Bad (2) Bad (3) Neutral (4) Good (5) Excellent
Please check (√) the answer which is the best match with your opinion about the implementation of the ERP system: Top management support (TMS) refers to the fact that the ERP project needs to receive approval from top
management. Please rate the level of top management approval and support for the ERP project. Business process reengineering (BPR) refers to aligning the company’s business processes with the ERP software
that will be implemented. Please rate the degree of business process reengineering that occurred in the ERP project. Education and training (ET) refers to the introduction of the ERP concepts to the future users and to providing
training with regard to the features of the ERP software. Please rate the level of education and training provided in
the ERP project.
Silpakorn U Science & Tech J Vol.8(1), 2014S. Duangekanong
41
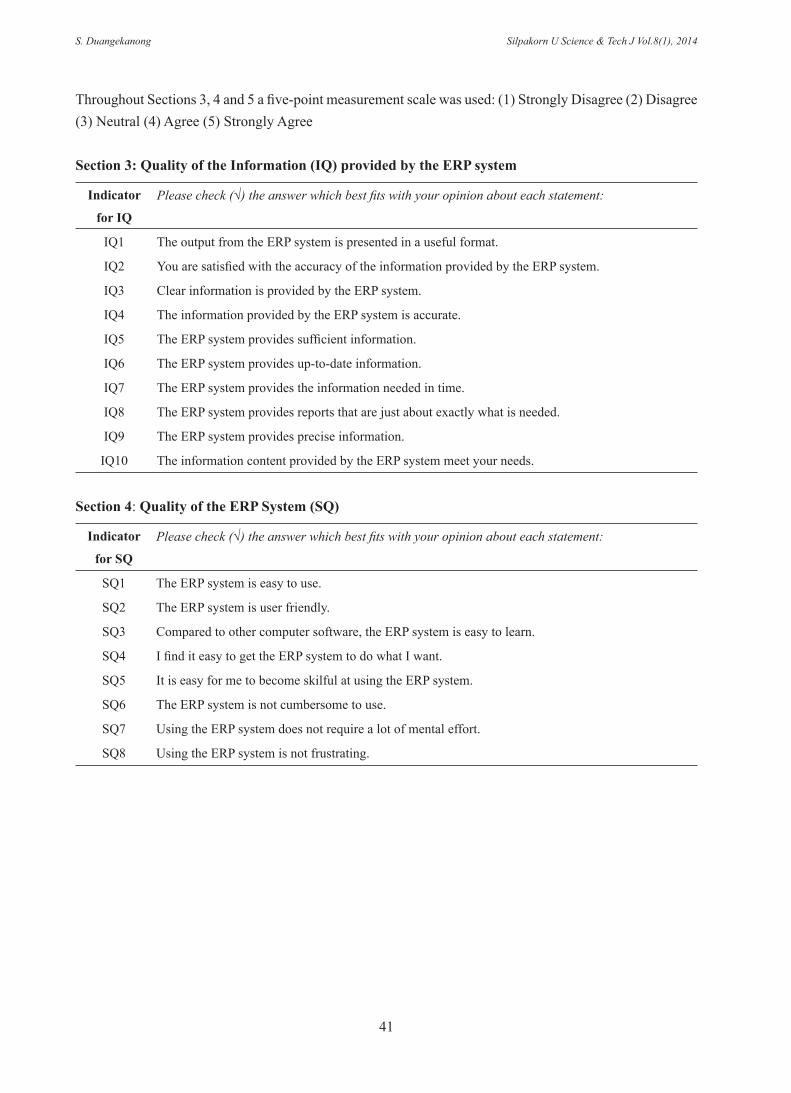
Throughout Sections 3, 4 and 5 a five-point measurement scale was used: (1) Strongly Disagree (2) Disagree (3) Neutral (4) Agree (5) Strongly Agree
Section 3: Quality of the Information (IQ) provided by the ERP system
Indicator
for IQ
Please check (√) the answer which best fits with your opinion about each statement:
IQ1 The output from the ERP system is presented in a useful format.
IQ2 You are satisfied with the accuracy of the information provided by the ERP system.
IQ3 Clear information is provided by the ERP system.
IQ4 The information provided by the ERP system is accurate.
IQ5 The ERP system provides sufficient information.
IQ6 The ERP system provides up-to-date information.
IQ7 The ERP system provides the information needed in time.
IQ8 The ERP system provides reports that are just about exactly what is needed.
IQ9 The ERP system provides precise information.
IQ10 The information content provided by the ERP system meet your needs.
Section 4: Quality of the ERP System (SQ)
Indicator
for SQ
Please check (√) the answer which best fits with your opinion about each statement:
SQ1 The ERP system is easy to use.
SQ2 The ERP system is user friendly.
SQ3 Compared to other computer software, the ERP system is easy to learn.
SQ4 I find it easy to get the ERP system to do what I want.
SQ5 It is easy for me to become skilful at using the ERP system.
SQ6 The ERP system is not cumbersome to use.
SQ7 Using the ERP system does not require a lot of mental effort.
SQ8 Using the ERP system is not frustrating.

Silpakorn U Science & Tech J Vol.8(1), 2014 Factors Influencing the Success of an ERP System
42
Section 5: Usefulness of the ERP System (PU)
Indicator
For PU
Please check (√) the answer which best fits with your opinion about each statement:
PU1 Using the ERP system in my job enables me to accomplish my tasks more quickly.
PU2 Using the ERP system improves my job performance.
PU3 Using the ERP system in my job increases my productivity.
PU4 Using the ERP system enhances my effectiveness in the job.
PU5 Using the ERP system makes it easier to do my job.
PU6 Overall, I find the ERP system useful in my job.
Section 6: User Satisfaction (US)A five-point measurement scale was used: (1) Very Dissatisfied (2) Dissatisfied (3) Neutral (4) Satisfied (5) Very Satisfied.
Indicator
For US
Please check (√) the answer which best fits with your opinion about each characteristic:
US1 How adequately the ERP system meets the information processing needs.
US2 The efficiency of the ERP system.(Efficiency refers to achieving maximum productivity with minimum wasted effort or expense)
US3 The effectiveness of the ERP system.(Effectiveness refers to success in producing a desired or intended result without concerning on waste and expense)
US4 Overall, how satisfied are you with ERP system?

Silpakorn U Science & Tech J Vol.8(1), 2014S. Duangekanong
43
Table A1 Final factor analysis
IndicatorLatent Variable
User Satisfaction Information Quality Perceived Usefulness System QualityUS4US1US3
US2
.853 .008 .038 .015
.833 .072 .045 -.038
.798 -.012 .147 .023
.792 .032 .061 .142IQ9IQ8
IQ10
.051 .914 .073 .050
.024 .913 .037 -.006
.004 .872 -.019 .011PU5PU6
PU4
.016 -.005 .872 .081
.144 .028 .864 .023
.060 .058 .793 .065SQ2SQ4
SQ3
-.015 .018 .035 .881.037 -.003 .075 .789.071 .035 .051 .781
Total Variance Explained
Latent Variable
Initial Eigenvalues Rotation Sums of Squared Loadings
TotalPercentage of
VarianceCumulativePercentage
TotalPercentage of
VarianceCumulativePercentage
User Satisfaction
3.138 24.139 24.139 2.718 20.911 20.911
Information Quality
2.369 18.224 42.364 2.443 18.789 39.700
Perceived Usefulness
2.084 16.028 58.392 2.182 16.781 56.481
System Quality
1.795 13.810 72.201 2.044 15.720 72.201
Notes: (a) Extraction Method: Principal Component Analysis; (b) Rotation Method: Equamax with Kaiser Normalization. Rotation converged in 5 iterations; (c) Kaiser-Meyer-Olkin Measure of Sampling Adequacy 0.725. Bartlett’s Test of Sphericity: Approx. Chi-Square 1479.292, Degrees of Freedom 78, Significance 0.000; (d) Only factors with eigenvalues of 1 or more are shown. The other factors extracted had eigenvalues less than 1 and none of the latent variable indicators loaded significantly on to any of these factors which collectively explained only 27.799 percent of the variance.
Table A2 Cronbach alpha coefficients
Latent Variable Indicators Alpha Interpretation Latent Variable Indicators Alpha Interpretation
Information
Quality
IQ 8, 9, 10 0.884 Good Perceived
Usefulness
PU 4, 5, 6 0.807 Good
User Satisfaction US 1, 2, 3, 4 0.842 Good System Quality SQ 2, 3, 4 0.757 Acceptable
Note: The interpretation of Cronbach alpha follows George and Mallery, 2003.

Silpakorn U Science & Tech J Vol.8(1), 2014 Factors Influencing the Success of an ERP System
44
Table A3 Personal and work characteristics of respondents
Personal Characteristics Work CharacteristicsGender Frequency Percent Work Position Frequency PercentMale 153 54.6 Full-time 130 46.4Female 127 45.4 Part-time 136 48.6Total 280 100.0 Government Advisor 14 5.0
Age
(Years)Frequency Percent
Cumulative
PercentTotal 280 100.0
18-22 7 2.5 2.5Work Experience
(Years)Frequency Percent
Cumulative
Percent23-27 15 5.4 7.9 1 to less than 5 years 123 43.9 43.9
28-32 43 15.4 23.25 to less than 10
years108 38.6 82.5
33-37 69 24.6 47.9 10 years or more 49 17.5 100.0
38-42 56 20.0 67.9Total
280 100.0Mean 6.7 years,
Std. Dev. 3.743-47 42 15.0 82.9 ERP System Experience (Years)48-52 6 2.1 85.0 1 to less than 5 years 175 62.5 62.5
53-57 32 11.4 96.45 to less than 10
years105 37.5 100.0
58-62 10 3.6 100.0 Total 280 100.0Mean 4.9 years,
Std. Dev. 2.4
Total 280 100.0
Mean 39.3
years,
Std. Dev. 9.5Level of Education (Degree)Bachelor 167 59.6 59.6Master 110 39.3 98.9Doctoral 3 1.1 100.0Total 280 100.0 -

Silpakorn U Science & Tech J Vol.8(1), 2014S. Duangekanong
45
Table A4 Descriptive statistics for model variables
Model Variable/Indicator Mean Standard Deviation Skewness KurtosisTop Management Support 4.73 .477 -1.427 .943Business Process Reengineering 4.66 .537 -1.315 .770Education and Training 4.65 .508 -.943 -.383Information Quality 4.64 .434 -.578 -1.455IQ8 4.66 .474 -.683 -1.545IQ9 4.63 .484 -.535 -1.726IQ10 4.63 .485 -.519 -1.743System Quality 4.55 .408 -.175 -1.563SQ2 4.57 .495 -.305 -1.921SQ3 4.57 .496 -.275 -1.938SQ4 4.50 .501 .000 -2.014Perceived Usefulness 4.48 .420 .103 -1.607PU4 4.60 .490 -.426 -1.832PU5 4.39 .489 .441 -1.818PU6 4.43 .503 .190 -1.757User Satisfaction 4.61 .400 -.557 -1.299US1 4.55 .499 -.188 -1.979US2 4.61 .488 -.457 -1.804US3 4.63 .483 -.551 -1.709US4 4.67 .472 -.717 -1.497
Table A5 Correlations among profile and model variables
VariableProfile Variable Model Variable
A E WE ERP TMS BPR ET IQ SQ PU
Profi
le
Vari
able
Age (A) 1 Level of Education (E) .191 1 Work Experience (WE) .297 .213 1 ERP System Experience (ERP) .298 .775 .247 1
Mod
el
Vari
able
Top Management Support (TMS) -.017 .045 .142 -.008 1 Business Process Reengineering (BPR) -.027 .011 .083 .003 .819 1 Education and Training (ET) -.017 .026 -.097 .045 .564 .549 1 Information Quality (IQ) .036 .125 .137 .068 .055 .056 -.003 1 System Quality (SQ) -.049 -.029 .046 .003 .036 .090 .067 .044 1 Perceived Usefulness (PU) .058 .015 .045 .053 -.062 -.009 .053 .068 .134 1 User Satisfaction (US) .070 -.014 .206 -.023 .069 .021 .006 .064 .806 .178
Notes: (a) Highlighted correlation coefficients are statistically significant at a level of 0.05; (b) Shaded cells indicate
significant correlations associated with causal effects in the theoretical model.