factors influencing improved student achievement in virginia
TRANSCRIPT

Factors Influencing Improved Student Achievement In Virginia
by
Patrick D. Linehan
A Dissertation
Submitted to the
Graduate Faculty
of
George Mason University
in Partial Fulfillment of
The Requirements for the Degree
of
Doctor of Philosophy
Public Policy
Committee:
David C. Armor, Chair
A. Lee Fritschler
Gary Galluzzo
James P. Pfiffner, Program Director
Edward Rhodes, Dean
Date: Summer Semester 2012
George Mason University
Fairfax, VA
Factors Influencing Improved Student Achievement In Virginia
A dissertation submitted in partial fulfillment of the requirements for the degree of
Doctor of Philosophy at George Mason University
by
Patrick D. Linehan
Bachelor of Science
United States Military Academy, 1977
Director: David C. Armor, Professor
Department of Public Policy
Spring Semester 2012
George Mason University
Fairfax, VA

ii
This work is licensed under a creative commons
attribution-noderivs 3.0 unported license.
iii
DEDICATION
This is dedicated to my loving wife Ronnie and our five wonderful children Patrick, Joey,
Tim, Duke and Kellie and my daughter-in-law Liz. I also dedicate this to our five
grandchildren Emily, Jacob, Audrey, Grace and Ella – motivators and distracters at the
same time.
iv
ACKNOWLEDGEMENTS
I would like to thank the many friends, relatives, and supporters. My loving wife, Ronnie,
who is my life, patiently put up with my many hours locked away in the basement. My
children and grandchildren gave me a purpose and the motivation to complete this
degree.
Dr. Armor guided me through this project as he did in many of my classes in the doctoral
program. His skill in cutting through to the most important questions made this project
more manageable through all its twists and turns.
Dr. Fritschler never failed to amaze me as he would quickly understand each new
challenge in this study and provide wise counsel and recommendations as to how to
proceed.
Dr. Galluzzo in several classes kept me focused on the perspective of educating children
and how to do it better. His advice was always right on the mark and contributed to my
development through the PhD program.
Dr. Aud performed a meticulous review of a draft of this dissertation and made it a much
better product.

v
TABLE OF CONTENTS
Page List of Tables .................................................................................................................... vii
List of Figures .................................................................................................................... ix
List of Abbreviations ...........................................................................................................x
List of Equations ................................................................................................................ xi
Abstract ............................................................................................................................. xii
Chapter One - Introduction ................................................................................................14
Chapter Two – Literature Review .....................................................................................19
Accountability ............................................................................................................... 19
NCLB ............................................................................................................................ 24
Student Background Factors ......................................................................................... 28
Resource Factors ........................................................................................................... 43
Pupil-Teacher Ratios – A Special Case of Resource Factors........................................ 48
Teacher Characteristics ................................................................................................. 50
Qualitative Examples .................................................................................................... 55
Chapter Three – Conceptual Model and Research Methods .............................................57
Conceptual Model ......................................................................................................... 57
Research Questions and Approach. ............................................................................... 58
Hypotheses .................................................................................................................... 59
Detailed Methodology ................................................................................................... 60
Data Collection .......................................................................................................... 60
Data Preparation ........................................................................................................ 63
Analysis ..................................................................................................................... 67
Chapter Four – Results ......................................................................................................69
Overall Achievement..................................................................................................... 69
Trends in the Student Background Variables ................................................................ 70
Trends in School and Teacher Characteristics ......................................................... 71
vi
Trends in Expenditures .............................................................................................. 77
Summary of Results for Reading Proficiency ............................................................... 78
Summary of Results for Math Proficiency .................................................................... 85
Regression Analysis ...................................................................................................... 89
Grade 3 Reading Cross-Sectional Regression Analysis ............................................ 89
Grade 5 Reading Cross-Sectional and Covariance Analysis ..................................... 93
Grade 3 Math Cross-Sectional Regression Analysis ................................................. 96
Grade 5 Math Cross-Sectional and Covariance Analysis .......................................... 99
Summary of the Main Regression Analyses ............................................................... 101
Student Background Analysis ..................................................................................... 103
Chapter Five – Conclusions, Limitations and Recommendations ...................................105
Conclusions ................................................................................................................. 105
Limitations of This Study ............................................................................................ 111
Recommendations for Further Study .......................................................................... 112
Policy Recommendations ............................................................................................ 113
Appendix A – Variables Used in the Study .....................................................................115
Appendix B – Available Data ..........................................................................................117
Appendix C – Overall Achievement ................................................................................118
Appendix D – Reading Descriptive Statistics and Correlation Matrix ............................119
Appendix E – Math Descriptive Statistics and Correlation Matrix .................................120
Appendix F – Achievement Gap .....................................................................................121
Appendix G – Relationship of the Expenditures Variables .............................................122
Appendix H – Examination Of The Limited English Proficiency (LEP) Factor ............124
Reading........................................................................................................................ 126
Math ............................................................................................................................ 127
Appendix I – NCLB Highly Qualified Teacher Extract ..................................................130
Appendix J – Virginia Highly Qualified Teachers Designation Extract .........................133
References ........................................................................................................................138

vii
LIST OF TABLES
Table Page
Table 1 Grade 5 SOL Assessment Results ....................................................................... 16 Table 2 Disaggregated 4th Grade NAEP Math Average Scores and Achievement Gaps 37
Table 3 Disaggregated 8th Grade NAEP Math Average Scores and Achievement Gaps 38
Table 4 Percent of Student Scoring Basic, Proficient and Advanced for 2011 Math
NAEP ................................................................................................................................ 40 Table 5 Disaggregated 4th Grade NAEP Reading Average Scores and Achievement
Gaps .................................................................................................................................. 41 Table 6 Disaggregated 8th Grade NAEP Reading Average Scores and Achievement
Gaps .................................................................................................................................. 42 Table 7 Percent of Student Scoring Basic, Proficient and Advanced for 2011 English
NAEP ................................................................................................................................ 43 Table 8 Changing Demographics in Virginia Schools from 2003 to 2011....................... 70 Table 9 Percent Highly Qualified Teachers Statistics ...................................................... 73
Table 10 Average Years of Teaching Experience in the Study Schools from 2007 – 2011
........................................................................................................................................... 75
Table 11 School Districts Percent of Teachers with Advanced Degrees .......................... 76 Table 12 Descriptive Statistics for the Reading Analysis for SY07-09............................ 80
Table 13 Correlation Matrix for Reading Achievement of All Students in Grades 3 & 5
for School Years ............................................................................................................... 83
Table 14 Descriptive Statistics for the Math Analysis for SY07-09 ................................ 87 Table 15 Correlation Matrix for Math Achievement of All Students on Grades 3 & 5 for
School Years 2007-2009 ................................................................................................... 88 Table 16 Regression Results for Reading, Grade 3, FY07-09 .......................................... 90 Table 17 Regression Results for Reading, Grade 5, FY07-09 .......................................... 93 Table 18 Regression Results for Math, Grade 3, FY07-09.............................................. 96 Table 19 Regression Results for Math, Grade 5, FY07-09............................................... 99
Table 20 Summary of Grade 5, Model 3 Effects for Reading and Math ........................ 102 Table 21 Decrease in Achievement Gaps from 2001 to 2011 ........................................ 104
Table 22 Variables Description ...................................................................................... 115 Table 23 Data Available for Quantitative Analysis ........................................................ 117 Table 24 Summary of Passing Rates for All Students in Grades 3 & 5 for Reading &
Math ................................................................................................................................ 118 Table 25 SOL Pass Rates for 3rd Grade Reading for All Students and Selected Subgroups
......................................................................................................................................... 119
viii
Table 26 SOL Pass Rates for 5th Grade Reading for All Students and Selected Subgroups
......................................................................................................................................... 119 Table 27 SOL Pass Rates for 3rd Grade Math for All Students and Selected Subgroups
......................................................................................................................................... 120
Table 28 SOL Pass Rates for 5th Grade Math for All Students and Selected Subgroups
......................................................................................................................................... 120 Table 29 Achievement Gaps 3rd Grade Students ........................................................... 121 Table 30 Achievement Gaps for 5th Grade Students...................................................... 121 Table 31 Math Achievement and Expenditure Variables Correlation Matrix ................ 122
Table 32 Reading Achievement and Expenditure Variables Correlation Matrix ........... 123 Table 33 Descriptive Statistics for the Reading Analysis for SY07-09.......................... 124 Table 34 SOL Pass Rates for 3rd Grade Reading for All Students and LEP Students .. 125
Table 35 Correlation Matrix for Reading Achievement with % LEP Students Included126 Table 36 Reading Regression Models with % LEP Students Included .......................... 127 Table 37 Correlation Matrix for Math Achievement with % LEP Students Included.... 127
Table 38 Math Regression Models with % LEP Students Included ............................... 129
ix
LIST OF FIGURES
Figure Page
Figure 1 Average Scores on NAEP Math Assessment ..................................................... 37 Figure 2 NAEP 4th Grade Math Achievement Gaps ...................................................... 38
Figure 3 NAEP 8th Grade Math Achievement Gaps ....................................................... 39
Figure 4. Average Scores on NAEP Reading Assessment .............................................. 41
Figure 5 NAEP 4th Grade Reading Achievement Gaps .................................................. 42 Figure 6 NAEP 8th Grade Reading Achievement Gaps .................................................. 42 Figure 7 Conceptual Model .............................................................................................. 57 Figure 8 Dependent and Independent Variable Listing .................................................... 63
Figure 9 Passing Rates for All Students in Grades 3 & 5 for Reading & Math ............... 70 Figure 10 Distribution of School Districts and the Percent of Highly Qualified Teachers
for SY2009 ........................................................................................................................ 74 Figure 11 Average Years Teaching Experience in Schools.............................................. 76 Figure 12 Per Pupil Total Expenditures ............................................................................ 77
Figure 13 Pupil-Teacher Ratio .......................................................................................... 78 Figure 14 SOL Pass Rates for 3rd Grade Reading for All Students and Selected
Subgroups ......................................................................................................................... 79 Figure 15 SOL Pass Rates for 5th Grade Reading for All Students and Selected
Subgroups ......................................................................................................................... 80 Figure 16 Math SOL Pass Rates for 3rd Grade for All Students and Selected Subgroups
........................................................................................................................................... 85 Figure 17 Math SOL Pass Rates for 5th Grade for All Students and Selected Subgroups86

x
LIST OF ABBREVIATIONS
No Child Left Behind.................................................................................................. NCLB
Standards of Learning .................................................................................................... SOL
Pupil-Teacher Ratio ....................................................................................................... PTR
Limited English Proficiency .......................................................................................... LEP
xi
LIST OF EQUATIONS
Equation Page
Equation 1 Model 3 Analysis of Covariance 68

xii
ABSTRACT
FACTORS INFLUENCING IMPROVED STUDENT ACHIEVEMENT IN VIRGINIA
Patrick D. Linehan
George Mason University, 2012
Dissertation Director: Dr. David C. Armor
At the beginning of the last decade, Congress passed and President George W. Bush
signed the No Child Left Behind (NCLB) Act of 2002. Key provisions of this act
focused on holding schools accountable to ensure that all students met state established
standards. In Virginia, the state Standards of Learning (SOL) assessments form the basis
of measuring student achievement. Previous studies have identified the importance of
family and socio-economic status factors on student performance. Other studies have
examined the effects of resources, teachers and school characteristics on student
achievement with varying results and interpretations. The purpose of this study is
determine the factors that affect achievement in Virginia and to determine whether the
Virginia results are similar to or different from national studies. The study examines
student achievement from 2001 through 2011 with particular attention on school years
2007 to 2009. This study does not examine specific provisions established and
implemented by the states in accord with NCLB requirements. Rather, it examines
xiii
factors traditionally seen to influence achievement and to determine the effects of those
factors in the NCLB era.
14
CHAPTER ONE - INTRODUCTION
Policymakers, educators and the public, in general, have debated the state of the
United States elementary and secondary education system and how to improve its
performance for many decades. The 1983 report, A Nation At Risk, provided renewed
emphasis on this debate and provided increased focus the on the federal role in what had
traditionally been a state and local concern. Many studies have examined various factors
thought to influence academic achievement including race/ethnicity, socio-economic
status of students’ families, funding allocated for education and teacher qualifications.
A key aspect of this debate, the role of accountability in K-12 education, was
highlighted with the passage of the No Child Left Behind Act of 2001 (NCLB), which
was signed into law in January 2002. Key provisions of this reenactment of the
Elementary and Secondary Education Act (ESEA) of 1965 impose strict accountability
provisions on states, districts and schools. These provisions require the states to establish
state-wide proficiency standards for all students, assess attainment of these standards and
report on the assessment results at the school, district and state levels. In addition, results
are disaggregated by race, ethnicity, English proficiency, poverty and special education
status.
Although many states are seeking and receiving waivers to the NCLB
requirement for 100 percent proficiency by 2014, this law remains important and relevant
15
because this is the first time that the federal government required states to establish
standards, measure against those standards and publish the results.
President Bush signed the NCLB legislation into law in early 2002 subjecting all
50 states to the accountability provisions of NCLB. States have largely implemented the
provisions by setting academic standards, adopting standardized curriculum at the state
level, and conducting annual assessments.
Virginia had implemented its own accountability system in the early 1990s based
on its Standards of Learning (SOL) assessments that it implemented at that time. The first
assessment reports were issued in 1999. 1 The Virginia assessments were developed as
part of the Virginia Standards of Quality (SOQs). SOQs are required by the Constitution
of Virginia and describe requirements for establishing and maintaining a high quality
educational program. 2 As part of its program, the state promulgated its SOLs and
schools began aligning their instruction with the standards. As curriculum alignment
between the state standards and the teachers’ instruction progressed, student achievement,
as measured by the SOL assessments, improved.
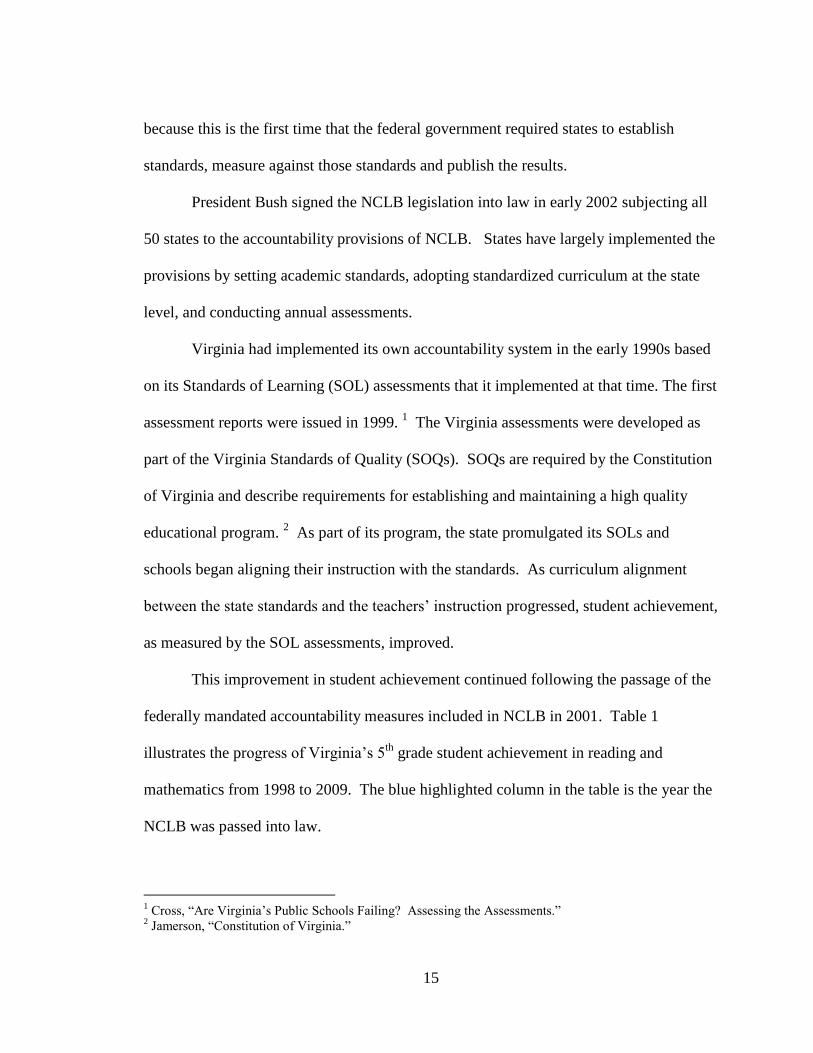
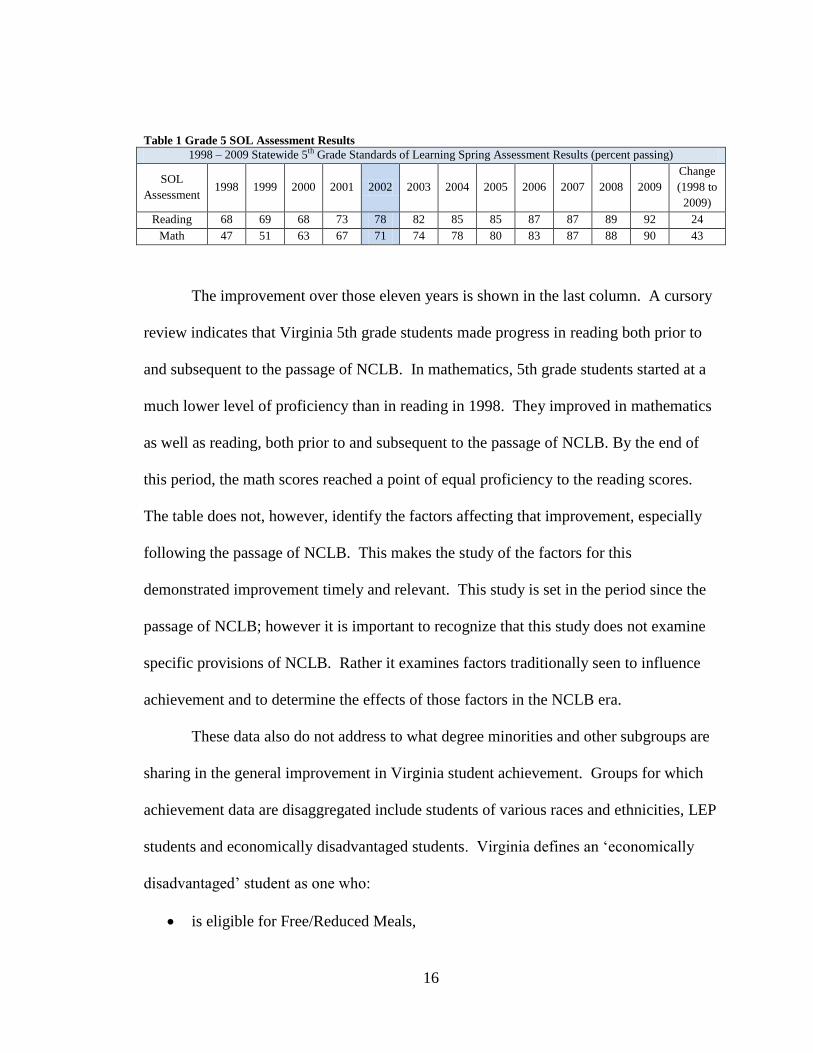
This improvement in student achievement continued following the passage of the
federally mandated accountability measures included in NCLB in 2001. Table 1
illustrates the progress of Virginia’s 5th
grade student achievement in reading and
mathematics from 1998 to 2009. The blue highlighted column in the table is the year the
NCLB was passed into law.
1 Cross, “Are Virginia’s Public Schools Failing? Assessing the Assessments.”
2 Jamerson, “Constitution of Virginia.”
16
Table 1 Grade 5 SOL Assessment Results
1998 – 2009 Statewide 5th Grade Standards of Learning Spring Assessment Results (percent passing)
SOL
Assessment 1998 1999 2000 2001 2002 2003 2004 2005 2006 2007 2008 2009
Change
(1998 to
2009)
Reading 68 69 68 73 78 82 85 85 87 87 89 92 24
Math 47 51 63 67 71 74 78 80 83 87 88 90 43
The improvement over those eleven years is shown in the last column. A cursory
review indicates that Virginia 5th grade students made progress in reading both prior to
and subsequent to the passage of NCLB. In mathematics, 5th grade students started at a
much lower level of proficiency than in reading in 1998. They improved in mathematics
as well as reading, both prior to and subsequent to the passage of NCLB. By the end of
this period, the math scores reached a point of equal proficiency to the reading scores.
The table does not, however, identify the factors affecting that improvement, especially
following the passage of NCLB. This makes the study of the factors for this
demonstrated improvement timely and relevant. This study is set in the period since the
passage of NCLB; however it is important to recognize that this study does not examine
specific provisions of NCLB. Rather it examines factors traditionally seen to influence
achievement and to determine the effects of those factors in the NCLB era.
These data also do not address to what degree minorities and other subgroups are
sharing in the general improvement in Virginia student achievement. Groups for which
achievement data are disaggregated include students of various races and ethnicities, LEP
students and economically disadvantaged students. Virginia defines an ‘economically
disadvantaged’ student as one who:
is eligible for Free/Reduced Meals,

17
receives TANF, or
is eligible for Medicaid. 3
The study addresses three groups of factors that have traditionally influenced
student achievement to varying degrees. These factors are student background, school
and teacher characteristics, and resources, also referred to as expenditures.
The student background variables used are race / ethnicity and poverty. In
addition, LEP students with are examined and discussed separately in an appendix. The
race/ethnicity data are grade-level for the 3rd and 5th grade at each school. . The poverty
data are also grade-level; however, there are some instances in which the school level
data rather than grade level data are used. This is explained in detail in the Methodology
chapter.
School and teacher characteristics available are the pupil-teacher ratio (PTR), the
percentage of teachers in a school that have advanced degrees, the percentage of teachers
in a school that meet the definition of a Highly Qualified Teacher (HQT), and the average
years of overall teaching experience for the teachers in a school. All of these data
elements are gathered at the school level.
The requirement for Highly Qualified Teachers (HQT) comes from NCLB. A
‘Highly Qualified Teacher’ in Virginia is one who is fully licensed by the state, has at
least a bachelor’s degree and has demonstrated competency in each subject taught. In
Virginia, the teacher licensure process ensures that new teachers meet these requirements.
For experienced teachers, the Commonwealth provides several paths to demonstrate the
required competency. An extract of these requirements is at Appendix J.
3 “VDOE :: Data Collections :: Student & School Records :: Student Records Data Definitions.”

18
The last area of potential influence on student achievement examined in this study
is expenditures. With the passage of NCLB, many educators expected additional
resources to implement provisions of the law. Advocates for improving the United States
education system feel that in order to hold schools accountable, the federal government
must provide sufficient resources to allow the schools to be successful. A key point from
some educators and policymakers is that there has not been adequate funding from the
federal government to meet all the mandates contained in the NCLB. Some supporters of
NCLB understood that passage of NCLB with its accountability provisions would also
result in additional federal funding to allow the states, districts and schools to meet the
ambitious goals set forth in the legislation. Many have been disappointed that substantial
additional federal funding has not been forthcoming.4 The provision of resources by the
federal government is an important factor to examine; however, this study does not
address whether the federal government has provided sufficient funding to support
implementation of NCLB. Rather, it examines the effect that the given level of
expenditures has on student achievement.
4 Kennedy, True Compass, 489–494.

19
CHAPTER TWO – LITERATURE REVIEW
While concern for student achievement and the performance of teachers and
schools has been around since the early years of the United States, in recent decades
educators and policymakers have more closely examined and identified factors
influencing student achievement in the United States educational system. Areas that have
been subjected to rigorous analysis and have engendered significant debate include
student background factors, resources, teacher qualifications and school factors.
Accountability In the second half of the 20
th century in the United States, accountability in
education became prominent. Leon Lessinger argued for accountability in 1970 stating
that since the passage of the 1965 ESEA the federal government had spent $4.3 billion on
education for students in poverty who need additional help. “We literally do not know
what educational results have been produced by that $4.3 billion.” 5 He further argued
for an engineering education process by “defin(ing) what we want, and then bring(ing)
together resources and technology in such a way as to assure those results.” 6 After
detailing various means of implementing accountability including independent
educational audits and performance contracts, Lessinger asked the question “Who is
accountable?” He recognized various accountability relationships including teachers,
5 Lessinger, Every Kid a Winner, 8.
6 Ibid., 12–13.
20
principals, superintendents and ultimately schools board members. He even pointed out
that in “the early nineteenth century . . . teachers in certain schools simply were not paid
unless their students could pass muster.” 7
Don Martin, George Overholt and Wayne Urban argued the other side in their
1976 book, Accountability in American Education: A Critique. They noted in their
introduction that “(t)he primary reason we are writing this book is to counter the all-
inclusive claim made by many accountability advocates that their approach should be the
only one to education.” 8 They contended that the accountability proponents’ views
reflected a positivist approach that a given input will produce a desired output or
outcome. They claimed that education and learning were much more complex than could
be described by mechanical solutions and that focusing on a rigid system of
accountability would not lead to improved learning. 9 In addition, they contended that
learning is not simply a change in behavior that can be measured but rather includes
higher order skills such as the ability to form and use concepts. 10
Overall, they
concluded that “the accountability movement attempts to apply mechanical solutions to a
complex social institution.” 11
Herbert Walberg noted challenges in establishing standards in an accountability
system and then developing assessments that measured accomplishment against those
standards. Standards had to be aligned with the school’s curriculum and the assessments
had to serve the dual purpose of providing information to both the student and the teacher
7 Ibid., 114.
8 Martin, Accountability in American Education, viii.
9 Martin, Accountability in American Education.
10 Ibid., 16.
11 Ibid., 76.

21
to improve learning while providing information to the public and decision makers as to
the effectiveness of the school. Determining what was to be tested and how student
learning was to be measured and reported was difficult and costly. 12
The push for accountability in education rocketed to the forefront of educational
issues with the release of the 1983 report, A Nation At Risk. This report was prepared by
the National Commission on Excellence in Education in 1983 to document challenges in
the United States education system. The study was undertaken shortly after the
establishment of the US Department of Education in 1980. President Ronald Reagan’s
Secretary of Education, Terrell Bell, chartered this Commission, which found there were
widespread declines in educational performance attributable to the educational process
itself. It rather bluntly stated in the opening paragraph that “. . . the educational
foundations of our society are presently being eroded by a rising tide of mediocrity that
threatens our very future as a Nation and a people.” 13
It categorized its findings in terms
of educational content or curriculum, expectations for high student achievement, time
spent on education and in the selection, preparation and work environments of teachers
thus leading to teacher shortages. 14
Ensuing policy initiatives attempted to reconcile the limited role of the federal
government called for in the U. S. Constitution with the desire of federal lawmakers to
improve what many began to refer to as a national problem. At the heart of the response
12
Walberg, “Real Accountability.” 13
National Commission on Excellence in Education, “A Nation at Risk: The Imperative for Educational
Reform,” 7. 14
National Commission on Excellence in Education, “A Nation at Risk: The Imperative for Educational
Reform,” 1983, http://www.ed.gov/pubs/NatAtRisk/index.html

22
to this report was a push to make teachers, schools, school districts and states accountable
for the performance of their students.
A key aspect of the accountability movement was to establish standards, that is, to
define what was to be learned, to what degree it should be mastered, and how
performance was to be assessed. Despite objections from some educators such as Martin,
and as a result of the A Nation At Risk report, President George H.W. Bush put the federal
spotlight on education when he became president. He invited the National Governors
Association to participate with him in a National Summit on Education in 1989. He
convened the summit in Charlottesville, Virginia and 49 of the nation’s 50 governors
attended. The summit’s purpose was to harness the energy of the nation’s governors in
responding to the need for improvement in K-12 education. Notably, in that summit, the
governors endorsed the establishment of national, as opposed to federal, goals. 15
They
endorsed Goals 2000—six goals for the nation to achieve by the year 2000. Following
this summit, President George H.W. Bush launched America 2000, which was a national
strategy to achieve these six goals. Key to this strategy was the fact that the national
standards in six core subjects were to be voluntary, rather than imposed by the federal
government. His strategy also encouraged market-based competition to improve school
quality. Most importantly, President Bush left it up to local communities to develop
plans to implement this initiative.16
A number of states and localities took up the
challenge to meet these goals; however, limited funding and coordination hampered the
achievement of these goals. The debate in Virginia over participation in the Goals 2000
15
Jennings, Why National Standards and Tests? Politics and the Quest for Better Schools. 16
Mintrom and Vergari, “Education Reform and Accountability Issues in an Intergovernmental Context.”
23
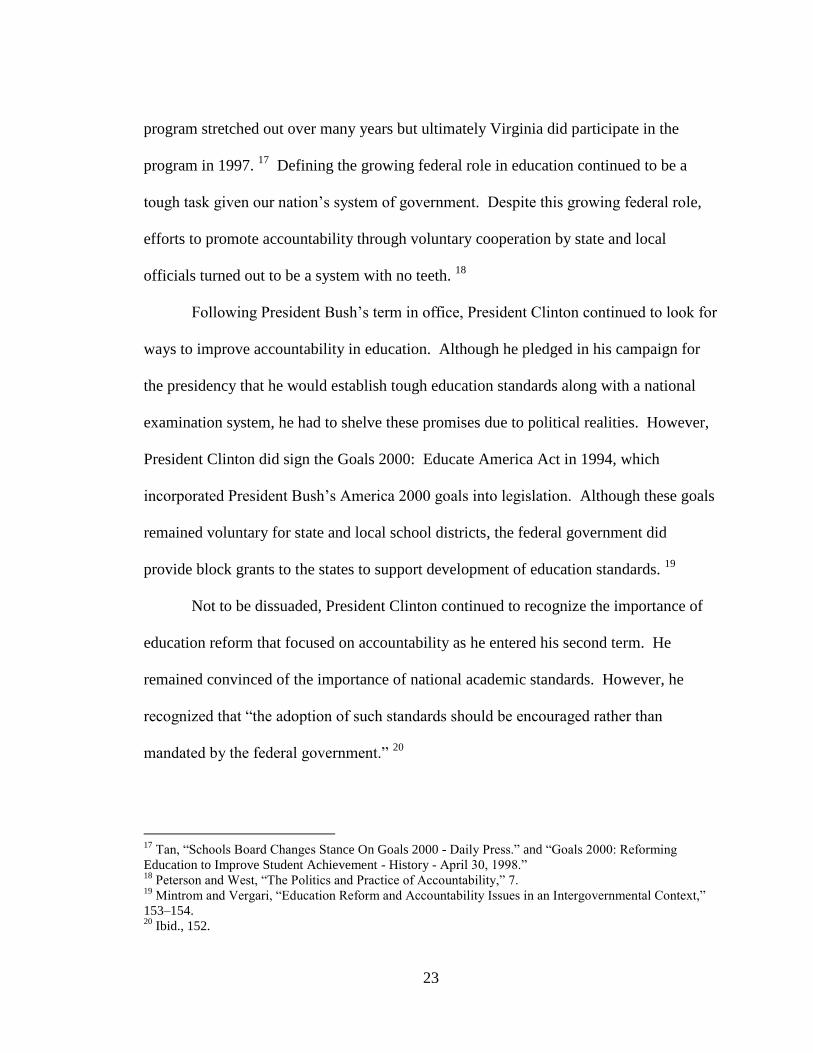
program stretched out over many years but ultimately Virginia did participate in the
program in 1997. 17
Defining the growing federal role in education continued to be a
tough task given our nation’s system of government. Despite this growing federal role,
efforts to promote accountability through voluntary cooperation by state and local
officials turned out to be a system with no teeth. 18
Following President Bush’s term in office, President Clinton continued to look for
ways to improve accountability in education. Although he pledged in his campaign for
the presidency that he would establish tough education standards along with a national
examination system, he had to shelve these promises due to political realities. However,
President Clinton did sign the Goals 2000: Educate America Act in 1994, which
incorporated President Bush’s America 2000 goals into legislation. Although these goals
remained voluntary for state and local school districts, the federal government did
provide block grants to the states to support development of education standards. 19
Not to be dissuaded, President Clinton continued to recognize the importance of
education reform that focused on accountability as he entered his second term. He
remained convinced of the importance of national academic standards. However, he
recognized that “the adoption of such standards should be encouraged rather than
mandated by the federal government.” 20
17
Tan, “Schools Board Changes Stance On Goals 2000 - Daily Press.” and “Goals 2000: Reforming
Education to Improve Student Achievement - History - April 30, 1998.” 18
Peterson and West, “The Politics and Practice of Accountability,” 7. 19
Mintrom and Vergari, “Education Reform and Accountability Issues in an Intergovernmental Context,”
153–154. 20
Ibid., 152.

24
NCLB In January 2002, President George W. Bush signed the NCLB Act into law. This
was a reauthorization of the Elementary and Secondary Education Act of 1965 (ESEA)
and launched a new era of federal involvement in K-12 education, which had been
increasing over the years. NCLB contained many provisions, but one of the primary
aspects of the law was its emphasis on accountability. “Accountability in education has
been described as a ‘tripod’ made up of standards, tests that measure whether those
standards have been reached, and penalties or rewards linked to performance on tests.” 21
“Since the early 1980s, many Americans have expressed concern about the
apparently poor performance of public schools in the United States. . . . These
expressions of concern about school performance have been accompanied by myriad
proposals for reform.” 22
Thus, one of the pillars of President Bush’s blueprint for
education reform was accountability. The NCLB act required assessing students annually
publishing those results for parents and other stakeholders in the education system. He
would reward schools that improved student achievement while sanctioning those that
did not. 23
Although this act represented increased federal government involvement in K-
12 education, it was not inconsistent with increased state involvement. NCLB requires
states and local education agencies (LEAs) to perform better by establishing their own
state standards and then demonstrating that they are meeting those standards. 24
Thus,
this law set the stage for many public policy questions regarding the roles of both the
21
Rudalevige, Forging A Congressional Compromise, 25. 22
Mintrom and Vergari, “Education Reform and Accountability Issues in an Intergovernmental Context,”
143. 23
Bush, “No Child Left Behind.” 24
Jennings, Why National Standards and Tests? Politics and the Quest for Better Schools, 299–306.
25
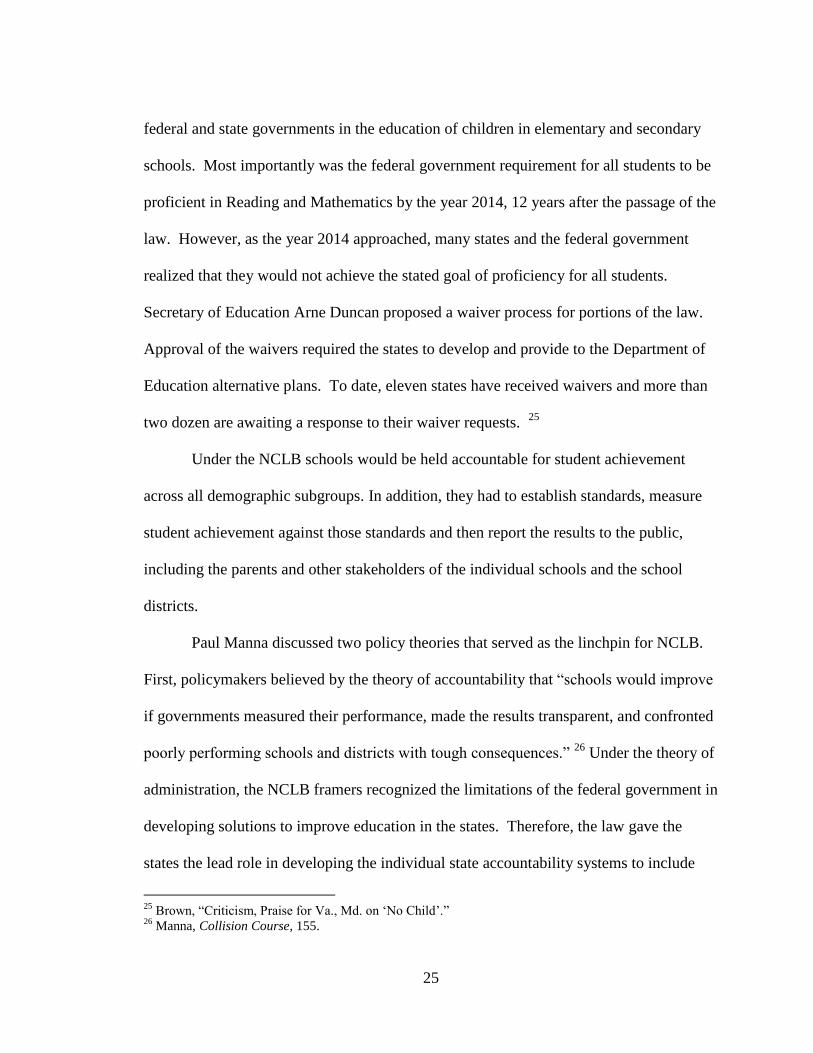
federal and state governments in the education of children in elementary and secondary
schools. Most importantly was the federal government requirement for all students to be
proficient in Reading and Mathematics by the year 2014, 12 years after the passage of the
law. However, as the year 2014 approached, many states and the federal government
realized that they would not achieve the stated goal of proficiency for all students.
Secretary of Education Arne Duncan proposed a waiver process for portions of the law.
Approval of the waivers required the states to develop and provide to the Department of
Education alternative plans. To date, eleven states have received waivers and more than
two dozen are awaiting a response to their waiver requests. 25
Under the NCLB schools would be held accountable for student achievement
across all demographic subgroups. In addition, they had to establish standards, measure
student achievement against those standards and then report the results to the public,
including the parents and other stakeholders of the individual schools and the school
districts.
Paul Manna discussed two policy theories that served as the linchpin for NCLB.
First, policymakers believed by the theory of accountability that “schools would improve
if governments measured their performance, made the results transparent, and confronted
poorly performing schools and districts with tough consequences.” 26
Under the theory of
administration, the NCLB framers recognized the limitations of the federal government in
developing solutions to improve education in the states. Therefore, the law gave the
states the lead role in developing the individual state accountability systems to include
25
Brown, “Criticism, Praise for Va., Md. on ‘No Child’.” 26
Manna, Collision Course, 155.
26
determining the standards for students to be considered proficient. Manna contended that
NCLB did not realize the goals of the NCLB framers because its theories of action were
in conflict with the realities of how the American educational system operated in the
United States. 27
Manna pointed out several of the many results of NCLB. On the positive side, the
law focused attention on the disparities between the various student subgroups. Second,
the emphasis on measuring achievement caused the state and local governments to
improve their technical capabilities, both in gathering and analyzing data as well as
developing approaches to improve student achievement. The focus on the key metric of
Adequate Yearly Progress (AYP) caused districts to improve professional development
for teachers in using data to address student weaknesses and led to increased
collaboration among teachers. Finally, NCLB provided an environment in which
educational entrepreneurs have been able to develop, test and implement innovative
ideas. On the negative side, however, the focus on having all students meet minimum
requirements led schools to decrease academic quality and expectations by watering
down requirements for proficiency. Second, NCLB focused school districts on meeting
technical, bureaucratic rules to satisfy the law’s requirements by implementing
techniques such as ‘teaching to the test’ in order to assure that their students will
demonstrate the required level of proficiency. 28
Virginia has two distinct measures of holding schools and school districts
accountable for student performance. The first measure applies state-determined criteria
27
Ibid., 155–156. 28
Ibid., 17, 149 – 155.

27
to accredit schools and school districts. Virginia established school accreditation prior to
the passage of NCLB. The second, and now more important, accountability measure for
Virginia schools is the NCLB requirement. The NCLB reports included a myriad of data
including information on school safety, graduation rates, dropout rates, teacher licensure
rates, rates of participation in the assessment process and, most importantly, assessment
results of the state developed and administered SOL assessments.
The key metric for these assessments is the Adequate Yearly Progress (AYP) that
schools make toward the objective of having 100 percent of its students pass the SOL
assessments by the end of the 2013-14 school year. NCLB required the states to develop
their own assessment instruments and to establish their own yearly goals as they progress
toward the final objective if 100 percent proficiency by 2014.
As required by NCLB, Virginia disaggregates the assessment the subgroups, in
order to focus on the results for all students not just a subset of students who perform
well. The school report cards provided student pass rates against the state-established
criteria for measuring Adequate Yearly Progress (AYP). These criteria are referred to as
the Annual Measurable Objectives. Schools must meet the established standards for all
of the disaggregated subgroups to be considered to have demonstrated the federally
required AYP.
Specific provisions of NCLB required each state to establish a set of statewide
curriculum subject matter content for grades three through eight, developing standardized
test to assess proficiency in those subject matters—including a specific proficiency
standard for each grade. Perhaps most important, the accountability provisions required
28
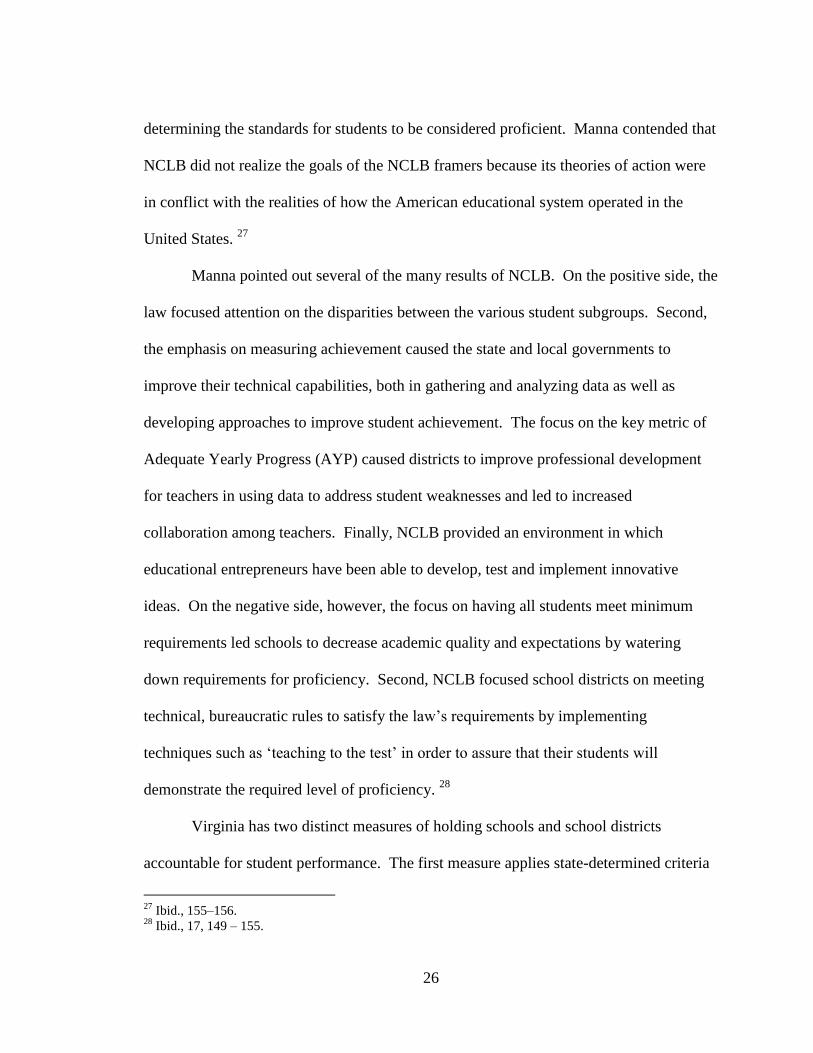
testing all students in grades three through eight with an objective that all students
demonstrate proficiency by 2014. Schools demonstrate interim progress by achieving
AYP measures, which indicate progress on a path the meet the proficiency objective as
required. School districts report their scores annually to the state and federal departments
and publish them for the public. In addition, the scores are disaggregated by race /
ethnicity, poverty, LEP, and disability in an effort to ensure that students in these
categories are improving. 29
Student Background Factors Much debate occurred over the effects of family and socio-economic status
factors relative to the effects from the resources provided by schools and the programs
that these resources enable. The seminal study in this area is the Equality of Educational
Opportunity by James Coleman. This report is commonly referred to as the Coleman
Report in 1966. This report identified family and other SES factors as predominant in
affecting student outcomes relative to school characteristics.30
Since that time, other
researchers attempted to determine other factors that contribute to student outcomes, but
Coleman’s findings, while still controversial, have been hard to refute.
Due to the unanticipated findings and the challenge in gathering information,
researchers conducted further studies and analyses either to validate Coleman’s findings
or to discover other important factors influencing student achievement. One of the first
such studies was a review of the Coleman Report published in 1972 and edited by
Frederick Mosteller and Daniel Moynihan. The purpose of this study was to examine the
29
Jennings, Why National Standards and Tests? Politics and the Quest for Better Schools, 1. 30
Coleman, Equality of Educational Opportunity, 9–12.
29
findings of the Coleman report and either confirm or refute them. The Coleman Report
had been prepared under a stringent time constraint imposed by the federal law that both
authorized and required the study. Lacking a demanding schedule to conduct the study
and to prepare the report, many felt that other researchers should conduct further analysis
and that the results made more widely available. The researchers used the same data that
the Coleman Report used but used different methods of analysis.31
This study noted that
the Coleman Report shifted the focus on educational opportunity from inputs to the
educational system to educational outputs. In general, while developing some additional
findings, the re-analysis of the Coleman Report did not support rejecting Coleman’s most
important findings.
In particular, David Armor reexamined the school and family effects on student
achievement. He noted some methodological issues with the collection of the initial data
from the Coleman study; however, since he used the same data, his results would have
the same limitations that Coleman noted in his report. Armor compared the
characteristics of Black and White schools in terms of school facilities, teacher quality
and school expenditures. Black schools were schools that had more than 50 percent
black students while White schools had 50 percent or more of white students. Schools
with majorities of other minorities of other minority groups were excluded. 32
He
concluded that the re-analysis supported Coleman’s original findings. Similarly, he
31
Moynihan and Mosteller, On Equality of Educational Opportunity, Preface. 32
Armor, “School and Family Effects on Black and White Achievement: A Reexamination of the USOE
Data,” 183.
30
examined student achievement and found that the community input factors, which
included family factors, were more important than school factors.33
In the same year that Moynihan and Mosteller published their re-analysis of the
Coleman data, Christopher Jencks and seven co-authors presented their analysis of
various research including the Coleman data in a book titled Inequality. He began by
examining the distinction between equal opportunity and equal results. Jencks, however,
focused his thoughts on the differences between individuals rather than groups and
examined long-term outcomes rather than short-term outcomes. He found that the long-
term effects of school in adult success are not as important as many thought they were.
Jencks noted that although society has tried to equalize opportunity it did not
eliminate inequalities. He noted that there is no evidence that the school system can
reduce the extent of cognitive inequality and that differences between schools have little
effect on any measurable attribute of those who attend them, thus recognizing the
importance of family on student achievement at an early age. In this matter, Jencks
supports Coleman’s finding of the limited effects of schools on student outcomes. He
also claimed that since the differences between schools have trivial long-term effects,
society should judge them by their short-term effects.34
Jencks’ focus on equal opportunity led him to note that access to schools and
colleges is unequal, as are the expenditures on individuals in different schools. Thus, he
claimed that individuals do not have equal access to society’s educational resources.
33
Ibid., 221–225. 34
Jencks, Inequality, 16–17.
31
Jencks’ analysis differed from Coleman in three respects. First, Jencks’ focus was on the
individual rather than on groups. Second, he considered these individuals throughout
their entire lives, rather than only while they are in K-12 schools. In addition, Jencks
considered not just the resources provided to schools but the lack of resources provided to
those who drop out of school or who do not attend postsecondary education. 35
However, in one instance Jencks did limit his analysis to the time in school when
discussing inequality in cognitive skills. He claimed that variations in student
performance in school depended on what they bring to school, not what the schools do
for them. Among Jencks’ and his co-authors’ many findings and conclusions, they noted
that the total environmental factors accounted for 25 to 40 percent of test score
inequality.36
In addition, they noted that overall family background, which includes “all
features of the environment that make brothers and sisters alike” explained nearly half the
variation in educational attainment.37
On this point, Jencks agreed with Coleman on the
importance of non-school factors.
In discussing these points, however, it is important to note that although Jencks is
skeptical of standardized tests in general, he recognized that they provided some useful
information. He noted that, “instability of test scores in early childhood and stability of
scores once children enter school may mean that preschool and early school
35
Ibid., 14–17. 36
Ibid., 108. 37
Ibid., 143.
32
environments are more important than later environments.”38
This lent support to
Coleman’s finding on the relative lesser importance of school effects.
Over the ensuing decades other researchers have routinely confirmed Coleman’s
results. A consistent finding from multiple assessments was the existence of an
achievement gap between minorities, primarily Black, but also including other groups,
and White students. Some examined the underlying conditions that resulted in this
achievement gap and proposed initiatives to close the achievement gap while others have
simply examined student achievement to determine if we are making progress in closing
the gap. 39
Closing this gap is the ultimate goal of the Brown vs. the Board of Education
to Topeka, Kansas Supreme Court decision. Holding schools and school districts
accountable for closing this gap was one of the major goals of NCLB.
In 2001, Alexander, Entwistle and Olson confirmed the continued existence of the
achievement gap using data from the Beginning School Study (BSS) of a random sample
of children who began first grade in the fall of 1982 in 20 of Baltimore's public schools.40
Their study examined the role the family played in contributing to seasonal learning in
Baltimore’s public schools. This study examined the learning of students during the
school year and during the summer intercession. They concluded that the results that
they observed indicated that the effects of schools were greater than Coleman believed.
They concluded that the achievement gap was due to differences in learning both before
38
Ibid., 61. 39
Alexander, Entwisle, and Olson, “Schools, Achievement, and Inequality: A Seasonal Perspective.”;
Ferguson and Mehta, “An Unfinished Journey: The Legacy of Brown and the Narrowing of the
Achievement Gap.”; Lee, “Racial and Ethnic Achievement Gap Trends: Reversing the Progress Toward
Equity?”. 40
Alexander, Entwisle, and Olson, “Schools, Achievement, and Inequality: A Seasonal Perspective,” 172.
33
the students entered first grade and the learning that occurred during the summer
intercessions. Minority students did, in fact, learn during the school year. Their findings
indicated, however, that lower SES students arrived in first grade less ready to learn than
students from higher SES families and that during the summer, the lower SES students
learning loss was greater than for higher SES students. Once school started, the lower
SES students began learning again. The researchers did not deny the family influence
that led to the achievement gap; they simply concluded that the school had greater
influence than it had been given credit. They believe that “(s)chools do matter, and they
matter the most when support for academic learning outside school is weak.” 41
In the introductory chapter of their 2002 book, Bridging the Achievement Gap,
Brookings researchers John Chubb and Tom Loveless noted that the achievement gap
that Coleman identified in his research in 1966 persisted over the ensuing decades. In
fact, Chubb and Loveless contended that in the decade of the 1990’s it got worse. They
pointed out that at the time of the publication of their book, the average Black or
Hispanic student achieved at the same level as the lowest quartile of White students.42
Ronald F. Ferguson and Jal Mehta also claimed that while some progress was
made in reducing the achievement gap for decades, progress stopped in the 1990s. They
contended this was the result of missed opportunities. Further progress toward
eliminating the achievement gap must rely upon seizing and exploiting the opportunities
presented to society. Many programs, such as the Head Start program and Title I, were
developed but did not deliver as hoped. They claimed that research into class-size effects
41
Ibid., 183. 42
Chubb and Loveless, Bridging the Achievement Gap, 1.
34
and the most effective types of teacher training and professional development were only
beginning to be understood in the early part of this century and that information on these
types of programs “has not been developed using high–quality research standards and
then widely shared . . .” and that these were the missed opportunities throughout the
1990s. 43
They concluded that continued research is required to identify what works and
then to leverage those programs rather than letting initial success go unexploited and lead
to no permanent improvement. 44
In 2003, Armor published results of his analysis of the Children of the National
Longitudinal Study of Youth (CNLSY) data. 45
These were children whose mothers were
originally surveyed in 1979 as part of the National Longitudinal Study of Youth (NLSY).
Surveying these children provided a wealth of data concerning potential factors for child
development. Armor examined potential risk factors that influenced development of
intelligence and thus academic performance. His analysis confirmed the importance of
family factors. Armor demonstrated that intelligence, although it could change to some
degree over time, was fairly well established by the time the child entered school. He
noted that schools provided uniform effects on students in accordance with the strong
family effects.
Armor identified risk factors in the family environment that had the strongest
effect on a child’s IQ and showed that these risk factors affected the child most
43
Ferguson and Mehta, “An Unfinished Journey: The Legacy of Brown and the Narrowing of the
Achievement Gap,” 667. 44
Ferguson and Mehta, “An Unfinished Journey: The Legacy of Brown and the Narrowing of the
Achievement Gap.” 45
Armor, Maximizing Intelligence.
35
substantially in the ages up to three years old. Of particular note, was that several of
these family factors were in place even before the child is born. These results certainly
supported Coleman’s study that identified family factors as more important to student
outcomes than school factors.46
David Armor continued this research into family factors and their effects on
student achievement. He examined data from the NAEP from 1990 to 2005, the Children
of the National Longitudinal Study of Youth (CNLSY) and their studies for a 2007 article
in which he addressed this gap and the attempt to close it by implementing the provisions
of NCLB. 47
He noted that the achievement gap comes into the schools from the
students’ family and home environments. In effect, the achievement gap is present when
a student starts school. The goal of NCLB is to have the schools do what they have not
yet been able to do and to determine ways to close this gap while the children are in
schools.
To close the achievement gap, schools must improve minority achievement faster
than they improve the achievement of White students. However, as Armor and other
previous research indicates, family risk factors that operate on children in their early
years explain a large portion of the achievement gap, not school factors. Currently there
is no agreed to program that promises to close the achievement gap. Educators lacked the
technical knowledge to improve one group faster than another group; thus, the
achievement gap will be hard to close in the time allotted by NCLB.
46
Ibid., 6–8 and 25–36. 47
Armor, “Can NCLB Close Achievement Gaps?,” 323.
36
His recommendations included conducting more research to determine ways that
schools can affect student achievement, and modifying the NCLB requirements that state
the goal only in terms of equal proficiency by using a growth model or a value-added
model in order to better measure progress. 48
In another effort to explain the observed influence of SES on student
achievement, Ream and Palardy examined the role of parental social capital, the capacity
to leverage scarce resources using membership in broad social and community structures,
on student achievement. They examined whether parental social capital differs among
different social classes, whether parental social capital affected educational outcomes and
whether the ability to affect educational outcomes differed among the different social
classes. In their study, Ream and Palardy affirmed the importance of parental social
capital on educational outcomes and that parents in the upper social class possess an
abundance of social capital relative to lower social class parents. Since the upper social
class parents had more social capital, they were better able to leverage their social capital
improved educational achievement. 49
Results from the National Assessment of Educational Progress (NAEP) presented
mixed results over the past decade. The NAEP reports provided the average scores for all
students in various subject areas as well as by various racial, ethnic and other categories
of interest to policymakers.
48
Ibid., 323–339. 49
Ream and Palardy, “Reexamining Social Class Differences in the Availability and the Educational Utility
of Parental Social Capital.”
37
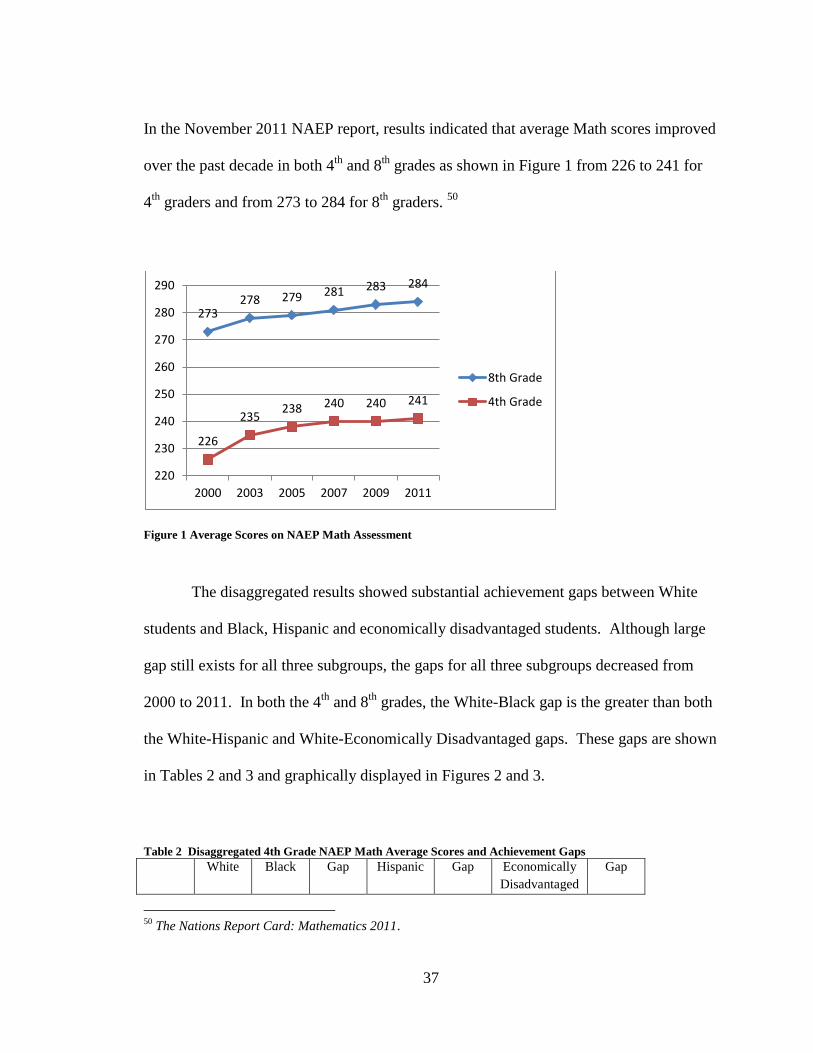
In the November 2011 NAEP report, results indicated that average Math scores improved
over the past decade in both 4th
and 8th
grades as shown in Figure 1 from 226 to 241 for
4th
graders and from 273 to 284 for 8th
graders. 50
Figure 1 Average Scores on NAEP Math Assessment
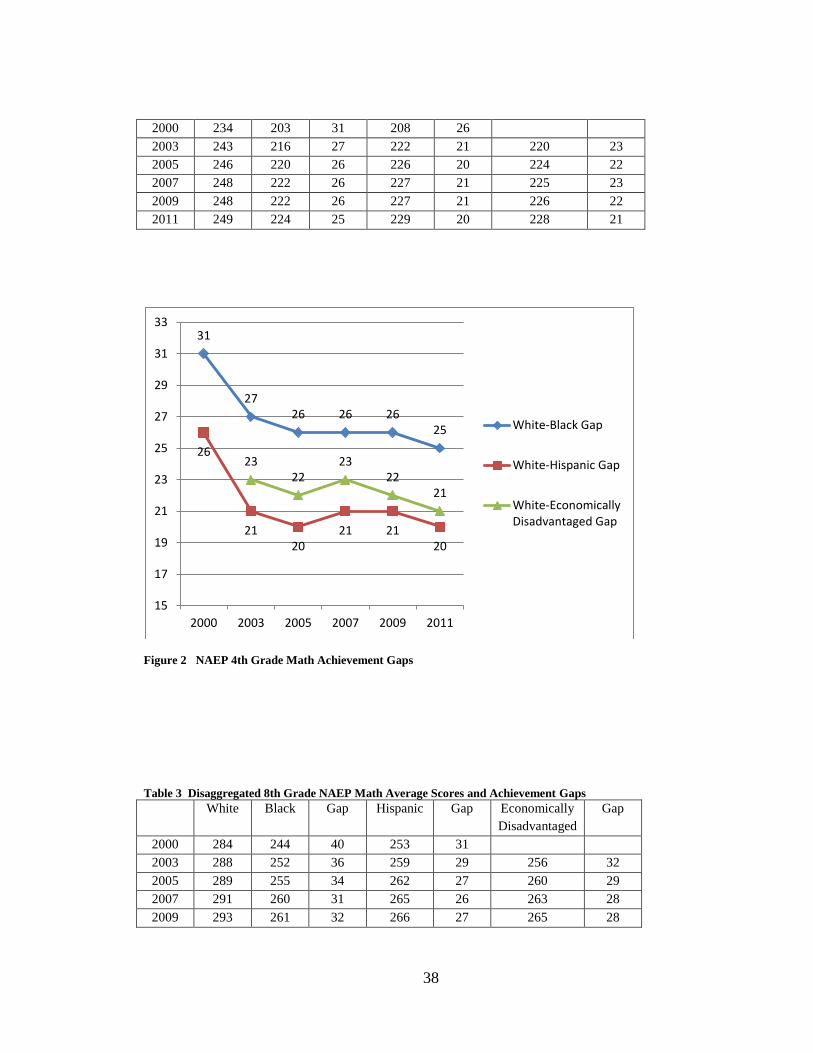
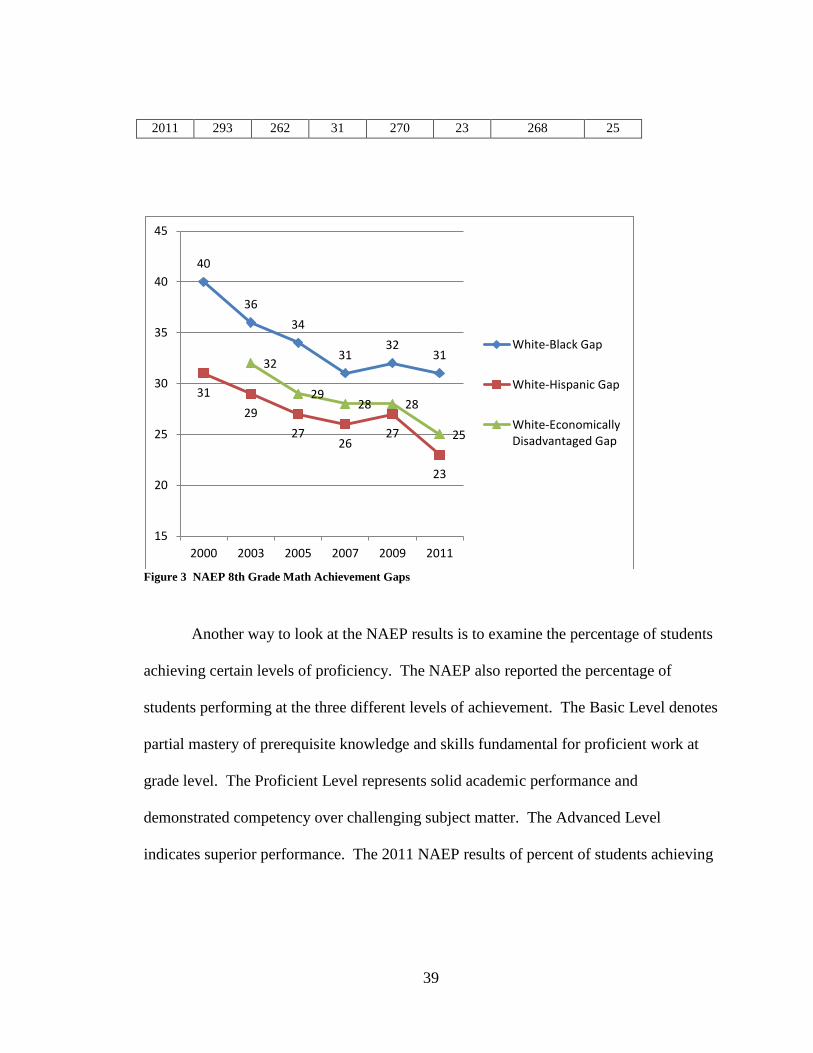
The disaggregated results showed substantial achievement gaps between White
students and Black, Hispanic and economically disadvantaged students. Although large
gap still exists for all three subgroups, the gaps for all three subgroups decreased from
2000 to 2011. In both the 4th
and 8th
grades, the White-Black gap is the greater than both
the White-Hispanic and White-Economically Disadvantaged gaps. These gaps are shown
in Tables 2 and 3 and graphically displayed in Figures 2 and 3.
Table 2 Disaggregated 4th Grade NAEP Math Average Scores and Achievement Gaps
White Black Gap Hispanic Gap Economically
Disadvantaged
Gap
50
The Nations Report Card: Mathematics 2011.
273 278 279 281 283 284
226
235 238 240 240 241
220
230
240
250
260
270
280
290
2000 2003 2005 2007 2009 2011
8th Grade
4th Grade
38
2000 234 203 31 208 26
2003 243 216 27 222 21 220 23
2005 246 220 26 226 20 224 22
2007 248 222 26 227 21 225 23
2009 248 222 26 227 21 226 22
2011 249 224 25 229 20 228 21
Figure 2 NAEP 4th Grade Math Achievement Gaps
Table 3 Disaggregated 8th Grade NAEP Math Average Scores and Achievement Gaps
White Black Gap Hispanic Gap Economically
Disadvantaged
Gap
2000 284 244 40 253 31
2003 288 252 36 259 29 256 32
2005 289 255 34 262 27 260 29
2007 291 260 31 265 26 263 28
2009 293 261 32 266 27 265 28
31
27 26 26 26
25
26
21 20
21 21 20
23 22
23 22
21
15
17
19
21
23
25
27
29
31
33
2000 2003 2005 2007 2009 2011
White-Black Gap
White-Hispanic Gap
White-EconomicallyDisadvantaged Gap
39
2011 293 262 31 270 23 268 25
Figure 3 NAEP 8th Grade Math Achievement Gaps
Another way to look at the NAEP results is to examine the percentage of students
achieving certain levels of proficiency. The NAEP also reported the percentage of
students performing at the three different levels of achievement. The Basic Level denotes
partial mastery of prerequisite knowledge and skills fundamental for proficient work at
grade level. The Proficient Level represents solid academic performance and
demonstrated competency over challenging subject matter. The Advanced Level
indicates superior performance. The 2011 NAEP results of percent of students achieving
40
36
34
31 32
31
31
29
27 26
27
23
32
29 28 28
25
15
20
25
30
35
40
45
2000 2003 2005 2007 2009 2011
White-Black Gap
White-Hispanic Gap
White-EconomicallyDisadvantaged Gap
40
these three achievement levels also demonstrated the continuing achievement gap
identified by Coleman in his seminal report.
Table 4 Percent of Student Scoring Basic, Proficient and Advanced for 2011 Math NAEP
4th
Grade 8th
Grade
Below
Basic Basic Proficient Advanced Below
Basic
Basic Proficient Advanced
White 9 39 43 9 16 39 33 11
Black 34 48 16 1 49 38 12 2
Hispanic 28 48 22 2 39 40 18 3
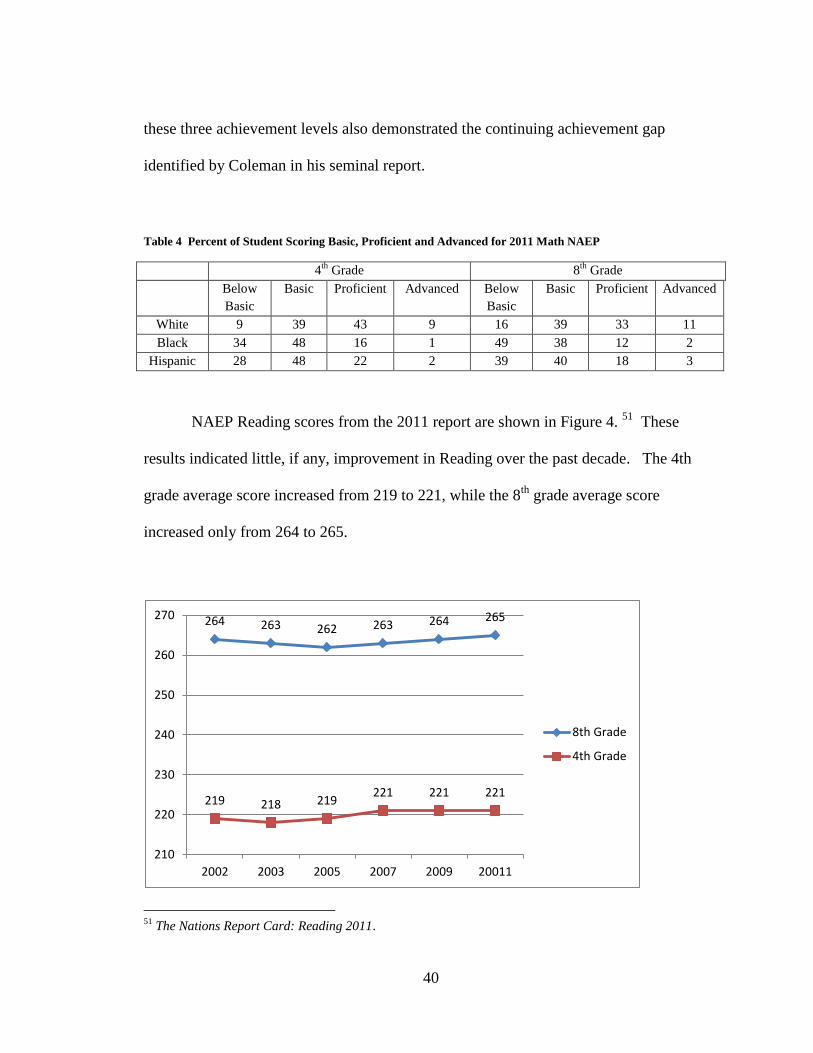
NAEP Reading scores from the 2011 report are shown in Figure 4. 51
These
results indicated little, if any, improvement in Reading over the past decade. The 4th
grade average score increased from 219 to 221, while the 8th
grade average score
increased only from 264 to 265.
51
The Nations Report Card: Reading 2011.
264 263 262 263 264 265
219 218 219 221 221 221
210
220
230
240
250
260
270
2002 2003 2005 2007 2009 20011
8th Grade
4th Grade
41
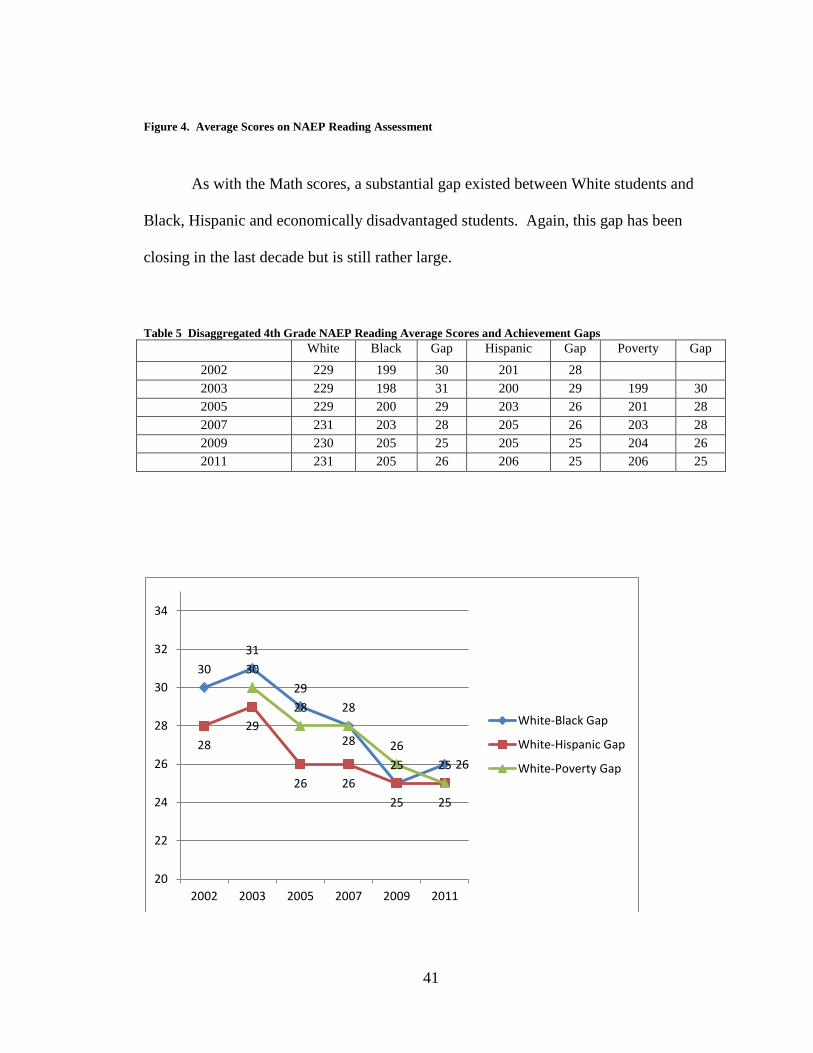
Figure 4. Average Scores on NAEP Reading Assessment
As with the Math scores, a substantial gap existed between White students and
Black, Hispanic and economically disadvantaged students. Again, this gap has been
closing in the last decade but is still rather large.
Table 5 Disaggregated 4th Grade NAEP Reading Average Scores and Achievement Gaps
White Black Gap Hispanic Gap Poverty Gap
2002 229 199 30 201 28
2003 229 198 31 200 29 199 30
2005 229 200 29 203 26 201 28
2007 231 203 28 205 26 203 28
2009 230 205 25 205 25 204 26
2011 231 205 26 206 25 206 25
30
31
29
28
25 26
28
29
26 26
25 25
30
28
28 26
25
20
22
24
26
28
30
32
34
2002 2003 2005 2007 2009 2011
White-Black Gap
White-Hispanic Gap
White-Poverty Gap
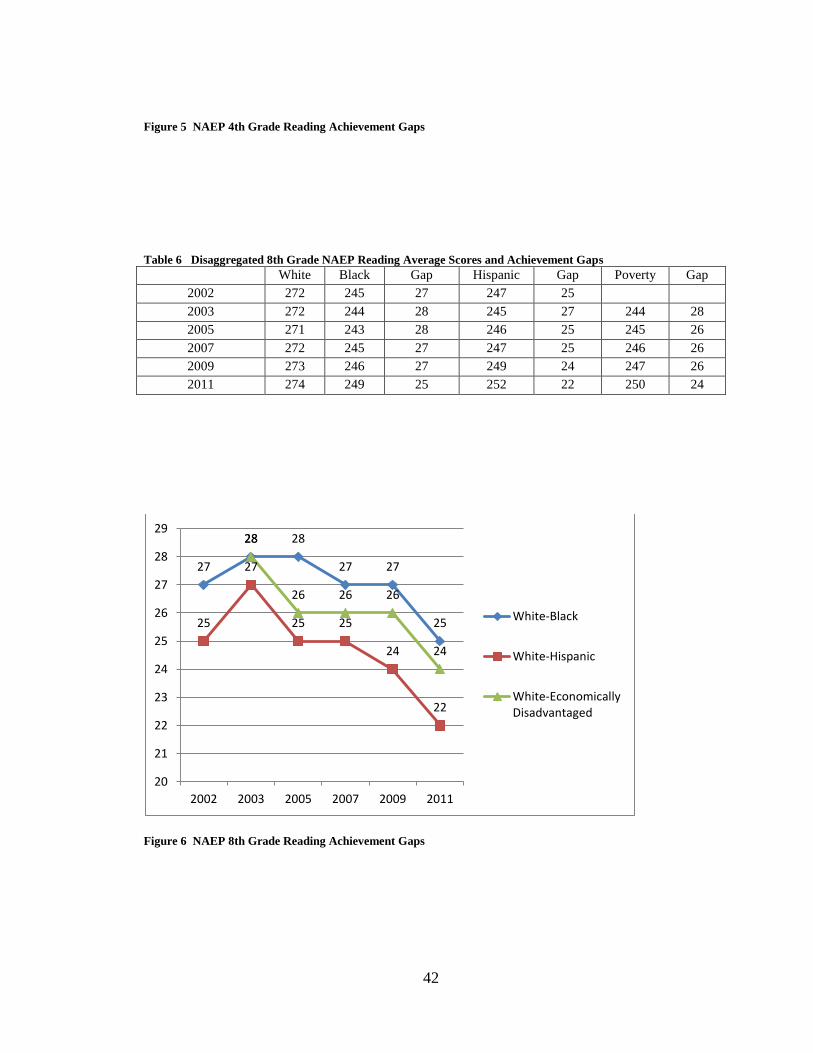
42
Figure 5 NAEP 4th Grade Reading Achievement Gaps
Table 6 Disaggregated 8th Grade NAEP Reading Average Scores and Achievement Gaps
White Black Gap Hispanic Gap Poverty Gap
2002 272 245 27 247 25
2003 272 244 28 245 27 244 28
2005 271 243 28 246 25 245 26
2007 272 245 27 247 25 246 26
2009 273 246 27 249 24 247 26
2011 274 249 25 252 22 250 24
Figure 6 NAEP 8th Grade Reading Achievement Gaps
27
28 28
27 27
25 25
27
25 25
24
22
28
26 26 26
24
20
21
22
23
24
25
26
27
28
29
2002 2003 2005 2007 2009 2011
White-Black
White-Hispanic
White-EconomicallyDisadvantaged
43
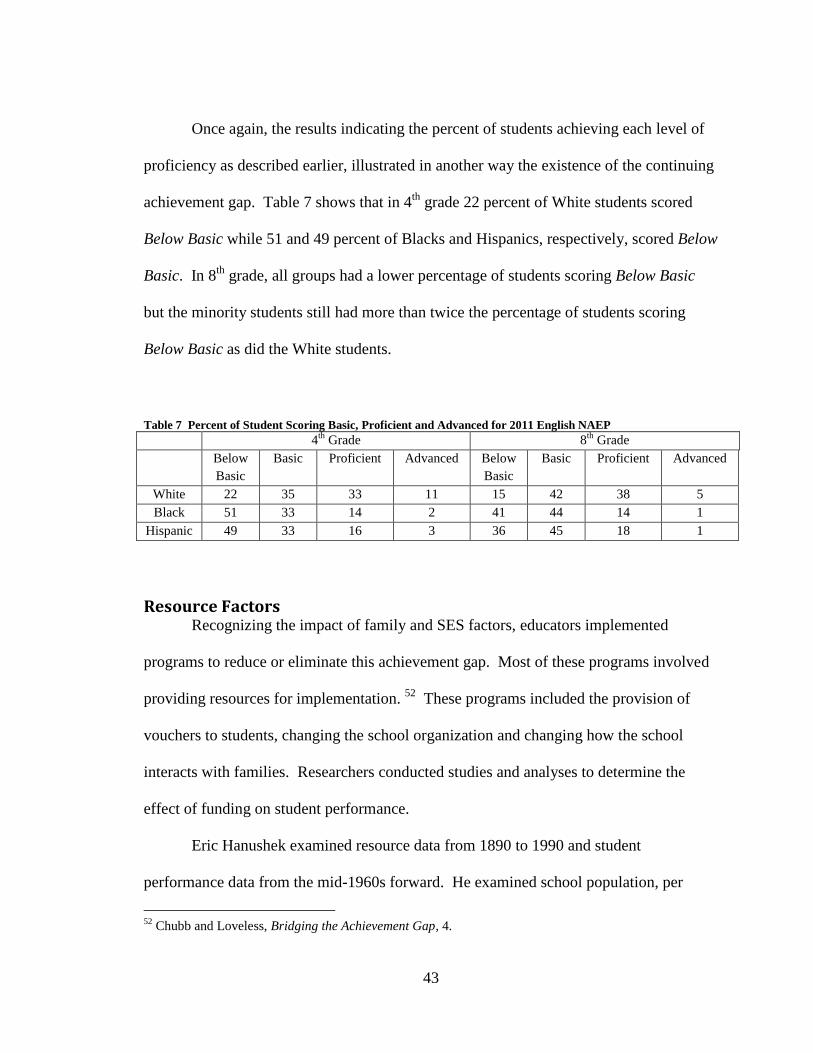
Once again, the results indicating the percent of students achieving each level of
proficiency as described earlier, illustrated in another way the existence of the continuing
achievement gap. Table 7 shows that in 4th
grade 22 percent of White students scored
Below Basic while 51 and 49 percent of Blacks and Hispanics, respectively, scored Below
Basic. In 8th
grade, all groups had a lower percentage of students scoring Below Basic
but the minority students still had more than twice the percentage of students scoring
Below Basic as did the White students.
Table 7 Percent of Student Scoring Basic, Proficient and Advanced for 2011 English NAEP
4th
Grade 8th
Grade
Below
Basic
Basic Proficient Advanced Below
Basic
Basic Proficient Advanced
White 22 35 33 11 15 42 38 5
Black 51 33 14 2 41 44 14 1
Hispanic 49 33 16 3 36 45 18 1
Resource Factors Recognizing the impact of family and SES factors, educators implemented
programs to reduce or eliminate this achievement gap. Most of these programs involved
providing resources for implementation. 52
These programs included the provision of
vouchers to students, changing the school organization and changing how the school
interacts with families. Researchers conducted studies and analyses to determine the
effect of funding on student performance.
Eric Hanushek examined resource data from 1890 to 1990 and student
performance data from the mid-1960s forward. He examined school population, per
52
Chubb and Loveless, Bridging the Achievement Gap, 4.

44
pupil spending and the growth of spending due to the number of students, the decrease in
the student-teacher ratio and the associated input costs. Hanushek used Scholastic
Aptitude Test (SAT) and National Assessment of Educational Progress (NAEP) data as
measures of student achievement. 53
He also analyzed data provided in 377 other studies
conducted and concluded that “no strong or systematic relationship exists between
spending and student performance.” 54
Larry Hedges, however, took issue with Hanushek’s interpretation of the data. He
argued that over that period two important changes occurred. First, the level and
comprehensiveness of education had increased. In other words, students are learning
more in 1990 than in 1890, as indicated by the rate of secondary school graduation that
increased substantially over that period. 55
Hedges also noted that the home environment
had changed in recent decades and in order for student performance to remain even level
over this period, the schools must have improved their effects on student learning and this
is associated with the increase in resources available.
After arguing opposing sides of the question ‘do resources matter?’, Eric
Hanushek and Larry Hedges came closer to agreement than would be expected.
Hanushek concluded, “the central issue in all policy discussion is usually not whether to
spend more or less on school resources but how to get the most out of marginal
expenditures.” 56
Hedges similarly concluded, “discussion of school reform should not
proceed under a mandate of flat resources but should instead incorporate an assessment
53
Hanushek, “Does Money Matter?,” 47–53. 54
Ibid., 54–62. 55
Hedges and Greenwald, “Does Money Matter?,” 74–80. 56
Hanushek, “Does Money Matter?,” 69.

45
of the current relation between inputs and outcomes and determine how to best allocate
resources in specific contexts.” 57
David Grissmer conducted a study for RAND in 2000 in which he examined
state-level achievement scores on NAEP math and reading tests from 1990 to 1996. He
examined state systemic reforms from the 1980s, including the establishment and
alignment of standards with assessments, professional development initiatives,
accountability, the increase in certification / recertification standards, pre-kindergarten
subsidies for low-income families, reduced class sizes, charter schools, choice and
contract schools, teacher experience, teacher advanced degrees, and resource allocation
as demonstrated by lower pupil-teacher ratios, spending per student and increased teacher
salaries. All of these reforms required resources to implement effectively. He noted,
“measurements at the state level have shown very consistent and robust positive effects
of added resources on educational outcomes, while measurements at lower levels of
aggregation show less-positive and more-inconsistent effects” (emphasis added).58
In
other words, increases in resources available for education across the entire state
improved student achievement levels, but within state differences in resources did not
have the same positive effects on student achievement.
Grissmer believed that resources can make a difference. Between state rather
than intra-state differences in resources were the main reasons for inequitable resource
levels for low-SES students. He cautioned, however, that the state factors identified
explained less than one-half of the differences in achievement. The remaining variance
57
Hedges and Greenwald, “Does Money Matter?,” 90. 58
Grissmer et al., Improving Student Achievement: What State NAEP Test Scores Tell Us, xix.
46
can be unmeasured family characteristics, unmeasured educational system characteristics,
characteristics of other social support systems or other factors creating social capital in
the states, i.e., private foundations. In addition, Grissmer warned that these results lag
policy implementation substantially. Policy makers should not expect instant results. 59
In a 2010 book, Linda Darling-Hammond argued strongly that the amount of
resources spent on education does affect student achievement. To support this position
she examined data from South Carolina and Massachusetts. Her analysis included
minority and poverty factors, as well as teacher qualifications, teacher salaries and
student-teacher ratios factors. In South Carolina her analysis included four models
examining her data. The first model included poverty and demographic factors as
independent variables and showed that the poverty index and the percentage of Black
students contributed to almost 80 percent of the variance of the percentage of students
scoring below basic on the state tests. Model 2 included teacher characteristics and
contributed only 64 percent of the variance to the student achievement measure. Model 3
added other resource factors—student-teacher ratio, average teacher salary and percent
portable classrooms—to Model 2. None of these three factors was statistically significant
and together they only added one percent to the R-squared coefficient. When Darling-
Hammond included all of the student qualification and other resource factors to Model 1
to develop Model 4, Model 4 added only five percent to the explanation of variance of
the student achievement variable.
59
Ibid., xxiii – xxxvii.

47
Her analysis of the Massachusetts results similarly showed that while there may
be some relationship between resources and student achievement, the family and SES
factors still provided greater effects on student achievement than do the resource
factors.60
Results for all of these studies are extremely nuanced and examine specific
factors. Together these studies and reports demonstrated that in some cases there has
been some improvement in performance attributable to the resources provided to the
schools over the past decades. However, researchers have not always identified the
programs or other factors impacted by the increased resources and that were the root
causes of any improved student achievement. In addition, the effects of the resource
increase have not been large enough to make the broad general statement that increased
resources will increase student performance substantially. Educators and researchers
must continue to look for those specific factors and programs tied to the provision of
resources that will incontrovertibly improve student performance. Any improvement in
student achievement related to increased provision of resources ultimately must be tied to
what the resources provide for the students. An increase in resources that are provided to
what turn out to be ineffective programs will not improve student performance.
However, if resources fund effective programs, student achievement can be expected to
improve. Identifying the effective and the ineffective programs becomes the challenge
for educators and helps to explain why the studies do not show consistent and large
effects on student achievement related to increased resources. In addition, even in studies
60
Darling-Hammond, The Flat World and Education, 113–119.
48
where some improvement in student achievement was shown to be caused by increased
resources, family and SES effects still dwarfed the effects of the resources.
Pupil-Teacher Ratios – A Special Case of Resource Factors A school factor related to the provision of resources is the Pupil-Teacher Ratio
(PTR). This is also referred to as Class Size Reduction (CSR). 61
Brookings Institution
publishes an annual volume of papers on education policy. The topic for its 2006/2007
volume was small school and small classes.62
In a paper in that volume, Doug Harris
noted the support of both parents and teachers for decreased class sizes. 63
With this
support that CSR programs engender, it is no wonder that many states and localities have
focused resources on maintaining small class sizes.
In some cases, these programs were established and supported with no real
demonstrable evidence of benefits from these programs. In a 1979 review and meta-
analysis of existing studies by Gene Glass and Mary Lee Smith, Glass and Smith state in
the introduction that “(t)he notion is wide-spread among educators and researchers that
class size bears no relationship to achievement. It is a dead issue in the minds of most
instructional researchers. To return to the class-size literature in search of defensible
interpretations and conclusions strikes many as fruitless.” 64
However, they persevered in
this study using advanced statistical techniques that had not previously been applied to
this issue and concluded that there was a strong relationship between class size and
61
Loveless and Hess, “Introduction: What Do We Know About School Size and Class Size?,” 1–2.,
Konstantopoulos ,“Do Small Classes Reduce the Achievement Gap between Low and High Achievers?
Evidence from Project STAR” p. 275. 62
“Brookings Papers on Education Policy: 2006-2007 - Brookings Institution.” 63
Harris, “Class Size and School Size: Taking the Trade-Offs Seriously,” 139, 153. 64
Glass and Smith, “Meta-Analysis of Research on Class Size and Achievement,” 2.
49
student achievement. Due to the criticism this study received 65
and the fact that no other
research was conclusive, the Tennessee legislature authorized a “well-designed study of
class size before investing in a costly new program.” 66
This study became the Student / Teacher Achievement Ratio (STAR) Project,
which is arguably the most notable study of CSR in recent decades. 67
In 1985, the
STAR project began a four year study to determine whether students in small classes had
greater academic achievement than students in larger classes. Entering kindergarten
students in the participating schools were randomly assigned to small classes, regular
classes or regular sized classes with a teacher’s aide. The students remained in these
size-type classes for the four years of the study. The state tracked their performance not
only for the four years of the study but for an additional two years through the 5th
and 6th
grades.68
Diane Schanzenbach of the Brookings Institution analyzed the results of the
Tennessee STAR experiment in 2006, looking at the immediate and some long-term
effects. She confirmed the overall benefit to all students of the small class size of
approximately .15 standard deviation on the Stanford Achievement Test for each grade.
Black students benefited about twice as much as White students and free lunch eligible
students benefited about .055 standard deviations more than students not eligible for free
lunch. She then examined the rate of the Tennessee STAR students’ rate of taking a
college entrance exam. While there was no statistical difference for white students there
was a five percentage point increase (from 33 to 38 percent) in Project STAR Black
65
“Class Size Research: A Critique of Recent Meta-Analyses.” 66
Word, Johnston, and Bain, The State of Tennessee’s STAR Project-Final Summary Report, 2. 67
Word, Johnston, and Bain, The State of Tennessee’s STAR Project-Final Summary Report. 68
“ClassSizeSTAR.pdf.”
50
students’ rate of taking a college entrance exam than for no-Project STAR Black students
even after the Project STAR students returned to regular size classes in fourth grade. She
concluded after her study that “the benefits [of reducing class size] are sizable and long
lasting, especially for black students.” 69
Teacher Characteristics One group of specific factors related to resources that is thought to improve
student achievement is that of teacher qualifications. Many studies examined teacher
qualification factors and their effects on student achievement.
In 1991, Ronald Ferguson examined nearly 900 school districts in Texas seeking
to determine the effect of resources on student test scores. This study encompassed over
2.4 million students. His results showed that between one-third and one-half of the
variation in students’ scores was due to quality of schooling and that most of the effect of
schooling was due to teachers’ scores on the state recertification exams, with experience
and master’s degrees contributing to the schooling effect. Controlling for the correlation
between SES and teacher quality, Ferguson demonstrated the separate effect of teacher
quality. In addition, Ferguson’s analysis showed that since teachers preferred higher
salaries, districts that provided those higher salaries got the pick of the better teachers.
Therefore, Ferguson confirmed a link between the provision of more resources and
teacher quality leading to improved student achievement. He argued that states can
equalize teacher quality by focusing their efforts and resources on salary differentials to
make the different school districts equally attractive to all teachers.
69
Schanzenbach, “What Have Researchers Learned from Project STAR?,” 224.
51
Ferguson’s analysis indicated statistically significant effects of teacher TECAT
scores, teacher experience and percent of teachers with master’s degrees on student test
scores on the reading and mathematics Texas Educational Assessment of Minimum Skills
exams, the Texas statewide exams.
However, Ferguson’s results also indicated that parents’ education levels,
especially the percentage of parents who have some college education and other
demographic factors such as female head of households are statistically significant
factors of student achievement. After reviewing all of his data, Ferguson concluded that
“higher quality schooling produces better reading skills among public school students and
that when targeted and managed wisely increased funding can improve the quality of
public education.” 70
Abigail and Stephen Thernstrom also examined and discussed the impact of
teacher quality on student achievement in their 2003 book, ‘No Excuses: Closing the
Racial Gap in Learning’. One of the problems they noted is the inability to identify the
attributes of what makes a good teacher and thus identify the good teachers. A recent
study they cited found only a small contribution to student learning by considering the
traditional measures of teacher quality such as teacher experience and advanced degree
obtained.
One means that some states use is to identify good teachers is to require teachers
to pass minimum competency tests. The tests vary from state to state in degree of
difficulty and, at the time of their book, state enforcement of the requirements to pass the
70
Ferguson, “Paying for Public Education,” 488.
52
tests also varied widely. They also discussed teacher candidate performance on the
Praxis I and II standardized tests, which are used across the nation to qualify students for
teacher training programs and to then license them to teach in the various states. They
contended that the rigor of these tests is insufficient to differentiate among good teachers.
The Praxis series of tests simply served to preclude from teaching those candidates who
truly would make terrible teachers.
Another measure of teacher quality is experience and the achievement of
advanced degrees. The Thernstroms contended that these measures also provided only
marginal impacts on student achievement.
Arguing that these traditional measures of teacher quality do not measure what
makes a truly good teacher, the Thernstroms do take note of James Coleman’s report and
a reanalysis that was completed thirty years after the initial issuance of the report. They
stated that one indicator of a positive impact on student performance was the vocabulary
of the teacher. Students of teachers with a rich vocabulary performed better than students
of teachers without the same rich vocabulary.
They also pointed out that several studies found that teachers from prestigious
colleges positively impacted student performance more than those teachers that did not
attend prestigious colleges. Overall, the Thernstroms discussion led to the conclusion
that there are some indications that high quality teachers can affect student achievement
but that it is difficult to identify those attributes of teachers that are related to improved
student performance.
53
In 2008 Harris and Sass updated a previously published paper on teacher training,
education, experience and education prior to entering the teaching profession. They
examined a rich store of data from the Florida Department of Education that allowed
them to track individual student achievement on the Florida Comprehensive Achievement
Test. A detailed dataset of school administrative linked each student and the teachers
assigned to each student throughout the student’s academic career. In addition, the
Florida data contained extensive data on the pre-service education of the teachers who
attended college in the state of Florida. For more recent teachers, this included their
college transcripts. 71
The initial focus of their results was on teachers’ experience, advanced degrees
earned, in-service professional development and undergraduate education. They found
generally positive, but mixed, results for teacher experience. The positive results for
teacher experience were in the early years at the elementary level. They found no
evidence for improved student achievement tied to a teacher possessing an advanced
degree. The exception to this finding was at the middle school level for mathematics
teachers. 72
Harris and Sass found no positive effects for in-service professional development
with a notable exception for prior professional development for middle and high school
math teachers. They noted that the professional development training that provided the
71
Harris and Sass, Teacher Training, Teacher Quality and Student Achievement, 15–18. 72
Ibid., 30.
54
positive effects was training on content areas rather than training in education-focused
areas. 73
The results of their study also indicated, with one exception, no value added by
obtaining a degree in education versus a non-education degree. The lone exception was
that middle school reading teachers who were English / Language Arts education majors
provided better student outcomes than those who are non-education majors. This
exception became insignificant when college entrance exam scores are considered.
Finally, their results indicated that for high school math teachers in education programs,
an increase in the number of content courses taken correlated positively with improved
student achievement. 74
However, schools strove to meet the requirements of AYP. Sarah Fuller and
Helen Ladd recently conducted an analysis of schools in North Carolina to determine
whether the accountability requirements of NCLB led school administrators to place
higher quality teachers in the grades subject to the NCLB assessments, i.e., 3rd
- 5th
grade
and above, to the detriment of the lower grades, K - 2. 75
They gathered information for
schools across North Carolina for the years 1995 – 2009. They examined several
different measures of teacher quality, including years experience, advanced degrees,
possession of elementary education license and licensure test scores, and compared these
teacher characteristics for the years 1995 and 2009. They determined that, with the sole
exception of teacher experience in 2009, the lower grades had a quality disadvantage
73
Ibid., 31. 74
Ibid. 75
Fuller and Ladd, School Based Accountability and the Distribution of Teacher Quality Among Grades in
Elementary School.

55
compared to the upper grades. In 2009, the lower grades had a small quality advantage
compared to the upper grades. 76
Fuller and Ladd then settled on using licensure test scores for the bulk of their
analysis. Their results indicated that beginning in 2003, the year that NCLB reporting
began, the difference in teacher quality between the upper and lower grades became
significantly larger than it previously was. They concluded that the “incentives created
by the NCLB accountability system increased the strategic placement of the stronger
teachers in the upper grades.” 77
Finally, they concluded that when a school failed to
meet its AYP objective in a given year, the school reacted and moved stronger teachers to
the upper grades. 78
Qualitative Examples Although these studies and others describe quantitative results from measurable
characteristics taken from the school, family and social environments, there are a number
of examples of individual schools and individual programs that have achieved success in
today’s educational environment and which do not yet demonstrate their success based on
a relationship with some measured input.
In 2004, the Education Trust and four other organizations established the
Achievement Alliance to publicize schools that had high minority populations and high
student achievement. Karin Chenowith authored a book, It’s Being Done, that described
her observations visiting 15 schools that satisfied those two criteria. She explained in the
introduction that, while the Education Trust was able to identify these schools, it could
76
Ibid., 13. 77
Ibid., 16. 78
Ibid., 21.
56
not explain why the schools performed so well. 79
In her conclusion, she came to realize
that “there is no single factor that is at the core of a successful school.” 80
However, she
did identify 25 characteristics and practices of the schools that she believed contributed to
the success of these schools. Many of these characteristics were hard to quantify, such as
noting that the schools use time wisely or the schools base their decisions on what is good
for the children, not the adults. This makes it difficult to include them in any quantitative
analysis. She also noted that each of the successful schools had its own character and it
would be difficult to change the character of all schools to match any one of the
successful schools.
Other examples of the promise of certain schools to overcome the challenges identified
initially by James Coleman were documented in the documentary film and the
accompanying book “Waiting For Superman”. Davis Guggenheim filmed children and
their families participating in lotteries for the chance to attend a particularly desired
school in their communities, or as Karl Weber stated in the accompanying book, the
diamonds that emerged in those cities. He stated that “families are flocking to those few
exemplary public schools.” 81
79
Chenowith, It’s Being Done, 2–3. 80
Ibid., 213. 81
Weber, Waiting for “Superman,” 17.
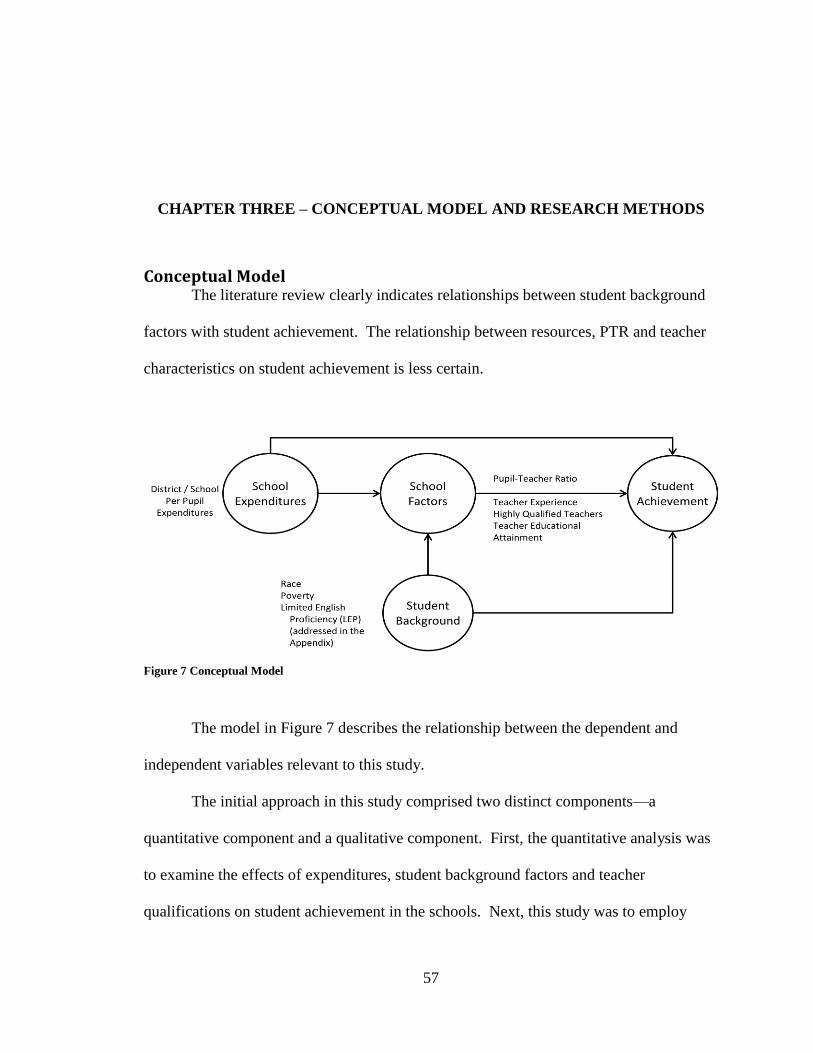
57
CHAPTER THREE – CONCEPTUAL MODEL AND RESEARCH METHODS
Conceptual Model The literature review clearly indicates relationships between student background
factors with student achievement. The relationship between resources, PTR and teacher
characteristics on student achievement is less certain.
Figure 7 Conceptual Model
The model in Figure 7 describes the relationship between the dependent and
independent variables relevant to this study.
The initial approach in this study comprised two distinct components—a
quantitative component and a qualitative component. First, the quantitative analysis was
to examine the effects of expenditures, student background factors and teacher
qualifications on student achievement in the schools. Next, this study was to employ

58
qualitative analysis to identify individual school classroom practices that may have
contributed to the improvement in student achievement. Identification and analysis of
these practices did not lend itself to a quantitative approach since objective data
identifying different classroom practices over time has not been collected. The
qualitative approach was to have elicited from different teachers and principals the
policies and practices implemented in the last decade to respond to the strict
accountability provisions imposed on them by the NCLB Act.
Based on the model developed in the quantitative analysis, schools were identified
that had high poverty and high minority populations and that performed better than
predicted by the model. Eight schools in five school districts were identified for the
study and five schools in the same districts were identified as control schools for this
study. Following identification of those schools, the school district central office
representatives were contacted to obtain permission to interview the principals and some
teachers in accordance with the school district policies. Only one school district agreed
to allow its teachers and principals to be interviewed – and this was only for two of the
three requested schools for that district. Following this development the qualitative
component of the study was eliminated.
Research Questions and Approach. This study investigates factors that contributed to improved student achievement
since the imposition of the NCLB accountability measures in 2002, as measured by the
Virginia SOL assessments. Specifically, this study examines the pass rates in
Mathematics and in Reading over the past decade and focuses on three cohorts of 5th
59
grade students. The study first examines overall changes in student pass rates over time.
It then focuses on the improvement in student achievement as measured by 5th grade
assessments for SY 2007 – 2009 using regression analysis. It examines the effects on
student achievement by student background, teacher characteristics and school resource
variables. It uses 5th
grade student achievement as the primary dependent variable, and it
introduces a lagged 3rd
grade covariate for each cohort to control for earlier achievement.
The research question addressed in this study is “What factors influenced student
achievement in Virginia for 5th grade students since the passage of NCLB?” Factors to
consider include student background factors, school and teacher characteristics and
district expenditures. Student background factors include race, poverty and English
proficiency. Expenditures include district per pupil expenditures of various categories.
Teacher characteristics include percentage of HQTs, teacher educational attainment and
teacher experience. A school factor considered is the PTR. These factors are examined
by quantitative analysis. The dependent variables are 3rd
and 5th grade achievement.
Hypotheses Based on initial examination of the data and previous research reviewed for this
paper, the following hypotheses are proposed.
Student background factors have large effects on student achievement and growth
in achievement for 3rd
and 5th
graders in Virginia.
School resources have small effects on improved student academic achievement.
The school characteristic of PTR has a small effect on improved student academic
achievement for 3rd
and 5th
graders in Virginia.

60
Teacher qualifications have small effects on improved student academic
achievement for 3rd
and 5th
graders in Virginia.
Student achievement in earlier grades, specifically 3rd
grade, has a large effect on
student achievement in later grades for 5th
graders in Virginia.
Detailed Methodology
Data Collection The quantitative analysis is a longitudinal study of the relevant factors identified
above over an eleven year period at the school level in 3rd
and 5th
grades in Virginia.
Available data is identified in Appendix B – Available Data.
Due to the different sources and databases available for this analysis, all variable
data are available only for SY07 through SY09. Those three years comprise the three
cohorts that provide the required data for the regression analysis. These years were
chosen based on the availability of all data elements from all of the different data sources.
Data are for a school year that begins in June and ends in May of the following
year. For example achievement data for the SOL assessments conducted in May 2004
would be identified as School Year 04. The expenditures data for that year is the
expenditures of that school district beginning in July2003 through June 2004. The
demographic data represent the data compiled for the School Year 2004 membership,
which were gathered in the September 2003 Fall Membership reports. Teacher
qualification data are for the teacher data gathered for the school year beginning in
September 2003.
61
Achievement Data. The Pass Rate for all students by school for 3rd
and 5th
grades
is the dependent variable in this study. It was obtained from the Virginia Department of
Education website (https://p1pe.doe.virginia.gov/datareports/assess_test_result.do). A
series of customized reports provided the Pass Rate for all students who attempted the
state SOL Assessments at the end of the school year. The data are identified by school
district and individual school for the 3rd
and 5th grades by school year from School Year
2001 – 2011. 82
Student Background Data. Student Background data were similarly obtained
from the Virginia Department of education website
(http://www.doe.virginia.gov/statistics_reports/enrollment/fall_membership/archive_data.
shtml). Data were obtained for the school district and school for grades three and five for
the various racial group identifiers. The data were collected for School Years 2003
through 2011.
Poverty data were obtained from the Virginia Department of Education website
for economically disadvantaged students. 83
Virginia defines an ‘economically
disadvantaged’ student as one who:
is eligible for Free/Reduced Meals,
receives Temporary Aid to Needy Families (TANF), or
is eligible for Medicaid.
Expenditure Data. Educational expenditures data were obtained from the United
States Department of Education (US DOE) School District Finance Survey (F-33) Reports.
82
“Virginia Assessment Results.” 83
“VDOE Fall Membership - Custom Reports.”“VDOE :: Data Collections :: Student & School Records ::
Student Records Data Definitions.”

62
Expenditure data is provided by school district rather than by individual schools. This
data element was divided by the number of pupils in the school districts to obtain per
pupil expenditures for each school district. The US DOE School District Finance Survey
Reports were available from FY 2001 through 2009. 84
Teacher Data. Teacher qualification data includes the percentage of teachers in a
school that met the requirements to be considered a HQT. This designation was
developed by the Virginia DOE as part of its compliance with NCLB provisions.
Teacher qualifications also include the percentage of teachers in a school that held
advanced degrees, either a Masters or a Doctorate and those who hold only a Bachelor’s
Degree. The Virginia Department of Education provided this data for FY04 through
FY09 in response to a special request.
Teacher characteristics also include the average years of teaching experience for
the teachers by school for the years FY2007 through FY2011. Again, these data were
provided by the Virginia Department of Education in response to a special request.
Pupil Teacher Ratio (PTR). The final school resource variable, PTR, was
obtained from the US DOE website (http://nces.ed.gov/ccd/bat/index.asp). This data is
part of the National Center for Education Statistics Common Core of Data. PTR data
exhibited aberrations for one district in one school year where PTR was unexpectedly and
extremely low. Examining all PTR data led to the exclusion of PTR less than five and
greater than 30 to precluded skewing the results.
84
“Common Core of Data (CCD) - Local Education Agency (School District) Finance Survey (F-33)
Data.”
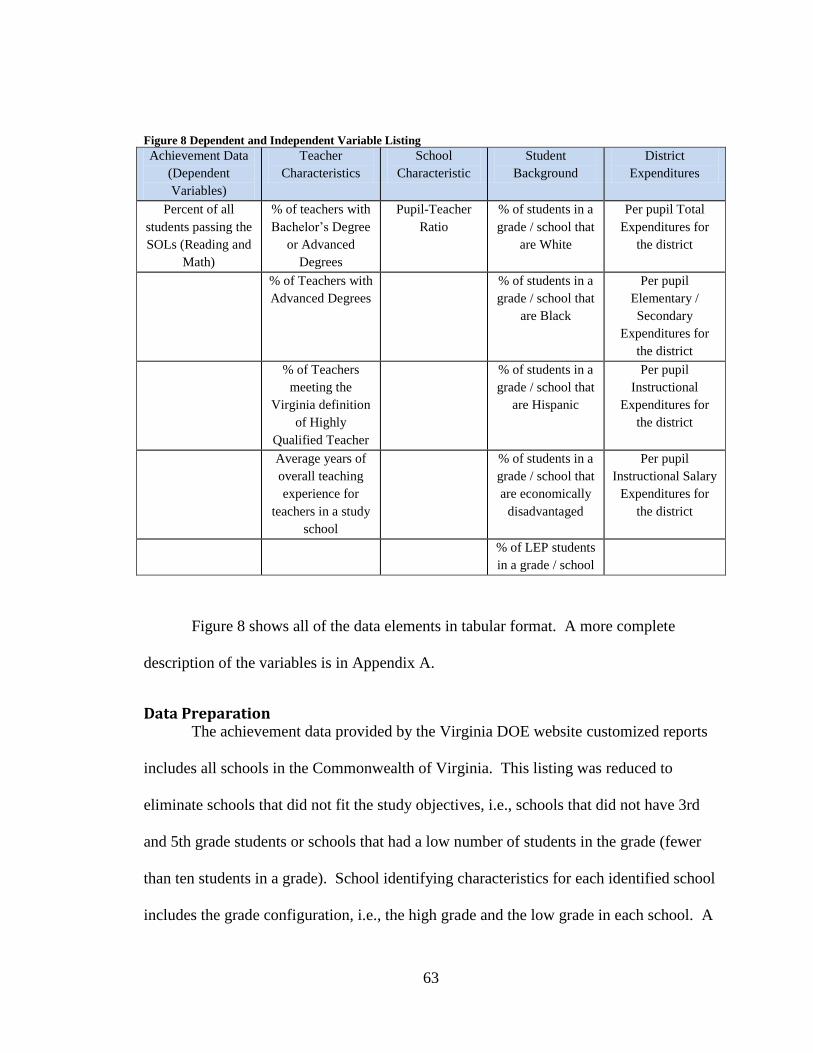
63
Figure 8 Dependent and Independent Variable Listing
Achievement Data
(Dependent
Variables)
Teacher
Characteristics
School
Characteristic
Student
Background
District
Expenditures
Percent of all
students passing the
SOLs (Reading and
Math)
% of teachers with
Bachelor’s Degree
or Advanced
Degrees
Pupil-Teacher
Ratio
% of students in a
grade / school that
are White
Per pupil Total
Expenditures for
the district
% of Teachers with
Advanced Degrees
% of students in a
grade / school that
are Black
Per pupil
Elementary /
Secondary
Expenditures for
the district
% of Teachers
meeting the
Virginia definition
of Highly
Qualified Teacher
% of students in a
grade / school that
are Hispanic
Per pupil
Instructional
Expenditures for
the district
Average years of
overall teaching
experience for
teachers in a study
school
% of students in a
grade / school that
are economically
disadvantaged
Per pupil
Instructional Salary
Expenditures for
the district
% of LEP students
in a grade / school
Figure 8 shows all of the data elements in tabular format. A more complete
description of the variables is in Appendix A.
Data Preparation The achievement data provided by the Virginia DOE website customized reports
includes all schools in the Commonwealth of Virginia. This listing was reduced to
eliminate schools that did not fit the study objectives, i.e., schools that did not have 3rd
and 5th grade students or schools that had a low number of students in the grade (fewer
than ten students in a grade). School identifying characteristics for each identified school
includes the grade configuration, i.e., the high grade and the low grade in each school. A

64
convention in place by the Virginia Department of Education to protect information for
individuals and to preclude any person who uses these reports from identifying individual
students and their performance is to suppress any numbers reported that are less than ten.
In examining the data for all students taking the tests, this limitation did not affect
the data collection and analysis for the category of ‘All Students’. However, in
disaggregating the data there was a substantial number of observations that contained
information that was suppressed due to low density of students in the 3rd and 5th grades
in individual schools in the various categories of disaggregation, i.e., race, poverty and
LEP. To conduct the study and address the study questions, the pass rates for all students
were used rather than disaggregated rates. The numbers and percentages of students in
these subgroups were available from the demographic reports.
The data preparation process for sorting and selecting the study schools began
with the 2008 schools provided in the customized report that was provided in an Excel
file. This includes every school in Virginia. Four files were obtained for each year of the
study—one file each for Grade 3 Reading, Grade 3 Math, Grade 5 Reading and Grade 5
Math.
Schools that had a low grade greater than third or a high grade lower than 5th
were deleted. Schools that had fewer than ten students taking the test were deleted. This
is an indication of specialized schools that were not identified previously and deleted
according to the grade configuration criteria. For example, a school may have had a
grade configuration identified as K – 8 but actually been a Middle School with only grade
6 – 8. These instances may have represented schools that recently changed their grade
65
configurations and the database was not updated to reflect the change or entries that were
improperly coded. In addition, these schools did not have an overall pass rate in the
grades of interest for ‘All Students’ and thus would not have provided an observation of
the dependent variable for analysis. This process thus generated the listing of schools to
be used in the analysis. Every year the number of schools varied due to schools opening,
closing or changing their grade configurations.
To uniquely identify each school and thus enable linkage with the data provided
by the other databases, a Unique ID was developed for each school. This was a
combination of the district identification number and the individual school identification
number used by the Virginia Department of Education. This was rather easily done for
the demographic and teacher characteristics reports from the Virginia Department of
Education.
As mentioned above, the Virginia Department of Education convention is to
suppress data for which the number of students is less than ten. The reports for
economically disadvantaged students followed this convention and suppressed data
identifying the number of economically disadvantaged students in a grade in a school or
the number in the entire school if the number was less than ten. There were a number of
grades in a school that met this criterion and thus the number of economically
disadvantaged students in the 3rd
of 5th
grade of the school was not available. Thus the
percent of economically disadvantaged students in that grade of the school was not
available.
66
In those cases the number of economically disadvantaged students in the entire
school was used with the number students in the school to compute the school percentage
of economically disadvantaged students. This percent was used for the grade for which
the number of economically disadvantaged students was not available. In some cases,
this school percentage was used for both the 3rd
and the 5th
grade in the school. This
assumed that the percentage of economically disadvantaged in each grade was
sufficiently close to the percentage of economically disadvantaged students in the entire
school, i.e., that the economically disadvantaged students were distributed equally
throughout the grade in the school.
The United States Department of Education (US DOE) District Fiscal Reports
using the Local Education Agency (School District) Finance Survey (F-33) Data and the
PTR reports posed a different problem. The US DOE does not use the same
identification numbers in its reports. Linking the resource data to each school was done
by attaching the school district Virginia identification number to each of the 134 school
districts in the F-33 reports.
Linking the US DOE data for school pupil-teacher ratios for the individual
schools was more complex. The schools were sorted in the Excel spreadsheets
alphabetically by school names and then manually compared to a listing of schools which
was developed from the Virginia databases and had the Unique ID attached.
After all of the date preparation described above, the school listing was complete.
Although the number of schools each year changed due to opening and closing of schools

67
and changes in grade configuration, the number of schools in each year for each grade
was approximately 1070.
Analysis The primary analytic approach for this study is analysis of covariance with Grade
5 achievement as the dependent variable and two-year lagged Grade 3 achievement as the
primary covariate. This covariate controls for earlier achievement for the same cohort of
children. This analysis will be conducted using the three cohorts for which all of the
variables are present, SY 07 - 09. Year is also entered as a fixed effect, thereby
controlling for cohort.
Prior to the main covariance analysis, two preliminary models are developed.
Model 1 is a cross-sectional regression for both Grade 3 and Grade 5 achievement in
order to determine school, teacher and expenditure effects prior to introducing the student
background variables. Model 2 adds the student background factors to the factors in
Model 1 to determine the school effects while controlling for student background. Model
3 examines the 3rd grade and is then followed by the 5th grade to determine the similarity
or difference of the school effects. Model 3 then introduce the lagged 3rd grade
achievement variable as a covariate for the Grade 5 achievement variable and examines
the 5th grade. Model 3 is the primary model for making inferences for school and
student effects on achievement. The Model 3 covariance equation is provided in Equation
1.

68
Equation 1 Model 3 Analysis of Covariance
Grade 5 Achievement = b0 + b1Gr3Ach Lag + b2Expenditures + b3PTR + b4%MA_Deg
+ b5% HQT + b6Yrs_Exp + b7%Black + b8%Hisp + b9%Pov + School_year + e
Prior to the development and presentation of the regression models, the analysis
presents the descriptive statistics—the mean and standard deviation of each of the
variables in the study. These are presented overall based on all available data from SY
07 - 09, which are the three years that contain complete datasets for all variables.
Next, the study examines the correlation matrices of all variables using the SY09
data. This examination assists in identifying relationships between and among the
variables and assists in choosing variables for the regression analysis, which follows.
The correlation matrices allow for an understanding of the different factors that comprise
the major categories of student background, expenditures and teacher characteristics.
This permits the selection of the expenditure variables that provide the best models for
this study.
Following the examination of the correlation matrices, the analysis begins the
cross-sectional regression analysis of pertinent variables to develop the models of student
achievement described above.
All analyses described in this section will be performed for both the Reading and
Math data separately. Quantitative results of the Reading and Math analyses are
compared and contrasted subjectively following the quantitative analyses.
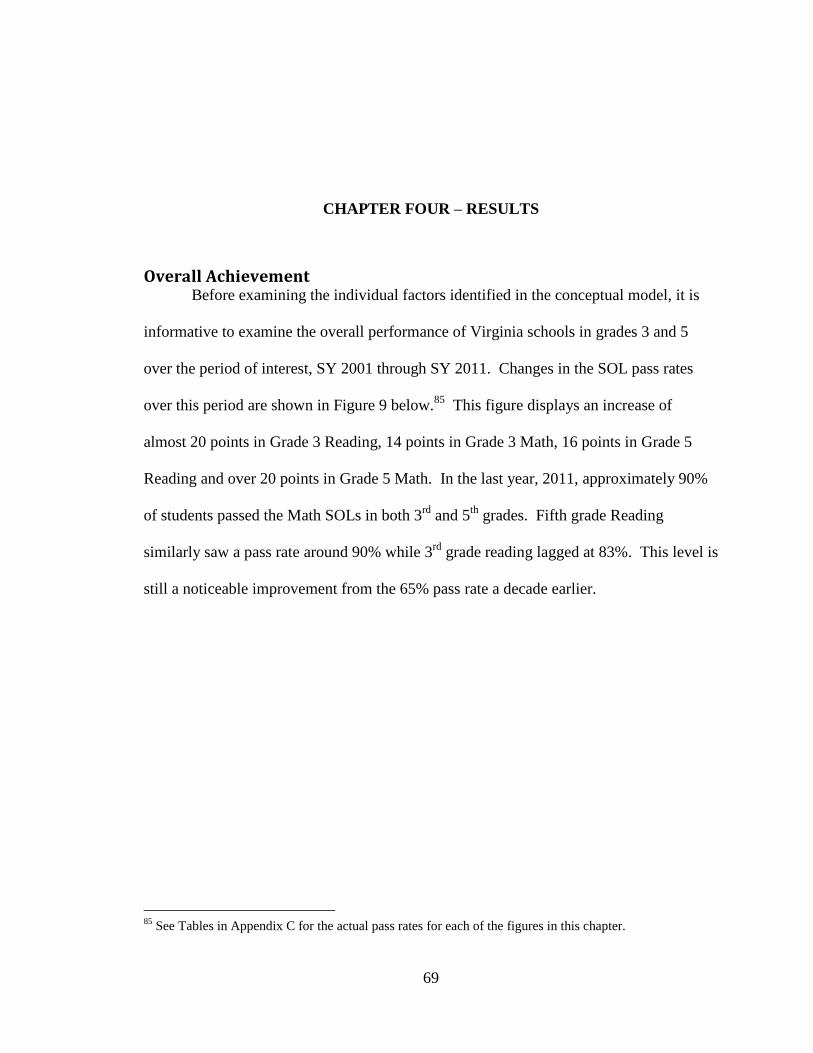
69
CHAPTER FOUR – RESULTS
Overall Achievement Before examining the individual factors identified in the conceptual model, it is
informative to examine the overall performance of Virginia schools in grades 3 and 5
over the period of interest, SY 2001 through SY 2011. Changes in the SOL pass rates
over this period are shown in Figure 9 below.85
This figure displays an increase of
almost 20 points in Grade 3 Reading, 14 points in Grade 3 Math, 16 points in Grade 5
Reading and over 20 points in Grade 5 Math. In the last year, 2011, approximately 90%
of students passed the Math SOLs in both 3rd
and 5th
grades. Fifth grade Reading
similarly saw a pass rate around 90% while 3rd
grade reading lagged at 83%. This level is
still a noticeable improvement from the 65% pass rate a decade earlier.
85
See Tables in Appendix C for the actual pass rates for each of the figures in this chapter.

70
Figure 9 Passing Rates for All Students in Grades 3 & 5 for Reading & Math
Trends in the Student Background Variables Student background has changed substantially over the past decade in Virginia,
although not to the degree of student achievement. Table 8 Changing Demographics in
Virginia Schools from 2003 to 2011displays the changing student background factors
over time from 2003 to 2011.
Table 8 Changing Demographics in Virginia Schools from 2003 to 2011
School Yr Percent of
Hispanic
students
Percent of Black
students Percent of White
students Percent of
Students in
Poverty 2003 6.1 27.0 61.7 37.6 2004 6.6 26.9 60.9 37.3 2005 7.1 26.6 60.2 37.2 2006 7.8 26.2 59.4 36.0 2007 8.2 25.7 58.6 36.7 2008 8.7 25.2 58.2 39.0
60
65
70
75
80
85
90
95
Grade 3 Reading
Grade 3 Math
Grade 5 Reading
Grade 5 Math
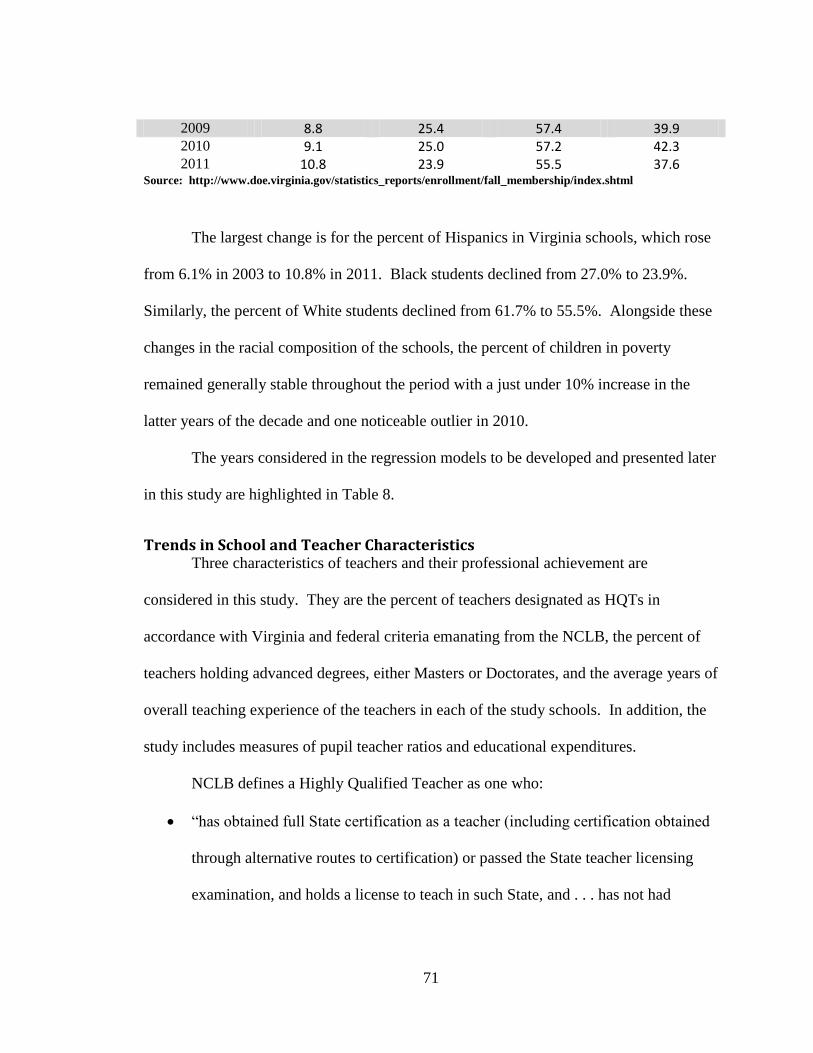
71
2009 8.8 25.4 57.4 39.9 2010 9.1 25.0 57.2 42.3 2011 10.8 23.9 55.5 37.6
Source: http://www.doe.virginia.gov/statistics_reports/enrollment/fall_membership/index.shtml
The largest change is for the percent of Hispanics in Virginia schools, which rose
from 6.1% in 2003 to 10.8% in 2011. Black students declined from 27.0% to 23.9%.
Similarly, the percent of White students declined from 61.7% to 55.5%. Alongside these
changes in the racial composition of the schools, the percent of children in poverty
remained generally stable throughout the period with a just under 10% increase in the
latter years of the decade and one noticeable outlier in 2010.
The years considered in the regression models to be developed and presented later
in this study are highlighted in Table 8.
Trends in School and Teacher Characteristics Three characteristics of teachers and their professional achievement are
considered in this study. They are the percent of teachers designated as HQTs in
accordance with Virginia and federal criteria emanating from the NCLB, the percent of
teachers holding advanced degrees, either Masters or Doctorates, and the average years of
overall teaching experience of the teachers in each of the study schools. In addition, the
study includes measures of pupil teacher ratios and educational expenditures.
NCLB defines a Highly Qualified Teacher as one who:
“has obtained full State certification as a teacher (including certification obtained
through alternative routes to certification) or passed the State teacher licensing
examination, and holds a license to teach in such State, and . . . has not had
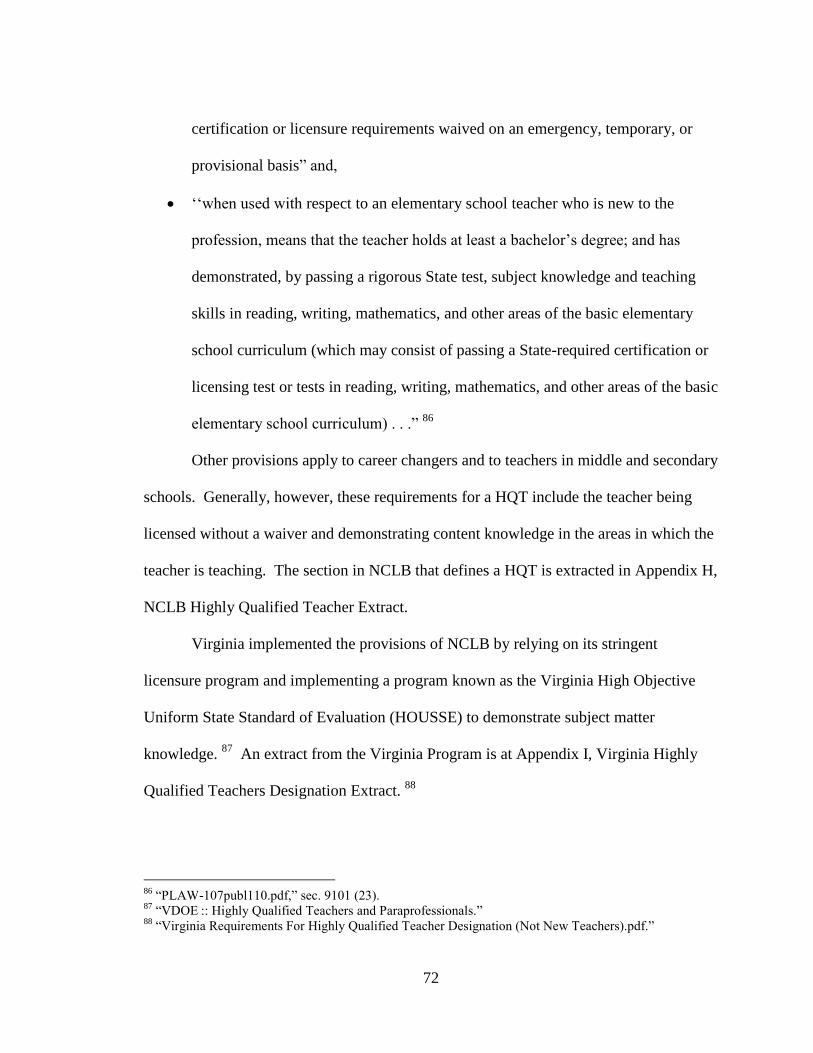
72
certification or licensure requirements waived on an emergency, temporary, or
provisional basis” and,
‘‘when used with respect to an elementary school teacher who is new to the
profession, means that the teacher holds at least a bachelor’s degree; and has
demonstrated, by passing a rigorous State test, subject knowledge and teaching
skills in reading, writing, mathematics, and other areas of the basic elementary
school curriculum (which may consist of passing a State-required certification or
licensing test or tests in reading, writing, mathematics, and other areas of the basic
elementary school curriculum) . . .” 86
Other provisions apply to career changers and to teachers in middle and secondary
schools. Generally, however, these requirements for a HQT include the teacher being
licensed without a waiver and demonstrating content knowledge in the areas in which the
teacher is teaching. The section in NCLB that defines a HQT is extracted in Appendix H,
NCLB Highly Qualified Teacher Extract.
Virginia implemented the provisions of NCLB by relying on its stringent
licensure program and implementing a program known as the Virginia High Objective
Uniform State Standard of Evaluation (HOUSSE) to demonstrate subject matter
knowledge. 87
An extract from the Virginia Program is at Appendix I, Virginia Highly
Qualified Teachers Designation Extract. 88
86
“PLAW-107publ110.pdf,” sec. 9101 (23). 87
“VDOE :: Highly Qualified Teachers and Paraprofessionals.” 88
“Virginia Requirements For Highly Qualified Teacher Designation (Not New Teachers).pdf.”
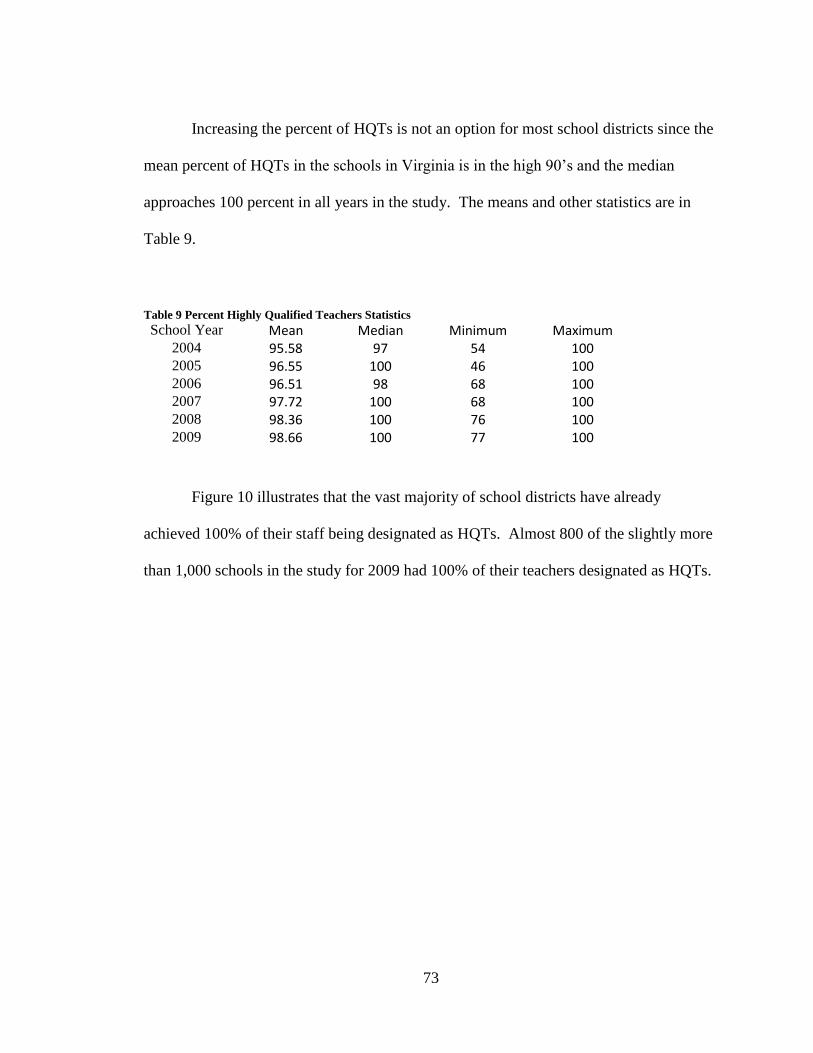
73
Increasing the percent of HQTs is not an option for most school districts since the
mean percent of HQTs in the schools in Virginia is in the high 90’s and the median
approaches 100 percent in all years in the study. The means and other statistics are in
Table 9.
Table 9 Percent Highly Qualified Teachers Statistics
School Year Mean Median Minimum Maximum 2004 95.58 97 54 100 2005 96.55 100 46 100 2006 96.51 98 68 100 2007 97.72 100 68 100 2008 98.36 100 76 100 2009 98.66 100 77 100
Figure 10 illustrates that the vast majority of school districts have already
achieved 100% of their staff being designated as HQTs. Almost 800 of the slightly more
than 1,000 schools in the study for 2009 had 100% of their teachers designated as HQTs.
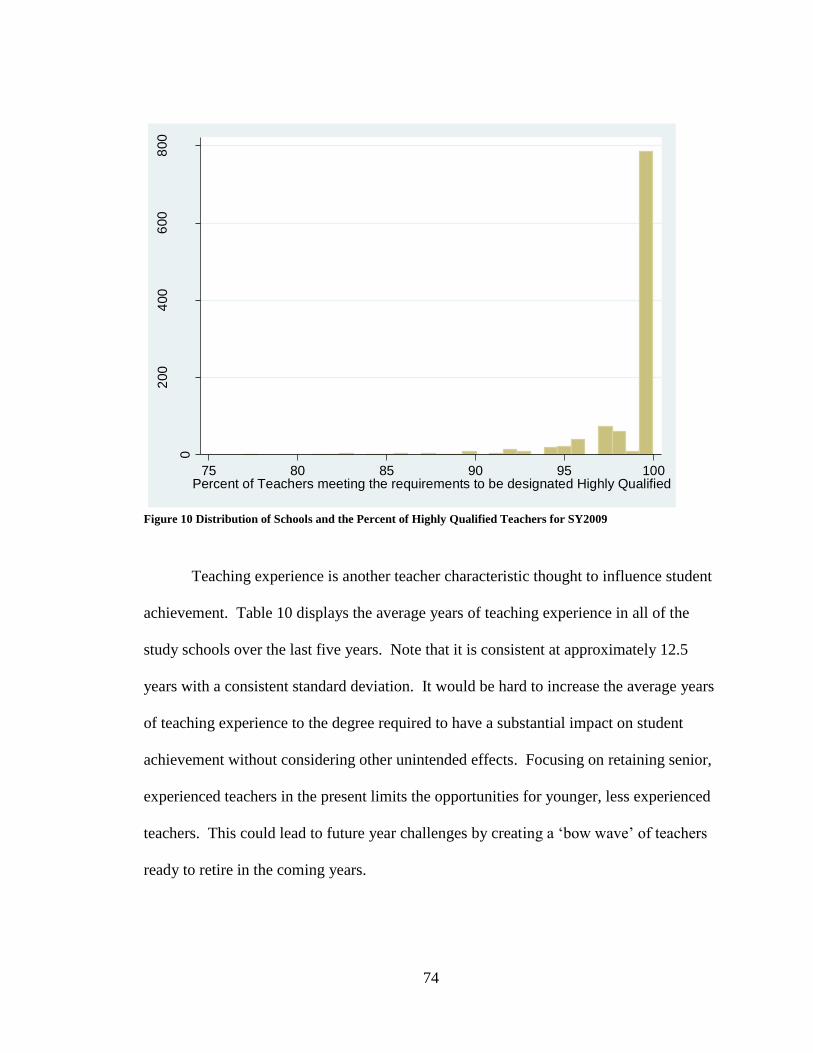
74
Figure 10 Distribution of Schools and the Percent of Highly Qualified Teachers for SY2009
Teaching experience is another teacher characteristic thought to influence student
achievement. Table 10 displays the average years of teaching experience in all of the
study schools over the last five years. Note that it is consistent at approximately 12.5
years with a consistent standard deviation. It would be hard to increase the average years
of teaching experience to the degree required to have a substantial impact on student
achievement without considering other unintended effects. Focusing on retaining senior,
experienced teachers in the present limits the opportunities for younger, less experienced
teachers. This could lead to future year challenges by creating a ‘bow wave’ of teachers
ready to retire in the coming years.
0
200
400
600
800
Fre
que
ncy
75 80 85 90 95 100Percent of Teachers meeting the requirements to be designated Highly Qualified

75
Table 10 Average Years of Teaching Experience in the Study Schools from 2007 – 2011
School Year Average Years Teaching Experience Mean Median Std. Dev.
2007 12.6 12.4 2.82 2008 12.4 12.3 2.88 2009 12.4 12.3 2.88 2010 12.6 12.6 2.84 2011 12.7 12.6 2.83 Total 12.5 12.5 2.85
While many school districts have an experienced a teacher cadre with a great deal
of experience, some school districts have a rather inexperienced school staff with lower
average years of experience. Figure 11 illustrates the distribution of the average years of
experience in the school districts in this study. Those with less than ten years average
teaching experience could increase the experience with programs designed to reduce staff
turnover.
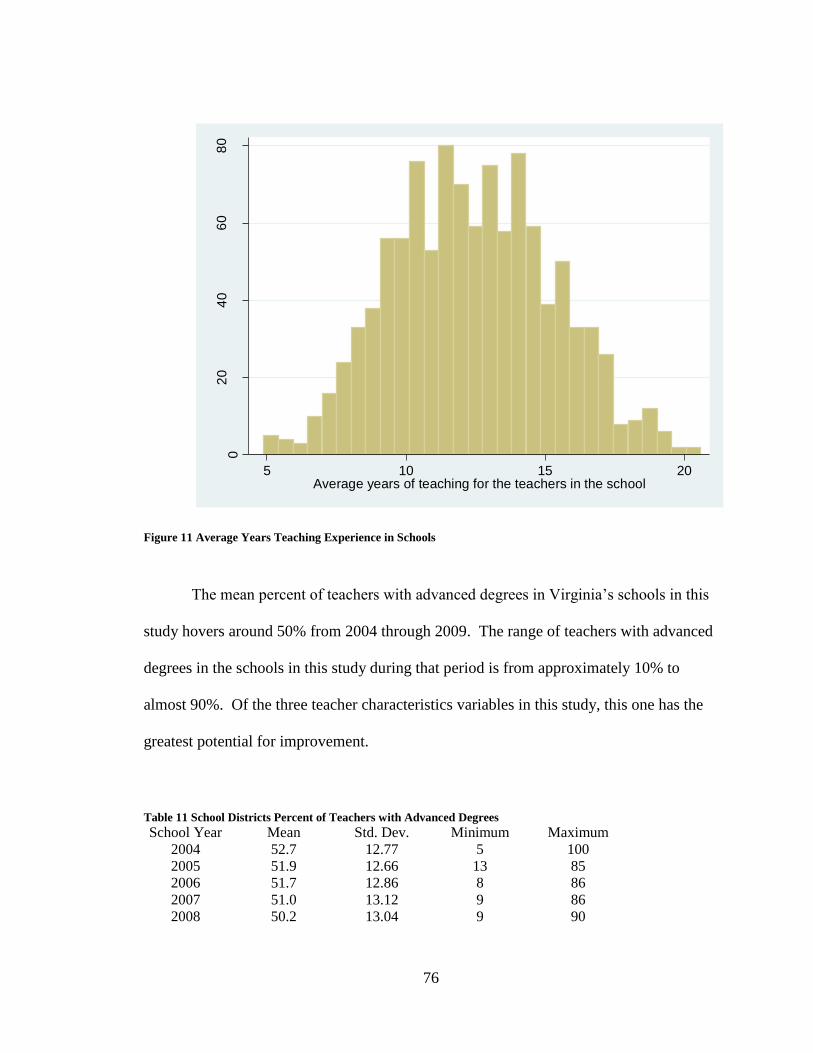
76
Figure 11 Average Years Teaching Experience in Schools
The mean percent of teachers with advanced degrees in Virginia’s schools in this
study hovers around 50% from 2004 through 2009. The range of teachers with advanced
degrees in the schools in this study during that period is from approximately 10% to
almost 90%. Of the three teacher characteristics variables in this study, this one has the
greatest potential for improvement.
Table 11 School Districts Percent of Teachers with Advanced Degrees
School Year Mean Std. Dev. Minimum Maximum 2004 52.7 12.77 5 100 2005 51.9 12.66 13 85 2006 51.7 12.86 8 86 2007 51.0 13.12 9 86 2008 50.2 13.04 9 90
02
04
06
08
0
Fre
que
ncy
5 10 15 20Average years of teaching for the teachers in the school
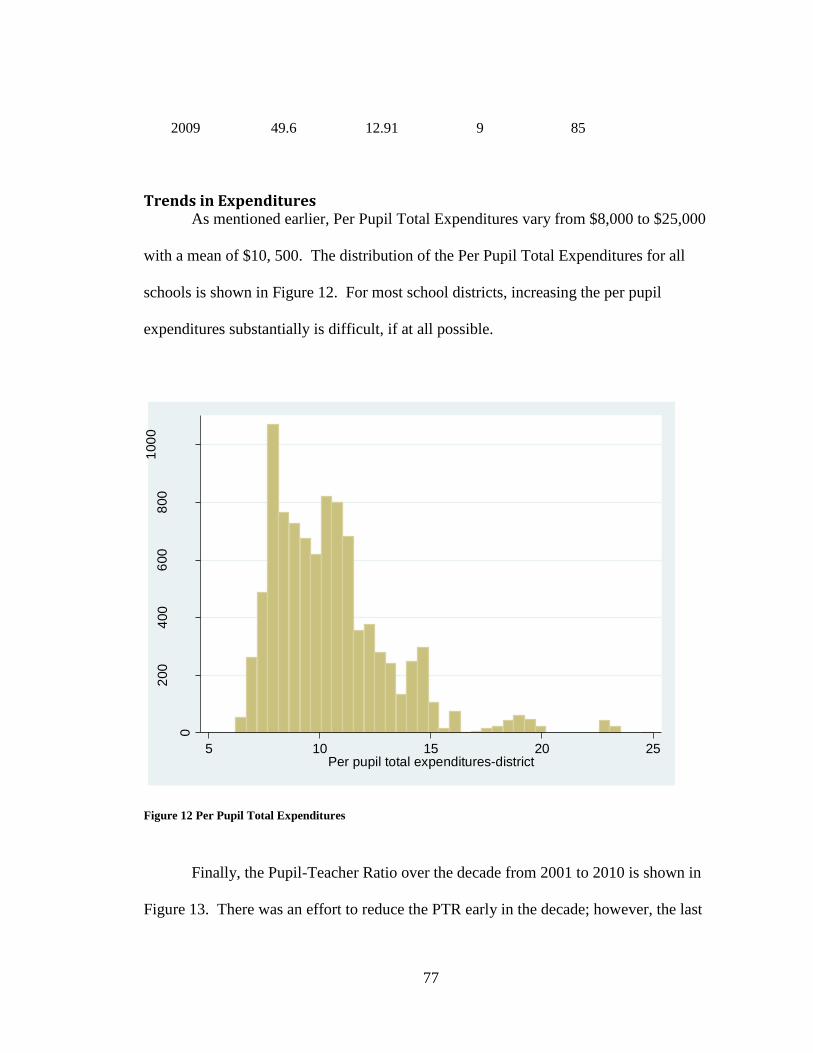
77
2009 49.6 12.91 9 85
Trends in Expenditures As mentioned earlier, Per Pupil Total Expenditures vary from $8,000 to $25,000
with a mean of $10, 500. The distribution of the Per Pupil Total Expenditures for all
schools is shown in Figure 12. For most school districts, increasing the per pupil
expenditures substantially is difficult, if at all possible.
Figure 12 Per Pupil Total Expenditures
Finally, the Pupil-Teacher Ratio over the decade from 2001 to 2010 is shown in
Figure 13. There was an effort to reduce the PTR early in the decade; however, the last
0
200
400
600
800
100
0
Fre
que
ncy
5 10 15 20 25Per pupil total expenditures-district
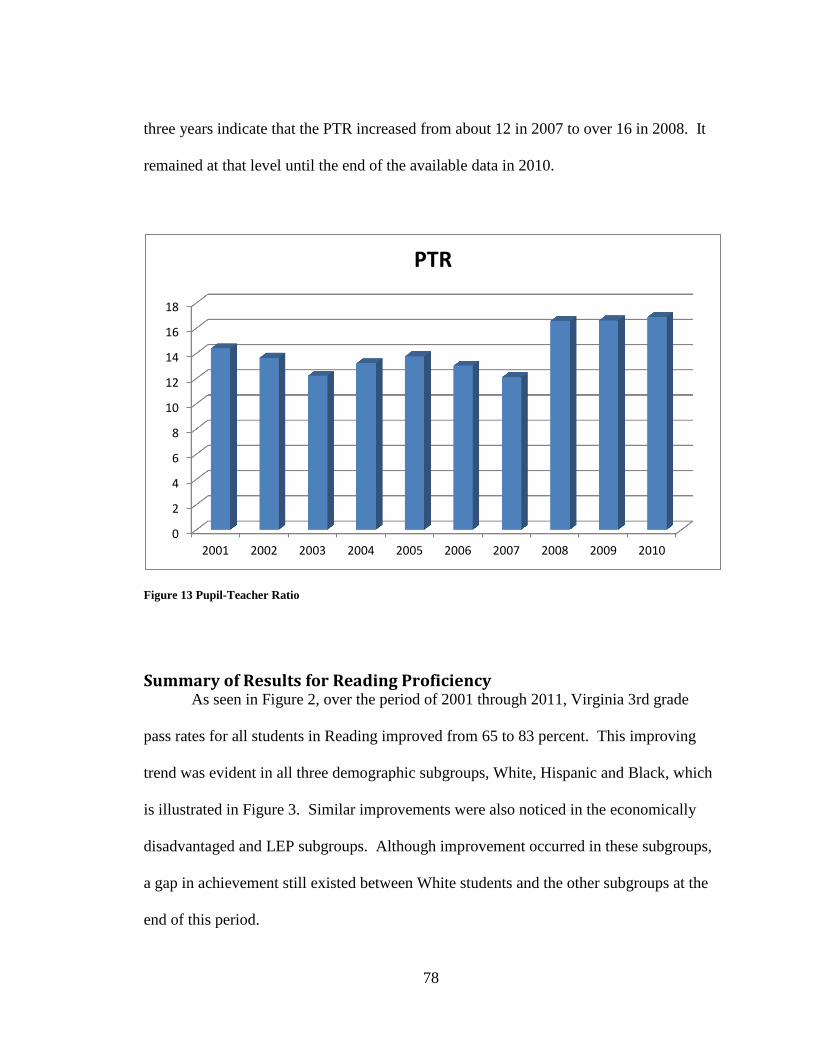
78
three years indicate that the PTR increased from about 12 in 2007 to over 16 in 2008. It
remained at that level until the end of the available data in 2010.
Figure 13 Pupil-Teacher Ratio
Summary of Results for Reading Proficiency As seen in Figure 2, over the period of 2001 through 2011, Virginia 3rd grade
pass rates for all students in Reading improved from 65 to 83 percent. This improving
trend was evident in all three demographic subgroups, White, Hispanic and Black, which
is illustrated in Figure 3. Similar improvements were also noticed in the economically
disadvantaged and LEP subgroups. Although improvement occurred in these subgroups,
a gap in achievement still existed between White students and the other subgroups at the
end of this period.
0
2
4
6
8
10
12
14
16
18
2001 2002 2003 2004 2005 2006 2007 2008 2009 2010
PTR

79
Figure 14 SOL Pass Rates for 3rd Grade Reading for All Students and Selected Subgroups
Over the same period, Virginia 5th grade pass rates for all students improved in
Reading from 73 to 89 percent. This improving trend was also evident in all three
demographic subgroups, White, Hispanic and Black, as seen in Figure 15. Hispanic
students had one year, 2007, in which they did not perform as well and, in fact, seemed to
take a step backward with a large drop in the percent of Hispanic students passing the
SOL Assessments in that year. This one year aberration was corrected in the ensuing
years. Again, similar improvements were also noticed in the economically disadvantaged
and LEP subgroups (see Appendix Tables).
40
50
60
70
80
90
100
All Students
Black
Hispanic
White
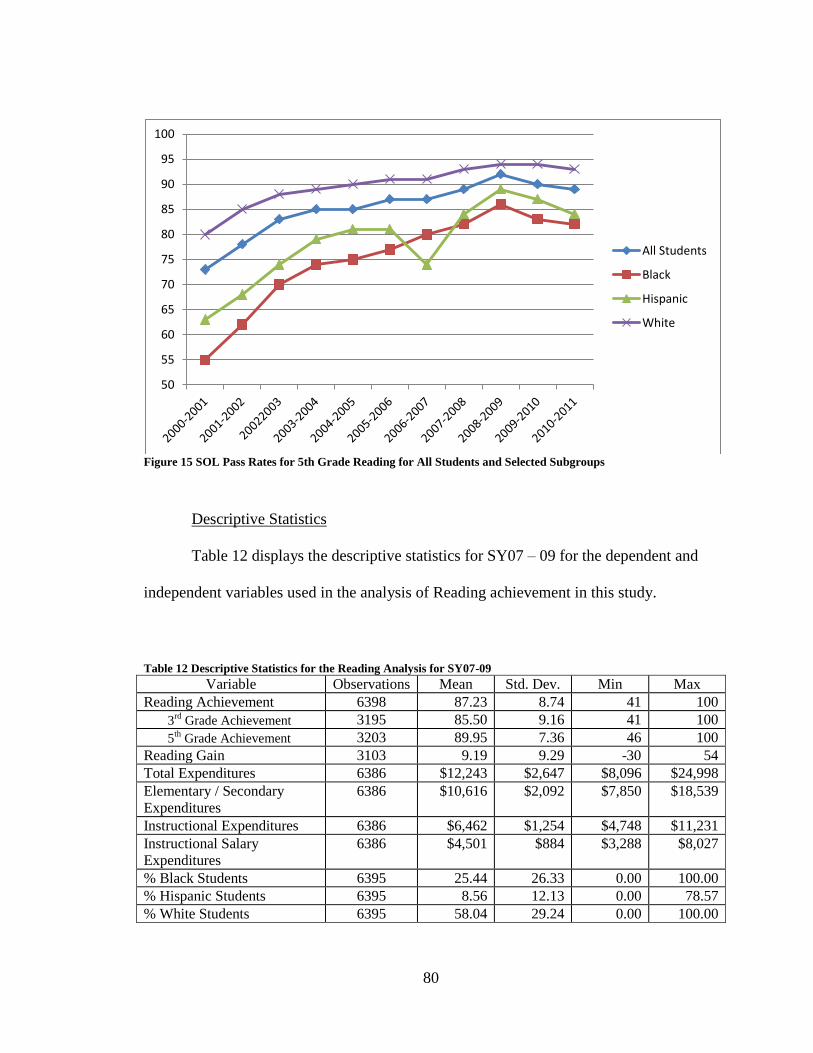
80
Figure 15 SOL Pass Rates for 5th Grade Reading for All Students and Selected Subgroups
Descriptive Statistics
Table 12 displays the descriptive statistics for SY07 – 09 for the dependent and
independent variables used in the analysis of Reading achievement in this study.
Table 12 Descriptive Statistics for the Reading Analysis for SY07-09
Variable Observations Mean Std. Dev. Min Max Reading Achievement 6398 87.23 8.74 41 100
3rd
Grade Achievement 3195 85.50 9.16 41 100
5th
Grade Achievement 3203 89.95 7.36 46 100 Reading Gain 3103 9.19 9.29 -30 54 Total Expenditures 6386 $12,243 $2,647 $8,096 $24,998 Elementary / Secondary
Expenditures 6386 $10,616 $2,092 $7,850 $18,539
Instructional Expenditures 6386 $6,462 $1,254 $4,748 $11,231 Instructional Salary
Expenditures 6386 $4,501 $884 $3,288 $8,027
% Black Students 6395 25.44 26.33 0.00 100.00 % Hispanic Students 6395 8.56 12.13 0.00 78.57 % White Students 6395 58.04 29.24 0.00 100.00
50
55
60
65
70
75
80
85
90
95
100
All Students
Black
Hispanic
White
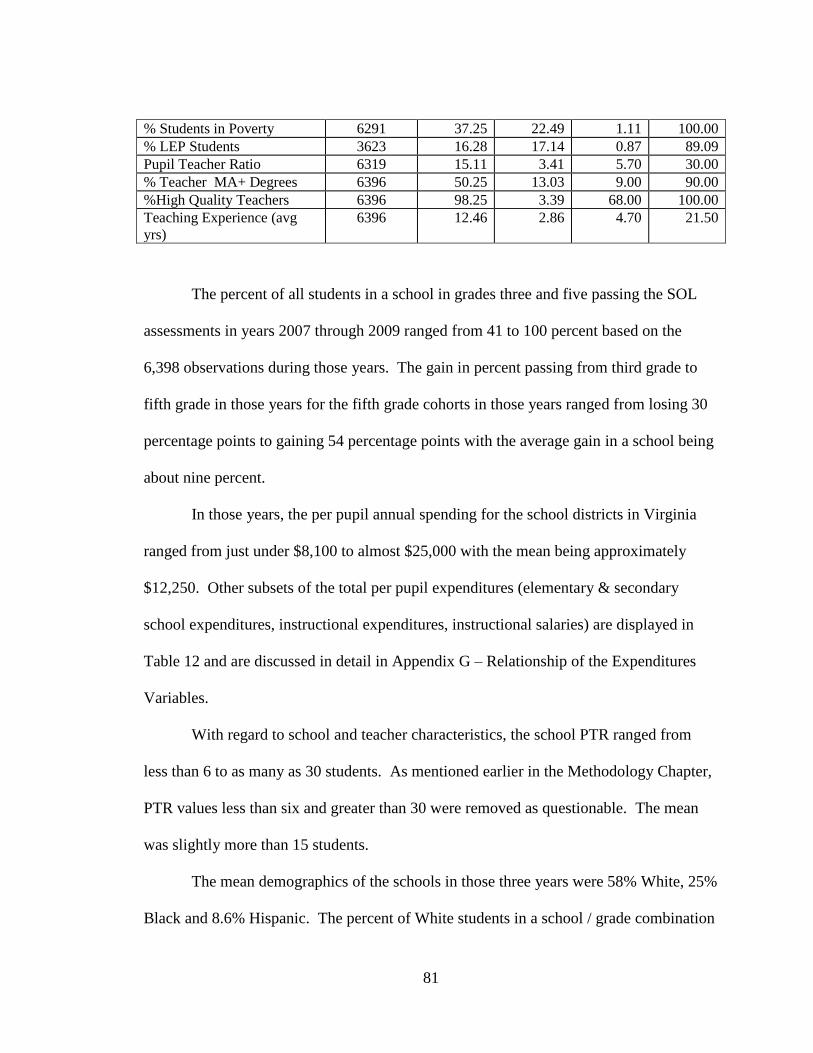
81
% Students in Poverty 6291 37.25 22.49 1.11 100.00 % LEP Students 3623 16.28 17.14 0.87 89.09 Pupil Teacher Ratio 6319 15.11 3.41 5.70 30.00 % Teacher MA+ Degrees 6396 50.25 13.03 9.00 90.00 %High Quality Teachers 6396 98.25 3.39 68.00 100.00 Teaching Experience (avg
yrs) 6396 12.46 2.86 4.70 21.50
The percent of all students in a school in grades three and five passing the SOL
assessments in years 2007 through 2009 ranged from 41 to 100 percent based on the
6,398 observations during those years. The gain in percent passing from third grade to
fifth grade in those years for the fifth grade cohorts in those years ranged from losing 30
percentage points to gaining 54 percentage points with the average gain in a school being
about nine percent.
In those years, the per pupil annual spending for the school districts in Virginia
ranged from just under $8,100 to almost $25,000 with the mean being approximately
$12,250. Other subsets of the total per pupil expenditures (elementary & secondary
school expenditures, instructional expenditures, instructional salaries) are displayed in
Table 12 and are discussed in detail in Appendix G – Relationship of the Expenditures
Variables.
With regard to school and teacher characteristics, the school PTR ranged from
less than 6 to as many as 30 students. As mentioned earlier in the Methodology Chapter,
PTR values less than six and greater than 30 were removed as questionable. The mean
was slightly more than 15 students.
The mean demographics of the schools in those three years were 58% White, 25%
Black and 8.6% Hispanic. The percent of White students in a school / grade combination
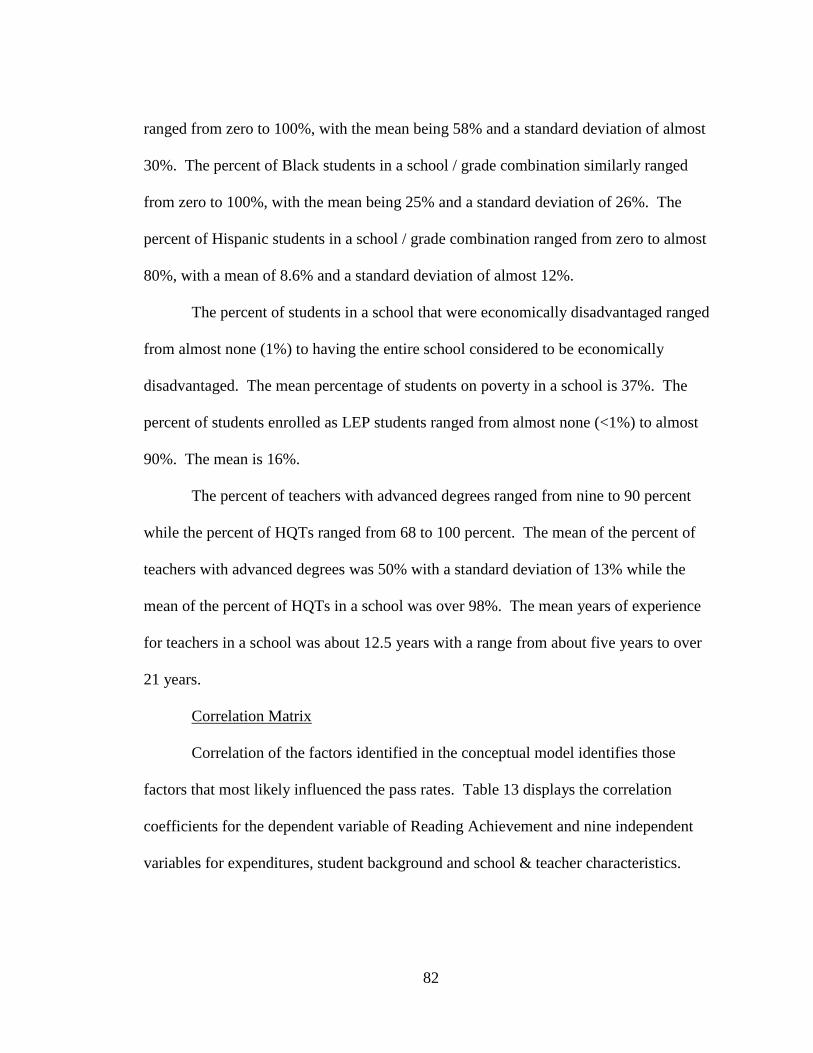
82
ranged from zero to 100%, with the mean being 58% and a standard deviation of almost
30%. The percent of Black students in a school / grade combination similarly ranged
from zero to 100%, with the mean being 25% and a standard deviation of 26%. The
percent of Hispanic students in a school / grade combination ranged from zero to almost
80%, with a mean of 8.6% and a standard deviation of almost 12%.
The percent of students in a school that were economically disadvantaged ranged
from almost none (1%) to having the entire school considered to be economically
disadvantaged. The mean percentage of students on poverty in a school is 37%. The
percent of students enrolled as LEP students ranged from almost none (<1%) to almost
90%. The mean is 16%.
The percent of teachers with advanced degrees ranged from nine to 90 percent
while the percent of HQTs ranged from 68 to 100 percent. The mean of the percent of
teachers with advanced degrees was 50% with a standard deviation of 13% while the
mean of the percent of HQTs in a school was over 98%. The mean years of experience
for teachers in a school was about 12.5 years with a range from about five years to over
21 years.
Correlation Matrix
Correlation of the factors identified in the conceptual model identifies those
factors that most likely influenced the pass rates. Table 13 displays the correlation
coefficients for the dependent variable of Reading Achievement and nine independent
variables for expenditures, student background and school & teacher characteristics.
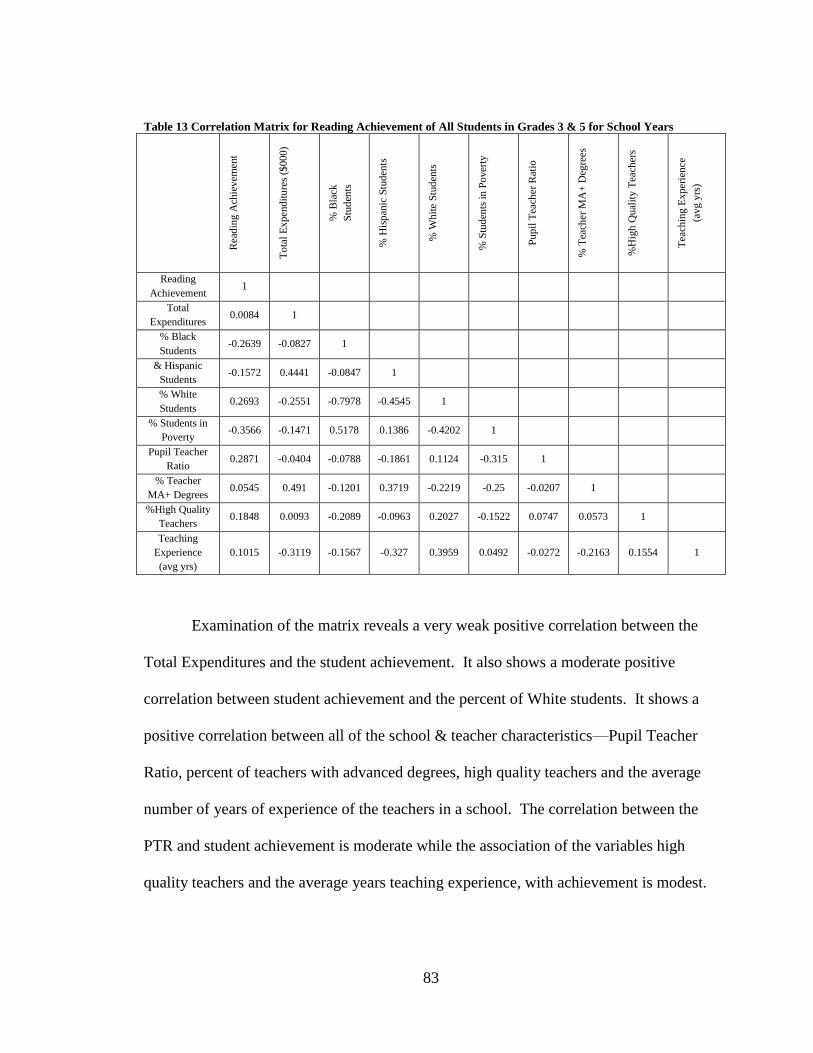
83
Table 13 Correlation Matrix for Reading Achievement of All Students in Grades 3 & 5 for School Years
Rea
din
g A
chie
vem
ent
To
tal
Ex
pen
dit
ure
s ($
000
)
% B
lack
Stu
den
ts
% H
isp
anic
Stu
den
ts
% W
hit
e S
tud
ents
% S
tud
ents
in
Po
ver
ty
Pu
pil
Tea
cher
Rat
io
% T
each
er M
A+
Deg
rees
%H
igh
Qu
alit
y T
each
ers
Tea
chin
g E
xp
erie
nce
(avg
yrs
)
Reading
Achievement 1
Total
Expenditures 0.0084 1
% Black
Students -0.2639 -0.0827 1
& Hispanic
Students -0.1572 0.4441 -0.0847 1
% White
Students 0.2693 -0.2551 -0.7978 -0.4545 1
% Students in
Poverty -0.3566 -0.1471 0.5178 0.1386 -0.4202 1
Pupil Teacher
Ratio 0.2871 -0.0404 -0.0788 -0.1861 0.1124 -0.315 1
% Teacher
MA+ Degrees 0.0545 0.491 -0.1201 0.3719 -0.2219 -0.25 -0.0207 1
%High Quality
Teachers 0.1848 0.0093 -0.2089 -0.0963 0.2027 -0.1522 0.0747 0.0573 1
Teaching
Experience
(avg yrs)
0.1015 -0.3119 -0.1567 -0.327 0.3959 0.0492 -0.0272 -0.2163 0.1554 1
Examination of the matrix reveals a very weak positive correlation between the
Total Expenditures and the student achievement. It also shows a moderate positive
correlation between student achievement and the percent of White students. It shows a
positive correlation between all of the school & teacher characteristics—Pupil Teacher
Ratio, percent of teachers with advanced degrees, high quality teachers and the average
number of years of experience of the teachers in a school. The correlation between the
PTR and student achievement is moderate while the association of the variables high
quality teachers and the average years teaching experience, with achievement is modest.

84
The association between the percent of teachers in a school with advanced degrees and
Reading Achievement is weak.
The matrix also reveals a moderately negative correlation between student
achievement and the percent of Black students and a moderately negative association
between the percent of Hispanic students and student achievement. The percent of
economically disadvantaged students and student achievement has a fairly strong
negative association and is the highest correlation with student achievement of all of the
nine independent variables.
In addition, the percent of economically disadvantaged students has a very strong
positive correlation with the percent of Black students but only a modest positive
correlation with the percent of Hispanic students. The percent of economically
disadvantaged students has a fairly strong negative correlation with the percent of White
students. Finally, the percent of Hispanic and Black students have a weak negative
correlation.
With regard to the school and teacher characteristics, the percent of percent of
high quality teachers has a weak positive correlation with the percent of teachers holding
advanced degrees and a modest positive correlation with the average number of years of
teaching experience in a school. The percent of teachers with advanced degrees has a
moderate negative correlation with the average number of years of teaching experience in
a school.

85
Summary of Results for Math Proficiency Over the period of 2001 through 2011, Virginia 3rd grade pass rates for all
students in Math improved from 77 percent to 91 percent. The magnitude of these
improvements was slightly smaller than the Reading improvements since the Math scores
started at higher level in 2001 thus limiting the amount of improvement possible. This
improving trend was evident in all three demographic subgroups, White, Hispanic and
Black. Similar improvements were also noticed in the economically disadvantaged and
LEP subgroups.
Figure 16 Math SOL Pass Rates for 3rd Grade for All Students and Selected Subgroups
Over the period of 2001 through 2011 Virginia 5th grade pass rates for all
students in Math improved from 67 to 89. This improving trend was evident in all three
50
55
60
65
70
75
80
85
90
95
100
All Students
Black
Hispanic
White
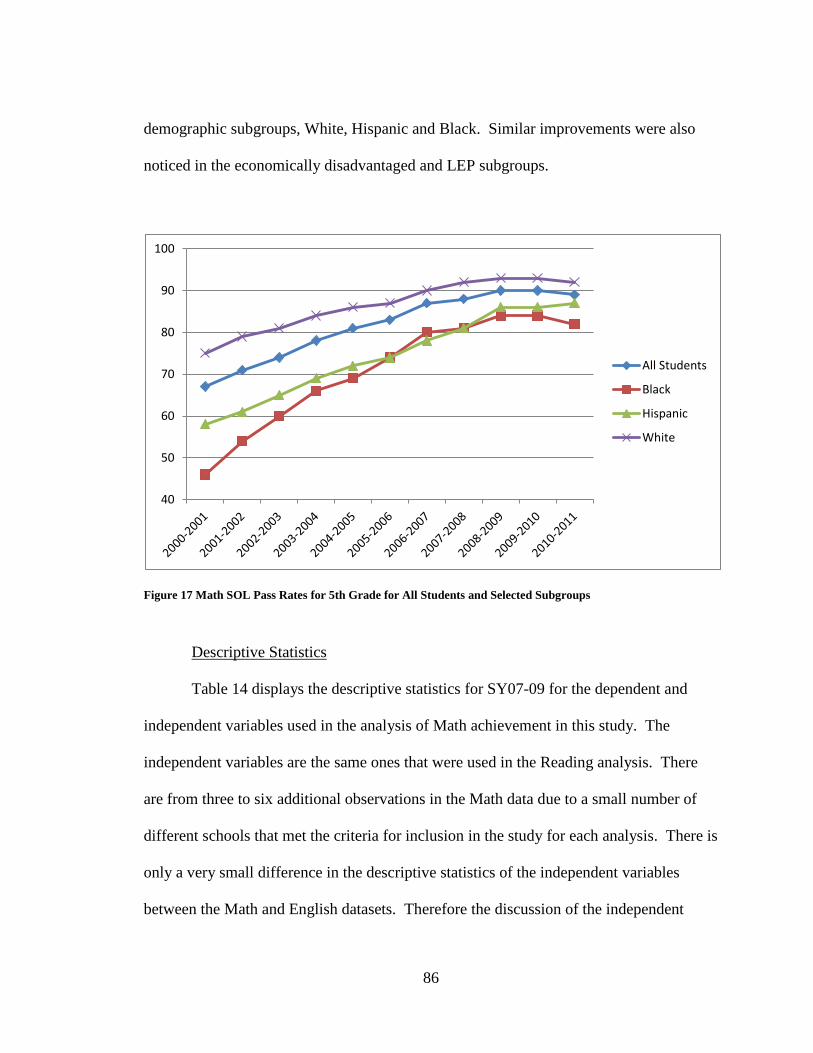
86
demographic subgroups, White, Hispanic and Black. Similar improvements were also
noticed in the economically disadvantaged and LEP subgroups.
Figure 17 Math SOL Pass Rates for 5th Grade for All Students and Selected Subgroups
Descriptive Statistics
Table 14 displays the descriptive statistics for SY07-09 for the dependent and
independent variables used in the analysis of Math achievement in this study. The
independent variables are the same ones that were used in the Reading analysis. There
are from three to six additional observations in the Math data due to a small number of
different schools that met the criteria for inclusion in the study for each analysis. There is
only a very small difference in the descriptive statistics of the independent variables
between the Math and English datasets. Therefore the discussion of the independent
40
50
60
70
80
90
100
All Students
Black
Hispanic
White
87
variables for the Math analysis is identical to the discussion in the Reading section
earlier.
Table 14 Descriptive Statistics for the Math Analysis for SY07-09
Variable Observations Mean Std. Dev. Min Max
Math Achievement 6404 89.59 7.61 51 100
3rd
Grade Achievement 3199 89.91 7.21 51 100
5th
Grade Achievement 3205 89.27 7.98 51 100
Math Gain 3110 .01 8.15 -36 39
Total Expenditures 6391 $12,241 $2,646 $8,096 $24,998
Elementary / Secondary
Expenditures 6391 $10,614 $2,091 $7,849 $18,538
Instructional Expenditures 6391 $6,460 $1,253 $4,747 $11,231
Instructional Salary
Expenditures 6391 $4,500 $883 $3,288 $8,026
% Black Students 6399 25.45 26.33 0 100
% Hispanic Students 6399 8.57 12.14 0 78.57
% White Students 6399 58.02 29.25 0 100
% Students in Poverty 6297 37.25 22.48 1.11 100
% LEP Students 3629 16.28 17.14 0.87 89.09
Pupil Teacher Ratio 6322 15.11 3.41 5.7 30
% Teacher MA+ Degrees 6402 50.25 13.03 9 90
% High Quality Teachers 6402 98.25 3.40 68 100
Teaching Experience (avg yrs) 6402 12.45 2.86 4.7 21.5
Student Math achievement in a school ranges from 51 to 100 percent with a mean
of just under 90% based on the 6,404 observations during those years.
The Math Achievement Gain from 3rd
to 5th
grade was not as strong as the
Reading Gains. The Math Gains ranged from losing 36 points to increasing by 39 points.
The overall mean was effectively zero.
Correlation Matrix

88
Table 15 displays the correlation coefficients for the dependent variable of Math
achievement and the nine independent variables for expenditures, student background,
and school & teacher characteristics.
Table 15 Correlation Matrix for Math Achievement of All Students on Grades 3 & 5 for School Years 2007-2009
The data show a weak negative correlation between the Total Expenditures and
the student achievement in math. The percent of Black students, the percent of Hispanic
students and the percent of economically disadvantaged students are all negatively
correlated with student math achievement. The percent of economically disadvantaged
students is fairly strongly correlated; the percent of Black students is moderately
Mat
h A
chie
vem
ent
To
tal
Ex
pen
dit
ure
s
($00
0)
% B
lack
Stu
den
ts
% H
isp
anic
Stu
den
ts
% W
hit
e S
tud
ents
% S
tud
ents
in
Po
ver
ty
Pu
pil
Tea
cher
Rat
io
% T
each
er M
A+
Deg
rees
%H
igh
Qu
alit
y
Tea
cher
s
Tea
chin
g E
xp
erie
nce
(avg
yrs
)
Math
Achievement 1.0000
Total
Expenditures
($000)
-0.0358 1.0000
% Black
Students -0.2685 -0.0827 1.0000
% Hispanic
Students -0.1858 0.4441 -0.0847 1.0000
% White
Students 0.3025 -0.2551 -0.7978 -0.4545 1.0000
% Students in
Poverty -0.3197 -0.1471 0.5178 0.1386 -0.4202 1.0000
Pupil Teacher
Ratio 0.1679 -0.0404 -0.0788 -0.1861 0.1124 -0.3150 1.0000
% Teacher
MA+ Degrees 0.0053 0.4910 -0.1201 0.3719 -0.2219 -0.2500 -0.0207 1.0000
%High Quality
Teachers 0.1668 0.0093 -0.2089 -0.0963 0.2027 -0.1522 0.0747 0.0573 1.0000
Teaching
Experience
(avg yrs)
0.1259 -0.3119 -0.1567 -0.3270 0.3959 0.0492 -0.0272 -0.2163 0.1554 1.0000
89
correlated and the percent of Hispanic students is modestly correlated. The percent of
White students, on the other hand, is fairly strongly positively correlated with student
achievement in this analysis.
With regard to the school & teacher characteristics, all four independent variables
positively correlated with student achievement in Math. PTR, percent of HQTs and the
average number of years of teaching experience have a modest positive correlation, while
the percent of teachers with advanced degrees weakly positively correlated with student
achievement.
Since the nine independent variables are the same as in the Reading achievement
analysis, the correlations between pairs of these variables are the same as for the previous
analysis.
Regression Analysis Multiple regression techniques constitute the primary analytic approach for this
study. In this section for both Reading and Math, models are developed to determine the
size and statistical significance of the effects of the independent variables in influencing
student achievement. First, the study examines the Reading achievement, followed by
the Math achievement analysis. For both content areas, 3rd grade achievement is
analyzed and then 5th
grade achievement in each of the subjects.
Grade 3 Reading Cross-Sectional Regression Analysis Model 1 includes the Total Expenditures variable to represent expenditures and
the school and teacher characteristics shown in Table 16. This model shows a small and
statistically insignificant effect for the Total Expenditures on Student Achievement.
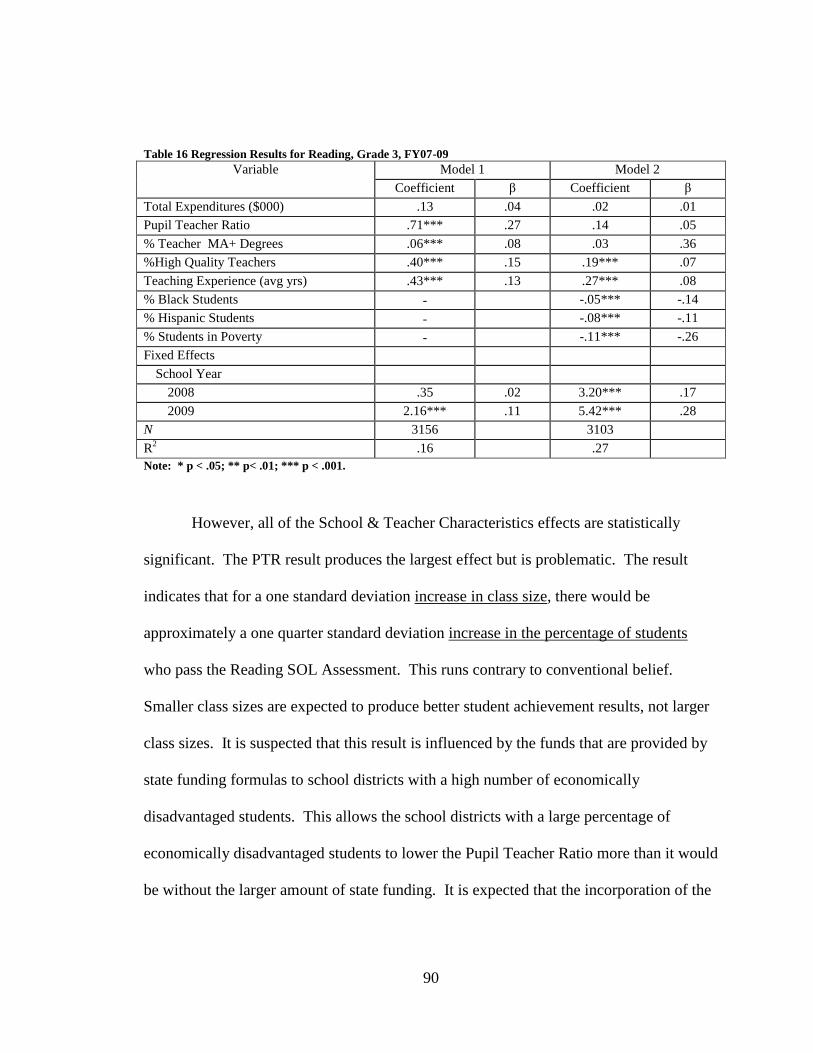
90
Table 16 Regression Results for Reading, Grade 3, FY07-09
Variable Model 1 Model 2
Coefficient β Coefficient β
Total Expenditures ($000) .13 .04 .02 .01
Pupil Teacher Ratio .71*** .27 .14 .05
% Teacher MA+ Degrees .06*** .08 .03 .36
%High Quality Teachers .40*** .15 .19*** .07
Teaching Experience (avg yrs) .43*** .13 .27*** .08
% Black Students - -.05*** -.14
% Hispanic Students - -.08*** -.11
% Students in Poverty - -.11*** -.26
Fixed Effects
School Year
2008 .35 .02 3.20*** .17
2009 2.16*** .11 5.42*** .28
N 3156 3103
R2 .16 .27
Note: * p < .05; ** p< .01; *** p < .001.
However, all of the School & Teacher Characteristics effects are statistically
significant. The PTR result produces the largest effect but is problematic. The result
indicates that for a one standard deviation increase in class size, there would be
approximately a one quarter standard deviation increase in the percentage of students
who pass the Reading SOL Assessment. This runs contrary to conventional belief.
Smaller class sizes are expected to produce better student achievement results, not larger
class sizes. It is suspected that this result is influenced by the funds that are provided by
state funding formulas to school districts with a high number of economically
disadvantaged students. This allows the school districts with a large percentage of
economically disadvantaged students to lower the Pupil Teacher Ratio more than it would
be without the larger amount of state funding. It is expected that the incorporation of the

91
student background factors, most importantly the percent of economically disadvantaged
students, will assist in explaining this aberration in Model 1.
The percent of HQTs and teaching experience result in the next largest effects.
Both result in an approximately one-sixth of a standard deviation improvement in student
achievement for a one standard deviation increase in these variables. For approximately
every two and a half percentage point increase in the percentage of High Quality
Teachers in a school, an increase of one point in the percentage of students who pass the
Reading SOL Assessment results. Similarly for an approximately three year increase in
the average years of teaching experience for the teachers in a school, a one percentage
point increase in the percent of students who pass the Reading SOL Assessment results.
Although statistically significant, the percentage of teachers who possess advanced
degrees provides a very small effect on student achievement in this model. For a ten
point increase in the percentage of teachers possessing advanced degrees, student
achievement would only increase by half of a percentage point.
This model also controlled for the effects of the school year on the student
achievement. The fixed effect of school year 2008 was not statistically significant;
however, the regression results indicate that student achievement increased by slightly
over two percentage points in 2009. This result is statistically significant.
Model 2 adds the student background factors to the expenditures and school &
teacher characteristics and results in the following regressions equation. The student
background factors are all statistically significant and have moderate negative effects.
92
The strongest effect results from the percent of economically disadvantaged
students, which is greater than the effects of race in this model. An increase of one
standard deviation in economically disadvantaged students results in a one quarter
decrease in student achievement.
The effect of the percent of Black students is slightly greater than the percent of
Hispanic students. An increase of one standard deviation in the percentage of Black
students in the school results in a decrease of one-seventh of a standards deviation in
student achievement in that grade / school combination. Similarly, an increase of one
standard deviation in the percentage of Hispanic students results in an approximately one
tenth of a standard deviation decrease in student achievement.
As in Model 1, the expenditures factor is not statistically significant. PTR was
statistically significant, had a large effect and was problematic in Model 1. However, in
Model 2, with the introduction of the student background factors, most importantly the
percent of students who are economically disadvantaged, the PTR coefficient is
substantially smaller indicating a diminished effect. In addition, it is not statistically
significant. This result thus supports the earlier explanation that the inclusion of student
background factors would mitigate the PTR factor in Model 2.
The percent of HQTs and the Teaching Experience remain statistically significant
in Model 2 but now produce lessened effects by about half. A five percentage point
increase in the percentage of HQTs in a school will result in a one percentage point
increase in student achievement. Similarly, an increase of almost four years in average

93
teaching experience for the teachers in a school will also result in a one percentage point
increase in student achievement.
Grade 5 Reading Cross-Sectional and Covariance Analysis The Model 1 regression results for the 5
th grade are shown in Table 17 and
indicate a very small and statistically insignificant negative effect from the Total
Expenditure factor.
Table 17 Regression Results for Reading, Grade 5, FY07-09
Variable Model 1 Model 2 Model 3
(Covariance)
Coefficient β Coefficient Β Coefficient β
Grade 3 Reading Achievement
(lagged two years)
.25*** .36
Total Expenditures ($000) -.06 -.02 -.13* -.05 -.14** -.05
Pupil Teacher Ratio .53*** .25 .02 .01 -.06 -.03
% Teacher MA+ Degrees .06*** .10 .03** .06 .04** .06
%High Quality Teachers .31*** .14 .15*** .07 .12*** .06
Teaching Experience (avg yrs) .23*** .09 .12* .05 .02 .01
% Black Students - -.02*** -.07 -.01* -.04
% Hispanic Students - -.07*** -.12 -.05*** -.08
% Students in Poverty - -.10*** -.31 -.07*** -.20
Fixed Effects:
School Year
2008 .35 .02 2.87*** .18 1.42*** .09
2009 2.47*** .16 5.36*** .35 4.50*** .29
N 3151 3098 3019
R2 .16 .26 .35
Note: * p < .05; ** p< .01; *** p < .001.
In Model 1 for the 5th
grade, all of the school & teacher characteristics are
statistically significant. Once again, the PTR has a large effect and is problematic in that
the result is once again contrary to expected results. An increase of one standard
94
deviation in the PTR results in a one quarter standard deviation increase in student
achievement. Another way of stating this is that a two student increase in PTR results in
a one percentage point increase in student achievement. Model 2 may again assist in
resolving this inconsistency.
The other school and teacher characteristics are statistically significant and
produce results that are approximately the same or smaller than the 3rd
grade. The fixed
effects of the years again result in an insignificant effect for school year 2008 but a
statistically significant effect of almost 2.5 percentage points for school year 2009.
Model 2 again introduces student background factors to the model. Expenditures
become statistically significant at the .05 level of significance; however, the effect is
small and negative. In Model 2, PTR is not statistically significant. All of the Teacher
Characteristics are statistically significant but their effects are very small in this model.
The student background variables are all statistically significant with the poverty
variable once again having the largest effect. An increase of one standard deviation in
the percent of economically disadvantaged students in a class results in a one-third
standard deviation decrease in student achievement. The effects of race, while
statistically significant, is not as strong as the poverty variable.
For approximately a one standard deviation increase in the percent of Hispanic
students in a school, student achievement decreases by approximately one-ninth of a
standard deviation. For the percent of Black students in a class, the effect is even
smaller.
95
Controlling for the school year results in statistically significant fixed effects for
both years in this model. School year 2008 produces an effect of almost three points
relative to school year 2007 and school year 2009 results in a greater than five point
increase in student achievement relative to school year 2007.
Finally, Model 3 introduces the Grade 3 lag variable into the model. This variable
represents the percentage of students passing the SOL Assessment in the 3rd
grade two
years prior to the year of interest for the 5th
grade. Since this study is conducted at the
grade/school level and not at the student level, it does not account for students who
entered or left a school over that two year period. We assume, however, that a large
percentage of the students who took the SOL Assessment in 3rd
grade are the same
students who took the 5th
grade SOL Assessment two years later.
The 3rd
grade Student Achievement Lag variable is statistically significant and
results in the largest effect of all of the variables. A one standard deviation increase in
student achievement for the cohort in their 3rd
grade scores results in a one-third standard
deviation increase in 5th
grade achievement. This can also be expressed as a one percent
increase in student achievement in the 3rd
grade SOL assessments resulting in a one-
quarter percent increase in 5th
grade achievement.
The three student background factors all remain statistically significant. The
percent of students in poverty is results in the largest effect of the three. A one standard
deviation increase in the percent of economically disadvantaged students results in a one
fifth standard deviation decrease in student achievement.

96
Expenditures are statistically significant in this model; however, the effects are
small and negative. A one standard deviation decrease in expenditures results in a one
twentieth increase in student achievement.
PTR remains statistically insignificant in this model, as is the teacher experience.
However, two teacher characteristics are statistically significant, percent with MA degree
or higher and percent Highly Qualified, but the size of their effects is quite small. Their
effect sizes are only .06, which means that a one standard deviation increase in either will
result in only a one-twentieth (approximately) standard deviation increase in reading
proficiency.
Once again, controlling for the school year results in an almost 1.5% increase in
school year 2008 relative to school year 2007 and a 4.5 % increase in school year 2009
relative to school year 2007. Both of these results are statistically significant.
Grade 3 Math Cross-Sectional Regression Analysis Table 18 shows the Grade 3 Math Cross-Sectional regression results.
Table 18 Regression Results for Math, Grade 3, FY07-09
Variable Model 1 Model 2
Coefficient β Coefficient β
Total Expenditures ($000) .01 .01 -.02 -.01
Pupil Teacher Ratio .48*** .23 .04 .02
% Teacher MA+ Degrees .01 .02 -.00 -.00
%High Quality Teachers .32*** .15 .13*** .06
Teaching Experience (avg yrs) .37*** .14 .16*** .06
% Black Students -.07*** -.25
% Hispanic Students
-
.11***
-
.19
% Students in Poverty
-
.06***
-
.18
Fixed Effects:

97
School Year
2008 -1.78*** -.12 .33 .02
2009 -2.166*** -.142 .215 .014
N 3156 3103
R2 .082 .218
Note: * p < .05; ** p< .01; *** p < .001.
The Total Expenditures variable effect for Math Student Achievement is not
statistically significant in Model 1. The PTR, the percent of HQTs and the average years
experience are all statistically significant in this model. The PTR has a moderate positive
effect while the percent of HQTs and teaching experience have modest positive effects.
However, the PTR effect is problematic in that it is contrary to expectations. As in the
Reading analysis, the introduction of the student background factors may help explain
this result. The PTR results are similar to the results for Model 1 in the Reading analysis.
The positive coefficient indicates that as PTR increases, student achievement also
increases. Again, this is contrary to what is expected. As in the Reading analysis, Model
1 does not include the student background factors, which may affect the influence of the
PTR.
For an increase of approximately two students in the PTR, the model provides for
just under a one percentage point increase in student achievement. For the percent of
HQTs an increase of one standard deviation would lead to an approximately one-seventh
standard deviation increase in student achievement. Similarly, for an increase of one
standard deviation in average teaching experience in a school, student achievement would
increase by approximately one-seventh of a standard deviation. The percentage of
98
teachers with advanced degrees results in a very small and statistically insignificant effect
in this model.
Controlling for the school year, student achievement in years 2008 and 2009 are
both lower than achievement in 2007. The fixed effect of student achievement for 2008
is approximately one and three quarters points and for 2009 by slightly more than two
points. Both of these results are statistically significant.
Model 2 adds the student background factors to the expenditures and school &
teacher characteristics in Model 1. In Model 2, the Total Expenditures variable remains
statistically insignificant.
The PTR coefficient is still positive but it is a much smaller effect and is
statistically insignificant. The three student background factors are all statistically
significant with the percent of Black students producing the largest effect. A one
standard deviation increase in percent Blacks results in s a one-quarter standard deviation
decrease in student achievement. A one standard deviation increase in the percent of
Hispanic students or in the percent of economically disadvantaged students results in a
one-fifth standard deviation decrease in student achievement. An increase of ten
percentage points in the percent of Hispanic students results in a one percentage point
decrease in overall student achievement. For the same ten percentage point increase in
either economically disadvantaged student or Black students, there would be an
approximately half a percent decrease in student achievement in Math.
In examining the teacher characteristics, the percent of teachers with advanced
degrees is not statistically significant. The percent of HQTs and the average years of

99
teaching experience are both statistically significant; however, they both have very small
effects on student achievement.
Controlling for the school year results in no statistically significant effect.
Grade 5 Math Cross-Sectional and Covariance Analysis Model 1 includes the expenditures and school & teacher characteristics. In this
model, the Total Expenditures are not statistically significant. The PTR is statistically
significant and has a modest effect. For approximately a two and a half student increase
in the PTR, student achievement growth would increase by one percentage point.
Alternatively, a one standard deviation increase in PTR results in a one-fifth increase in
student achievement.
Table 19 Regression Results for Math, Grade 5, FY07-09
Variable Model 1 Model 2 Model 3 (Covariance)
Coefficient β Coefficient β Coefficient β
Grade 3 Math Achievement
(lagged two years) .38*** .37
Total Expenditures ($000) .00 .00 -.07 -.02 -.07 -.03
Pupil Teacher Ratio .40*** .17 -.09 -.04 -.16** -.07
% Teacher MA+ Degrees .02* .04 .01 .01 .01 .02
%Highly Qualified Teachers .30*** .13 .17*** .07 .12** .05
Teaching Experience (avg yrs) .23*** .08 .15** .05 .06 .02
% Black Students - - -.01 -.03 .01 .03
% Hispanic Students - - -.06*** -.09 -.06*** -.09
% Students in Poverty - - -.10*** -.28 -.07*** -.19
Fixed Effects:
School Year
2008 -.29 -.02 2.04*** .12 1.57*** .09
2009 1.33*** .08 4.04*** .24 3.66*** .22
N 3153 3098 3020
R2 .075 .15 .26
Note: * p < .05; ** p< .01; *** p < .001.
100
The percent of teachers with advanced degrees, the average years teaching
experience and the percent of HQTs are statistically significant with the percent of HQTs
and teaching experience having modest effects. The effect of the percent of teachers with
advanced degrees is weak. Controlling for the school year, the year 2008 has an effect of
.3 percentage points lower than the base year of 2007 but is not statistically significant.
The year 2009 has a statistically significant effect of one and a third percentage points
greater than the 2007 base year.
Model 2 adds the student background characteristics to the Model 1 variables. In
Model 2, the percent of HQTs, Teaching Experience, percent economically
disadvantaged students and percent Hispanic students are statistically significant. The
teacher characteristics of HQTs and years of teaching experience both result in very small
positive effects. The negative effect of the percent of Hispanic students in the grade is
small while the negative effect of the percent of students in poverty is both statistically
significant and large. A one standard deviation increase in the percent of students in
poverty result in just under a one-third standard deviation decrease in student
achievement. The effect of the percent of Black students in the grade is very small and
not statistically significant.
The effects of the school years are statistically significant for both 2008 and 2009.
Both effects are positive with 2008 having a fixed effect of two percentage points and
2009 having an even larger effect of four percentage points relative to the base year of
2007.
101
Model 3 introduces the lag variable of 3rd
grade Achievement. 3rd grade
Achievement is statistically significant and results in the largest effect in this model. A
one standard deviation increase in 3rd
grade Achievement results in a greater than one
third standard deviation increase in 5th
grade Student Achievement two year later. The
other statistically significant variables in Model 3 are Pupil Teacher Ratio, percent of
HQTs, the percent of Hispanic students and the percent of economically disadvantaged
students in Poverty. Of these, the largest effect results from the percent of economically
disadvantaged students in Poverty. A one standard deviation increase in the percent of
students in poverty results in a one-fifth decrease in student achievement in Model 3.
The PTR, percent of HQTs and the percent of Hispanic students all result in smaller
effects. With the addition of the student background factors, the PTR now results in the
expected negative effect on student achievement such that an increase in PTR results in a
decrease in student achievement. Similarly, the effect of the percent of Hispanic students
is negative. The percent of HQTs results in a positive effect on student achievement.
Once again, the fixed effects of the school year result in positive, statistically
significant effects for both 2008 and 2009. In 2008 the results indicate a fixed effect of
over one and a half percent and 2009 results in a greater than three and a half percent
increase.
Summary of the Main Regression Analyses Table 20 below summarizes the effects of the independent variables from Model 3
on Reading and Math student achievement. For both subjects, the Grade 3 lag variable is
statistically significant and has the largest standardized effect (about .36). In both
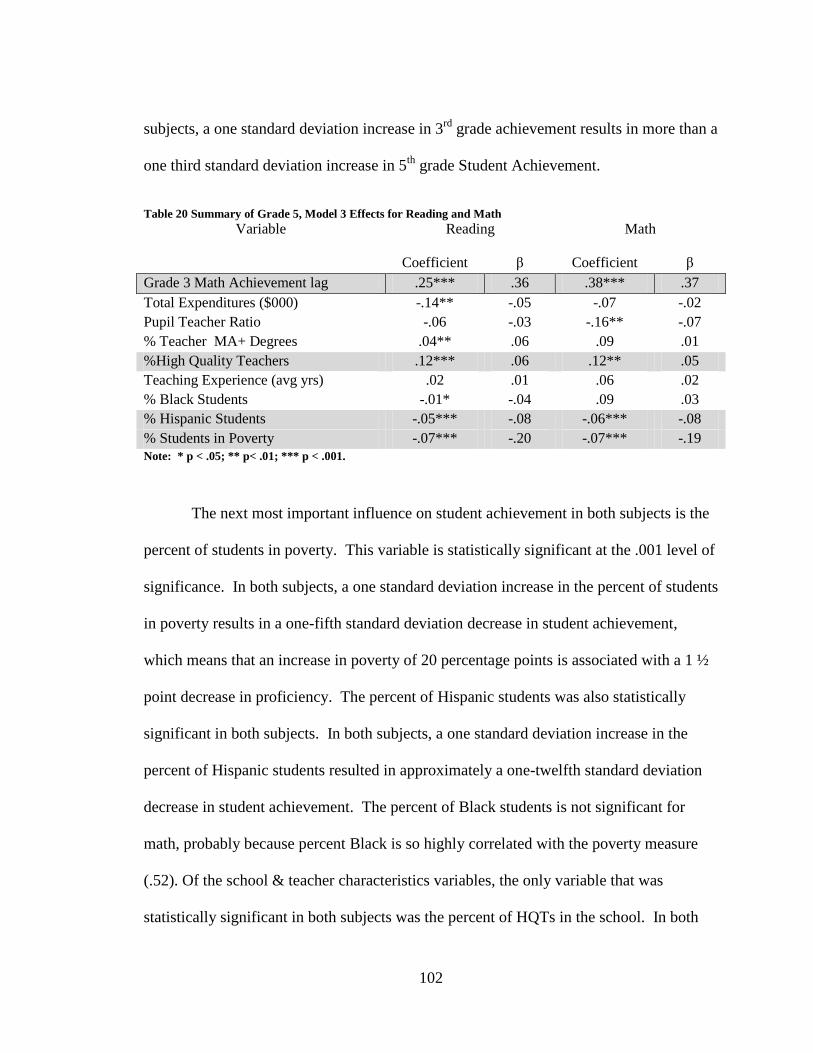
102
subjects, a one standard deviation increase in 3rd
grade achievement results in more than a
one third standard deviation increase in 5th
grade Student Achievement.
Table 20 Summary of Grade 5, Model 3 Effects for Reading and Math
Variable Reading Math
Coefficient β Coefficient β
Grade 3 Math Achievement lag .25*** .36 .38*** .37
Total Expenditures ($000) -.14** -.05 -.07 -.02
Pupil Teacher Ratio -.06 -.03 -.16** -.07
% Teacher MA+ Degrees .04** .06 .09 .01
%High Quality Teachers .12*** .06 .12** .05
Teaching Experience (avg yrs) .02 .01 .06 .02
% Black Students -.01* -.04 .09 .03
% Hispanic Students -.05*** -.08 -.06*** -.08
% Students in Poverty -.07*** -.20 -.07*** -.19 Note: * p < .05; ** p< .01; *** p < .001.
The next most important influence on student achievement in both subjects is the
percent of students in poverty. This variable is statistically significant at the .001 level of
significance. In both subjects, a one standard deviation increase in the percent of students
in poverty results in a one-fifth standard deviation decrease in student achievement,
which means that an increase in poverty of 20 percentage points is associated with a 1 ½
point decrease in proficiency. The percent of Hispanic students was also statistically
significant in both subjects. In both subjects, a one standard deviation increase in the
percent of Hispanic students resulted in approximately a one-twelfth standard deviation
decrease in student achievement. The percent of Black students is not significant for
math, probably because percent Black is so highly correlated with the poverty measure
(.52). Of the school & teacher characteristics variables, the only variable that was
statistically significant in both subjects was the percent of HQTs in the school. In both
103
subjects, a one standard deviation increase in the percent of HQTs (3 percentage points)
results in a one-twentieth standard deviation increase in student achievement, or less than
half a percentage point in proficiency. Moreover, in most schools this characteristic is
already close to 100%, so a 3 point increase is not possible.
The remaining five independent variables in this analysis did not provide
consistent results across both subjects, either in the direction of the effect (positive or
negative), the size of the effect, of the statistically significance of the effect. The lack of
consistency was present in two of these attributes and in two of the variables it was
present in all three attributes.
The PTR provided a statistically significant and two and a half times larger result
in Math than in Reading. The percent of teachers with advanced degrees provided a
statistically significant positive effect in Reading but not in Math. The effect in Reading
was small. Teaching experience was statistically insignificant in both subjects. The
percent of Black students was statistically significant only in Reading. It resulted in a
small negative effect. Finally, expenditures resulted in a negative effect in both subjects;
however, it was statistically significant in only Reading. The negative influence of
expenditures is not expected. This model indicates that there is no clear benefit to be
obtained simply by increasing expenditures for the schools.
Student Background Analysis The achievement gap between White and Black students and between White and
Hispanic students remains a decade after the passage of the NCLB. However, for each
group, the gap was narrowed during that time in both Reading and Math in 3rd
grade and
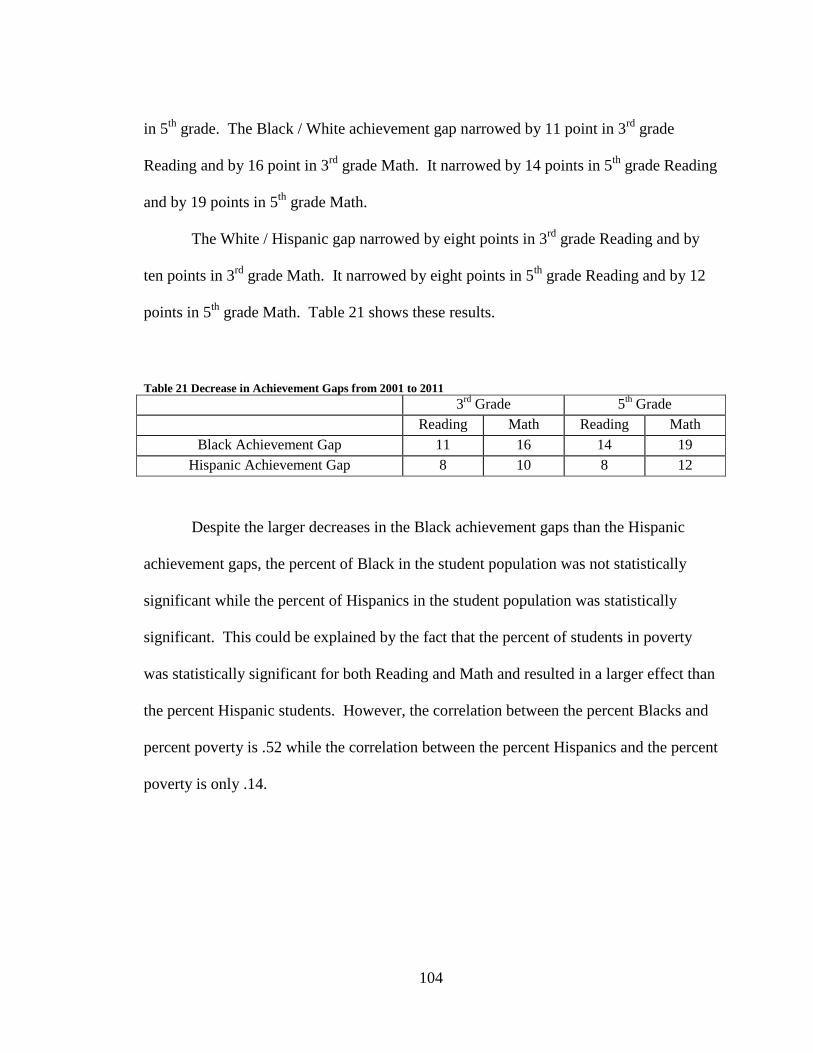
104
in 5th
grade. The Black / White achievement gap narrowed by 11 point in 3rd
grade
Reading and by 16 point in 3rd
grade Math. It narrowed by 14 points in 5th
grade Reading
and by 19 points in 5th
grade Math.
The White / Hispanic gap narrowed by eight points in 3rd
grade Reading and by
ten points in 3rd
grade Math. It narrowed by eight points in 5th
grade Reading and by 12
points in 5th
grade Math. Table 21 shows these results.
Table 21 Decrease in Achievement Gaps from 2001 to 2011
3rd
Grade 5th Grade
Reading Math Reading Math
Black Achievement Gap 11 16 14 19
Hispanic Achievement Gap 8 10 8 12
Despite the larger decreases in the Black achievement gaps than the Hispanic
achievement gaps, the percent of Black in the student population was not statistically
significant while the percent of Hispanics in the student population was statistically
significant. This could be explained by the fact that the percent of students in poverty
was statistically significant for both Reading and Math and resulted in a larger effect than
the percent Hispanic students. However, the correlation between the percent Blacks and
percent poverty is .52 while the correlation between the percent Hispanics and the percent
poverty is only .14.
105
CHAPTER FIVE – CONCLUSIONS, LIMITATIONS AND
RECOMMENDATIONS
Conclusions The passage of the NCLB legislation in 2001 placed renewed emphasis was on
accountability for student achievement. Key to this emphasis was the reporting of results
on standardized assessments throughout a student’s career in school. This study
examined the results obtained in selected schools in Virginia. It focused on Reading and
Math assessment results obtained since the passage of NCLB using the SOL Assessment
results in 3rd
and 5th
grades. The unit of analysis was the school level.
The study examined factors that influence student achievement and determined
that over the past decade, student achievement scores in Virginia have increased in both
Reading and Math as shown in percentage of students who passed the SOL Assessments
at the end of each school year. The regression analysis then determined the importance
of these factors. Factors that were examined fell into four broad categories:
expenditures, student background factors, teacher characteristics and school
characteristics. In the final model, this study examined the covariance of the Grade 3
student achievement with the Grade 5 student achievement.
Hypotheses The first hypothesis stated that student background factors have large effects on
student achievement and growth in achievement for 3rd
and 5th
graders in Virginia.
106
Student background factors were the most important factors influencing student
achievement after the Grade 3 student achievement. They are more important than the
school and teacher characteristics that were examined. Poverty was the most important
of the student background factors. The percent of economically disadvantaged students
increased somewhat in recent years and then returned to the level at the beginning of the
decade. Also in Virginia during the past decade there was a large increase in the number
of Hispanic students in the schools in Virginia. There was a positive correlation between
the increase in the number of economically disadvantaged students and the increase in
Hispanic students in the schools.
The percent of Black students in the schools, which remained relatively constant
throughout the period of study, was not a statistically significant factor influencing
student achievement. However, there was a strong association between the percent of
Black students in Virginia and the percent of economically disadvantaged students. As
Tables 25 and 26 illustrate, an achievement gap between White students and Black
students still exists.
The literature and previous studies confirm the importance of student background
as important factors in student achievement. The influence of poverty is consistent with
previous research. The lack of statistical significance of being Black is not reflected in
the literature. However, the statistical significance of the Hispanic ethnicity may be
reflective the changing demographics of the country in general and Virginia in particular.
Further analyses and studies may better explain the complex interaction among
the percent of Blacks, the percent of economically disadvantaged students and student
107
achievement. Due to the effects of poverty on student achievement and the lack of a
statistically significant effect of Black students on student achievement as shown in the
regressions analysis, the first hypothesis is partially accepted.
The second hypothesis was that school resources have small effects on improved
student academic achievement and the school characteristic of Pupil Teacher Ratio (PTR)
has a small effect on improved student academic achievement for 3rd
and 5th
graders in
Virginia. This study examined the relationship between the per pupil total expenditures
in the school and student achievement. The study results show that the per pupil
expenditures did not influence student achievement.
In addition, this study examined PTR, which is related to the expenditure
variables, as a school characteristic. Importantly, in this study PTR did not have a
consistent significant effect on student achievement. PTR was statistically significant in
only two of the models and in those two cases, the effects were in opposite directions.
The results show a statistically significant positive relationship and a very small positive
effect in 3d grade Reading. Yet the PTR factor also results in a statistically significant
small negative effect in 5th
grade Math. The other two instances do not provide
statistically significant results. This study illustrates that PTR did not provide consistent
effects on student achievement in Virginia during this period.
The literature on the effects of resources is mixed. Some researchers believe that
resources do matter. However, resources need to be tied to programs and in fact it is the
program that either improves student achievement or not. Schools should identify the
purpose of any additional expenditures and provide additional expenditures only for

108
specific programs that have been demonstrated to improve student achievement. School
leaders should then monitor those programs to ensure goals are met before continuing
ineffective programs. The results in this study show that expenditures have no effect on
student achievement. Even when applied to reducing the PTR, there is no consistent
effect on student achievement. The results for the PTR factor are particularly interesting.
These results should be studied in greater detail. The recommendation for further study
of the PTR variable is discussed later in this chapter. The second hypothesis is rejected.
The third hypothesis is that teacher qualifications have small effects on improved
student academic achievement for 3rd
and 5th
graders in Virginia. Of the teacher
characteristics examined in this study, only the percent High Quality Teachers (HQTs)
was statistically significant, and that was specific to the 5th
grade. However, most
schools are already at or close to having 100% of their teachers designated as HQTs.
Even at the early years of this study, most schools had a high percentage of teachers
designated as HQTs. The statistically significant results indicate that the efforts of those
schools and school districts that did not have a high percentage of their teachers
designated as HQTs at the beginning of the decade did, in fact, result in improved student
achievement. Unfortunately, the ability of schools to improve that factor is limited.
Most of the schools that had room for improvement have done so. For those schools that
have not yet achieved the requirement of having all teachers designated as HQTs, they
should focus on meeting this requirement.
One of the other teacher characteristics that was examined was the average
number of years of overall teaching experience of the teachers in each study school. The

109
results show that 3rd
grade achievement was influenced by teaching experience. This
factor, however, did not provide statistically significant result for the 5th
grade student
achievement. This result indicates that students may benefit more from experienced
teachers in the earlier years more than in the later years. This is supported by the
literature review, which indicated some small benefit for elementary teachers with
experience beyond their first few years of teaching.
Overall, the literature review indicated mixed results for teacher characteristics.
One group of teachers identified as benefiting from various measures of higher value
teacher characteristics was the middle and high school math teachers who benefited from
increased content area development. The HQT requirements in Virginia include
demonstrating competency in the subject area for which the teacher is certified to teach.
This generally supports the literature indicating that Math teachers with greater content
area education provide greater value to their students. Discovering the more nuanced
aspect of teacher characteristics that affect student achievement may lead to greater
effects on student achievement. Based on the results of this study for schools in
Virginia, the third hypothesis is partially accepted.
The final hypothesis stated that student achievement in earlier grades, specifically
3rd
grade for this study, has a large effect on student achievement in later grades for 5th
graders in Virginia. The most important effect on 5th
grade student achievement in both
Reading and Math was 3rd
grade student achievement. Intensive efforts focusing on
student achievement early rather than later has the potential to lead to better outcomes for
110
students than trying to improve student achievement in later grades. Hypothesis four is
accepted.
Additional Findings Three additional findings were made during this study that are not addressed
directly in the hypotheses. First, it is important to recognize that student background
factors have greater effects on student achievement than teacher characteristics. No
matter the talent, capability and effort that teachers possess and expend, teachers have a
great deal to overcome when students arrive in a classroom. While not examined in this
study, out of school programs that address the family factors influenced by a student’s
socio-economic status should be considered in conjunction with school programs to
improve student achievement. Overcoming the student’s SES is a challenge for teachers.
Second, the data indicate that it is unlikely that school districts in Virginia will
achieve the NCLB goal of 100% proficiency for students by 2014. Like the Goals 2000
program endorsed by Presidents George H.W. Bush and Bill Clinton, the NCLB
requirement for 100% proficiency has the potential of becoming irrelevant and of being
ignored by future national education leaders. Authorization for Goals 2000 was
ultimately withdrawn and funding eliminated without having achieved any of the goals.
The federal government should judiciously establish goals that are achievable and not
engage in wishful thinking. Federal government requirements for the states, local school
districts and individual schools must be tough but achievable. For over a decade, schools
have been attempting to achieve a goal of 100% proficiency for students that many knew
111
would be tough, if not impossible, to meet when it was first established. Policymakers
must be realistic in establishing policy standards for schools.
Finally, the value of having HQTs as currently classified is uncertain. While it is
certainly valid to want the best classroom teachers that society can provide, the fact that
98% of schools have all of their teachers identified as HQTs raises questions of the
standards to be a HQT. Certainly not all teachers in Virginia are of equal proficiency.
Current standards for designation as a HQT do not allow for differentiation among
teachers. This standard appears to be a minimal one rather than an achievement that all
teachers seek to obtain.
Limitations of This Study The most important limitation of this study was the inability to interview or
survey teachers and principals in schools that performed better than the quantitative
models predicted. Results indicate that there has been improvement in Virginia over the
last decade. The improvements are related to the student background and earlier
achievement. However, after identifying eight schools with a high percentage of poverty
and minority students and that performed better than predicted by the quantitative
models, the school districts were not able to make the teachers and/or principals available
for interviews or focus groups. The district representatives explained their focus on
student instruction and would not release teachers from their classroom responsibilities
for this study. In addition, removing a teacher from a classroom for an interview would
require finding another teacher, or possibly hiring a substitute teacher, to fill in for the
classroom teacher while she was absent for the interview.

112
Another limitation was the unavailability of data for all school years, although
this was not as important a limitation as the inability to interview teachers and principals.
Much of the data is now collected and made available to the general public due to the
requirements of NCLB. However, as illustrated in Appendix A, not all data are collected
or available for all years. This limited the regression analysis to three years, 2007 –
2009.
A final limitation was the limited examination of the student achievement data.
The dependent variable is based on student passing the SOL assessments at the end of the
year. More detailed examination of the SOL assessment themselves may have uncovered
changes to the assessments over the years in question that reduced the rigor of the tests.
In addition, a detailed qualitative analysis of the teaching practices in the schools may
have revealed teaching practices such as teaching to the test that resulted in higher pass
rates without any real improvement in student learning. That level of analysis was
beyond the scope of this study.
Recommendations for Further Study This study identified poverty as a factor influencing student performance;
however, it did not examine any programs or school characteristics that specifically
addressed achievement for students in poverty. During the conduct of this study, schools
were identified that had high rates of students in poverty but had performed better than
expected according to the quantitative models developed in this study. Further efforts
should be made to examine the programs, techniques and characteristics of those schools
to identify what they are doing to realize this better-than-predicted student achievement.
113
In addition, as more data becomes available additional studies into the factors that
influence student achievement should be conducted. Additional data may include
additional years for which the data elements used in this study become available and new
data elements that are collected, which could potentially influence student achievement.
The PTR analysis presented interesting results. Surprisingly, PTR was not
statistically significant and in many models provided results contrary to what was
expected. There are some interesting interactions that were not examined between PTR
and student background. These should be considered for further research and application
to school districts with high percentages of minorities and economically disadvantaged
students. Further research is required with regard to the interactions among PTR, race,
ethnicity, poverty and student achievement.
Policy Recommendations The most important finding in this study is the importance of the influence of
previous student achievement on later student achievement. This argues for continued
emphasis on instruction in the early grades. Of the three teacher characteristics examined
in this study, the percent of HQTs in a school was the only teacher characteristic that
resulted in a statistically significant positive effect in 3rd
and 5th
grade Reading and Math.
However, the average years teaching experience was a statistically significant factor in
Reading and Math in 3rd
grade but not in 5th
grade. Given this result plus the importance
of the Grade 3 Achievement lag variable, to the extent possible, elementary schools
should consider putting their most senior teachers in the earlier grades. Establishing a
114
strong level of student achievement with experienced teachers in the early grades may
result in continued strong student achievement in the later grades.
The influence of student background, especially conditions of poverty, was a
strong influence on student achievement. Efforts to understand and mitigate the effects
of poverty on student achievement should be continued. Insights derived from the studies
should then focus on developing policies and programs that are likely to improve student
achievement. Programs that schools implement should have a reasonable expectation of
success in improving student achievement. However, policy makers must realize that
schools can only do so much. Student background, especially poverty provides a large
effect on student achievement as shown in many studies going back decades and
confirmed in this study.
Expenditures on education did not influence student achievement. However,
implementing any policy change will most likely entail expending some resource to
implement and possibly maintain the policy. Policy makers should ensure that, prior to
providing additional funding for education, programs are designed to focus on areas that
will improve student achievement. Simply increasing expenditures will not result in
improved student achievement.
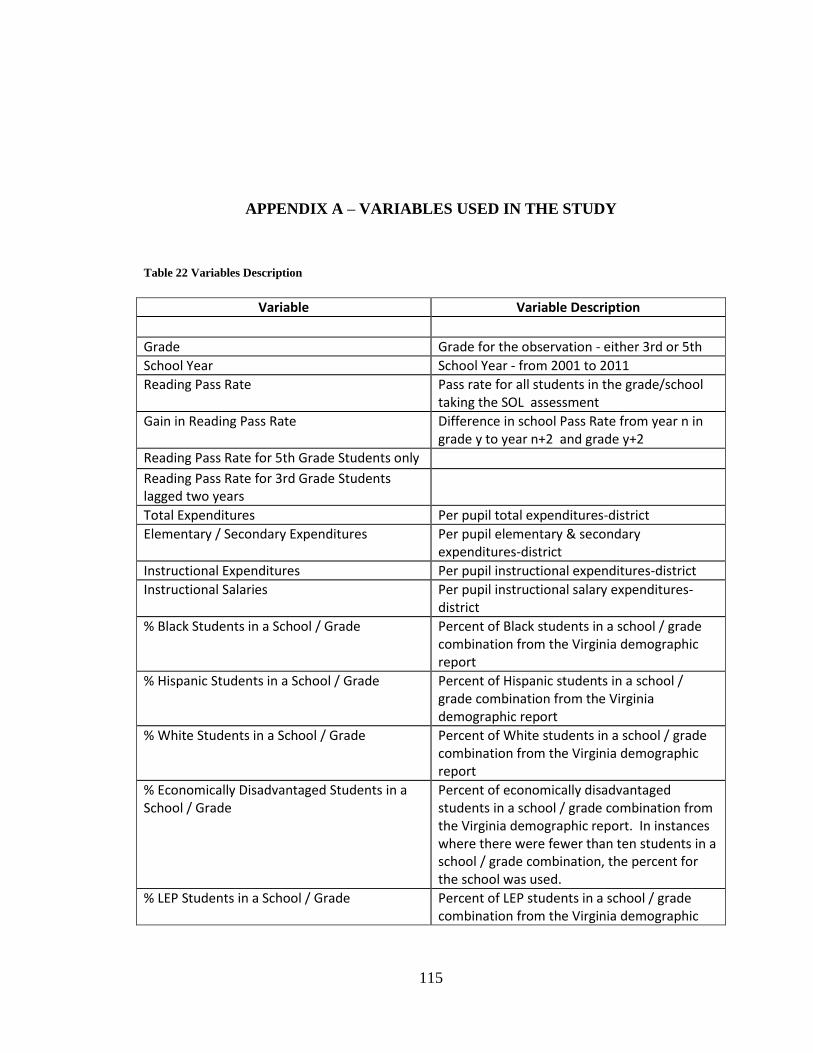
115
APPENDIX A – VARIABLES USED IN THE STUDY
Table 22 Variables Description
Variable Variable Description
Grade Grade for the observation - either 3rd or 5th School Year School Year - from 2001 to 2011 Reading Pass Rate Pass rate for all students in the grade/school
taking the SOL assessment Gain in Reading Pass Rate Difference in school Pass Rate from year n in
grade y to year n+2 and grade y+2 Reading Pass Rate for 5th Grade Students only Reading Pass Rate for 3rd Grade Students lagged two years
Total Expenditures Per pupil total expenditures-district Elementary / Secondary Expenditures Per pupil elementary & secondary
expenditures-district Instructional Expenditures Per pupil instructional expenditures-district Instructional Salaries Per pupil instructional salary expenditures-
district % Black Students in a School / Grade Percent of Black students in a school / grade
combination from the Virginia demographic report
% Hispanic Students in a School / Grade Percent of Hispanic students in a school / grade combination from the Virginia demographic report
% White Students in a School / Grade Percent of White students in a school / grade combination from the Virginia demographic report
% Economically Disadvantaged Students in a School / Grade
Percent of economically disadvantaged students in a school / grade combination from the Virginia demographic report. In instances where there were fewer than ten students in a school / grade combination, the percent for the school was used.
% LEP Students in a School / Grade Percent of LEP students in a school / grade combination from the Virginia demographic
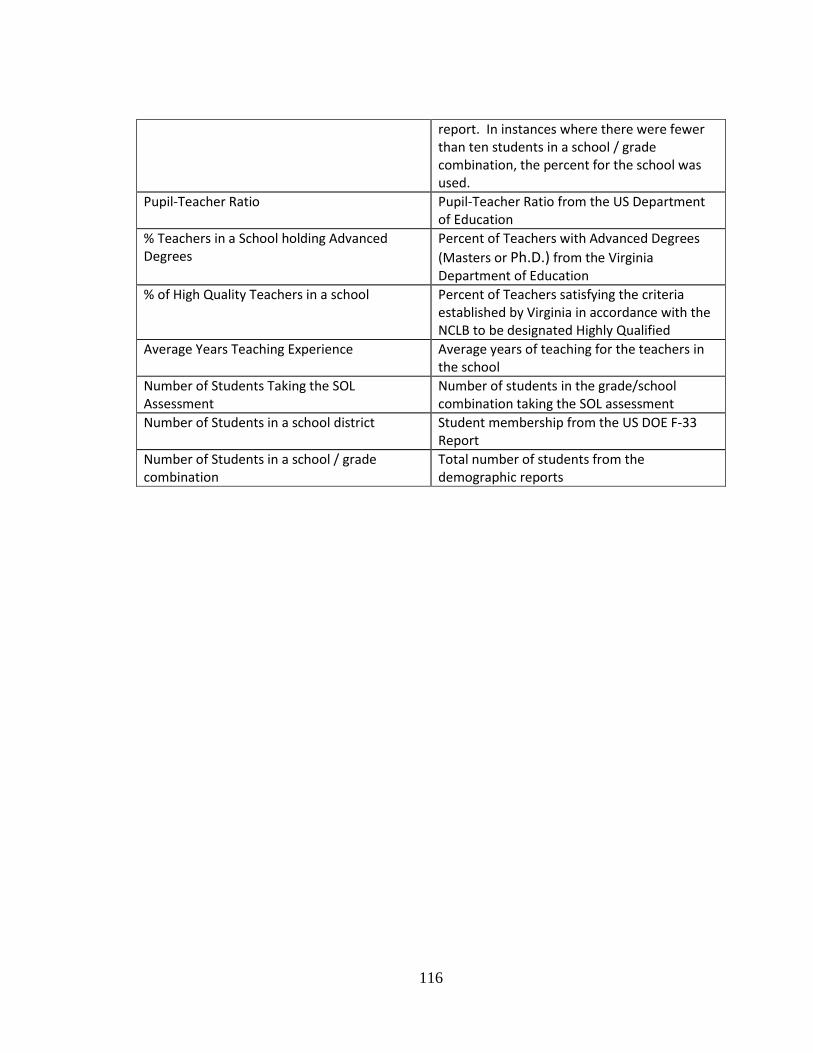
116
report. In instances where there were fewer than ten students in a school / grade combination, the percent for the school was used.
Pupil-Teacher Ratio Pupil-Teacher Ratio from the US Department of Education
% Teachers in a School holding Advanced Degrees
Percent of Teachers with Advanced Degrees
(Masters or Ph.D.) from the Virginia Department of Education
% of High Quality Teachers in a school Percent of Teachers satisfying the criteria established by Virginia in accordance with the NCLB to be designated Highly Qualified
Average Years Teaching Experience Average years of teaching for the teachers in the school
Number of Students Taking the SOL Assessment
Number of students in the grade/school combination taking the SOL assessment
Number of Students in a school district Student membership from the US DOE F-33 Report
Number of Students in a school / grade combination
Total number of students from the demographic reports
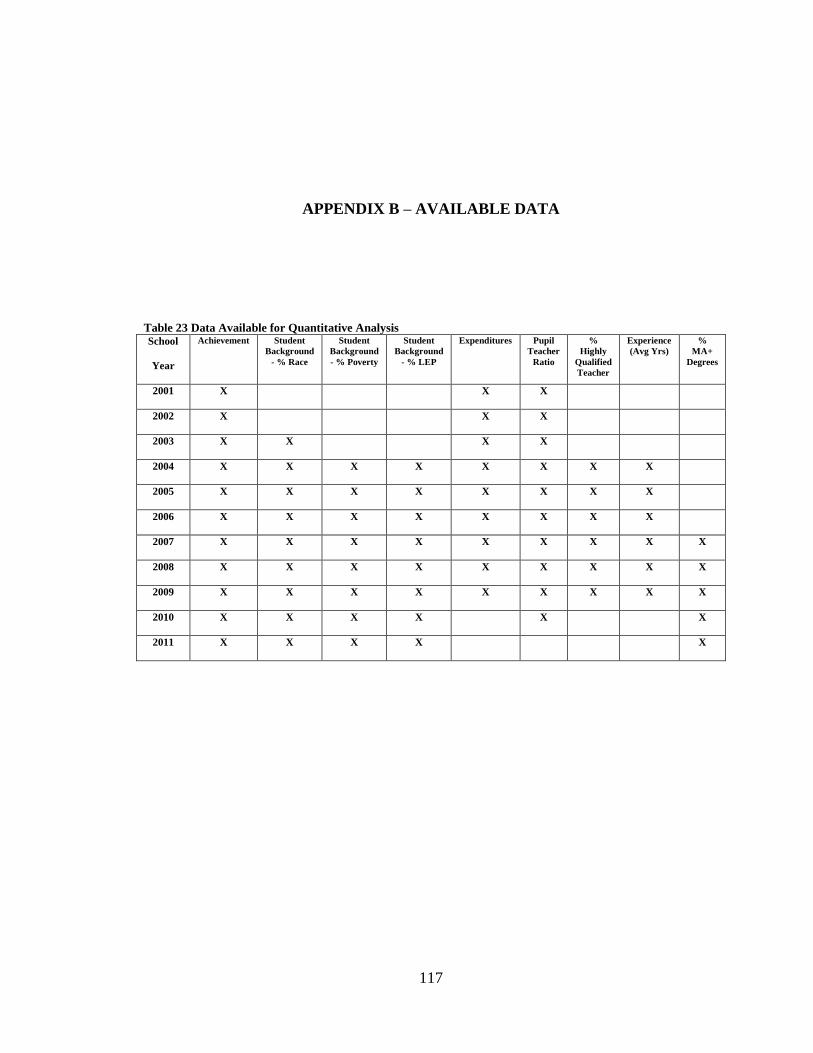
117
APPENDIX B – AVAILABLE DATA
Table 23 Data Available for Quantitative Analysis School
Year
Achievement Student
Background
- % Race
Student
Background
- % Poverty
Student
Background
- % LEP
Expenditures Pupil
Teacher
Ratio
%
Highly
Qualified
Teacher
Experience
(Avg Yrs)
%
MA+
Degrees
2001 X X X
2002 X X X
2003 X X X X
2004 X X X X X X X X
2005 X X X X X X X X
2006 X X X X X X X X
2007 X X X X X X X X X
2008 X X X X X X X X X
2009 X X X X X X X X X
2010 X X X X X X
2011 X X X X X
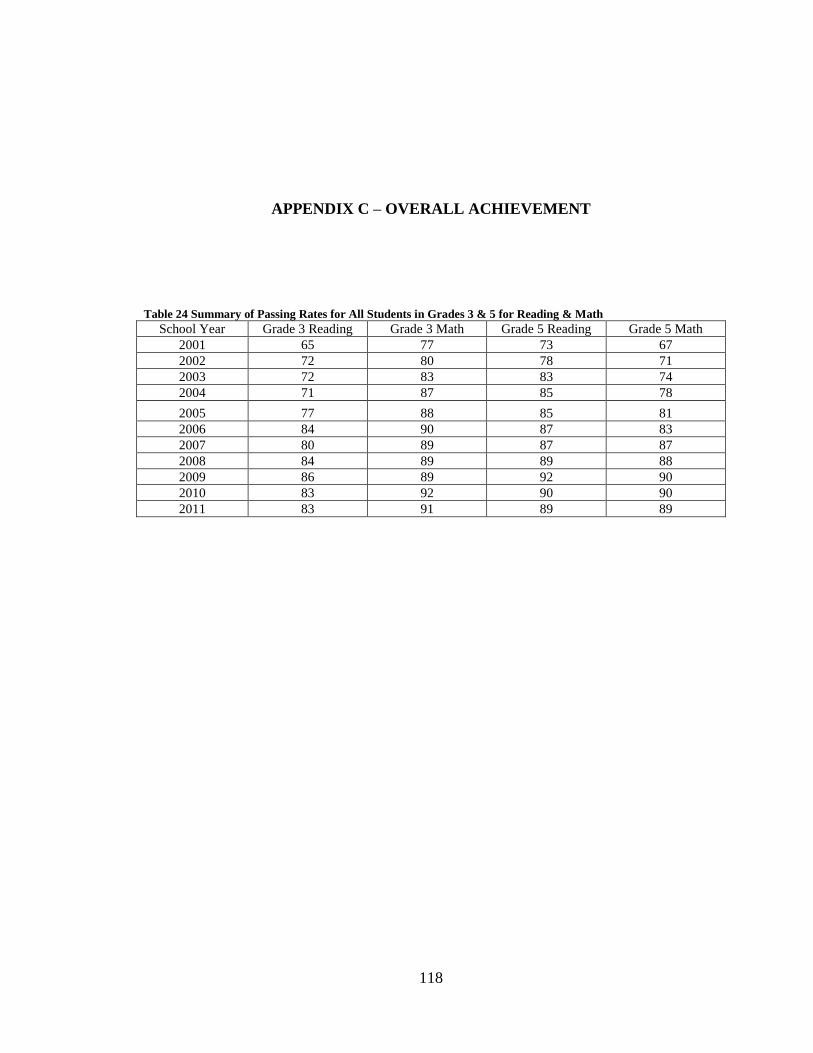
118
APPENDIX C – OVERALL ACHIEVEMENT
Table 24 Summary of Passing Rates for All Students in Grades 3 & 5 for Reading & Math
School Year Grade 3 Reading Grade 3 Math Grade 5 Reading Grade 5 Math
2001 65 77 73 67
2002 72 80 78 71
2003 72 83 83 74
2004 71 87 85 78
2005 77 88 85 81
2006 84 90 87 83
2007 80 89 87 87
2008 84 89 89 88
2009 86 89 92 90
2010 83 92 90 90
2011 83 91 89 89
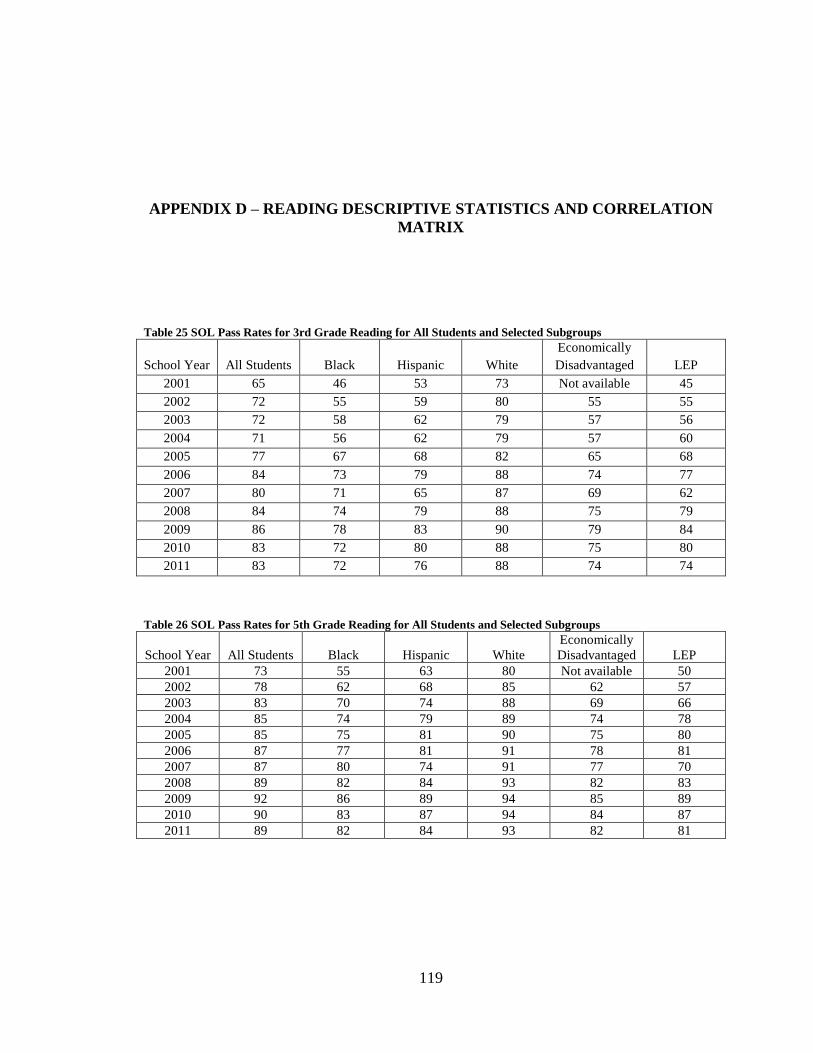
119
APPENDIX D – READING DESCRIPTIVE STATISTICS AND CORRELATION
MATRIX
Table 25 SOL Pass Rates for 3rd Grade Reading for All Students and Selected Subgroups
School Year All Students Black Hispanic White
Economically
Disadvantaged LEP
2001 65 46 53 73 Not available 45
2002 72 55 59 80 55 55
2003 72 58 62 79 57 56
2004 71 56 62 79 57 60
2005 77 67 68 82 65 68
2006 84 73 79 88 74 77
2007 80 71 65 87 69 62
2008 84 74 79 88 75 79
2009 86 78 83 90 79 84
2010 83 72 80 88 75 80
2011 83 72 76 88 74 74
Table 26 SOL Pass Rates for 5th Grade Reading for All Students and Selected Subgroups
School Year All Students Black Hispanic White
Economically
Disadvantaged LEP
2001 73 55 63 80 Not available 50
2002 78 62 68 85 62 57
2003 83 70 74 88 69 66
2004 85 74 79 89 74 78
2005 85 75 81 90 75 80
2006 87 77 81 91 78 81
2007 87 80 74 91 77 70
2008 89 82 84 93 82 83
2009 92 86 89 94 85 89
2010 90 83 87 94 84 87
2011 89 82 84 93 82 81
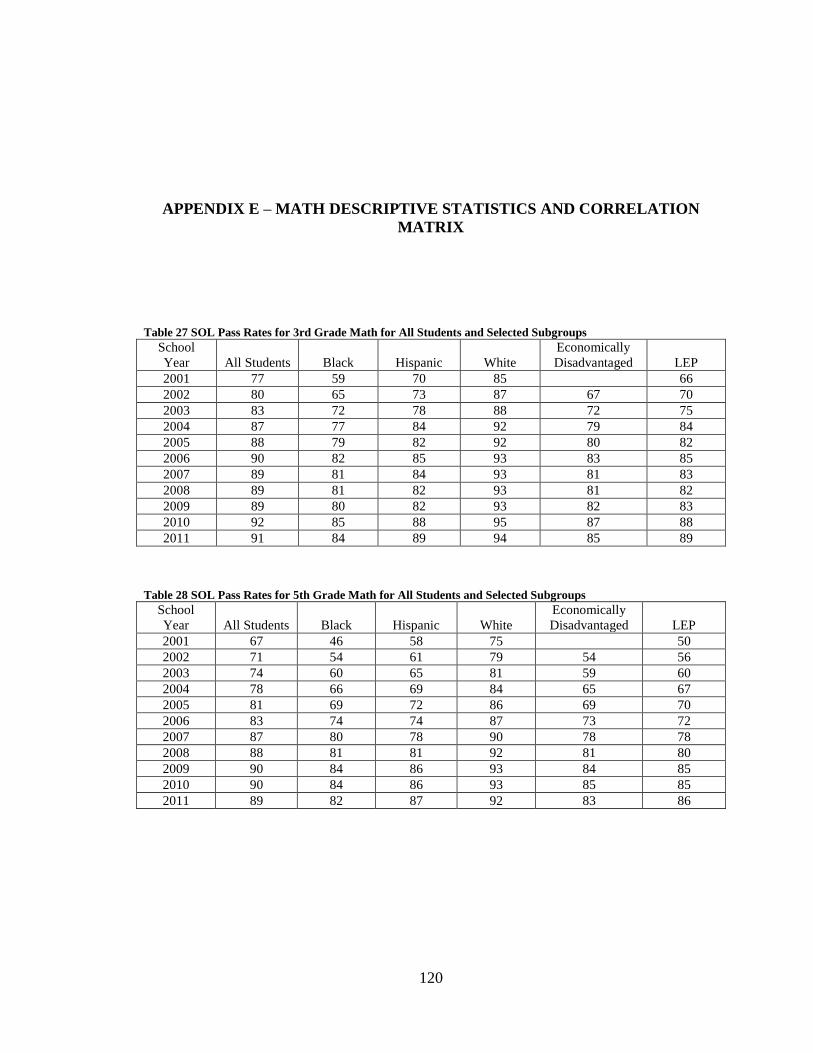
120
APPENDIX E – MATH DESCRIPTIVE STATISTICS AND CORRELATION
MATRIX
Table 27 SOL Pass Rates for 3rd Grade Math for All Students and Selected Subgroups
School
Year All Students Black Hispanic White
Economically
Disadvantaged LEP
2001 77 59 70 85 66
2002 80 65 73 87 67 70
2003 83 72 78 88 72 75
2004 87 77 84 92 79 84
2005 88 79 82 92 80 82
2006 90 82 85 93 83 85
2007 89 81 84 93 81 83
2008 89 81 82 93 81 82
2009 89 80 82 93 82 83
2010 92 85 88 95 87 88
2011 91 84 89 94 85 89
Table 28 SOL Pass Rates for 5th Grade Math for All Students and Selected Subgroups
School
Year All Students Black Hispanic White
Economically
Disadvantaged LEP
2001 67 46 58 75 50
2002 71 54 61 79 54 56
2003 74 60 65 81 59 60
2004 78 66 69 84 65 67
2005 81 69 72 86 69 70
2006 83 74 74 87 73 72
2007 87 80 78 90 78 78
2008 88 81 81 92 81 80
2009 90 84 86 93 84 85
2010 90 84 86 93 85 85
2011 89 82 87 92 83 86

121
APPENDIX F – ACHIEVEMENT GAP
Table 29 Achievement Gaps 3rd Grade Students
Reading Math
2001 2011 Gap
Reduction
2001 2011 Gap
Reduction
White Students 73 88 85 92
Black Students 46 72 59 82
White – Black Gap 27 16 11 26 10 16
Hispanic Students 53 76 70 87
White – Hispanic Gap 20 12 8 15 5 10
Table 30 Achievement Gaps for 5th Grade Students
Reading Math
2001 2011 Gap
Reduction
2001 2011 Gap
Reduction
White Students 80 93 75 92
Black Students 55 82 46 82
White – Black Gap 25 11 14 29 10 19
Hispanic Students 63 84 58 87
White – Hispanic Gap 17 9 8 17 5 12
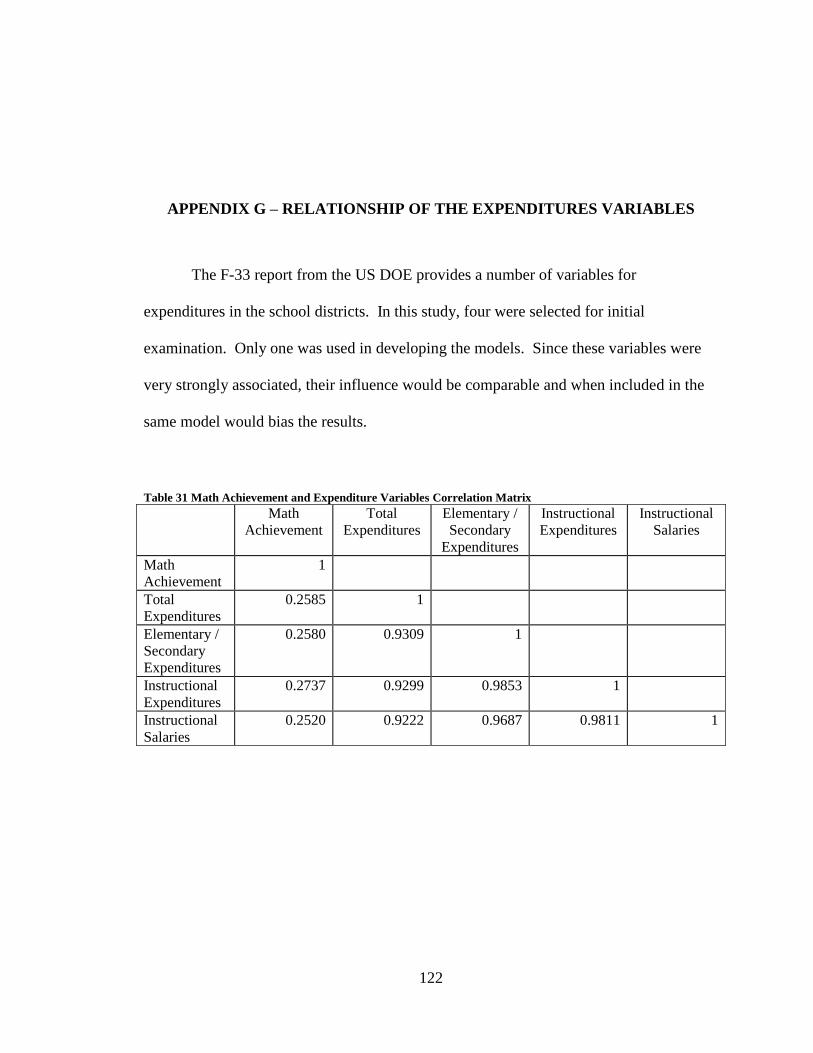
122
APPENDIX G – RELATIONSHIP OF THE EXPENDITURES VARIABLES
The F-33 report from the US DOE provides a number of variables for
expenditures in the school districts. In this study, four were selected for initial
examination. Only one was used in developing the models. Since these variables were
very strongly associated, their influence would be comparable and when included in the
same model would bias the results.
Table 31 Math Achievement and Expenditure Variables Correlation Matrix
Math
Achievement Total
Expenditures Elementary /
Secondary
Expenditures
Instructional
Expenditures Instructional
Salaries
Math
Achievement 1
Total
Expenditures 0.2585 1
Elementary /
Secondary
Expenditures
0.2580 0.9309 1
Instructional
Expenditures 0.2737 0.9299 0.9853 1
Instructional
Salaries 0.2520 0.9222 0.9687 0.9811 1

123
Table 32 Reading Achievement and Expenditure Variables Correlation Matrix
Reading
Achievement Total
Expenditures Elementary /
Secondary
Expenditures
Instructional
Expenditures Instructional
Salaries
Reading
Achievement 1
Total
Expenditures 0.2648 1
Elementary /
Secondary
Expenditures
0.2683 0.9309 1
Instructional
Expenditures 0.2823 0.9299 0.9854 1
Instructional
Salaries 0.2640 0.9222 0.9687 0.9811 1
Both correlation matrices above illustrate the high correlation among the four
expenditure variables available from the F-33 Reports. It is expected that whichever
variable was used in the regression models, the results would not differ substantially.
The Total Expenditure variable was used in the regression analyses as it represented the
largest of the four variables and was the variable that is most commonly cited when
addressing per pupil expenditures in the literature. Had these variables not been so
highly correlated, more than the single expenditure would have been considered for the
study.
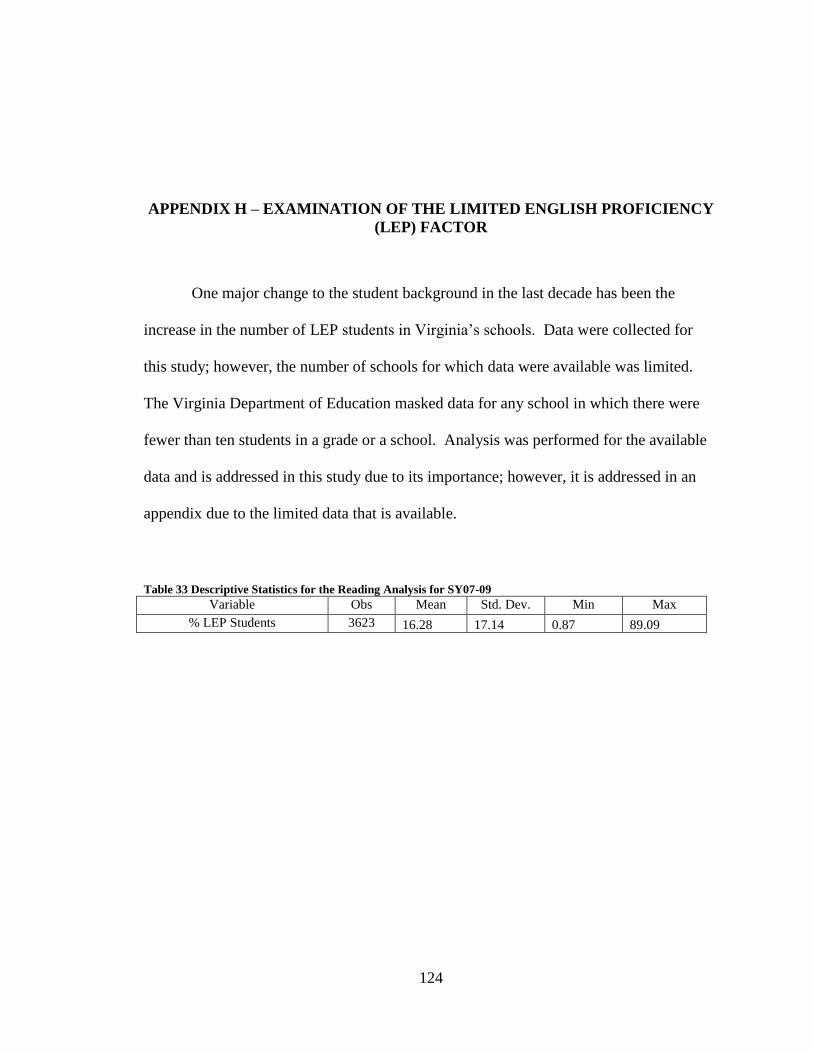
124
APPENDIX H – EXAMINATION OF THE LIMITED ENGLISH PROFICIENCY
(LEP) FACTOR
One major change to the student background in the last decade has been the
increase in the number of LEP students in Virginia’s schools. Data were collected for
this study; however, the number of schools for which data were available was limited.
The Virginia Department of Education masked data for any school in which there were
fewer than ten students in a grade or a school. Analysis was performed for the available
data and is addressed in this study due to its importance; however, it is addressed in an
appendix due to the limited data that is available.
Table 33 Descriptive Statistics for the Reading Analysis for SY07-09
Variable Obs Mean Std. Dev. Min Max
% LEP Students 3623 16.28 17.14 0.87 89.09
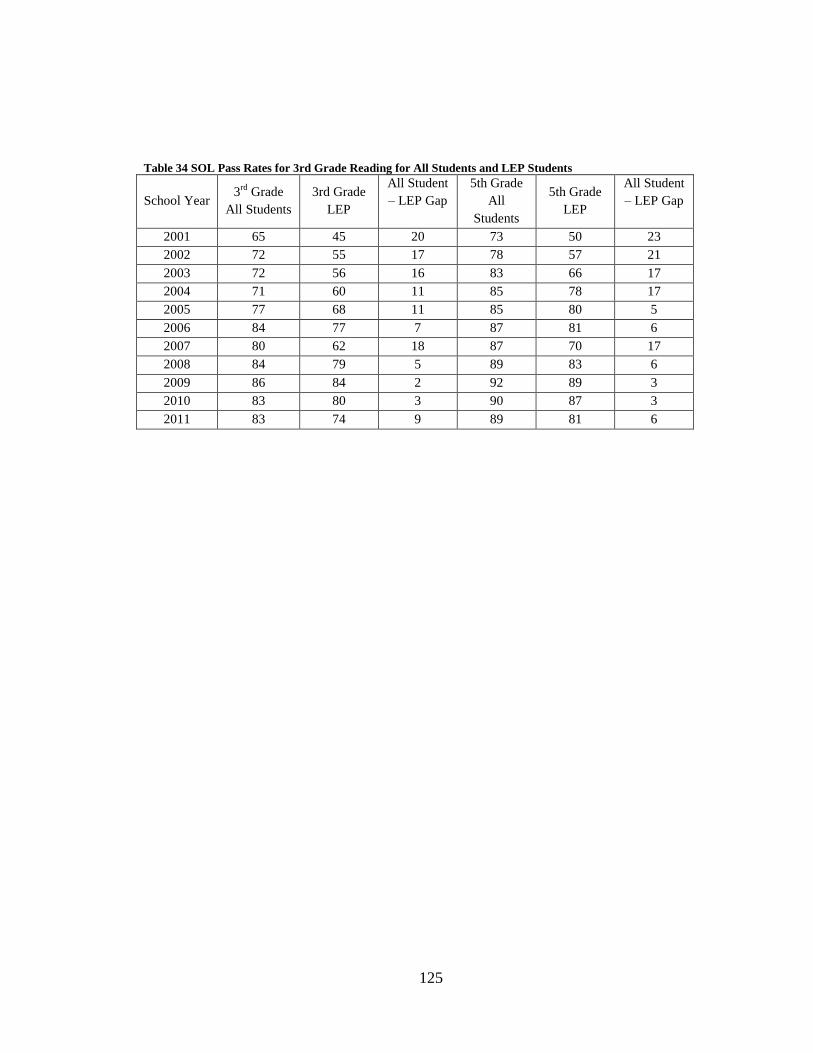
125
Table 34 SOL Pass Rates for 3rd Grade Reading for All Students and LEP Students
School Year 3
rd Grade
All Students
3rd Grade
LEP
All Student
– LEP Gap
5th Grade
All
Students
5th Grade
LEP
All Student
– LEP Gap
2001 65 45 20 73 50 23
2002 72 55 17 78 57 21
2003 72 56 16 83 66 17
2004 71 60 11 85 78 17
2005 77 68 11 85 80 5
2006 84 77 7 87 81 6
2007 80 62 18 87 70 17
2008 84 79 5 89 83 6
2009 86 84 2 92 89 3
2010 83 80 3 90 87 3
2011 83 74 9 89 81 6
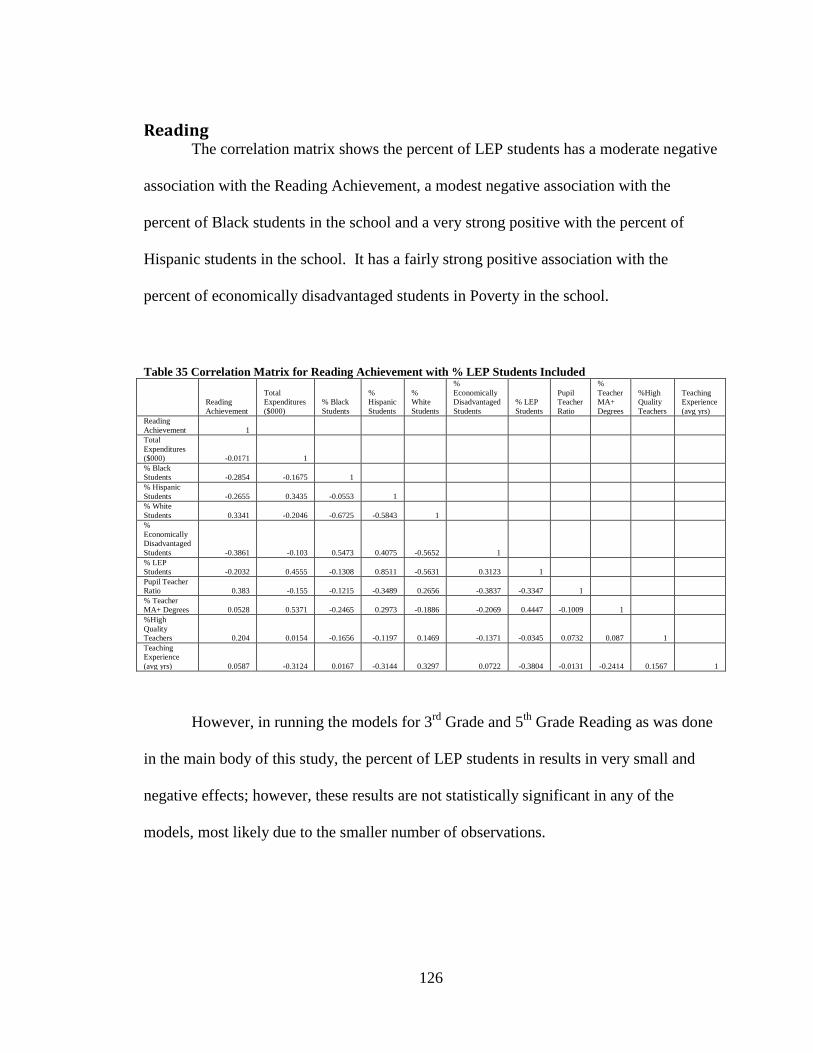
126
Reading The correlation matrix shows the percent of LEP students has a moderate negative
association with the Reading Achievement, a modest negative association with the
percent of Black students in the school and a very strong positive with the percent of
Hispanic students in the school. It has a fairly strong positive association with the
percent of economically disadvantaged students in Poverty in the school.
Table 35 Correlation Matrix for Reading Achievement with % LEP Students Included
Reading
Achievement
Total
Expenditures
($000)
% Black
Students
%
Hispanic
Students
%
White
Students
%
Economically
Disadvantaged
Students
% LEP
Students
Pupil
Teacher
Ratio
%
Teacher
MA+
Degrees
%High
Quality
Teachers
Teaching
Experience
(avg yrs)
Reading
Achievement 1
Total
Expenditures
($000) -0.0171 1
% Black
Students -0.2854 -0.1675 1
% Hispanic
Students -0.2655 0.3435 -0.0553 1
% White
Students 0.3341 -0.2046 -0.6725 -0.5843 1
%
Economically
Disadvantaged
Students -0.3861 -0.103 0.5473 0.4075 -0.5652 1
% LEP
Students -0.2032 0.4555 -0.1308 0.8511 -0.5631 0.3123 1
Pupil Teacher
Ratio 0.383 -0.155 -0.1215 -0.3489 0.2656 -0.3837 -0.3347 1
% Teacher
MA+ Degrees 0.0528 0.5371 -0.2465 0.2973 -0.1886 -0.2069 0.4447 -0.1009 1
%High
Quality
Teachers 0.204 0.0154 -0.1656 -0.1197 0.1469 -0.1371 -0.0345 0.0732 0.087 1
Teaching
Experience
(avg yrs) 0.0587 -0.3124 0.0167 -0.3144 0.3297 0.0722 -0.3804 -0.0131 -0.2414 0.1567 1
However, in running the models for 3rd
Grade and 5th
Grade Reading as was done
in the main body of this study, the percent of LEP students in results in very small and
negative effects; however, these results are not statistically significant in any of the
models, most likely due to the smaller number of observations.
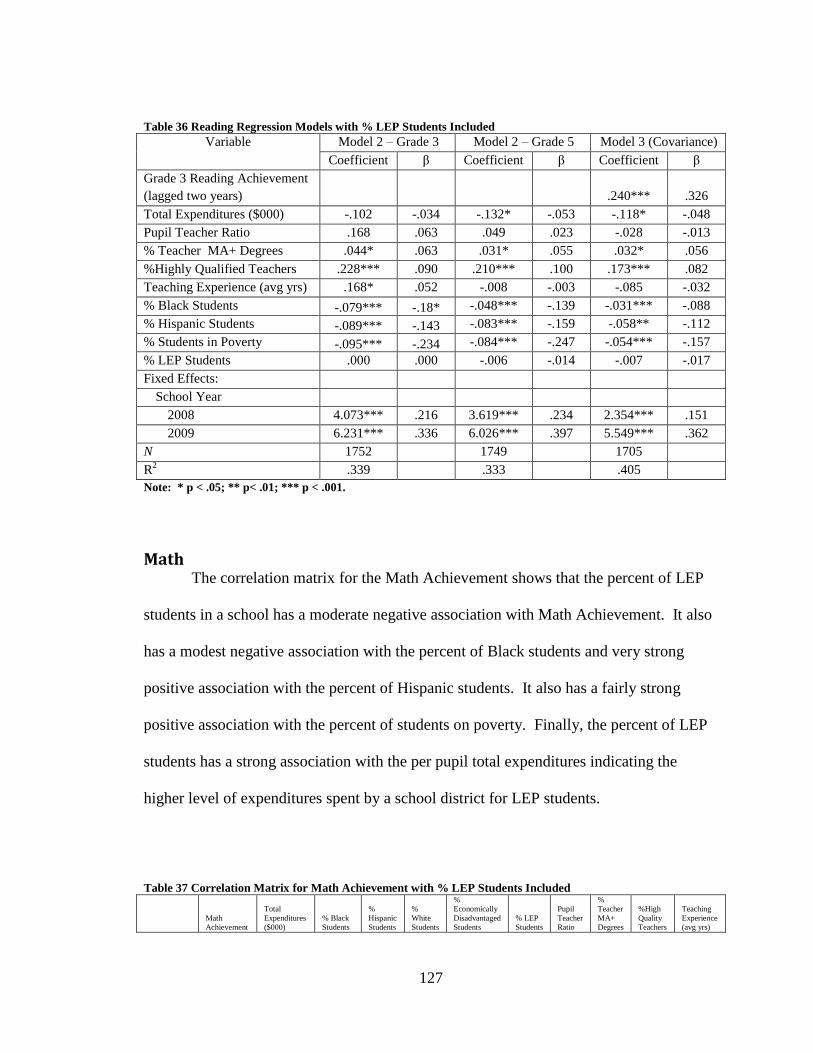
127
Table 36 Reading Regression Models with % LEP Students Included
Variable Model 2 – Grade 3 Model 2 – Grade 5 Model 3 (Covariance)
Coefficient β Coefficient β Coefficient β
Grade 3 Reading Achievement
(lagged two years) .240*** .326
Total Expenditures ($000) -.102 -.034 -.132* -.053 -.118* -.048
Pupil Teacher Ratio .168 .063 .049 .023 -.028 -.013
% Teacher MA+ Degrees .044* .063 .031* .055 .032* .056
%Highly Qualified Teachers .228*** .090 .210*** .100 .173*** .082
Teaching Experience (avg yrs) .168* .052 -.008 -.003 -.085 -.032
% Black Students -.079*** -.18* -.048*** -.139 -.031*** -.088
% Hispanic Students -.089*** -.143 -.083*** -.159 -.058** -.112
% Students in Poverty -.095*** -.234 -.084*** -.247 -.054*** -.157
% LEP Students .000 .000 -.006 -.014 -.007 -.017
Fixed Effects:
School Year
2008 4.073*** .216 3.619*** .234 2.354*** .151
2009 6.231*** .336 6.026*** .397 5.549*** .362
N 1752 1749 1705
R2 .339 .333 .405
Note: * p < .05; ** p< .01; *** p < .001.
Math The correlation matrix for the Math Achievement shows that the percent of LEP
students in a school has a moderate negative association with Math Achievement. It also
has a modest negative association with the percent of Black students and very strong
positive association with the percent of Hispanic students. It also has a fairly strong
positive association with the percent of students on poverty. Finally, the percent of LEP
students has a strong association with the per pupil total expenditures indicating the
higher level of expenditures spent by a school district for LEP students.
Table 37 Correlation Matrix for Math Achievement with % LEP Students Included
Math
Achievement
Total
Expenditures
($000)
% Black
Students
%
Hispanic
Students
%
White
Students
%
Economically
Disadvantaged
Students
% LEP
Students
Pupil
Teacher
Ratio
%
Teacher
MA+
Degrees
%High
Quality
Teachers
Teaching
Experience
(avg yrs)

128
Math
Achievement 1
Total
Expenditures
($000) -0.0451 1
% Black
Students -0.2772 -0.1675 1
% Hispanic
Students -0.2776 0.3435 -0.0553 1
% White
Students 0.3566 -0.2046 -0.6725 -0.5843 1
%
Economically
Disadvantaged
Students -0.3666 -0.103 0.5473 0.4075 -0.5652 1
% LEP
Students -0.2263 0.4555 -0.1308 0.8511 -0.5631 0.3123 1
Pupil Teacher
Ratio 0.2338 -0.155 -0.1215 -0.3489 0.2656 -0.3837 -0.3347 1
% Teacher
MA+ Degrees -0.0031 0.5371 -0.2465 0.2973 -0.1886 -0.2069 0.4447 -0.1009 1
%High
Quality
Teachers 0.1604 0.0154 -0.1656 -0.1197 0.1469 -0.1371 -0.0345 0.0732 0.087 1
Teaching
Experience
(avg yrs) 0.0923 -0.3124 0.0167 -0.3144 0.3297 0.0722 -0.3804 -0.0131 -0.2414 0.1567 1
However, in running the models for 3rd
Grade and 5th
Grade Math as was done in
the main body of this study and for the Reading Achievement above, the percent of LEP
students in results in very small and negative effects; however, these results are not
statistically significant in any of the models, most likely due to the smaller number of
observations.

129
Table 38 Math Regression Models with % LEP Students Included
Variable Model 2 – Grade 3 Model 2 – Grade 5 Model 3 (Covariance)
Coefficient β Coefficient β Coefficient β
Grade 3 Math Achievement
(lagged two years) .402*** .369
Total Expenditures ($000) -.030 -.013 -.062 -.024 -.050 -.019
Pupil Teacher Ratio .091 .043 -.097 -.042 -.226** -.099
% Teacher MA+ Degrees .004 .008 -.018 -.030 -.016 -.027
%Highly Qualified Teachers .141*** .070 .153** .069 .109* ..049
Teaching Experience (avg yrs) .141* .055 .047 .017 -.016 -.004
% Black Students -.086*** -.253 -.037*** -.101 -.005 -.014
% Hispanic Students -.068*** -.139 -.080*** -.147 -.058* -.106
% Students in Poverty -.063*** -.196 -.081*** -.225 -.060*** -.166
% LEP Students -.029 -.074 .001 002 -.007 -.015
Fixed Effects:
School Year
2008 -.219 -.015 2.174*** .133 1.924*** .116
2009 -.221 -.015 4.313*** .269 4.355*** .271
N 1752 1749 1705
R2 .268 .172 .280
Note: * p < .05; ** p< .01; *** p < .001.
130
APPENDIX I – NCLB HIGHLY QUALIFIED TEACHER EXTRACT
PUBLIC LAW 107–110—JAN. 8, 2002
‘‘No Child Left Behind Act of 2001’’
TITLE IX – General Provisions
Part A – Definitions
Sec. 9101. Definitions
‘‘(23) HIGHLY QUALIFIED.—The term ‘highly qualified’—
‘‘(A) when used with respect to any public elementary school or secondary school
teacher teaching in a State, means that—
‘‘(i) the teacher has obtained full State certification as a teacher (including
certification obtained through alternative routes to certification) or passed the State
teacher licensing examination, and holds a license to teach in such State, except that
when used with respect to any teacher teaching in a public charter school, the term means
that the teacher meets the requirements set forth in the State’s public charter school law;
and
‘‘(ii) the teacher has not had certification or licensure requirements waived on an
emergency, temporary, or provisional basis;
‘‘(B) when used with respect to—

131
‘‘(i) an elementary school teacher who is new to the profession, means that the
teacher—
‘‘(I) holds at least a bachelor’s degree; and
‘‘(II) has demonstrated, by passing a rigorous State test, subject knowledge and
teaching skills in reading, writing, mathematics, and other areas of the basic elementary
school curriculum (which may consist of passing a State-required certification or
licensing test or tests in reading, writing, mathematics, and other areas of the basic
elementary school curriculum); or
‘‘(ii) a middle or secondary school teacher who is new to the profession, means
that the teacher holds at least a bachelor’s degree and has demonstrated a high level of
competency in each of the academic subjects in which the teacher teaches by—
‘‘(I) passing a rigorous State academic subject test in each of the academic
subjects in which the teacher teaches (which may consist of a passing level of
performance on a State-required certification or licensing test or tests in each of the
academic subjects in which the teacher teaches); or
‘‘(II) successful completion, in each of the academic subjects in which the teacher
teaches, of an academic major, a graduate degree, coursework equivalent to an
undergraduate academic major, or advanced certification or credentialing; and
‘‘(C) when used with respect to an elementary, middle, or secondary school
teacher who is not new to the profession, means that the teacher holds at least a
bachelor’s degree and—

132
‘‘(i) has met the applicable standard in clause (i) or (ii) of subparagraph (B),
which includes an option for a test; or
‘‘(ii) demonstrates competence in all the academic subjects in which the teacher
teaches based on a high objective uniform State standard of evaluation that—
‘‘(I) is set by the State for both grade appropriate academic subject matter
knowledge and teaching skills;
‘‘(II) is aligned with challenging State academic content and student academic
achievement standards and developed in consultation with core content specialists,
teachers, principals, and school administrators;
‘‘(III) provides objective, coherent information about the teacher’s attainment of
core content knowledge in the academic subjects in which a teacher teaches;
‘‘(IV) is applied uniformly to all teachers in the same academic subject and the
same grade level throughout the State;
‘‘(V) takes into consideration, but not be based primarily on, the time the teacher
has been teaching in the academic subject;
‘‘(VI) is made available to the public upon request; and
‘‘(VII) may involve multiple, objective measures of teacher competency.

133
APPENDIX J – VIRGINIA HIGHLY QUALIFIED TEACHERS DESIGNATION
EXTRACT
COMMONWEALTH OF VIRGINIA
DEPARTMENT OF EDUCATION
P.O. BOX 2120
RICHMOND, VIRGINIA 23218-2120
SUPTS. MEMO NO. 43
February 23, 2007
INFORMATIONAL
TO: Division Superintendents
FROM: Billy K. Cannaday, Jr.
Superintendent of Public Instruction
SUBJECT: Revisions in Criteria to Designate Teachers Highly Qualified
In June 2006, the United States Department of Education (USED) reported to the
Virginia Department of Education the results of the USED Academic Improvement and
Teacher Quality Programs team review of the state's progress in meeting the highly
qualified teacher provisions of the No Child Left Behind Act of 2001 (NCLB) and
Virginia's administration of the Title II, Part A, Improving Teacher Quality State Grants
program.
In the report, USED cited Virginia on the following two issues related to Virginia's
implementation of the highly qualified teacher requirements:
Virginia's using the Praxis II middle school assessments for newly-hired high
school special education teachers to demonstrate content knowledge did not meet
the requirements of NCLB or the Individuals with Disabilities Education
Improvement Act of 2004 (IDEA); and
Virginia's High Objective Uniform State Standard of Evaluation (HOUSSE)
option of allowing licensed elementary, middle, and secondary teachers not new
to the profession to become highly qualified by the completion of an earned
advanced degree in any area from an accredited college or university did not meet
the requirements of NCLB.
The Virginia Department of Education was advised by USED that these issues regarding
highly qualified teachers must be resolved by December 29, 2006, and the approved
134
definition reflected in the 2005-2006 data reported on highly qualified teachers. Virginia
submitted a response, and notification was received on January 25, 2007, that the data
fully addressed the requirements, and the conditions on both the ESEA Title I, Part A,
and Title II, Part A, grants have been removed.
High school special education teachers new to the profession must meet one of the
following options to demonstrate subject-matter competency in the subject(s) they teach.
The criteria for highly qualified teachers do not apply to special education consultative
teachers who are collaborating with a core academic teacher.
1. Options provided by the No Child Left Behind Act, including an academic
major in the content area, graduate degree in the teaching content area, or
coursework equivalent to an undergraduate major. [New secondary special
education teachers who teach two or more academic subjects who are highly
qualified in mathematics, language arts, science, or social studies have two years
after the date of employment to be highly qualified in the other core academic
subject area, which may include HOUSSE. If teaching core academic subjects
exclusively to children assessed on alternate achievement standards, the teacher
must meet highly qualified requirements for an elementary teacher.]
2. Rigorous State Academic Subject Test: Pass the appropriate Praxis II
assessment(s) in the high school subject(s) they teach.
3. Rigorous State Academic Subject Test: Pass the appropriate Middle
School Praxis II assessment(s) in the subject(s) they teach if the special
education teacher new to the profession is teaching classes at a high school
campus in which the students are not earning standard credit in core academic
areas towards a high school diploma.
To address the citation regarding the option of allowing licensed elementary, middle, and
secondary teachers not new to the profession to become highly qualified by the
completion of an earned advanced degree (with any major) from an accredited college or
university, the Board of Education approved an amendment to Virginia's High Objective
Uniform State Standard of Evaluation (HOUSSE). The completion of an earned
advanced degree from an accredited college or university must be in the subject(s) the
teacher is teaching. Attached is the amended HOUSSE reflecting this change.
Each state was required to submit a plan to limit the use of the HOUSSE. Attached is
Virginia's plan including specific exceptions. Teachers who have met previously
approved criteria by the Virginia Department of Education will continue to be designated
highly qualified.
If you have any questions, please do not hesitate to contact Mrs. Patty S. Pitts, assistant
superintendent for teacher education and licensure, at (804) 371-2522;
135
BKCJr/psp
http://www.doe.virginia.gov/administrators/superintendents_memos/2007/inf043a.pdf
http://www.doe.virginia.gov/administrators/superintendents_memos/2007/inf043b.pdf

136
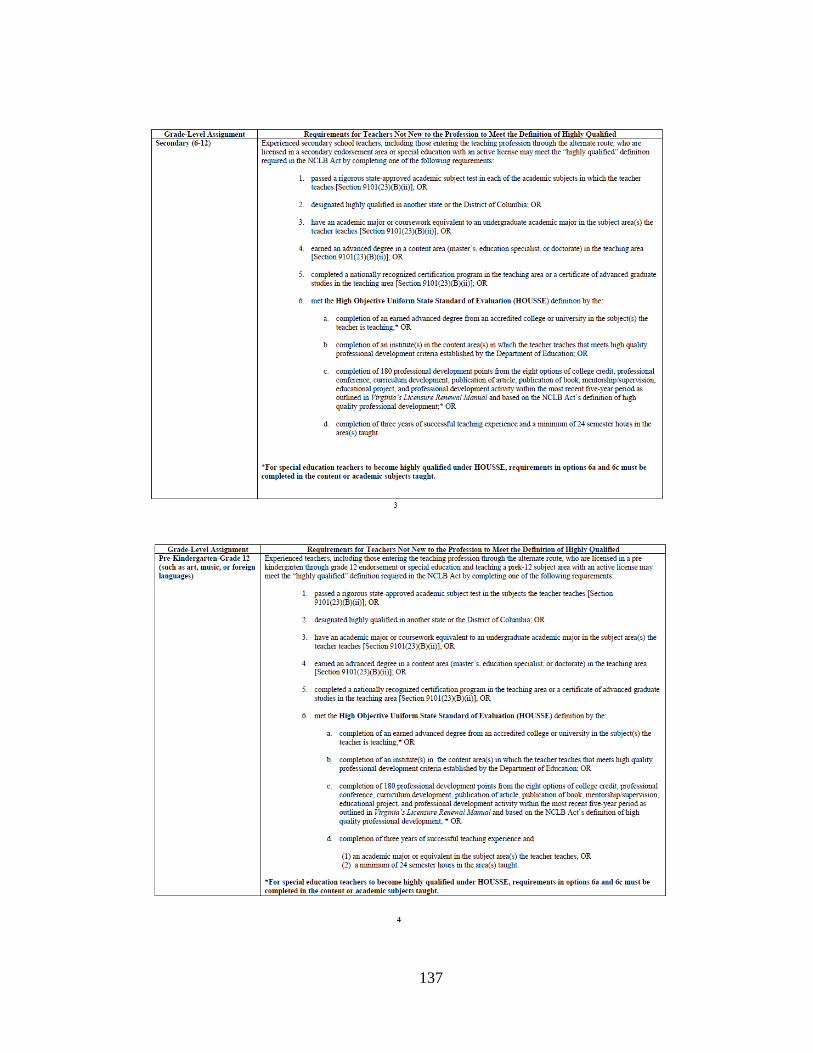
137
138
REFERENCES
Alexander, Karl L., Doris R. Entwisle, and Linda S. Olson. “Schools, Achievement, and
Inequality: A Seasonal Perspective.” Educational Evaluation and Policy Analysis
23, no. 2 (July 1, 2001): 171–191.
Armor, David. “Can NCLB Close Achievement Gaps?” In No Child Left Behind and the
Reduction of the Achievement Gap. New York: Routledge, 2007.
Armor, David J. Maximizing Intelligence. New Brunswick, NJ: Transaction Publishers,
2003.
Armor, David J. “School and Family Effects on Black and White Achievement: A
Reexamination of the USOE Data.” In On Equality of Educational Opportunity,
570. 1st ed. New York: Vintage Books, 1972.
“Brookings Papers on Education Policy: 2006-2007 - Brookings Institution”, n.d.
http://www.brookings.edu/press/Journals/2007/brookingspapersoneducationpolicy
20062007.aspx.
Brown, Emma. “Criticism, Praise for Va., Md. on ‘No Child’.” Washington Post.
Washington, DC, May 7, 2012, sec. Metro.
Bush, G.W. “No Child Left Behind”, 2001. http://www.whitehouse.gov/news/reports/no-
child-left-behind.pdf.
Chenowith, Karin. It’s Being Done. Cambridge, Massachusetts: Harvard Education Press,
2007.
Chubb, John E, and Tom Loveless, eds. Bridging the Achievement Gap. Washington,
D.C: Brookings Institution Press, 2002.
“Class Size Research: A Critique of Recent Meta-Analyses.” The Phi Delta Kappan 62,
no. 4 (December 1, 1980): 239–241.
“ClassSizeSTAR.pdf”, n.d.
http://www.aypf.org/publications/rmaa/pdfs/ClassSizeSTAR.pdf.
139
Coleman, James S. Equality of Educational Opportunity. Washington, DC: U.S.
Government Printing Office, 1966.
“Common Core of Data (CCD) - Local Education Agency (School District) Finance
Survey (F-33) Data”, n.d. http://nces.ed.gov/ccd/f33agency.asp.
Cross, Lawrence H. “Are Virginia’s Public Schools Failing? Assessing the
Assessments.” Virginia Issues & Answers - A Public Policy Forum, May 1999.
http://www.via.vt.edu/spring99/schools.html.
Darling-Hammond, Linda. The Flat World and Education: How America’s Commitment
to Equity Will Determine Our Future. New York: Teachers College Press, 2010.
Ferguson, Ronald F. “Paying for Public Education: New Evidence on How and Why
Money Matters.” Harvard Journal on Legislation 28 (1991): 465.
Ferguson, Ronald F., and Jal Mehta. “An Unfinished Journey: The Legacy of Brown and
the Narrowing of the Achievement Gap.” The Phi Delta Kappan 85, no. 9 (May 1,
2004): 656–669.
Fuller, Sarah, and Helen Ladd. School Based Accountability and the Distribution of
Teacher Quality Among Grades in Elementary School. Washington, DC: National
Center for Analysis of Longitudinal Data in Education Research, April 2012.
http://www.caldercenter.org/publications/upload/wp75.pdf.
Glass, Gene V., and Mary Lee Smith. “Meta-Analysis of Research on Class Size and
Achievement.” Educational Evaluation and Policy Analysis 1, no. 1 (January 1,
1979): 2–16.
“Goals 2000: Reforming Education to Improve Student Achievement - History - April
30, 1998”, n.d. http://www2.ed.gov/pubs/G2KReforming/g2ch1.html.
Grissmer, David W., Ann Flanagan, Jennifer Kawata, and Stephanie Williamson.
Improving Student Achievement: What State NAEP Test Scores Tell Us. Santa
Monica, California: Rand, 2000.
Hanushek, Eric A. “School Resources and Student Performance.” In Does Money
Matter? The Effect of School Resources on Student Achievement and Adult
Success, 43–73. Washington, DC: Brookings Institution Press, 1996.
Harris, Douglas N. “Class Size and School Size: Taking the Trade-Offs Seriously.”
Brookings Papers on Education Policy, no. 9 (January 1, 2006): 137–161.
Harris, Douglas N., and Tim R. Sass. Teacher Training, Teacher Quality and Student
Achievement. Washington, DC: National Center for Analysis of Longitudinal
140
Data in Education Research, March 12, 2008.
http://www.caldercenter.org/PDF/1001059_Teacher_Training.pdf.
Hedges, Larry V., and Rob Greenwald. “Have Times Changed? The Relation Between
School Resources and Student Performance.” In Does Money Matter? The Effect
of School Resources on Student Achievement and Adult Success, 74–92.
Washington, DC: Brookings Institution Press, 1996.
Jamerson, Bruce F. “Constitution of Virginia”, January 1, 1971.
http://legis.state.va.us/Laws/search/ConstOfVa.pdf.
Jencks, Christopher. Inequality: A Reassessment of the Effect of Family and Schooling in
America. New York: Basic Books, 1972.
Jennings, J.F. Why National Standards and Tests? Politics and the Quest for Better
Schools. Thousand Oaks, California: Sage Publications, Inc., 1998.
Kennedy, Edward M. True Compass. New York, NY: Twelve, 2009.
Lee, Jaekyung. “Racial and Ethnic Achievement Gap Trends: Reversing the Progress
Toward Equity?” Educational Researcher 31, no. 1 (January 1, 2002): 3–12.
Lessinger, Leon M. Every Kid a Winner: Accountability in Education. New York: Simon
and Schuster, 1970.
Loveless, Tom, and Frederick M. Hess. “Introduction: What Do We Know About School
Size and Class Size?” Brookings Papers on Education Policy, no. 9 (January 1,
2006): 1–14.
Manna, Paul. Collision Course : Federal Education Policy Meets State and Local
Realities. 2nd ed. Washington, DC: CQ Press, 2011.
Martin, Don T. Accountability in American Education: A Critique. Princeton, N. J:
Princeton Book Co, 1976.
Mintrom, M., and S. Vergari. “Education Reform and Accountability Issues in an
Intergovernmental Context.” Publius 27, no. 2 (Spring 1997): 143–166.
Moynihan, Daniel P, and Frederick Mosteller, eds. On Equality of Educational
Opportunity. 1st ed. New York: Vintage Books, 1972.
National Commission on Excellence in Education. “A Nation at Risk: The Imperative for
Educational Reform”, 1983. http://www.ed.gov/pubs/NatAtRisk/index.html.
141
Peterson, Paul E., and Martin R. West. “The Politics and Practice of Accountability.” In
No Child Left Behind? The Politics and Practice of School Accountability., 1–20.
Washington, DC: Brookings Institution Press, n.d.
“PLAW-107publ110.pdf”, n.d. http://www.gpo.gov/fdsys/pkg/PLAW-
107publ110/pdf/PLAW-107publ110.pdf.
Ream, Robert K., and Gregory J. Palardy. “Reexamining Social Class Differences in the
Availability and the Educational Utility of Parental Social Capital.” American
Educational Research Journal 45, no. 2 (June 1, 2008): 238–273.
Rudalevige, A. Forging A Congressional Compromise. No Child Left Behind?
Harrisonburg, Virginia: The Brookings Institution, 2003.
Schanzenbach, Diane Whitmore. “What Have Researchers Learned from Project STAR?”
Brookings Papers on Education Policy, no. 9 (January 1, 2006): 205–228.
Tan, Sandra. “Schools Board Changes Stance On Goals 2000 - Daily Press”, June 27,
1997. http://articles.dailypress.com/1997-06-27/news/9706270019_1_school-
boards-george-allen-virginia-s-terms.
The Nations Report Card: Mathematics 2011. National Center for Education Statistics
(2011). Institute of Education Sciences, U.S. Department of Education,
Washington, DC, November 2011.
http://nces.ed.gov/nationsreportcard/pubs/main2011/2012458.asp.
The Nations Report Card: Reading 2011. National Center for Education Statistics (2011).
Institute of Education Sciences, U.S. Department of Education, Washington, DC,
November 2011. http://nces.ed.gov/nationsreportcard/pdf/main2011/2012457.pdf.
“VDOE :: Data Collections :: Student & School Records :: Student Records Data
Definitions”, n.d.
http://www.doe.virginia.gov/info_management/data_collection/student_record_co
llection/data_definitions.shtml#disadvantaged.
“VDOE :: Highly Qualified Teachers and Paraprofessionals”, n.d.
http://www.doe.virginia.gov/teaching/highly_qualified/index.shtml.
“VDOE Fall Membership - Custom Reports.” VDOE - Fall Membership Reports, n.d.
http://bi.vita.virginia.gov/doe_bi/rdPage.aspx?rdReport=Main&subRptName=Fall
membership.
“Virginia Assessment Results”, n.d.
https://p1pe.doe.virginia.gov/datareports/assess_test_result.do.

142
“Virginia Requirements For Highly Qualified Teacher Designation (Not New
Teachers).pdf”, n.d.
http://www.doe.virginia.gov/teaching/licensure/va_requirements_teachers_not-
new.pdf.
Walberg, Herbert J. “Real Accountability.” In Our Schools and Our Future : --are We
Still at Risk?, 305–328. Koret Task Force on K-12 Education. Stanford,
California: Hoover Institution Press, Stanford University, 2003.
Weber, Karl. Waiting for “Superman”. United States: Participant Media, 2012.
Word, Elizabeth, John Johnston, and Helen Pate Bain. The State of Tennessee’s STAR
Project-Final Summary Report, n.d.
http://www.misd.k12.wa.us/departments/superintendent/class_size/documents/ST
ARReport.pdf.

143
Curriculum Vitae
Patrick D. Linehan graduated from the United States Military Academy at West Pint,
New York, with a Bachelor of Science in 1977. He received his Masters of Science in
Contracting and Acquisition Management from Florida Tech in 1989. He served 21 years
of commissioned service in the United States Army, retiring in 1998 at the rank of
Lieutenant Colonel. During his career Colonel Linehan served in operational
assignments as an Armor officer and in Acquisition assignments, including a tour on the
Army Secretariat in the Pentagon. In 1996 Colonel Linehan was selected to serve as the
Product Manager for the Improved Army Tactical Missile System, a Major Defense
Acquisition Program. Upon his retirement from active duty in 1998, Colonel Linehan
provided consulting services to various federal departments through April 2012. At that
time Colonel Linehan accepted his current position as the Chief Operating Officer for the
Virginia Initiative for Science Teaching and Achievement in George Mason University’s
College of Education and Human Development.