factors influencing abundance of the american burying beetle at different geographic scales curtis...
TRANSCRIPT

Factors influencing abundance of the American burying beetle at
different geographic scales
Curtis CreightonPurdue University Calumet

Co-presentersRobert Basarache - Ouachita National Forest, United States
Forest Service, Idabel, OK 74745
Mark V. Lomolino - SUNY College of Environmental Science and Forestry, Syracuse, NY 13210
Mark Belk - Department of Integrative BiologyBrigham Young University, Provo, Utah846024
Gary D. Schnell - Sam Noble Oklahoma Museum of Natural History and Department of Zoology, University of Oklahoma, Norman, OK 73072
Ana E. Hiott - Sam Noble Oklahoma Museum of Natural History, University of Oklahoma, Norman, OK 73072

Body Size Implications

Body Size Implications
• Larger species tend to depend on larger prey• Larger species tend to occupy a greater diversity of habitats• Larger species tend to require larger home ranges

Factors affecting abundance at local scales:
Tiak District of Ouachita National Forest
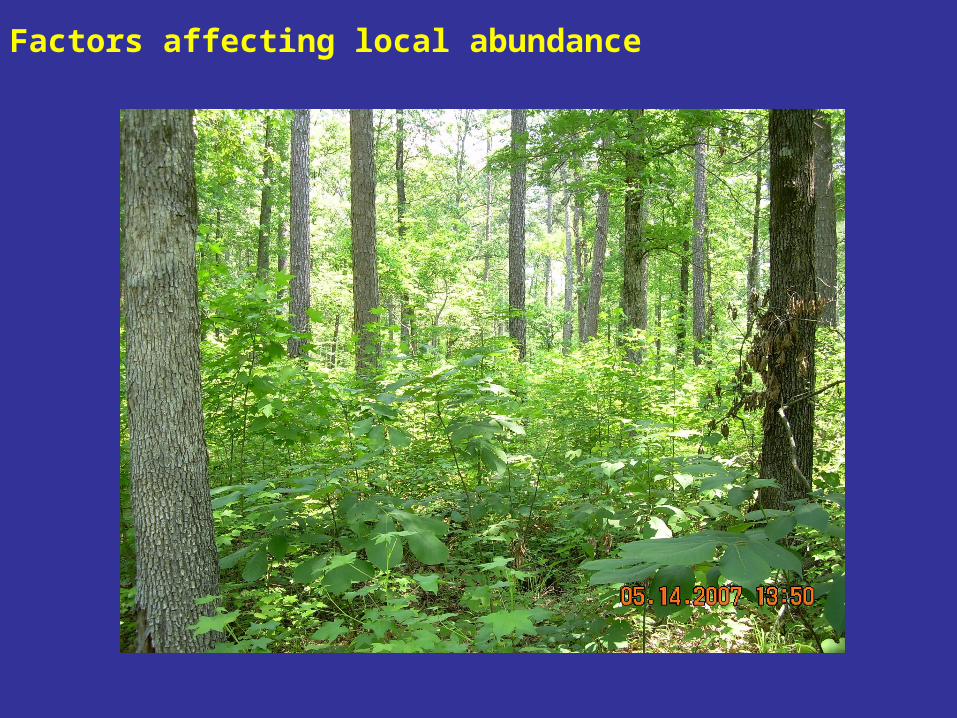
Factors affecting local abundance

Factors affecting local abundance
Tree density: 2.3 – 4.6 m2 / ha
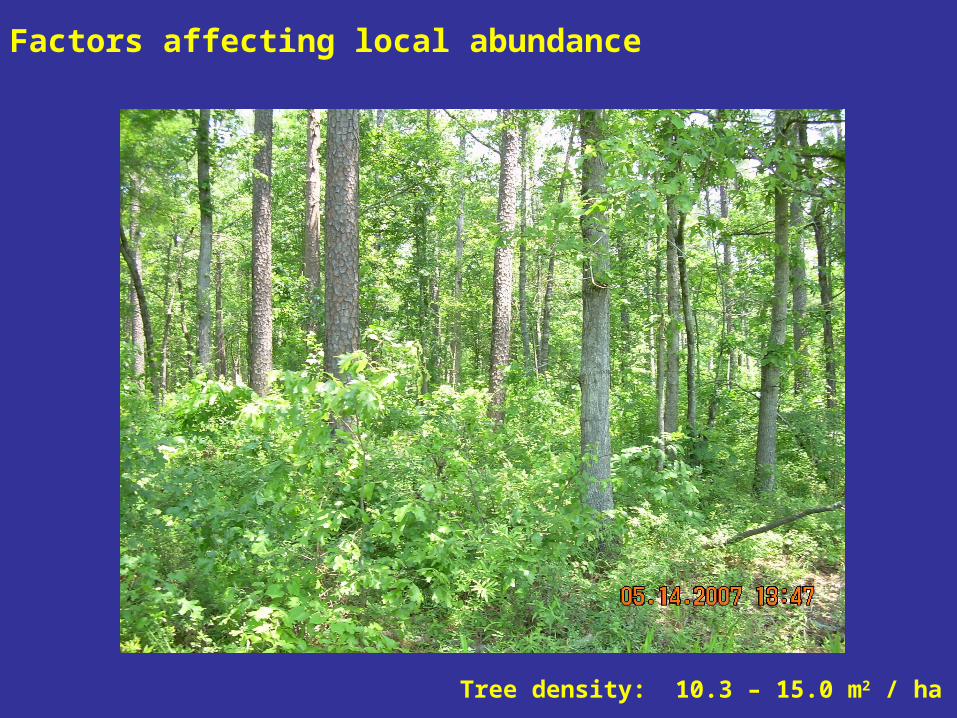
Factors affecting local abundance
Tree density: 10.3 – 15.0 m2 / ha

Factors affecting local abundance
0
0.2
0.4
0.6
0.8
1.0
1.2
1.4
1993 1994 1995 1996 1998
Year
Bee
tles
/Tra
p-n
igh
t Plot 2
Plot 3
Plot 1

Factors affecting local abundance
0
0.2
0.4
0.6
0.8
1
Seed-Cut Select 1 Select 2
Site
Bee
tles
/Tra
p*n
igh
t
Before
After
Randomization test p = 0.045

Factors affecting abundance at local scales:
Fort Chaffee

Factors affecting local abundance
S ites No L onger Surveyed N
0 1 32 4 5
K ilom eters
New boundary
1
6
8
12
13
15
17
18
21
22
23
2527
29
30
34
3638
39
42
43
44
45
46
47
49
50
54
55
57
58 64
6768
69
70
79
84
88
89
97
99
101
109
111
122
123
128
129
137
145
146
147
502503
504
505
506
507
508
509
510
511
512
513
514
515
516
517
518
519 520
521
A
B
C
D
E
F
G H I J K L
M
N
O
P
Q
R

Factors affecting local abundance
Sites no longer surveyed
Kilom eters
1 2 3 4 50
Im pact A rea
N ew Boundary
0 .000 to 0 .041 0 .041 to 0 .423 0 .423 to 0 .846 0 .846 to 1 .269 1 .269 to 1 .692 1 .692 to 2 .115 2 .115 to 2 .538 2 .538 to 2 .961

Factors affecting local abundance
12
N
0 1 32 4 5
K ilom eters
Im pact A rea
N ew boundary
0.00
0.20
0.40
0.60
0.80
1.00
1.20
1.40
1.60
1.80
2.00
2.20
2.40
2.60
2.80
Beetles/trap-n ight2003
3.00

Factors affecting local abundance
Distance (km) from centroid
0 2 4 6 8 10 12 14 16 18
De
nsi
ty in
de
x (b
ee
tles/
tra
p-n
igh
t)
0.0
0.2
0.4
0.6
0.8
1.0
1.2
1.4
1.6
1.8
2.0
2.2
2.4
2.6
2.8
3.0
r = -0.527 p < 0.01

Factors affecting local abundance
0 1 2 3 4 5
Den
sity
Inde
x (b
eetle
s/tr
ap-n
ight
)
0.0
0.2
0.4
0.6
0.8
1.0
1.2
1.4
1.6
1.8
2.0
2.2
2.4
2.6
2.8
3.0
3.2
Distance (km) from border
r = 0.521 p < 0.01

Year
1992 1993 1994 1995 1996 1997 1998 1999 2000 2001 2002 2003
Me
an d
ens
ity in
dex
(be
etle
s/tr
ap
-nig
ht)
0.0
0.1
0.2
0.3
0.4
0.5
Factors affecting local abundance

Factors affecting local abundance1998
0.0
0.2
0.4
0.6
0.8
1.0
1.2
1.4
1.6
1.8
2.0
2.2
2.4
2.6
2.8
3.0
Be e tle s/ tra p -nig ht
N
Kilom eters
0 1 2 3 4 5
Im pact A rea
Be e tle s/ tra p -nig ht
0.0
0.2
0.4
0.6
0.8
1.0
1.2
1.4
1.6
1.8
2.0
2.2
2.4
2.6
2.8
2000
3.0
N
Kilo m e te rs
0 2 3 4 5 6
Im pact Area
0.0
0.2
0.4
0.6
0.8
1.0
1.2
1.4
1.6
1.8
2.0
2.2
2.4
2.6
2.8
3.0
1999
N
Kilo m e te rs
0 2 3 4 5 6
Be e tle s/ tra p -nig ht
Im pact A rea
2001
0.0
0.2
0.4
0.6
0.8
1.0
1.2
1.4
1.6
1.8
2.0
2.2
2.4
2.6
2.8
Be e tle s/ tra p -nig ht
Kilo m e te rs
0 2 3 4 5 6
N
New boundary
3.0
Im pact Area
0 1 32 4 5
Kilom eters
N
0.0
0.2
0.4
0.6
0.8
1.0
1.2
1.4
1.6
1.8
2.0
2.2
2.4
2.6
2.8
3.0
2002
Beetles/trap-night
N ew boundary
Im pact A reaN
New boundary
0.0
0.2
0.4
0.6
0.8
1.0
1.2
1.4
1.6
1.8
2.0
2.2
2.4
2.6
2.8
Beetles/trap-night2003
3.0
0 1 32 4 5
K ilom eters
Im pact Area

Factors affecting abundance at regional scales:
Eastern Oklahoma

0
5000
10000
15000
20000
25000
0 0.5 1 1.5 2 2.5
Beetle density - N. orbicollis
Are
a si
ze (
ha)
r = -0.04
Factors affecting regional abundance

Factors affecting regional abundance
0
5000
10000
15000
20000
25000
0 0.05 0.1 0.15 0.2 0.25 0.3 0.35 0.4 0.45 0.5
Beetle density - N. americanus
Are
a si
ze (
ha)
r = 0.94

Hypotheses explaining the decline of the American burying beetle
1.Habitat loss and fragmentation (Anderson 1982)• artificial lighting• vertebrate competition• loss of carrion • congener competition
2.Extinction of the passenger pigeon3.Pathogen

Funding provided by:
United States Forest Service
Military Department of Arkansas
United States Fish and Wildlife Service and the Oklahoma Department of Wildlife Management