factors i nfluencing acceptance of a mobile system
TRANSCRIPT

Master thesis in I nformat ics
Factors I nfluencing Acceptance of a Mobile System A Case Study in the Pharm aceut ical I ndust ry Charlot ta Edberg & Sara Lennartsson Göteborg, Sweden 2004


REPORT NO. 2004:36
Factors Influencing Acceptance of a Mobile System
A Case Study in the Pharmaceutical Industry
Charlotta Edberg & Sara Lennartsson [email protected] & [email protected]
Tutor: Jens Bergqvist Examiner: Urban Nuldén
Department of Informatics IT UNIVERSITY OF GÖTEBORG
GÖTEBORG UNIVERSITY AND CHALMERS UNIVERSITY OF TECHNOLOGY Göteborg, Sweden 2004

Factors Influencing Acceptance of a Mobile System –
A Case Study in the Pharmaceutical Industry
Charlotta Edberg & Sara Lennartsson
© Charlotta Edberg & Sara Lennartsson, 2004.
Report no 2004:36
ISSN: 1651-4769
Department of Informatics
IT University of Göteborg
Göteborg University and Chalmers University of Technology
P O Box 8718
SE – 402 75 Göteborg
Sweden
Telephone + 46 (0)31-772 4895
Chalmers Repro
Göteborg, Sweden 2004
Factors Influencing Acceptance of a Mobile System –
A Case Study in the Pharmaceutical Industry
Charlotta Edberg & Sara Lennartsson
Department of Informatics
IT University of Göteborg
Göteborg University and Chalmers University of Technology
SUMMARY In this report we have addressed factors influencing acceptance of a mobile IT solution within a regulated business. We have examined the work situation of today, the attitudes among the employees towards the situation and the attitudes toward working with a mobile IT solution. We have further examined if the attitudes depend on different background variables. The study was conducted in two clinical supply units within a company in the pharmaceutical industry and was divided according to three logical levels; operating procedures, work practice and attitudes. Methods used were observations, interviews, examination of documentation and questionnaire. This was a descriptive study so design implications and software development are not within the scope of the report. The factors that appeared in the study were compared to Nah et al.’s proposed model for users’ adoption of mobile computing and we found connections to the following factors: Input and Output Devices, Navigation, Service Offerings, Degree of mobility, Compatibility, Reliability, Security, Characteristics of Mobile Vendor and Perceived Congruence of Skills and Challenges. Background variables that were statistically proved to affect the employees’ attitudes toward a mobile IT solution were: interest in technology, department, employment position and site. Keywords: acceptance, adoption, attitudes, factors, mobile system, pharmaceutical industry and regulated business.

Acknow ledgem ents
First we would like to thank our tutors Jens Bergqvist from Örebro University and the
Viktoria Institute and Fredrik Brander and Tobias Ivarsson from the company in question for their support and for
making this report possible.
We would also like to thank Kerstin Forsberg for her support and ideas regarding this thesis, Sten Edberg for checking the linguistic usage
and Anna-Karin Edberg for her help with the statistics.
We would like to thank the employees that let us observe them and all respondents that answered our questionnaire.
And, at last, we would like to thank Karin Roth
and Gunnar Hegge for their happy company and many laughters.

1
Table of Contents 1 INTRODUCTION.......................................................................................................... 3
1.1 PURPOSE..................................................................................................................... 4 1.1.1 Delimitations ...................................................................................................... 4
1.2 DISPOSITION ............................................................................................................... 4
2 THEORY......................................................................................................................... 6
2.1 ATTITUDES ................................................................................................................. 6 2.2 INFORMATION TECHNOLOGY ADOPTION .................................................................... 7 2.3 MOBILITY ................................................................................................................. 12
3 METHOD...................................................................................................................... 14
3.1 CASE STUDY............................................................................................................. 14 3.2 COLLECTION OF DATA.............................................................................................. 15 3.3 RELIABILITY AND VALIDITY..................................................................................... 17
3.3.1 Reliability ......................................................................................................... 17 3.3.2 Validity ............................................................................................................. 18
3.4 PART 1 – OPERATING PROCEDURES.......................................................................... 19 3.4.1 Sample .............................................................................................................. 19 3.4.2 Examination of Documents .............................................................................. 19
3.5 PART 2 – WORK PRACTICE ....................................................................................... 20 3.5.1 Sample .............................................................................................................. 20 3.5.2 Observations..................................................................................................... 20 3.5.3 Interviews ......................................................................................................... 22
3.6 PART 3 – ATTITUDES ................................................................................................ 23 3.6.1 Sample .............................................................................................................. 23 3.6.2 Questionnaire ................................................................................................... 23
4 CASE DESCRIPTION ................................................................................................ 26
4.1 PART 1 – OPERATING PROCEDURES.......................................................................... 26 4.1.1 Good Practice .................................................................................................. 26 4.1.2 Description of Clinical Supply Units ............................................................... 28 4.1.3 Clinical Supply Process ................................................................................... 29
4.2 PART 2 – WORK PRACTICE ....................................................................................... 32 4.3 PART 3 – ATTITUDES ................................................................................................ 34
4.3.1 Use of documentation....................................................................................... 34 4.3.2 Logbooks .......................................................................................................... 35 4.3.3 Stock management............................................................................................ 35 4.3.4 Controls in the work practice........................................................................... 36 4.3.5 The need of information ................................................................................... 37 4.3.6 Contamination.................................................................................................. 38 4.3.7 Possibilities of working with a mobile IT solution........................................... 38
5 ANALYSIS & RESULT .............................................................................................. 40
5.1 PART 1 – OPERATING PROCEDURES.......................................................................... 40 5.2 PART 2 – WORK PRACTICE ....................................................................................... 41

2
5.3 PART 3 – ATTITUDES ................................................................................................ 46 5.3.1 Factor Analysis ................................................................................................ 46 5.3.2 Cronbach’s Alpha ............................................................................................ 49 5.3.3 Statistical Significance ..................................................................................... 49 5.3.4 Analysis of the Text Result ............................................................................... 50 5.3.5 Result of the Questionnaire .............................................................................. 50 5.3.6 Result of the Text in the Questionnaire ............................................................ 54
6 DISCUSSION ............................................................................................................... 58
6.1 DISCUSSION OF RESULTS .......................................................................................... 58 6.2 REFLECTIONS ON THE STUDY.................................................................................... 63 6.3 CONCLUSION ............................................................................................................ 65 6.4 FUTURE WORK ......................................................................................................... 66
7 REFERENCES............................................................................................................. 67
APPENDIX A .................................................................................................................. 70
APPENDIX B................................................................................................................... 71
PART 1............................................................................................................................ 71 PART 2............................................................................................................................ 71 PART 3............................................................................................................................ 72 PART 4............................................................................................................................ 73

3
1 I nt roduct ion ”User acceptance is often the pivotal factor determining the success or failure of an information system project” (Davis, 1993) There have been considerable advances in hardware and software capabilities, but still there is a problem with under-utilised systems (Sichel, referred to in Davis & Venkatesh, 2000). Then, what affects the users’ acceptance and thereby willingness to use an information system? Davis developed the Technology Acceptance Model, TAM, especially to model user acceptance of information systems. Davis wanted to provide an explanation of general determinants of computer acceptance. According to this model the actual system use is determined by the user’ s intention to use the system. The intention is in turn determined by the user’ s attitudes toward using the system (Bagozzi et al., 1989). Attitude is defined as a summary evaluation of an object. Attitudes have several functions and one of the most essential of these is the knowledge function. The knowledge function means that attitudes help us identify good and bad and provides a structure for organizing an otherwise complex environment. Another important function is the utilitarian function. This means that when we have decided if an object is good or bad we can decide if we should approach the object or avoid it (Bohner & Wänke, 2002). TAM was developed for computer acceptance in general (Bagozzi et al., 1989) and has been tested in many situations (Nah et al., 2003). But is it valid for mobile computing? Mobile devices are very much different from desktop computers regarding form and input and output methods (Rodden et al., referred to in Nah et al., 2003). Nah et al. has developed TAM further and proposed a model for users’ adoption of mobile computing. The model is a hypothesis over which external factors may influence usage of a mobile information system (Nah et al., 2003). The factors in the model are used in this thesis to compare with the factors emerged in the study. In this thesis we are studying two departments within a unit supplying clinical study material, which from now on will be called clinical supply units. Clinical supply units produce, pack, analyse, control quality and distribute drugs for clinical studies. This kind of work is strictly regulated and everything that is done must be documented. Today, everything is documented on paper records. At present, one of the projects within the company has to do with coordination of the information systems used in clinical supply units to produce records. This has raised the question if the work practice, within clinical supply units, could be facilitated with a mobile information system. Mobile information systems are relatively new and not so much investigated by most companies. There is a lot to gain but also a lot to lose. Is it worthwhile implementing a mobile system and what does it take to be successful? Will it make the company activities more efficient or more difficult? There are examples on mobile IT solutions that instead of improving the situation made it more complicated. One example is when a mobile

4
system was developed for the foremen on a construction site. The thought was that the mobile system would make the foremen more active and involved in management but the result was that they had to participate more in documentation and bureaucratic activities (Heath & Luff, 1998). How can you avoid this when you implement a mobile IT solution? In this thesis we want to examine and investigate the users’ attitudes towards a mobile IT solution in a regulated business context. The users in a regulated business context have no possibilities to choose whether they want to use the system or not, they must use the system while they are working. We believe that it is of considerable significance to consider the users and their attitudes toward mobile IT solutions to gain an increased acceptance of the system. If the users have a positive attitude towards a mobile system and thus be favourable toward using the system, then there is a greater possibility that the system will be used more efficiently and the users will be able to learn and to use the functions of the system in full.
1 .1 Purpose The purpose of this study is to examine what factors influence acceptance of a mobile system in a regulated business. In order to get an idea about factors of influence, the working situation of today is studied and the attitudes among the employees towards the situation are examined. The attitudes toward working with a mobile IT solution are also examined. Further on, the attitudes are examined if they are depending on different background variables such as age, sex and interest in technology. We are going to study and answer the following questions:
Which factors influence acceptance of a mobile system within regulated business? Which background variables affect these factors?
1 .1 .1 Delim itat ions The study is conducted in two clinical supply units within a company in the pharmaceutical industry. The observations in the study are limited to one of the company sites in Sweden. The study will investigate acceptance of mobile IT solutions taking the prospective users’ attitudes as a starting point. A mobile IT solution means, in this thesis, that you work with a handheld device that is integrated with a stationary system. The study will further examine the attitudes and acceptance of mobile IT solutions within an organization, but without investigating and discussing organizational theories. Theories discussed in this thesis consider the attitudes, acceptance and adoption of mobile information systems. Since this is a descriptive study, design implications and software development is not within the scope of the thesis.
1 .2 Disposit ion This thesis is divided into seven chapters: introduction, theory, method, case description, analysis and result, discussion and references.

5
In the introduction, chapter one, we discuss the background of this thesis. We motivate the study and present the aim of the thesis. In chapter two, theory, related research and work relevant for the study are described. Concepts of interest for the study, such as attitude, adoption and mobility, are discussed. Methods used in the study are presented in chapter three. The research area is presented in three logical levels; operating procedures, work practices and attitudes. The thesis is divided into three parts according to the logical levels. Part 1 deals with operating procedures, part 2 deals with work practice and part 3 deals with attitudes. In chapter four, the case is described according to the different levels of the study. First the company, where the study was conducted, is described together with the regulation affecting the company and the structure of the departments handling clinical study material. Next, the work practice and the attitudes among the employees are described. In the analysis and result chapter, chapter five, the analysis methods used in the different parts of the study, are explained and the result of the study is presented. In chapter six, discussion, the different factors from the different parts of the study are presented and assembled. We also discuss the benefits and disadvantages with the chosen methods and propose future research according to what we have found in this study. At the end of the chapter, the research question is answered under the headline conclusion. In the reference chapter, books, articles, online resources and other information sources are listed. In appendix A you find explanations on different abbreviations used in the thesis. In appendix B you will find a copy of the statements and questions in the questionnaire which was used in the study.
6
2 Theory In this chapter, related research relevant for the study is discussed. Different theories regarding the concepts of attitude, information technology adoption and mobility, of interest to this study, are brought up and discussed.
2 .1 At t itudes The concept of attitude is used, for instance within social psychology, to define a person’ s lasting approach toward an object. The approach towards the object is built on experience and decides if the person is for or against the object (Nationalencyklopedin). Bohner and Wänke (2002) define attitude as the summary evaluation of an object. Attitudes have several functions and Bohner and Wänke have divided them into two main groups. The first group is about how attitudes help organize knowledge and how attitudes guide action. The second group deals with how attitudes meet higher psychological needs. The two functions belonging to the first group are the knowledge function and the utilitarian function. The knowledge function means that attitudes help you to divide objects in good or bad and organize your environment. The utilitarian function means that attitudes influence how you act towards an object. After you decided if the object is good or bad, you can decide if you should approach or avoid it (Ibid.). The symbolic function and the social identity function belong to the second group. The symbolic function means that some attitudes are important to a person’ s self-concept and by expressing these attitudes the person confirms his or her beliefs. Attitudes can also support a person’ s relationship to other people, the so called social identity function. This function means that attitudes help maintaining social relationships, for instance if you hold an attitude and it is viewed as favourable by a fellow being you might identify yourself with him or her (Ibid.). The relation between attitudes and behaviour is complex. A person’ s attitude toward an object can influence how that person acts towards that object. An attitude toward an object can also influence the attitude towards other objects. Besides, an attitude can influence other people’ s attitudes. Attitudes have also an effect on how you handle information about the object. There is a tendency to look for information that speaks in favour of your attitude. Bohner and Wänke summarize that attitudes is an important link between the social information in the environment and how we react on it (Ibid.). In the following chapter, theories regarding behaviour and adoption are presented and one recurrent factor in these theories is attitude.

7
2 .2 I nform at ion Technology Adopt ion When reviewing literature regarding what has been done in the areas acceptance and mobile devices, it appeared that the adoption theory area was the most suitable area to study since this area also deals with acceptance. In the literature we found four models that we thought were relevant to the study. To start with, a basic model within behavioural theory is introduced, followed by a model within the technology adoption area that is an extension of the first model. The two following models consider adoption from a mobile perspective and the last one of them is of special relevance to this study. Theory of Reasoned Action, TRA, is a model within social psychology concerned with “the determinants of consciously intended behaviours” . According to TRA a person’ s behaviour is determined by that person’ s intention to perform the behaviour. The intention is in turn determined by that person’ s attitude toward and subjective norm regarding the behaviour. The behavioural intention is defined as to what degree a person intends to perform a specific behaviour. A person’ s attitude is referred to that person’ s opinion, positive or negative, regarding performing the behaviour. Subject norm means “the person’ s perception that most people who are important to him think he should or should not perform the behaviour in question” (Fishbein & Ajzen, referred to in Bagozzi et al., 1989). Figure 1: Theory of Reasoned Action (Bagozzi et al., 1989, p. 984) TRA is the basis for several models, for instance Technology Acceptance Model, TAM. TAM was developed by Davis especially for user acceptance of information technology. With TAM Davis wanted to show general determinants for computer acceptance. According to TAM the two beliefs perceived usefulness and perceived ease of use are important for computer acceptance behaviours. Perceived usefulness is defined as “the prospective user’ s subjective probability that using a specific application system will increase his or her job performance within the organizational context.” And perceived ease of use means “the degree to which the prospective user expects the target system to be free of effort” (Bagozzi et al., 1989).
Beliefs and Evaluations
Normative beliefs and motivation to comply
Attitude toward behaviour, A
Subjective norm, SN
Behavioural intention, BI
Actual behaviour

8
Figure 2: Technology Acceptance Model (Bagozzi et al., 1989, p. 985) The usage of a computer is, according to TAM, determined by the behavioural intention. And the intention is determined by the attitude towards using the information system and the perceived usefulness. The attitude is in turn determined by perceived usefulness and perceived ease of use, that in turn are determined by external variables. External variables refer to, for example, system characteristics, system features, training and user support (Ibid.). Sarker and Wells (2003) propose a model within mobile communication and commerce. The model is founded on three different processes that the users are going through in an adoption of a mobile IT solution. The first process is the Input Process which is built on five different characteristics. The first is individual characteristics like age, culture and earlier technical experience. Number two is built on the characteristics of the communication and the task like the number of interacting participants, if immediate response is desired of the system, together with the amount of the user’ s communication. Characteristics number three involves what kind of mobility the users have and to what extent the user is mobile. Characteristics number four has the technique in mind and that includes the user interface as well as the capacity of the network. The last characteristic is the input processes in the context, which consider the surroundings as an important part for how the other characteristics react in for example social or economic contexts. The next process in Sarker and Wells’ model is the Use Process, in which there are two steps, Exploration and Experimentation and Assessment of Experience. The exploration and experimentation consider which medium has been chosen for the mobile communication, the frequency and the volume of the communication. At last you adjust the cognitive environment around the user to get the mobile technique to harmonize in the environment of the user. The second step in the use process, assessment of experience, means in what way the user uses the mobile device. There are three dimensions that estimate the experiences of the user; functionally, psychosocially and relationally. The last process in Sarker and Wells model is Output. This process can also be called the Adoption Outcome, i.e. to what extent it is on the users’ adoption of the mobile system. If the use process is positive to the user this will affect positively in the last output process.
External variables
Perceived usefulness (U)
Perceived ease of use (E)
Attitude towards using (A)
Behavioural intention to use (BI)
Actual system use
9
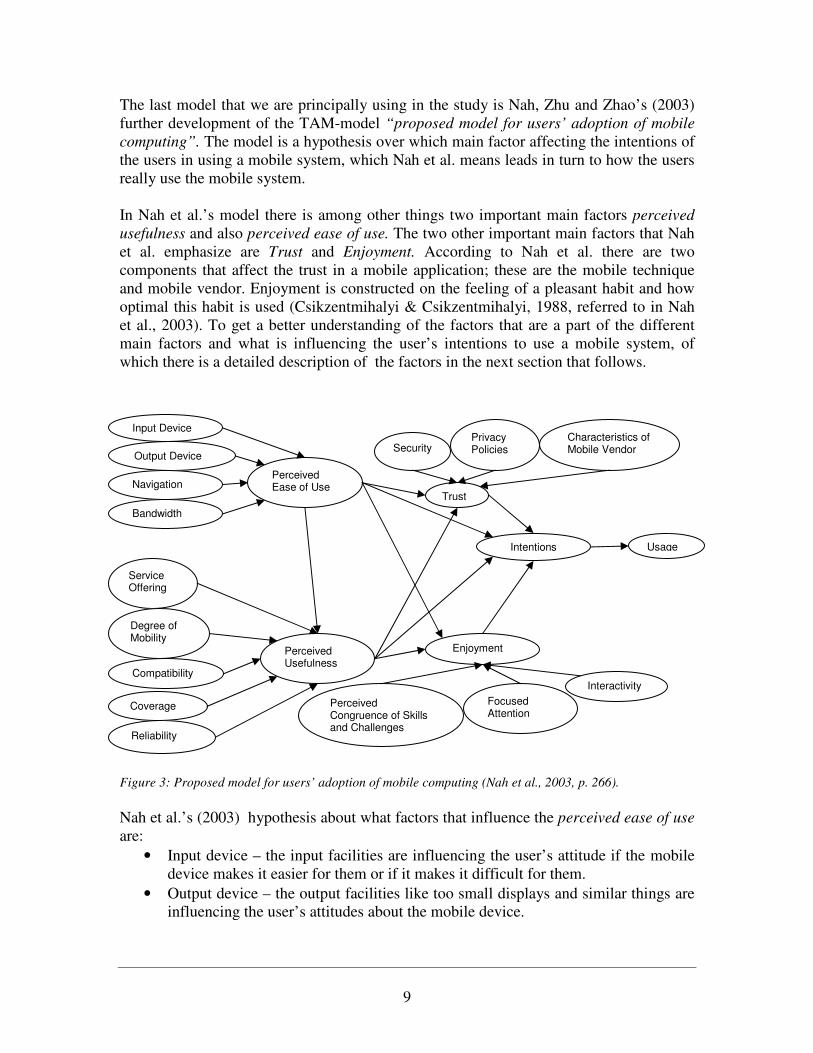
The last model that we are principally using in the study is Nah, Zhu and Zhao’ s (2003) further development of the TAM-model “proposed model for users’ adoption of mobile computing”. The model is a hypothesis over which main factor affecting the intentions of the users in using a mobile system, which Nah et al. means leads in turn to how the users really use the mobile system. In Nah et al.’ s model there is among other things two important main factors perceived usefulness and also perceived ease of use. The two other important main factors that Nah et al. emphasize are Trust and Enjoyment. According to Nah et al. there are two components that affect the trust in a mobile application; these are the mobile technique and mobile vendor. Enjoyment is constructed on the feeling of a pleasant habit and how optimal this habit is used (Csikzentmihalyi & Csikzentmihalyi, 1988, referred to in Nah et al., 2003). To get a better understanding of the factors that are a part of the different main factors and what is influencing the user’ s intentions to use a mobile system, of which there is a detailed description of the factors in the next section that follows. Figure 3: Proposed model for users’ adoption of mobile computing (Nah et al., 2003, p. 266). Nah et al.’ s (2003) hypothesis about what factors that influence the perceived ease of use are:
• Input device – the input facilities are influencing the user’ s attitude if the mobile device makes it easier for them or if it makes it difficult for them.
• Output device – the output facilities like too small displays and similar things are influencing the user’ s attitudes about the mobile device.
Input Device
Output Device
Navigation
Bandwidth
Perceived Ease of Use
Trust
Perceived Usefulness
Enjoyment
Service Offering
Degree of Mobility
Compatibility
Reliability
Perceived Congruence of Skills and Challenges
Focused Attention
Interactivity
Intentions
Security
Privacy Policies
Characteristics of Mobile Vendor
Coverage
Usage

10
• Navigation – How the users find the information they need in the shortest possible time at the mobile device.
• Bandwidth – The bandwidth is affecting if multimedia can be used on the mobile device or not.
Factors influencing users to perceived usefulness according to Nah et al. are:
• Service offerings – The quality and the offerings of services accessible and how well these services support the user’ s needs and requirements.
• Degree of mobility – Nah et al.’ s hypothesis are that the more mobile a user is, the more important mobile use is to the user.
• Compatibility – The mobile device must work well with the user’ s already existing computing environment like for example the possibility to synchronize the mobile device to the user’ s stationary computer.
• Coverage – The larger area the mobile device covers, the larger the access possibilities you have and in this way the mobile device has a larger usability to the user.
• Reliability – Stable and uninterrupted access is necessary if the user is going to be able to access the mobile device anytime, anywhere. A mobile device which is not meeting these requirements will probably not be especially useful to the user according to Nah et al.
Nah et al. are founding their theories about which factors that influences trust and they are as follows:
• Security – This factor is necessary to reach trust. The higher level of security, the more security supported on the mobile devices, the higher degree of trust.
• Privacy policies – This factor is important to gain the confidence of the users. The higher level of privacy policy, the higher is the possibility to gain the trust of the users.
• Characteristics of mobile vendors – familiarity, reputation and integrity of mobile vendors are three important characteristics that influence trust. The higher these three characteristics are, the higher the level of trust exhibited by the users.
• Perceived ease of use – Nah et al.’ s hypothesis is if the mobile system is user friendly and easy to use this will influence the user’ s trust for the mobile system.
• Perceived usefulness – Nah et al. hypothesis is if the mobile system has a high perceived usefulness this factor will also impact user’ s trust of the mobile system.
The last main factor that is influencing the intentions by the users to adopt a mobile IT solution according to Nah et al. is enjoyment. The other factors in the enjoyment factor are:
• Perceived congruence of skills and challenges – if an enjoyment flow will occur, the user must think that the challenges of using the system is correspond with his or her skills in the mobile system. If the mobile system is too difficult in using in relation to the user’ s skills, then the user will probably not like using the system.
• Focused attention – If the mobile system is easy and creates fun to use, the system will have more focused attention from the user, this increases the enjoyment which occurs in the interaction with the mobile system.

11
• Interactivity – The immediate feedback the user gets from using the mobile system can affect the enjoyment level of the system.
• Perceived ease of use – This factor Nah et al. assume influences how the user experiences the enjoyment factor in the mobile system.
• Perceived usefulness – Just like perceived ease of use Nah et al assume that perceived usefulness is influencing how the user experiences the enjoyment factor in the mobile system.
These are, as mentioned above, the four main factors that lead to the users’ intentions to use the mobile system. The intentions to use the mobile system, lead up to how much the user really uses the system. The model investigated above (Nah et al., 2003) has not yet been tested and verified through the gathering of empirical data, i.e. after the book it was published in was printed. Although, we think this model is relevant for estimating users’ adoption of a mobile IT solution. We wanted to test and verify if the model was applicable in a working environment within clinical supply units.

12
2 .3 Mobility The concept of mobility isn’ t easy to define the word mobility in the information technology context. Kristoffersen and Ljungberg (1999) consider that it is hard to define the word mobility in a meaningful way:
Mobility is one of those words that are virtually impossible to define in a meaningful way. You either come up with a definition that excludes obvious instances, or your definition is to too vague; it fails to shed light on important aspects (Kristoffersen & Ljungberg, 1999).
Heath and Luff (1998) describe three dimensions of mobility which they have reached a conclusion about in different studies. The explanations of these dimensions were applicable at the clinical supply units. The dimensions that Heath and Luff describe are micro mobility, local mobility and remote mobility. Micro mobility is defined as ” the way in which artefacts can by mobilized and manipulated for various purposes around a relatively circumscribed, or ‘at hand’ , domain” (Ibid.). Heath and Luff were examining a team of doctors, where they observed that the documentation with paper was critical in their work, both regarding to the cooperation and to the communication between the doctors. In the work at the clinical supply units, the documentation is a shared artefact between different parts, and hereby supports both communication and cooperation. Input and output factors, according to Nah et al.’ s (2003) model, affect how well a mobile device can support cooperation and communication between colleagues in a working environment. To get an understanding about the micro mobility dimension in the study, this dimension was studied during the observations. We considered the micro mobile dimension was of importance since the way of working with the documents can affect the attitudes of the employees towards working with a mobile artefact within the manufacturing and packing processes. Local mobility is defined by Heath and Luff (1998) as mobility that is established within a defined area, for example between different rooms, floors or buildings. An example of local mobility is when an employee is seated by his computer and prints a document on the printer which is placed a bit further down the corridor. When he walks to the printer to fetch the document he moves back and forward in the corridor. Bellotti and Bly (1996) reveal two factors that bring the local mobility forward. The first factor is when employees share common resources and the other factor is when the employees need to communicate. According to Nah et al. (2003) the degree of mobility is an important factor influencing the perceived usefulness of the mobile system. The degree of this dimension was examined during the observations in the study. We considered the local mobility dimension important since the way of working in the manufacturing and packing areas can affect which attitude the employees have towards working with a mobile device. Heath and Luff’ s (1998) last dimension of mobility is Remote mobility and it is about two actors that are situated in two different places, and they are interacting with another

13
through some kind of technology. An example of remote mobility is when a field salesman needs to communicate with his boss and calls him on his cellular phone. A remote mobility isn’ t present in the packing and manufacturing processes at the studied departments and because of this the remote mobility dimension was of less importance in the study than the other two dimensions.

14
3 Method In this chapter we discuss our choice of methods when performing the study. The chosen methods are described how they were used and why they were chosen. We also review the validity and reliability of the concept, since we believe it is important to understand these concepts in relation to the collected and analyzed data. The study is divided into three parts according to three logical levels; operating procedures, work practice and attitudes.
3 .1 Case Study The study is concentrated to examining one example of organisation, one case, where the questions of issue are of interest. A case is, according to Bell (1995), the interaction between different factors in a specific situation. Case study: ” Investigation of specific area; a person, an organisation or an environment” (Repstad, 1999) Case study is a concept used in many situations and within many different disciplines. This results in a dissonance regarding what a case study is. The concept is also used as a synonym to, among others, fieldwork, ethnography and observations, which contributes further to the confusion (Merriam, 1994). A case study is, according to Merriam (Ibid.), a non-experimental, descriptive method with the goal to describe and explain a phenomenon. Non-experimental means that you cannot manipulate the variables in the phenomenon, instead you study and describe it as it is. The strength of a case study is that it can handle many different types of material, for instance documents, interviews and observations. There are no definite methods when performing a case study, every method for gathering of scientific information can be used. It is the perspective, qualitative or quantitative, that decides what methods and techniques are suitable when gathering and analyzing the information needed (Ibid.). Bell means that, even if observations and interviews are the most common methods when performing a case study, other methods are not excluded. You should instead choose those methods best for the task at hand (Bell, 1995). Merriam also states that even if a great part of the literature regarding qualitative research mentions case studies this does not mean that case studies are solely qualitative. Case studies can instead be said to “ get its logic from the basic approach of the qualitative methods” (Merriam, 1994). However, you have to be aware that you can’ t without questioning draw general conclusions from only one study of one case (Repstad, 1999). One of the main arguments against using case study is the difficulty to draw scientific conclusions from just one case. But Yin means that you can use case study to expand and generalize theories, so called analytic generalization (Yin, 1994).

15
3 .2 Collect ion of Data Holme and Solvang (1997) mean that we are facing a complex reality when you’ re about to study and describe society. They also mean that it would be strange if you could catch and describe this complex reality just through one method. Quantitative procedures aren’ t the only ones that count just because they are able to compute statistical results. The social relationships aren’ t unimportant just because they can’ t compute and express results in figures (Holme & Solvang, 1997). Repstad (1999) refers to a sociologist, Fredrik Engelstad (1985), who says that the qualitative methods are used to describe a phenomenon while the quantitative methods are used to compute the same phenomenon, but both ways presuppose each other in combination. The triangulation of methods is a combination of methods when you study the same phenomenon from different angels. A combination of different methods in a study, gives you a wide foundation of data that will contribute to a reliable interpretation and analysis of the data that the study is based on (Ibid.). The reason that a method of triangulation was chosen in this study was to get a better understanding of the problem area that was to be studied and illustrated from different angels. The formulation of the problem that has to been done in a study decides what method you will choose when you’ ll collect the data. Holme and Solvang (1997) consider that it is natural with a combination of quantitative and qualitative methods to capture strength and neutralize weak sides in each method. The strength in quantitative methods is that they can explain different phenomena and that you can generalize the result through statistical techniques. They are wide in their selection and they can also represent other units that haven’ t been a part of the conducted study. The different analysis techniques can inform how exact the data is that has been collected. The weakness in the quantitative methods is the flexibility, since you can’ t change anything through the implementation of the study. The strength of the qualitative analysis is characterized by the flexibility and that they are showing the total situation of the context. The scientists have some guiding principles and fixed points, and the further the research is conducted the more the organization and planning evolve. The characteristics of the qualitative methods are to give a complete picture of a few chosen units. The weaknesses of the qualitative methods are characterized by a low degree of generalization and standardization. The chosen techniques in the study were literature studies, a visit at the studied site, observations, interviews and a questionnaire. To get an understanding of what had been done in this area before we examined the literature (Merriam, 1994). The purpose of the visit at the studied site was to increase the understanding for the working processes and to focus at the important areas that were to be studied (Eriksson & Wiedersheim-Paul, 1991). The purpose of conducting the observations at two departments was to gain a wider understanding of the problem area (Hughes et al., 1994). Since the study was carried through at one site in Sweden there is a problem regarding the generalization and to apply the result at other similar sites that haven’ t been studied environmentally (Repstad, 1999). To complement the observations we carried through two interviews. At the interviews there were opportunities to ask complementary questions to the operator that was studied during the observations. The interview questions were adjusted to each
16
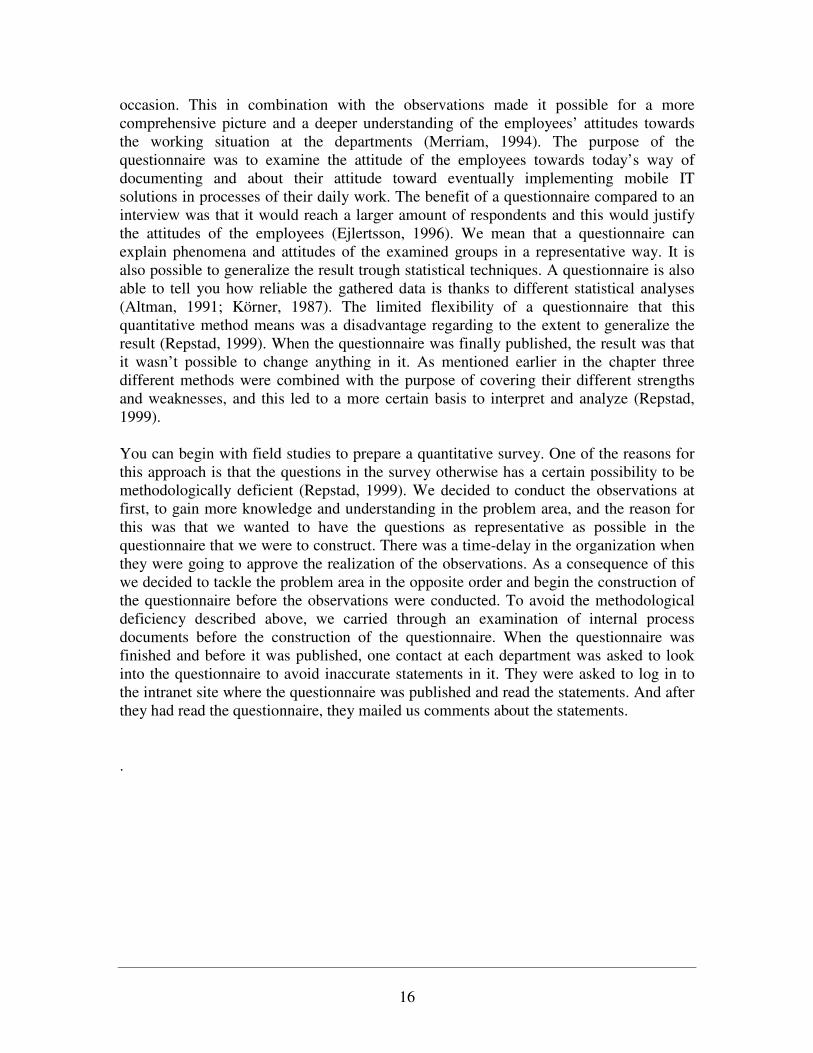
occasion. This in combination with the observations made it possible for a more comprehensive picture and a deeper understanding of the employees’ attitudes towards the working situation at the departments (Merriam, 1994). The purpose of the questionnaire was to examine the attitude of the employees towards today’ s way of documenting and about their attitude toward eventually implementing mobile IT solutions in processes of their daily work. The benefit of a questionnaire compared to an interview was that it would reach a larger amount of respondents and this would justify the attitudes of the employees (Ejlertsson, 1996). We mean that a questionnaire can explain phenomena and attitudes of the examined groups in a representative way. It is also possible to generalize the result trough statistical techniques. A questionnaire is also able to tell you how reliable the gathered data is thanks to different statistical analyses (Altman, 1991; Körner, 1987). The limited flexibility of a questionnaire that this quantitative method means was a disadvantage regarding to the extent to generalize the result (Repstad, 1999). When the questionnaire was finally published, the result was that it wasn’ t possible to change anything in it. As mentioned earlier in the chapter three different methods were combined with the purpose of covering their different strengths and weaknesses, and this led to a more certain basis to interpret and analyze (Repstad, 1999). You can begin with field studies to prepare a quantitative survey. One of the reasons for this approach is that the questions in the survey otherwise has a certain possibility to be methodologically deficient (Repstad, 1999). We decided to conduct the observations at first, to gain more knowledge and understanding in the problem area, and the reason for this was that we wanted to have the questions as representative as possible in the questionnaire that we were to construct. There was a time-delay in the organization when they were going to approve the realization of the observations. As a consequence of this we decided to tackle the problem area in the opposite order and begin the construction of the questionnaire before the observations were conducted. To avoid the methodological deficiency described above, we carried through an examination of internal process documents before the construction of the questionnaire. When the questionnaire was finished and before it was published, one contact at each department was asked to look into the questionnaire to avoid inaccurate statements in it. They were asked to log in to the intranet site where the questionnaire was published and read the statements. And after they had read the questionnaire, they mailed us comments about the statements. .
17
3 .3 Reliability and Validity Davidsson and Patel (1991) are gathering the validity and reliability of the concepts as follows:
Partly we need to know that we are examining what we intend to examine, i.e. we need to know that we have a good validity. Partly we need to know that we do this in a reliable way, i.e. we need to know that we have a good reliability (p. 84)
3 .3 .1 Reliability To be able to talk about a high reliability the situation should have a high standardisation in all respects according to Trost (2001). Trost means that when you refer to a study with a good reliability you assume there has been conducted a quantitative study where you have measured a result. Trost means that it is different when you try to understand the qualitative side of a qualitative method, which often has a low extent of standardization. Reliability is a problematic conception within the qualitative methods, since the human behaviour is changeable and not static. While the course of action within a case study develops as time passes, the reliability concept can’ t be used in a meaningful way. A recurrence of a qualitative research will not give the same result but the results are meaningful until they are proved to be wrong by updated information (Merriam, 1994). Instead of using the concept of reliability you could use “ extent of dependence” or “ context” regarding results from the information (Lincoln and Guba, 1994, referred to in Merriam, 1994). The triangulation of methods is an excellent technique to obtain this dependence due to Goetz and LeCompte (referred to in Merriam, 1994). Eriksson and Wiedersheim-Paul (1991) consider that the idea of attitude is a theoretical conception that is measurable when you have made it measurable. To be able to measure a theoretical conception you have to carry out the conception, transferring theoretical ideas in a way of concepts and models into empirical observations like measurable scales. When this transformation has been made, you can empirically test an attitude. Eriksson and Wiedersheim-Paul also mean that any kind of operation when it comes to theoretical conceptions is an inconvenient problem. To get reliable results of the transferred values, it is important to the scientist to understand the problem area and which factors that have an influence on the theoretical conceptions. At the same time it is important that the tools used to measure the results are suitable or else there could be an incorrect picture of the theoretical conceptions. In the beginning of the study, visits to the departments and examinations of standard operating procedures and quality manuals, served as methods to get the knowledge about the problem area and what problems were important to be focused on to measure. The attitudes of the employees, which are an aspect of quality, were measured in an attitude questionnaire through a Likert-scale. According to Trost (2001) you should have a high reliability when you are using fixed alternative, this means that there are a high extent of structure and standardization of the answers. When data was put together from the questionnaire, different statistical methods were used to guarantee the reliability, which can be concluded from the analysis.
18
To have a high extent of reliability of the result from the study, triangulation from the three methods questionnaire, observations and interviews were used.
3 .3 .2 Validity In quantitative methods you measure the validity through the extent of the possibilities to generalize the results from the conducted study. Regarding the qualitative methods it is up to the reader of the study to generalize and decide what is applicable in his or her situation (Merriam, 1994). There are two important aspects to stress when it comes to validity according to Eriksson and Wiedersheim-Paul (1991), referring to inner and outer validity. Inner validity means that you measure the right object. To guarantee inner validity in the questionnaire, the respondent was asked what department he or she worked at. The aim of the question was to guarantee that only employees from the concerned departments in the study were included. In the observations and in the interviews employees were studied and interviewed from the concerned departments, which mean that correct objects were interviewed and studied. The outer validity describes if the results are in accordance with reality, in other words, it is how general the results are (Eriksson & Wiedersheim-Paul, 1991). We have tried to improve the possibilities to generalize from the study in giving the reader a thorough description of the context and in which situation the study was conducted (Merriam, 1994), and through this increase the outer validity of the qualitative results. At the same time we tried to increase the validity through a thorough description of our methods of research. The result of the questionnaire was analyzed with statistical methods, a quantitative approach. At the same time the results from the observations and interviews were analyzed qualitatively. This triangulation of methods made it possible to examine the problem area from three different angles, which also should increase the inner validity of the study. This means that the possibility that we have measured the right artefact within the problem area should increase. The validity in the study should also be determined by the reader all along if the result is applicable in his environment (Merriam, 1994).

19
3 .4 Part 1 – Operat ing Procedures In this section, the sample and method to examine the operating procedures of the case are described. Operating procedures mean the underlying processes that state how the work should be done.
3 .4 .1 Sam ple At the beginning of the study, a walk round the concerned departments was carried out. This gave a first introduction to how they work and an example of work documentation was shown. Then, documents describing and regulating the work were studied. For example, documents describing processes, education material intended for the employees of the company and some Standard Operation Procedures, SOP. A SOP is a document describing how the pharmaceutical work should be done.
3 .4 .2 Exam inat ion of Docum ents Documents have traditionally been defined as written information. But due to the technological development this definition has come to include, for example, movies and recordings (Davidsson & Patel, 1991). In this respect, the definition of Riley and Sellitz, of documents as all information about a subject that exists before the research is started, is suitable (referred to in Merriam, 1994). By examining documents you can establish actual conditions and processes (Davidsson & Patel, 1991), which has been the purpose of this part of the study. It is important to evaluate a document by considering how it originated (Ibid.). Documents used to study the operating procedures have been produced and published within the company. It has been clearly stated who the producer of the document is, what the document is applied for and which version it is. Some documents have been produced by the department with the responsibility to secure that the processes follow the regulations. We have therefore evaluated the documents as valid.

20
3 .5 Part 2 – W ork Pract ice In this section, the sample and method to investigate the work practice of the case are described. Work practice means how they actually work in the two departments studied.
3 .5 .1 Sam ple The observations were carried out on fifteen occasions and one team was followed at each department. The observations of the packaging department continued for a week and those of the manufacturing department for two weeks. In all, approximately fifteen hours were spent at each department. Then, one interview with two people from the packaging department and one interview with one person from the manufacturing department were conducted. The interview at the manufacturing department took almost one hour whereas the interview at the packaging department took approximately two hours and a half, due to the need for explanations since the packaging processes observed were so complex.
3 .5 .2 Observat ions Observation is one example of an ethnographical method. The Swedish National Encyclopaedia defines ethnography as the collection and processing of research material in order to analyze social and cultural structures and processes (Nationalencyklopedin). Ethnography is of late used more and more within system design. Hughes, King and Rodden (1994) thinks this is due to two understandings:
• One possible reason why so many systems fail is that the design doesn’ t consider the social context of work
• The growing use of networked and distributed computing has changed the structure of work and new methods to analyse the social character of work and its activities are required. Traditional methods have been more focused on gathering information that the designers need to know instead of gathering information about crucial aspects of the work.
Ethnography is appropriate when you want to understand the actual activity, environment and relation between ongoing activities and new technology (Bly, 1997). The advantage with ethnography is the ability to make the social aspect of a setting visible. This results in a better understanding how those involved in the setting perceive it (Hughes et al., 1994). Other examples of ethnographical methods, besides observations, are interviews, biographies, diaries and text analyses (Merriam, 1994). Hughes et al. (1994) have identified different uses of ethnography in system design, of which one being the quick and dirty approach. A quick and dirty study means that in a relatively short study you get general information that contributes to an understanding of the setting studied. Thus, in a relatively short time you can gain valuable knowledge of the social organization of work. The information you get from a quick and dirty study is neither complete nor fully detailed. Instead, you aim to make the aspects of the work setting, which are important for the design, clear. A quick and dirty study can be used to

21
provide the designers with a better understanding for the setting and the work activities. That the study is short means that it is short relative to the size of the task. We thought it was appropriate to use the quick and dirty approach, since the study were limited to a short period of time. The observations were conducted at two different departments and since their work activities differ considerably, the observations were consequently conducted in somewhat different ways. At the manufacturing department we had to stand outside the room and observe through the window, because they openly handled active substances. At the packaging department on the other hand we could stand in the room and observe more closely. An observation means to study people in their natural environment. It gives the observer first hand information about social collaboration and social processes about which interviews and analyses of text often only give second hand information (Repstad, 1999). Observations are suitable when you want to study people and see what they actually do. Nisbet and Watt (referred to in Bell, 1995) mean that even if interviews can contribute with important information, they only reflect what the subject of the interview thinks happened and not what actually happened. Weilenmann (2003) states four possible approaches when observing mobility. You can choose between following the actors, following the technology, studying a place or studying a virtual communication space. Following the actors means to follow them and study where they go and what they do. To follow the technology means to follow the technology around and see how it is used. Examples of mobile technologies are, among other things, cellular phones and PDA’ s, but also papers and pens. To study a place means to study a place where people on the move spend time or pass through, for instance a railway station, and study the mobility. Another place where people are mobile is in cyberspace, where by connecting to the internet you can interact with other parts in the world. A virtual communication space is a place in cyberspace where you can communicate with others around the world. To study this communication space means to follow what is being said and how those involved act. Since a mobile IT solution could possibly replace the paper documents used, we concentrated on studying them. We wanted to know how they work with the documents today. The choice of observation as method is due to the fact that we wanted to see what they actually do with the documents and not what they say they do. When observing you can choose between being open or concealed about the item that you are observing. You can also choose between being active or passive when you observe (Repstad, 1999). The observations were carried out in a closed environment, which means that not just anybody can enter without permission. This resulted in us being open about why we were there. Since we wanted to study the employees in their natural situations, we remained passive and did not participate in what we saw. We wanted to affect the people observed as little as possible to prevent their normal behaviour from changing, so called research effect, something that can give a false image of the reality. The research effect means when the observed object does not behave naturally but instead behave tactically and arrange their behaviour since they know they

22
are being watched (Repstad, 1999). To eliminate the risk for the observed to feel watched, only one of us was present during the observations. There are some aspects of observations one needs to be aware of. First, every note of data and information is at the same time an interpretation of what you see. And when you analyse the notes and draw conclusions from the observations, it is done according to your own opinion (Repstad, 1999). Second, how can we know that the behaviours observed are representative for others than the people observed (Bell, 1995; Davidsson & Patel, 1991)? This is something you have to be aware of and consider when analyzing and producing results.
3 .5 .3 I nterview s The purpose of the interviews was to elucidate and explain the different processes that were studied during the observations. The sample of interview respondents, were based on the condition to interview the operators studied. This was based on the thought of having the operators supplementing and explaining their work practice. According to Repstad (1999) this is the flexibility of the method to be able to change the pattern of the interview during the proceedings of the project. A qualitative interview is like an ordinary conversation in an ordinary situation. The respondent of the interview influences the development of the conversation and the scientist practices a little managing of the conversation (Holme & Solvang, 1997). The qualitative interview is a demanding way of gathering information and it has its limitations considering how many respondents you can interview. The material that the interviews generate can be quite hard to analyze. The qualitative interview has one advantage, and that is the flexibility of the technique. If you miss information you can always go back to the respondent and make an additional interview (Ibid.). Davidsson and Patel (1991) mean that there are two different aspects to consider when gathering information. Partly how well standardized and structured the questions are. Davidsson and Patel also mean that you should have a low structuring and standardization when you would like to make a qualitative analysis of the results from the interview. The form of the interview used in the study was half structured (Kvale, 1997) with a low standardization (Davidsson & Patel, 1991). We mean that this form of interview fits well since we wanted to talk about several different areas of concerns of the departments and at the same time we wanted to give the respondent free space to answer. The questions in the interview were used as a draft to the interviewer; there were included suggestions of relevant questions. The interviewer chose which questions were to be asked and the order of the questions, and the interviewer also had the possibility to follow up the questions and stories told by the respondent. The respondent had the possibility to answer the questions and add more information if he or she thought this was necessary to understand or make some situations clearer (Kvale, 1997). At the interview there were an interviewer and an assistant interviewer helping with complementary questions.

23
3 .6 Part 3 – At t itudes In the following section of the thesis, we describe the sample and methods conducted in part three of the study. At the end of the section we describe the design of the questionnaire used in the survey of the study.
3 .6 .1 Sam ple The survey was addressed to employees at the clinical study departments within the Swedish sites of the company where the study was conducted. Totally the sample was limited by 135 e-mail requests to employees working at two sites in Sweden. Since the third site belongs organizationally to one of the English sites we didn’ t include this one in the study. In spite of this seven respondents answered our questionnaire from the site that wasn’ t included, since they have access to the intranet site where the questionnaire was published. Their answers to the statements were included in the analysis since the respondents are working at the same departments as the departments included in the study. We motivate this by saying that they have the same kind of regulations when they are performing their work and they are also performing the same kind of work practice. The total amount of answers in the questionnaire was seventy-six. The English speaking sites of the company were not examined in this study.
3 .6 .2 Quest ionnaire To have an understanding of the attitude of the employees to the working situation today and the attitude towards working with mobile computerized devices, we decided to design an attitude questionnaire. The purpose of the questionnaire was to measure attitude, which is a qualitative aspect, with a quantitative measure. According to Davidsson and Patel (1991) an attitude, in the scientific context, is an individual basical valuation. Attitude is a stronger expression than it would be if the individual ´would just think something. Thinking can be defined as the individual having a point of view or what this one thinks or considers. This in turn can be measured in a questionnaire form or an interview. If you want to measure an attitude of an individual you should do this by creating an attitude scale. In an attitude scale you grade statements from one to five points (Davidsson & Patel, 1991), where the internal answering reduction is set to zero (Trost, 2001). According to Trost you can distinguish between two ways of asking attitude questions. In the first case the respondent will have to decide the different statements by agreeing or disagreeing with them. In this way you can see if he or she agrees or disagrees. The other way according to Trost is to ask questions that the respondent will have to answer yes or no to. The questionnaire was designed according to the Likert-scale, where the respondent will have to agree or disagree from the statements in a five pointed scale which is described above (Davidsson & Patel, 1991). The decision about an attitude questionnaire was based on the number of the samples. We wanted it to reach as many employees as possible at the clinical supply units and in this way have a more correct picture of the attitudes. The advantage of a questionnaire was that it is possible to reach a wider sample by using this than perform an interview research that a smaller sample of respondents can give. A smaller sample can lead to an incorrect picture of the attitudes (Ejlertsson, 1996).

24
Another advantage with the questionnaire is that it has a high degree of standardization. The questions were the same to all respondents and you eliminate the so called interview effect by not letting the interviewer influence the respondents by asking the questions differently or accentuate the questions differently. The higher degree of standardization in the questions, the more reliable answers the respondents will give you. The risk of misunderstandings and the internal answering reduction is a bit higher in a questionnaire than in an interview (Ejlertsson, 1996). To eliminate the large internal answering reduction, and the fact that we wanted to reach as many employees as possible, one contact in each department was asked if they were willing to mail an inquiry to their colleagues with an invitation to answer the questionnaire published at the intranet of the company. By this course of action we tried to achieve a high frequency of answers. By using the procedure of letting a contact mail an inquiry, we wanted the employees to feel that it was a colleague that was recommending the study and not representatives or informants to the management of the company (Repstad, 1999). As Davidsson and Patel (1991) indicate, it is important to make it clear that the individual is making an important role in carrying through an innovation, since it was of importance to have all the attitudes of the employees, it was emphasized in the dispatched mail, that people less positive to mobile it-support in the departments should also give their answers to the questionnaire. Thanks to the contacts at each department, going through the questionnaire and giving us their comments and their point of views, we got a response that showed if the statements could be misunderstood or if they where incorrect. The cause of this action, before the questionnaire was published at the intranet of the company, was that the design of the questionnaire and its statements were of great importance. The reason for this was to have the respondent to take the questionnaire seriously and to make him or her answer each statement thoughtfully and as carefully as possible (Ejlertsson, 1996). The questionnaire consisted of four sections. Section one dealt with the work practice of today, section two dealt with the attitudes of the employees towards working with mobile devices and section three was about background variables that eventually could have an effect on the attitudes of the employees, section four dealt with demographical questions. The experience of mobile devices was placed second last due to the effect we thought this would have on the respondents; we didn’ t want them to think too much in mobile terms when they answered the statements concerning computerized facilities.

25
Figure 4: Structure of the questionnaire.
Parts in the questionnaire Reason About the working situation today with the paper documentation.
How are the opinions of the employees regarding how the work is done today?
About the possibilities of working with mobile devices.
The attitude of the employees towards working with mobile devices.
About the experience of mobile devices. To find out about the technical experience of the employees from among other things PDA’ s and cellular phones.
Demographical questions (Sex, Age, Years of employment, Position, Department and Site)
To find out the background variables, like age, years of employment, department, site, and sex, which we think affect the attitudes.

26
4 Case descript ion In the following chapter, the case is described according to the three different levels of the study. First the company, where the study was conducted, is described together with the regulation affecting the company and the structure of the departments handling clinical study material. Next, the work practice and the attitudes among the employees are described.
4 .1 Part 1 – Operat ing Procedures The study was conducted at departments within a clinical supply unit in the pharmaceutical industry. Within a clinical supply unit you produce, pack, analyze, distribute and assure quality of drugs for clinical studies. A clinical study is when you test drugs on humans in order to investigate the effects and identify possible side effects (Läkemedelsverket). The company is part of an organization represented globally. The number of employees in the organization amounts to about 60 000. Totally, about 13 000 work at the company sites in Sweden and about 2 500 of these work at the site where the study took place. The company is one of five leading companies within its domain and has several well known drugs in its product portfolio. One of the top priorities of the company is to secure the flow of new products, hence the large investment in research. In the year 2002 the company sold drug products for about 18 000 million dollars. The department that is part of this study belongs to the research and development section within the company. The company’ s research and development sites are represented on ten different locations in three continents and in the year of 2002 the company research cost amounted to about 20 % of the total revenues obtained from the sale. The company is a merger between two larger pharmaceutical companies dating back to the beginning of the 20th century. The merging of the two companies resulted in a global reorganization at the beginning of this century, which in turn resulted in a complex and dynamic structure of organization. The ambition of the company is to integrate the IS/IT systems of the different company sites in order to get an easier flow of communication. At present the company is engaged in different IS/IT projects with the goal to coordinate the structure of the information systems.
4 .1 .1 Good Pract ice The following information is collected from company documents if nothing else is given. Work within the pharmaceutical industry is much regulated. Rules and routines are generated to secure patient safety and minimize the risk for mistakes and errors. In order to be allowed to sell drugs in a country you have to fulfil the rules set by the authorities of that country. These rules can differ from country to country.

27
There are several different sets of rules and regulations, affecting the pharmaceutical industry. Some examples are Good Laboratory Practice, Good Clinical Practice and Good Manufacturing Practice. The generic term for these are Good Practice, shortened GXP. Good Laboratory Practice, GLP, regulates the development work before clinical studies. Good Clinical Practice, GCP, regulates the handling and execution of clinical studies. Good Manufacturing Practice, GMP, regulates the manufacturing of pharmaceutical products. GMP is the set of rules regulating work at the departments studied. GMP is an internationally used term for principles and procedures assuring that the product manufactured has the intended quality (European Agency for the Evaluation of Medicinal Products). The first GMP was developed in the USA in the sixties after a number of serious events where people had been hurt or even killed by pharmaceutical products. Today there are several different GMP regulations developed by both national and international authorities. The two GMP regulations that are of most interest to the company at hand are developed by EMEA and FDA. EMEA is short for European Agency for the Evaluation of Medicinal Products and is one of European Union agencies with the responsibility to protect the health of human beings and animals. EMEA works to ensure the highest level of evaluation and supervision of medicines in Europe (The Agencies of the European Community). FDA, Food and Drug Administration, is s scientific, regulatory and public health agency in the USA responsible for ensuring that food, human and animal medicine, medical devices, cosmetics and animal food are safe. For a drug to be approved for the American market the development and manufacturing of the drug must be done according to the cGMP, current Good Manufacturing Practice (U.S Food and Drug Administration). On the basis of these GMP regulations the company has developed Quality and Compliance Manuals, Q&C-manuals. For the work on the different sites they have produced local Standard Operation Procedures, SOP. The SOP’ s must correspond with the company’ s Q&C-manuals. One of the most important directives within GMP is the demand for traceability. Traceability means that you are able to trace a product back through all the stages. This demands that everything happening to a product must be documented. The documentation is a proof of what you are about to do, what you have done, when and how you did it, who did it and the results of it. The motto is that things that have not been documented have not happened and refers to the fact that the burden of proof is on the company when they apply for permissions and patents. Documentation while working must be done according to certain rules in order to guarantee the authenticity of the information. For instance, the work documentation must be done when performing the work, not after, and the documentation must be examined and signed by a co-worker. Other important rules are that you cannot use tip-ex and that you have to cross over parts of the documentation that are unused.

28
4 .1 .2 Descript ion of Clinical Supply Units The cooperation of the departments is described and summarized briefly in this part; the following part of the chapter gives a detailed description of the process. The information about the process is gathered from the company where the study was conducted. Investigational Products, IPS, has the main responsibility to pack, mark and distribute medicinal products that is included in clinical study. In Sweden the department is represented on three sites within the company with a total amount of 45 employees. Product Development, PD, is responsible for preparing and manufacturing the clinical study material. In Sweden they are represented with a total amount of 162 employees on three sites within the company. IPS and PD are a part of an organization called Pharmaceutical Analytical Research and Development which is in the following text shortened PAR&D. Other departments within PAR&D, that have a close cooperation with IPS and PD but are not included in this study are for example Clinical departments. Clinical departments have the responsibility for the realization of the clinical studies of drugs and how these are going to be realized. The most important task of the Quality Assurance department, QA, is to make packaging and manufacturing routines available for the employees within IPS and PD and the updating of these too. They approve raw material as well as manufactured and packed study material. Analytical Development, AD, is responsible for accomplishing analytical tests of the raw material used in the manufacturing process and manufactured study material. They also define non-perishable limits on raw material as well as clinical study material. The departments within the PAR&D are responsible for the clinical studys within the company. Figure 5: The cooperation between the departments.
Clinical
QA
AD
IPS PD

29
4 .1 .3 Clinical Supply Process The following information in the following part describing the Clinical Supply Process is gathered from internal documents within the company that describe how the different processes should be carried out. At first there is a short description of which documents that are represented in the process of the studied departments. To understand how the documents are used in the processes of packing and manufacturing, a following description of the clinical supply process is presented. Documents that are included in the Clinical Supply Process:
• Study Packaging Plan, SPP • Master Study Packaging Record, MSPR • Study Packaging Record, SPR • Master Composition Record, MCR • Master Batch Production Record, MBPR • Batch Production Record, BPR
In figure 6 the documents are placed in the following order in the Clinical Supply Process. The site where the study was conducted had system support in generating the paper documents listed above, which are used in the packaging and manufacturing processes. The system at the studied site, handling the generation of the paper documents, is the most extensive system used in the Swedish sites. The other sites have different methods in generating the paper documentation. Figure 6: The documents in internal order between the concerned departments.
IPS
Clinical
PD Study Packaging Plan
SPP
Master Study Packaging
Record MSPR
Study Packaging
Record SPR
Master Batch Production
Record MBPR
Batch Production
Record BPR
Master Composition
Record MCR

30
When a decision has been made about a clinical study from the Clinical department, this is to be planned with Investigational Products, IPS. A Study Packaging Plan, SPP, is to be established. Then an order and study information will be registered in the order system, which is communicating with the storage system. If it is the first time the study is being conducted, a Master Study Packaging Record, MSPR should be established. A MSPR is the foundation for all packaging documentation. Before the study is being conducted Quality Assurance department, QA, must approve the MSPR. After the approval the packaging documentation, Study Packaging Record SPR, is printed. SPR’ s are working documentation that is based on the MSPR of the study. Figure 7: Clinical Supply Process At the beginning of the study, the involved parties invent the system of study material and then order what will be needed to conduct the study from Product Development, PD, the Operation units of the company or externally. Operation units are the manufacturing plants of the company, externally means that material is ordered from the Pharmacy Company or similar. PD, Operations or the external supplier should give IPS an order confirmation. Before PD gives an order confirmation they should look into their possibilities to manufacture the quantities of the drugs requested. If the article hasn’ t been requested in this strength and quantity before, PD will establish a Master Batch Production Record, MBPR. A MBPR is a given composition for a batch quantity. If the article has been ordered before, PD should use this MBPR as a basis for a new Batch Production Record, BPR. A BRP is the manufacturing documents where original data are documented during the manufacturing. If it is the first time the manufacturing will be based on a new MBPR, QA should first approve this before a BPR is being printed.
IPS
Clinical
Manufactured batch
PD
QA AD
Operations
Quality assurance
Analysis services
Source material
Packaged batch
Distribution
Drug request Material request
Manufacturing

31
When a MBPR will be established in a certain quantity, this is based on a so called Master Composition Record, MCR, which is a given composition in certain strength for a certain quantity of an article. This MCR should also be approved by QA. When an approval from QA has been received and PD has made an activity plan and when all substances are in the warehouse, the production of the article can take place. The scientist that is going to manufacture the batch, prints the BPR, which is one or more documents of each process in the manufacturing. The BPR contains finished instructions and quantity of substances. These instructions should be carried out by the scientist by writing “ like instructions above” in the BPR, when a process in the manufacturing has been made. A control of this should be made by a controller in the most of the steps of GMP-manufacturing. This is done by a signature in the BPR from the scientist and the controller. When the batch is finished and has been bulk packed, a reference sample should be sent to Analytical Development department, AD, for an analysis. Until QA has approved the manufactured batch, it will be put in quarantine in a warehouse at PD before it is being sent to IPS for final packaging. The MBPR and the BPR are stored in an archive at PD. At IPS an employee that is responsible of the warehouse should receive papers from QA that show that the article is approved. The approved article should be controlled and registered in the warehouse system at IPS. A coordinator at IPS should pack the article due to the Study Packaging Record, SPR. The coordinator at IPS should document the packaging process exactly as the scientist at PD documented the manufacturing process. This means that the coordinator and an controller should sign the documents in all critical moments like for example the weighing of drugs should be documented in the SPR. When the study is packed and the documentation is put together, an employee that has an authorization should control all documentation and control samples of packed drugs. Samples in the material should be left opened so that the authorized person could control this. When all has been approved by the authorized employee from IPS, the clinical study material should be packed in final distribution boxes. MSPR and SPR should be stored in an archive at IPS. When the documentation has been approved from QA the clinical study material is ready to be finally distributed.

32
4 .2 Part 2 – W ork Pract ice When manufacturing and packaging drugs they work in special areas according to Good Manufacturing Practice, GMP. In order to enter their respective GMP- areas they have to go through a passage where they have to change clothes. There are different degrees of cleanliness and rules for clothing. The purpose of the passage is to prevent unwanted particles from getting into the GMP-areas and to prevent particles, such as active substances, from getting out. In the GMP-areas there are several rooms and in those rooms there is different equipment. When they are about to perform an activity, they log in to a room intended for that activity by entering their information in a logbook. The first thing they do when they are about to start using a room is to check that the room is clear from documents and products from earlier manufacturing or packaging. When working in the GMP-areas they often work two and two together. One is the operator and the other is the controller. This means that they work together but one has the main responsibility and the other one controls and verifies that the work has been done and documented correctly. The work documentation, belonging to the present manufacturing or packaging, is printed on paper before entering the GMP-areas. When working they log and take notes about everything they do. There are logbooks belonging to all the different rooms and machines and in these they write what they used the room or machine for and when and also what they brought with them into the room. When they have finished in one room they log out by writing date and signature in the logbook. They can work in the same room for several days and in that case they do not have to log out, as long as they perform only one activity. If they use the same room for several activities, then they have to log out and log in again when they are about to start a new activity. As long as they are logged in a room no one else can use it. For almost every task they perform they have to take notes and sign in the work documentation. The signature shows that the task is performed and who wrote the note. At some moments, two signatures are required, one from the operator and one from the controller. Things they note in the documentation are, among other things, parameters that have effect on the manufacturing or packaging. It can, for example, be notes about temperature of the room, what machine has been used and the machine settings. If they write the wrong notes they do not erase, instead they just cross over the wrong text, write the correct one by the side and write an explanation to the typing error. Neither do they leave any part of the document blank, but instead they cross that section over and write NA, short for Not Applicable. On the work documentation there is information printed in advance, such as ingredients, packaging products to be used and instructions for the tasks. However, some information, for instance the batch number of a product, must be noted manually. To note manually means a moment of control since it is an active event. The alternative with batch numbers printed on the documentation in advance and that are controlled and signed, is considered to be a less extensive control with greater risk for errors.

33
At the manufacturing department they do not only manufacture products for clinical studies, but they also carry out experiments. The intention with the experiments is to come up with the most optimal way of manufacturing, by testing different ways to manufacture. It was observed that they made a lot of notes on other documents than the work documentation. These notes were partly for their personal use and partly for the development work. There were notes about, for example, settings of a machine and process parameters. There were also notes about what time it was and similar things that they used to fill in the work documentation later on. The work can sometimes be really complicated and for some parts of the process there are instructions, written on paper and accessible in the GMP-areas. At the manufacturing department these instructions can be about a machine and at the packaging department they can be about how one special type of packing should be made. The demand on clinical studies to be blinded complicates the packaging. This means that they send both active and non-active products, so called placebo, but the patient receiving them do not know what alternative they get. Because a study is blinded they have to be extra cautious when packaging, and later on labelling, so they do not mix the active products with the placebo. Since both alternatives look alike there are strict rules about keeping them apart. When performing a study they randomly distribute what patient gets what alternative, and when they label the product it is very important to control that the right patient gets the right alternative. When they are finished with a product they take a reference copy. The copy will be kept and later used for control if anything would be discovered about that specific manufacturing or packaging. The purpose of the copy is that it should reflect the whole process from the withdrawal to a completed product or packaging. When working with a task they handle several documents. They change between different documents and they do not always belong to the same task. At some points they work with several documents and logbooks, sometimes even instructions, placed in front of them on the table. They gather data from the different documents and take notes in the present work documentation. It was studied, on several occasions, that they organized the different documents in piles in order not to mix them up. The paper is an artefact characterized by micro mobility. Micro mobility can be applied in the study to describe the way in which the personal of the clinical supply units works with the paper documentation during the manufacturing and packing processes of the study material. The communication and cooperation in the processes are supported in the manufacturing and packing documentation, the logbooks are also fulfilling an important function. The work with manufacturing or packaging is characterized by local mobility. They prepare the work in their office and then they perform the work to a large extent in the GMP-areas. They work in one room with one activity and when they are about to perform the next activity they have to move to another room. And while working they must sometimes leave the room to collect instruments or to perform a test on a machine in another room.

34
4 .3 Part 3 – At t itudes The histograms resulting from the questionnaire help us to get an understanding what attitudes the employees of the departments in the study have. The histograms were used to give an easy and clear presentation of the employees’ attitudes and they were grouped into areas which seemed to be relevant. A couple of histograms were used to represent each area. In the histogram the alternatives are classified as follows: A = Agree, B = Partly Agree, C = Uncertain, D = Partly Disagree, E = Disagree.
4 .3 .1 Use of docum entat ion To get an understanding what attitude the respondents have towards working with paper in the process of documentation, in the packaging and manufacturing processes, they were asked to answer the statements one and six. Roughly two thirds of the respondents have a positive attitude toward printing the document before the packaging and manufacturing processes begin. The histogram from statement nine shows that there are different opinions about how it functions in working with the documents in the different processes.
Figure 8: Statement 1) I think it works well in Figure 9: Statement 6) It is hard work with paper
printing protocols before the work begins. documents in the manufacturing-/ packaging process. In the text answers of the questionnaire, three of the respondents were expressing their attitudes towards working with paper as follows:
No need to copy and send the documents around to different persons/departments/sites would save a lot of time. The advantage of paper and pen is that they are always working when you have printed out your manufacturing document. What happens if the mobile device stops working? or if the whole network is down? Personally I prefer a system with separate documents for technical experiments which are marked with the number of the experiment and archived near my office. In this archive photos, printings from measurements etc. can be archived at the same place as my notes.”

35
4 .3 .2 Logbooks The respondents were asked to answer the statements seven and eight since we wanted to have an idea of their attitudes towards documenting information from the processes in logbooks. It appeared that roughly thirty respondents have the opinion that the logbooks are unclearly filled-in. In the other way, roughly forty respondents have the opinion that the logbooks always contain correct information. At the same time an overwhelming part of the respondents have the opinion that it would be easier to work with electronic logbooks according to the histogram from statement seventeen.
Figure 10: Statement 7) The logbooks are Figure 11: Statement 8) The logbooks always
filled in an unclear way (legibility). contain the right information.
Figure 12: Statement 17) It would have been easier
working with electronic logbooks.
4 .3 .3 Stock m anagem ent At one of the departments they are working manually with the stock in hand of articles, the respondents of this department agree in disagreeing that it is optimal to register articles/raw material manually, in statement twenty-four. At the same time they agree in statement twenty-five, in their attitudes towards believing that it will be easier to use a computerized facility in this situation. Both departments have similar positive attitudes in statement sixteen, towards believing that it would be easier identifying articles with a barcode reader.

36
Figure 13: Statement 24) It is optimal in registering Figure 14: Statement 25) Managing articles/raw withdrawals of articles/raw material material in the stock, would generally be manually on cards in a binder placed in easier if this had been done with a the stock. computerized facility.
Figure 15: Statement 16) It would have been easier
if it would be possible to identify article/raw material, instruments etc. with a barcode reader during the processes of the work.
One respondent expresses his attitude towards the thought of starting using a computerized system in consideration of warehouse managing as follows:
The advantage of a possible computerized system is the possibility of reading barcodes at raw materials/packaging materials.
4 .3 .4 Controls in the w ork pract ice Most of the respondents seem to think it would simplify work with automatic controls instead of signing twice which the answers in the histogram from statement ten hint. This appears somewhat contradictory when you look at the answers from statement four, where most of the respondents agree that it feels safe working together and signing twice in the documentation.

37
Figure 16: Statement 4) It feels safe signing twice Figure 18: Statement 10) You can make it easier
in the documentation. to perform the work in certain processes by including automatic controls, instead of working one operator and one controller together.
Two respondents express their attitudes towards working in teams as follows:
Would not like giving up signing twice just because you simplify work with automatic controls. You could read the wrong barcode by mistake etc. It is good being two when you manufacture for a clinic.
4 .3 .5 The need of inform at ion According to statement five and twenty-one the respondents can be considered having a positive attitude towards the need of searching information when they are working in the packaging-/manufacturing area, i.e. when they are having a high extent of local mobility. Roughly forty respondents agree or partly agree in statement five, while almost fifty respondents agree or partly agree in statement twenty-four.
Figure 18: Statement 5) You need to search Figure 19: Statement 21) It would have been easier
information about other batch protocols/ if you could look for information like work sheets(ongoing and finished) when SOP, what other sites have in their stocks you are working in the packaging-/ and old logging books when you are manufacturing area. working in the manufacturing-/packaging- area

38
Two respondents express their attitudes towards the need of searching information in the packaging-/manufacturing area:
It would have been much easier if you could read SOP when you are in GMP and work, since we should always work after the latest SOP. But I don’t think you are dependent on old logging books. It would have been suitable to have access to SOP. On the other hand I’m uncertain whether archived logging books. I think that automatic reconciliation calculations seem unnecessary.
4 .3 .6 Contam inat ion According to the histogram from statement two, you can see that the respondents’ attitudes are separated whether they take any action regarding carrying in documentation into the packaging-/manufacturing area. This statement is interesting since there are strict rules when the employees are going into the area to work. The employees must change working clothes and be particular so they don’ t bring undesired particles into the area. The same rules are applied when articles and raw materials are being transported into the area.
Figure 20: Statement 2) There is special action taken (due to contamination risk) when carrying in and out batch protocol/work sheets through the packaging-/manufacturing area.
4 .3 .7 Possibilit ies of w orking w ith a m obile I T solut ion Statement thirty-four and thirty-five summarize what the respondents’ attitudes are towards working with a mobile IT solution. The histogram shows that the respondents have a positive attitude towards working with some form of mobile IT solution. In statement thirty-four there were over two thirds which had a positive attitude and felt comfortable with the thought of working with a mobile IT solution. In statement thirty-five there were roughly four out of five that had the attitude that a mobile IT solution would make the work easier.

39
Figure 21: Statement 34) I feel comfortable Figure 22: Statement 35) I think working with a working with a mobile IT solution. mobile solution would make the work at the department easier. Two respondents have the following attitude towards mobile IT solutions at the departments:
I believe in mobile solutions, if it can be guaranteed that they work reliably and are not so complicated that they are put away and are seen as a trouble.
I’m doubtful about mobile data support regarding what will happen when this system is troublesome. It is well known that computers are “going crazy” every now and then.
40
5 Analysis & Result Analysis means an attempt to structure the collected data in a way to make the interpretation easier (Repstad, 1999). In the following chapter the methods used for analysing the data are described together with the results from the three different parts of the study.
5 .1 Part 1 – Operat ing Procedures When collecting qualitative information a first analysis of the material takes place. The data collected gives the researcher ideas and guides the focus of the researcher during the collection of new data. When all information is collected the analysis continues (Merriam, 1994). In theory the qualitative research separates between analysis, interpretation and writing the thesis, but in reality the phases often overlap (Repstad, 1999). The analysis is about compressing the information and to make sense of it (Merriam, 1994). First, you go through the material and take notes about ideas and comments and then you see what possible categories that have come up. One should also be aware of categories that have not come up and contradictions (Repstad, 1999). The study of regulations within the pharmaceutical industry and company documents has provided an understanding for the context of the work activities. The study showed how the local work activities are arranged and demands on them. Since you cannot interpret attitudes from these documents, we have focused on forming categories that we think may influence the attitudes, toward a mobile IT solution, among the employees within the departments studied. Here follows explanations of the categories we saw when studying the operating procedures. Traceability Traceability means the demand for careful documentation of the work and there are established rules for what to note. I nform at ion integrit y Information integrity means demands for how to take notes in order to establish authenticity of the notes. There are rules regarding what you can and cannot do when documenting. Control The control is concerned with the demand for control and verification of the documentation by a co-worker.

41
5 .2 Part 2 – W ork Pract ice Observations and interviews are qualitative methods like examination of documents in part one. Therefore the same thing applies for analyzing observations and interviews as for the examination of documents. The aim is to find recurrent categories in the collected material (Repstad, 1999). It is difficult to interpret attitudes from observations. We have therefore focused on finding categories that we think may influence the attitudes, in one way or another, toward a mobile IT solution. The material from the interviews has been used to enhance the categories from the observations, but also to find new categories and to interpret any attitudes that might have been mentioned. Below, categories found during the analysis are presented together with illustrative excerpts from the observations and interviews. The excerpts contain abbreviations and Op stands for operator, Co stands for controller, R stands for respondent and I stands for interviewer. Excerpts starting with an R comes from the interviews, the rest comes from the observations. Reduct ion of m istakes Reduction of mistakes means behaviour that contributes to a lower risk of error. This refers to, for example, keeping the documentation in good order so that you do not take notes on the wrong document. This also refers to writing the identity of the product on the container in which it is kept in order to prevent mix-ups.
Co sorts the documents on the table, thinks there are too many documents, and groups them so there won’ t be any mistakes.
Another aspect refers to the circumstance that you cannot have both active products and placebo in the same room at the same time, because of the risk of mixing them up. It is also important to keep the labels for active products and placebo apart in order to prevent mislabelling.
R: …but he is not allowed to bring both active products and placebo in the room when making the withdrawal. It is very easy at this moment to make a withdrawal from one bag and copy the identity of the other bulk, meaning if I withdraw an active product but writing on the bag that it is placebo…
R: Yes, the purpose with the activity is, harshly said, to deceive the world around… I: Yes, then it is foolish to deceive oneself … R: Yes, and then the object is to avoid stumbling on the finishing line and fool oneself…

42
Sim plif icat ion We were witnessing behaviour that we perceived as complex and where we mean that there would be a potential to simplify certain processes. The reason for this argument is that we observed that they took a lot of notes while working.
Co notes in the documentation the number of references, date and signature. She also notes what alternative it is (B), how many blister packages there were, between which patient numbers and how many there are left (in this case 0)
It was also found that they themselves have changed some parts of the work in order to make things easier for themselves.
R: … are there 100 bottles with 10 pills then you withdraw 1000 tablets and it is then simpler to understand the documentation later on, for example in connection with such a withdrawal if you write that you withdraw 100 bottles with 10 tablets. Then you can add such a comment. R: … when we need these references, it is when there are strange results in a study, and they say there are strange results in Italy, in this study, with this or this order number… then you go down to the box with the references from June 2003 and there you start looking for your study and the country of Italy. Many employees see the country before the order number. So that is why many employees still, there is no demand for it and it is not wrong either, write the country and as R2 mentioned, there is nothing wrong with writing the period either, but there is no demand for it.
I nform at ion integrit y Information integrity means how important it is that you perform the tasks in a right way and that you take the right notes. The moment when you, for example, take notes about the setting of a machine, is at the same time a control that the setting is correct.
R: It says in the order that I want bottles with 30 pills and all our work is about taking down notes about what we do and this count is really critical that you control, that the machine is set on the right setting and that you verify it. And since it is not done anywhere else, which is why we have chosen to have it in the logbook.
R: … you take a box from the stock, put it in the withdrawal room and then you copy the number and transfer it to the bag you place your withdrawal in. If you do something wrong in this situation, then you deceive the whole IPS, you also deceive everyone following, yes, it is very critical…
It is also very important to prevent information from being entered in the work documentation afterwards.

43
R: We are not allowed to leave parts of the documentation empty. To prevent you from entering anything there. So everything that is left empty must be crossed over, the whole part or the row, and you write NA.
Traceability Traceability means that everything must be documented so that you can trace a product back through the processes. This is demonstrated by the fact that every event is logged and information about them is documented.
After that, the Op logs the task of packaging the products together in the logbook; date, order number, product, the product batch number, pack products together (activity), signature. This is done twice, once for each product that is packed… R: … and then you note in the logbook that you used the two equipments… the purpose of the logbook is to trace both events and flow of products, and since we say that there can never be two events or products in the same room at the same time we have decided that it is enough with one logbook.
Control Control means behaviour that is about controlling that the work is done in the right way and that the documentation is correct.
Co controls that Op has written the right information in the logbook and in the documentation, and signs in the documentation. The number of the article is printed in advance and Op controls this against the label on the barrel.
When Co comes out in the corridor with the trolleys Op makes a check with a material list, and finds that the barrel contains the wrong substance.
As for information integrity, the notes are also an extra control.
R: … I think there is a demand from QA that the entering of notes must be an active event when it happens, it is supposed to be a control.
You perform tests on the products you work with to control that everything is correct.
The machine that makes the test prints a receipt with the results… The receipts from the leak test are attached to the back (of the documentation)
Flex ibility Flexibility refers to tasks that are not so much regulated and where the performance becomes personal. This is, for example, about making comments in the documentation.

44
R: Some put in whole sentences, others are very brief. Something like 10 times 100 tablets… But as you see, when you are making a comment it is very individual…
Flexibility is also about the behaviour when performing an experiment at the manufacturing department, since there is no specific work documentation for them.
The explanation that Op gives later on is that they take their own notes about technical graphs in order to find the optimal compound, time and other parameters to be able to produce granules as good as possible.
I nform at ion need The need of information means when you, for instance, use written instructions to assure that you do the right thing.
R: … that there was a file with the earlier orders… we were uncertain how we should do it and how we usually do it, so that we can do it precisely as before… so that the testers will not see any difference… from which batch it is.
Safety Safety is about behaviour that leads to you feeling secure with the fact that you do the right thing. This means, for instance, that the controller controls and that you use the documentation as a help.
Co stands on the side and watches (controls) the packaging. It is made clear when Co and Op talk, that this is not necessary in this packaging, but the Op feels more secure, since this is a very complex packaging. R: … at this point I had the document with me because of the complexity so to speak. I had reserved an amount of tablets, but to be on the safe side, it is always good to have the documentation with you so that you can look at it…
Navigat ion Navigation is about navigating in the documentation. It was observed that some time was spent on organizing the work documentation.
… Op checks another protocol. He browses through the protocols in the pile beside the batch protocol. Finds a protocol and writes something on it, browses further and finds another protocol and writes something on it. Op sorts the documentation…
Mobility Mobility reflects how they move about when they work. It was observed that they moved about a great deal in the room they were working in and within the GMP-areas, so called local mobility. It was also observed that the documentation was moved about a great deal and is used to support communication and cooperation, so called micro mobility.
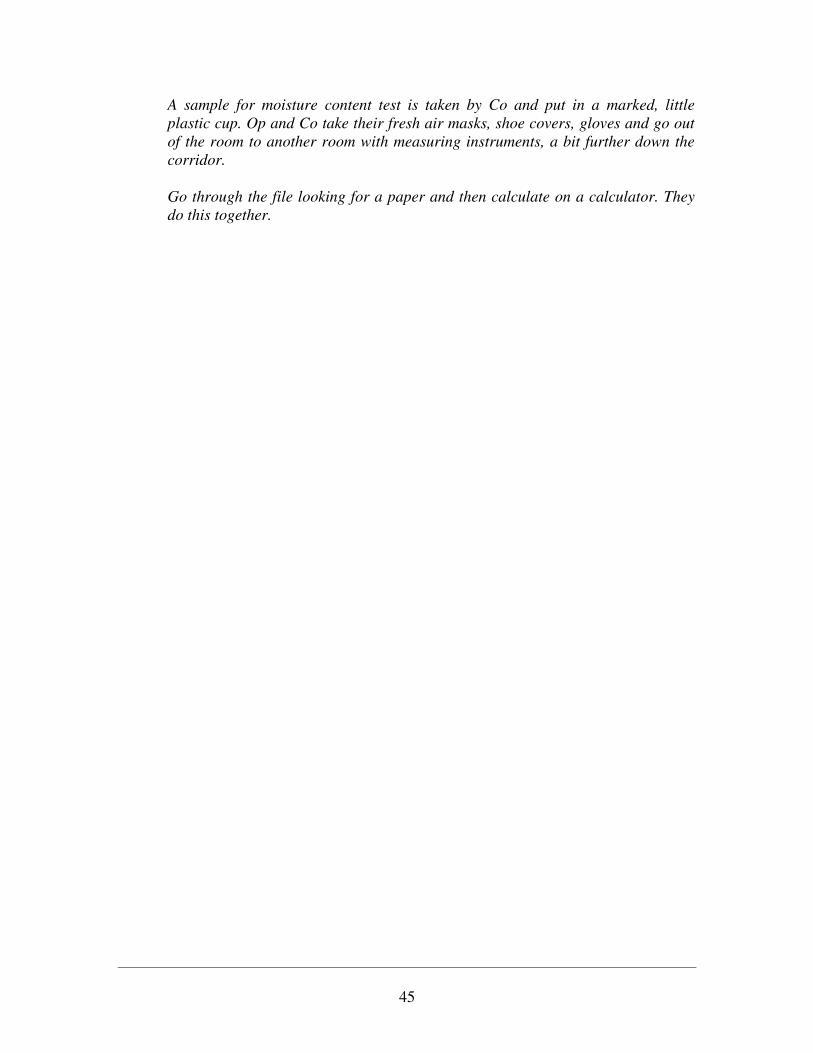
45
A sample for moisture content test is taken by Co and put in a marked, little plastic cup. Op and Co take their fresh air masks, shoe covers, gloves and go out of the room to another room with measuring instruments, a bit further down the corridor.
Go through the file looking for a paper and then calculate on a calculator. They do this together.
46
5 .3 Part 3 – At t itudes When you calculate statistical methods the purpose is to be able to draw conclusions about a population based on information from a sample, and also to be able to explain to what extent the results are correct. Our purpose with the questionnaire survey is to map out relations and test if different background variables could be the reasons why the attitudes are alternating among the employees, along with finding out what factors there are to take in consideration in a possible implementation of a mobile system. The answering alternative of the statements were graduated in a five pointed Likert-scale (Davidsson & Patel, 1991). The statements were given points according to the negative loading they have considering the way of working today and how positively loaded they are considering working with a mobile IT solution. If the respondent agrees in a statement with negative loading towards the way of working today, the value is set to one. If the respondent disagrees with the same statement, the value is set to five. If the answer to the statement has the value of five, we assume that the tendency for innovations is higher and the attitude of the respondent is more positive than if the value of the answer is one. If the respondent agrees with a statement with positive loadings towards working with a mobile IT solution, the value of the answer is set to five. However, if the respondent is disagreeing in the same statement the value of the answer is set to one. If the answer of the statement has the value of five, we assume that the tendency for innovations and the attitude towards working with a mobile IT solution in the working processes are positive. The statements 1-22, 24-28, 32-35 and 37-42 were entered into SPSS for a statistical analysis. The statements 23, 36 and 43 were text answers and were therefore excluded from the statistical analysis. In the statistical analysis different categories were identified in the study. These categories were put together with categories identified in the other methods in the final summary with the Nah et al. (2003) model in chapter six.
5 .3 .1 Factor Analysis Factor analysis is a form of explorative multivariate analysis which is used either to reduce the number of variables in a model to detect relations between variables (Statistical Computing). The purpose of a factor analysis is to try to identify which factors the variables establish (Statistical Computing). A factor analysis was conducted, which reduced the number of variables. In this study the variables are the statements in the questionnaire. This reduction of variables means that it simplify the quantitative analysis (Jolliffe, 1986). A principal component analysis with a varimax rotation was conducted on the variables in SPSS, the analysis resulted in a nine factor solution. The nine different factors loaded, in the different statements included in the survey, with a marginal value of >0.4 or >-0.4. The marginal value decided if the factors were to be used in further analysis. Three statements loaded in more than one factor. In these cases the logical belonging decided by which factor the statement was sorted. Since five of the statements could only be answered by employees from one of the

47
departments included in the study, an additional factor analysis was conducted based on these employees’ answers. The five statements together are the basis in factor ten. In table one, the loadings of the variables with the marginal value are represented in their respective factor.
Statement Auto- mate
Reduc- tion of mistakes
Trace-ability
PDA inter-action
Cellular Phone inter- action
Infor- mation need
Infor-mation integrity
Conta-mination Efficiency Simpli-
fication
12. Easier if diverse process parameters have been registered automatically
82.3
16. Easier if you could identify with a barcode reader
75.1
18. Easier if you use a barcode reader to register the activity
70.9
13. Easier if measured values registered automati-cally when controlling supplying material
69.3
10. Easier with automatic controls, instead of two signatures
57.6
17. Easier working with electronic logbooks 51.8
35. Working with a mobile solution would make the work easier
51.0
11. Easier with automatic documentation in the logbook when calibrating
47.8 47.2 45.1
14. Easier if reconciliations could be done automatically 44.0 44.7 -39.7
7. The logbooks are filled in an unclear way 73.6
19. Mistakes could be avoided by using automatic controls and electronical records
72.4
20. Desirable if you could print different marking labels close to where I am
66.8
22. Able to avoid much unnecessary transportation if we had been working with mobile IT solutions
52.4
9. It is hard work looking for a filed logbook 75.8
3. Documentation after a completed packaging/ manufacturing has been found in the area
61.7
34. I feel comfortable working with a mobile IT solution
61.7
6. It is hard work with paper documents 48.8

48
Statement
Auto-mate
Reduc- tion of mistakes
Trace-ability
PDA inter-action
Cellular Phone inter- action
Infor- mation needs
Infor-mation integrity
Conta-mination Efficiency Simpli-
fication
33.2. Input facility is too hard work to use on Personal Digital Assistants
-83.5
32.2. I think the Personal Digital Assistant is too small to handle
-73.1
15. Easier if information needed for a line-clearance control had been registered automatically
53.7
32.1. I think the cellular phones are too small to handle
85.4
33.1. Input facility is too hard work to use on cellular phones
75.4
5. Search information about other batch protocols/work sheets when you are working
75.2
21. Easier if you could look for information when you are working
43.2
54.1 47.3
8. The logbooks always contain the right information 79.3
4. It feels safe signing twice in the documentation 73.8
2. Special action taken when carrying in and out batch protocol/work sheets
76.6
1. I think it works well in printing protocols before the work begins.
53.6
17. Easier working with electronic logbooks 49.2
24. Optimal in registering withdrawals on cards in a binder placed in the stock
81.4
26. Hard work fetching logbooks which are not close to the room/instrument
80.2
27. Easier with a central place where the technical experimental protocols had been stored
80.1
28. Easier in technical experiments if you could work with a computerized device instead
79.1
Table 1: Factor solution F1-F9 based on n=76, factor solution F10 based on n=55

49
Ten factors were identified, which were named to represent the loadings of the variables in the factors: F1) Automate; F2) Reduction of mistakes; F3) PDA interaction; F4) Cellular Phone interaction; F5) Cellular Phone interaction; F6) Information needs; F7) Information integrity; F8) Contamination; F9) Efficiency and F10) Simplification.
5 .3 .2 Cronbach’s Alpha Cronbach’ s alpha is a measure of reliability in the examined material. It measures the internal consistency in the material, i.e. how well the factors in this case are coherent (Altman, 1991). In this study this means how well the statements in each factor are connected together. The coefficient of reliability used in the material is 0.65-0.95, which is considered as acceptable in most of the studies (Statistical Computing). An analysis wasn’ t accomplished on factor eight since there was only one variable in this factor.
Auto- mate
Reduc- tion of mistakes
Trace-ability
PDA inter-action
Cellular Phone inter- action
Infor- mation needs
Infor-mation integrity
Conta-mination Efficiency Simpli-
fication
Number of variables 9 4 4 3 2 2 2 1 3 5
Alpha 0.84 0.74 0.43 0.71 0.75 0.67 0.46 - 0.21 0.90 Table 2: Cronbach´s Alpha analysis of the factors.
5 .3 .3 Stat ist ical Significance After the Cronbach’ s alpha analysis the different background variables were examined by testing the statistical significance, the p-value. The p-value has an interval between zero and one. If the p-value is high, the possibilities are bigger that the answer values given by the respondents have been entered randomly; but if it is low the reliability of the answers are higher. The extent of the significance in the study was decided to p<0.05. This means that there can be a 5% difference in the material even if the opinions of the sample groups are identical. i.e. that the zero hypothesis is true (Körner, 1987). Non parametric methods were used in the significance tests, which is convenient when the studied groups are small. These methods are not so easy to affect if the groups aren’ t normally distributed like the parametric methods (Körner, 1987). Chi-Square test, Kruskal Wallis and Mann-Whitney U tests are three used non parametric methods. Kruskal Wallis test and Mann-Whitney U test were used in this study since there are mutual dependencies between the answering alternatives in each statement. Chi-Square test was used when the answer alternatives don’ t have a mutual dependency. A Kruskal Wallis test compares if the attitudes have a variable that differs among three of more independent groups. A Mann Whitney U test compares if the attitudes have a variable that differs between two independent groups. As far as the background variables: technical interest, years of employment, age, department, site and position the attitudes of the groups were compared by means of a Kruskal Wallis test. A Mann Whitney U test was used in a comparison if the attitudes differed between men and women.

50
When the background variable technical interest was examined, the group was divided into three different levels depending on which level of technical interest the respondent had. Technical interest was based on statement 29 in the questionnaire, “ Which techniques are you using today?” , while the statements 30 and 31 don’ t represent any foundation since there was no equal normal distribution in these answers (Altman, 1991). The groups were divided after a normal distribution curve, where the group with low technical interest chose none or one answering alternative. The group with middle high interest chose two answering alternatives and those with high interest chose more than two answering alternatives. Some background variables that proved to have a statistical significance were technical interest, department, site and employment position. The other background variables didn’ t prove any statistical significance and therefore they weren’ t used further on in the statistical analysis. The significance tests proved to be statistical significant values in the factors: Automate, Reduction of mistakes, Personal Digital Assistant Interaction, Cellular Phone Interaction, Information integrity and Simplification. The background variables have a variation in these factors. The answers to the questions were added and then divided with the number of the included statements of the factor; in this way there was a gathered mean value received in each factor with a significant value. This gathered mean value explains which attitudes the employees have in the different factors and what point of view they have in the included statements of the factors. Since the factors Information needs, Contamination and Efficiency didn’ t show any statistical significant value they weren’ t used further on in the statistical analysis.
5 .3 .4 Analysis of the Text Result Text answers are a qualitative method similar to examination of documents, observations and interviews, which is why we have analyzed the material in a similar way. To be able to analyze the material we have proceeded from the question at issue (Repstad, 1999). We have been looking for attitudes in the material which is concerning the same area and then divided these into different categories.
5 .3 .5 Result of the Quest ionnaire The attitudes from the respondents have appeared from the respondents’ answers to statements in the present way of working, hypothetical statements of working with a computerized facility and which experience they have from different technical devices. These attitudes originate from the respondents’ knowledge basis and as Bohner and Wänke (2002) say, the respondent has divided the statements in good or bad and they have answered the statements from this condition.

51
Table 3: Mean value for the background variables with a p-value <0.05 on the ten factors. The mean value in table three shows that the employees, independently of background variables, are most positive in their attitudes towards the fact that a mobile IT solution
Comparison of groups Auto- mate
Reduc- tion of mistakes
Trace-ability
PDA inter-action
Cellular Phone inter- action
Infor- mation needs
Infor-mation integrity
Conta-mination Efficiency
Simpli-fication n = 53
Mean value all the respondents, n=76 4.4 3.7 3.5 2.9 3.0 3.7 2.4 3.1 3.4 3.3
Technical interest, mean value
Low n=16 4.1 3.4 3.1 2.3 1.3 3.4 2.3 2.9 3.4 3.1
Middle high n=36 4.4 3.8 3.5 2.7 3.3 3.8 2.3 2.8 3.4 3.4
High n=24 4.5 3.7 3.9 3.6 3.5 3.8 2.5 3.5 3.6 3.3
Mean value in the group 3.5 2.9 2.7
p-value, calculated from differences between the groups
0.238 0.399 0.013 0.005 0.000 0.370 0.579 0.092 0.614 0.081
Department, mean value
AD, QA n=4 4.1 4.0 3.4 2.8 2.0 3.8 2.3 2.8 3.7 3.2
PD n=53 4.3 3.5 3.5 2.9 3.1 3.8 2.4 2.9 3.4 3.3
IPS n=19 4.7 4.0 3.7 3.0 2.7 3.6 2.4 3.5 3.6 3.8
Mean value in the group 4.4 3.8
p-value, calculated from differences between the groups
0.033 0.021 0.526 0.976 0.432 0.609 0.812 0.315 0.342 0.272
Site, mean value
Site A n=49 4.3 3.6 3.4 2.9 2.9 3.7 2.3 3.3 3.4 3.3
Site B n=20 4.3 3.6 3.5 2.5 3.0 3.6 2.6 2.6 3.4 3.4
Site C n=7 4.8 4.2 4.3 4.2 3.5 4.4 2.6 3.0 3.7 3.5
Mean value in the group 3.5 2.7 2.5
p-value, calculated from differences between the groups
0.54 0.93 0.024 0.014 0.572 0.233 0.043 0.140 0.458 0.271
Employment position, mean value
Scientist n=51 4.2 3.4 3.4 2.8 3.0 3.7 2.4 2.9 3.3 3.4
Coordinator & Study Drug Technician n=16 4.7 4.1 3.5 2.8 2.5 3.6 2.4 3.7 3.6 0.0
Other positions n=9 4.6 4.2 4.1 4.1 3.6 4.1 2.4 2.9 3.6 3.0
Mean value in the group 4.5 3.9 3.7 3.2 2.5
p-value, calculated from differences between the groups
0.027 0.000 0.030 0.016 0.327 0.496 0.871 0.131 0.509 0.046

52
can automate, Automate (4.4), the processes of working, and a less positive attitude towards the fact that Information integrity (2.4) can be supported by a mobile IT solution. The effect of technical interests on Traceability and PDA/ Cellular Phone I nteract ion factors The attitudes of the respondents are differing between Traceability, PDA Interaction and Cellular phone Interaction depending on which technical interest the respondent has. The lower technical interest the more negative the attitude and the higher technical interest the more positive the attitude towards these factors concerning a mobile IT solution. The mean value of the attitudes in the three groups in the Traceability factor indicates that the respondents’ attitudes differ between partly agreeing and being uncertain (3.5). In other words this means that the respondents with technical interest varying between low to high, believe there are possibilities in implementing a mobile IT solution with built-in support for traceability. The mean value for the attitudes in the two factors PDA and Cellular Phone Interaction in the three groups can be interpreted that they are uncertain to the statements in both factors (2.9, 2.7), in other words, the respondents have either positive or negative attitudes towards statements regarding interaction in mobile devices. There is no statistical significance between the technical interest and the other factors, which means that we have not examined if the technical interest has any significance towards these factors. The effect of departm ental belongings on factors concerning Autom ate and Reduct ion of m istakes The attitudes differ in Automate and Reduction of mistakes depending on which department the respondents are working at. One of the departments has more positive attitudes than the other departments in both factors. In the Automate factor all the respondents in their respective department have a higher mean value in their attitudes than towards the Reduction of mistakes factor. The mean value for the attitudes in the three groups in the Automate factor indicates that the respondents in the departments are positive towards a mobile IT solution being able to automate the working processes, by agreeing or partly agreeing (4.4) to the statements regarding this issue. The mean value for the attitude in the Reduction of mistakes factor is positive. The respondents of the departments are closer to partly agreeing (3.8) to statements concerning a mobile IT solution being able to help reduce risky processes. In the other factors there is no statistical significance in relation to the departmental belonging, so because of this we haven’ t examined this issue.

53
The effect of site belongings on Traceabilit y, PDA I nteract ion and I nform at ion integrit y factors When it comes to which site you belong to, then it shows that the respondents have different attitudes towards the three factors Traceability, PDA Interaction and Information integrity. Only the result from the two sites, site A and B, in the study was taken into consideration in the following analysis of result. The total attitude to the statements regarding Traceability factor on both the sites A and B is much closer to partly agreeing than to being uncertain (3.5), that traceability can be solved with a mobile IT solution, which can be fairly positively interpreted. The common attitudes for both the sites are that they hold an uncertain point of view (2.7) when it comes to statements that can be connected with a mobile IT solution and the PDA Interaction factor. The factor with the lowest mean value, Information integrity, also follows the tendency in this group in having the lowest values. When it comes to the attitudes totally seen in the sites regarding statements in the factor Information integrity, the attitudes are relatively negative (2.5) that you can support this factor in a mobile IT solution. In the remaining factors there are no statistical significance regarding the site belongings of the respondent, which is why we haven’ t examined significance of the site belongings towards these factors. The effect of the em ploym ent posit ion belongings of the factors: Autom ate, Reduct ion of m istakes, Traceability, PDA I nteract ion and Sim plificat ion It is shown, according to table 3, that there is a dependence between which attitudes you have in the factors Automate, Reduction of mistakes, Traceability, PDA Interaction and Simplification and which position you have. In the mean value for the attitude regarding the Automate factor it is shown that the respondents in the different groups of employment positions are positive that a mobile IT solution can automate the work processes, by agreeing or partly agreeing (4.5) to the statements regarding this factor. The mean value for the attitude in the factor Reduction of mistakes is positive. The respondents in the different employment positions hold a point of view that is closer to partly agreeing (3.9) to the statements regarding a mobile IT solution being able to help in reducing risky processes. Totally seen, you can say that the attitudes in the three groups are seemingly positive (3.7) to the Traceability factor. In other words, this means that the respondents remain positive to the possibility to implement a mobile IT solution with a traceability support in it.

54
The groups totally seen have an uncertain (3.2) attitude towards the statements in the PDA Interaction factor. This means that the respondents are in a positive majority compared to the negative attitudes toward statements about interaction in mobile devices. The last factor that is statistically significant towards the employment positions is Simplicity. Since there were no Coordinators and Study Drug Technicians answering statements in this factor, there is no mean value calculated in this place in table 3. Totally seen both the groups had a fairly uncertain attitude (2.5) towards the Simplicity factor. Their attitude towards the possibilities of simplification in work by using a mobile IT solution is relatively negative. In the other factors there is no statistical significance to which position the respondent has, and therefore we haven’ t analyzed any connection between these and the background variable position.
5 .3 .6 Result of the Text in the Quest ionnaire In an analysis of the text result from the questionnaire frequent attitudes were shown in certain areas among the respondents; these areas establish the below mentioned factors. Flexibility Nine statements from the respondents were about how important they think it is having a system working flexibly. It is important that the mobile system has the right functions, so it will be able to support the user in his/her works. The following excerpts show that there were a number of respondents having the opinion of the importance of the ability of documenting in a flexible way in technical experiments:
It is important that you can perform technical experiments simply, fast and flexibly My answer above is regarding GMP-manufacturing. In technical experiments the widest flexibility must be held, i.e. possibilities in documenting an experiment according as it proceeds, on paper when that fits or in a computer when that fits.
All respondents don’ t have that positive attitude towards a mobile IT solution when it comes to support in the technical experiments since they believe and think that the old system is working with more flexibility:
Personally I prefer a system with separate documents for technical experiments which is marked with the number of the experiment and archived near my office. In this archive photos, printings from measurements etc. can be archived at the same place as my notes. In technical experiments a smooth solution is pretty unnecessary and creates more bureaucracy than it solves. In GMP-work the conditions are reversed.

55
Some respondents have the apprehensions that the system isn’ t going to be as flexible as they would like:
The system must be designed so that ALL exceptions of any kind they may be, can be documented. In other words, the system can’ t CREATE any problems. Have some apprehension that a reconciliation function (exchange etc.) is going to be too controlling… The most important aspect is the management security – what will you do when the system hangs and hassles, which all systems ordinarily do sometimes. Important is also the flexibility, if you must change something in your plans during the execution of the experimentations, then this must be simple so that the system hasn’ t got built-in locking and so that this is easy to document.
Reliability in Service Another important factor that many respondents were commenting upon is the reliability in service in a mobile IT solution. Most of the respondents are concerned what will happen if it isn’ t accessible during the time a manufacturing and a packaging is performed.
We clearly need a new system to handle the batch document, but I’m wondering if there is a backup plan if the mobile IT system crashes in the middle of a manufacturing process?
Some of the respondents’ attitudes lead up to the way they are documenting today are more stable, when the documents are finally printed on paper.
The advantage of paper and pen is that they are always working when they have been printed. What happens if the mobile device stops working? or if the whole network is down?
Some respondents have a positive attitude to the possibility of a mobile IT solution, if the condition that the system is working properly is met; the following excerpt shows this:
I believe in mobile solutions if it can be guaranteed that they are working properly and aren’ t so hard to use that they are being put away and seen as a problem.
Other respondents have an uncertain attitude towards a mobile IT solution since they have established an understanding from their knowledge base about how it is when stationary computers behave in a queer way:
I’m doubtful to mobile data support referring to what will happen when this system is fussing around. It is well known that computers are “going crazy” every now and then.

56
Safety The respondents don’ t seem to rely fully that they can reduce some double controls and that the mobile IT solution can perform that and therefore they don’ t seem to be so positive towards a reduction of the double controls. According to the following excerpts their attitudes in the following category are as follows:
I wouldn’ t like to give up the double signs just because you simplify work with automatic controls. It may happen that you read the wrong barcode etc.
It is good being two when you manufacture for a clinic.
Autom ate In the questionnaire it was clearly shown that the respondents had positive attitudes towards the automate factor. This is further shown by the comments of two respondents and their positive attitudes concerning the automation of certain processes:
The best thing with an eventual computerized system is the possibility of reading the barcodes of raw materials/packaging material. To skip double controls doesn’ t give such a great gain in itself, since you should be two in the manufacturing of working environment reasons. But on the other hand there are many administrative advantages in the automatic logging of data.
I nform at ion need It seems as if the respondents have a positive attitude towards the possibility of reaching different standard operating procedures during the time they were performing their work, as the following excerpts shows:
SOP it had been much easier if you could read them when you are in GMP and working, since we are always working according to the latest one. Nevertheless don’ t think you need old logbooks. It would have been suitable to have access to SOP. Nevertheless I’m doubtful regarding archived logbooks. I think automatic reconciliation seems unnecessary.
I m plem entat ion problem s To have the users’ trust in the system, and thereby a positive attitude towards the system from the beginning. It is important that the implementation is carefully prepared and runs smoothly for all concerned parties; this is shown in the following excerpt from two respondents:
The questions above assume that the data system is working directly from implementation and forward. What do we believe about the conversion phase? What will happen if the questions above don’ t meet the reality? How much work does it take from the operator/controller to have the mobile IT solutions to give the result according to the questions above?

57
Some things will be easier but not all. Then it will take some time to have the system to work well.
Traceability A respondent expresses himself like this about ER/ES, which involves electronic records and signatures: Hope you take ER/ES in consideration too.
The respondent doesn’ t express any clear attitude in the factor, but on the other hand he/she shows clearly that there is an aspect in a mobile IT solution that is included in his/her knowledge base (Bohner & Wänke, 2002) that he/she is usually able to make an opinion about which attitude he/she would take in using a mobile IT solution. Sim plicity If the users will have a positive attitude and thereby the willingness of adopting a mobile IT solution it is probably a requirement from their point of view that they can see the simplifying aspect of the system. The following excerpt shows that one respondent has this attitude towards the possibilities of what a mobile IT solution could simplify:
Not having to copy and send around documents to different persons/departments/sites would spare a lot of time.
Degree of tolerance The degree of tolerance is an important factor when it comes to how the respondents are establishing their attitudes towards a new system. You can see this in the following excerpt:
The way you ask you will have the answer; “It would have been easier if the reconciliations in the documentation could have been done automatically”, of course it is easier if things are executed automatically, but what will be required for that? To attend a lot of courses in calibrating and electronical signatures, validating computerized systems for three years with some consultant? Then it may not be so interesting anymore with that technique. When everything is getting computerized everything is getting so awfully complicated.
Com pat ibility An important attitude towards a mobile system is that the respondents seem to think it is important that it is compatible with other systems (Nah et al., 2003) used within the manufacturing and packaging processes today. The excerpt below shows this:
Though you can log chosen raw materials automatically it is still good being two persons attending in balancing. It isn’ t always necessary to document data in the protocols, but it should be possible to store data in another system (like PACman).

58
6 Discussion In the following chapter, we discuss the factors resulted from the study and link them to Nah et al.’ s mobile adoption model. We reflect over the chosen methods in the study and then finally it ends up in a conclusion.
6 .1 Discussion of results The purpose of this study was to investigate which factors can influence the acceptance of a mobile IT solution. Further, we wanted to examine if, and in that case which, background variables can influence these factors. Several factors identified in the study correspond with Nah et al.’ s (2003) hypotheses. And the study showed that some background variables are of importance for the employees’ attitudes towards some factors. In the sector that follows, there is a comparison between Nah et al.’ s model and the factors that appeared in the study. Some factors were appearing in more than one logical level as can be seen in table four. Operating
Procedures Work
Practice Attitudes
1. Personal Digital Assistant Interaction x 2. Cellular Phone Interaction x 3. Navigations x 4. Simplification x x 5. Flexibility x x 6. Reduction of mistakes x x 7. Traceability X x x 8. Automate x 9. Control X x 10. Information need x x 11. Mobility x 12. Compatibility x 13. Implementation problems x 14. Information integrity x x x 15. Reliability in Service x 16. Safety x x 17. Degree of tolerance x
Table 4: Combination of the factors From the employees’ attitudes we have been able to identify two factors which can be derived to the Input and Output Devices factors in the model; Personal Digital Assistant and Cellular Phone Interaction. It is important that the Input and Output Devices of the mobile device are adjusted to the work situation and environment where it should be used, so as not to make the users consider the mobile device as a problem and stop using it. The Navigation, meaning how well-arranged the system is, is a factor influencing the user’ s attitude towards the system and his or her intention to use it. It is important, when handling several functions in a mobile system, that it is well-arranged and easy to navigate. In the observations it was studied how the operators were looking through the
59
documentation and tried to navigate to the right document to take down notes in it; this can be compared to the Navigation factor in the model. These three factors identified lead up to how easy the user thinks the system is to use, Perceived Ease of Use, the first main factor in Nah et al’ s model. The second main factor in Nah et al.’ s model is Perceived Usefulness, which is about how useful a user thinks a system is. Service Offerings, Mobility, Compatibility and Reliability are factors which affect the Perceived Usefulness. It was shown that a number of our factors could be traced to the Service Offerings factor. This factor is about the quality and selection of services accessible to the user and how well these services support their needs and demands. This factor is important since the study concerns a work environment where the system must give such service that it does not feel more difficult to work with it in comparison to the system of today. Among the factors that can be traced to the Service Offerings factor were Simplification, Flexibility, Reduction of mistakes, Traceability, Automate, Control, Information need and Information integrity. These are all functions or services which the employees have a use for or must be available when they perform their work. The Mobility factor was studied in the observations and as mentioned before, the employees are mobile in the performance of their work and therefore the Degree of Mobility of the system is significant for the attitudes of the employees. The respondents’ attitudes are to be interpreted as if they think it is important to have a flexible and compatible mobile IT solution available in the manufacturing and packaging processes. The Flexibility and Compatibility factors can be traced to the Compatibility factor in the model. It is important that the users can use a mobile IT solution flexibly and combine it with already existing systems. It is important that the user feels that he or she does not have to register the same information in several systems, partly because of workload and partly because of the information integrity in the system. Because of this, it is important that the mobile system is compatible with the other systems used. The last factor in this group is, Reliability. If the system does not have a stable and uninterrupted access the users will lose confidence in it and perceive the mobile device as problematical and probably stop using it. The study showed that the Reliability factor is important for how the user will adopt and use a mobile system. It was stated from the employees’ attitudes that the Reliability in Service and the Implementation of the mobile IT solution were important factors to take into consideration. If the users are to have a positive attitude towards the mobile IT solution, it is important in this consideration that both these factors work as it was planned. The third main group in Nah et al.’ s model is Trust, which is about what trust the user has in the mobile IT solution. This factor is influenced by the Security, Privacy policies and Characteristics of Mobile Vendor. The feeling that the system is safe increases the trust in the system and also the intentions to use it. It is important that systems in this environment have a high security. The information in the system must fulfil the demands

60
regarding documentation in the different processes and must not be accessible to unauthorized people. In a comparison with the factors appearing in the study, we connect Safety and Information integrity to Security, and Reliability in Service to Characteristics of Mobile Vendor. The Security factor is important if the employees are to have a high confidence in the respect that the mobile IT solution functions as it is supposed to and contains the correct information. In this study, the internal IS/IT department is considered to be the vendor of the mobile system. According to Nah et al., the reputation and integrity of the vendor are important for how the users perceive the vendor and also how the adoption of the mobile IT solution works. In this case, you can connect this to what confidence and attitudes the employees have towards the company IS/IT department. The fourth main group in Nah et al.’ s model is Enjoyment. Enjoyment means how the user feels about the experience, if it is enjoyable and optimal. There are three factors influencing Enjoyment; Perceived Congruence of Skills and Challenges, Focused Attention and Interactivity. The factor Perceived congruence of skills and challenges influences how the user perceives the system and also the attitudes toward it. If it is too difficult and the user’ s knowledge is not enough there is a risk that the user will not use it. When designing the mobile system you must take the contemplated users into consideration and adjust it to their level of knowledge. The company must also provide the users with adequate training how to use the system. From the attitudes of the respondents and from the behaviour observed, we found the factor Degree of tolerance that could be connected to Perceived Congruence of Skills and Challenges. This connection is made because the experience and knowledge of the respondents in the different work processes can influence their degree of tolerance when working with a mobile device.

61
Figure 23: A comparison between factors found in the study and Nah et al.’ s model. The remaining factors in Nah et al.’ s model, such as Bandwidth, Coverage, Privacy policies, Focused attention and Interactivity, were not attested in the study as factors influencing the attitudes towards and intentions to use a mobile system. These factors can be related to design and infrastructure of a system and are difficult to ask questions about. The factors can also be related to other types of mobility than what has been observed in the study. The study also showed that there are background variables of interest for what attitude the users have towards different factors. Among these, it is evident that the interest in technology influences the employees’ attitudes toward Traceability and Personal Digital Assistant and Cellular Phone Interaction. A higher interest in technology means a more positive attitude. Probably this background variable has an impact on these factors because the employees are more used to handling the interface of mobile devices in addition to the fact that the employee has a more positive attitude that the mobile system can solve the necessary requirements concerning traceability. The attitudes among the employees vary regarding Automate and Reduction of mistakes depending on which department they are working for. This can be due to how many computerized systems they work with today and the fact that their work activities differ. It was also evident that the attitudes differ regarding the factors Automate, Reduction of mistakes, Traceability, Personal Digital Assistant Interaction and Simplification depending on the position that the employees have in the company. This position is related to which department you
Input Device
Output Device
Navigation
Bandwidth
Perceived Ease of Use
Trust
Perceived Usefulness
Enjoyment
Service Offerings
Degree of Mobility
Compatibility
Reliability
Perceived Congruence of Skills and Challenges
Focused Attention
Interactivity
Intentions
Security
Privacy Policies
Characteristics of Mobile Vendor
Coverage
Usage
Simplification Flexibility Reduction of mistakes Traceability Automate Control Information need Information integrity
Degree of mobility
Flexibility Compatibility
Reliability in service Implementation problems
Navigation
Personal Digital Assistant & Cellular Phone Interaction
Safety Information integrity
Reliability in service
Degree of tolerance

62
work in, and because of this the difference in attitude may be due to the reasons that were mentioned connected with department. It was also important on what site the employees work, when it comes to their attitudes to Traceability, Personal Digital Assistant Interaction and Information integrity. This can be due to different routines, that the work is done differently and that the work with computerized systems differs. As mentioned before in the analysis and result, the questionnaire showed that the employees’ attitudes differ depending on the factors. Irrespective of background variables, the automation of processes was the factor about which the employees were most positive . This can depend on the fact that the employees might see the possibilities with automation for example with a barcode reader together with a mobile system. The employees have positive attitudes to other factors, such as Reduction of mistakes, Traceability and Cellular Phone Interaction. These positive attitudes may be due to the fact that the employees have more experience handling cellular phones and that both reduction of mistakes and traceability are connected to the automate factor where the employees have answered in a fairly similar way as far as these factors are concerned. The employees have a less positive attitude toward Personal Digital Assistant Interaction, and this can depend on the fact that they might not have had as much experience of these devices as with cellular phones. The employees have a rather negative attitude towards the factor regarding information integrity. This can be due to the fact that the employees feel safe with the way they document the work today and so they do not see any need to secure that the document contains the right information. The employees’ tendency to change the way they work, from paper documents to a mobile system, can be regarded as relatively positive, with a high average value in the different factors found in the study.
63
6 .2 Reflect ions on the study From the beginning, the thought was that the observations would contribute with an understanding for the case and be of help when we would create the questionnaire. But since the questionnaire was ready before the observations started, we chose to use the results from the observations in a different way. This made us study the framing of the problem from three different logical levels; operating procedures, work practice and attitudes. By using the method of triangulation we were able to get a better understanding of the scope of the problem by studying it from three angles. The environment is very restricted and this posed a difficulty in connection with the observations. It was, for example, impossible to observe unnoticed and we were not allowed to observe some sensitive parts of the work. But we do not think our presence affected the observed employees much, since it is a regulated work and they cannot arrange it. Another aspect is that we were not allowed inside the rooms in the manufacturing department, but instead we had to observe through the windows of the room. This made it difficult to apprehend everything. We felt, however, that we got a sufficient impression of how the work is done. One disadvantage with the observations was that we could only observe one team at each department. If we had studied more teams it is possible that the result had shown more variation in the work. The choice of method, to measure attitudes, was made between questionnaire and interview. The advantage with a questionnaire is that you reach more respondents, while the disadvantage is that a questionnaire is not as flexible. If a questionnaire, as in this case, consists of fixed alternative answers, there is no room for all variations of answers. Instead, an interview gives the respondent the opportunity to express exactly how he or she feels. Since an introduction of a mobile device would affect everybody working in the departments, we wanted to know what as many as possible of the employees thought and therefore we chose the questionnaire. A questionnaire does not necessarily consist of fixed alternative answers, but since we wanted to compare the answers easily we chose to let the respondents state their opinions, according to a Likert scale. To capture possible thoughts and attitudes, that the respondents felt was not evident in the statements, we added a text field where they could express themselves freely. It is very difficult to ask questions about something that the respondents have not experienced. The questions and answers often get hypothetical. In order to try to avoid this, the statements were formulated as examples of how we saw a mobile IT solution could work in specific work situations. With this we hope they got a better understanding of what a mobile device could mean and form an opinion. The fact that they are mobile when they work can also have made it easier for them to understand statements regarding mobile devices. It is difficult to ask questions about design without offering the respondent examples on how the design can be. This led to that the statements in the questionnaire mostly were about function and not design of a contemplated mobile IT solution. If there had been

64
statements about design, it is possible that we had found factors that could be compared to factors in Nah et al.’ s model concerned with design. This study has been performed at only one company and only one site. The result would probably have been more varied if it had included more sites or more companies. But this was not possible due to limitations in time.
65
6 .3 Conclusion The purpose of this study was to examine which factors influence acceptance of a mobile system within regulated business. We formed two research questions and in this section we are going to give answers to them.
Which factors influence acceptance of a mobile system within regulated business? The case studied is set in a work environment with demand for rigorous documentation and if you cannot take notes you cannot work. The study showed factors that are important for a mobile IT solution to be a success in this particular context. In comparison with the hypotheses of Nah et al. we found connections to the following factors: Input and Output Devices, Navigation, Service Offerings, Degree of mobility, Compatibility, Reliability, Security, Characteristics of Mobile Vendor and Perceived Congruence of Skills and Challenges.
Which background variables affect these factors? The study showed four background variables that are statistically proved to affect acceptance of a mobile IT solution. The first one, a person’ s interest in technology, confirmed our beliefs in the beginning of the study, that this is an important background variable. Two other background variables are for which department a person works and what position a person has. These two variables can both be connected to what a person works with and shows that different work activities influence how you perceive a mobile IT solution to facilitate work. The last one, which site a person works on, can be connected to how you work with information systems today and different routines.

66
6 .4 Future W ork The adoption theory area is large and therefore there is an amount of different theories worked out for acceptance and adoption within different kinds of systems used in the stationary information technology area. Regarding to the size of the area, there are a lot of different theories to examine and investigate if they are suitable for acceptance and adoption within the mobile information technology. Up till now there have only been a few theories examined and further developed (Nah et al., 2003; Sarker & Wells, 2003; Kleijnen et al., 2003); this is due to the fact that the area is relatively new and has just been started. It’ s hard to have a correct picture of the users’ attitudes by asking them hypothetical questions about a system that has never been in use. Poole and Van Valley (1994) tried to determine user patterns and user attitudes towards a stationary system by conducting an attitude survey with an interval of five years, and in this way have a more correct picture of the attitudes. In getting a more correct picture of this survey, we suggest that you ought to conduct another survey within a couple of years to verify if the users’ attitudes have been changing by dissociating themselves from a mobile IT solution or in having more positive attitudes towards working with a mobile IT solution. Since the time has been limited by the realization of the study, as a result of this, we haven’ t been able to cover as much as we would have wanted to. Among other things, we would like to examine the users’ attitudes in the factors that arise in the study in part two, work practice, to se if these factors influence the users’ attitudes and intentions to adopt a mobile IT solution. Further on, it would be appropriate to develop a prototype in the future according to this work. From a prototype like that, you can verify and see if the factors are valid and if they can be applied in predicting the acceptance of a mobile IT solution. It would also be desirable to evaluate this prototype with users from both the departments which were included in the study. To get a result from which you can generalize, it would also be appropriate to test and evaluate if the result is applicable to corresponding departments within other pharmaceutical companies and within other sectors with similar conditions and requirements.

67
7 References The Agencies of the European Community [Online].
http://europa.eu.int/agencies/emea/index_en.htm Access: 2003. December, 9.
Altman, D. G. (1991). Practical Statistics For Medical Research. Lindon: Chapman & Hall.
Bagozzi, R. P., Davis, F. D. & Warshaw, P. R. (1989) User Acceptance of Computer Technology: A Comparison ot two Theoretical Models. Management Science, 35, pp. 982-1003.
Bell, J. (1995). Introduktion till forskningsmetodik. Lund: Studentlitteratur.
Bellotti, V. & Bly, S. (1996). Walking Away from the Desktop Computer: Distributed Collaboration and Mobility in a Product Design Team. In Proceedings of Proceedings of the 1996 ACM conference on Computer supported cooperative work. pp. 209-218. Boston, Massachusetts, United States. ACM Press
Bly, S. (1997) Field Work: Is It Product Work? Interactions, 4, pp. 25-30.
Bohner, G. & Wänke, M. (2002). Attitudes and attitude change. Hove: Psychology Press.
Davidsson, B. & Patel, R. (1991). Forskningsmetodikens grunder; Att planera, genomföra och rapportera en undersökning. Lund: Studentlitteratur.
Davis, F. D. (1993) User Acceptance of Information Technology: Systems Characteristics, User Perceptions and Behavioral Impacts. International Journal of ManMachine Studies, 38, pp. 475-487.
Davis, F. D. & Venkatesh, V. (2000) A Theoretical Extension of the Technology Acceptance Model: Four Longitudinal Field Studies. Management Science, 46, pp. 182-204.
Ejlertsson, G. (1996). Enkäten i praktiken; En handbok i enkätmetodik. Lund: Studentlitteratur.

68
Eriksson, L. T. & Wiedersheim-Paul, F. (1991). Att utreda, forska och rapportera. Malmö: Liber-Hermods AB.
European Agency for the Evaluation of Medicinal Products [Online]. http://www.emea.eu.int Access: 2004, February, 2.
Heath, C. & Luff, P. (1998). Mobility in Collaboration. In Proceedings of Proceedings of the 1998 ACM conference on Computer supported cooperative work. pp. 305-314.
Holme, I. M. & Solvang, B. K. (1997). Forskningsmetodik; Om kvalitativa och kvantitativa metoder. Lund: Studentlitteratur.
Hughes, J., King, V., Rodden, T. & Andersen, H. (1994). Moving out of the control room: ethnography in CSCW. In Proceedings of CSCW ´94. Chapel Hill. ACM Press
Jolliffe, I. T. (1986). Principal Component Analysis. New York: Springer-Verlag New York Inc.
Kleijnen, M., de Ruyter, K. & Wetzels, M. G. M. (2003). Factors Influencing the Adoption of Mobile Gaming Services. In Mennecke, B. (Ed.), Mobile Commerce: Technology, Theory, and Applications pp. 200-217. Idea Group Publishing
Kristoffersen, S. & Ljungberg, F. (1999). Mobile Use of IT Oslo and Gothenburg: Norweigan Computing Centre and Viktoria Institute.
Kvale, S. (1997). Den kvalitativa forskningsintervjun. Lund: Studentlitteratur.
Körner, S. (1987). Statistisk dataanalys. Lund: Studentlitteratur.
Läkemedelsverket [Online]. http://www.mpa.se Access: 2003, December, 4.
Merriam, S. B. (1994). Fallstudien som forskningsmetod. Lund: Studentlitteratur.
Nah, F. F.-H., Zhao, F. & Zhu, W. (2003). Factors Influencing Users' Adoption of Mobile Computing. In Mariga, J. (Ed.), Managing E-Commerce and Mobile Computing Technologies Book pp. 260--271. Idea Group Inc.

69
Nationalencyklopedin [Online]. www.ne.se Access: 2003, November, 30.
Poole, H. & Van Valley, T. L. (1994). Surveys of computing: a tool for campus planning. In Proceedings of Proceedings of the 22nd annual ACM SIGUCCS conference on User services. pp. 105-110. Ypsilanti, Michigan, United States. ACM Press
Repstad, P. (1999). Närhet och distans; Kvalitativa metoder i samhällsvetenskap. Lund: Studentlitteratur.
Sarker, S. & Wells, J. D. (2003) Understanding mobile handheld device use and adoption. Communications of The ACM, 46, pp. 35-40.
Statistical Computing [Online]. http://www.ats.ucla.edu/stat/overview.htm Access: 2004, January, 23.
Trost, J. (2001). Enkätboken. Lund: Studentlitteratur.
U.S Food and Drug Administration [Online]. http://www.fda.gov/ Access: 2004, January, 15.
Weilenmann, A. (2003). Doing mobility (Doctoral, Department of Informatics, Göteborgs universitet).
Yin, R. K. (1994). Case study research: design and methods. Thousand Oaks: Sage Publications.

70
Appendix A AD – Analytical Development BPR – Batch Production Record; manufacturing documents / batch protocol, where the original data is documented during the manufacturing process. CFR – Code of Federal Regulations CGMP – Current GMP; the conception is mostly used in the US. EMEA – European Agency for the Evaluation of Medicinal Products ER/ES – Electronic Record/Electronic Signature FDA – Food and Drug Administration GCP – Good Clinical Practice GLP – Good Laboratory Practice GMP – Good Manufacturing Practice GXP – General abbreviation for all conceptions of Good Practices IPS - Investigational Products LV – Läkemedelsverket, Swedish Medical Products Agency MBPR – Master Batch Production Record; a given composition for a batch size of an article and also the basis for all manufacturing documentation / batch protocol. MCR – Master Composition Record; a given composition for a quantity/unit of an article, liquid products and also for primary packaging material. MSPR – Master Packaging Record; the basis for all packaging documentation. PAR&D – Pharmaceutical and Analytical R&D PD – Product Development PDA – Personal Digital Assistant; A handheld computerized device QA – Quality Assurance Q&A-manual – The Quality and Compliance Manual within the company SLS – Swedish standard of drugs SOP – Standard Operation Procedure SPP – Study Packaging Plan; planning documentation of a drug study which is established in the beginning of the study. SPR – Study Packaging Record; packaging documentation where original data is documented during the packaging processes. TAM – Technology Acceptance Model; a model of adoption within the information technology area which originates from the TRA model. TRA – Theory of Reasoned Action; model of planned behaviour within the area of social psychology.

71
Appendix B In the following appendix you’ ll find the statements and questions in the questionnaire of the study. In statement 1-24, 26-28 and 32-36 the respondents were given five options; A = Agree, B = partly agree, C = uncertain, D = partly disagree and C = Disagree. The other questions were given answering alternatives, except on question 25, 36 and 43 where the respondents could type in text answers.
Part 1 1. I think it works well printing protocols before the work begins. 2. There is special action taken (due to contamination risk) when carrying in and out
batch protocol/work sheets through the packaging-/manufacturing area. 3. It has happened that documentation after a completed packaging/manufacturing
has been found in the area when you will start a new process. 4. It feels safe signing twice in the documentation. 5. You need to search information about other batch protocols/work sheets (ongoing
and finished) when you are working in the packaging-/manufacturing area. 6. It is hard work with paper documents in the manufacturing-/ packaging process. 7. The logbooks are filled in an unclear way (legibility). 8. The logbooks always contain the right information. 9. It is hard work looking for a filed logging book.
Part 2 10. You can make it easier to perform the work in certain processes by including
automatic controls, instead of one operator and one controller sign together. 11. When calibrating, it would have been easier if documentation had been automatic
in the logging book. 12. It would have been easier if diverse process parameters like temperature, pressure
and different flows could have been registered automatically in a batch protoc0l/work sheet.
13. In controlling supplying material, it would have been easier if measured values and other information that is necessary were registered automatically in the record.
14. It would be easier if reconciliations in the documentation could be done automatically.
15. It would have been easier if information needed for a line-clearance control (date and time) had been registered automatically in the work sheet/batch protocol.
16. It would have been easier if you could identify articles/raw material, instruments etc. with a barcode reader during the proceeding of the work.
17. It would have been easier working with electronic logbooks. 18. It would have been easier if you use a barcode reader to register the activity you
were about to perform and this had been stored automatically. 19. Mistakes that can be made in the documentation could be avoided to a certain
extent by using automatic controls and by transfers to electronical records.
72
21. It would have been desirable if you could print different types of marking labels, for example for bowls, receptacles and reference samples, close to where I am.
22. It would have been easier if you could look for information like SOP, what other sites have in their stocks and old logbooks when you are working in the manufacturing-/packaging area.
23. If we had been working with mobile IT solutions we would have been able to avoid much unnecessary transportation in and out through the manufacturing area.
24. If you would like to add anything or think that we have missed something, please write it down:
25. It is optimal in registering withdrawals of articles/raw material manually on cards in a binder placed in the stock.
26. Managing articles/raw material in the stock would generally be easier if this had been done with a computerized facility.
27. It is hard work being forced to fetch logbooks which are not close to the room/instrument.
28. It would have been easier if there had been a central place where the technical experimental protocols had been stored.
29. It would have been easier in technical experiments if you hadn’ t needed to print the experimental record, but could work with it on a computerized device instead.
Part 3 30. Which techniques do you use today?
a. Stationary computer b. Portable computer c. Tablet pc d. Cellular phone e. Personal Digital Assistant f. If anything else, specify:
31. If you are using a cellular phone, which functions do you use? a. Telephone conversations b. Calendar c. Address book d. SMS e. WAP / Internet f. E-mail g. Games h. Note book i. Camera j. Clock k. If anything else, specify:
32. If you are using a Personal Digital Assistant, which functions do you use? a. Calendar b. Address book c. Note book d. Games e. E-mail

73
f. Internet g. If anything else, specify:
33.
a. I think the cellular phones are too small to handle. b. I think the Personal Digital Assistant is too small to handle.
34.
a. I think the input facility is too hard work to use on cellular phones. b. I think the input facility is too hard work to use on Personal Digital
Assistants.
35. I feel comfortable working with a mobile IT solution. 36. I think working with a mobile solution would make the work at the department
easier. 37. If you have any point of view regarding using a mobile IT solution, please write it
down here:
Part 4 38. Sex?
a. male b. female
39. Age? a. – 20 years b. 21 – 25 years c. 26 – 30 years d. 31 – 35 years e. 36 – 40 years f. 41 – 45 years g. 46 – 50 years h. 51 – 55 years i. 56 – 60 years j. 61 – 65 years k. 66 – years
40. Employment position? a. Team manager b. Scientist c. Senior scientist d. Associate principal scientist e. Principal scientist f. Associate Director g. Research Scientist h. Study Drug Coordinator i. IPS Coordinator j. Study Drug Technician k. Senior IPS Coordinator

74
l. GLP-administrator m. Other employment…
41. Years of employment? a. – 2 years b. 3 – 5 years c. 6 – 8 years d. 9 – 12 years e. 13 – 15 years f. 16 – 18 years g. 19 – 21 years h. 22 – years
42. Department? a. PD b. IPS c. AD d. QA e. Other department
43. Site? a. Site no 1 b. Site no 2 c. Site no 3
44. Do you have any opinion regarding this study, please let us know here: