factors associated with orthodontic pain dclindent thesis
TRANSCRIPT

Factors Associated with Orthodontic Pain
DClinDent Thesis
Victoria Beck
Supervisors
Professor Mauro Farella
Professor Jules Kieser
Professor Murray Thomson
Associate Professor Nicholas Chandler

ii
Table of Contents Acknowledgements ...................................................................................................................................... iv
Abstract ............................................................................................................................................................... v
Table of Abbreviations ................................................................................................................................ vi
Literature Review ......................................................................................................................................... vi
Pain ................................................................................................................................................................... 1
Definitions ................................................................................................................................................ 2
Neural Pathway of Pain ....................................................................................................................... 2
Neural Structures .................................................................................................................................. 4
Nociceptors .............................................................................................................................................. 4
Brainstem and Brain ............................................................................................................................ 5
Trigeminal System ................................................................................................................................ 5
The Autonomic Nervous System ..................................................................................................... 6
The Neurophysiology of Pain............................................................................................................ 8
Neurochemistry of Nociception ..................................................................................................... 10
Neuronal Sensitisation ...................................................................................................................... 11
Pain Modulation by Psychological Factors ................................................................................ 11
State-Dependent Sensory Processing .......................................................................................... 12
Orthodontic Pain ....................................................................................................................................... 14
Factors Influencing Orthodontic Pain ......................................................................................... 16
Measurements of Pain ....................................................................................................................... 25
Elicitation of Pain ................................................................................................................................ 25
Current Study ................................................................................................................................................ 27
Background.................................................................................................................................................. 27
Aims and Objectives ................................................................................................................................. 28
Hypothesis ................................................................................................................................................... 28
Materials and Methods .............................................................................................................................. 29
Data and Collection ................................................................................................................................... 29
Sample ........................................................................................................................................................... 30
Experimental Procedure ........................................................................................................................ 31
Phase One ............................................................................................................................................... 32
Phase Two .............................................................................................................................................. 34
Duration of Testing ............................................................................................................................. 38
Data Analysis ......................................................................................................................................... 38
Results .............................................................................................................................................................. 39
Sample ........................................................................................................................................................... 39

iii
Phase One ..................................................................................................................................................... 40
Phase Two .................................................................................................................................................... 41
Discussion ....................................................................................................................................................... 50
Clinical Implications ................................................................................................................................. 60
Conclusion....................................................................................................................................................... 61
References ...................................................................................................................................................... 62
Appendix I ....................................................................................................................................................... 73
Appendix II ..................................................................................................................................................... 76
Budget ............................................................................................................................................................ 76
Materials and consumables ............................................................................................................. 76
Technical Services ............................................................................................................................... 76
Total .......................................................................................................................................................... 76
Appendix III .................................................................................................................................................... 77
Appendix IV .................................................................................................................................................... 85
Appendix V...................................................................................................................................................... 91
Appendix VI .................................................................................................................................................... 93
Appendix VII .................................................................................................................................................. 96

iv
Acknowledgements
This study was supported by grants from the Foundation for Orthodontic Research and
Education, NZAO (FORENZAO) Charitable Trust and Fuller Scholarship, Sir John Walsh
Research Institute, Faculty of Dentistry, University of Otago.
I would like to sincerely thank:
My research supervisors Professor Mauro Farella, Professor Murray Thomson,
Associate Professor Nicholas Chandler and Professor Jules Kieser - thank you for
sharing your passion for research and immense knowledge with me. You have helped
make this project far more enjoyable than I had anticipated! Also to Tony Merriman and
his team for their help with my genetic testing.
My clinical supervisors: Professor Mauro Farella, Dr Winifred Harding, Dr Chris
Robertson, Dr Suzan Stacknik, Dr Peter Gilbert and visiting lecturer Dr Shari Daniels –
thank you for your patience, guidance and generous donation of your time, as well as for
sharing your enthusiasm for orthodontics with us.
Orthodontic clinic staff – thank you for always being ready for a chat and a laugh, I really
appreciate how hard you ladies work for us!
My classmates Jen and Joe, quite possibly the shortest class ever to graduate - we made
it!! It has been so much fun, I’m really lucky to have such supportive classmates as you.
Josh – your constant support has been incredible throughout this journey.
Amber and Meng – I couldn’t have asked for more from you guys, you are amazing!
To my dog Archie, the best running buddy ever – sorry for ignoring you so much while I
worked on this thesis, I promise there will be a lot more play-time next year!
Mum and Dad – thank you for all your love, support and encouragement. You have
always been my number one supporters, I couldn’t have come this far without you guys
behind me. You have made me the person I am today and I love you so much.
Shaun – thank you for being my rock. Your love and support mean everything to me and
I can’t wait to begin our life together.

v
Abstract
Up to 95% of orthodontic patients report pain during orthodontic treatment, with up to
10% of patients interrupting their treatment due to the pain experienced. Pain is highly
subjective: there is a range of pain response among individuals undergoing orthodontic
treatment, with some patients feeling high levels of pain and others just mild
discomfort. The reasons for this variability are largely unknown. Objective: To
investigate factors that may be associated with orthodontic pain experience. Methods:
First, 107 participants were screened for pain response over 48 hours following
placement of orthodontic elastomeric separators. Second, the highest (n=10) and lowest
(n=10) pain responders were identified and data collected on age, ethnicity, sex, self-
rated oral health, anxiety, mood, dental anxiety and fear, catastrophising, general
sensitivity (cold) and tooth sensitivity. They also provided a saliva sample for Catechol-
O-Methyltransferase (COMT) gene sequencing. Results: Statistically significant
differences between high and low pain responders were identified with the Pain
Catastrophising Scale (PCS), Dental Anxiety Scale (DAS) and Cold Pressor Tests.
Multivariate analysis was carried out using a generalised linear model. The empty
model showed that 39.3% of pain response type (high or low) is explained by the
magnification subcategory of the PCS; once all other variables were controlled for, the
adjusted model explained 80% of the variance in the magnification subscale of the PCS.
Of the three single nucleotide polymorphisms of the COMT gene analysed, only rs6269
showed an association with pain responders’ haplotypes (albeit marginal).
Conclusions: Pain catastrophising, dental anxiety and cold sensitivity appear to modify
orthodontic pain experience. A few simple screening questions may help to identify
patients at risk prior to commencing orthodontic treatment, so that patient-specific
management strategies can minimise orthodontic discomfort.

vi
Table of Abbreviations
Abbreviation Definition
ANOVA Analysis of Variance
ANS Autonomic Nervous System
ATP Adenosine Triphosphate
CNS Central Nervous System
COMT Catechol-O-Methyltransferase
COX Cyclooxygenase
DAS Dental Anxiety Scale
DNA Deoxyribonucleic Acid
EPT Electrical Pulp Tester
LD Linkage Disequilibrium
met Methionine
NS Nociceptive Specific
PANAS Positive and Negative Affect Schedule
PCS Pain Catastrophising Scale
PDL Periodontal Ligament
RCT Randomised Control Trial
RT-PCR Real-Time Polymerase Chain Reaction
SNP Single Nucleotide Polymorphism
STAI Spielberger’s State–Trait Anxiety Inventory
TMD Temporomandibular Dysfunction
val Valine
VAS Visual Analogue Scale
WDR Wide Dynamic Range

1
Literature Review
Pain is an important factor in clinical orthodontic practice, so this section will initially
encompass the basics of pain pathways and systems in the human body. It will begin
with neural pathways of pain (focusing on the trigeminal system); secondly, discussing
the autonomic nervous system (again with particular focus on the trigeminal afferent
pathway); thirdly, background information will be presented on neurophysiology of
pain; nociception; pain modulation; and finally psychological factors that may affect
pain modulation. Lastly, this section will cover orthodontic pain and factors that may
affect this, including genetics and anxiety and means of testing such factors.
Pain
Managing orofacial pain is a concern to clinicians worldwide. Pain is a highly personal
experience, with the degree of pain and suffering reported not always related to the
amount of tissue injury (Okeson and Bell, 2005). Pain cannot be sensed in a detached
manner; it comes in combination with sensations such as dislike, anxiety, fear and
urgency (Muller and Calvo, 2001). Acute symptomatic pain serves a biological function
to warn the individual that something is wrong in the area manifesting the pain,
whereas chronic pathologic pain may serve no clear biological function, but causes
stress (emotional, physical and social) to the sufferer (Sessle, 1987). The ability of
clinicians to treat pain lies in the knowledge and understanding of the various
mechanisms and behavioural characteristics of pain and its manifestations (Okeson and
Bell, 2005).
Pain is more of an experience than just a sensation that registers the nature of the
stimulus, which can be described in terms of quality (such as itchy or sharp), intensity
(such as dull or severe), location (where on the body they feel pain and whether it is
superficial or deep) and duration (such as seconds or days as well as the frequency of
pain). It also has cognitive (the individual’s ability to comprehend and evaluate
significance of experience), emotional (the feelings that are generated), and motivational
(the drive to terminate the pain) dimensions (Okeson and Bell, 2005).

2
Definitions Before proceeding, it is appropriate to define some key terms.
Nociceptors are free nerve endings; in the face and mouth, these are the peripheral
receptors that respond to noxious orofacial stimuli (Sessle, 1987). Nociception refers to
the noxious stimulus originating from the sensory receptor. This information is carried
to the central nervous system (CNS) by the primary afferent neuron (Okeson and Bell,
2005). Pain is defined as the unpleasant sensation perceived in the cortex, usually as a
result of incoming nociceptive input. However, the presence or absence of nociceptive
input does not always relate closely to pain (Okeson and Bell, 2005), because the CNS
can alter or modulate nociceptive input before it reaches the cortex for recognition. This
modulation input can either increase or decrease the perception of pain.
There are three functional components of the brain system (Liebgott, 2001). First, there
is the spinal cord and medulla (or basic reptilian brain), which provide protective reflex
activity against challenges. Second, there are the limbic structures (or mammalian
brain) which are wrapped around the upper portion of the medulla and spinal cord and
provide the individual with instinctive drives and emotions (such as when pain is felt,
the individual will instinctively direct behaviour towards activities to reduce pain and
stimulate pleasure if possible). Finally, the cortex (or human brain) provides the
individual with the ability to reason and think (so the individual can apply meaning and
consequence to the situation). Sensations in the cortex can be influenced by attention,
anxiety and fear (Liebgott, 2001).
Neural Pathway of Pain The nervous system (Figure 1) can be divided into the central nervous system (which co-
ordinates peripheral and autonomic systems) and peripheral nervous systems (which
carries information from musculoskeletal and cutaneous system). The peripheral
nervous system is then further divided into the somatic and autonomic systems. The
latter co-ordinates the activities of visceral structures such as blood flow and breathing
(Okeson and Bell, 2005).

3
Figure 1 The Nervous Systemi
The neural pathway for pain consists of four processes; these are transduction,
transmission, modulation and perception (Kelly et al., 2001). Transduction is where
noxious stimuli causes electrical stimulation in specific nerve endings, the noxious input
is then transmitted via the neural system to the CNS for processing. The neural system
which processes the noxious input consists of three parts; initially the peripheral
sensory nerve primary afferent neuron, which carries the nociceptive input via the
dorsal root, to the dorsal horn in the spinal cord. All cell bodies of primary neurons are
located in the dorsal root ganglion; followed by the second order neuron, which can
involve more than one neuron and carries the input across the spinal cord, and via the
anterolateral spinothalamic pathway, to the thalamus; the final part of the system
involves neural interactions between the thalamus, cortex and limbic system. This is
where modulation occurs, as the cortex and brainstem can control the pain-transmitting
neurons (to enhance or reduce the arriving input). Finally, perception is achieved when
nociceptive input reaches the cortex and a complex interaction of neurons between the
higher centres of the brain occurs and pain behaviours begin (Okeson and Bell, 2005).
i Adapted from http://www.news-medical.net/health/What-is-the-Nervous-System.aspx on 8/4/13
4
Neural Structures Nerves convey electrical and chemical impulses and are comprised of bundles of nerve
fibres (each surrounded by its own connective tissue sheath) which are bound together
by another connective tissue sheath (Okeson and Bell, 2005). Nerve fibres are
comprised of nerve cells (neurons) which have a cell body and a process (axons or
dendrites). Cell bodies which are located outside the CNS are grouped together in
ganglia, and the dendritic processes conduct impulses towards the cell body. Axons are
the central impulse-conducting core of the nerve fibre; they are essentially an extension
of the neuronal cytoplasm (Okeson and Bell, 2005).
Neurons can have any number of axons (and are termed unipolar, bipolar; or multipolar
depending on the number of axons present). Peripheral neurons are unipolar. The axon
then divides into two; the peripheral part extends to terminate at a sensory receptor,
and the central branch passes through the roots of the nerve to terminate in the grey
matter of the CNS.
Depending on their location, neurons are either afferent (conduct impulses towards the
CNS) or efferent (conduct nerve impulses peripherally, away from the CNS). Nerve
impulses are transmitted from neuron to neuron through synaptic junctions (where two
neuronal processes are in close proximity). Afferent synapses are located in the grey
substance of the CNS.
Nociceptors Nociceptors are each responsible for what is known as a receptive field. They are
polymodal, meaning that they can respond to many different stimuli (such as heat or
cold). Two types of nociceptors have been identified. The first is the C-fibre, which is
sensitive to mechanical, chemical and heat stimuli (Dalili, 2009) and conveys a burning
or dull aching pain sensation. C-fibres have a receptive field of 10cm, a diameter of 0.5-
1µm and are unmyelinated, making them slower at conducting impulses. C-fibres are
the most common nociceptor found in the dental pulp (Sessle, 1987); the other type of
nociceptor is the A-delta (A-δ) fibre, which elicits a pricking, sharp pain and is sensitive
to mechanical and heat stimuli (Dalili, 2009). A-δ -fibres are myelinated, so that they
have faster signal transduction (Racich, 2005).

5
Brainstem and Brain Input is carried to higher centres for interpretation via second-order neurons. These
higher centres can be divided into four regions according to their location (from inferior
to superior). The brainstem is made up of the medulla oblongata, the pons and the
midbrain. The cerebellum has an outer part which comprises grey matter, and an inner
part of white matter (Liebgott, 2001). The diencephalon consists mainly of the thalamus
and hypothalamus. The cerebrum is made up of the cerebral cortex, basal ganglia and
limbic structures (Okeson and Bell, 2005).
Trigeminal System Orofacial input does not enter the spinal cord via the spinal nerves, but via the fifth
cranial (trigeminal) nerve (Racich, 2005). The trigeminal spinal tract also receives input
from other cranial nerves (the glossopharyngeal (IX) and vagus (X)) and the upper
cervical nerves (Liebgott, 2001).
The afferent trigeminal nerve cell bodies are in the large Gasserian (trigeminal)
ganglion; they enter directly into the brainstem at the pons to synapse in the trigeminal
spinal tract nucleus (Sessle, 1987), which is structurally similar to the dorsal horn of the
spinal cord.
The brainstem trigeminal nucleus consists of a main sensory trigeminal nucleus which
is located rostrally and receives periodontal and some pulpal afferents. The spinal tract
of the trigeminal nucleus is located caudally and is divided into three parts: the
subnucleus oralis (a significant area in oral pain mechanisms); the subnucleus
interpolaris; and the subnucleus caudalis (which is implicated in trigeminal nociceptive
mechanisms; Miles et al., 2004; Racich, 2005; Sessle, 1987). Evidence points to facial
nociceptive afferents projecting to the subnucleus caudalis; however, the other
subnuclei also play important roles in nociception (Okeson and Bell, 2005). The
trigeminal brainstem complex also has a motor nucleus, which interprets impulses that
demand motor responses, such as the muscles of mastication (Racich, 2005).
Second-order trigeminal neurons project to the thalamus from synaptic junctions with
primary afferents in the subnucleus caudalis (Miles et al., 2004) and at the dorsal horn.
These inter-neurons represent three types of transmission cells. Wide dynamic range

6
neurons receive input from cutaneous and deeper orofacial structures, and respond to
both noxious and non-noxious (such as tactile) stimuli. Nociceptive specific neurons
respond only to input from small-diameter nociceptive fibres (A-δ and/or C-fibres) that
are activated by high-intensity orofacial stimulus applied to a localised receptive field
(Miles et al., 2004). Low-threshold mechano-sensitive neurons, which are usually non-
nociceptive, respond to light tactile stimuli and are excited by strong electrical
stimulation of the dental pulp (Sessle, 1987).
The Autonomic Nervous System The autonomic nervous system (ANS) is made up of the parasympathetic (cranio-sacral)
portion and the sympathetic (thoraco-lumbar) portion. They receive afferent input that
is usually below the level of consciousness (Ranson, 1918). Efferent portions of these
nerves make up the autonomic nervous system, which is again divided into sympathetic
and parasympathetic components. The ANS plays important roles in the control of
phenomena such as arterial blood pressure, digestion, sweating and body temperature,
with most functions occurring continuously and below the conscious level. The ANS can
respond quickly when stimulated, to help adaptation to environmental challenges.
Sympathetic Nervous System Sympathetic nerves originate in the spine between T1 and L2, travelling through the
sympathetic chain and on to tissues and organs. The sympathetic chain is a chain of
ganglia which lie either side of the spinal column. The sympathetic pathway consists of
two neurons, with the body of the preganglionic neuron lying in the intermediolateral
horn of the spinal cord; the postganglionic neuron transmits the impulse to the target
organ or tissue. Some sympathetic nerves pass all the way through the sympathetic
chain without synapsing, to end at the adrenal medulla. Here, modified neuronal cells
are stimulated to secrete adrenaline and noradrenaline into the bloodstream (Okeson
and Bell, 2005).
Some of the postganglionic fibres pass back from the sympathetic chain onto the spinal
nerves. Theses fibres are C-fibres which extend around the body in the skeletal nerves
to control sweat glands, blood vessels, and so on. Approximately 8% of the fibres in
skeletal nerves are sympathetic fibres (Okeson and Bell, 2005); this may have
significance for muscle pain, because pains of muscular origin are a frequent cause of

7
discomfort in the head and neck (Miles et al., 2004). Thus, the possibility of orofacial
pain being muscular (rather than dental) in origin must always be taken into account.
Parasympathetic Nervous System The parasympathetic system is made up of fibres from cranial nerves III, VII, IX, and X,
as well as fibres from the second and third sacral spinal nerves. Most parasympathetic
fibres (approximately 75%) are in the vagus nerve (X), which innervates the thoracic
and abdominal regions (Okeson and Bell, 2005). In the orofacial region,
parasympathetic fibres travel with cranial nerve III to pupillary sphincters and ciliary
muscles, cranial nerve VII to the lacrimal, nasal and submandibular glands, and cranial
nerve XI to the parotid gland (Liebgott, 2001).
The parasympathetic nervous system is also made up of two types of neuron; however,
the pre-ganglionic fibre travels all the way to the target organ, where it synapses with
the post-ganglionic neuron in the wall of the organ.
The ANS maintains proper function of the body by having both the sympathetic and
parasympathetic systems constantly active at a low level (Jänig and McLachlan, 1992;
Okeson and Bell, 2005). This also allows for rapid adaptation to environmental
challenges (the fight or flight reaction).

8
Figure 2 Sensory fields of the Trigeminal nerve branches ii
Trigeminal Afferent (parasympathetic sensory) Pathway The main afferent nerve for orofacial somatic sensation is the trigeminal nerve (V),
which divides into three sensory branches (Liebgott, 2001) and has a sensory field from
vertically in front of the ears and across the top of the head, as shown in Figure 2ii. The
ophthalmic division (V1) supplies the parietal and frontal areas as well as the upper
eyelid and nasal bridge. The maxillary division (V2) supplies the anterior portion of the
temple, malar and maxillary areas, as well as the lower eyelid, alar of nose and upper lip
(Liebgott, 2001).
Intraorally, V2 supplies the palate, maxillary process and associated teeth, periodontium
and gingiva and some of the posterior buccal mucosa. The mandibular division (V3)
supplies the posterior temple, tragus, preauricular area, masseter, lower lip, external
auditory canal and mandibular area (excluding the angle of the mandible). Intraorally,
V3 supplies the anterior two-thirds of the tongue, mandibular teeth, the periodontium
and overlying gingiva and mucosa of the floor of the mouth (Liebgott, 2001).
The Neurophysiology of Pain The neurophysiology of pain encompasses how neural impulses are transferred from
one neuron to another from peripheral receptors to the CNS and back out again to
receptor organs for appropriate action.
ii Adapted from: http://www.minclinic.ru/pns/pns_eng/trigeminus_eng.html on 17/09/11.

9
Nerve Action Potential Impulses received from the dendrites are carried down the axon as an action potential.
This comprises a change in the charge on the cell surface, which opens the sodium ion
channels on its surface, leading to depolarisation, which is followed by a return to its
resting state and repolarisation. This process continues down the sensory pathway until
it reaches the CNS.
The signal is transmitted between neurons via junctions called synapses (often where
there is contact with dendritic processes), and impulses are carried across to cause an
action potential and subsequent depolarisation of the next neuron. There are chemical
and electrical synapses, but the CNS predominantly comprises chemical synapses
(Okeson and Bell, 2005). As the afferent input ascends to higher centres, it can be
modulated by the brainstem or cortex (as discussed in “Neural Pathways of Pain”
section). This is known as the gate control theory, where the signal can be blocked,
transmitted, or modified at different central regions (Melzack, 2001).
Ion Channels Synaptic membranes contain many ion channels, of which there are three main types.
The first type, voltage-gated ion channels, are the basic component of the membrane’s
ability to rapidly depolarise, allowing positively and negatively charged ions to pass in
and out of the cell, via sodium, potassium and calcium channels (Armstrong and Hille,
1998). The second type of ion channels are G-protein-linked ion channels, which have
receptors which are activated by mediators (e.g. bradykinin and prostaglandins) which
stimulate intracellular messengers, leading to slow opening of the ion channels (Hepler
and Gilman, 1992). Third, there are ligand-gated ion channels, where ligands (for
example ATP) act as mediators and cause the opening of channels (Hucho and Weise,
2001).
Neurotransmitters Neurotransmitters are the chemical mediators released by the pre-synaptic neuron into
the synaptic cleft; they activate ion channels. The two types of neurotransmitters are
small, fast-acting neurotransmitters and larger, slow-acting neuropeptides.
These small, rapid-acting molecules lead to acute responses of the nervous system.
Examples include: acetylcholine, noradrenaline, glutamate, dopamine and serotonin.
Acetylcholine, noradrenaline and glutamate usually have an excitatory effect on the

10
post-synaptic neuron, yet dopamine normally has an inhibitory effect. Centrally,
serotonin potentiates endorphin analgesia and peripherally it is a neurovascular
algogenic (pain-causing) agent (Okeson and Bell, 2005).
The large, slower-acting neuropeptides are manufactured in ribosomes and transported
to the synapse for release. Examples of these include substance P, endorphins and
bradykinin. Substance P is a polypeptide that is released at the primary terminals of
nociceptive A-δ and C-fibre afferents (including in dental pulp nerve fibres) and acts as a
transport substance, exciting wide dynamic range (WDR) and nociceptive specific (NS)
neurons (Sessle, 1987) in the dorsal horn. Substance P has a rapid and short-lived
action as a strong vasodilator, promoting oedema and the release of histamine—which
is also an excitatory neurotransmitter that promotes vasodilation and oedema—from
mast-cells (Besson, 1999). Endorphins are polypeptides that bind to morphine
receptors and cause a dulling of pain, thus acting as “endogenous opiates” (Amir et al.,
1980; Sessle, 1987; Zubieta et al., 2003). Bradykinin is released during inflammation
and ischaemia, and is an algogenic agent that excites all receptors and sensitises high-
threshold receptors so that they respond to otherwise sub-threshold stimuli
(hyperalgesia). It requires the presence of prostaglandins to act (Chapman and
Dickenson, 1992; Mizumura et al., 2009). There is a lot of interaction between
neurotransmitters in pain modulation; for example, endorphin is potentiated by
serotonin, which is only released in the presence of dopamine (Okeson and Bell, 2005).
Following the release of a neurotransmitter into the synapse, it is eliminated via various
means. These include diffusion, where the neurotransmitter diffuses out of the synaptic
cleft; enzymatic destruction, by enzymes that are either already present or are released;
or reuptake, which can include active transportation back into the presynaptic terminal
for re-use e.g. noradrenaline in the sympathetic nervous system (Okeson and Bell,
2005).
Neurochemistry of Nociception Peripheral nociceptors can be activated by thermal, chemical and mechanical
stimulation. Once stimulation has been removed, the most likely reason for continued
nociceptive input is neurochemical substances accumulating near the nociceptor.
Sources of these neurochemicals can include the damaged cell (via leakage of

11
intracellular substances), plasma extravasation, lymphocyte migration or the nociceptor
itself, for example, by releasing substance P.
Histamine and potassium are known to be released from damaged tissues, and they can
activate or sensitise the nociceptor. Bradykinin is known to induce the thermal
sensitisation of polymodal nociceptors (Kumazawa et al., 1991).
In regions of tissue damage, metabolites of arachidonic acid are synthesised. These are
inflammatory mediators. Prostaglandins are one type of inflammatory mediator. They
are not algogenic substances, but help to sensitise nociceptors, effectively reducing pain
thresholds (Besson, 1999). Prostaglandin E2 is metabolised from arachidonic acid via
the enzyme cyclooxygenase (COX), which has two isomers: COX1 (which produces
prostaglandins that aid normal physiologic functioning) and COX2 (present in most
tissues, it produces prostaglandins involved in inflammation). Thus, if COX2 is inhibited,
the inflammatory reaction is reduced, reducing pain (Besson, 1999). The presence of
prostaglandins is required for bradykinin to act; this in turn stimulates the release of
prostaglandins, each effectively potentiating the other. Another important metabolic
part of the arachidonic pathway is the lipoxygenase pathway, which produces
leukotrienes (Lewis et al., 1990). Leukotriene B4 causes hyperalgesia which is not
inhibited by COX inhibitors.
Neuronal Sensitisation Following the release of excitatory neurotransmitters into the synaptic cleft, excitation
of the post-synaptic neuron and carriage of the impulse down the axon, excitatory
neurochemicals may remain in the synaptic cleft. This will lead to the neuron being
depolarised more easily when neurotransmitters are next released, via a lowering of the
excitatory threshold. This leads to greater sensitivity of adjacent primary afferent
neurons so that even light mechanical stimulation may cause depolarisation (Besson,
1999; Miles et al., 2004; Racich, 2005). This process is known as neuronal sensitisation.
Pain Modulation by Psychological Factors Pain experienced can be influenced positively and negatively by the psychological state
of the individual (Sessle, 1987). It can be increased by such psychological excitatory

12
factors as the attention paid to the injury (Okeson and Bell, 2005), the individual
expecting pain, usually based on past experiences (Arntz et al., 1990; Bergius et al.,
2000), anxiety and fear as a result of previous pain experiences (Bergius et al., 2000;
Klages et al., 2004; Klages et al., 2006), and depression (Keefe et al., 2001). Conversely,
some inhibitory factors can include increasing patients’ expectations that a drug will
produce powerful analgesia or a “placebo effect” (Miles et al., 2004), attention being
directed away from the injury (distraction), and confidence and assurance (Loggia et al.,
2008).
Psychological factors which are associated with poor adjustment to pain include anxiety
(Litt, 1996; Sergl et al., 1998), pain catastrophising, and pain-related anxiety or fear of
pain. Pain catastrophising relates to the individual’s tendency to focus on pain, along
with an inability to deal with it (Keefe et al., 2001). Previous studies have shown that a
high level of dental anxiety mirrors a strong influence of fear of both specific and
general painful objects and situations (Litt, 1996).
State-Dependent Sensory Processing The way in which the CNS receives, modulates and interprets input can be complicated
further by the state of the dorsal horn when the nociceptive input arrives. Mechanical,
chemical, or thermal threats to tissue integrity cause nociceptive neurons to increase
their discharge rate, and there are four states described (Woolf and Doubell, 1994).
First, there is the basal state (Carr and Goudas, 1999), where processing of the
nociceptive input follows the normal pattern; for example, low-intensity stimuli
activates only low-threshold primary afferent neurons and is interpreted as innocuous
(touch, warmth, vibration). Reaction to noxious stimuli elicits reflex and behavioural
avoidance responses. Second, there is the suppressed state, where stress-induced
analgesia reflects the bilateral descending inhibition of neural activity from the
brainstem to spinal level and the analgesic and anti-inflammatory effects, such as β-
endorphin (Carr and Goudas, 1999). In this situation, a high-intensity nociceptive
stimulus will fail to evoke the sensation of pain. This is also known as hyposensibility
and can help individuals during fight-or-flight to reduce pain sensation from injuries.
Third, there is the sensitised state, where the excitability of cells in the spinal tract
nucleus is markedly increased with the sensitised nociceptors having an increased rate

13
of discharge, a lowered stimulus threshold, a supranormal increase in discharge rate
with each increase in stimulus strength, or a combination of these changes (Carr and
Goudas, 1999). At the site of injury, inflammatory mediators (such as prostaglandins),
neurotransmitters, and growth factors surround sensitised nociceptors so that a low-
intensity input will elicit pain (allodynia) and noxious input will be exaggerated
(secondary hyperalgesia). This may also play a part in survival, because it may help an
individual to protect an injured body part from further trauma during healing (Carr and
Goudas, 1999). Finally there is the reorganised state. In this mode, there is a structural
reorganisation of synaptic circuitry in the spinal tract nucleus, where axons may have
atrophied or died as a result of injury to the nervous system. This alters the way in
which input is processed, and it may result in neuropathic pain long after the injury
heals (Woolf and Doubell, 1994). The first three modes represent normal, healthy
functioning, and transitions between these modes occur in response to different types,
intensities and qualities of input (Okeson and Bell, 2005).

14
Orthodontic Pain
Literature shows that up to 95% of orthodontic patients report pain at some stage
during their treatment (Bergius et al., 2008), beginning with initial discomfort when
orthodontic force is applied, but which disappears immediately. The second response
appears much later, with peak intensity on day one or two and lasts a few days (Jones
and Chan, 1992). This was demonstrated in a Swedish study, where 87% of patients
reported pain on the first evening after elastic separators were placed between their
teeth, with pain reaching a maximum score after 24 hours, as rated on a visual analogue
scale (Bergius et al., 2002). The pain generally begins to subside after 48 hours and
decreases to pre-application levels within seven days (Krishnan, 2007); however, up to
10% of patients will discontinue their treatment due to the pain experienced (Patel,
1989).
Orthodontic forces are designed to move teeth. Pain is thought to be caused by a range
of orthodontic procedures, such as separator placement, archwire placement and
activations (Krishnan, 2007). It has been reported that orthodontic procedures will
reduce the proprioceptive and discriminating abilities of patients for up to four days,
which results in lowering of the pain threshold and disruption of normal mechanisms
associated with proprioception input from nerve endings in the periodontal ligament
(PDL; Soltis et al., 1971). The forces applied to teeth also cause compression of the PDL,
leading to pressure, ischaemia, inflammation and oedema in the PDL space (Krishnan,
2007). Periodontal nerve endings consist of low-threshold mechano-receptors and
nociceptors. Pain is initiated via compression and stretch of the low-threshold
mechano-receptors, whereas nociceptors are activated by tissue injury or heavy forces
(Fujiyoshi et al., 2000). Orthodontic tooth movement may initiate mechanically-induced
inflammatory responses in the periodontium (Yamashiro et al., 1998), stimulating the
release of neuropeptides such as prostaglandin and substance P from peripheral nerves
(Krishnan, 2007). The level of prostaglandin in the periodontium peaks at
approximately 24 hours and gradually subsides over the next few days, to reach base
level again by 7-14 days (Yamashiro et al., 1998).
Fujiyoshi et al. (2000) described two different responses during experimental tooth
movement. The initial response, within the first two hours of force application, occurs at
the ipsilateral medullary dorsal horn and then quickly disappears. This reaction may be

15
due to compression of the PDL (Bergius et al., 2000). The second response appears
around four hours after the application of orthodontic force; it occurs at the trigeminal
subnucleus oralis and lasts for up to a few days. This response has been called
hyperalgesia of the periodontal ligament and is due to a greater sensitivity of nerve
fibres to noxious stimuli, such as prostaglandins, histamines and substance P (Besson,
1999; Bergius et al., 2000; Miles et al., 2004). In a cat model, substance P appeared in
the dental pulp within three hours, but later in the PDL (24 hours to 14 days), mainly at
sites of compression (Nicolay et al., 1990).
It has been suggested that, due to the greater tenderness to pressure of the teeth
involved, pain may also be due in part to a mild pulpitis reaction (Bergius et al., 2000)
caused by periodontal inflammatory mediators spreading and diffusing into the pulp
(Dalili, 2009). Pain can also be due to soft tissue injury from fixed orthodontic
appliances (Scheurer et al., 1996).
The trigeminal nerve supplies sensory innervation to the teeth, with unmyelinated (C-)
fibres located in the pulp, providing dull, poorly-localised, lingering pain, whereas
myelinated (mostly A-δ) fibres are located in the dentine or pulpal periphery and
provide brief, localised, sharp pain (Chaudhary et al., 2001).
There appears to be a variable response among individuals undergoing orthodontic
treatment (Ngan et al., 1989; Krishnan, 2007; Bergius et al., 2008), with some patients
feeling high levels of pain and others just mild discomfort, despite similar sex, race and
age.
In a small study of 24 patients over the initial 16 days following placement of fixed
appliances, there was no correlation between the total discomfort experienced and the
severity of dental crowding. There was also no difference in the amount of crowding
when patients were compared by pain response type (none, mild moderate or severe
pain; Jones and Richmond, 1985). The same authors also conducted a randomised
control trial of pain and discomfort during orthodontic treatment of two initial aligning
wires (Japanese nickel titanium 0.014’ diameter and multi-stranded stainless steel
0.015’ diameter). They again concluded that the severity of initial dental crowding had
no influence on the pain experienced and also found that there was no difference in the
prevalence, intensity and duration of pain between the two initial archwires (Jones and

16
Chan, 1992). Comparing a 2x4 appliance, single arch and two arch appliances, no
statistically significant differences have been found in reported pain frequency, general
intensity of pain, tooth pain, discomfort when biting and chewing, and analgesic
consumption. Overall, upon placement of the archwire, more pain has been reported
from anterior than posterior teeth; this may be due to levelling of the arches, because
the anterior teeth are more involved and have smaller root surfaces (Scheurer et al.,
1996); however, following placement of separating elastics, more discomfort from
posterior teeth was reported (Ngan et al., 1989).
Factors Influencing Orthodontic Pain There have been few studies of pain experience during orthodontic treatment, fewer on
possible modifying factors which may predispose individuals to experience more pain
during treatment, and no studies into the possibility of COMT gene influence. There are
some factors that have been identified as influencing orofacial pain, which some believe
may also influence orthodontic pain.
Age There appear to be conflicting findings with regard to age differences in orthodontic
pain experience. This may be due to different treatment approaches; for example, a
patient in the mixed dentition may not receive the same appliance as older patients
(Bergius et al., 2000; Krishnan, 2007). Ngan (1989) found no statistically significant
difference in relation to treatment with fixed appliances between adolescents and
adults. However, Scheurer (1996) reported the most pain in the 13-16 age group, while
other orthodontic studies reported that the older the patient, the greater the pain
reported (Jones and Chan, 1992; Bergius et al., 2008), the greater the pain sensitivity
(Jones, 1984), and the lower the pain tolerance (Walsh et al., 1989).
Sex Orofacial and dental pain does tend to show statistically significant differences between
sexes (Krishnan, 2007; Svensson et al., 2011), with women reported as having lower
pain thresholds and reporting more pain (Woodrow et al., 1972; Walsh et al., 1989). It
has been proposed that sex-dependent differences in pain sensitivity may be due to
evolutionary pressure for women to be more aware of environmental threats against
their offspring (Diatchenko et al., 2007). Sex differences have also been reported in the
orthodontic literature (Scheurer et al., 1996; Bergius et al., 2002; Krishnan, 2007);

17
however, this is controversial, because there seem to be very few statistically significant
associations reported between sex and orthodontic pain (Ngan et al., 1989; Jones and
Chan, 1992).
Ethnicity The term ethnicity distinguishes between groups of people based on behaviour and
culture as well as physical characteristics; it includes what is usually categorised as race
(for example Asian), but also refers to characteristics that are of social, psychological,
cultural, and political nature (Edwards et al., 2001).
Some dimensions of pain are universal but others are learned. Some cultures encourage
stoical attitudes and behaviour (Bergius et al., 2000). In some other cultures, individuals
are encouraged to openly express their responses (Krishnan, 2007) and receive
sympathy and attention for this behaviour (Bergius et al., 2000).
Social factors, such as differences in socioeconomic status, can influence access to health
care, so that some ethnic groups do not receive adequate pain relief due to inadequate
medical treatment (Edwards et al., 2001). Under-treatment of pain in Hispanic patients
(relative to non-Hispanic Caucasian patients) has been previously reported to be at high
levels in Emergency Department settings of American hospitals (Todd et al., 2000). Long
term under-treatment of pain has been shown to produce increased psychological
strain and reduced coping levels, as well as high levels of sympathetic nervous system
activation. This may reduce an individuals’ ability to cope with acute or persistent pain
(Edwards et al., 2001).
Anxiety and Fear Dental anxiety or previous negative dental experiences can increase the risk of
reporting pain (Bergius et al., 2008; Mobilio et al., 2011) and psychological factors, such
as anxiety (De Jongh et al., 1994; Newton and Buck, 2000; Fuentes et al., 2009; Armfield,
2010b) and dental fear (Vassend, 1993; Armfield, 2010a; b) have been associated with
more pain during dental procedures.
It has been shown that dental anxiety lowers the pain threshold and can lead to the
perception of normally non-painful stimuli as painful, and that a high level of dental
anxiety mirrors a strong influence of fear of both specific and general painful objects
and situations (Vassend, 1993; Litt, 1996). When anxiety sensitivity is combined with

18
high dental fear, pain perception is increased (Klages et al., 2006), because fearful
patients have also been shown to expect and experience more pain in dental situations
than less fearful patients (Klages et al., 2004; Klages et al., 2006). There are also genetic
influences on anxiety disorders (discussed below).
An efficient, reliable and sensitive means to measure anxiety as a general aspect of
personality (trait) and anxiety as a response to a specific situation (state) is
Spielberger’s State–Trait Anxiety Inventory (STAI; Appendix IV). This 40-item Likert-type
frequency scale (responses are scored along a range) questionnaire is divided into two
20 question parts, with state anxiety questions assessing the transitory emotional state
of the individual, which may be characterised by feelings of tension, apprehension and
increased autonomic nervous system activity. The trait anxiety questions measure
relatively stable individual differences in anxiety-proneness (Spielberger et al., 1970;
Newton and Buck, 2000).
Dental anxiety is commonly measured using the Corah Dental Anxiety Scale (DAS;
Appendix IV), which is a four-item measure in which participants are asked about
dentally related situations (Newton and Buck, 2000). It has been shown to have both
high reliability and test-retest stability when assessing dental anxiety (Corah, 1969;
Corah et al., 1978).
An American study of pain after placement of orthodontic appliances used a group of
129 patients who were randomly divided into three groups and all told to “expect some
pain and discomfort” (Bartlett et al., 2005). They also received a standardised set of oral
and written instructions about general orthodontic care. The first group also received a
structured telephone call demonstrating care and reassurance; the second group
received an attention-only telephone call thanking them for participating in the study;
and the third group, the control, received no telephone call. The findings showed that a
telephone call from a health-care provider within 24 hours of orthodontic appliance
placement significantly reduced patients’ self-reported pain and anxiety, illustrating
that the content of the telephone call was not important, yet it led to a decrease in
anxiety and therefore a reduction in pain.

19
Mood The Positive and Negative Affect Schedule (PANAS; Appendix IV) measures the two
primary dimensions of mood (positive and negative affect) in a reliable, valid and
efficient way (Watson et al., 1988).
Self-rated Oral Health Locker’s Global Item (Appendix IV) is a self-rating of patients’ oral health and is scored
on a Likert-type frequency scale (Locker, 1988; Locker et al., 2004). A higher score
indicates worse oral-health-related quality of life. Locker (2004) stated that, when
discussing oral health, the focus is not on the oral cavity itself but on the individual and
the way in which oral diseases, disorders and conditions, whether confined to the oral
cavity or linked to other medical conditions, threaten health, wellbeing and the quality
of life. One described measure of quality of life focuses on physical functioning,
psychological wellbeing and pain and discomfort, showing how tightly psychological
wellbeing is linked to pain and discomfort through an individuals’ health status
(Stewart and King, 1994).
Catastrophising Catastrophising is defined as “an individual’s tendency to focus on and exaggerate the
threat value of painful stimuli and negatively evaluate one’s own ability to deal with
pain” (Rosenstiel and Keefe, 1983). It is a multifactorial concept, comprising rumination
(“I keep thinking about how much it hurts”), magnification (“I wonder whether
something serious may happen”), and helplessness (“It’s awful and I feel it overwhelms
me”; Sullivan and Neish, 1998). The Pain Catastrophising Scale (PCS; Appendix IV)
evaluates any exaggerated negative orientation toward noxious stimuli (such as
helplessness and inability to cope effectively with pain), identifying individuals who
may be susceptible to heightened distress responses. It has been shown to be a reliable
and valid measure of catastrophising (Sullivan et al., 1995).
There is an apparent relationship between catastrophising (Sullivan and Neish, 1998;
Keefe et al., 2001; Sullivan et al., 2006), heightened pain behaviour (Sullivan and Neish,
1998) and also more intense pain (Sullivan et al., 1995). Catastrophisers were shown to
report more negative pain-related statements during a cold pressor test (discussed
later) than non-catastrophisers (Sullivan et al., 1995). There have been no studies of the
relationship of catastrophising to orthodontic pain experience, but it has been shown

20
that there is an association between catastrophic thinking and dental anxiety (De Jongh
et al., 1994). A Canadian study of catastrophising, anxiety and pain during dental
hygiene treatment found that an excessive focus on pain sensations played an important
role in the experience of pain, and that the heightened pain experience of
catastrophisers may lead them to become dentally anxious (Sullivan and Neish, 1998).
The study found that the rumination subscale of the PCS contributed significant unique
variance to the prediction of pain.
Both dispositional and situational studies have shown an effect of sex on pain
catastrophising (Sullivan et al., 1995; Sullivan et al., 2000), with differences observed in
the rumination and helplessness subscales, but not the magnification subscale. An
American study into catastrophising as a mediator of sex differences in pain showed
that women tend to report higher levels of catastrophising, along with more recent
painful experiences, lower pain thresholds and tolerances; yet, after controlling for
catastrophising, the sex disparity was somewhat diminished (Edwards et al., 2004).
This association was shown again in a Canadian study, but, after PCS scores were
statistically controlled for, sex was no longer associated with pain (Sullivan et al., 2000);
thus, catastrophising may act a as a confounder, explaining some of the sex disparities
in pain experiences. To date, no study has reported higher catastrophising levels in men.
Pain Sensitivity Individual variation can potentially occur at any stage in pain processing, ranging from
the peripheral nociceptor, through pain-regulating mechanisms in the brainstem and
spinal cord, to the psychological and cognitive processes involved in interpreting and
experiencing pain (Nielsen et al., 2009).
The Catechol-O-Methyltransferase (COMT) gene Human cells have 46 chromosomes, located in the nucleus of the cell. These provide the
information required for a functioning individual. Chromosomes consist of strands of
deoxyribonucleic acid (DNA), which can be further divided into subunits known as
nucleotides. Genes are specific series of nucleotides within a strand of DNA (Kardos and
Kieser, 2000).
An allele is one of a number of alternative forms of the same gene for a character
producing different effects. Sometimes, different alleles can result in different

21
observable or phenotypic traits, such as different pigmentation. However, many
variations at the genetic level result in little or no observable variation. Haplotypes are
the particular combinations of alleles observed in a population. When a new mutation
arises, it happens on a specific chromosomal haplotype (Gabriel et al., 2002).
Individual sensitivity to pain is believed to be genetically determined by many genes
which influence the pain perception pathway. Despite the small effects of individual
genes, interactions between genes and environment play a big part in pain modulation.
One important gene in this process is the COMT gene. The role of the COMT gene has
been well established for individual susceptibility to orofacial pain (Diatchenko et al.,
2005) and temporomandibular dysfunction (TMD; Slade et al., 2008), but there have
been no studies into its possible influence on orthodontic pain.
Located on the long arm of chromosome 22, the COMT enzyme regulates levels of
catecholamines and encephalins (Andersen and Skorpen, 2009). It acts as a key
modulator in dopaminergic and adrenergic/non-adrenergic neurotransmission, which
is characterised by heightened sensitivity to noxious stimuli and affects approximately
15% of the American adult population (Slade et al., 2008). Substitution of valine (val) by
methionine (met) at codon 158 (val158met) causes a difference in thermostability,
leading to a three- to four-fold reduction of activity in the COMT enzyme. This
substitution is also known as single nucleotide polymorphism (SNP) rs4680. Two other
synonymous haplotypes of COMT (rs4633 and rs4818), combined with the val158met
SNPs, can lead to a 30-fold difference in enzymatic activity related to pain sensitivity
(low enzymatic activity leads to high pain sensitivity - to be discussed later; Diatchenko
et al., 2007). Protein regulation is controlled by interaction between three alleles in
these haplotypes. A further SNP (rs6269) has been implicated, along with the previous
three SNPs, in contributing to a higher risk of developing TMD (Slade et al., 2008).
Three rs4680 (val158met) genotypes have been identified to be associated with pain
sensitivity phenotypes: high pain sensitivity, average pain sensitivity and low pain
sensitivity (Andersen and Skorpen, 2009). In a recent study, these were shown to
encompass 96% of examined genotypes (Diatchenko et al., 2005). The alleles are co-
dominant, so that the val/val genotype has the highest COMT activity and the met/met
genotype has the lowest COMT enzyme activity, and lower thermostability due to a

22
difference in COMT molecular structure (Lotta et al., 1995). Heterozygous individuals
are intermediate (Zubieta et al., 2003). In the high pain sensitivity met/met genotype, a
variation has been associated with low enzymatic activity of COMT (leading to high pain
sensitivity due to more neurotransmitters being present to bind to excitatory receptors
following noxious stimuli), as well as diminished activation of µ-opioid system (reduced
analgesia) (Slade et al., 2008). Both homozygous genotypes are common, with the
met/met allele frequency reported to be around 42% in US Caucasians (Enoch et al.,
2003).
Within the CNS, there are several opiate receptors (µ, δ and κ) involved in pain and its
control (Sessle, 1987). One of the functions of the COMT enzyme is metabolising
catecholamines (such as dopamine, epinephrine, and norepinephrine) which are
secondarily involved in the modulation of pain, via the endogenous opioid pathway. The
level of COMT activity by different genotypes influences the functions regulated by
neurotransmitters, such as the µ-opioid pathway, which is activated in response to
prolonged (not acute) stressors and pain, and acts to reduce pain and stress responses.
Polymorphisms in COMT have been shown to be associated with resistance to the
effects of analgesics. Polymorphisms can result in lower morphine efficacy (Kolesnikov
et al., 2011). The COMT haplotype has recently been shown to be associated with the
efficacy of the β-adrenergic antagonist propranolol for pain reduction in patients with
TMD (Tchivileva et al., 2010). Four COMT SNPs have been identified (rs6269, rs4633;
rs4818; rs4680) that may contribute to a haplotype characterised by differences in
COMT metabolic enzyme activity (Diatchenko et al., 2006) that are inversely correlated
with alterations in pain perception (Young et al., 2012).
The application of orthodontic force may be seen as a prolonged pain challenge. Even
moderate levels of pain, as they become sustained, can become a significant physical
and emotional stressor, activating the µ-opioid neurotransmitter responses and
subsequent compensatory changes in µ-opioid receptor binding (Zubieta et al., 2003).
This pathway generally only becomes activated with prolonged, non-acute pain, so that
individuals with the met/met genotype (high pain sensitivity) undergoing orthodontic
treatment will most likely experience greater discomfort or pain during treatment
(Slade et al., 2008).

23
Recently, Michelotti and colleagues (Michelotti et al., 2013) investigated the role of the
COMT enzyme as a risk factor for chronic TMD pain. A statistically significant difference
in SNPs genotype frequencies between 50 patients affected by chronic TMD pain and
the 132 controls was found for the polymorphisms rs165656 (P =0.001). They also
investigated a new SNP rs4646310, which was shown with logistic regression analysis
to confer an increased risk of chronic TMD pain of 5.3. There was no statistically
significant difference between TMD patients and controls for rs4680 or rs6269 SNPs.
Linkage disequilibrium (LD) refers to correlations among neighbouring alleles, reflecting
'haplotypes' descended from single, ancestral chromosomes (Reich et al., 2001).
Because disease mutations are inherited by individuals who share a common, distant
ancestor, they will also share a region of the ancestor’s haplotype from where the
disease mutation originated. Markers within this shared haplotype are associated with
the disease, and each other, and are in “linkage disequilibrium” (Abecasis and Cookson,
2000). Linkage disequilibrium mapping presents a powerful analysis for the mapping
and detection of genes with a modest effect on risk (Li et al., 2000). LD between several
COMT SNPs associated with orofacial pain is shown in Figure 3.
Figure 3 Linkage disequilibrium of COMT SNPs associated with orofacial pain iii
It has been shown that, during the follicular phase of women’s menstrual cycles (days 1-
13), oestradiol levels are at their lowest, and have the least effects on COMT
transcription (oestrogen can inhibit COMT gene transcription; Enoch et al., 2003).
COMT plays a significant role in metabolisation of basal ganglia dopamine in humans,
iii Information was generated by the Merriman lab using publically-available genotype data from the 1000 Genomes project and Haploview software.

24
and the amygdala has been implicated in the µ-opioid receptor-dependent, stress-, and
fear-induced analgesia and emotional regulation (Zubieta et al., 2003). The three COMT
haplotypes may account for approximately 11% of variation in pain perception; this is
quite considerable (Diatchenko et al., 2005). A different SNP of COMT (rs740603)
showed an association with maximum post-operative pain following dental extraction
(Kim et al., 2006).
As an aside, on a small sample of 29 healthy participants, Zubieta et al. (2003) found
that in response to a sustained pain challenge (internal emotional state was measured
using the PANAS and pain was measured using the McGill Pain Questionnaire), there
were higher negative affect scores in individuals with the lowest (met/met) COMT
activity, followed by heterozygotes and val/val homozygotes. Enoch et al. (2003) found
no association between the rs4680 genotype and the Spielberger State anxiety scores in
401 US participants.
Stein et al. (2005) genotyped 497 undergraduate students for three common COMT
polymorphisms (including rs4680) that combine to define a haplotype that is associated
with reduced COMT activity in the human brain. Individuals with the chromosome
22q11 micro-deletion in the COMT gene have a high frequency of mood disorders,
including anxiety (Enoch et al., 2003). Anxiety-related traits (such as high neuroticism)
were associated with rs4680 and rs737865 (located in the first intron) polymorphisms.
The rs4680 polymorphisms have been associated with a variety of personality traits,
such as harm avoidance and neuroticism (Enoch et al., 2003).
There is sexual dimorphism in anxiety disorders, with generalised anxiety disorders
being more common in women (Runeson and Rich, 1994). Studies on mice have shown
that COMT-deficient female mice (but not males) display greater anxiety. In humans,
women have been shown to have significantly lower COMT activity than men (this could
be due to the fact that oestrogen can inhibit COMT gene transcription), which may lead
to an increased vulnerability to anxiety disorders when COMT gene expression is below
a minimum threshold (Enoch et al., 2003). In a study of 58 patients undergoing
arthroscopic shoulder surgery, high pain catastrophising and low COMT activity were
associated with higher pre-operative ratings and a greater risk of experiencing
persistent pain following surgery (George et al., 2008b).

25
Genetic phenotyping shows great promise in the future of orthodontic treatment,
because clinicians may better predict which of their patients may have greater pain
experience, as well as being able to provide a more individualised approach to their
analgesic regime, especially with opioids.
Measurements of Pain Orthodontic pain has been simulated in previous clinical studies by placement of elastic
separators, mesial and distal to first molar teeth, to allow assessment of pain perception
as well as creating a simple homogenous research model, because this procedure is
often the start of orthodontic treatment (Ngan et al., 1989; Bergius et al., 2002).
One way to assess potential clinical pain is by assessment of experimental pain
thresholds and tolerance. Pain tolerance is defined as the highest level of pain stimulus
at which the participant requests cessation of stimulus; the pain threshold is that
stimulus at which the participant first recognises pain or discomfort (Woodrow et al.,
1972). Gelfand (1964) found that pain tolerance has no strict association with pain
threshold and that pain tolerance is more closely related to clinical pain than the pain
threshold is.
Pain is a subjective experience, and the self-report approach must therefore be used for
its assessment. The Visual Analogue Scale (VAS) is a widely used non-verbal measure for
orthodontic pain (Ngan et al., 1989; Jones and Chan, 1992; Scheurer et al., 1996), where
patients describe their pain by placing a mark on a 100mm horizontal line that has
anchors labelled “no pain” and “unbearable pain” (Duncan et al., 1989). The VAS has
been validated as a measure of pain many times, proving more accurate than other pain
scales (such as a five-point verbal rating scale or fixed-interval rating scale; Aitken,
1969). The reliability of the VAS for pain measures has been confirmed by Revill and
colleagues (Revill et al., 1976) and it has been shown to be well suited to within-
individual repeated measurements (Aitken, 1969) for those aged over five years
(Bergius et al., 2008).
Elicitation of Pain Methods of assessing experimental pain levels include electrical pulp testing (EPT) and
the cold pressor test. Electrical pulp testing can be used to deliver an electric current to
a tooth that is sufficient to overcome enamel and dentine resistance to stimulate the
small, fast-conducting myelinated A-fibres at the pulp-dentine junction (there is not

26
enough current to stimulate the C-fibres; Bender et al., 1989). As the intensity of the
stimulus increases, more sensory nerves are activated, and this results in a progressive
increase in the sensory response (Lin and Chandler, 2008). In a Japanese clinical trial,
EPT was found to be 99% accurate in 396 teeth with vital pulps (Kitamura et al., 1983).
It was concluded from studies with a Macaca mulatta monkey, following five hours of
continuous EPT stimulation, that prolonged electric pulp testing caused no histological
damage to the dental pulp (McDaniel et al., 1973).
The Cold Pressor Test is an experimental technique for inducing an
emotional/motivational pain experience (Walsh et al., 1989). It is a measure of pain
tolerance which involves participants placing their hand and lower forearm in cold
water, inducing a slowly mounting pain (via C-fibres) that dissipates quickly on
withdrawal of the limb from the water (von Baeyer et al., 2005). It has been reported
that preoperative cold pain tolerance, using the cold pressor test, can be used to predict
post-operative pain after wisdom tooth extraction (Mobilio et al., 2011), laparoscopic
cholecystectomies, even after controlling for neuroticism (Bisgaard et al., 2001).
Collectively, these findings suggest that experimental pain responses are associated
with clinical pain reports (namely, that greater pain sensitivity is associated with
greater clinical pain; Edwards et al., 2005).

27
Current Study
Background
The International Association of Pain defines pain as “an unpleasant sensory and
emotional experience associated with actual or potential tissue damage or described in
terms of such” (Merskey and Bogduk, 1994). Pain is highly subjective and is influenced
by a mixture of physical, cognitive, emotional and genetic factors (Andersen and
Skorpen, 2009).
There appears to be a variable response among those undergoing orthodontic
treatment (Ngan et al., 1989; Bergius et al., 2008; Krishnan, 2007), with some patients
feeling high levels of pain and others just mild discomfort. There have been few
investigations into why some patients experience more pain during treatment than
others, despite similarities in malocclusion, sex, race and age.
The literature has identified modifying factors for orthodontic pain, including anxiety
(Bergius et al., 2008), dental fear (Klages et al., 2006), psychological state (Loggia et al.,
2008), patients’ attitudes towards treatment (Sergl et al., 1998), age (Svensson et al.,
2011) and ethnicity (Bergius et al., 2000; Krishnan, 2007). The literature on sex
differences in response to orthodontic pain is inconclusive (Ngan et al., 1989; Scheurer
et al., 1996; Bergius et al., 2000), and there also appears to be no association between
the severity of crowding (Jones and Richmond, 1985) or type of archwire used and pain
levels reported (Jones and Chan, 1992)Studies of the genetic predictors of orofacial pain
and TMD have pinpointed the Catechol-O-Methyltransferase (COMT) gene as a major
influence (Diatchenko et al., 2005; Slade et al., 2007, 2008). However, there have been
no studies on the COMT gene’s influence in orthodontic pain.
Elastomeric separators will be used in this study to introduce orthodontic force. As
stated earlier, this allows assessment of pain perceived as well as creating a
homogenous research model.
Being able to identify individuals who may have a high pain response to orthodontic
treatment would help the clinician to provide the patient with a more comfortable
experience, by utilising patient-specific management strategies to help minimise
orthodontic discomfort.

28
Aims and Objectives
The aim of this study was to investigate possible modifying factors of pain experienced
following application of orthodontic force.
The objectives of this study were:
1. To determine, in a convenience sample, the variability of pain responses
following orthodontic force application with elastomeric separators and to
identify high and low pain responders.
2. To compare high and low pain responders for differences by self-rated oral
health, anxiety (both as a general aspects of personality and in response to a
specific situation), mood, dental anxiety and fear, catastrophising, genetics,
general sensitivity (cold) and tooth sensitivity.
Hypothesis
The study hypothesis was that the reported amount of orthodontic pain is associated
with other pain thresholds, specific psychological and emotional factors (such as dental
anxiety), sex and specific SNPs (rs4680, rs4646310 and rs6269) of the COMT gene.

29
Materials and Methods
Data and Collection
Data collection, in regard to the use and disclosure of personal information, was in
compliance with The Privacy Act 1993 and the Health Information Privacy Code 1994.
Participants were informed of the purpose for which we were collecting the information
and the uses we proposed to make of it. They were allowed access to (and the right to
correct) any personal information gathered.
Māori consultation was sought and Ethical Approval gained (Appendix I).
Data were kept in secure storage within the Orthodontic Clinic and any personal
information held about the participants (such as contact details) was destroyed after it
had been transcribed. After the completion of the study, all personal identifying
information was removed and the remaining data will be stored indefinitely. The
principal researcher had access to personal information. Supervising Faculty staff had
access only via liaison with the principal researcher. Participants had access to the data
in its raw format, and the research findings were made available to them upon
completion of the project, if requested.

30
Sample
A convenience sample of 107 students (mean age = 24.1 years; 49.5% female, 50.5%
male) in the Faculty of Dentistry (University of Otago) participated in Phase One of the
study. Potential participants were invited to participate by the principal researcher
through personal contact, advertising posters, online noticeboards and by dropping
flyers into the pigeonholes of all undergraduate and postgraduate students at the
Faculty of Dentistry.
Inclusion criteria included: age 18 years or older; good general and oral health; contact
with adjacent teeth on mesial and distal surfaces of mandibular first molar teeth (tested
by dental floss resistance) and a willingness to participate in the study (signalled by
signing a written consent form).
Exclusion criteria included: diagnosed depressive illness; a history of Raynaud’s
phenomenon or any chronic pain syndrome; use of neurologically-acting medication or
medication that can potentially affect pain sensitivity (such as anti-depressants);
spacing in the mandibular dentition; active caries or periodontal disease; large
restorations; and previous trauma or root canal treatment of the maxillary central
incisors.
As an incentive for taking part in Phase One research, all participants were offered a
movie voucher and went into a draw for one of two iPod Touch devices; for Phase Two,
each participant received a $50 gift voucher.
Participants were provided with an explanation of the research goals and procedures
and the investigator was available to participants after the project, should any stress,
harm, or related concerns have arisen.

31
Experimental Procedure
This study consisted of two phases. During the first phase, participants were screened
for pain response to the placement of an orthodontic elastomeric separating ring (“Sep-
A-Ring Separators”, maximum stretch 18 mm, TP Orthodontics Inc, Indiana, USA)
between their teeth over 48 hours (Figure 4).
Figure 4 Orthodontic elastomeric separator
This was used to identify high and low pain responders, who were then invited to enter
phase two testing. Phase two consisted of cold pressor testing, electric pulp testing, a
self-rating on oral health, testing of anxiety levels and dental fear as well as testing
genetic variations in order to investigate how the two groups differed.

32
Phase One
Following the placement (Figure 5) of two orthodontic separating rings – one mesial
and one distal to the mandibular right first molar tooth (Figure 6) – participants were
asked to complete six visual analogue scales on pain levels over the next 48 hours
(McCormack et al., 1988; Appendix III).
Figure 5 Insertion of elastomeric separators
Figure 6 Elastomeric separators in situ

33
Figure 7 Visual Analogue Scale
The VAS (Figure 7) consisted of a 10 cm horizontal line on a sheet of paper with labels
at either end. The participant placed a mark on the line wherever their level of current
pain or highest intensity of pain since the last report lay. These reports took only
seconds to complete, with the first one being completed under supervision in the clinic
as soon as the separating rings were placed. The next one was four hours after insertion
of the elastic separating rings, followed by one that evening before retiring, another
report first thing the following morning, and another in the evening prior to retiring.
The last report was made the following day (making six reports, in total, over 48 hours).
The first VAS report related to the current pain level; subsequent reports included a
second VAS on the maximum pain intensity felt over the time since the previous report
as well. After the final VAS report was completed, participants returned to have the
separating rings removed.
Based on these scores, 10 participants above the 90th percentile (peak VAS score from
Phase One 8.00 cm or higher) and 10 participants below the 10th percentile (score 0.55
cm or lower), were selected and defined as “high” or “low” pain responders
(respectively) and invited to participate further.

34
Phase Two
Phase Two commenced shortly after completion of Phase One.
(1) Emotion, Dental Fear and Anxiety Questionnaire (Appendix IV)
Participants were asked to complete a 15 minute questionnaire prior to testing. The
questionnaire comprised: the Corah Dental Anxiety Scale (DAS; Corah, 1969); Locker’s
Global Item (Locker, 1988); the Positive and Negative Affect Schedule (PANAS; Watson
et al., 1988); the Pain Catastrophising Scale (Sullivan et al., 1995); and Spielberger’s
State–Trait Anxiety Inventory (STAI; Spielberger et al., 1970).
(2) Cold Pressor Test
This test evaluates pain sensitivity in experimental conditions. It is based on von
Baeyer’s methodology (von Baeyer et al., 2005) and elicits an emotional/motivational
pain experience from the immersion of a limb in a 21.5 litre tank of cold water which
has been insulated to ensure constancy of temperature (Walsh et al., 1989).
In preparation for testing, participants immersed their non-dominant hand into a water
tank at 36 °C (+/- 1°C) for two minutes. They were then seated comfortably next to the
tank (Figure 8) and then placed their non-dominant hand into the tank of continuously
circulating water (10°C +/- 1°C), flowing from a tap above the tank.

35
Figure 8 Cold pressor test apparatus
Hands were immersed unclenched and palm-up, to a depth of 5 cm above the wrist into
the tank (arm not secured), for three minutes (Figure 9). After each minute, without
removing their arm from the tank, participants were asked to mark on a VAS the
pain/discomfort level currently experienced (Appendix VI). The last VAS was completed
prior to removing the hand from the tank. If at any time the pain was intolerable,
participants could remove the arm from the tank and complete the VAS.
Figure 9 Cold pressor test

36
Appropriate resuscitation equipment was readily available during this testing, but it
was not required.
(3) Electric Pulp Testing
The dental pain threshold and tolerance were tested using an electrical pulp tester
(EPT) of the type used routinely in general dental practice (Figure 10).
Figure 10 Electric pulp tester
Participants were seated comfortably in the dental chair. Their maxillary central
incisors were isolated using cotton rolls, dried with gauze (no air-blast), and then Mylar
strips were placed mesially and distally, to isolate them from the adjacent teeth.
The Kerr Vitality Scanner 2006 Electric Pulp Tester (SybronEndo, Anaheim, CA, USA)
was used following manufacturer’s instructions. In common with most contemporary
EPT instruments, the instrument’s scale runs from 0 to 80. The stimulus rate was fixed
at level “4” throughout Phase Two testing. “Close Up Active Gel” 0.21% NaF toothpaste
(Unilever, N.V, Rotterdam) was used as a contact medium on the probe tip.
The probe tip was placed on the incisal third of the enamel (to ensure no greater
sensation due to exposed dentine on the incisal edge) as recommended by Bender et al.
(1989) and, once positioned by the clinician, the participant was asked to grasp the
handle of the probe (Figure 11).

37
Figure 11 Electric pulp tester tolerance test
Three initial sensation readings were made on the maxillary left central incisor. These
initial readings recorded the detection threshold of the central incisor. The participant
was asked to let go of the probe handle as soon as an abnormal sensation (such as heat
or tingling) was felt, and then to immediately report the pain experienced on a VAS
(Appendix VII); the reading at this point was recorded (Appendix V). This was repeated
two more times, with the tooth dried with gauze and a rest period of at least one minute
between readings, in order to minimise nerve sensitisation arising from repeated
stimulation (Bender et al., 1989; Lin et al., 2007).
Three further assessments were taken on the maxillary right central incisor. This
second round of testing involved the participant holding the probe until discomfort was
unbearable, at which point the participant released the probe handle. Immediately, the
pain experienced was recorded on a VAS (Appendix VII). The reading at this point was
recorded as the maximum tolerance (Appendix V). Following the first measurement, the
tooth was re-dried and a recovery period of at least one minute was allowed (Lin et al.,
2007), and the procedure was repeated twice. This procedure has been shown to cause
no long-term pain or injury to the tooth (McDaniel et al., 1973).
(4) Saliva Test Due to financial constraints, only three single nucleotide polymorphisms (SNPs) could
be selected for analysis. Due to linkage disequilibrium (LD) values (discussed earlier) of
100% between SNPs rs165656 and rs4680, as well as for rs4818 and rs6269, it was only

38
necessary to analyse one SNP from each of these pairs, as well as analysing the novel
rs464630, for which the LD was unknown.
Participants were asked to provide a saliva sample according to a standard protocol
(Oragene-500 Kit, DNA Genotek, Ottawa, Canada). Samples were kept at room
temperature until all samples had been collected, at which time they were taken to be
processed at Associate Professor Tony Merriman’s laboratory, Department of
Biochemistry, University of Otago. Genomic DNA was extracted from the saliva samples
according to manufacturer’s instructions. Three SNPs (namely rs4680, rs6269 and
rs4646310) from the COMT gene were genotyped using TaqMan assays (Diatchenko et
al., 2005; Michelotti et al., 2013). TaqMan probes are hydrolysis probes that are
designed to increase the specificity of real-time polymerase chain reaction (RT-PCR)
assays.
Samples were destroyed under standard conditions at the laboratory, unless the
participants had requested that their sample either be disposed of with appropriate
karakia (Māori prayers or incantations) or returned to them at the conclusion of the
study.
Duration of Testing Phase One involved ten minutes in the Orthodontic Clinic and then five minutes over the
following 48 hours.
Phase Two took 30-40 minutes to complete a questionnaire and participate in the
testing, which on average took 20 minutes.
Data Analysis
Statistical analysis used conventional descriptive statistics, using SPSS Software
(version 21, IBM, NY, USA). Scale scores were computed using the recommended
method for each scale. Comparison of means was performed using Student's t-test (if
the data were normally distributed) or the Mann-Whitney U test where data was not
normally distributed. Comparisons of proportions used the Chi-square test. Repeated
measurement analysis of variance and multivariate modelling were used to control
confounding, and, in particular, to control for the influence of personality.

39
Results
Sample
The sample consisted of 107 undergraduate and postgraduate students within the
Dental Faculty at the University of Otago (Table 1). There was an almost equal number
of male and female participants (n = 54 and n = 53 respectively), with over 80% of the
sample being of either Asian or European descent. Males and females did not differ with
respect to ethnicity or mean age.
Table 1. Phase One Participants - Summary Data
Variable Sex Total
(n = 107) Females (n = 53) Males (n = 54) P Value Ethnicity (%) European 28 (52.8) 19 (35.2) 0.823a 47 (43.9) Asian 19 (35.8) 24 (44.4) 43 (40.2) Other 6 (11.3) 11 (20.4) 17 (15.9) Age (SD) 24.2 (4.2) 23.9 (4.1) 0.699b 24.1 (4.2) a Fisher’s Exact Test b Unpaired Student’s t-test

40
Phase One
Mean VAS peak pain over the 48-hour time interval was 3.1 cm (sd, 2.7), peaking during
the night on the second evening. Generally, pain levels had elevated by the first evening
and stayed elevated until the second morning (Figure 12).
Figure 12 Phase One mean VAS pain over the duration of experiment
Error bar = 95% confidence interval *Since Last refers to the VAS report regarding maximum pain experienced between their previous pain report and the current report
Repeated measurements analysis of variance (ANOVA) showed that the pain scores
over time were not significantly associated with sex (Fisher’s Exact Test (F) = 0.121; P =
0.729), and that there was no significant interaction between time and sex (F = 1.780; P
= 0.074). Pain response varied significantly over time following orthodontic force
application (F = 3.026; P = 0.002).
The mean maximum VAS pain score over the 48-hour period did not differ between
males and females (t = 0.730 and P = 0.467).
0.0
0.5
1.0
1.5
2.0
2.5
3.0
Me
an V
AS
Sco
re (
cm)
Time of VAS recording

41
Phase Two
Phase Two involved the highest and lowest 10th percentile (n = 10 in each group) from
Phase One. Again, there were nearly equal proportions of male and female participants
in each group (high pain n = 4 and n = 6 respectively, and low pain group n = 5 in each
group), and over 80% of the sample was of either Asian or European descent (Table 2).
Table 2. Phase Two Participants - Summary Data
Variable Group Both combined
(n = 20) High Pain (n = 10)
Low Pain (n = 10)
P Value
Age (SD) 22.4 (2.3) 24.6 (4.1) 0.164a 23.5 (3.4) Sex (%) Male 4 (40.0) 5 (50.0) 1.000b 9 (45.0) Female 6 (60.0) 5 (50.0) 11 (55.0) Ethnicity (%) European 3 (30.0) 5 (50.0) 0.727b 8 (40.0) Asian 5 (50.0) 4 (40.0) 9 (45.0)
Other 2 (20.0) 1 (10.0) 3 (15.0) a Independent samples t-test (equal variance not assumed) b Fisher’s Exact Test

42
The phase one VAS pain scores differed substantially between the groups. Individually,
each high pain responder had a peak VAS pain score of ≥8.0 cm for at least one time
point over the 48-hour observation period, whereas, low pain responders had a mean
peak pain of ≤0.6 cm, during the whole 48-hour period.
As a group, due to peak pain occurring at different time points, the high pain responders
had a peak VAS pain score of 7.4 cm (sd, 2.3) on evening two; by contrast, the low pain
responders had a peak VAS pain score of 0.2 cm (sd, 0.2) on morning one (Figure 13).
Figure 13 Highest and lowest pain responders
* Error bar = 95% confidence interval (for convenience, upper bar only shown for Low Pain Group)
0.0
1.0
2.0
3.0
4.0
5.0
6.0
7.0
8.0
9.0
10.0
Me
an V
AS
Sco
re (
cm)
Time of VAS recording
High Pain Group
Low Pain Group

43
The Pain Catastrophising Scale (PCS) showed a statistically significant difference (P <
0.05) between high and low pain responders across all three subcategories. The Corah
Dental Anxiety Scale (DAS) also showed a statistically significant difference (P < 0.05)
between the high and low pain responders (Table 3).
Table 3. Mean PCS and DAS scores, by group
Group
Both combined (n = 20)
High Pain (n = 10)
Low Pain (n = 10)
P Valuea
Catastrophising
Rumination (SD) 9.1 (5.2) 3.5 (3.2) 0.019 6.3 (5.1) Magnification (SD) 4.6 (1.8) 1.5 (2.0) 0.003 3.1 (2.4) Helplessness (SD) 7.8 (5.8) 2.6 (2.7) 0.023 5.2 (5.1)
Mean DAS Score (SD) 9.4 (3.3) 6.5 (2.6) 0.043 8.0 (3.3) a Mann-Whitney U Test
The two groups’ responses to Locker’s global item were identical (Table 4). Table 4. Locker’s global item responses, by group
Self Rating Group
Both combined (n = 20)
High Pain (n = 10)
Low Pain (n = 10)
P Valuea
Excellent (%) 2 (20.0) 2 (20.0) 1.000 4 (20.0) Very Good (%) 6 (60.0) 6 (60.0) 12 (60.0) Good (%) 2 (20.0) 2 (20.0) 4 (20.0) Fair-Poor (%) 0 (0.0) 0 (0.0) 0 (0.0) a Fisher’s Exact Test
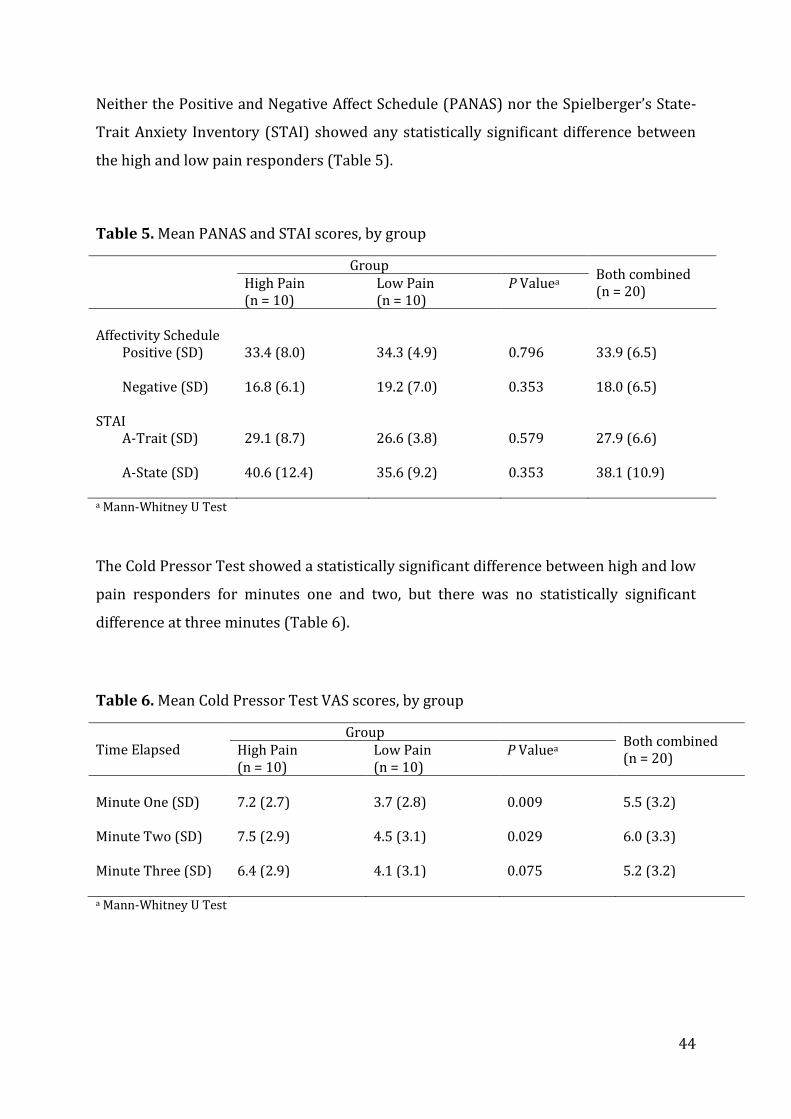
44
Neither the Positive and Negative Affect Schedule (PANAS) nor the Spielberger’s State-
Trait Anxiety Inventory (STAI) showed any statistically significant difference between
the high and low pain responders (Table 5).
Table 5. Mean PANAS and STAI scores, by group
Group
Both combined (n = 20)
High Pain (n = 10)
Low Pain (n = 10)
P Valuea
Affectivity Schedule
Positive (SD) 33.4 (8.0) 34.3 (4.9) 0.796 33.9 (6.5) Negative (SD) 16.8 (6.1) 19.2 (7.0) 0.353 18.0 (6.5)
STAI
A-Trait (SD) 29.1 (8.7) 26.6 (3.8) 0.579 27.9 (6.6) A-State (SD) 40.6 (12.4) 35.6 (9.2) 0.353 38.1 (10.9)
a Mann-Whitney U Test
The Cold Pressor Test showed a statistically significant difference between high and low
pain responders for minutes one and two, but there was no statistically significant
difference at three minutes (Table 6).
Table 6. Mean Cold Pressor Test VAS scores, by group
Time Elapsed Group
Both combined (n = 20)
High Pain (n = 10)
Low Pain (n = 10)
P Valuea
Minute One (SD) 7.2 (2.7) 3.7 (2.8) 0.009 5.5 (3.2) Minute Two (SD) 7.5 (2.9) 4.5 (3.1) 0.029 6.0 (3.3) Minute Three (SD) 6.4 (2.9) 4.1 (3.1) 0.075 5.2 (3.2) a Mann-Whitney U Test

45
Detection threshold and tolerance output measurements for EPT were compared
between high and low pain responders, as were the VAS scores for pain experienced.
Neither output reading value nor VAS scores for detection threshold or tolerance were
significantly different between high and low pain responders.
Detection threshold and tolerance output values between high pain responders and low
pain responders were tested using repeated measurement ANOVA. The ANOVA results
suggested that there was a significant effect of “test number” on detection threshold (F =
5.5; P = 0.008), with the mean detection threshold value (Table 7) becoming
progressively lower with subsequent tests. The effect of “test number” was not
significant (F = 1.3; P = 0.28) for tolerance thresholds (Table 8).
VAS scores for pain were also tested for detection threshold and tolerance differences
between high and low pain responders using repeated measurement ANOVA. Detection
threshold VAS pain (Table 9) was not influenced by test number (F = 0.38; P = 0.69);
however, the VAS pain score for tolerance (Table 10) was statistically significantly
higher with subsequent tests (F = 6.4; P = 0.004).
Table 7. Mean Electric Pulp Tester Threshold Output Values (arbitrary units), by group
Test number Group
Both combined (n = 20)
High Pain (n = 10)
Low Pain (n = 10)
P Valuea
Test One (SD) 19.1 (5.2) 20.4 (7.2) 0.280 19.8 (6.1) Test Two (SD) 14.7 (7.2) 19.7 (7.3) 0.075 17.2 (7.5) Test Three (SD) 15.5 (8.3) 18.5 (6.3) 0.218 17.0 (7.3)
Mean (SD) 16.4 (6.9) 19.5 (6.9) 0.143 18.0 (6.6) a Mann-Whitney U Test

46
Table 8. Mean Electric Pulp Tester Tolerance Output Values (arbitrary units), by group
Test Group
Both combined (n = 20)
High Pain (n = 10)
Low Pain (n = 10)
P Valuea
Test One (SD) 26.4 (6.9) 35.7 (16.7) 0.075 31.1 (13.3) Test Two (SD) 25.7 (5.6) 33.6 (17.9) 0.247 29.7 (13.5) Test Three (SD) 26.3 (7.2) 35.0 (16.6) 0.123 30.7 (13.2)
Mean (SD) 26.1 (6.6) 34.8 (17.1) 0.105 30.5 (13.2) a Mann-Whitney U Test
Table 9. Mean Electric Pulp Tester Threshold VAS pain scores, by group
Test Group
Both combined (n = 20)
High Pain (n = 10)
Low Pain (n = 10)
P Valuea
Test One (SD) 3.0 (2.3) 1.6 (1.9) 0.190 2.3 (2.2) Test Two (SD) 2.9 (2.6) 1.5 (2.3) 0.218 2.2 (2.5) Test Three (SD) 3.0 (2.8) 1.7 (2.4) 0.190 2.3 (2.6)
Mean (SD) 3.0 (2.6) 1.6 (2.2) 0.190 2.3 (2.4) a Mann-Whitney U Test
Table 10. Mean Electric Pulp Tester Tolerance VAS pain scores, by group
Test Group
Both combined (n = 20)
High Pain (n = 10)
Low Pain (n = 10)
P Valuea
Test One (SD) 7.2 (2.0) 5.6 (2.4) 0.123 6.4 (2.3) Test Two (SD) 7.5 (1.5) 5.9 (2.5) 0.143 6.7 (2.1) Test Three (SD) 8.0 (1.4) 5.9 (2.7) 0.105 7.0 (2.4)
Mean (SD) 7.6 (1.6) 5.8 (2.5) 0.123 6.7 (2.3) a Mann-Whitney U Test

47
Owing to the low number of participants in Phase Two, logistic regression could not be
used to compare low and high pain responders. Therefore, analysis was carried out
using pain responder type as the main independent variable, in order to investigate the
significant differences described above (PCS, DAS, Cold Pressor One Minute; Table 11).
The empty model shows that 39.3% of pain response type (high or low) was explained
by the magnification subcategory of the PCS, with high pain responders having a score
in this subcategory which was approximately 3.1 units higher; after controlling for
other factors, it was still 1.8 units higher than low pain responders.
Once all other variables were controlled for, the adjusted model accounted for 80% of
the variance in the magnification subscale of the PCS (P = 0.011).

48
Table 11. Multivariate analysis, using statistically significant variables from Phase Two to compare pain responder types (Regression coefficient pertains to high pain response type).
Scale Empty Model
Full Modela
Unadjusted difference
(95% CI)
P Value Variance explained (%)
Adjusted difference
(95% CI)
P Value Variance explained
(%)
PCS
Rumination 5.6 (1.6, 9.6) 0.009 28.2 -0.5 (-3.8, 2.7) 0.728 82.9
Magnification 3.1 (1.3, 4.9) 0.002 39.3 1.8 (0.5, 3.2) 0.011 79.9
Helplessness 5.2 (-0.4, 5.6) 0.019 22.8 -2.1 (-5.0, 0.8) 0.144 84.6
DAS 2.9 (0.1, 5.7) 0.044 16.3 1.8 (-1.3, 4.8) 0.239 59.7
Cold pressor test minute 1 3.5 (1.0, 6.1) 0.010 27.9 3.0 (-0.2, 6.2) 0.064 47.1
a Independent variable = pain responder type

49
Three SNPs of the COMT gene were analysed from saliva samples of both high and low
pain responders (Table 12). None of the three SNPs showed a statistically significant
difference between high and low pain responders.
Table 12. Genotype frequencies of COMT SNPs, by group
SNP
Genotype
Group
High Pain (%) Low Pain (%) P Valuea
rs4680 G/G 2 (20) 2 (20) G/A 5 (50) 7 (70) 0.820
A/A 3 (30) 1 (10) rs6269 A/A 6 (60) 3 (30)
A/G 3 (30) 7 (70) 0.179 G/G 1 (10) 0 rs4646310 G/G 9 (90) 6 (60)
G/A 1 (10) 3 (30) 0.303
A/A 0 1 (10) a Fisher’s exact test

50
Discussion
The findings of this study suggest that there are three characteristics that modify the
pain experienced following application of orthodontic force, namely: pain
catastrophising, dental anxiety, and cold sensitivity.
The factors investigated in this study included: anxiety, both as a general aspect of
personality and in response to a specific situation; the two primary dimensions of mood
(positive and negative affect); dental anxiety and fear; self-rating of oral health;
catastrophising; three SNPs of the COMT gene; general sensitivity (cold) and tooth
sensitivity (EPT). Only three factors proved to be related to pain experienced following
application of orthodontic force; these were pain catastrophising, dental anxiety and
cold sensitivity. The strongest of the three orthodontic pain modifying factors was the
magnification subscale of the PCS, as shown by using a predictive multivariate model for
orthodontic pain sensitivity, which accounted for 39.3% of the variance in the
magnification subscale of the PCS (P = 0.011).
There were some weaknesses in this study: a lack of power due to low participant
numbers; a possibly biased sample; timing of administration of questionnaires and pain
reporting protocol. The most important weakness was Type II error, due to low
participant numbers. This was especially highlighted in the COMT analyses.
Participation was entirely voluntary, with 107 volunteers for Phase One, leading to just
20 participants in Phase Two. Dental students have a very busy timetable; thus, a self-
selecting group of students was involved in this study. This compromises the study’s
external validity.
It is unlikely that a truly representative sample of participants could ever be recruited
to studies like this, and so multiple studies of different populations are required to
determine whether the findings can be a true representation of orthodontic patients.
This lack of power meant that no strong conclusions could be drawn from the EPT or

51
COMT SNP analysisiv. Electrical pulp testing is based on stimulation of sensory nerves
and, as with the cold pressor testing, requires and relies on subjective assessment from
the patient (Lin and Chandler, 2008). EPT can produce a false-positive response in teeth
with pulpal necrosis, a condition which was avoided as much as possible via exclusion
criteria. However, one study has demonstrated an overlap of the thresholds of pulpal
and periodontal nerves, thus providing a “false” response via periodontal nerve
stimulation – a scenario which was unaccounted for in this study (Närhi et al. 1979).
With this study being based within a dental faculty, the external validity of the findings
may be further compromised. This is particularly evident with Locker’s global item
(self-rated oral health), where all participants rated their oral health as “good” or better.
Participants would have higher dental awareness as well as easier access to oral health
care. However, dental anxiety still featured as a statistically significant orthodontic pain
predictor, which indicates that despite the study being based within a dental institution,
there was still good representation of dentally anxious people.
Some internal bias may have been encountered in Phase One due to participants
allowing previous VAS scores to influence their current report. Efforts were made to
reduce this, by placing each VAS time report on a new page (Appendix I). Previous
studies have telephoned the participants at each time interval to collect a verbal VAS
(Bergius et al., 2008), or participants have mailed back VAS forms on completion
(Scheurer et al., 1996; Bergius et al., 2002). A novel way to prevent bias could be to
create a “smart phone” application which would prompt a VAS report at the required
time intervals, whereby the data would be sent straight back to the server and the
investigators.
Another factor to consider is that the STAI questionnaire was administered at the start
of Phase Two; thus, the State section which pertains to how they feel at a particular time
iv We are collaborating with a dental school in Naples, Italy, to increase the power of this study.

52
(such as the “intensity induced by stressful experimental procedures”) was not
temporally related to the application of orthodontic separators (Spielberger et al.,
1970). The situation is similar for the PCS which ideally is assessed in two different
ways, either as a reaction measured during or immediately after exposure to a noxious
stimulation (situational or state assessment; Leung, 2012). Ideally, the PCS could have
been administered immediately after separator removal, so that participants could
reflect on this experience when answering their questionnaire. However,
catastrophising, assessed while individuals are in a pain-free state, can predict pain
ratings made in response to aversive stimulation, as shown by PCS scores obtained one
week (Sullivan and Neish, 1999) or up to eight weeks (Sullivan et al., 1995) before a
painful procedure. The findings from this study can still be an indication of
catastrophising and anxiety when there is the threat or anticipation of pain including
dental pain, since all Phase Two participants were aware that following completion of
their questionnaires, they would be taking part in EPT and cold pressor tests.
Pain has the two dimensions of algosity and unpleasantness. Algosity refers to the
quality of an unpleasant somatic sensation that allows it to be identified as pain (Fields,
1999), whereas unpleasantness is a dimension of pain that allows a somatic sensation
to be identified as noxious, yet it may not necessarily be associated with noxious stimuli
(Mobilio et al., 2011). An example is an itch, where unpleasantness is tightly coupled
with stimulus intensity (Fields, 1999). Both of these dimensions can be tested using a
VAS (with different end-point labels), which would allow a better understanding of the
quality of the pain that participants were experiencing. In the current study, there was
only one VAS used throughout the study, and it was noted during Phase Two testing that
some participants had asked whether they were reporting on discomfort
(unpleasantness) or pain. Having separate VAS reports of those aspects would help
participants to clarify what they were experiencing. It is important to remember when
scrutinising the pain literature that the severity of pain is different for different
experimental modalities of testing; thus, modifying factors may not be comparable
between all studies.

53
The menstrual phase of female participants was not recorded in this study. A review of
pain perception across the menstrual cycle (Riley et al., 1999) concluded that, for cold
pressor pain, higher thresholds were apparent in the follicular phase than in other
phases; however, these were regarded as only trivial to mild, in line with the
conclusions of a more recent systematic review which showed inconsistent menstrual
cycle effects in regard to cold pressor pain (Fillingim et al., 2009). Because of such
inconclusive results, menstrual phase was not seen to be an influence, as there were no
sex differences in pain response during this study.
The participants in Phase One were evenly split between males (50.5%) and females
(49.5%). When the influence of sex on the Phase One VAS scores was investigated, both
as the maximum pain score and throughout the 48-hour observation period, it was not a
significant predictor of pain. This was also true upon investigation of the interaction
between time and sex with regard to pain level. This is consistent with the findings of
other orthodontic studies using orthodontic separators (Ngan et al., 1989), including
those of Jones and Chan (1992) who did a randomised control trial (RCT) with fixed
orthodontic appliances. Both studies found no sex influence on pain reported by VAS,
yet this is the opposite of some other studies looking at sex differences in pain
perception, most of which were not orthodontic studies (Svensson et al., 2011).
However, Scheurer and colleagues (1996) found a significantly higher reporting of pain
from females following placement of orthodontic appliances and Bergius and co-
workers (2002) found that, following orthodontic separator placement, females
experienced significantly higher levels of pain on days three, five and seven post-
insertion.
The time of the VAS pain recording had a significant influence on pain levels reported,
which, of course, is to be expected, because it is well known that orthodontic pain
generally follows a pattern of increasing after four hours of force application, usually
rising to a peak after approximately 24 hours, before beginning to subside after 48
hours (Krishnan, 2007). This temporal pattern has been shown in previous studies
(Ngan et al., 1989; Bergius et al., 2002) following placement of orthodontic separators

54
on patients. Jones and Chan (1992) also showed this in a RCT following placement of
fixed orthodontic appliances.
The age or ethnicity of participants did not significantly influence pain response type in
either Phase One or Phase Two. Since the sample for this study consisted of students,
there was a limited spread of ages; the literature has mixed reports on the influence of
age on orthodontic pain, with some reports stating no difference (Ngan et al., 1989;
Bergius et al., 2008) and others concluding that the older the patient (over 16 years),
the worse the pain (Jones and Chan, 1992). Further studies have concluded that the
greatest pain reported was in the 13-16 age group (Scheurer et al., 1996).
There is no literature on ethnic differences in orthodontic pain. Literature on pain that
compares similar ethnic groups to those in this study has found similarities in reported
pain responses, but it has been pointed out that groups can be quite different with
regard to factors (such as social and cultural) which influence the responses (Lipton and
Marbach, 1984). By contrast, Woodrow and colleagues (1972) suggested that
Caucasians can tolerate more pain than Asians. This was also found in a small study
using the cold pressor test, where Asians reported significantly more pain and distress
(in response to cold pressor pain) than Caucasian participants (Knox et al., 1977). In the
present study, there were no ethnic differences, possibly because of low statistical
power.
As stated earlier, the PCS evaluates any exaggerated negative orientation toward
noxious stimuli (such as helplessness and inability to cope effectively with pain),
identifying individuals who may be susceptible to heightened distress responses. In this
study, there was a statistically significant difference between high and low pain
responders for all three subscales (rumination, magnification and helplessness),
meaning that catastrophising appears to be a strong predictor of orthodontic pain.
When Sullivan and colleagues (1995) developed the PCS, it was also compared with cold
pressor pain VAS scores, and they too found that catastrophisers reported significantly

55
more pain than non-catastrophisers. Although research has demonstrated a strong
relationship between catastrophising and pain experience, the precise mechanism
remains unclear (Sullivan et al., 1995). As discussed later, it has been suggested that
pain catastrophising might be associated with suppression of the dopamine or
endogenous opioid pain-control systems (Benedetti et al., 2010). It has also been
suggested that pain catastrophising might interfere with pain modulation.
Multivariate analysis using all the predicting factors that we found to be statistically
significant (cold pressor test, the three subcategories of PCS and DAS), with pain
responder type as the independent variable, showed that 80% of the variance in the
magnification subscale of the PCS was explained after other factors were controlled for,
making magnification the strongest predictor for orthodontic pain. Magnification
describes a person’s likelihood to exaggerate the threat value or seriousness of the pain
sensations (such as “I wonder whether something serious may happen”).
The current study findings underline the importance of cortical processing on pain
perception following the application of orthodontic force, because cerebral cortical
areas receiving afferent nociceptive information can be readily modulated by
expectation-induced information. Positive expectations (of lower pain) can produce a
greater reduction in perceived pain than the effects of a clinically analgesic dose of
morphine, and expectations of a negative outcome (greater pain) can result in the
amplification of pain (Koyama et al., 2005). Several regions in the cortex and the
hippocampus have been found to be activated during the anticipation of pain (Koyama
et al., 2005). As discussed earlier, the cerebral cortex is an area where pain modulation
can occur; thus, influencing pain signal transmission (Okeson and Bell, 2005), for
example, via suppression of opioid or dopamine pathways (Benedetti et al., 2010). The
way in which the pain signal is received and modulated (either by enhancement or
reduction) can be further influenced by the state of the dorsal horn when the input
arrives, such as in the sensitised state, as discussed earlier, which will lead to an
exaggerated noxious input (Carr and Goudas, 1999).

56
It has been found that following dental hygiene treatment, the rumination subscale of
the PCS contributed significant unique variance to the prediction of pain, but the
magnification subscale had no significant contribution (Sullivan and Neish, 1998). No
dental literature highlights the magnification subscale of the PCS as being a modifying
factor for pain experience, but there has been a tentative conclusion drawn in a sample
of patients with whiplash at a specialist pain clinic. One year after the injury, the
magnification subscale was the best predictor of their pain and disability (Sullivan et al.,
2002).
A study of dental students investigated how to reduce pain experienced by
catastrophisers during dental hygiene treatment. It showed that catastrophisers who
were given the opportunity to disclose their dental worries and concerns before the
dental procedure had lower ratings of pain and emotional distress (Sullivan and Neish,
1999).
Dental anxiety may also be a modifying factor for orthodontic pain as there was a
significant difference in DAS scores between high and low pain responder groups,
meaning that high pain responders seem to be more dentally anxious. A similar
conclusion was made by Bergius and colleagues (2008) who investigated the
characteristics of patients who experienced prolonged pain (pain still at day seven)
following orthodontic separator placement. They found the DAS scores were
significantly higher in the group who experienced prolonged pain. The DAS was also
found to be a strong predictor of pain intensity associated with routine dental
procedures (Tickle et al., 2012). Catastrophising can be a significant confounder on the
influence of dental anxiety. De Jongh and colleagues (1994) concurred with previous
research on student populations, finding that dental anxiety was significantly related to
catastrophising.
Orthodontic pain experience may also be influenced by genetic differences in the COMT
enzyme. The COMT SNPs investigated in this study were rs4680, rs6269 and the

57
recently identified “novel” SNP rs4646310 (Michelotti et al., 2013). While no SNPs were
shown to differ between high and low pain responders, a factor heightened due to the
low power of this study, the rs6269 SNP difference approached statistical significance,
pointing at a marginal relationship of an A/A haplotype for high pain responders, and
A/G haplotype for low pain responders (P = 0.179). Doubling the sample size gave a P
Value of 0.035, and doubling again gave P < 0.0001.
Evidence for the COMT SNP rs6269 being a significant contributor to orofacial pain
sensitivity can be found in the study by Diatchenko’s group (2005), where it was
determined that rs6269 accounted for 6% of the variation in pain sensitivity (P < 0.01)
and that homozygous genotypes were associated with significant differences in mean
pain sensitivity, whereas rs4680 showed a marginal association with pain sensitivity (P
= 0.18). Diatchenko’s group also reported that, following multivariate analysis, all
possible combinations of four SNPs in the coding region (including rs4680 and rs6269
plus two other SNPs), accounted for 10.6% of the variation in the summary measure of
pain sensitivity. This was also found by Lee and colleagues (2011), who studied pain
following mandibular third molar tooth extraction in a sample that did not differ in
psychological factors (including STAI and PCS measures). It was found that pain VAS
scores one week post-operatively showed statistically significant differences between
rs6269 high- and low-pain sensitivity genotypes (GG versus GA, respectively).
Interestingly, there was again no statistically significant difference in pain VAS scores
between rs4680 genotypes.
There appears to be a strong link between genetic and psychological factors. Patients
with high PCS scores and low COMT activity (high pain sensitivity) with shoulder pain
had significantly higher preoperative pain ratings (32.9% of variance explained) in
comparison to those patients with high PCS and high COMT activity, showing that pain
catastrophising and COMT diplotype interaction was a significant predictor of post-
operative pain (George et al., 2008b). George and colleagues had earlier shown with an
induced shoulder pain experiment and a hierarchical regression model that the
interaction between pain catastrophising and COMT diplotype was the strongest unique

58
predictor of 72-hour pain ratings (George et al., 2008a). Enoch and colleagues (2003)
had previously concluded that the COMT rs4680 SNP played an important role in the
pathogenesis of anxiety in women. This was also shown by Slade’s group (2007) in a
prospective study of TMD of asymptomatic females, where it was found that
psychological factors (including STAI scores) and COMT haplotypes (including rs6269
and rs4680) increased the risk of clinical pain.
The cold pressor test was used in the current study to investigate whether the pain
experienced from hand immersion in cold water predicts the pain experienced
following application of orthodontic force. For the cold pressor test, a technique
validated for use with children was selected (von Baeyer et al., 2005), because this
would ensure that the maximum number of participants would complete the task,
providing the maximum amount of data to analyse, given that half of our participants
were pain-sensitive. It is worth noting that one of the high pain responder participants
did remove his/her arm from the tank shortly after two minutes, as they felt the pain
was unbearable. The cold pressor test showed a statistically significant difference
between high and low pain responders for minutes one and two of immersion, but there
was no significant difference at three minutes. This is probably due to the fact that after
two minutes of hand immersion in 10°C water, peripheral vasoconstriction occurs to
reduce heat loss (cold adaptation) in both groups (Greene et al., 1965; Walsh et al.,
1989).
Multivariate analysis, using pain responder type as the independent variable, showed
borderline statistical significance (P = 0.064) once all other variables were controlled
for, and accounting for 47% of the variance in the cold pressor one minute test VAS
score. Preoperative pain sensitivity testing on patients prior to third molar tooth
removal has shown that the cold pressor test can be used to identify patients at risk of
developing greater pain after this type of surgery (Mobilio et al., 2011). A prospective
study on patients undergoing a laparoscopic cholecystectomy has also identified that
pre-operative greater sensitivity to cold pressor pain is an independent risk factor for
early postoperative pain (Bisgaard et al., 2001). These findings support those of the

59
current study, whereby cold pressor VAS pain scores were associated with pain
experienced following the application of orthodontic force (P = 0.009 after one minute
of immersion). However, the influence of the cold pressor test on pain following
application of orthodontic force is small compared to that of the magnification subscale
of the PCS.
The EPT was used to compare both Threshold Detection and Tolerance levels between
the high and low pain responder groups. For both sets of data, there was no significant
difference between the groups, meaning that EPT pain VAS and output values are not
related to pain experienced following application of orthodontic force. The ANOVA
results showed a statistically significant difference within each responder group (high-
or low-pain response) with subsequent tests for tolerance VAS scores being higher, as
well as a progressive lowering of the detection threshold during the three tests (P =
0.008). This may be described as intra-group conditioning (due to primary hyperalgesia
or peripheral sensitisation of the nociceptors at the test site) accounting for the greater
pain sensitivity of the central incisors (Besson, 1999; Miles et al., 2004). This result
contradicts that found in some EPT studies, which have described nerve
accommodation after repeated nerve stimulation, and participants feeling less pain or
tolerating higher output readings before releasing the probe tip (Mumford, 1965;
Bender et al., 1989).
The PANAS measures the two primary dimensions of mood (positive and negative
affect). It did not show a statistically significant difference between high and low pain
responder groups. A similar Swedish orthodontic study (Bergius et al., 2008) - which
tested personality factors (temperament, self-concepts and self-esteem) using the EAS
survey for adults (Buss and Plomin, 1984) and the “I think I am” self-report
questionnaire (Ouvinen-Birgerstam, 1984) to try and characterise the patients who felt
prolonged pain following orthodontic separators - also found that the two groups did
not differ according to these psychological dimensions.

60
The STAI was used as a measure of anxiety as a general aspect of personality (trait) and
anxiety as a response to a specific situation (state). Neither measure showed any
statistically significant differences between the high and low pain responder groups. As
discussed earlier, the “state” questionnaire was not specifically in relation to the
orthodontic separators; however, the STAI was administered just prior to commencing
the experimental procedures of Phase Two, for which the threat of pain had been
explained. The general indication shown is that dental anxiety can be a predictor of
orthodontic pain, but there is no influence from a generally anxious personality.
Clinical Implications
These findings show the importance of cortical processing for pain perception,
demonstrating that the pain perceived following orthodontic force application can be
influenced to a greater extent by psychological factors rather than from factors related
to the occlusion, dental anatomy or PDL. Dental anxiety and pain catastrophising were
found to significantly influence the pain reported over 48 hours following placement of
orthodontic elastomeric separators, with the magnification subscale of the PCS
explaining the most variation between pain responder types (high or low). Cold
sensitivity was also found to significantly modify the pain experienced; however, its
influence was smaller than that of the modification subscale of the PCS.
Clinicians may consider adding PCS and DAS questions into their new patient forms,
because pain catastrophising and dental anxiety appear to modify orthodontic pain
experience. The PCS involves 13 multiple choice questions (the magnification subscale
makes up three of these), and the DAS comprises four. They are quick to complete and
may provide information so that patient-specific management strategies can be
employed. These might include: ensuring they are given an opportunity to discuss their
worries and concerns prior to treatment; phoning patients within 24 hours of
orthodontic treatment, since this has been shown to reduce patients’ self-reported pain
and anxiety (Bartlett et al., 2005); or even ensuring that analgesic recommendations are
discussed. Clinicians would then be doing as much as possible to minimise orthodontic
discomfort.

61
Conclusion
Pain is a very subjective experience which may be influenced by genetic, psychological
and environmental factors, among others. Early and accurate identification of patients
who are more sensitive to orthodontic pain is currently not possible because valid
prognostic factors have not been discovered.
This study set out to determine whether high and low responders to pain caused by
orthodontic force application differed in regards to age, ethnicity, sex, self-rated oral
health, anxiety (both as a general aspects of personality and in response to a specific
situation), mood, dental anxiety and fear, catastrophising, genetics, general sensitivity
(cold) and tooth sensitivity. It identified three significant characteristics that may
modify the pain experience following application of orthodontic force: dental anxiety,
pain catastrophising and cold sensitivity. Age, sex, ethnicity, anxiety, mood, and tooth
sensitivity were not modifiers.
These findings highlight the importance of cortical processing for pain perception, as the
pain signal can be either enhanced, or reduced, thus influencing the pain experienced.
Based on our preliminary findings, it seems that a few screening questions may help to
identify patients at risk of a high pain response prior to commencing orthodontic
treatment, so that patient-specific management strategies can be employed to minimise
orthodontic discomfort.
Future directions for this research could look at sampling the general population, and
exploring the exciting field of genetic prediction, especially with respect to the COMT
gene, which is established as a modifier of individual susceptibility to TMD and orofacial
pain.

62
References
Abecasis GR, Cookson WOC (2000). GOLD—Graphical Overview of Linkage Disequilibrium. Bioinformatics 16(2):182-183.
Aitken RC (1969). Measurement of feelings using visual analogue scales. Proc R Soc Med 62(10):989-993.
Amir S, Brown ZW, Amit Z (1980). The role of endorphins in stress: Evidence and speculations. Neurosci Biobehav R 4(1):77-86.
Andersen S, Skorpen F (2009). Variation in the COMT gene: implications for pain perception and pain treatment. Pharmacogenomics 10(4):669-684.
Armfield JM (2010a). How do we measure dental fear and what are we measuring anyway? Oral Health Prev Dent 8(2):107-115.
Armfield JM (2010b). Towards a better understanding of dental anxiety and fear: cognitions vs. experiences. Eur J Oral Sci 118(3):259-264.
Armstrong CM, Hille B (1998). Voltage-gated ion channels and electrical excitability. Neuron 20(3):371-380.
Arntz A, van Eck M, Heijmans M (1990). Predictions of dental pain: the fear of any expected evil, is worse than the evil itself. Behav Res Ther 28(1):29-41.
Bartlett BW, Firestone AR, Vig KW, Beck FM, Marucha PT (2005). The influence of a structured telephone call on orthodontic pain and anxiety. Am J Orthod Dentofacial Orthop 128(4):435-441.
Bender IB, Landau MA, Fonsecca S, Trowbridge HO (1989). The optimum placement-site of the electrode in electric pulp testing of the 12 anterior teeth. J Am Dent Assoc 118(3):305-310.
Benedetti F, Carlino E, Pollo A (2010). How placebos change the patient's brain. Neuropsychopharmacol 36(1):339-354.
Bergius M, Kiliaridis S, Berggren U (2000). Pain in orthodontics. A review and discussion of the literature. J Orofac Orthop 61(2):125-137.

63
Bergius M, Berggren U, Kiliaridis S (2002). Experience of pain during an orthodontic procedure. Eur J Oral Sci 110(2):92-98.
Bergius M, Broberg AG, Hakeberg M, Berggren U (2008). Prediction of prolonged pain experiences during orthodontic treatment. Am J Orthod Dentofacial Orthop 133(3):331-338.
Besson JM (1999). The neurobiology of pain. Lancet 353(9164):1610-1615.
Bisgaard T, Klarskov B, Rosenberg J, Kehlet H (2001). Characteristics and prediction of early pain after laparoscopic cholecystectomy. Pain 90(3):261-269.
Buss AH, Plomin R (1984). Temperament: Early developing personality traits. Hillsdale, New Jersey: L. Erlbaum Associates
Carr DB, Goudas LC (1999). Acute pain. Lancet 353(9169):2051-2058.
Chapman V, Dickenson AH (1992). The spinal and peripheral roles of bradykinin and prostaglandins in nociceptive processing in the rat. Eur J Pharmacol 219(3–4):427-433.
Chaudhary P, Martenson ME, Baumann TK (2001). Vanilloid receptor expression and capsaicin excitation of rat dental primary afferent neurons. J Dent Res 80(6):1518-1523.
Corah NL (1969). Development of a dental anxiety scale. J Dent Res 48(4):596.
Corah NL, Gale EN, Illig SJ (1978). Assessment of a dental anxiety scale. J Am Dent Assoc 97(5):816-819.
Dalili F (2009). Pain Perception at Different Stages of Orthodontic Treatment. Doctoral Thesis, University of Kuopio, Finland.
De Jongh A, Muris P, ter Horst G, Van Zuuren FJ, De Wit CA (1994). Cognitive correlates of dental anxiety. J Dent Res 73(2):561-566.
Diatchenko L, Slade GD, Nackley AG, Bhalang K, Sigurdsson A, Belfer I et al. (2005). Genetic basis for individual variations in pain perception and the development of a chronic pain condition. Hum Mol Genet 14(1):135-143.

64
Diatchenko L, Nackley AG, Slade GD, Bhalang K, Belfer I, Max MB et al. (2006). Catechol-O-methyltransferase gene polymorphisms are associated with multiple pain-evoking stimuli. Pain 125(3):216-224.
Diatchenko L, Nackley AG, Tchivileva IE, Shabalina SA, Maixner W (2007). Genetic architecture of human pain perception. Trends Genet 23(12):605-613.
Duncan GH, Bushnell MC, Lavigne GJ (1989). Comparison of verbal and visual analogue scales for measuring the intensity and unpleasantness of experimental pain. Pain 37(3):295-303.
Edwards CL, Fillingim RB, Keefe F (2001). Race, ethnicity and pain. Pain 94(2):133-137.
Edwards RR, Haythornthwaite JA, Sullivan MJ, Fillingim RB (2004). Catastrophizing as a mediator of sex differences in pain: differential effects for daily pain versus laboratory-induced pain. Pain 111(3):335-341.
Edwards RR, Sarlani E, Wesselmann U, Fillingim RB (2005). Quantitative assessment of experimental pain perception: multiple domains of clinical relevance. Pain 114(3):315-319.
Enoch MA, Xu K, Ferro E, Harris CR, Goldman D (2003). Genetic origins of anxiety in women: a role for a functional catechol-O-methyltransferase polymorphism. Psychiatr Genet 13(1):33-41.
Fields HL (1999). Pain: an unpleasant topic. Pain Suppl 6:S61-69.
Fillingim RB, King CD, Ribeiro-Dasilva MC, Rahim-Williams B, Riley JL, 3rd (2009). Sex, gender, and pain: a review of recent clinical and experimental findings. J Pain 10(5):447-485.
Fuentes D, Gorenstein C, Hu LW (2009). Dental anxiety and trait anxiety: an investigation of their relationship. Br Dent J 206(8):E17.
Fujiyoshi Y, Yamashiro T, Deguchi T, Sugimoto T, Takano-Yamamoto T (2000). The difference in temporal distribution of c-Fos immunoreactive neurons between the medullary dorsal horn and the trigeminal subnucleus oralis in the rat following experimental tooth movement. Neurosci Lett 283(3):205-208.
Gabriel SB, Schaffner SF, Nguyen H, Moore JM, Roy J, Blumenstiel B et al. (2002). The structure of haplotype blocks in the human genome. Science 296(5576):2225-2229.

65
Gelfand S (1964). The Relationship of Experimental Pain Tolerance to Pain Threshold. Can J Psychol 18(36-42).
George SZ, Dover GC, Wallace MR, Sack BK, Herbstman DM, Aydog E et al. (2008a). Biopsychosocial influence on exercise-induced delayed onset muscle soreness at the shoulder: pain catastrophizing and catechol-o-methyltransferase (COMT) diplotype predict pain ratings. Clin J Pain 24(9):793-801.
George SZ, Wallace MR, Wright TW, Moser MW, Greenfield WH, 3rd, Sack BK et al. (2008b). Evidence for a biopsychosocial influence on shoulder pain: pain catastrophizing and catechol-O-methyltransferase (COMT) diplotype predict clinical pain ratings. Pain 136(1-2):53-61.
Greene MA, Boltax AJ, Lustig GA, Rogow E (1965). Circulatory dynamics during the cold pressor test. Am J Cardiol 16(54-60).
Hepler JR, Gilman AG (1992). G proteins. Trends Biochem Sci 17(10):383-387.
Hucho F, Weise C (2001). Ligand-Gated Ion Channels. Angew Chem Int Edit 40(17):3100-3116.
Jänig W, McLachlan EM (1992). Characteristics of function-specific pathways in the sympathetic nervous system. Trends Neurosci 15(12):475-481.
Jones M, Chan C (1992). The pain and discomfort experienced during orthodontic treatment - A randomized controlled clinical trial of 2 initial aligning arch wires. Am J Orthod Dentofacial Orthop 102(4):373-381.
Jones ML (1984). An investigation into the initial discomfort caused by placement of an archwire. Eur J Orthod 6(1):48-54.
Jones ML, Richmond S (1985). Initial tooth movement: force application and pain-a relationship? Am J Orthod 88(2):111-116.
Jones M, Chan C (1992). The pain and discomfort experienced during orthodontic treatment - A randomized controlled clinical-trial of 2 initial aligning arch wires. Am J Orthod 102(4):373-381.

66
Kardos T, Kieser J (2000). Clinical Oral Biology. Second ed. Dunedin: Otago University Print (pages 1-2).
Keefe FJ, Lumley M, Anderson T, Lynch T, Studts JL, Carson KL (2001). Pain and emotion: new research directions. J Clin Psychol 57(4):587-607.
Kelly DJ, Ahmad M, Brull SJ (2001). Preemptive analgesia I: physiological pathways and pharmacological modalities. Can J Anaesth 48(10):1000-1010.
Kim H, Lee H, Rowan J, Brahim J, Dionne RA (2006). Genetic polymorphisms in monoamine neurotransmitter systems show only weak association with acute post-surgical pain in humans. Mol Pain 2:24 (online).
Kitamura T, Takahashi T, Horiuchi H (1983). Electrical characteristics and clinical application of a new automatic pulp tester. Quintessence Int 1:45-53.
Klages U, Ulusoy O, Kianifard S, Wehrbein H (2004). Dental trait anxiety and pain sensitivity as predictors of expected and experienced pain in stressful dental procedures. Eur J Oral Sci 112(6):477-483.
Klages U, Kianifard S, Ulusoy O, Wehrbein H (2006). Anxiety sensitivity as predictor of pain in patients undergoing restorative dental procedures. Community Dent Oral Epidemiol 34(2):139-145.
Knox VJ, Shum K, McLaughlin DM (1977). Response to cold pressor pain and to acupuncture analgesia in oriental and occidental subjects. Pain 4:49-57.
Kolesnikov Y, Gabovits B, Levin A, Voiko E, Veske A (2011). Combined catechol-O-methyltransferase and mu-opioid receptor gene polymorphisms affect morphine postoperative analgesia and central side effects. Anesth Analg 112(2):448-453.
Koyama T, McHaffie JG, Laurienti PJ, Coghill RC (2005). The subjective experience of pain: where expectations become reality. P Natl Acad Sci USA 102(36):12950-12955.
Krishnan V (2007). Orthodontic pain: from causes to management-a review. Eur J Orthod 29(2):170-179.
Kumazawa T, Mizumura K, Minagawa M, Tsujii Y (1991). Sensitizing effects of bradykinin on the heat responses of the visceral nociceptor. J Neurophysiol 66(6):1819-1824.

67
Lee PJ, Delaney P, Keogh J, Sleeman D, Shorten GD (2011). Catecholamine-o-methyltransferase polymorphisms are associated with postoperative pain intensity. Clin J Pain 27(2):93-101.
Leung L (2012). Pain catastrophizing: an updated review. Indian J Psychol Med 34(3):204-217.
Lewis RA, Austen KF, Soberman RJ (1990). Leukotrienes and other products of the 5-lipoxygenase pathway. Biochemistry and relation to pathobiology in human diseases. New Eng J Med 323(10):645-655.
Li T, Ball D, Zhao J, Murray RM, Liu X, Sham PC et al. (2000). Family-based linkage disequilibrium mapping using SNP marker haplotypes: application to a potential locus for schizophrenia at chromosome 22q11. Mol Psychiatry 5(4):452.
Liebgott B (2001). The anatomical basis of dentistry. 2nd ed. St. Louis: Mosby (pages 268-271, 275, 404-409). Lin J, Chandler N, Purton D, Monteith B (2007). Appropriate electrode placement site for electric pulp testing first molar teeth. J Endod 33(11):1296-1298.
Lin J, Chandler NP (2008). Electric pulp testing: a review. Int Endod J 41(5):365-374.
Lipton JA, Marbach JJ (1984). Ethnicity and the pain experience. Soc Sci Med 19(12):1279-1298.
Litt MD (1996). A model of pain and anxiety associated with acute stressors: distress in dental procedures. Behav Res Ther 34(5-6):459-476.
Locker D (1988). Measuring oral health: a conceptual framework. Community Dent Health 5(1):3-18.
Locker D, Jokovic A, Clarke M (2004). Assessing the responsiveness of measures of oral health-related quality of life. Community Dent Oral Epidemiol 32(1):10-18.
Loggia ML, Schweinhardt P, Villemure C, Bushnell MC (2008). Effects of psychological state on pain perception in the dental environment. J Can Dent Assoc 74(7):651-656.
Lotta T, Vidgren J, Tilgmann C, Ulmanen I, Melen K, Julkunen I et al. (1995). Kinetics of human soluble and membrane-bound catechol O-methyltransferase: a revised

68
mechanism and description of the thermolabile variant of the enzyme. Biochemistry-US 34(13):4202-4210.
McCormack HM, Horne DJ, Sheather S (1988). Clinical applications of visual analogue scales: a critical review. Psychol Med 18(4):1007-1019.
McDaniel KF, Rowe NH, Charbeneau GT (1973). Tissue response to an electric pulp tester. J Prosthet Dent 29(1):84-87.
Melzack R (2001). Pain and the neuromatrix in the brain. J Dent Educ 65(12):1378-1382.
Merskey H, Bogduk N (1994). Classification of chronic pain: descriptions of chronic pain syndromes and definitions of pain terms: Seattle: IASP press (pages 209-214).
Michelotti A, Liguori R, Toriello M, D'Anto V, Vitale D, Castaldo G et al. (2013). Catechol-O-Methyltransferase (COMT) gene polymorphisms as risk factor in temporomandibular disorders patients from southern Italy. Clin J Pain (online article): 1-5.
Miles TS, Nauntofte B, Svensson P (2004). Clinical oral physiology. Copenhagen: Quintessence (pages 93, 101, 103, 104, 114, 116-118).
Mizumura K, Sugiura T, Katanosaka K, Banik RK, Kozaki Y (2009). Excitation and sensitization of nociceptors by bradykinin: what do we know? Ex Brain Res 196(1):53-65.
Mobilio N, Gremigni P, Pramstraller M, Vecchiatini R, Calura G, Catapano S (2011). Explaining pain after lower third molar extraction by preoperative pain assessment. J Oral Maxillofac Surg 69(11):2731-2738.
Muller E, Calvo M (2001). Pain and Dental Implantology: Sensory Quantification and Affective Aspects.: Part I: At the Private Dental Office. Implant Dent 10(1):14-22.
Mumford JM (1965). Pain perception threshold and adaptation of normal human teeth. Arch Oral Biol 10(6):957-968.
Närhi MVO (1985). The characteristics of intradental sensory units and their responses to stimulation. J Dent Res 64, 564–71.

69
Nielsen CS, Staud R, Price DD (2009). Individual differences in pain sensitivity: measurement, causation, and consequences. J Pain10(3):231-237.
Newton JT, Buck DJ (2000). Anxiety and pain measures in dentistry: a guide to their quality and application. J Am Dent Assoc 131(10):1449-1457.
Ngan P, Kess B, Wilson S (1989). Perception of Discomfort by Patients Undergoing Orthodontic Treatment. Am J Orthod Dentofacial Orthop 96(1):47-53.
Nicolay OF, Davidovitch Z, Shanfeld JL, Alley K (1990). Substance P immunoreactivity in periodontal tissues during orthodontic tooth movement. Bone Miner 11(1):19-29.
Okeson JP, Bell WE (2005). Bell's orofacial pains : the clinical management of orofacial pain. 6th ed. Chicago: Quintessence Pub. Co (pages 9-11, 13-41, 45-60, 87-89, 96, 97).
Ouvinen-Birgerstam P (1984). Jag tycker jag är. En metod för studier av barns och ungdomars självuppfattning. Manual: Stockholm: Psykologiförlaget.
Patel V (1989). Non-completion of orthodontic treatment: a study of patient and parental factors contributing to discontinuation in the hospital service and specialist practice. Thesis, University of Wales, Heath Park, UK.
Racich MJ (2005). Orofacial pain and occlusion: Is there a link? An overview of current concepts and the clinical implications. J Prosthet Dent 93(2):189-196.
Ranson SW (1918). An introduction to a series of studies on the sympathetic nervous system. J Comp Neurol 29(4):305-312.
Reich DE, Cargill M, Bolk S, Ireland J, Sabeti PC, Richter DJ et al. (2001). Linkage disequilibrium in the human genome. Nature 411(6834):199-204.
Revill SI, Robinson JO, Rosen M, Hogg MI (1976). The reliability of a linear analogue for evaluating pain. Anaesthesia 31(9):1191-1198.
Riley JL, 3rd, Robinson ME, Wise EA, Price DD (1999). A meta-analytic review of pain perception across the menstrual cycle. Pain 81(3):225-235.
Rosenstiel AK, Keefe FJ (1983). The use of coping strategies in chronic low back pain patients: relationship to patient characteristics and current adjustment. Pain 17(1):33-44.

70
Runeson BS, Rich CL (1994). Diagnostic and statistical manual of mental disorders, 3rd ed. (DSM-III), adaptive functioning in young Swedish suicides. Ann Clin Psychiatry 6(3):181-183.
Scheurer PA, Firestone AR, Burgin WB (1996). Perception of pain as a result of orthodontic treatment with fixed appliances. Eur J Orthod 18(4):349-357.
Sergl HG, Klages U, Zentner A (1998). Pain and discomfort during orthodontic treatment: causative factors and effects on compliance. Am J Orthod Dentofacial Orthop 114(6):684-691.
Sessle BJ (1987). The neurobiology of facial and dental pain: present knowledge, future directions. J Dent Res 66(5):962-981.
Slade GD, Diatchenko L, Bhalang K, Sigurdsson A, Fillingim RB, Belfer I et al. (2007). Influence of psychological factors on risk of temporomandibular disorders. J Dent Res 86(11):1120-1125.
Slade GD, Diatchenko L, Ohrbach R, Maixner W (2008). Orthodontic treatment, genetic factors and risk of temporomandibular disorder. Semin Orthod 14(2):146-156.
Soltis JE, Nakfoor PR, Bowman DC (1971). Changes in ability of patients to differentiate intensity of forces applied to maxillary central incisors during orthodontic treatment. J Dent Res 50(3):590-596.
Spielberger CD, Gorsuch RL, Lushene RE (1970). STAI Manual for the Stait-Trait Anxiety Inventory ("Self-Evaluation Questionnaire"). Palo Alto: Consulting Psychologists Press, Inc.
Stein MB, Fallin MD, Schork NJ, Gelernter J (2005). COMT polymorphisms and anxiety-related personality traits. Neuropsychopharmacol 30(11):2092-2102.
Stewart AL, King AC (1994). Conceptualizing and measuring quality of life in older populations. In: Aging and quality of life. New York, USA. Springer Publishing Co xvii (pages 27-54).
Sullivan MJ, Neish N (1999). The effects of disclosure on pain during dental hygiene treatment: the moderating role of catastrophizing. Pain 79(2-3):155-163.

71
Sullivan MJ, Stanish W, Sullivan ME, Tripp D (2002). Differential predictors of pain and disability in patients with whiplash injuries. Pain Res Manag 7(2):68-74.
Sullivan MJL, Bishop SR, Pivik J (1995). The Pain Catastrophizing Scale: Development and validation. Psychol Assessment 7(4):524-532.
Sullivan MJL, Neish NR (1998). Catastrophizing, anxiety and pain during dental hygiene treatment. Community Dent Oral Epidemiol 26(5):344-349.
Sullivan MJL, Tripp DA, Santor D (2000). Gender differences in pain and pain behavior: The role of catastrophizing. Cognitive Ther Res 24(1):121-134.
Sullivan MJL, Martel MO, Tripp D, Savard A, Crombez G (2006). The relation between catastrophizing and the communication of pain experience. Pain 122(3):282-288.
Svensson P, Baad-Hansen L, Pigg M, List T, Eliav E, Ettlin D et al. (2011). Guidelines and recommendations for assessment of somatosensory function in oro-facial pain conditions - a taskforce report. J Oral Rehabil 38(5):366-394.
Tchivileva IE, Lim PF, Smith SB, Slade GD, Diatchenko L, McLean SA et al. (2010). Effect of catechol-O-methyltransferase polymorphism on response to propranolol therapy in chronic musculoskeletal pain: a randomized, double-blind, placebo-controlled, crossover pilot study. Pharmacogenet Genomics 20(4):239-248.
Tickle M, Milsom K, Crawford FI, Aggarwal VR (2012). Predictors of pain associated with routine procedures performed in general dental practice. Community Dent Oral Epidemiol 40(4):343-350.
Todd KH, Deaton C, D’Adamo AP, Goe L (2000). Ethnicity and analgesic practice. Ann Emerg Med 35(1):11-16.
Vassend O (1993). Anxiety, pain and discomfort associated with dental treatment. Behav Res Ther 31(7):659-666.
von Baeyer CL, Piira T, Chambers CT, Trapanotto M, Zeltzer LK (2005). Guidelines for the cold pressor task as an experimental pain stimulus for use with children. Pain 6(4):218-227.
Walsh NE, Schoenfeld L, Ramamurthy S, Hoffman J (1989). Normative model for cold pressor test. Am J Phys Med Rehabil 68(1):6-11.

72
Watson D, Clark LA, Tellegen A (1988). Development and validation of brief measures of positive and negative affect: the PANAS scales. J Pers Soc Psychol 54(6):1063-1070.
Woodrow KM, Friedman GD, Siegelaub AB, Collen MF (1972). Pain tolerance: differences according to age, sex and race. Psychosom Med 34(6):548-556.
Woolf CJ, Doubell TP (1994). The pathophysiology of chronic pain—increased sensitivity to low threshold Aβ-fibre inputs. Curr Opin Neurobiol 4(4):525-534.
Yamashiro T, Satoh K, Nakagawa K, Moriyama H, Yagi T, Takada K (1998). Expression of Fos in the rat forebrain following experimental tooth movement. J Dent Res 77(11):1920-1925.
Young EE, Lariviere WR, Belfer I (2012). Genetic basis of pain variability: recent advances. J Med Genet 49(1):1-9.
Zubieta JK, Heitzeg MM, Smith YR, Bueller JA, Xu K, Xu Y et al. (2003). COMT val158met genotype affects mu-opioid neurotransmitter responses to a pain stressor. Science 299(5610):1240-1243.

73
Appendix I

74

75

76
Appendix II
Budget
Materials and consumables
Cheek Swab Collection Kit - 25 @ $29.30 per person = $732.50
Red Stamp 25 Litre Chilly Bin - 3 @ $24.99 = $74.97
Aqua One (Sydney, Australia) ST-3 Electronic Thermometer $13
DSE Digital LCD Stopwatch $14
Gift Vouchers for Phase Two participants 20 @ $50 = $1000
iPod Touch 2 @ $259.99 = $519.98
Technical Services
Genetic testing-
Set-up Cost (TaqMan probes) - 3 @ $614 per COMT SNP = $1842
Genetic testing of COMT variations - $100
Total $4296
$2855 Funded by the Foundation for Orthodontic Research and Education, NZAO (FORENZAO) Charitable Trust
$1441 Funded by a Fuller Scholarship, Sir John Walsh Research Institute

77
Appendix III
Factors Associated with Orthodontic Pain
Phase One
Sex (please circle)
Male Female
Date of Birth
_____________________
Ethnicity (please circle)
NZ European
Māori
Pacific Islander
European
Asian
Other (please specify) _______________
ID Number

78
The clinician will go through this section with you:
Anxiety disorders or depressive illness Yes/No
Raynaud’s phenomenon Yes/No
Chronic pain syndromes Yes/No
Use of neurologically-acting medication or medication Yes/No
Spacing between mandibular teeth Yes/No
Active decay or gum disease Yes/No
Large fillings, previous trauma or root canal treatment on upper central incisors Yes/No
Following insertion of the separating rings, you are requested to complete the Visual Analogue
Scales (VAS) on the following pages.
The first one will be completed under supervision, immediately following insertion. After this,
you are required to complete a VAS at the following times:
Four hours after insertion
Evening One before retiring
Morning One shortly after rising
Evening Two before retiring
Morning Two shortly after rising
You are required to bring these forms back with you on Day Two, when you return to have the
separating rings removed.

79
Immediately post-insertion
On the line below, place a vertical line to describe your current pain level.
No pain
at all
Worst pain
imaginable

80
Four hours post-insertion
On the line below, place a vertical line to describe your current pain level.
On the line below, place a vertical line to describe the maximum pain level experienced since the
last questionnaire.
No pain
at all
Worst pain
imaginable
No pain
at all Worst pain
imaginable

81
Evening One
On the line below, place a vertical line to describe your current pain level.
On the line below, place a vertical line to describe the maximum pain level experienced since the
last questionnaire.
No pain
at all
Worst pain
imaginable
No pain
at all Worst pain
imaginable

82
Morning One
On the line below, place a vertical line to describe your current pain level.
On the line below, place a vertical line to describe the maximum pain level experienced since the
last questionnaire.
No pain
at all
Worst pain
imaginable
No pain
at all Worst pain
imaginable

83
Evening Two
On the line below, place a vertical line to describe your current pain level.
On the line below, place a vertical line to describe the maximum pain level experienced since the
last questionnaire.
No pain
at all Worst pain
imaginable
No pain
at all Worst pain
imaginable

84
Morning Two
On the line below, place a vertical line to describe your current pain level.
On the line below, place a vertical line to describe the maximum pain level experienced since the
last questionnaire.
Thank you for your participation.
Please return to the Orthodontic clinic this morning at the scheduled time to have the separating
rings removed.
No pain
at all Worst pain
imaginable
No pain
at all Worst pain
imaginable

85
Appendix IV
Factors Associated with Orthodontic Pain
Phase Two
Please complete every question in this questionnaire.
The Positive And Negative Affectivity Schedule
This scale consists of a number of words that describe different feelings and emotions. Read each
item and then mark the appropriate answer in the space next to that word. Indicate to what
extent you generally feel this way, that is, how you feel on average.
Use the following scale to record your answers.
____ interested ____ irritable
____ distressed ____ alert
____ excited ____ ashamed
____ upset ____ inspired
____ strong ____ nervous
____ guilty ____ determined
____ scared ____ attentive
____ hostile ____ jittery
____ enthusiastic ____ active
____ proud ____ afraid
ID Number
1
Very slightly
or not at all
2
A little
3
Moderately
4
Quite a bit
5
Extremely

86
Corah Dental Anxiety Scale
This next section asks more about how you feel when you go to the dentist. For each question, please
tick the box of the answer which comes closest to how you feel.
If you had to go to the dentist tomorrow, how would you feel about it?
I would look forward to it as a reasonably enjoyable experience
I wouldn’t care one way or the other
I would be a little uneasy about it
I would be afraid that it would be unpleasant and painful
I would be very frightened of what the dentist might do
When you are waiting in the dentist’s surgery for your turn in the chair, how do you feel?
Relaxed
A little uneasy
Tense
Anxious
So anxious that I sometimes break out in a sweat or almost feel physically sick
When you are waiting in the dentist’s chair while they get their drill ready to begin working on your teeth, how do you feel?
Relaxed
A little uneasy
Tense
Anxious
So anxious that I sometimes break out in a sweat or almost feel physically sick
You are waiting in the dentist’s chair to have your teeth cleaned. While you are waiting and the dentist is getting out the instruments which they will use to scrape your teeth around the gums, how do you feel?
Relaxed
A little uneasy
Tense
Anxious
So anxious that I sometimes break out in a sweat or almost feel physically sick

87
Locker’s Global Item
How would you describe the health of your teeth and mouth?
Excellent (1) Very good (2) Good (3) Fair (4) Poor (5)

88
Som
ewh
at
The State-Trait Anxiety Inventory:
A number of statements which people have used to describe themselves are given below. Read
each statement and then circle the most appropriate number to the right of the statement to
indicate how you feel right now, that is, at this moment. There are no right or wrong answers. Do
not spend too much time on any one statement but give the answer which seems to describe your
present feelings best.
1. I feel calm 1 2 3 4
2. I feel secure 1 2 3 4
3. I am tense 1 2 3 4
4. I am regretful 1 2 3 4
5. I feel at ease 1 2 3 4
6. I feel upset 1 2 3 4
7. I am presently worrying over possible misfortunes 1 2 3 4
8. I feel rested 1 2 3 4
9. I feel anxious 1 2 3 4
10. I feel comfortable 1 2 3 4
11. I feel self-confident 1 2 3 4
12. I feel nervous 1 2 3 4
13. I am jittery 1 2 3 4
14. I feel “high strung” 1 2 3 4
15. I am relaxed 1 2 3 4
16. I feel content 1 2 3 4
17. I am worried 1 2 3 4
18. I feel over-excited and “rattled” 1 2 3 4
19. I feel joyful 1 2 3 4
20. I feel pleasant 1 2 3 4
No
t at all
Mo
derately so
Very m
uch
so

89
No
t at all
Mo
derately so
Very m
uch
so
A number of statements which people have used to describe themselves are given below. Read
each statement and then circle the most appropriate number to the right of the statement to
indicate how you generally feel. There are no right or wrong answers. Do not spend too much
time on any one statement but give the answer which seems to describe how you generally feel.
21. I feel pleasant 1 2 3 4
22. I tire quickly 1 2 3 4
23. I feel like crying 1 2 3 4
24. I wish I could be as happy as others seems to be 1 2 3 4
25. I am losing out on things because I can’t make up my
mind soon enough 1 2 3 4
26. I feel rested 1 2 3 4
27. I am “calm, cool, and collected” 1 2 3 4
28. I feel that difficulties are piling up on me so that I
cannot overcome them 1 2 3 4
29. I worry too much over something that really doesn’t matter 1 2 3 4
30. I am happy 1 2 3 4
31. I am inclined to take things hard 1 2 3 4
32. I lack self-confidence 1 2 3 4
33. I feel secure 1 2 3 4
34. I try to avoid facing a crisis or difficulty 1 2 3 4
35. I feel blue 1 2 3 4
36. I am content 1 2 3 4
37. Some unimportant thought runs through my mind
and bothers me 1 2 3 4
38. I take disappointments so keenly that I can’t put
them out of my mind 1 2 3 4
39. I am a steady person 1 2 3 4
40. I get in a state of tension or turmoil as I think over
my recent concerns and interests 1 2 3 4
Som
ewh
at

90
Pain Catastrophising Scale
A number of statements which people have used to describe themselves are given below. Read
each statement and then circle the most appropriate number to the right of the statement to
indicate how you feel when you have pain. There are no right or wrong answers. Do not spend
too much time on any one statement but give the answer which seems to describe your feelings
best
“When I have pain…”
1. I worry all the time about whether the 0 1 2 3 4
pain will end
2. I feel I can’t go on 0 1 2 3 4
3. It’s terrible and I think it’s never going
to get any better 0 1 2 3 4
4. It’s awful and I feel that it overwhelms me 0 1 2 3 4
5. I feel I can’t stand it anymore 0 1 2 3 4
6. I become afraid that the pain may get worse 0 1 2 3 4
7. I think of other painful experiences 0 1 2 3 4
8. I anxiously want the pain to go away 0 1 2 3 4
9. I can’t seem to keep it out of my mind 0 1 2 3 4
10. I keep thinking about how much it hurts 0 1 2 3 4
11. I keep thinking about how badly I want the
pain to stop 0 1 2 3 4
12. There is nothing I can do to reduce the
intensity of the pain 0 1 2 3 4
13. I wonder whether something serious may
happen 0 1 2 3 4
No
t at all
To
a slight d
egree
To
a mo
derate d
egree
To
a great degree
All th
e time

91
Appendix V
Factors Associated with Orthodontic Pain
Phase Two
Cold Pressor Test (non-dominant hand, 5cm from ulnar process)
Warm water temperature at start ___________°C
Cold Water:
Temperature at start ___________°C
Temperature at 1 minute ___________°C
Temperature at 2 minutes ___________°C
Temperature at conclusion ___________°C
Time in cold (if not full 3 minutes) ______:_______ (mins:secs)
ID Number

92
Electric Pulp Testing
Output Reading at Initial Sensation 1 (tooth 21) ______________
Output Reading at Initial Sensation 2 (tooth 21) ______________
Output Reading at Initial Sensation 3 (tooth 21) ______________
Output Reading at Maximum Tolerance 1 (tooth 11) ______________
Output Reading at Maximum Tolerance 2 (tooth 11) ______________
Output Reading at Maximum Tolerance 3 (tooth 11) ______________
Hair Colour _______________
Saliva Test
*No bubbles & must be completed within 30mins

93
Appendix VI
Cold Pressor Test
1 Minute
On the line below, place a vertical line to describe the maximum pain level experienced.
ID Number
No pain
at all Worst pain
imaginable

94
2 Minutes
On the line below, place a vertical line to describe the maximum pain level experienced.
No pain
at all Worst pain
imaginable

95
3 Minutes
On the line below, place a vertical line to describe the maximum pain level experienced.
No pain
at all Worst pain
imaginable

96
Appendix VII
Electric Pulp Testing
Threshold 1
On the line below, place a vertical line to describe the maximum pain level experienced.
ID Number
No pain at all
Worst pain imaginable

97
Threshold 2
On the line below, place a vertical line to describe the maximum pain level experienced.
No pain at all
Worst pain imaginable

98
Threshold 3
On the line below, place a vertical line to describe the maximum pain level experienced.
No pain at all
Worst pain imaginable

99
Maximum Tolerance 1
On the line below, place a vertical line to describe the maximum pain level experienced.
No pain
at all Worst pain
imaginable

100
Maximum Tolerance 2
On the line below, place a vertical line to describe the maximum pain level experienced.
No pain
at all Worst pain
imaginable

101
Maximum Tolerance 3
On the line below, place a vertical line to describe the maximum pain level experienced.
No pain
at all Worst pain
imaginable