factors associated with chronic pain in teenagers · to determine the prevalence of chronic...
TRANSCRIPT

INESE GOBINA
CHRONIC PAIN AND ASSOCIATED FACTORS IN ADOLESCENTS
SUMMARY OF DOCTORAL THESIS
Public health and epidemiology
Scientific supervisor:
Dr.med., Assoc.Prof. Anita Villerusa
Riga, 2010
2
Scientific supervisor: Dr.med., Assoc. Prof. Anita Villerusa Approved reviewers: Dr. Med. Prof. Inara Logina (Riga Stradins University) Dr. Med. Valdis Folkmanis (University of Latvia) Dr. Med., Prof. Jurate Klumbiene (Lithuanian University of Health Sciences)
The doctoral studies were supported by the project "Support for
implementation of doctoral studies and postdoctoral research in medicine” and the project „Support to doctoral studies and postdoctoral research at Rigas Stradins University” of the ESF National programme “Support of implementation of doctoral studies and postdoctoral research”. Presentation of doctoral thesis will be held on the 21st of February, 2011 in the Hippocrates Lecture Room of the Riga Stradins University, Dzirciema Street 16, Riga. The Doctoral thesis is available at the library of Riga Stradins University. Secretary of the Doctoral Board: Dr habil. med., Prof. Līga Aberberga - Augškalne
3
Content 1. Introduction................................................................................................................4
2. Aim, Objectives and Hypotheses................................................................................5
3. Conceptual Model......................................................................................................6
4. Novelty and Practical Application.............................................................................7
5. Structure of the Doctoral Thesis……………………………………………………8
6. Materials and Methods..............................................................................................8
7. Results......................................................................................................................14
7.1. Prevalence of chronic pain in adolescents and changes from 1994 – 2006..........14
7.1.1. Prevalence of chronic pain.................................................................................14
7.1.2. Combination of chronic pain..............................................................................16
7.1.3. Chronic pain prevalence trends from 1994 to 2006...........................................18
7.2. Chronic pain and other health complaints……………………………………….20
7.3. Chronic pain in adolescents with chronic illness..................................................24
7.4. Chronic pain and use of medication......................................................................26
7.5. Chronic pain and adolescent lifestyle....................................................................29
7.5.1. Chronic pain and smoking..................................................................................29
7.5.2. Chronic pain and alcohol use………………………………………………….32
7.5.3. Chronic pain and vigorous physical activity......................................................34
7.6. Chronic pain and subjective socio-economic status..............................................35
7.7. Chronic pain and adolescent communication with parents and friends................38
7.7.1. Chronic pain and adolescent relationships with their parents............................38
7.7.2. Chronic pain and adolescent relationships with friends.....................................41
7.8. Chronic pain and academic performance..............................................................45
7.9. Chronic pain and bullying at school......................................................................52
8. Conclusions………………………………………………………………………..56
9. Recommendations…………………………………………………………………57
10. Publications and reports........................................................................................57
11.References………………………………………………………………………...59

4
1. Introduction
Chronic pain is one of the most frequent somatic health complaints of the adult
population. The costs associated with its diagnosis and treatment are significant.1
Comparatively little is known about chronic pain and associated risk factors in the
adolescent population.
In its essence pain is a distinctly subjective phenomenon. Thus, the most
valuable information in assessing pain (localization, duration, intensity, influence on
daily activities etc.) in epidemiological studies, also among adolescent population, is
that gained from the individual. In pain research subjective individual information can
be considered the „golden standard”.2,3,4
The International Association of the Study of Pain (IASP) defines pain as „an
unpleasant sensory and emotional experience associated with actual or potential tissue
damage or described in terms of such damage”.5,6 In this definition, which is widely
use in pain research, attention is given towards subjective experience of pain
regardless of is primary causes. Especially in the studies in general population, the
case definition of chronic pain doesn’t describe clinical diagnosis. Chronic pain is
characterized by the heterogeneity in etiology and manifestation of symptoms;
thereby, the chronic pain itself is a health problem and central focus of research.
Most studies on chronic pain include individuals who have sought their
doctor’s or pediatrician’s advice. But this type of selection principle is not
representative within the general adolescent population. The individuals in clinical
settings may differ regarding several research parameters, for example, general health
condition.7,8,9 Research results show that in most cases adolescents do not seek
medical attention in cases of chronic pain. However, health care utilization continues
to be high for those adolescents seeking medical help because of chronic pain.10,11,12
Complaints of localized chronic pain are one of the most weekly health
complaints among adolescents. Existing epidemiological research shows that on
average of 20% – 50% of the adolescent population complains of some sort of chronic
pain. 12,13,14,15 The results are subject to variations due to pain case definition as well
as differences in research methods.
Existing European studies reveal an increase in the prevalence of chronic pain
among adolescents over the last 20 years.16,17,18 Chronic pain also at such a young age
has a negative effect on quality of life and daily functioning.9,19,20,21 Moreover, the

5
cohort studies suggest that complaints about chronic pain in childhood and
adolescence result not only in the risk of chronic pain but also can lead to other
chronic health disorders later in adulthood. 8,22
There has been no research in Latvia on the prevalence of chronic pain and
associated factors among adolescents. The information available from international
studies on factors associated with chronic pain in adolescents is fairly limited and
often contradictory, making mutual comparison difficult. The main research issue
raised in this thesis is determining the prevalence of chronic headache, stomach ache
and back pain among adolescents based on gender and analyzing the association of
chronic pain with other health indicators and certain lifestyle and psychosocial
factors.
2. Aim, Objectives and Hypotheses
Aim: to study the prevalence of chronic headache, stomachache and backache and
associated health, lifestyle and psychosocial factors in Latvian adolescents.
Objectives:
1. To determine the prevalence of chronic headache, stomach ache and back pain
in adolescents from 1994 – 2006.
2. To study the association between chronic pain and other indicators of
adolescent health.
3. To determine the association between chronic pain and factors characteristic
of adolescent lifestyle.
4. To study the association between chronic pain and psychosocial factors in the
family and at school.
5. To assess the independent effect of health, lifestyle and psychosocial factors
on chronic headache, stomach ache and back pain in adolescents adjusting by
age and other health complaints in multiple logistic regression analysis.
Hypotheses:
– Chronic pain is related to adolescent lifestyle and psychosocial factors.
– The effect of factors associated with chronic pain differs among boys and girls.

6
3. Conceptual Model
The theoretical framework of this doctoral thesis is based on bio-psychosocial
model of pain. According to this model, each individual’s complaints of and reaction
to pain is determined by a complex interaction of biological, psychological and social
factors. Fig.3.1. shows the conceptual model of the study presented in the doctoral
thesis.
Fig. 3.1. Conceptual model of the study
The main variable of interest in the study is chronic pain – headache, stomach
ache and back pain. In this study chronic pain in adolescents is defined as pain that
recurs at least once per week over a six-month period.
The associated factors of chronic pain studied in this study can be divided in
three broad categories: (1) health, (2) lifestyle and (3) psychosocial. Age and gender
were taken into account in statistical analysis as significant determinants for both
Health indicators: Chronic illnesses Health complaints
Lifestyle indicators: Alcohol use
Smoking Physical activity
Psychosocial indicators: Perceived family affluence Relationship with parents Relationship with friends
Bullying at school Academic performance
Headache
Stomach ache
Back pain
Medicine use
Demographic values: Gender
Age
7
chronic pain and associated factors. In the statistical analysis the chronic pain is
selected as the dependent variable with the only exception being the case of the
association with medicine in which the chronic pain was chosen as the independent
variable.
It should be noted that the study design used in the data analysis is a cross-
sectional; hence it is not possible to prove the true direction of the associations and
causality. The choice of independent or dependent study variables is based on the aim
of the study, theoretical considerations as well as the results of other research studies.
The true direction of associations notwithstanding, the measures of association
between chronic pain and studied factors remains quantitatively unchanged.
4. Novelty and Practical Application
This doctoral thesis presents the first study of the prevalence of chronic pain
and associated factors among adolescents in Latvia. The data collected in the surveys
of Health Behavior Study in School-aged Children (HBSC) in Latvia from 1994 –
2006 provides the basis for assessment of distribution trends of chronic pain among
adolescents over a longer period of time.
An important advantage of this study is the considerable number of
respondents (n = 15319) representing Latvian adolescents ages 11, 13 and 15. This
number of respondents ensures sufficient statistical power for a stratified data analysis
and testing for a statistical interaction, allowing a separate analysis of chronic pain
factors in boys and girls as well as assessment of differences in age groups.
A multiple logistic regression analysis is used to assess the influence of factors
associated with chronic pain. Logistic regression analysis allows the assessment of
each factor (health, lifestyle, psychosocial) independent of other factors such as age
and other health complaints. Such analysis of factors associated with chronic pain in
different adolescent gender and age groups using appropriate statistical methods have
not previously been carried out in Latvia and have been comparatively little studied as
part of other international epidemiological studies.
The information gained by this study might have practical clinical application
especially as part of primary health care in dealing with chronic pain problems in
adolescents using a bio-psychosocial approach. The findings suggest the information

8
on adolescent psychosocial and lifestyle factors could be useful and important not
only in diagnosing chronic pain, especially procuring anamnesis, but also in choosing
the best and most effective chronic pain therapy for adolescents.
For the first time the problem of chronic pain among adolescents in Latvia is
presented to public health professionals. The identification of factors associated with
chronic pain in a representative sampling of adolescents in Latvia by using
appropriate statistical methods ensures evidence-based information enabling the
development of further public health programs that address the chronic pain issue in
promoting health in adolescents.
5. Structure of the Doctoral Thesis
The doctoral thesis is written in Latvian. It consists of nine sections: the
introduction, an overview of the literature, materials and methods, results, discussion,
conclusions, scientific novelty and recommendations, the bibliography and addenda.
The work consists of 200 pages and includes 63 tables and 15 figures; 266 sources are
referred to in the doctoral thesis.
6. Materials and Methods
The data collected in the surveys of Health Behavior Study in School-aged
Children in Latvia from 1994 – 2006 was used as the basis for the research. The
Health Behavior in School-aged Children Study (HBSC) is an international school-
based survey supported by the World Health Organization and includes 41 participant
countries (www.hbsc.org). Latvia joined the HBSC project in 1990/1991. The
Principal Investigator of HBSC in Latvia from 1990 – 2000 was Prof. Ieva Ranka
(Medical Academy of Latvia/Riga Stradins University) but from 2001 the Principal
Investigator is Dr. Iveta Pudule (The Centre of Health Economics).
The study methods are standardized for all HBSC participant countries. The
study design of HBSC is cross-sectional. The survey is carried out every 4 years. The
target audience consists of general education students aged 11, 13 and 15. The
standardized questionnaire prepared by the international scientific work group is used

9
as the method of measurement in this study. The HBSC surveys in Latvia were
administered by specially trained personnel and ensured student anonymity and the
right to refuse to answer the questionnaire. The time allotted for filling out the
questionnaire was one classroom hour.
The surveys of HBSC Latvia were conducted with the support of the Ministry
of Health, the Ministry of Science and Education and WHO Country Office in Latvia.
Sampling
The data gained from four HBSC Latvia surveys conducted from 1994 – 2006
were used in the analysis. A representative selection of participants was achieved by
using the multilevel cluster sampling with probability proportional to size selecting
schools and classes at random from the Ministry of Science and Education school
registry. The initial sampling included only general education schools, excluding
schools for children with special needs and those whose teaching language is not
Latvian or Russian. Classes were selected at random, one from each class group. The
total number of adolescents studied from all the surveys conducted from 1994 – 2006
is 15319 (Table 6.1).
Table 6.1. The number of respondents and response rate per HBSC surveys in Latvia
Survey year Number of respondents Response rate 1993/1994 3818 92% 1997/1998 3775 94% 2001/2002 3481 80% 2005/2006 4245 82%
In further tables and figures the short form of the survey year is used showing
only the last period of academic year.
Measurements
In this study the association between chronic pain and the following factors
was determined: 1) other health indicators such as other health complaints, chronic
illnesses, medicine use; 2) specific lifestyle factors such as smoking, alcohol use,
vigorous physical activity; 3) psychosocial factors such as perceived family affluence,
relationship with family members and friends, bullying, academic achievement and
academic stress.

10
The main variables revealed by results analysis are headache, stomach ache
and back pain. Frequency of pain was assessed based on health complaints over the
last six months on a five point scale – „almost every day”, „more than once a week”,
„almost every week”, „almost every month”, and „seldom or never”. The proportion
of students not answering based on type of pain is between 1% and 1.7% (Addendum
1). Those respondents who complained of pain at least once a week over the last six
months fit the definition of chronic pain used in this study.
Other health indicators considered as possibly associated with chronic pain in
adolescents included other health complaints, chronic illness and use of medication.
Health complaints were measured with HBSC Symptom Check List and included the
frequency of irritability or bad temper, anxiety, difficulty falling asleep, and dizziness
over the last six months, with the respondents commenting on each complaint
separately. The same answer categories were used as for pains. The frequency of
health complaints was dichotomized for the purpose of data analysis as in the case of
pain – adolescents having health complaints weekly or rarely/never.
In order to determine the prevalence of chronic illnesses, the respondents
were asked to respond with a „yes” or „no” based only on a doctor’s diagnosis of
chronic illness. The relationship between chronic pain and chronic illness was
analyzed using 2006 survey results (n = 4245) since the question of chronic illnesses
was not included in the other surveys. Use of medication among adolescents was
determined by asking about use of medication over the last month for a) headache, b)
stomach ache, c) anxiety, and d) difficulty falling asleep by answering „yes” or „no”.
The relationship between chronic pain and use of medication was analyzed using
1994, 1998 and 2006 survey results (n = 11838).
Considering the comparability of the items in the questionnaire of the HBSC
surveys in Latvia from 1994 – 2006 (n = 15319), the lifestyle factors selected for
assessment as related to chronic pain were smoking, alcohol use and vigorous
physical activity. Students who smoke or use alcohol (beer and/or wine and/or
spirits) every day or at least once a week were analyzed. Sufficient vigorous physical
activity was defined as participating at least 2 – 3 times per week at least one hour per
week in the physical activities that produce sweat and hard breathing. [26]
Considering the comparability of the used questions in the HBSC surveys in
Latvia from 1994 – 2006 (n = 15319), the following psychosocial factors were
selected for data analysis: the student’s subjective assessment of his family’s

11
affluence, communication with friends and parents, and school associated factors such
as academic achievement, academic stress and bullying. The perceived family’s
affluence was used to define the socioeconomic condition of adolescents. Adolescents
were asked about how well-off their families are with answer categories: “very well-
off”, “quite well-off”, “average”, “not so well-off” and “not at all well-off”. The data
analysis with combining the first and last two answer categories resulted in three
groups of respondents rating their family’s affluence level as (1) high, (2) middle, and
(3) low.
In order to measure the family and friends communication, the respondents
were asked to evaluate how easy it is to discuss various bothering problems with their
mother, father, same gender friends or friends of the opposite gender on a five point
scale: „very easy”, „easy”, „difficult”, „very difficult”, and „don’t have or see this
person”. To assess the association between chronic pain and difficulties to
communicate, the respondents answering „don’t have or see this person” were
omitted from the analysis (no father – 13.3%. no mother – 2.7%. no friends of the
opposite gender – 16.4%. no friends of the same gender – 7.2%). For purposes of data
analysis the responses were divided in two categories where the communication with
parents or friends was very easy/easy or difficult/very difficult.
The adolescents were also asked how they felt their teachers evaluate their
academic success compared with that of their classmates with these possible answers:
„very good”, „good”, and „average”, „below average”. The respondents were also
asked to rate their academic stress with the question about how pressured do they felt
by the schoolwork with the following answers: „none”, „a little”,” some”, „a lot”;
the first two response categories were combined in the data analysis.
In order to assess the prevalence of bullying in schools, the respondents were
asked two questions about the last couple of months: „how often have you been
bullied at school? and „how often have you taken part in bullying other student(s) at
school?” Possible answers: „this has not happened”, „once or twice”, „2 – 3 times a
month”, „about once a week”, „several times a week”. Data analysis included only
those students responding to both questions. Considering the answers given, the
respondents were grouped in four categories: „have not been bullied and have not
bullied” (neutrals), „have only been bullied” (victims), „have only bullied others”
(bullies), „have bullied others and been bullied” (bullies/victims). Based on
validation studies, frequency of bullying from „2 – 3 times a month” was considered

12
the control group in order to classify the respondents in one of three bullying
categories (victims, bullies, victims/bullies). [27]
Statistical analysis
The χ² test was used to compare the subgroups for data analysis in 2x2 tables.
The percentage differences were tested to compare three or more independent groups.
Confidence Interval Analysis software (CIA 2.1.2.) was used to determine the
confidence interval of percentage differences. Linear regression was used to assess the
chronic pain prevalence trends from 1994 – 2006. In order to determine the
association between analyzed types of chronic pain and also mutual association
among other health complaints, log-linear analysis was used which is applicable to
multi-way frequency tables.
Given the fact that the selection of respondents was done not based on
individual cases but on the cluster sampling of schools and classes from the state
school registry, it was necessary to assess the possible influence of the selection
method. This was done with statistics software MLwiN 2.11, computing the
Intraclass Correlation Coefficient – ICC in order to assess the degree of chronic pain
variation in the classes. The ICC for headache, stomach ache and back pain varied
from 0.01 – 0.026, thus indicating that the cluster selection method has no significant
effect on the results of the study. For this reason multiple logistic regression analysis
was used to analyze the results using a single level (student) model in statistical
software SPSS 16.0.
The association between specific factors and chronic pain is expressed in the
form of an odds ratio – OR, which shows the odds of chronic pain in adolescents
based on comparison of factors with the adolescents in reference group (pain seldom
or never). If the OR is greater than 1 the odds of chronic pain related to the specific
factor is greater than in the reference group, but if the OR is less than 1, chronic pain
based on this factor is less than in the reference group. The statistical differences of
regression coefficients between multiple answer categories of independent variables
except the reference category were tested with χ2 test in the statistical software
MLwiN 2.12. In order to evaluate the effect of each specific factor on chronic pain
independently from other factors such as age, adjustment was used. The significance
of the change in relationship between various factors after controlling for other

13
variables was assessed given that regression coefficient changes of greater than 10%
were chosen a cutoff for an important change in the estimate.
Considering that a total of four HBSC Latvia surveys from 1994 – 2006 were
used in the data analysis, a survey year-adjusted results in logistic regression are
shown in the results section. There were no significant differences of ORs in the crude
models of logistic regression compared with survey year-adjusted models. In the
summary of this thesis most of the logistic regression results are already age adjusted,
because in the most cases the OR estimates were similar to results prior to adjustment,
with the changes of ORs all under 10%. The one exception is the case of the
association between chronic pain with smoking and alcohol use where significant
changes of ORs after the adjustment by age were observed, and this is also shown in
results section of the summary.
Since the prevalence of chronic pain as well as other health and lifestyle
indicators differs significantly among gender groups, a separate data analysis was
implemented for boys and girls. Multiplicative statistical interaction between gender
and the independent variables of interest was evaluated, thus testing statistical
significance of the heterogeneity of OR between boys and girls. Multiplicative
interaction also between other studied independent variables was assessed by
evaluating the possibilities to adjust the variables in the logistic regression models.
Statistically significant differences of ORs between boys and girls are entered in bold
in the logistic regression results tables. The results shown in italics indicate the
statistically significant multiplicative interaction found in the logistic regression
models between age and independent variable; statistically significant differences
found between age groups are discussed more detailed in the text.
A significance level of 0.05 was selected for all the statistical tests. The
confidence interval (CI) for estimated results was set to 95%.

14
7. Results
7.1. Prevalence of chronic pain in adolescents and changes from 1994 – 2006
7.1.1. Prevalence of chronic pain
A total of 40.5% adolescents (n = 15319) reported complaints of chronic
headache and/or stomach ache and/or back pain; i.e. – recurrent pain that occurred at
least once a week over the last six months. All further results refer to the above
definition of chronic pain.
Complaints of chronic headache were most common, followed by chronic
stomach ache and back pain (Figure 7.1.1.1).
Figure 7.1.1.1. Prevalence of chronic pain among adolescents (%)
19.8
13.5
27.2
0
5
10
15
20
25
30
Headache Stomach ache Back pain
%
In all cases of chronic pain the proportion of girls was greater than that of boys
(p<0.001). The greatest gender differences were in the case of headache – the
proportion of girls complaining of chronic headache was greater by 15% (95%CI=
13.7 – 16.4) than that of boys. The smallest, but statistically valid differences were
observed in the case of back pain; the proportion of girls with chronic back pain was
greater by 3.4% (95%CI= 2.3 – 4.5) as compared with boys (Table 7.1.1.1).

15
Table 7.1.1.1. Prevalence of chronic pain by age in boys and girls (%) Gender Chronic pain Age groups Total
11 years 13 years 15 years % 95% CI Boys Headache 20.6 19.3 17.2 19.1 18.2 – 20.0 Stomach ache 16.4 13.4 10.8 13.6 12.9 – 14.5 Back pain 9.0 11.4 14.9 11.6 10.9 – 12.4
Girls Headache 29.7 31.9 39.9 34.1 33.1 – 35.1 Stomach ache 26.2 25.4 23.2 25.0 24.1 – 25.9 Back pain 11.0 13.5 19.9 15.0 14.3 – 15.8
The proportion of boys complaining of chronic headache slightly decreased
with age but a statistically significant proportional decrease of 3.4% (95%CI=1.1 –
5.7) can be observed only in 15–year–old boys compared with 11-year-olds. The
prevalence of chronic headache significantly increased in girls at age 15; it was 10.2%
(95%CI=7.7 – 12.7) greater than in 11-year-old girls. There were no statistically
significant differences in the prevalence of chronic headache between ages 11 and 13
for both genders.
As age increased, the prevalence of chronic stomach ache gradually decreased
in both genders, however, the decrease was steeper for boys. The proportion of 15-
year-old boys suffering from chronic stomach ache was 5.6% (95%CI=3.6 – 7.6) less
than at age 11, but for girls – 3% (95%CI=0.7 – 5.3) less.
Overall, the prevalence trends of chronic headache (p<0.001) and stomach
ache (p<0.01) in age groups among boys and girls were found to be significantly
different; the multiplicative statistical interaction between age and gender in logistic
regression in these cases was found.
The statistically significant (p<0.001) increase of the prevalence of chronic
back pain in increasing age groups was about the same for both boys and girls.

16
7.1.2. Combination of chronic pain
Table 7.1.2.1 shows the estimated prevalence of combinations of chronic
headache, stomach ache and back pain of those adolescents responding about all three
types of pain. In all 15.9% (95%CI=15.3 – 16.5) of adolescents complained of
combinations of several types of chronic pain. The total prevalence of multiple
chronic pain was 10.5% (95%CI=9.8 – 11.3) for boys and 20.4% (95%CI=19.5 –
21.3) for girls (p<0.001).
Table 7.1.2.1. Proportional distribution of adolescents complaining of chronic pain at one or multiple sites (%)
Chronic pain n % 95% TI No pains 8934 59.5 58.7 – 60.2 Only headache 1934 12.9 12.3 – 13.4 Only stomachache 1030 6.9 6.5 – 7.3 Only back pain 742 4.9 4.6 – 5.3 Headache + stomach ache 1105 7.4 6.9 – 7.8 Headache + back pain 445 3.0 2.7 – 3.2 Back pain + stomach ache 227 1.5 1.3 – 1.7 Headache + stomach ache + back pain 608 4.0 3.7 – 4.4 Total 15025 100 Missing 294 Total 15319
Combined chronic headache and stomach ache was the most widespread as
noted by 7.4% of adolescents. The other combinations were less common, but the
combination of all three types of chronic pain was relatively more prevalent – 4%.
The association between all three types of chronic pain was tested in a log-
linear analysis. The three-way effects were not statistically significant (χ² = 0.89;
p=0.35), but a two-way effects were found to be significant (p<0.001). This means
that there was a statistically significant association between any two of the pain types,
but the combination of pain types didn’t depend on the remaining variable – the third
pain type. For example, chronic headache was associated with chronic stomach ache,
but this association was not dependent on chronic back pain. Chronic headache, in
turn, was associated with back pain independent of stomach ache.
The odds of other chronic pain increased significantly by logistic regression in
those cases in which one of the pain types is stomach ache. For example, the odds of
chronic headache in adolescents with stomach ache increased by seven times, but
17
adolescents with stomach ache were four times more likely to complain also of
chronic back pain. It should be noted, however, that these results reflect the inter-
association of chronic pain types and it is not possible within this study, because of
the study design, to determine which of the pain types is primary.
In logistic regression, testing the multiplicative interaction of each specific
pain type based on gender in combination with other pain types, the interaction effect
was statistically significant on almost all pain type combinations. The only exception
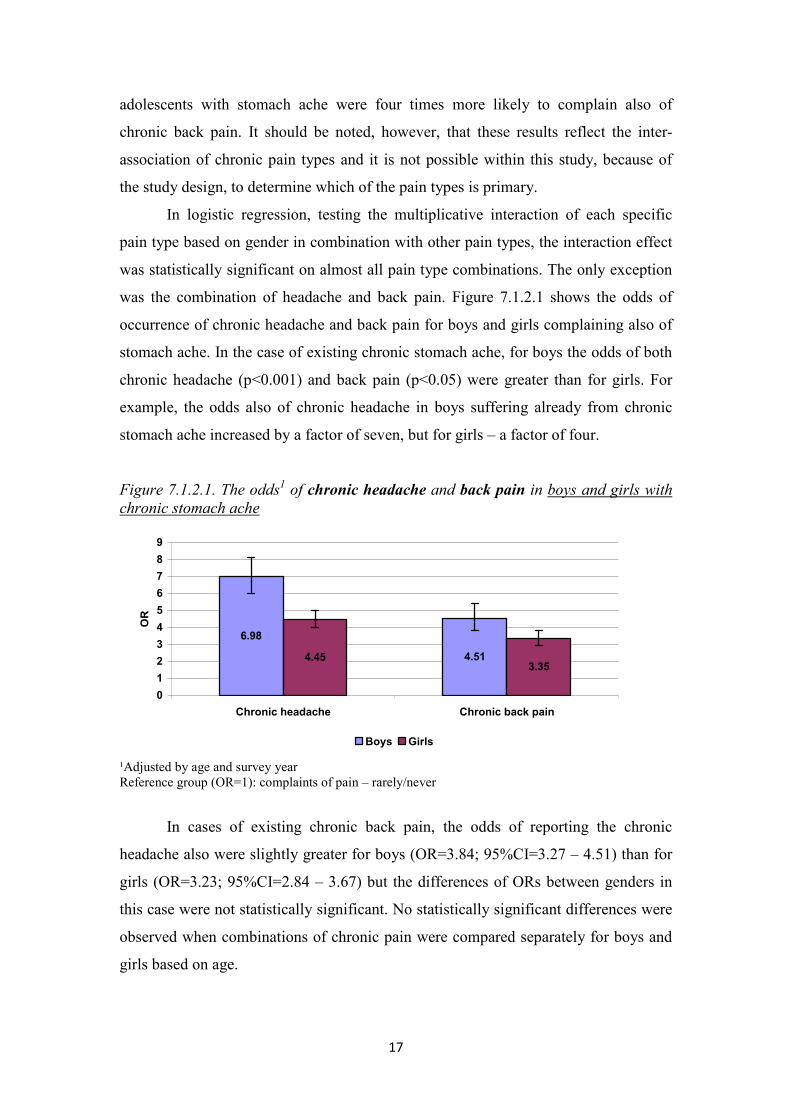
was the combination of headache and back pain. Figure 7.1.2.1 shows the odds of
occurrence of chronic headache and back pain for boys and girls complaining also of
stomach ache. In the case of existing chronic stomach ache, for boys the odds of both
chronic headache (p<0.001) and back pain (p<0.05) were greater than for girls. For
example, the odds also of chronic headache in boys suffering already from chronic
stomach ache increased by a factor of seven, but for girls – a factor of four.
Figure 7.1.2.1. The odds1 of chronic headache and back pain in boys and girls with chronic stomach ache
6.98
4.513.35
4.45
0
1
2
3
4
5
6
7
8
9
Chronic headache Chronic back pain
OR
Boys Girls
¹Adjusted by age and survey year Reference group (OR=1): complaints of pain – rarely/never
In cases of existing chronic back pain, the odds of reporting the chronic
headache also were slightly greater for boys (OR=3.84; 95%CI=3.27 – 4.51) than for
girls (OR=3.23; 95%CI=2.84 – 3.67) but the differences of ORs between genders in
this case were not statistically significant. No statistically significant differences were
observed when combinations of chronic pain were compared separately for boys and
girls based on age.

18
7.1.3. Chronic pain prevalence trends from 1994 to 2006
The prevalence trends of analyzed types of chronic pain were assessed as part
of the data analysis using a linear regression and taking into consideration the HBSC
Latvia survey results from 1994 – 2006. Table 7.1.3.1 shows changes in prevalence of
chronic pain types during the survey years along with the percentage change and
confidence intervals as obtained by linear regression.
Table 7.1.3.1. Prevalence of chronic pain during survey years (%) 1994 1998 2002 2006 % changes; 95%CI
Headache 24.5 29.9 24.6 29.3 +0.9% (–5.4; + 7.2) Stomach ache 17.9 22.7 16.5 21.4 +0.4% (– 6.3; + 7.2) Back pain 8.3 12.8 13.7 18.6 +3.2% (+0.9; + 5.5)
During the period from 1994 to 2006 the prevalence of chronic back pain had
increased on average by 3.2% (p<0.05) each survey year. The total prevalence of
chronic back pain had increased from 8.3% in 1994 to 18.6% in 2004 (Figure 7.1.3.1).
Figure 7.1.3.1. Changes in prevalence of chronic pain from 1994 to 2006 (%)
18.612.8
13.7
8.3y = 3.1925x + 5.3533
0.0
5.0
10.0
15.0
20.0
25.0
30.0
35.0
1994 1998 2002 2006
%
Headache Stomach ache
Back pain Linear (Back pain)
Assessing the changes in prevalence of chronic back pain by age, the
proportion of adolescents complaining of chronic back pain from 1994 to 2006 had
increased in 11-year-olds (p<0.05) and 15-year-olds (p<0.01) (Figure 7.1.3.2).
Comparing the year 1994 with 2006, the prevalence of chronic back pain among 15-
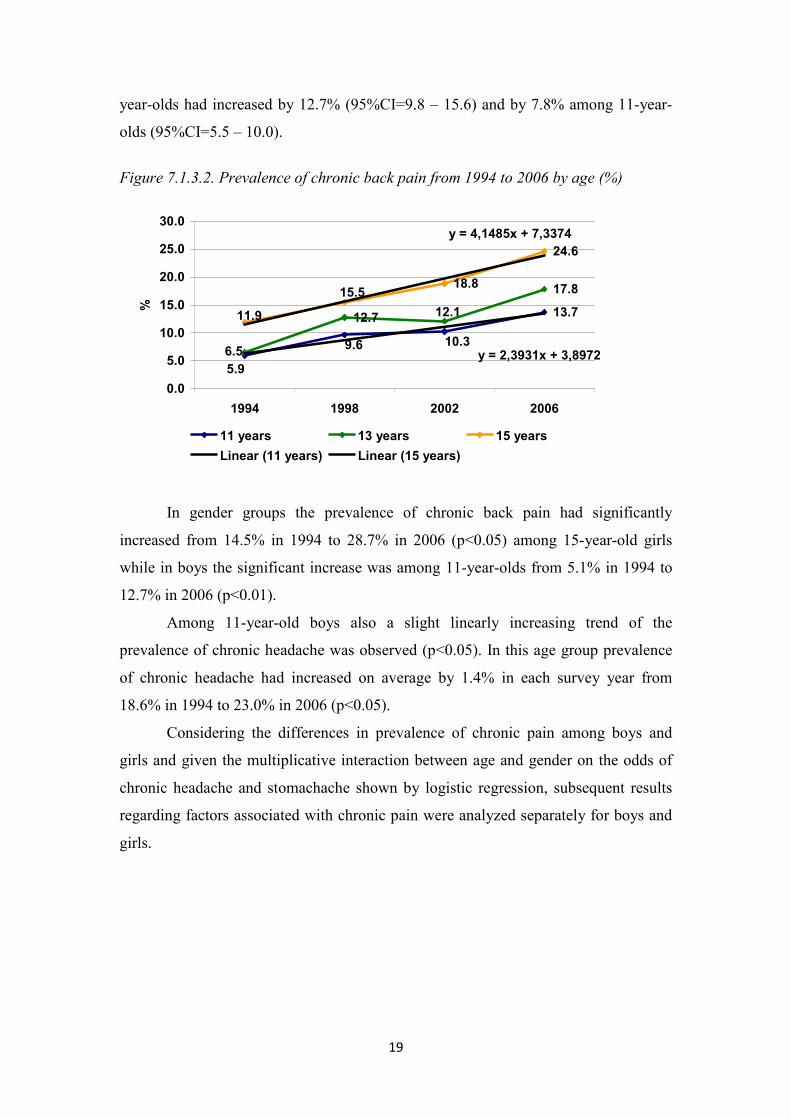
19
year-olds had increased by 12.7% (95%CI=9.8 – 15.6) and by 7.8% among 11-year-
olds (95%CI=5.5 – 10.0).
Figure 7.1.3.2. Prevalence of chronic back pain from 1994 to 2006 by age (%)
13.712.7
17.818.8
24.6
5.9
10.39.6
12.1
6.5
11.9
15.5
y = 2,3931x + 3,8972
y = 4,1485x + 7,3374
0.0
5.0
10.0
15.0
20.0
25.0
30.0
1994 1998 2002 2006
%
11 years 13 years 15 years
Linear (11 years) Linear (15 years)
In gender groups the prevalence of chronic back pain had significantly
increased from 14.5% in 1994 to 28.7% in 2006 (p<0.05) among 15-year-old girls
while in boys the significant increase was among 11-year-olds from 5.1% in 1994 to
12.7% in 2006 (p<0.01).
Among 11-year-old boys also a slight linearly increasing trend of the
prevalence of chronic headache was observed (p<0.05). In this age group prevalence
of chronic headache had increased on average by 1.4% in each survey year from
18.6% in 1994 to 23.0% in 2006 (p<0.05).
Considering the differences in prevalence of chronic pain among boys and
girls and given the multiplicative interaction between age and gender on the odds of
chronic headache and stomachache shown by logistic regression, subsequent results
regarding factors associated with chronic pain were analyzed separately for boys and
girls.

20
7.2. Chronic pain and other health complaints
Based on the HBSC surveys in Latvia of 1994 – 2006 (n = 15319) the
prevalence of other adolescent health complaints such as irritability or bad temper,
anxiety, difficulty falling asleep and dizziness was estimated. Only those health
complaints occurring at least once a week over the last past sixth months were studied
and defined as weekly.
The proportion of adolescents suffering from one of the other health
complaints besides pain was 66.3% (95%CI=65.5 – 67.1). The most common
complaint among adolescents was irritability or bad temper (52.7%), but the least
common complaint – dizziness (13.7%) (Table 7.2.1). Just as chronic pain, all the
other health complaints were more prevalent among girls than boys (p<0.001).
Table 7.2.1. Prevalence of weekly health complaints among boys and girls (%)
Boys Girls Total Health complaints at least once a week % %
%
95%CI
Irritability of bad temper 44.6 59.6 52.7
51.9 – 53.3 Nervousness 30.2 44.0 37.7 36.9 – 38.5
Difficulties falling asleep 21.7 28.2 25.2 24.5 – 25.9 Dizziness 10.1 16.7 13.7 13.1 – 14.2
Adolescents who had other weekly health complaints also reported more
chronic pain than those adolescents with health complaints occurring more seldom. In
all cases the percentage differences were statistically significant (p<0.001). For
example, a total of 41.6% adolescents with weekly anxiety also complained of chronic
headache while among adolescents with anxiety occurring more seldom, respectively,
only 18.6% (Table 7.2.2).

21
Table 7.2.2. Prevalence of chronic pain as related to other health complaints (%)
Headache Stomach ache Back pain
% 95%CI % 95%CI % 95%CI Irritability or bad temper
Weekly 37.7 36.7 – 38.8 27.7 26.7 – 28.7 18.7 17.8 – 19.6 Rarely/never 15.5 14.7 – 16.3 11.0 10.3 – 11.7 7.7 7.1 – 8.3 Nervousness
Weekly 41.6 40.3 – 42.9 30.6 29.4 – 31.8 21.8 20.7 – 22.9 Rarely/never 18.6 17.8 – 19.4 13.2 12.5 – 13.9 8.5 7.9 – 9.1
Difficulties getting asleep Weekly 43.7 42.1 – 45.2 32.0 30.5 – 33.5 21.8 20.5 – 23.1
Rarely/never 21.7 20.9 – 22.4 15.6 15.0 – 16.3 10.7 10.1 – 11.2 Dizziness Weekly 61.1 58.9 – 63.1 45.9 43.7 – 48.0 30.9 28.9 – 32.9
Rarely/never 21.9 21.2 – 22.6 15.6 15.0 – 16.3 10.7 10.2 – 11.2
Table 7.2.3 shows the odds of chronic pain as related to other health
complaints among boys and girls adjusted by survey year and age. In the case of
weekly health complaints, the odds of all chronic pain significantly increased
(p<0.001). These finding indicate that in general chronic health complaints among
adolescents are closely interrelated. It must be noted, since the cross-sectional study
design precludes an analysis of causation, it is not possible to identity the true
direction of the association.
Table 7.2.3. The odds 1 of chronic pain as related to other weekly health complaints
Health complaints at least weekly
Chronic pain Headache Stomach ache Back pain
OR 95%CI OR 95%CI OR 95%CI Boys
Irritability of bad temper 3.03*** 2.66 – 3.45 3.04*** 2.62 – 3.53 2.92*** 2.49 – 3.43 Nervousness 3.19*** 2.81 – 3.66 3.31*** 2.86 – 3.83 2.93*** 2.51 – 3.41
Difficulties falling asleep 3.11*** 2.72 – 3.55 2.99*** 2.58 – 3.47 2.73*** 2.33 – 3.21 Dizziness 5.06*** 4.28 – 5.97 4.51*** 3.78 – 5.39 4.18*** 3.46 – 5.04 Girls
Irritability of bad temper 3.08*** 2.77 – 3.42 2.96*** 2.63 – 3.33 2.34*** 2.03 – 2.70 Nervousness 2.68*** 2.44 – 2.95 2.61*** 2.34 – 2.90 2.65*** 2.32 – 3.02
Difficulties falling asleep 2.49*** 2.25 – 2.76 2.20*** 1.98 – 2.45 2.13*** 1.87 – 2.43 Dizziness 5.27*** 4.64 – 5.99 4.08*** 3.61 – 4.62 3.38*** 2.93 – 3.89
The odds of chronic pain in association with other health complaints for boys
were in more cases greater than that for girls. The significantly greater odds of chronic
1 Adjusted by age and study year Reference category – health complaints rarely/never *p<0.05; ** p<0.01; *** p<0.001; NS – not significant

22
stomach ache as related to anxiety (p<0.05) and chronic back pain as related to
dizziness (p<0.05) were found in boys as compared with girls. The odds of all chronic
pain types as related to difficulty falling asleep were also significantly greater for boys
than that for girls (p<0.001) (see Table 7.2.3 in bold). For example, for boys finding it
difficult to fall asleep at least once a week the odds of all types of chronic pain
increased by a factor of three, but for girls the odds of all types of chronic pain in this
case increased by a factor of two (p<0.001).
Logistic regression was used to test the multiplicative interaction of age and
other health complaints in relation to chronic pain, noting possible statistically
significant differences by age. In all cases in which a statistically significant
multiplicative interaction between age and other health complaints was found (see
Table 7.2.3 in italics), respondents in the 11-year-old group were significantly more
likely to report chronic pain than adolescents in the other two age groups. For
example, as for boys (χ²(2) = 6.87; p<0.05) as for girls (χ²(2) = 7.34; p<0.05) the odds
of chronic back pain related to weekly nervousness significantly differed among
studied age groups. If there were differences among 11 and 13-year-old girls (OR~ 3),
then among 15-year-old girls the odds of chronic back pain significantly decreased
(OR ~ 2) (p<0.05). However, as age increased for boys, the odds that they would
suffer from chronic back pain related to nervousness gradually decreased in all age
groups from 4 to 2 (p<0.05) (Figure 7.2.1).
Figure 7.2.1. The odds1 of chronic back pain in adolescents with weekly complaints of nervousness by age
3.922.9
2.363.19 3.0
2.17
00.51
1.52
2.53
3.54
4.55
5.5
11 years 13 years 15 years
OR
Boys Girls
1 Adjusted by study year Reference category – complaints of nervousness rarely/never
23
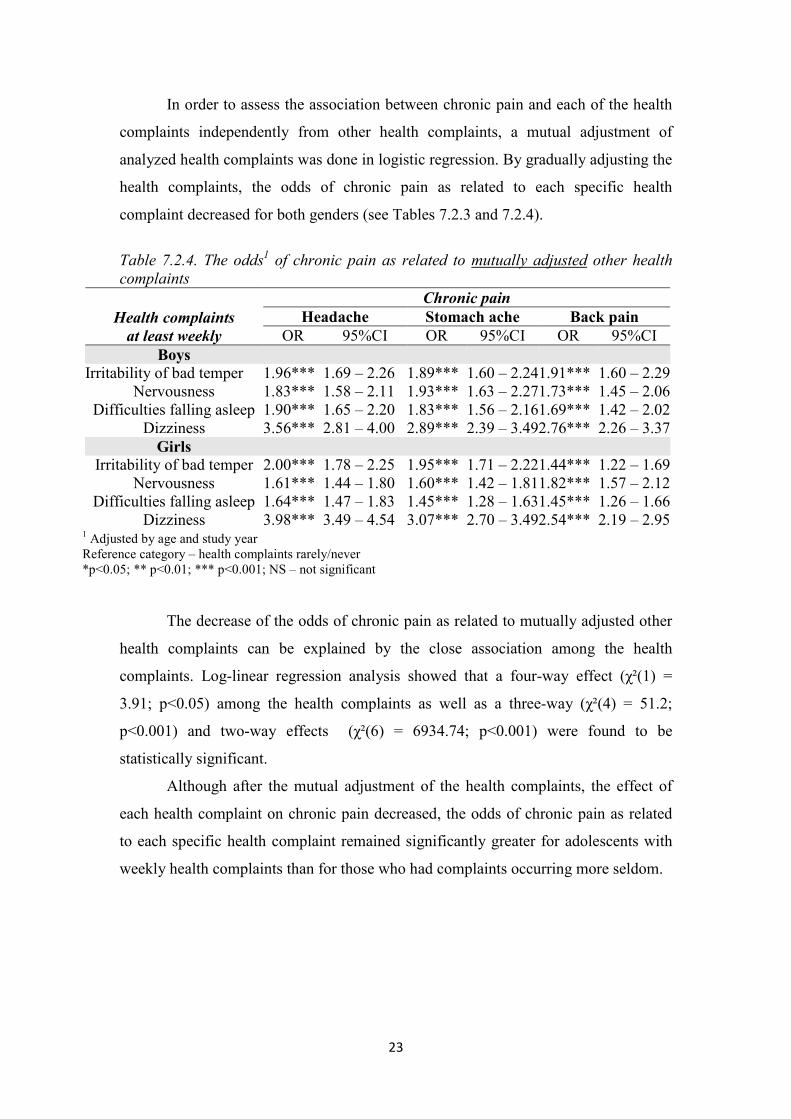
In order to assess the association between chronic pain and each of the health
complaints independently from other health complaints, a mutual adjustment of
analyzed health complaints was done in logistic regression. By gradually adjusting the
health complaints, the odds of chronic pain as related to each specific health
complaint decreased for both genders (see Tables 7.2.3 and 7.2.4).
Table 7.2.4. The odds1 of chronic pain as related to mutually adjusted other health complaints
Health complaints at least weekly
Chronic pain Headache Stomach ache Back pain
OR 95%CI OR 95%CI OR 95%CI Boys
Irritability of bad temper 1.96*** 1.69 – 2.26 1.89*** 1.60 – 2.241.91*** 1.60 – 2.29Nervousness 1.83*** 1.58 – 2.11 1.93*** 1.63 – 2.271.73*** 1.45 – 2.06
Difficulties falling asleep 1.90*** 1.65 – 2.20 1.83*** 1.56 – 2.161.69*** 1.42 – 2.02Dizziness 3.56*** 2.81 – 4.00 2.89*** 2.39 – 3.492.76*** 2.26 – 3.37Girls
Irritability of bad temper 2.00*** 1.78 – 2.25 1.95*** 1.71 – 2.221.44*** 1.22 – 1.69Nervousness 1.61*** 1.44 – 1.80 1.60*** 1.42 – 1.811.82*** 1.57 – 2.12
Difficulties falling asleep 1.64*** 1.47 – 1.83 1.45*** 1.28 – 1.631.45*** 1.26 – 1.66Dizziness 3.98*** 3.49 – 4.54 3.07*** 2.70 – 3.492.54*** 2.19 – 2.95
The decrease of the odds of chronic pain as related to mutually adjusted other
health complaints can be explained by the close association among the health
complaints. Log-linear regression analysis showed that a four-way effect (χ²(1) =
3.91; p<0.05) among the health complaints as well as a three-way (χ²(4) = 51.2;
p<0.001) and two-way effects (χ²(6) = 6934.74; p<0.001) were found to be
statistically significant.
Although after the mutual adjustment of the health complaints, the effect of
each health complaint on chronic pain decreased, the odds of chronic pain as related
to each specific health complaint remained significantly greater for adolescents with
weekly health complaints than for those who had complaints occurring more seldom.
1 Adjusted by age and study year Reference category – health complaints rarely/never *p<0.05; ** p<0.01; *** p<0.001; NS – not significant

24
7.3. Chronic pain in adolescents with chronic illness
Given that the question of prevalence of chronic illness among adolescents
was addressed only in the 2006 survey of HBSC Latvia, it is only these data (n =
4245) that were analyze in this results section. Adolescents were asked to answer if
they had any long-term illness, disability or medical condition (like arthritis, allergy,
asthma, diabetes etc.) that had been diagnosed only by a doctor.
Overall 17.2% of adolescents (95%CI=16.1 – 18.4) reported having a chronic
illness diagnosed by a doctor. The proportion of girls (19.9%) suffering from chronic
illness was 5.6% greater (95%CI=3.3 – 7.8) than among boys (14.3%). A comparison
of age groups showed no differences in prevalence of chronic illness among 11-year-
old boys and girls. The prevalence increased among girls with age from 14.9% at age
11 to 24.2% at age 15 (p<0.001).
Table 7.3.1 shows the prevalence of chronic pain in adolescents with
diagnosed chronic illness and in those without chronic illness.
Table 7.3.1. Prevalence of chronic pain as related to chronic illness (%)
Headache Stomach ache Back pain
% 95%CI % 95%CI % 95%CI Chronic illness
Yes 41.1 37.6 – 44.7 34.6 31.2 – 38.2 28.3 25.1 – 31.6 No 26.9 25.4 – 28.3 18.7 17.4 – 20.0 16.6 15.4 – 17.8
Compared with respondents without chronic illnesses, those adolescents with a
chronic illness constituted a greater proportion in all three pain types (p<0.001).
Table 7.3.2 shows unadjusted (model I) and adjusted (model II) OR of chronic
pain as related to chronic illness in boys and girls. Both boys and girls suffering from
chronic illness had statistically significant greater odds (about a factor of 2) of
suffering from chronic pain than did adolescents without chronic illness. There were
no statistically significant gender differences.

25
Table 7.3.2. Unadjusted (model I) and adjusted (model II) OR 1of chronic pain as related to chronic illness
Chronic illness
Chronic pain Headache Headache Headache
OR 95%CI OR 95%CI OR 95%CI Model I
Boys 1.82*** 1.39 – 2.39 2.31*** 1.72 – 3.11 1.48* 1.09 – 2.02 Girls 1.80*** 1.46 – 2.23 2.13*** 1.71 – 2.65 2.27*** 1.80 – 2.87
Model II Boys 1.83*** 1.39 – 2.41 2.36*** 1.75 – 3.18 1.50* 1.09 – 2.05 Girls 1.70*** 1.37 – 2.10 2.15*** 1.72 – 2.69 2.13*** 1.68 – 2.70
Adolescents suffering from chronic illness also complained more about
weekly irritability/bad temper, anxiety, difficulty falling asleep and dizziness
(p<0.001). It was determined by logistic regression how much chronic illness affected
chronic pain in adolescents independent of the other health complaints. By gradually
adjusting chronic illness with the other weekly health complaints, it was found that
there was a steady decrease in the odds of chronic pain in the case of chronic illness
(Table 7.3.3). The association between each health complaint and chronic pain
significantly changed upon mutual adjustment by the other health complaints, not
chronic illness. The final results of adjustment showed that the odds of chronic pain
for both genders in the association with chronic illnesses have significantly decreased
after the adjustment by other health complaints (see Tables 7.3.2 and 7.3.3). Thus, the
association between chronic illness and chronic pain was also affected by the
prevalence of other health complaints among adolescents with chronic illness.
1 Adjusted by age and study year Reference category – no chronic illness *p<0.05; ** p<0.01; *** p<0.001; NS – not significant
26
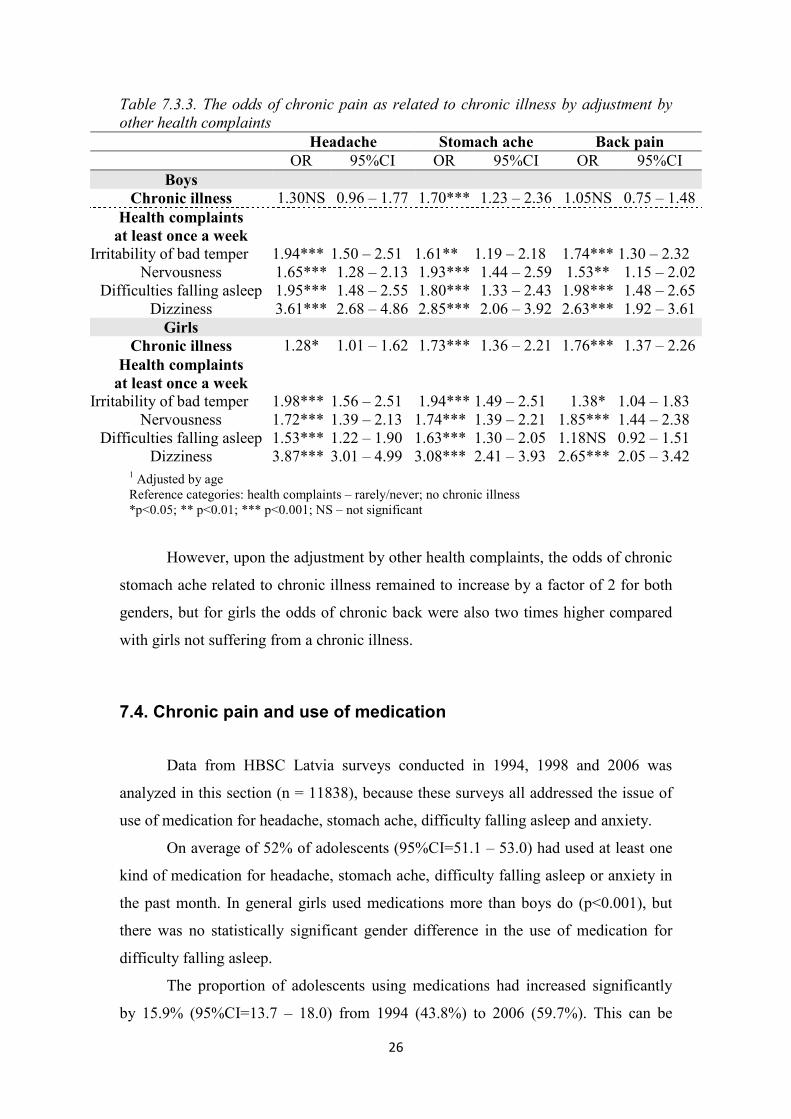
Table 7.3.3. The odds of chronic pain as related to chronic illness by adjustment by other health complaints
Headache Stomach ache Back pain OR 95%CI OR 95%CI OR 95%CI
Boys Chronic illness 1.30NS 0.96 – 1.77 1.70*** 1.23 – 2.36 1.05NS 0.75 – 1.48 Health complaints at least once a week
Irritability of bad temper 1.94*** 1.50 – 2.51 1.61** 1.19 – 2.18 1.74*** 1.30 – 2.32 Nervousness 1.65*** 1.28 – 2.13 1.93*** 1.44 – 2.59 1.53** 1.15 – 2.02
Difficulties falling asleep 1.95*** 1.48 – 2.55 1.80*** 1.33 – 2.43 1.98*** 1.48 – 2.65 Dizziness 3.61*** 2.68 – 4.86 2.85*** 2.06 – 3.92 2.63*** 1.92 – 3.61 Girls
Chronic illness 1.28* 1.01 – 1.62 1.73*** 1.36 – 2.21 1.76*** 1.37 – 2.26 Health complaints at least once a week
Irritability of bad temper 1.98*** 1.56 – 2.51 1.94*** 1.49 – 2.51 1.38* 1.04 – 1.83 Nervousness 1.72*** 1.39 – 2.13 1.74*** 1.39 – 2.21 1.85*** 1.44 – 2.38
Difficulties falling asleep 1.53*** 1.22 – 1.90 1.63*** 1.30 – 2.05 1.18NS 0.92 – 1.51 Dizziness 3.87*** 3.01 – 4.99 3.08*** 2.41 – 3.93 2.65*** 2.05 – 3.42
However, upon the adjustment by other health complaints, the odds of chronic
stomach ache related to chronic illness remained to increase by a factor of 2 for both
genders, but for girls the odds of chronic back were also two times higher compared
with girls not suffering from a chronic illness.
7.4. Chronic pain and use of medication
Data from HBSC Latvia surveys conducted in 1994, 1998 and 2006 was
analyzed in this section (n = 11838), because these surveys all addressed the issue of
use of medication for headache, stomach ache, difficulty falling asleep and anxiety.
On average of 52% of adolescents (95%CI=51.1 – 53.0) had used at least one
kind of medication for headache, stomach ache, difficulty falling asleep or anxiety in
the past month. In general girls used medications more than boys do (p<0.001), but
there was no statistically significant gender difference in the use of medication for
difficulty falling asleep.
The proportion of adolescents using medications had increased significantly
by 15.9% (95%CI=13.7 – 18.0) from 1994 (43.8%) to 2006 (59.7%). This can be
1 Adjusted by age Reference categories: health complaints – rarely/never; no chronic illness *p<0.05; ** p<0.01; *** p<0.001; NS – not significant

27
explained by more widespread use of medication for headache and stomach ache
(p<0.001) (Figure 7.4.1).
Figure 7.4.1. Proportion of adolescents among medication users in the survey years (%)
28.7
20.8
5.1 7.6
35.5
27.2
8.5 10.5
37.5
6.810.1
59.7
43.8
52.1
43.4
0.0
10.0
20.0
30.0
40.0
50.0
60.0
70.0
Medicines forheadache
Medicines forstomach ache
Medicine fordifficulties falling
asleep
Medicines fornervousness
Total medicineusers
%
1994 1998 2006
The use of medications was much greater among adolescents with chronic
pain than among adolescents without pain (p<0.001). In Table 7.4.1 the association
between medicine use and chronic pain is presented with OR from results by logistic
regression after the adjustment by survey year and age.
In the case of adolescents suffering from chronic headache and stomach ache,
the odds of corresponding medicine use were more than three times greater than
among adolescents without these chronic pains (p<0.001). In the case of back pain,
also the odds of medicine use for headache and stomach ache increased. In the case of
all three pain types, also the odds of medicine use for difficulty falling asleep and
anxiety on average doubled (p<0.001).
The association between chronic pain and non-corresponding medication use
can be explained by the previously found combinations of chronic pain and strong
association of the chronic pain with other health complaints.

28
Table 7.4.1. The odds1 of medication use as related to chronic pain
Chronic pain
Medicines for headache
Medicines for stomach ache
Medicines for difficulties falling asleep
Medicines for nervousness
OR 95%CI OR 95%CI OR 95%CI OR 95%CI Boys
Headache 3.49*** 3.03 – 4.03 1.75*** 1.50 – 2.05 1.84*** 1.44 – 2.34 2.36*** 1.90 – 2.93 Stomach ache 1.81*** 1.54 – 2.13 3.85*** 3.26 – 4.55 1.95*** 1.50 – 2.53 1.98*** 1.56 – 2.51
Back pain 1.53*** 1.28 – 1.83 1.46*** 1.21 – 1.77 1.98*** 1.47 – 2.67 1.80*** 1.37 – 2.38 Girls
Headache 3.70*** 3.31 – 4.13 1.38*** 1.24 – 1.54 1.75*** 1.43 – 2.15 1.86*** 1.58 – 2.20 Stomach ache 1.79*** 1.59 – 2.01 3.12*** 2.77 – 3.51 1.61*** 1.30 – 1.99 1.73*** 1.45 – 2.05
Back pain 1.35*** 1.17 – 1.56 1.18* 1.02 – 1.37 1.91*** 1.49 – 2.46 1.46*** 1.18 – 1.81
The odds of medicine use for stomach ache in the case of chronic stomach
ache were significantly higher among boys than girls (p<0.05) (see Table 7.4.1 in
bold). Boys suffering from chronic stomach ache were four times more likely to use
medication for stomach ache than boys with stomach ache occurring more seldom
compared with the difference of two times among girls.
A multiplicative interaction between age and pain was observed in several
cases of medication use (see Table 7.4.1 in italics); in all of these cases 11-year-olds
with chronic pain were more likely to use medication than 13- and 15-year-olds. For
example, the odds of medicine use for difficulties falling asleep among girls with
chronic back pain among 11-year-olds increased by a factor of 3 but in the oldest age
groups the association significantly decreased.
1 Adjusted by age and survey year
Reference category: complaints of pain – rarely/never *p<0.05; ** p<0.01; *** p<0.001; NS – not significant

29
Figure 7.4.2. The odds1 of medicine use for difficulties falling asleep among girls with chronic back pain by age
3.26
1.46 1.16
0
0.5
1
1.5
2
2.5
3
3.5
4
4.5
5
11 years 13 years 15 years
OR
7.5. Chronic pain and adolescent lifestyle
Based on data gained in the 1994 – 2006 HBSC Latvia, the association
between chronic pain and certain lifestyle factors among adolescents was studied.
These factors include smoking, alcohol use and vigorous physical activity.
7.5.1. Chronic pain and smoking
In general, 15.2% of boys (95%CI=14.3 – 16.0) and 9% of girls (95%CI=8.4 –
9.7) smoked regularly – at least once a week or every day. The proportion of regular
smokers among boys was higher than girls in all age groups (p<0.001). The
prevalence of smoking had increased with increasing age (p<0.001). If a total of 2.3%
of boys (95%CI=1.8 – 2.9) smoked regularly at age 11, then by age 15 the proportion
increased to 31.9% (95%CI=29.9 – 33.9). The corresponding proportion among girls
was 0.7% (95%CI=0.4 – 1.0) at age 11 and 18.8% (95%CI=17.4 – 20.2) at age 15.
Comparing the survey years, a trend in the total increase of female smokers was
observed, however, statistically significant increase was only in girls aged 15 from
13.3% in 1994 to 22.7% in 2006 (p<0.05).
1 Adjusted by survey year Reference category: back pain – rarely/never *p<0.05; ** p<0.01; *** p<0.001; NS – not significant

30
The regular smokers complained of all three types of chronic pain more than
adolescents had never or seldom smoked (p<0.05). The most difference between both
groups was observed in the case of chronic back pain – regular smokers complained
of chronic back pain 1.7 times more than non-smokers and adolescents who had
seldom smoked (Table 7.5.1.1).
Table 7.5.1.1. Prevalence of chronic pain as related to smoking (%) Headache Stomach ache Back pain % 95%CI % 95%CI % 95%CI
Smoking At least once a week 30.5 28.4 – 32.7 24.8 22.8 – 26.8 21.5 19.6 – 23.4
Seldom/never 26.7 26.0 – 27.5 19.1 18.4 – 19.8 12.4 11.8 – 13.0
Logistic regression results showed that regular smoking increased the most the
odds of chronic back pain for both boys and girls and also the odds of stomach ache
for girls (Table 7.5.2.1). The odds of chronic back pain as related to regular smoking
increased by 2 times compared with adolescents who had never or seldom smoked
(p<0.001); but for girls regular smoking increased the odds of chronic stomach ache
also by 2 times (p<0.001).
Table 7.5.1.2. The odds1 of chronic pain as related to smoking
Smoking at least once a week
Chronic pain Headache Stomach ache Back pain
OR 95%CI OR 95%CI OR 95%CI Model I
Boys 1.15NS 0.98 – 1.35 1.28** 1.07 – 1.54 2.04*** 1.70 – 2.43Girls 1.58*** 1.35 – 1.84 1.83*** 1.56 – 2.15 1.97*** 1.64 – 2.36
Model II Boys 1.31** 1.10 – 1.56 1.68*** 1.38 – 2.05 1.78*** 1.47 – 2.17Girls 1.34*** 1.14 – 1.57 2.08*** 1.76 – 2.47 1.55*** 1.28 – 1.87
Adjustment by age (model II) revealed significant changes in the odds of
smoking related chronic pain in both genders compared to results adjusted only by
survey year (model I) (Table 7.5.1.2). The effect of regular smoking on chronic pain
decreased after adjustment by age. However, the odds of chronic headache increased
in boys but the odds of chronic stomach ache increased in both boys and girls, which
1 Adjusted by survey year in model I 2 Adjusted by survey year and age in model II Reference category: smoking – seldom/never *p<0.05; ** p<0.01; *** p<0.001; NS – not significant

31
can be explained by the opposite trends observed in the prevalence of smoking and
chronic pain in age subgroups. As adolescent age increased, the prevalence of chronic
stomach ache had decreased in both genders, but the prevalence of chronic headache
decreased in boys only. However, as the age increased, also the prevalence of
smoking had increased for both genders. Thus, the independent effect of smoking on
the chronic pain before age-adjustment was lower.
Compared with adolescents who had never or seldom smoked, regular
smokers significantly more reported the prevalence of weekly complaints of
irritability/bad temper, anxiety, difficulty falling asleep and dizziness (p<0.001). In
order to determine how much regular smoking was associated with chronic pain
regardless of other health complaints, the adjustment by these complaints was done in
logistic regression, thus allowing an assessment of the independent effect of smoking
on chronic pain (Table 7.5.1.3).
Table 7.5.1.3. The odds1 of chronic pain in association with smoking adjusted by other health complaints
Smoking at least once a week
Chronic pain Headache Stomach ache Back pain
OR 95%CI OR 95%CI OR 95%CI Boys 0.97NS 0.80 – 1.18 1.29* 1.04 – 1.59 1.42*** 1.15 – 1.74Girls 1.02NS 0.86 – 1.22 1.74*** 1.45 – 2.09 1.27* 1.04 – 1.55
After the adjustment by other health complaints, the association between
smoking and chronic pain had decreased by 22% – 24% in both genders and in the
case of chronic headache statistical significance had disappeared. However, regardless
of other health complaints, a rather significant association remained between regular
smoking and chronic stomach ache in girls (OR=1.74; p<0.001) and back pain in boys
(OR=1.42; p<0.001) with a decrease in the odds of 16% and 18%, respectively.
1 Adjusted by age and survey year and other health complaints (irritability/bad temper, anxiety, difficulty falling asleep and dizziness)
Reference category: smoking – seldom/never *p<0.05; ** p<0.01; *** p<0.001; NS – not significant

32
7.5.2. Chronic pain and alcohol use
The data analyzed in this thesis refer to alcohol use (beer and/or wine and/or
spirits) at least once a week. A total of 10.8% (95%CI=10.2 – 11.7) of boys and 5.4%
(95%CI=4.9 – 5.9) of girls had used alcohol at least once a week (p<0.001). The
proportion of boys in all age groups was on average twice as big as the proportion of
girls. The prevalence of weekly alcohol use significantly had increased for both
genders as they get older (p<0.001).
During the period from 1994 to 2006 there was an increasing trend of weekly
alcohol use among girls. However, significantly weekly alcohol use had increased
only in 13-year-old girls from 1.7% in 1994 to 5% in 2006 (p<0.05).
Adolescents who had used alcohol at least once a week reported more chronic
pain than adolescents who had never or seldom used alcohol (p<0.001) (Table
7.5.2.1). The relatively most difference was observed in the case of chronic back pain.
Table 7.5.2.1. Prevalence of chronic pain as related to alcohol use (%) Headache Stomach ache Back pain % 95%CI % 95%CI % 95%CI
Alcohol use At least once a week 33.4 30.8 – 36.2 23.4 21.0 – 25.9 22.1 19.7 – 24.6
Seldom/never 26.7 25.9 – 27.4 19.5 18.8 – 20.1 12.7 12.2 – 13.3
Logistic regression showed that before the adjustment by age (model I) the
girls who had used alcohol at least once a week were about twice as likely to report
chronic pain as girls who had never or seldom used alcohol (p<0.001). The odds of
chronic pain were also higher in boys who had used alcohol weekly and the strongest
association was observed between alcohol use and chronic back pain (Table 7.5.2.2).

33
Table 7.5.2.2. The odds1 of chronic pain as related to alcohol use
Alcohol at least once a week
Chronic pain Headache Stomach ache Back pain
OR 95%CI OR 95%CI OR 95%CI Model I
Boys 1.42*** 1.19 – 1.70 1.24* 1.01 – 1.53 1.95*** 1.60 – 2.39 Girls 1.87*** 1.54 – 2.27 1.69*** 1.37 – 2.06 2.06*** 1.65 – 2.58
Model II Boys 1.59*** 1.32 – 1.93 1.55** 1.24 – 1.93 1.75*** 1.41 – 2.16 Girls 1.62*** 1.32 – 1.97 1.79*** 1.45 – 2.21 1.65*** 1.31 – 2.08
The age-adjusted results (model II) showed significant changes in the odds of
chronic pain as related to alcohol use. The independent effect of alcohol use on
chronic back pain decreased adjusting by age, but it remained significant nevertheless.
The age-adjusted odds of chronic stomach ache increased for both boys and girls with
weekly alcohol use, but the odds of chronic headache increased only for boys. As in
the case of smoking, this can be explained by the opposite trends of the prevalence of
alcohol use and chronic pain among age subgroups. Taking into account the logistic
regression results, the age is a significant factor in assessing the association between
chronic pain and smoking/alcohol use.
Compared with adolescents who had never or seldom used alcohol,
adolescents who had used alcohol at least once a week not only were more likely to
complain of chronic pain, but also more likely reported the other health complaints
analyzed before (p<0.001). The adjustment by these complaints (irritability/bad
temper, anxiety, difficulty falling asleep and dizziness) was done in logistic regression
in order to assess the independent effect of alcohol use on chronic pain (Table
7.5.2.3).
1 Adjusted by survey year in model I 2 Adjusted by survey year and age in model II Reference category: alcohol use – seldom/never *p<0.05; ** p<0.01; *** p<0.001; NS – not significant

34
Table 7.5.2.3. The odds1 of chronic pain in association with alcohol use adjusted by other health complaints
Alcohol use at least once a week
Chronic pain Headache Stomach ache Back pain
OR 95%CI OR 95%CI OR 95%CI Boys 1.24* 1.01 – 1.53 1.17NS 0.92 – 1.48 1.38** 1.10 – 1.73 Girls 1.22NS 0.98 – 1.51 1.41** 1.13 – 1.77 1.31* 1.03 – 1.67
By comparing the results in the Table 7.5.2.2 with the Table 7.5.2.3, the
association between alcohol use and chronic pain had significantly decreased for both
genders after the adjustment by other health complaints. The odds of chronic pain had
decreased from 21% – 24% and in some cases the association ceased to be statistically
significant.
It can be concluded that the independent effect of both alcohol use and
smoking on chronic pain decreases subject to other health complaints. For this reason
the greater prevalence of chronic pain in adolescents who regularly smoke and use
alcohol can largely be explained also by the greater prevalence of other weekly health
complaints in this group.
7.5.3. Chronic pain and vigorous physical activity
The level on vigorous physical activity in about 58.3% (95%CI=57.2 – 59.5)
of boys and 36.2% (95%CI=35.1 – 37.2) of girls was considered sufficient, i.e. at least
2 – 3 times per week for a total of one or more hours per week. The proportion of
boys who had a sufficient level of vigorous physical activity gradually had increased
with age (p<0.001), but there were no statistically significant differences by age
among girls. Comparing the results of the HBSC surveys in Latvia from 1994 to 2006,
there was an increase in the proportion of 11-year-old girls who had a sufficient level
of physical activity from 27.4% to 51.0 % (p<0.01).
Logistic regression analysis of the association between chronic pain and
vigorous physical activity showed similar results in the estimates of ORs before
(model I) and after (model II) adjustment by age (Table 7.5.3.1). There was no
association between chronic pain and vigorous physical activity in girls. In general the
1 Adjusted by age and survey year and other health complaints (irritability/bad temper, anxiety, difficulty falling asleep and dizziness)
Reference category: smoking – seldom/never *p<0.05; ** p<0.01; *** p<0.001; NS – not significant

35
odds of chronic pain in boys with a sufficient level of vigorous physical activity were
somewhat less than for physically inactive boys, but a statistically significant
difference was only in the case of chronic headache – by 0.8 times (p<0.05).
Table 7.5.3.1. The odds1 of chronic pain associated with level of vigorous physical activity
Sufficient vigorous physical activity
Chronic pain Headache Stomach ache Back pain
OR 95%CI OR 95%CI OR 95%CI Model I
Boys 0.82** 0.73 – 0.93 0.89NS 0.77 – 1.02 0.90NS 0.77 – 1.05 Girls 0.98NS 0.89 – 1.08 1.03NS 0.93 – 1.15 1.00NS 0.87 – 1.13
Model II Boys 0.84** 0.74 – 0.95 0.90NS 0.78 – 1.04 0.88NS 0.75 – 1.02 Girls 0.98NS 0.89 – 1.09 1.04NS 0.94 – 1.16 1.01NS 0.88 – 1.15
After the adjustment by previously analyzed other weekly health complaints,
there were no significant changes in the estimates of ORs showing the association
between chronic pain and vigorous physical activity in the Table 7.5.3.1.
7.6. Chronic pain and subjective socio-economic status
According to the results of HBSC Latvia from 1994 to 2006, on average of
57.3% (95%CI=56.5 – 58.1) of adolescents had perceived their family affluence to be
high. About 34.2% (95%CI=33.4 – 34.9) of adolescents considered their family’s
level of affluence as middle and 8.5% (95%CI=8.1 – 9.0) – as low. A total of 10%
(95%CI=9.4 – 10.7) of girls and 6.8% (95%CI=6.2 – 7.4) of boys reported their
family’s level of affluence to be low; these gender differences were statistically valid
(p<0.001). The proportion of adolescents who considered their family’s level of
affluence to be low also increased with age increase (p<0.001). The increase in boys
was 3.8% (95%CI=2.3 – 5.4) from 5.2% at age 11 to 9% at age 15, but among girls
the increase was greater by 8.4% (95%CI=6.8 – 10.0), respectively from 5.9% at age
11 to 14.3% at age 15.
As the family’s level of affluence had decreased, statistically both boys and
girls showed a greater proportion of chronic pain (p<0.001) (Table 7.6.1). The
strongest association is in the case of chronic headache. The prevalence of chronic
1 Adjusted by survey year in model I 2 Adjusted by survey year and age in model II Reference category: vigorous physical activity – insufficient *p<0.05; ** p<0.01; *** p<0.001; NS – not significant

36
headache among adolescents who considered their family’s affluence as low exceeded
that of adolescents who rated their family’s affluence as high by 14.4% (95%CI=11.6
– 17.3).
Table 7.6.1. Prevalence of chronic pain as related to assessment of family’s level of affluence
Headache Stomach ache Back pain % 95%CI % 95%CI % 95%CI
Family affluence High 23.2 22.3 – 24.1 17.6 16.8 – 18.5 11.6 10.9 – 12.3
Middle 31.3 30.0 – 32.6 21.6 20.5 – 22.8 15.0 14.1 – 16.0 Low 37.6 35.0 – 40.3 26.7 24.4 – 29.2 19.9 17.8 – 22.2
As the level of affluence in the family declined both boys and girls had
statistically greater odds of experiencing chronic pain (Table 7.6.2). For both genders
if the family affluence level was perceived as low, the odds of chronic pain types
nearly doubled (p<0.001).
Table 7.6.2. The odds1 of chronic pain as related to assessment of family’s level of affluence
Family affluence
Chronic pain Headache Stomach ache Back pain
OR 95%CI OR 95%CI OR 95%CI Boys
Middle 1.45*** 1.27 – 1.66 1.34*** 1.14 – 1.56 1.27** 1.07 – 1.50 Low 1.75*** 1.38 – 2.21 1.78*** 1.37 – 2.30 1.89*** 1.44 – 2.48 Girls
Middle 1.43*** 1.29 – 1.59 1.30*** 1.16 – 1.46 1.38*** 1.20 – 1.58 Low 1.92*** 1.64 – 2.26 1.75*** 1.48 – 2.08 1.99*** 1.62 – 2.43
The odds to report all types of chronic pain were statistically greater among
girls with low family affluence compared with those who considered their family’s
level of affluence as middle. The difference of odds for headache among boys with
middle or low family affluence were not statistically valid, but the odds of chronic
stomach ache (χ²(1) = 4.29; p<0.05) and back pain (χ²(1) = 7.49; p<0.01) were
statistically greater for boys with low family affluence than for those who considered
their family’s level of affluence as middle.
1 Adjusted by age and survey year
Reference category: high family affluence *p<0.05; ** p<0.01; *** p<0.001; NS – not significant
37
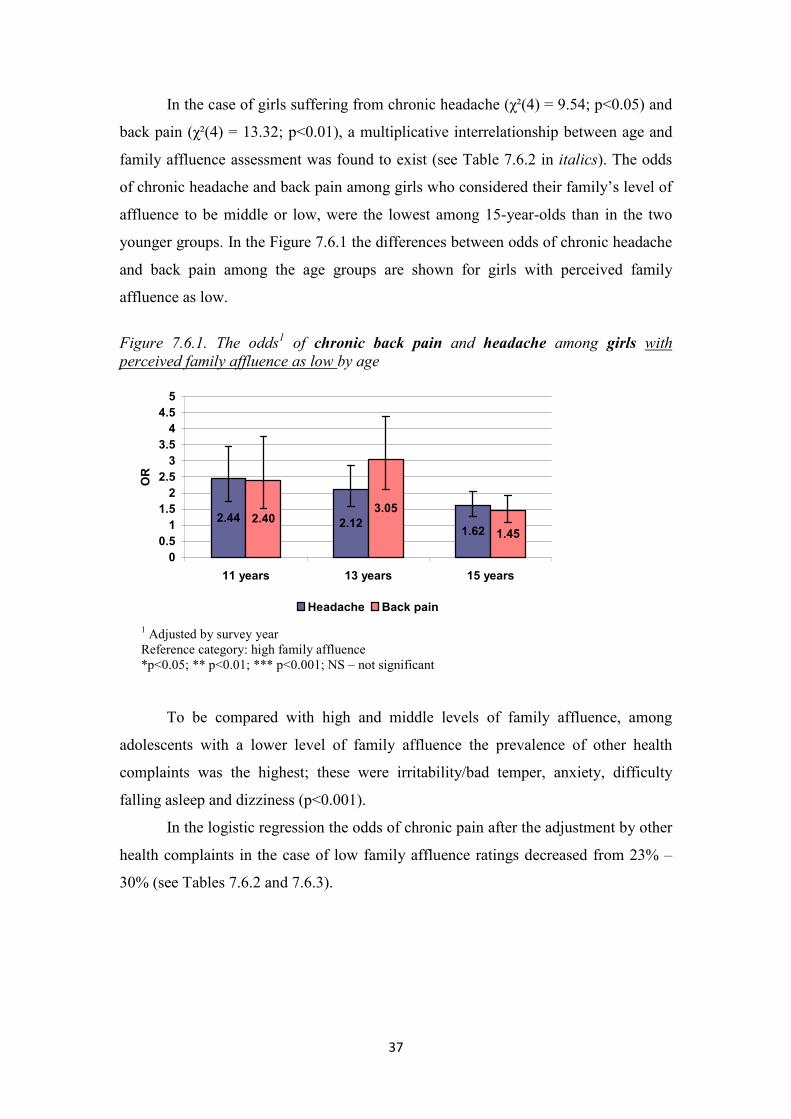
In the case of girls suffering from chronic headache (χ²(4) = 9.54; p<0.05) and
back pain (χ²(4) = 13.32; p<0.01), a multiplicative interrelationship between age and
family affluence assessment was found to exist (see Table 7.6.2 in italics). The odds
of chronic headache and back pain among girls who considered their family’s level of
affluence to be middle or low, were the lowest among 15-year-olds than in the two
younger groups. In the Figure 7.6.1 the differences between odds of chronic headache
and back pain among the age groups are shown for girls with perceived family
affluence as low.
Figure 7.6.1. The odds1 of chronic back pain and headache among girls with perceived family affluence as low by age
2.44 2.121.62
2.403.05
1.45
00.51
1.52
2.53
3.54
4.55
11 years 13 years 15 years
OR
Headache Back pain
To be compared with high and middle levels of family affluence, among
adolescents with a lower level of family affluence the prevalence of other health
complaints was the highest; these were irritability/bad temper, anxiety, difficulty
falling asleep and dizziness (p<0.001).
In the logistic regression the odds of chronic pain after the adjustment by other
health complaints in the case of low family affluence ratings decreased from 23% –
30% (see Tables 7.6.2 and 7.6.3).
1 Adjusted by survey year Reference category: high family affluence *p<0.05; ** p<0.01; *** p<0.001; NS – not significant
38
Table 7.6.3. The odds1 of chronic pain as related to assessment of family’s level of affluence adjusted by other health complaints
Family affluence
Chronic pain Headache Stomach ache Back pain
OR 95%CI OR 95%CI OR 95%CI Boys
Middle 1.33*** 1.15 – 1.54 1.21* 1.03 – 1.43 1.13NS 0.95 – 1.35 Low 1.27NS 0.99 – 1.63 1.29NS 0.98 – 1.70 1.38* 1.04 – 1.85
Girls Middle 1.27*** 1.14 – 1.43 1.14* 1.01 – 1.28 1.22** 1.05 – 1.41
Low 1.47*** 1.24 – 1.75 1.34** 1.11 – 1.61 1.54*** 1.25 – 1.90
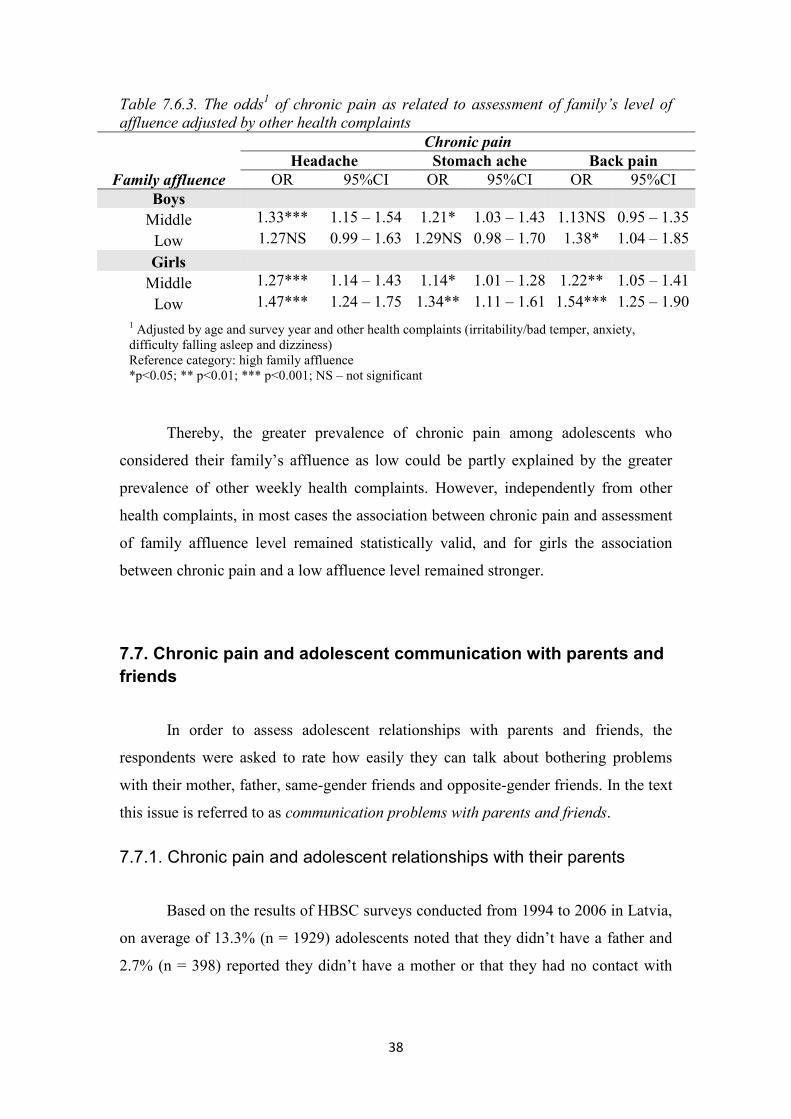
Thereby, the greater prevalence of chronic pain among adolescents who
considered their family’s affluence as low could be partly explained by the greater
prevalence of other weekly health complaints. However, independently from other
health complaints, in most cases the association between chronic pain and assessment
of family affluence level remained statistically valid, and for girls the association
between chronic pain and a low affluence level remained stronger.
7.7. Chronic pain and adolescent communication with parents and friends
In order to assess adolescent relationships with parents and friends, the
respondents were asked to rate how easily they can talk about bothering problems
with their mother, father, same-gender friends and opposite-gender friends. In the text
this issue is referred to as communication problems with parents and friends.
7.7.1. Chronic pain and adolescent relationships with their parents
Based on the results of HBSC surveys conducted from 1994 to 2006 in Latvia,
on average of 13.3% (n = 1929) adolescents noted that they didn’t have a father and
2.7% (n = 398) reported they didn’t have a mother or that they had no contact with
1 Adjusted by age and survey year and other health complaints (irritability/bad temper, anxiety, difficulty falling asleep and dizziness)
Reference category: high family affluence *p<0.05; ** p<0.01; *** p<0.001; NS – not significant
39
them. These respondents were not included in the assessment of communication
problems with parents.
A total of 18.8% (95%CI=18.2 – 19.4) of adolescents reported to be difficult
or very difficult to talk about bothering problems to their mother and 38.1%
(95%CI=37.3 – 39.0) – to their father. The proportion of girls having communication
difficulties with both parents was greater than the proportion of boys, but the greatest
differences appeared in communication with the father. The proportion of girls
(47.2%) finding it difficult to communicate with their father exceeded that of boys
(27.8%) by 19.4% (95%CI=17.7-21.1) (p<0.001). In the case of both genders
communication difficulties with parents were twice more prevalent at age 15 than in
the youngest age group (p<0.001).
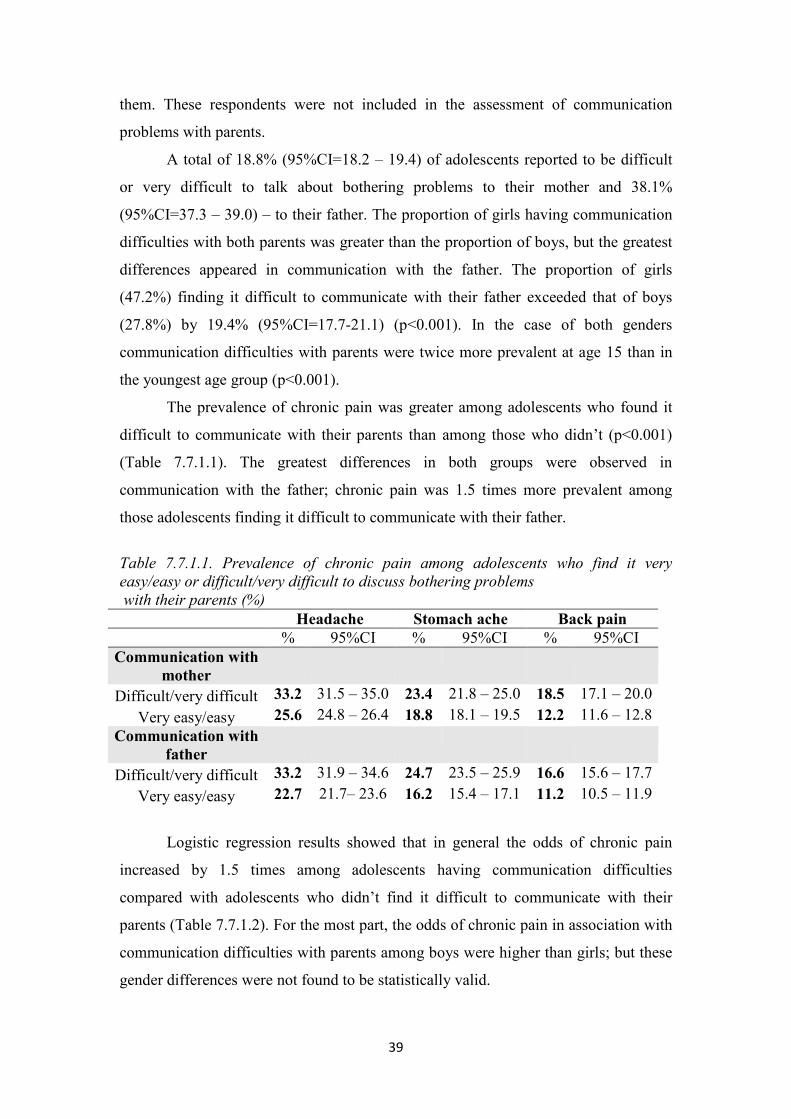
The prevalence of chronic pain was greater among adolescents who found it
difficult to communicate with their parents than among those who didn’t (p<0.001)
(Table 7.7.1.1). The greatest differences in both groups were observed in
communication with the father; chronic pain was 1.5 times more prevalent among
those adolescents finding it difficult to communicate with their father.
Table 7.7.1.1. Prevalence of chronic pain among adolescents who find it very easy/easy or difficult/very difficult to discuss bothering problems with their parents (%)
Headache Stomach ache Back pain % 95%CI % 95%CI % 95%CI
Communication with mother
Difficult/very difficult 33.2 31.5 – 35.0 23.4 21.8 – 25.0 18.5 17.1 – 20.0 Very easy/easy 25.6 24.8 – 26.4 18.8 18.1 – 19.5 12.2 11.6 – 12.8
Communication with father
Difficult/very difficult 33.2 31.9 – 34.6 24.7 23.5 – 25.9 16.6 15.6 – 17.7 Very easy/easy 22.7 21.7– 23.6 16.2 15.4 – 17.1 11.2 10.5 – 11.9
Logistic regression results showed that in general the odds of chronic pain
increased by 1.5 times among adolescents having communication difficulties
compared with adolescents who didn’t find it difficult to communicate with their
parents (Table 7.7.1.2). For the most part, the odds of chronic pain in association with
communication difficulties with parents among boys were higher than girls; but these
gender differences were not found to be statistically valid.

40
Table 7.7.1.2. The odds1 of chronic pain as related to communication difficulties with parents
Communication with parents
Chronic pain Headache Stomach ache Back pain
OR 95%CI OR 95%CI OR 95%CI Difficulties in communication
with mother
Boys 1.59*** 1.36 – 1.86 1.42*** 1.18 – 1.70 1.63*** 1.35 – 1.96 Girls 1.27*** 1.12 – 1.42 1.30*** 1.14 – 1.48 1.42*** 1.23 – 1.65
Difficulties in communication with father
Boys 1.68*** 1.45 – 1.93 1.46*** 1.24 – 1.72 1.54*** 1.29 – 1.83 Girls 1.32*** 1.19 – 1.47 1.62*** 1.44 – 1.82 1.39*** 1.21 – 1.61
Among the adolescents who found it difficult or very difficult to communicate
with their parents the prevalence of other weekly health complaints (irritability/bad
temper, anxiety, difficulty falling asleep and dizziness) was higher than among those
without communication difficulties (p<0.001). In the logistic regression it was
determined to what degree the association between chronic pain and communication
difficulties could be explained independent of other health complaints.
By comparing the results in the Table 7.7.1.2 with the Table 7.7.1.3, after the
adjustment by other health complaints, the odds of chronic pain among adolescents
with communication difficulties with parents decreased by 12% – 22%, in many cases
losing statistical validity (Table 7.7.1.3). The statistically strongest association (OR =
1.42) for girls remained between chronic stomach ache and communication
difficulties with their father.
1 Adjusted by age and survey year
Reference category: communication with parents – very easy/easy *p<0.05; ** p<0.01; *** p<0.001; NS – not significant

41
Table 7.7.1.3. The odds1 of chronic pain as related to communication difficulties with parents adjusted by other health complaints
Communication with parents
Chronic pain Headache Stomach ache Back pain
OR 95%CI OR 95%CI OR 95%CI Difficulties in communication
with mother
Boys 1.28** 1.08 – 1.51 1.14NS 0.94 – 1.38 1.33** 1.09 – 1.61 Girls 1.02NS 0.89 – 1.16 1.08NS 0.94 – 1.23 1.21* 1.03 – 1.41
Difficulties in communication with father
Boys 1.34*** 1.15 – 1.57 1.14NS 0.95 – 1.36 1.22* 1.02 – 1.47 Girls 1.10NS 0.98 – 1.24 1.42*** 1.25 – 1.61 1.21* 1.04 – 1.40
Thus, a greater prevalence of other health complaints largely explains the
association between chronic pain and communication difficulties with parents which
again indicates the strong interconnectedness between pain and other health
complaints and also strong association between all chronic health complaints and
family communication during adolescence.
7.7.2. Chronic pain and adolescent relationships with friends
Based on the 1994 – 2006 HBSC surveys in Latvia, on average of 7.2% (n =
1009) adolescents reported they did not have any same-gender and 16.4% (n = 2282)
– opposite gender friends. These respondents were not included in assessment of
communication difficulties with friends.
In all 19.5% (95%CI=18.8 – 20.2) of adolescents reported it was difficult or
very difficult to discuss bothering problems with their same-gender and 48.5%
(95%CI=47.6 – 49.4) – opposite-gender friends. There were no differences in
communication with same-gender friends, but the proportion (53.4%) of girls finding
it difficult to communicate with opposite-gender friends exceeded that of boys
(42.6%) by 10.8% (95%CI=9.0 – 12.6). Communication difficulties decreased for
both genders with the age increase. However, the proportion of adolescents finding it
difficult to communicate with opposite-gender friends decreased more – for boys from
1 Adjusted by age and survey year and other health complaints (irritability/bad temper, anxiety, difficulty falling asleep and dizziness)
Reference category: communication with parents – very easy/easy *p<0.05; ** p<0.01; *** p<0.001; NS – not significant

42
48.4% at age 11 to 36.5% at age 15; for girls from 66.3% at age 11 to 41.5% at age 15
(p<0.001).
The difference of the prevalence of chronic pain among adolescents as related
to communication difficulty with friends in most cases was not statistically
significant. Adolescents who did have problems communicating with their same-
gender friends had a slightly greater prevalence for chronic stomach ache than
adolescents with no communication difficulties (p<0.05). Proportions of adolescents
with chronic headache and back pain was slightly higher among those who found it
difficult to communicate with opposite-gender friends than those who didn’t (p<0.01).
Although statistically valid, the percentage differences just mentioned were negligible
– on average of 2% (Table 7.7.2.1).
Table 7.7.2.1. Prevalence of chronic pain among adolescents finding it difficult /very difficult or easy/very easy to discuss bothering problems with their friends
Headache Stomach ache Back pain % 95%CI % 95%CI % 95%CI
Communication with same-gender friends
Difficult/very difficult 28.9 27.1 – 30.7 21.3 19.7 – 22.9 13.7 12.4 – 15.1 Very easy/easy 27.0 26.2 – 27.9 19.5 18.8 – 20.3 13.4 12.7 – 14.0
Communication with opposite-gender friends
Difficult/very difficult 28.8 27.6 – 30.0 20.5 19.5 – 21.6 14.8 13.9 – 15.7 Very easy/easy 26.4 25.3 – 27.6 19.6 18.6 – 20.6 12.8 12.0 – 13.7
Logistic regression analysis showed that the odds of chronic pain as related to
communication difficulties with friends indicators were for the most part not
statistically significant (Table 7.7.2.2). As a result of communications difficulties, the
odds of chronic headache and stomach ache increased by a factor of 1.24 – 1.33 in
boys. Girls who found it difficult to communicate with friends of the opposite gender
seemed to be 0.8 times less likely to report chronic back pain as compared with those
girls who didn’t have this difficulty. Although the latter was not statistically valid, the
odds of chronic pain for girls with communications problems with friends actually
decreased rather than increased.

43
Table 7.7.2.2. The odds1 of chronic pain as related to communication difficulties with friends
Communication with friends
Chronic pain Headache Stomach ache Back pain
OR 95%CI OR 95%CI OR 95%CI Difficulties in communication with same-gender friends
Boys 1.24** 1.05 – 1.45 1.33** 1.11 – 1.60 1.17NS 0.96 – 1.43 Girls 1.08NS 0.95 – 1.23 1.00NS 0.87 – 1.15 0.99NS 0.83 – 1.17
Difficulties in communication with opposite-gender friends
Boys 1.17* 1.01 – 1.35 0.98NS 0.83 – 1.15 1.03NS 0.86 – 1.23 Girls 1.04NS 0.93 – 1.16 0.93NS 0.83 – 1.04 0.87* 0.75 – 1.00
There were statistically significant differences of the odds of chronic stomach
ache in boys finding it difficult to communicate with same-gender friends in studied
age groups (χ²(2)=7.20; p<0.05). Boys had the highest odds of chronic stomach ache
(OR=1.73; 95%CI=1.32 – 2.27) as related to difficulties in communicating with same-
gender friends at age 11, but at age 13 (OR=0.96; 95%CI=0.69 – 1.33) and at age 15
(OR=1.30; 95%CI=0.89 – 1.88) the association was weaker and no longer statistically
valid.
Girls had statistically significant differences of the odds of back pain by age as
related to communicating with friends of the opposite gender (χ²(2) = 7.45; p<0.05).
At age 11 girls who found it difficult to communicate with opposite-gender friends
were 1.26 times (95%CI=0.91 – 1.74) more likely to report chronic back pain, but this
was not statistically significant. At age 13 (OR=0.77; 95%CI=0.59 – 1.01) and at the
age of 15 (OR=0.80; 95%CI=0.65 – 0.98) the odds of chronic back pain inversely
remained below 1, but only the last case was statistically valid.
Thus, lower odds of back pain, mentioned already before, among girls with
communication problems with opposite-gender friends were statistically valid only at
15-year old girls. To some extent it could be explained by the age differences on
forming interrelationship and communication with opposite-sex friend throughout the
period of adolescence for girls. However, there is a need for evidenced-based
information, firstly, testing the construct validity of this measurement among different
age and gender groups within the adolescent period.
1 Adjusted by age and survey year
Reference category: communication with friends– very easy/easy *p<0.05; ** p<0.01; *** p<0.001; NS – not significant

44
After adjustment by logistic regression for other health complaints
(irritability/bad temper, anxiety, difficulty falling asleep and dizziness), the odds of
chronic pain practically didn’t change among girls and decreased somewhat among
boys, but these changes were not substantial (see Tables 7.7.2.2 and 7.7.2.3). Such
results could be explained by the fact the there were no differences in the prevalence
of these health complaints between different adolescent groups depending on
communication difficulties with friends.
Table 7.7.2.3. The odds1 of chronic pain as related to communication difficulties with friends adjusted by other health complaints
Communication with friends
Chronic pain Headache Stomach ache Back pain
OR 95%CI OR 95%CI OR 95%CI Difficulties in communication with same-gender friends
Boys 1.12NS 0.94 – 1.33 1.22* 1.01 – 1.47 1.06NS 0.86 – 1.31 Girls 1.03NS 0.90 – 1.18 0.95NS 0.82 – 1.10 0.93NS 0.78 – 1.11
Difficulties in communication with opposite-gender friends
Boys 1.08NS 0.93 – 1.26 0.88NS 0.74 – 1.05 0.90NS 0.75 – 1.09 Girls 1.03NS 0.92 – 1.16 0.91NS 0.80 – 1.03 0.85* 0.74 – 0.99
Reviewing the logistic regression results (see Tables 7.7.1.2 and 7.7.2.2), it
could be concluded that the presence of chronic pain among adolescents was much
more strongly associated with communication difficulties with parents than friends.
1 Adjusted by age and survey year and other health complaints (irritability/bad temper, anxiety, difficulty falling asleep and dizziness)
Reference category: communication with friends – very easy/easy *p<0.05; ** p<0.01; *** p<0.001; NS – not significant

45
7.8. Chronic pain and academic performance
In the HBSC study the academic success of adolescents was evaluated by
analyzing the respondents’ answer to this question: “In your opinion, what does your
teacher(s) think about your school performance compared to your classmates?”
Further this concept is referred to as academic success. Thereby, the self-evaluated
relative academic success is measured in this study. The role of self-image in
academic success might be as much as important as objective academic achievement,
especially, in terms of subjective health.
A total of 5.7% (95%CI=5.3 – 6.1) of the respondents reported their academic
success was very good compared with classmates’ average, while 5.3% (95%CI=5.0 –
5.7) considered their academic success below the average. The proportion of girls
who evaluate themselves as very good exceeded that of the boys by 2.9% (95%CI=2.2
– 3.7) while the proportion of girls who assessed their academic success below the
average level of their classmates was 4.1% (95%CI=3.4 – 4.8) lower than that of the
boys (p>0.001).
The proportion of girls who evaluated their academic success as very good had
increased from 1994 to 2006 from 3.8% in 1994 to 11.4% in 2006 (p<0.05).
As adolescent age increased, the self-evaluated academic success as very good
for both genders slightly decreased. A total of 5.8% of the boys at age 11 reported
their academic success as very good, but at age 15 this proportion decreased by one
half (p<0.001). The opposite tends to be true for those adolescents who considered
their academic success below the average level of their classmates. The proportion of
girls in this category was somewhat larger (≈4%) at age 15 than at 11 (2%), but for
boys the difference was greater. At age 15, the proportion of boys (10.1%)
considering their academic success below the average level of their classmates was
6.3% greater (95%CI=4.8 – 7.8) than at age 11 (4.4%) (p<0.001).
The greatest proportion of adolescents with chronic pain was among those
adolescents who evaluated their academic success below the average level of their
classmates. The prevalence of chronic headache and back pain was slightly higher
among those adolescents with very good academic success compared to those with
self-assessed good academic success (Table 7.8.1).

46
Table 7.8.1. Prevalence of chronic pain as related to academic success (%) Headache Stomach ache Back pain % 95%CI % 95%CI % 95%CI
Academic success Very good 29.2 26.3 – 32.3 19.9 17.3 – 22.7 15.0 12.7 – 17.5
Good 24.8 23.8 – 25.9 17.8 16.9 – 18.8 12.0 11.2 – 12.9 Average 28.1 27.1 – 29.1 20.8 19.9 – 21.8 13.5 12.8 – 14.4
Below average 35.0 31.7 – 38.3 24.8 22.0 – 28.0 21.6 18.9 – 24.7
Table 7.8.2 shows the logistic regression analysis results as related to the
association between chronic pain and self-evaluated academic success separately for
boys and girls after adjustment by survey year and age. Adolescents with self-assessed
good academic success were selected as the reference category since this group of
respondents was the largest and had the lowest proportion of adolescents reporting the
chronic pain.
The highest odds of chronic pain existed for girls who considered their
academic success below the average level of their classmates; the odds of chronic pain
were twice as great as for girls with self-rated good academic success (p<0.001). The
odds of chronic pain for boys who evaluated their academic success below the
average level of their classmates increased by 1.6 – 1.8 times compared to boys with
good academic success. However, the odds of chronic stomachache increased by 1.6
times also for those boys with self-assessed very good academic success (p<0.01).
Table 7.8.2. The odds1 of chronic pain as related to academic success
Academic success
Chronic pain Headache Stomach ache Back pain
OR 95%CI OR 95%CI OR 95%CI Boys
Very good 1.25NS 0.91 – 1.70 1.61** 1.16 – 2.25 0.89NS 0.58 – 1.34 Average 1.34*** 1.17 – 1.54 1.27** 1.09 – 1.50 1.10NS 0.93 – 1.31
Below average 1.80*** 1.42 – 2.27 1.64** 1.25 – 2.15 1.69*** 1.29 – 2.21 Girls
Very good 1.18NS 0.98 – 1.42 0.92NS 0.74 – 1.15 1.29* 1.01 – 1.64 Average 1.32*** 1.19 – 1.46 1.49*** 1.34 – 1.67 1.26*** 1.10 – 1.44
Below average 2.54*** 1.98 – 3.26 2.41*** 1.87 – 3.12 2.31*** 1.74 – 3.07
There were no statistically significant differences in the odds of chronic
stomach ache in boys as related to different self-evaluated levels of academic success
(very good, average or below average), but in the case of girls, statistically valid
1 Adjusted by age and survey year
Reference category: good academic success *p<0.05; ** p<0.01; *** p<0.001; NS – not significant

47
differences appeared between the all levels of academic success (p<0.001). For
example, the odds of stomach ache in girls were significantly lower in the group with
self-assessed average academic success than in the group with academic success
below the average level of their classmates.
Both boys (p<0.01) and girls (p<0.001) with the academic success below the
average level of their classmates were more prone to chronic headache and back pain
than students with very good or average academic success. The differences between
the odds of chronic back pain and headache in students who evaluate their academic
performance as average or very good were statistically invalid for both genders.
The likelihood that girls who evaluated their academic success below the
average level of their classmates would suffer from chronic headache was statistically
greater than it was for boys (χ²(3) = 8.05; p<0.05) (see Table 7.8.2 in bold).
Moreover, girls also were more prone to have chronic stomach ache than boys were,
both those with self-evaluated average or below the average academic success (χ²(3) =
20.2; p<0.001). Thus, the odds that girls would suffer from chronic headache and
stomach ache exceeded that of boys as their academic success level decreased.
However, if there was no association between chronic stomach ache and very good
academic success for girls, then academically very successful boys showed a
statistically valid greater likelihood of reporting chronic stomach ache.
In general the prevalence of other health complaints (irritability/bad temper,
anxiety, difficulty falling asleep and dizziness) was much greater in those adolescents
who considered their academic success below the average level of their classmates
(p<0.001). However, no differences appeared when to compare students who were
academically good or very good.
In order to determine how much chronic pain was associated with academic
success independent of other health complaints, academic self-evaluation was
adjusted by other health complaints (Table 7.8.3).

48
Table 7.8.3. The odds1 of chronic pain as related to academic success adjusted by other health complaints
Academic success
Chronic pain Headache Stomach ache Back pain
OR 95%CI OR 95%CI OR 95%CI Boys
Very good 1.30NS 0.92 – 1.82 1.74** 1.22 – 2.49 0.91NS 0.59 – 1.40 Average 1.28*** 1.11 – 1.49 1.18* 1.01 – 1.40 1.02NS 0.85 – 1.22
Below average 1.51*** 1.17 – 1.95 1.33NS 0.99 – 1.77 1.42** 1.07 – 1.89 Girls
Very good 1.16NS 0.95 – 1.43 0.87NS 0.69 – 1.10 1.25NS 0.98 – 1.61 Average 1.15** 1.04 – 1.29 1.34*** 1.20 – 1.51 1.12NS 0.97 – 1.29
Below average 1.66*** 1.27 – 2.19 1.61*** 1.22 – 2.12 1.57** 1.16 – 2.11
The odds of chronic pain as related to an academic success rating of lower
than average significantly decreased by 16% – 19% in boys and 32% – 35% in girls
after the adjustment by other health complaints. Thus, weekly health complaints by
adolescents who evaluate their academic success below the average level of their
classmates to some extent explain the association with greater odds of chronic pain.
Still, the odds of chronic stomach ache increased almost twice for boys who
considered themselves academically very good compared with those boys with self-
evaluated good academic success.
As part of the HBSC survey adolescents were asked how much pressured they
felt by the schoolwork, further referred to as academic stress. Most of the
respondents (71.1%; 95%CI=70.4 – 71.8) felt very little or no academic stress. A total
of 23.2% (95%CI=22.6 – 23.9) of respondents felt some stress and 5.7% (95%CI=5.3
– 6.1) – a lot of stress by the schoolwork.
The proportion of boys and girls who reported a lot of academic stress was
similar. In the case of those adolescents reporting some academic stress, the
proportion of girls (25.2%) was 4.3% (95%CI=3.0 – 5.7) greater than that of boys
(20.9%). The level of academic stress increased for both genders with age (p<0.001).
The students with self-assessed a lot of academic stress were twice as likely to
suffer from chronic pain as those students with no academic stress (p<0.001) (Table
7.8.4).
1 Adjusted by age and survey year and other health complaints (irritability/bad temper, anxiety, difficulty falling asleep and dizziness)
Reference category: good academic success *p<0.05; ** p<0.01; *** p<0.001; NS – not significant

49
Table 7.8.4. Prevalence of chronic pain as related to academic stress (%) Headache Stomach ache Back pain % 95%CI % 95%CI % 95%CI
Academic stress Not at all/a little 23.3 22.5 – 24.1 17.5 16.8 – 18.3 11.4 10.8 – 12.0
Some 35.3 33.7 – 36.9 24.6 23.2 – 26.0 17.4 16.2 – 18.7 A lot 42.9 39.6 – 46.3 27.9 25.0 – 31.0 23.5 20.8 – 26.5
The results in logistic regression adjusting by survey year and age showed that
the odds of chronic pain increased on average by two times for those adolescents who
reported a lot of academic stress compared to the reference group – adolescents with
very little or no academic stress. The gender differences of odds for chronic pain for
adolescents as related to academic stress were not statistically significant.
Table 7.8.5. The odds1 of chronic pain as related to academic stress
Academic stress
Chronic pain Headache Stomach ache Back pain
OR 95%CI OR 95%CI OR 95%CI Boys Some 1.96*** 1.70 – 2.26 1.67*** 1.42 – 1.97 1.63*** 1.36 – 1.94 A lot 2.39*** 1.88 – 3.04 2.00*** 1.52 – 2.64 2.03*** 1.53 – 2.70 Girls Some 1.65*** 1.48 – 1.84 1.56*** 1.39 – 1.75 1.53*** 1.33 – 1.76 A lot 2.40*** 1.99 – 2.90 1.82*** 1.48 – 2.22 2.30*** 1.85 – 2.88
In boys there were no significant differences of odds for chronic pain between
those with some academic stress compared to those with a lot of academic stress. In
girls the odds of chronic headache (χ2(1) = 13.49; p<0.001) and back pain (χ2(1) =
11.76; p<0.001) as related to self-reported levels of some or a lot of academic stress
were significantly different. As the level of academic stress among girls increased, the
odds of mentioned chronic pain also increased.
There were statistically significant differences of odds for chronic back pain
among age groups in girls with a lot of academic stress (χ2(4) = 6.74; p<0.05). Among
the girls with a lot of academic stress the odds of back pain in 11 year-olds were twice
as great as the odds in 15 year-olds (Figure 7.8.1).
1 Adjusted by age and survey year
Reference category: academic stress – not at all/a little *p<0.05; ** p<0.01; *** p<0.001; NS – not significant
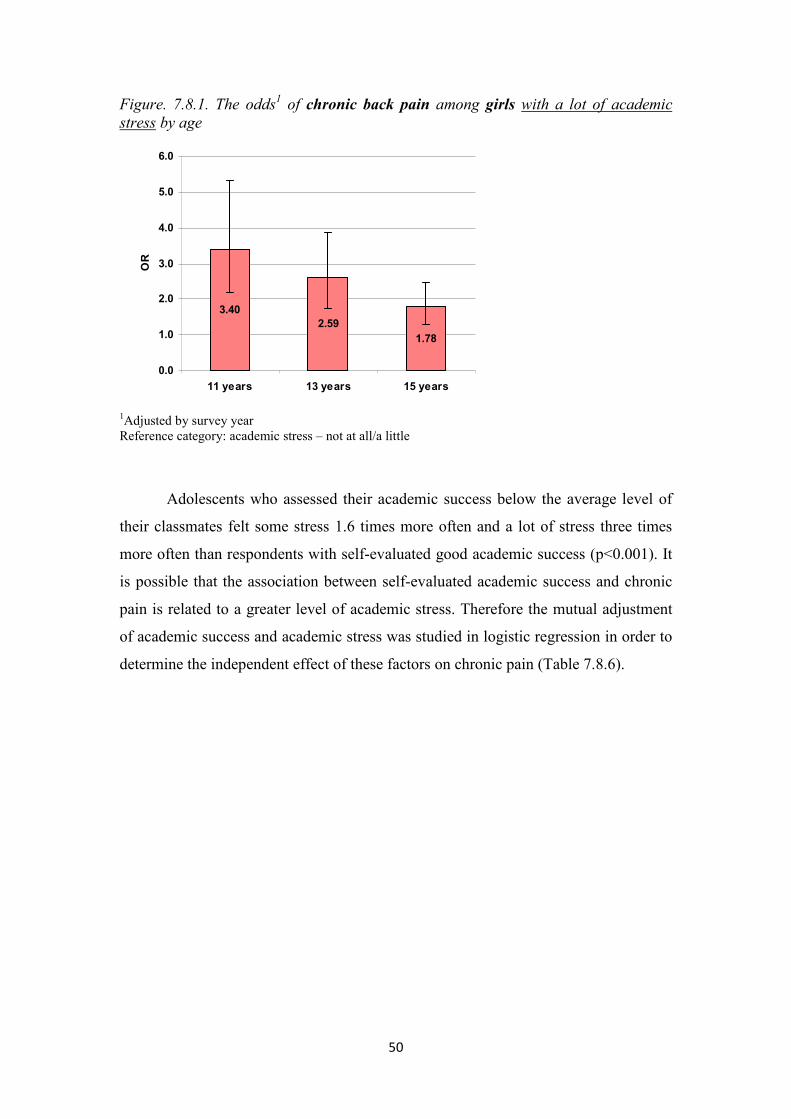
50
Figure. 7.8.1. The odds1 of chronic back pain among girls with a lot of academic stress by age
3.402.59
1.78
0.0
1.0
2.0
3.0
4.0
5.0
6.0
11 years 13 years 15 years
OR
1Adjusted by survey year Reference category: academic stress – not at all/a little
Adolescents who assessed their academic success below the average level of
their classmates felt some stress 1.6 times more often and a lot of stress three times
more often than respondents with self-evaluated good academic success (p<0.001). It
is possible that the association between self-evaluated academic success and chronic
pain is related to a greater level of academic stress. Therefore the mutual adjustment
of academic success and academic stress was studied in logistic regression in order to
determine the independent effect of these factors on chronic pain (Table 7.8.6).

51
Table 7.8.6. The odds1 of chronic pain as related to mutually adjusted academic success and academic stress
Academic success and stress
Chronic pain Headache Stomach ache Back pain
OR 95%CI OR 95%CI OR 95%CI Boys
Very good academic success 1.25NS 0.91 – 1.71 1.69** 1.21 – 2.36 0.90NS 0.59 – 1.37 Average academic success 1.25*** 1.09 – 1.44 1.22* 1.03 – 1.43 1.05NS 0.88 – 1.25
Below average academic success 1.50*** 1.18 – 1.90 1.42** 1.08 – 1.88 1.46** 1.11 – 1.93 Some academic stress 1.92*** 1.66 – 2.22 1.64*** 1.39 – 1.94 1.59*** 1.34 – 1.90
A lot of academic stress 2.25*** 1.76 – 2.87 1.88*** 1.42 – 2.50 1.93*** 1.45 – 2.57 Girls
Very good academic success 1.20NS 0.99 – 1.45 0.93NS 0.74 – 1.15 1.30* 1.02 – 1.65 Average academic success 1.26*** 1.14 – 1.40 1.44*** 1.29 – 1.61 1.21** 1.05 – 1.39
Below average academic success 2.28*** 1.77 – 2.94 2.22*** 1.71 – 2.87 2.01*** 1.51 – 2.69 Some academic stress 1.59*** 1.43 – 1.78 1.48*** 1.32 – 1.67 1.47*** 1.27 – 1.70
A lot of academic stress 2.26*** 1.87 – 2.74 1.68*** 1.37 – 2.06 2.17*** 1.73 – 2.72 Very good academic success 1.25NS 0.91 – 1.71 1.69** 1.21 – 2.36 0.90NS 0.59 – 1.37
After the mutual adjustment of academic success and academic stress the
greatest decrease in the odds of chronic pain (10% –14%) in both girls and boys was
associated with a below average academic success level. Thus, the association
between a low level of academic success and chronic pain in adolescents can partly be
explained by the subjective level of academic stress. However, independent of
academic stress, an academic success rating below that of their classmates resulted on
average in a 1.5 times greater odds of chronic pain in boys and up to two times in
girls.
The independent effect of academic stress as related to chronic pain was
comparatively greater than academic success in boys. However, independent of
academic stress, the odds of chronic stomach ache associated with very good
academic success in boys still remained increasing almost by two times compared to
boys with good academic success.
The level of academic stress, especially in girls, explained less variation in
chronic pain as related to academic success than it was with other health complaints
(see Tables 7.8.3 and 7.8.6). This could be explained by the fact that the other health
complaints studied before (irritability/bad temper, anxiety, difficulty falling asleep
and dizziness) result from a much broader range of psycho-emotional feelings that are
not associated with only academics.
1 Adjusted by age and survey year
Reference category: good academic success and academic stress – not at all/a little *p<0.05; ** p<0.01; *** p<0.001; NS – not significant

52
7.9. Chronic pain and bullying at school
The prevalence of bullying in schools was determined by asking the
respondents how often they have been bullied in the last few months and how often
they had bullied others. Taking into consideration the answers to both questions, the
students were classified in four groups: „have not been bullied nor have bullied
others” (neutrals), „have only been bullied” (victims), „have only bullied others”
(bullies), „have been bullied and have bullied others” (bullies/victims).
In general, about the same proportion of adolescents had only bullied others –
12.8% (95%CI=12.3 – 13.3) as had only been bullied – 14.9% (95%CI=14.3 – 15.4).
The lowest proportion of adolescents – 9.1% (95%CI=8.6 – 9.6) was in the group of
bullies/victims.
Table 7.9.1 shows the prevalence of bullying by gender and age. The
proportion of boys who had only bullied others was almost twice as great as the
proportion of girls (p<0.001). There was no statistically valid gender difference in the
group of victims. Among the adolescents who had both been bullied and bullied
others, the proportion of boys was 3.1% (95%CI=2.2 – 4.1) greater than that of girls
(p<0.001).
Table 7.9.1. Prevalence of bullying at school among boys and girls by age (%) Gender Bullying groups Age groups Total
11 years 13 years 15 years % 95% CI Boys Bullies 10.3 18.3 22.1 16.5 15.7 – 17.4 Victims 19.1 16.7 9.4 15.4 14.6 – 16.2 Bullies/victims 9.7 12.8 9.7 10.8 10.1 – 11.5
Girls Bullies 5.7 10.9 12.1 9.6 9.0 – 10.3 Victims 18.5 15.5 9.6 14.4 13.7 – 15.2 Bullies/victims 7.5 9.1 6.6 7.7 7.1 – 8.2
The proportion of bullies doubled as adolescents age increased, both boys and
girls (p<0.001). By contrast, the proportion of victims, both boys and girls, was cut in
half (p<0.001). The proportion of adolescents in the bully/victim group at age 11 and
15 was almost unchanged, but at age 13 compared with age 11 it increased by 3.1%
(95%CI=1.3 – 4.9) for boys and 1.7% (95%CI=0.1 – 3.2) for girls (Table 7.9.1).
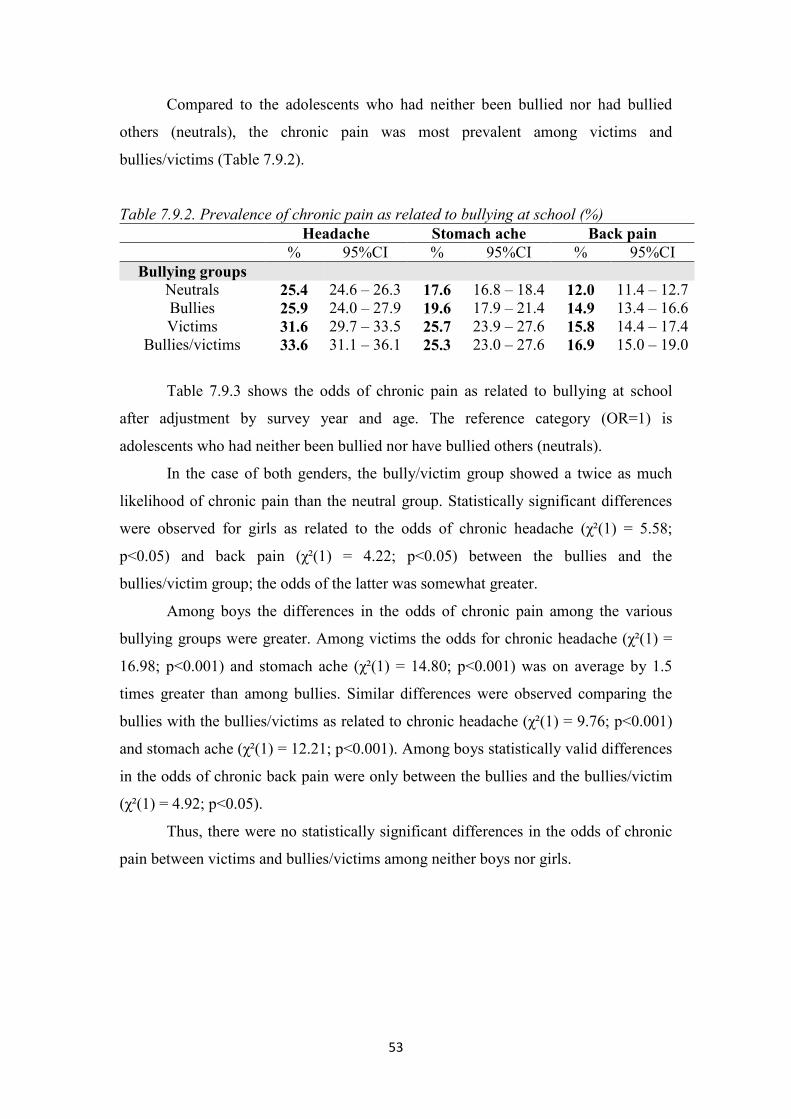
53
Compared to the adolescents who had neither been bullied nor had bullied
others (neutrals), the chronic pain was most prevalent among victims and
bullies/victims (Table 7.9.2).
Table 7.9.2. Prevalence of chronic pain as related to bullying at school (%) Headache Stomach ache Back pain % 95%CI % 95%CI % 95%CI
Bullying groups Neutrals 25.4 24.6 – 26.3 17.6 16.8 – 18.4 12.0 11.4 – 12.7 Bullies 25.9 24.0 – 27.9 19.6 17.9 – 21.4 14.9 13.4 – 16.6 Victims 31.6 29.7 – 33.5 25.7 23.9 – 27.6 15.8 14.4 – 17.4
Bullies/victims 33.6 31.1 – 36.1 25.3 23.0 – 27.6 16.9 15.0 – 19.0
Table 7.9.3 shows the odds of chronic pain as related to bullying at school
after adjustment by survey year and age. The reference category (OR=1) is
adolescents who had neither been bullied nor have bullied others (neutrals).
In the case of both genders, the bully/victim group showed a twice as much
likelihood of chronic pain than the neutral group. Statistically significant differences
were observed for girls as related to the odds of chronic headache (χ²(1) = 5.58;
p<0.05) and back pain (χ²(1) = 4.22; p<0.05) between the bullies and the
bullies/victim group; the odds of the latter was somewhat greater.
Among boys the differences in the odds of chronic pain among the various
bullying groups were greater. Among victims the odds for chronic headache (χ²(1) =
16.98; p<0.001) and stomach ache (χ²(1) = 14.80; p<0.001) was on average by 1.5
times greater than among bullies. Similar differences were observed comparing the
bullies with the bullies/victims as related to chronic headache (χ²(1) = 9.76; p<0.001)
and stomach ache (χ²(1) = 12.21; p<0.001). Among boys statistically valid differences
in the odds of chronic back pain were only between the bullies and the bullies/victim
(χ²(1) = 4.92; p<0.05).
Thus, there were no statistically significant differences in the odds of chronic
pain between victims and bullies/victims among neither boys nor girls.

54
Table 7.9.3. The odds1 of chronic pain as related to bullying at school
Bullying at school
Chronic pain Headache Stomach ache Back pain
OR 95%CI OR 95%CI OR 95%CI Boys
Bullies 1.07NS 0.89 – 1.28 1.16NS 0.94 – 1.43 1.28* 1.04 – 1.58 Victims 1.67*** 1.42 – 1.97 1.86*** 1.54 – 2.23 1.63*** 1.32 – 2.01
Bullies/victims 1.78*** 1.47 – 2.13 1.84*** 1.49 – 2.28 1.75*** 1.38 – 2.21 Girls
Bullies 1.24** 1.06 – 1.45 1.49*** 1.26 – 1.76 1.24* 1.01 – 1.52 Victims 1.37*** 1.20 – 1.56 1.59*** 1.38 – 1.83 1.58*** 1.33 – 1.88
Bullies/victims 1.62*** 1.36 – 1.92 1.67*** 1.39 – 2.01 1.66*** 1.33 – 2.08
Among adolescents in the victim group, the odds of chronic headache was
greater for boys than for girls (χ²(3) = 12.19; p<0.01), but among the bullies, the odds
of chronic stomach ache was greater for girls than it was for boys (χ²(3) = 9.49;
p<0.01) (see Table 7.9.3 in bold).
With respect to the prevalence of other health complaints (irritability/bad
temper, anxiety, difficulty falling asleep and dizziness) among adolescents in all three
groups indicating the involvement in bullying, it was statistically greater than among
adolescents in the neutral group (p<0.001).
Table 7.9.4 shows that after adjustment by other health complaints, the odds of
chronic pain as related to bullying decreased significantly, especially in the
bully/victim group (by 29% – 32% for boys and 23% – 25% for girls). This is
explained by the highest prevalence of other health complaints in the bullies/victims
group.
1 Adjusted by age and survey year
Reference category: neutrals *p<0.05; ** p<0.01; *** p<0.001; NS – not significant

55
Table 7.9.4. The odds1 of chronic pain as related to bullying at school adjusted by other health complaints
Bullying at school
Chronic pain Headache Stomach ache Back pain
OR 95%CI OR 95%CI OR 95%CI Boys
Bullies 0.92NS 0.76 – 1.11 1.01NS 0.82 – 1.26 1.12NS 0.90 – 1.40 Victims 1.34** 1.12 – 1.60 1.51*** 1.24 – 1.84 1.30* 1.04 – 1.62
Bullies/victims 1.25* 1.02 – 1.53 1.30* 1.04 – 1.63 1.19NS 0.93 – 1.53 Girls
Bullies 1.05NS 0.88 – 1.24 1.30** 1.08 – 1.55 1.06NS 0.86 – 1.32 Victims 1.06NS 0.91 – 1.22 1.27** 1.09 – 1.47 1.27** 1.06 – 1.53
Bullies/victims 1.22* 1.01 – 1.47 1.28** 1.05 – 1.55 1.28* 1.02 – 1.62
Thus, the association between bullying and chronic pain is to a certain extent
explained by the high prevalence of other health complaints among those adolescents
involved in bullying at school. These results again confirm the strong association
between chronic pain and other health complaints.
1 Adjusted by age and survey year and other health complaints (irritability/bad temper, anxiety, difficulty falling asleep and dizziness)
Reference category: neutrals *p<0.05; ** p<0.01; *** p<0.001; NS – not significant

56
8. Conclusions
1. 40% of adolescents have chronic pain (headache and/or back pain and/or
stomach ache); 16% of adolescents report multiple chronic pain.
2. From 1994 to 2006 the prevalence of chronic back pain among adolescents has
statistically increased in Latvia from 8% to 18%.
3. Chronic pain is experienced more often by adolescents suffering from chronic
illness or other health complaints.
4. Adolescents with chronic pain not only use twice as much pain medication
than adolescents without chronic pain, but also use more medications for
difficulty falling asleep and anxiety.
5. The odds of chronic pain increases for adolescents who smoke and use
alcohol.
6. The prevalence of chronic pain is higher among those adolescents with low
perceived family affluence as well as communication difficulties with parents.
7. A low academic success but high level of academic stress as well as bullying
at school all increases the odds of chronic pain in adolescents.
8. Not only does the prevalence of chronic pain differ between boys and girls by
age, but often the strength of association between chronic pain and studied
factors does too.
9. To a certain extent the association between chronic pain and other health-
related, lifestyle and psychosocial factors can be explained by a greater
prevalence of other health complaints among adolescents with chronic pain.
This confirms the strong association between studied factors and chronic
health complaints in general and also the existence of psychosomatic
mechanisms in the development of chronic pain among adolescents supported
by quantitative evidence.

57
9. Recommendations
1. Use of gender stratified analysis is recommended for epidemiological studies
on chronic pain in adolescents.
2. Both in research and clinical practice, it is important and useful to obtain
additional information about other health indicators, adolescent lifestyle and
psychosocial factors when studying chronic pain and its possible causes in
adolescents.
3. It is crucial to initiate the issue of chronic pain in public health programs
addressing adolescent health in the frame of biopsychosocial approach.
10. Publications and reports
The results of the thesis „Chronic Pain and Associated Factors in Adolescents”
were presented at the joint meeting of the RSU Department of Public Health and
Epidemiology and the Public Health Association of Latvia on May 13, 2010.
List of publications
1) Gobina I., Välimaa R., Tynjälä J., Villberg J., Villerusa A., Iannotti R.J., Godeau E. et al. The Medicine use and corresponding subjective health complaints among adolescents, a cross-national survey // Pharmacoepidemiology and Drug Safety, 2011; 19: DOI: 10.1002/pds.2102
2) Gobiņa I., Pudule I., Villeruša A. Medikamentu lietošana un sūdzības par galvassāpēm un vēdera sāpēm pusaudžiem Latvijā/Medicine use for headache and stomach ach among adolescents in Latvia // Zinātniskie raksti 2009/ Collection of Scientific Papers 2009. – Riga: Riga Stradins University, 2010. – Pp. 295. – 303.
3) Holstein B.E., Currie C., Boyce W., Damsgaard M.T., Gobina I., Kökönyei G., Hetland J. et al. Socio-economic inequality in multiple health complaints among adolescents: international comparative study in 37 countries // International Journal of Public Health, 2009; 54: S1–S11.
4) Gobiņa I., Villeruša A., Pudule I., Kalniņa I. Skolēnu veselības paradumu pētījums Latvijā 1990. – 2005./Health Behaviour Study in School-aged Children in Latvia from 1990 to 2005 // Akadēmiskā Dzīve. Riga: University of Latvia, 2009; 46: 42.–50.
5) Gobina I., Zaborskis A., Pudule I., Kalnins I., Villerusa A. Bullying and subjective health among adolescents at schools in Latvia and Lithuania // International Journal of Public Health, 2008; 53: 272–276.

58
6) Gobina I., Villerusa A., Pudule I., Barengo N.C. Subjective Health Complaints among Adolescents in Latvia during 1994 – 2006 // Collection of Scientific Papers 2007. Research articles in medicine & pharmacy. – Riga: Riga Stradins University, 2008. – Pp. 84–89.
7) Villeruša A., Gobiņa I. Latvijas jauniešu veselība demogrāfiskās situācijas kontekstā/ Youth’s health in the context of demographic situation in Latvia/ Stratēģiskās analīzes komisija. Zinātniski pētnieciskie raksti/ Scientific Proceedings of the Commission of Strategic Analysis, 4(15). Riga: Zinātne, 2007. – Pp. 179 – 196.
8) Gobiņa I., Villeruša A., Pudule I. Ņirgāšanās un skolēnu veselība Latvijā/Bullying and Health among School-aged Children in Latvia // Zinātniskie raksti 2006/ Collection of Scientific Papers 2006 – Riga: Riga Stradins University, 2017. – Pp. 171 – 176.
Thesis and Conference Presentations
1) Gobiņa I., Pudule I., Villeruša A. Medikamentu lietošana starp pusaudžiem, kuriem ir sūdzības par biežām sāpēm/Medicine use among adolescents with recurrent chronic pain // 2010. gada Zinātniskā konference. Tēzes /Thesis of Scientific Conference of Riga Stradins University/, – Rīga: Rīgas Stradiņa universitāte, 2010. – Pp. 65.
2) Gobiņa I., Pudule I., Villeruša A. Medikamentu lietošanas izplatība pusaudžiem laikā no 1994. – 2006. gadam/Medicine use among adolescents from 1994 to 2006 in Latvia // 2009. gada Zinātniskā konference. Tēzes /Thesis of Scientific Conference of Riga Stradins University/ – Rīga: Rīgas Stradiņa universitāte, 2009. – Pp. 63.
3) Gobiņa I., Pudule I., Villeruša A. Hronisko slimību un atkārtotu sāpju prevalence skolēniem pusaudžu vecumā / Chronic illness and chronic pain among adolescents // 2008. gada Zinātniskā konference. Tēzes /Thesis of Scientific Conference of Riga Stradins University/ – Rīga: Rīgas Stradiņa universitāte, 2008. – Pp.73.
4) Gobina I., Villerusa A., Barengo N., Pudule I. Gender differences of multiple subjective health complaints among adolescents in Latvia during 1994 – 2006 // European Journal of Public Health, Vol. 17, Suppl. 2, 2007: 170. (15th European Public Health Conference 2007)
5) Gobiņa I., Villeruša A., Barengo N., Pudule I. Veselības sūdzību prevalence un raksturojums skolēniem pusaudžu vecumā laikā no 1994. līdz 2006. gadam/ Subjective health complaints among adolescents from 1994 – 2006 // 2007. gada Zinātniskās konference. Tēzes /Thesis of Scientific Conference of Riga Stradins University/ – Rīga: Rīgas Stradiņa universitāte, 2007. – Pp.70.
6) Gobina I, Villerusa A, Pudule I. Health Promoting Behaviours at Health Promotion Schools in Latvia. Book of Abstracts: Globalization and Equity: Consequences for Health Promotion Policies and Practices. NIHD & IUHPE, 2006:122. (7th IUHPE European Conference on Health Promotion and Health Education)
7) Gobiņa I., Villeruša A., Pudule I. Veselības pašvērtējumu noteicošie veselības indikatori skolas vecuma bērniem Latvijā / Health indicators of self-perceived health among school-aged children // 2006. gada Zinātniskā konference. Tēzes /Thesis of Scientific Conference of Riga Stradins University/ – Rīga: Rīgas Stradiņa universitāte, 2006. – Pp.77.

59
11. References
1. Turk DC, Wilson HD. Fear of pain as a prognostic factor in chronic pain: conceptual models, assessment, and treatment implications // Current Pain and Headache Reports, 2010; 14:88–95.
2. McGrath PA. Pain in children. Nature, assessment, and treatment. – New York: Quilford Press, 1990. – Pp. 1–19, 41–87
3. Larsson BA. The measurement of paediatric pain. Acta Paediatrica, 1999; 88:115–117.
4. Steinhausen H., Metzke C.W. Continuity of functional-somatic symptoms from late childhood to young adulthood in a community sample // Journal of Child Psychology and Psychiatry, 2007; 48:508–513.
5. Merskey H. and Bogduk N. (Eds.). IASP Task Force on Taxonomy. Classification of Chronic Pain. – Seattle: IASP Press, 1994. – Pp. 222.
6. Latvijas sāpju izpētes biedrība./The Latvian Pain Society // http://www.sapes.lv/?p=6089&pp=7713&lang=1240 (accessed March 2, 2010.)
7. Deyo R.A., Weinstein J.N. Low back pain // New England Journal of Medicine, 2001; 344:363–370.
8. Oksanen A., Metsahonkala L., Anttila P. et al. Leisure activities in adolescents with headache // Acta Pediatrica, 2005; 94:609–615.
9. Fearon P. & Hotoph M. Relation between headache in childhood and physical and psychiatric symptoms in adulthood: national birth cohort study // British Medical Journal, 2001; 322: 1145.
10. Palermo T.M. Impact of recurrent and chronic pain on child and family daily functioning: a critical review of the literature // Journal of Developmental and Behavioural Pediatrics, 2000; 21:58–69.
11. Fichtel A., Larsson B. Psychosocial impact of headache and co-morbidity with other pains among Swedish school adolescents // Headache, 2002; 42:766–775.
12. van Eekelen F.C., Perquin C.W., Hunfeld J.A. et al. Comparison between children and adolescents with and without chronic benign pain: consultation rate and pain characteristics // The British Journal of General Practice, 2002; 52:211–213.
13. Perquin C.W., Hunfeld J.A.M., Hazebroek-Kampschreur A. et al. The natural course of chronic benign pain in childhood and adolescence: a two-year population-based follow-up study // European Journal of Pain, 2003; 7:551–559.
14. Ghandour R.M., Overpeck M.D., Huang Z.J. et al. Headache, stomach-ache, backache, and morning fatigue among adolescent girls in the United States // Archive of Pediatric Adolescent Medicine, 2004; 158; 797–803.
15. Petersen S., Brulin C., Bergstrom E. Recurrent pain symptoms in young schoolchildren are often multiple // Pain, 2006; 121:145–150.
16. Sundblad G.M., Saartok T., Engstrőm L.M. Prevalence and co-occurrence of self-rated pain and perceived health in school-children: age and gender differences // European Journal of Pain, 2007; 11:171–180.

60
17. Bandell-Hoekstra I.E., Abu-Saad H.H., Passchier J. et al. Prevalence and characteristics of headache in Dutch schoolchildren // European Journal of Pain, 2001; 5:145–153.
18. Hakala P., Rimpelä R., Salminen J.J. et al. Back, neck, and shoulder pain in Finnish adolescents: national cross sectional surveys // British Medical Journal, 2002; 325:743.
19. Hagquist C. Psychosomatic health problems among adolescents in Sweden – are the time trends gender related? // European Journal of Public Health, 2009; 19:331–336.
20. Bandell-Hoekstra I.E., Abu-Saad H.H., Passchier J. et al. Coping and quality of life in relation to headache in Dutch schoolchildren // European Journal of Pain, 2002; 6:315–321.
21. Härmä A., Kaltiala-Heino R., Rimpelä M., Rantanen P. Are adolescents with frequent pain symptoms more depressed? // Scandinavian Journal of Primary Health Care, 2002; 20:92–96.
22. Powers S.W., Gilman D.K., Hershey A.D. Headache and psychological functioning in children and adolescents // Headache, 2006; 46:1404–1415.
23. Hotoph M. Childhood experience of illness as a risk factor for medically unexplained symptoms // Scandinavian Journal of Psychology, 2002; 43:139–146.
24. Booth M.L., Okely A.D., Chey T. & Bauman A. The reliability and validity of the physical activity questions in the WHO Health Behaviour in Schoolchildren (HBSC) survey: a population study // British Journal of Sports Medicine, 2001; 35:263–267.
25. Solberg M.E., Olweus D. Prevalence estimation of school bullying with the Olweus Bully/Victim Questionnaire // Aggressive Behavior, 2003; 29:239–268.

61
Acknowledgments
I express the deepest thanks to the scientific supervisor Anita Villeruša for her
advice and encouragement during the doctoral studies and to colleagues in the
Department of Public Health and Epidemiology for their friendly support.
I thank the entire HBSC Latvia working group, especially the Principal
Investigator Dr. Iveta Pudule, for their collaboration over the years.
I thank also Prof. Uldis Teibe for his responsiveness regarding matters of
statistics.
My thanks also to all co-authors for their support during the writing of related
scientific publications, especially Prof. Ilze Kalniņš (University of Toronto) and Prof.
Apolinaras Zaborskas (Kaunas University).
Special thanks to my family, especially the husband, for providing the support
during the whole time of the doctoral studies and research.