factors affecting u.s. pork consumption
TRANSCRIPT

Abstract
Pork ranks third in annual U.S. meat consumption, behind beef and chicken,averaging 51 pounds per person. The Continuing Survey of Food Intakes byIndividuals (CSFII) indicates that most pork is consumed at home. Porkconsumption is highest in the Midwest (58 pounds), followed by the South(52 pounds), the Northeast (51 pounds), and the West (42 pounds). Ruralconsumers eat more pork (60 pounds) than urban/suburban consumers(49/48 pounds). Pork consumption varies by race and ethnicity. Blacksconsume 63 pounds of pork per person per year, Whites 49 pounds, andHispanics 45 pounds. Higher income consumers tend to consume less pork.Everything else remaining constant, demographic data in the CSFII suggestfuture declines in per capita pork consumption, as increases of Hispanicsand the elderly—who eat less pork than the national average—enlarge theirshares of the population. However, total U.S. pork consumption will growbecause of an expansion of the U.S. population.
Keywords: Pork, consumption, fresh pork, processed pork, per capita use,ethnicity, region, gender, age, income.
AcknowledgmentsThe authors thank the following individuals for their insightful comments:Janet Perry, Donald Blayney, William Hahn, Joy Harwood, Gary Lucier,LaVerne Creek, and Lewrene Glaser, all of ERS; Jeffrey Gillespie,Louisiana State University; John Lawrence, Iowa State University; SteveMeyer, Paragon Economics; and Shayle Shagam, World AgriculturalOutlook Board. Appreciation is also extended to the editor, CourtneyKnauth, and to Anne Pearl for text layout and graphic design.
1Factors Affecting U.S. Pork Consumption/LDP-M-130-01
Economic Research Service/USDA
United StatesDepartmentof Agriculture
www.ers.usda.gov
Electronic Outlook Report from the Economic Research Service
LDP-M-130-01
May 2005
Factors Affecting U.S.Pork Consumption
Christopher G. Davis and Biing-Hwan Lin

Although pork is not consumed by certain populations or in certain regions,it is one of the preferred meats in the world and the United States, rankingfirst in per capita meat consumption in the world and third in the UnitedStates (fig. 1). It accounts for approximately 50 percent of daily meatprotein intake worldwide (U.S. Pork Manual, Today’s Pork Industry). In2003, pork accounted for almost 42 percent of red meats (beef, pork, lamb,and veal) consumed in the United States.
Americans’ consumption of pork helps fulfill the daily recommendedamount of protein. While a great deal is known about pork’s nutritionalvalue and its production, much less is known about its consumption. Verylittle analysis has been done on who eats various pork products in theUnited States, how much is eaten, and where. Analysts at USDA’sEconomic Research Service (ERS) have conducted studies on Americans’consumption of nonalcoholic beverages and various fruits and vegetables,grains, and other foods, but this is the first time pork consumption has beenanalyzed from a similar perspective. Understanding the basic factors under-lying pork consumption will help ERS improve its analysis of supply anddemand shifts in the U.S. pork market, and will enable the industry todesign effective marketing strategies and to predict future demand. Forexample, the changing racial/ethnic landscape in the United States and the“graying” of Americans will probably reduce future pork demand (Lin et al.,2003); Hispanics, the fastest growing ethnic group, eat less pork than Blacksor Whites, and as people age they reduce their food consumption.
This report presents the results of an analysis of the most recent data fromUSDA’s Continuing Survey of Food Intakes by Individuals to determine thefactors affecting fresh and processed pork product consumption (see boxData and Methodology). A descriptive analysis was conducted on the distri-bution of pork consumption across different marketing channels, geographicregions, and population groups.
2Factors Affecting U.S. Pork Consumption/LDP-M-130-01
Economic Research Service/USDA
Figure 1
U.S. per capita consumption of pork, beef, and chicken, selected years
Source: U.S. Department of Agriculture, Economic Research Service, 2004.
Pounds per capita
1960 65 70 75 80 85 90 95 96 97 98 99 2000 01 02 030
10
2030
405060
7080
90100
Pork
Beef
Chicken
Introduction

3Factors Affecting U.S. Pork Consumption/LDP-M-130-01
Economic Research Service/USDA
Data and Methodology
Since the 1930s, periodic surveys of household and individual foodconsumption in the United States have been designed and administered bythe United States Department of Agriculture (USDA). The most recent arethe 1994-96 and 1998 Continuing Survey of Food Intakes by Individuals(CSFII), conducted by USDA’s Agricultural Research Service (ARS). Datafrom the 1994-96 CSFII are representative of noninstitutionalized personsliving in the 50 States and Washington, DC. In 1998, an identical surveywas conducted to augment the data, the CSFII sample for children. In2002, CSFII was integrated into the National Health and Nutrition Exami-nation Survey administered by the Department of Health and HumanService’s National Center for Health Statistics.
The CSFII surveys were administered to people of all ages to collectdietary intake data for 2 nonconsecutive days, 3 to 10 days apart. In eachinterview, participants were asked to recall what they had eaten over thelast 24 hours. The 1994-96 CSFII contains responses from 15,303 personswho answered questions about the types and amounts of food consumed.The 1998 CSFII survey collected data on 5,559 children up to 9 years ofage. For more information about the CSFII, visit the website atwww.barc.usda.gov/bhnrc/foodsurvey/
The respondents provided a list of foods consumed, as well as informationon how much of each food was eaten, and where and when each food waseaten. Several categories were used for coding locations where the foodwas purchased. An array of economic, social, and demographic character-istics of individuals—such as respondents’ level of education, householdincome, race, age, and gender—was also collected. This rich database canbe used for estimating the market and consumption distribution of aselected food by numerous delineations.

Pork consumption has fluctuated slightly in the United States, with percapita consumption declining by 10 percent between 1960 and 2003 (table1). In 1960, per capita pork consumption averaged approximately 59pounds. Consumption actually peaked in 1944 at 81.1 pounds, fell to 48pounds per person in 1997, and rebounded to 53 pounds in 1999. Per capitafluctuation from 1999 to 2003 varied only slightly (USDA, ERS, 2004).The occasional observed declines in consumption are usually associatedwith higher pork prices (USDA, WASDE, 1998-2002). Each Americanconsumed an average of 51 pounds of pork per year, retail product, during1994-96 and 98 (USDA, ERS, 2004), or 2 ounces per day.1
The recent growth in the hog industry was partly due to advances in tech-nology (McBride and Key, 2003; Boehlje, 1992). Technology has beenintroduced into the hog industry through structural change, genetics, andbetter management and breeding practices. This has led to pork and porkproducts of consistently high quality (Martinez and Zering, 2004). As theseventh-largest U.S. farm commodity in cash receipts, the pork sectorcontinues to produce large quantities of pork products, estimated at a record20.5 billion pounds in 2004 (USDA, WASDE, 2004). Total pork consump-tion has increased over the past years and is expected to continue increasingas the U.S. population grows.
We used the 1994-96 and 1998 data to estimate the distribution of porkconsumption by economic and demographic characteristics. The per capita-consumption of 51 pounds (retail product) was multiplied by the market
4Factors Affecting U.S. Pork Consumption /LDP-M-130-01
Economic Research Service/USDA
Table 1—U.S. per capita consumption, pork and all meats, selected years
Fresh and processed Fresh and processed Fresh and processedYear pork beef chicken
Pounds, retail weight equivalent
1960 58.7 64.7 28.01965 51.5 74.7 33.4
1970 55.4 84.4 40.11975 42.9 88.2 38.71980 56.8 76.4 47.41985 51.5 79.0 52.51990 49.4 67.5 60.61995 51.5 66.4 68.91996 48.1 67.0 69.71997 47.6 65.5 71.41998 51.3 66.5 71.91999 52.5 67.3 76.42000 50.8 67.5 77.42001 50.0 66.0 77.0
2002 51.3 67.5 81.02003 51.7 64.9 82.0
Source: U.S. Department of Agriculture, Economic Research Service.
U.S. Pork Consumption Patterns
1From the disappearance statistics,51 pounds of pork consumption percapita per year, retail weight, isapproximately 66 pounds of carcassweight or 48.1 pounds of bonelesspork available for consumption. Usingthis conversion means that there are2.11 oz per day of boneless pork avail-able to U.S. consumers. We have nodata on how much pork is purchasedbone-in or boneless.

share (which is measured in percent) for each economic and demographiccharacteristic to derive per capita pork consumption by characteristics.
Calculating Per Capita Shares
One way to describe the various consumption shares is by converting thesurvey shares into information already familiar to those in the agriculturalindustry: per capita disappearance. The per capita use data presented in thetables for 1994-96 and 1998 were calculated by distributing the ERS fooddisappearance data for pork for those years, using the CSFII survey data asdistribution factors and then dividing by the average population from 1994-96 and 1998. This presents the share of consumption described in thesurvey in terms of pork consumption per person.
Processed Market DominatesU.S. Pork Consumption
In this study, pork is separated into two main product types, fresh andprocessed. Fresh products are those muscle cuts of pork purchased fromwholesale markets by food services or from grocery meat counters directlyby consumers, cooked just before eating. Processed pork products aretransformed by grinding, curing, smoking, or seasoning prior to wholesaleor retail sale. Both categories can include frozen products.2 The 1994-96and 1998 CSFII data indicate that 38 percent of the pork consumed wasfresh and 62 percent processed. Applied to the 51 pounds per capita porkconsumption noted earlier, Americans consumed, on average, 19 pounds offresh pork and 32 pounds of processed pork per year in 1994–96 and 1998.(fig. 2).
The consumption of individual pork cuts within each main product type canalso be estimated with CSFII data. Individual cuts in the fresh pork cate-gory included pork chops, pork steaks, ribs, fresh ham, other fresh pork, and
5Factors Affecting U.S. Pork Consumption/LDP-M-130-01
Economic Research Service/USDA
2Because processed products areexcluded from country-of-origin label-ing regulations that are under discus-sion, there are proposed specificguidelines delineating the specific reg-ulatory definition of processed prod-ucts. These guidelines may notexactly match our definitions here.Frozen products are considered asbelonging to either the muscle cutscategory we are calling “fresh” or tothe processed meat category.
Figure 2
U.S. pork consumption: fresh and processed pork
Processed consists of canned and dehydrated. Pie chart divisions show percent of population consuming at least one type of pork. See text Calculating Per Capita Shares for an explanation of methodology.Source: U.S. Department of Agriculture, Economic Research Service, based on data fromAgricultural Research Service, 2000: 1994-96 and 1998 Continuing Survey of Food Intakesby Individuals.
38%Fresh
62%Processed
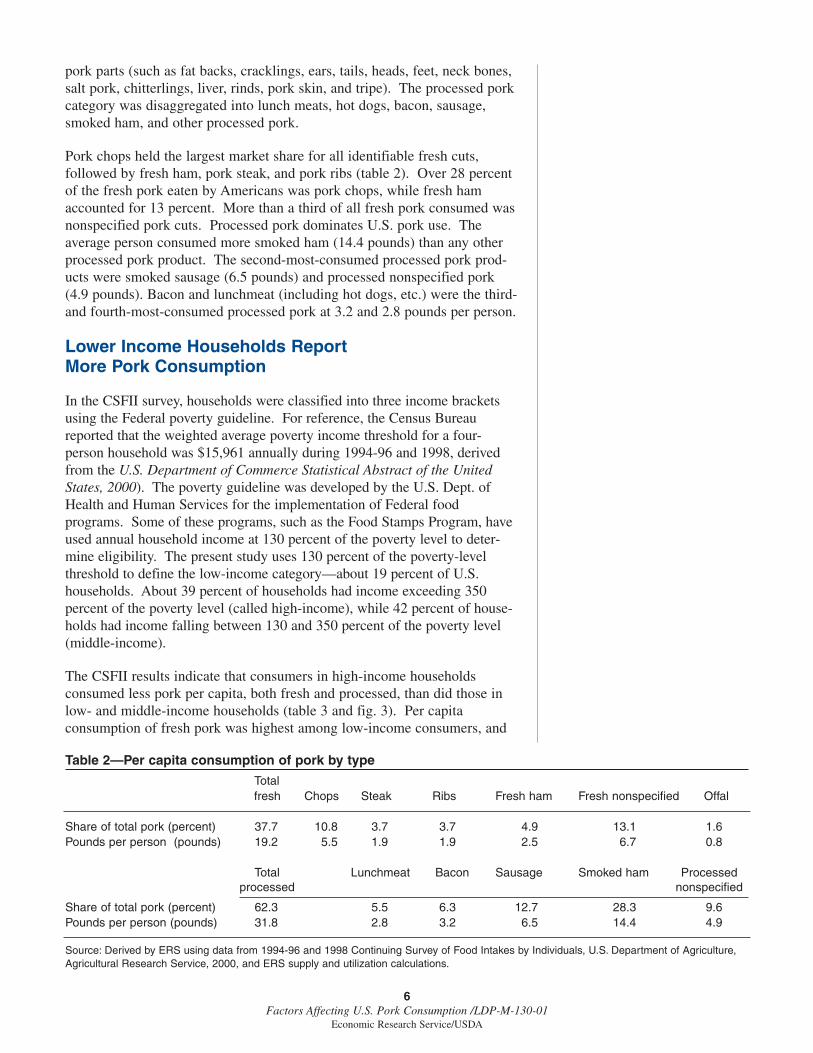
pork parts (such as fat backs, cracklings, ears, tails, heads, feet, neck bones,salt pork, chitterlings, liver, rinds, pork skin, and tripe). The processed porkcategory was disaggregated into lunch meats, hot dogs, bacon, sausage,smoked ham, and other processed pork.
Pork chops held the largest market share for all identifiable fresh cuts,followed by fresh ham, pork steak, and pork ribs (table 2). Over 28 percentof the fresh pork eaten by Americans was pork chops, while fresh hamaccounted for 13 percent. More than a third of all fresh pork consumed wasnonspecified pork cuts. Processed pork dominates U.S. pork use. Theaverage person consumed more smoked ham (14.4 pounds) than any otherprocessed pork product. The second-most-consumed processed pork prod-ucts were smoked sausage (6.5 pounds) and processed nonspecified pork(4.9 pounds). Bacon and lunchmeat (including hot dogs, etc.) were the third-and fourth-most-consumed processed pork at 3.2 and 2.8 pounds per person.
Lower Income Households Report More Pork Consumption
In the CSFII survey, households were classified into three income bracketsusing the Federal poverty guideline. For reference, the Census Bureaureported that the weighted average poverty income threshold for a four-person household was $15,961 annually during 1994-96 and 1998, derivedfrom the U.S. Department of Commerce Statistical Abstract of the UnitedStates, 2000). The poverty guideline was developed by the U.S. Dept. ofHealth and Human Services for the implementation of Federal foodprograms. Some of these programs, such as the Food Stamps Program, haveused annual household income at 130 percent of the poverty level to deter-mine eligibility. The present study uses 130 percent of the poverty-levelthreshold to define the low-income category—about 19 percent of U.S.households. About 39 percent of households had income exceeding 350percent of the poverty level (called high-income), while 42 percent of house-holds had income falling between 130 and 350 percent of the poverty level(middle-income).
The CSFII results indicate that consumers in high-income householdsconsumed less pork per capita, both fresh and processed, than did those inlow- and middle-income households (table 3 and fig. 3). Per capitaconsumption of fresh pork was highest among low-income consumers, and
6Factors Affecting U.S. Pork Consumption /LDP-M-130-01
Economic Research Service/USDA
Table 2—Per capita consumption of pork by type
Totalfresh Chops Steak Ribs Fresh ham Fresh nonspecified Offal
Share of total pork (percent) 37.7 10.8 3.7 3.7 4.9 13.1 1.6Pounds per person (pounds) 19.2 5.5 1.9 1.9 2.5 6.7 0.8
Total Lunchmeat Bacon Sausage Smoked ham Processed processed nonspecified
Share of total pork (percent) 62.3 5.5 6.3 12.7 28.3 9.6Pounds per person (pounds) 31.8 2.8 3.2 6.5 14.4 4.9
Source: Derived by ERS using data from 1994-96 and 1998 Continuing Survey of Food Intakes by Individuals, U.S. Department of Agriculture,Agricultural Research Service, 2000, and ERS supply and utilization calculations.

of processed pork it was highest among middle-income consumers.
Non-Hispanic Blacks Are thePredominant Pork Consumers
The 1994-96 and 1998 CSFII were based on the 1990 Census, whichcontains data on race and ethnicity.3 When people are grouped by ethnicity,different patterns of income and consumption at home and away from homeemerge for pork consumption. Non-Hispanic Blacks accounted for approxi-mately 13 percent of the U.S. population, yet on a per capita basis, Blacksate over 63 pounds of pork annually, 14 pounds more than Whites (table 4).Blacks ate almost 16 percent more processed pork and 58 percent morefresh pork than Whites. Among Blacks, processed pork was more popularthan fresh pork (38 vs. 25 pounds).
7Factors Affecting U.S. Pork Consumption/LDP-M-130-01
Economic Research Service/USDA
Table 3—U.S. consumption of fresh and processed pork by household income as a percentage of poverty threshold
Item Population All pork Fresh-market Processed
Percent Percent Pounds Percent Pounds Percent Poundsper capita per capita per capita
Income/povertythreshold ratio
Under 130 percent 19.2 20.4 54.0 21.4 21.2 19.7 32.8131-350 percent 41.8 42.9 52.4 41.6 18.9 43.8 33.5Over 350 percent 39.0 36.6 48.0 37.0 18.0 36.5 29.9
Processed consists of canned and dehydrated. See text Calculating Per Capita Shares for an explanation of methodology.Source: U.S. Department of Agriculture, Economic Research Service, using data from Agricultural Research Service, 2000: 1994-96 and 1998Continuing Survey of Food Intakes by Individuals.
3The questions used to ascertainrespondents’ race/ethnicity were thefollowing: which of the groups on thiscard best describes (NAME)’s race: (1)WHITE, (2) BLACK, (3) ASIAN, (4)AM. INDIAN, (5) OTHER? Do any ofthe groups on this card represent(NAME)’s national origin: (1) MEXI-CAN, (2) PUERTO RICAN, (3)CUBAN, (4) OTHER SPANISH / HIS-PANIC, (5) NONE OF ABOVE?
Under 130 percent 131-350 percent Over 350 percent
Percent of poverty level
Processed Fresh-market
Pounds per capita
Figure 3
Pork consumption by income
Source: U.S. Department of Agriculture, Economic Research Service, based on data fromAgricultural Research Service, 2000: 1994-96 and 1998 Continuing Survey of Food Intakesby Individuals.
0
10
20
30
40
50
60

The CSFII data indicate that Hispanics ate pork at about the same rate astheir share of the population implies and had a preference for fresh pork.Other races, including Asians, represented 4 percent of the U.S. populationand consumed about the same amount of pork their population implies.When comparing Americans’ pork intake by type (table 4 and fig. 4), theCSFII data reveal that people of other races, particularly Asians, consumedrelatively more fresh pork per capita than Whites, Blacks, or Hispanics,while Blacks and Whites consumed relatively more processed pork thanHispanics or other races.
At-Home Use Dominated Pork Consumption
In the CSFII, the source of food is coded in several categories. We delineate“at home” and “away from home” according to where a food was obtained or prepared, not where it was consumed. See box Food Sources: At-Homeor Away-From-Home, for further discussion of this delineation.
8Factors Affecting U.S. Pork Consumption /LDP-M-130-01
Economic Research Service/USDA
Table 4—U.S. consumption of fresh and processed pork by race/ethnicity
Item Population All pork Fresh-market Processed
Percent Percent Pounds Percent Pounds Percent Poundsper capita per capita per capita
Race/ethnic origin:White, non-Hispanic 72.5 69.8 49.0 61.1 16.0 74.8 33.0Black, non-Hispanic 12.6 15.3 63.4 16.8 25.3 15.0 38.1Hispanic 10.6 9.9 44.9 11.9 21.3 7.8 23.5Other races 4.4 5.1 61.9 10.3 44.5 2.4 17.5
Processed consists of canned and dehydrated. See text Calculating Per Capita Shares for an explanation of methodology.Source: U.S. Department of Agriculture, Economic Research Service, using data from Agricultural Research Service, 2000: 1994-96 and 1998Continuing Survey of Food Intakes by Individuals.
White Black Hispanic Other races
Fresh-market Processed
Figure 4
Pork consumption by race/ethnicity
Pounds per capita
Source: U.S. Department of Agriculture, Economic Research Service, based on data fromAgricultural Research Service, 2000: 1994-96 and 1998 Continuing Survey of Food Intakesby Individuals.
0
10
20
30
40
50
60
70

CSFII data reveal that about 78 percent of all pork was purchased at retailstores and is thus considered at-home food (table 5 and fig. 5). Fresh porkpurchased at retail stores for home use accounted for 82 percent of all freshpork, while 76 percent of all processed pork was purchased for home mealpreparation. Americans consumed approximately 16 pounds of fresh porkand 24 pounds of processed pork per person at home during 1994-96 and1998.
Restaurants (including the fast food sector) accounted for the bulk of freshand processed pork consumed away from home, representing 15 percent offresh pork use and 18 percent of processed pork use. In away-from-homemarkets, Americans consumed more processed than fresh pork (8 pounds vs.4 pounds), on average.
Non-Hispanic Blacks Are Big Consumersof Fresh Pork at Home
Blacks ate more pork than other consumers and ate 82 percent of their totalpork at home, compared with 76 percent for Whites (table 6). Blacksconsumed 92 percent of their fresh pork at home vs. 78 percent for Whitesand 85 percent for Hispanics. Hispanics consumed about 3 percent less
9Factors Affecting U.S. Pork Consumption/LDP-M-130-01
Economic Research Service/USDA
Food Sources: At Home or Away From Home
Food for consumption at home is generally obtained at a retail store such asa supermarket, grocery, or convenience store. Food consumed away fromhome is generally purchased from commercial foodservice establishments,but can also be obtained from such places as school cafeterias, communityfeeding programs, or child/adult care centers. Both at-home and away-from-home food can be consumed at or away from home. For example, abagged lunch prepared at home and consumed at work is classified as at-home food. A commercially prepared pizza delivered and consumed at-home is classified as away-from-home food. Other away-from-home eatingplaces include fast food restaurants, self-service establishments, carryoutplaces, restaurants that have wait staff, and school cafeterias, includingthose at daycare facilities and summer camps. “Others” is a catch-all cate-gory including places to eat or obtain food, such as community feedingcenters, bars/taverns, and vending machines.
Table 5—U.S. consumption of fresh and processed pork at home and away from home
Item All pork Fresh-market Processed
Percent Pounds Percent Pounds Percent Poundsper capita per capita per capita
Food sources:At home 77.8 39.8 81.8 15.7 75.8 24.1Away from home 22.2 11.2 18.2 3.5 24.2 7.7
Restaurant 17.2 8.7 15.4 3.0 18.1 5.8Others 5.0 2.5 2.8 0.5 6.1 1.9
Processed consists of canned and dehydrated. See text Calculating Per Capita Shares for an explanation of methodology.Source: U.S. Department of Agriculture, Economic Research Service, based on data from Agricultural Research Service, 2000: 1994-96 and1998 Continuing Survey of Food Intakes by Individuals.

processed pork at restaurants than Whites or Blacks. However, there is littledifference in the distribution of processed pork identified as away-from-home by Blacks, Whites, or Hispanics, at 24 pounds for each group.
Low-Income Consumers Eat Pork Mainly at Home
Consistent with findings that eating away from home rises with income, wefind that low-income consumers (those with household income in the 0-130percent of poverty level) consumed 84 percent of their fresh pork at homeand 16 percent at restaurants. Low-income consumers ate less fresh orprocessed pork products at restaurants than other groups (table 7). High-income consumers ate greater proportions of both fresh and processed porkat restaurants than other consumers.
Pork Consumption Strongest in the Midwest
The CSFII data are representative of the four Census regions that make upthe U.S. total population—Northeast (20 percent of the population),Midwest (23 percent), South (35 percent), and West (22 percent) (fig. 6).The data for the 1994-98 survey period show that the Northeast region’sshare of pork was proportionate to its population share, implying that percapita pork consumption in the Northeast is the same as the national averageof 51 pounds (table 8 and fig. 7). The share of pork consumption in theWest was below its population share, consistent with data showing that eachperson in the West ate less (42 pounds) than the national average.Consumers in the Midwest and South ate the most pork, consuming 58 and52 pounds of pork per capita, respectively. This regional pork consumptionpattern mirrors the regional pattern of pork production. As illustrated in themap of hogs and pigs (fig. 8), the dominant hog producing State in the
10Factors Affecting U.S. Pork Consumption /LDP-M-130-01
Economic Research Service/USDA
Figure 5
Pork consumption by eating location
Pounds per capita
Source: U.S. Department of Agriculture, Economic Research Service, based on data fromAgricultural Research Service, 2000: 1994-96 and 1998 Continuing Survey of Food Intakes by Individuals.
At home Away fromhome
Restaurant Others
All pork Fresh-market Processed
0
5
10
15
20
25
30
35
40
45

11Factors Affecting U.S. Pork Consumption/LDP-M-130-01
Economic Research Service/USDA
Table 7—U.S. pork consumption by income
Item All pork Fresh-market Processed
Percent
Low-income pork consumption (< 130 percent of poverty threshold)At home 83.9 90.3 79.3Away from home 16.1 9.7 20.7
Restaurant 11.1 7.0 14.4Others 5.0 2.7 6.3
Middle-income pork consumption (130 - 350 percent of poverty threshold)At home 79.9 84.7 77.5Away from home 20.1 15.3 22.5
Restaurant 15.5 13.0 16.6Others 4.6 2.3 5.9
Upper-income pork consumption (> 350 percent of poverty threshold)At home 72.0 73.7 71.9Away from home 28.0 26.3 28.1
Restaurant 22.6 22.8 21.8Others 5.4 3.5 6.3
Source: U.S. Department of Agriculture, Economic Research Service, based on data from Agricultural Research Service, 2000: 1994-96 and1998 Continuing Survey of Food Intakes by Individuals.
Table 6—U.S. pork consumption by race
Item All pork Fresh-market Processed
Percent
Whites, non-HispanicFood sources:
At home 76.4 78.0 76.0 Away from home 23.6 22.0 24.0
Restaurant 18.8 19.0 18.5Others 4.8 3.0 5.5
Blacks, non-HispanicFood sources:
At home 82.0 91.5 76.1Away from home 18.0 8.5 23.9
Restaurant 13.6 6.3 18.1Others 4.4 2.2 5.8
HispanicsFood sources:
At home 80.6 85.1 75.8Away from home 19.4 14.9 24.2
Restaurant 12.9 11.0 15.2Others 6.5 3.9 9.0
Source: U.S. Department of Agriculture, Economic Research Service, based on data from Agricultural Research Service, 2000: 1994-96 and1998 Continuing Survey of Food Intakes by Individuals.

South is North Carolina, while dominance is shared among Iowa,Minnesota, Illinois, and Indiana in the Midwest.
Rural Consumers Eat More Pork,Especially Processed
CSFII data identify whether a consumer lived in a metropolitan city (urban),suburban, or rural area according to the 1990 Census. Forty-seven percentof Americans lived in suburban areas, 32 percent lived in cities, and 21percent lived in rural areas. Per capita, rural consumers tended to eat morepork, particularly processed pork (38 pounds vs. 31 pounds for suburbanconsumers and 29 pounds for city dwellers) (table 9 and fig. 9). Suburbanconsumers ate less fresh pork (17 pounds) than city and rural dwellers (20and 21 pounds).
12Factors Affecting U.S. Pork Consumption /LDP-M-130-01
Economic Research Service/USDA
Table 8—Per capita pork consumption by region
Item Population All pork Fresh-market Processed
Percent Percent Pounds Percent Pounds Percent Poundsper capita per capita per capita
Northeast 19.6 19.4 50.8 18.9 18.3 19.9 32.5Midwest 23.5 26.6 57.7 26.0 21.1 26.9 36.6South 34.9 35.4 52.3 32.2 17.5 37.9 34.8West 22.0 18.5 42.0 22.8 19.7 15.3 22.3
Processed consists of canned and dehydrated. See text Calculating Per Capita Shares for an explanation of methodology.Source: U.S. Department of Agriculture, Economic Research Service, based on data from Agricultural Research Service, 2000: 1994-96 and1998 Continuing Survey of Food Intakes by Individuals.
Northeast
West22% Midwest
23%
South35%
20%
Figure 6
U.S. population by census region
Source: Bureau of Census, U.S. Department of Commerce.

13Factors Affecting U.S. Pork Consumption/LDP-M-130-01
Economic Research Service/USDA
Figure 7
Pork consumption by region
Source: U.S. Department of Agriculture, Economic Research Service, based on data fromAgricultural Research Service, 2000: 1994-96 and 1998 Continuing Survey of Food Intakes by Individuals.
Fresh-market Processed
Pounds per capita
Northwest Midwest South West0
10
20
30
40
50
60
70
Figure 8
Hogs and pigs inventory: 2002
1 Dot = 15,000 hogs and pigs.U. S. total is 64,405,103 hogs and pigs.
Source: U.S. Department of Agriculture, Economic Research Service, based on data from National Agricultural Statistics Service.

Middle-Aged Men Eat the Most Pork
According to the CSFII data, pork consumption varied greatly by gender (65pounds for men vs. 37 pounds for women (table 10)). Men consumed 24pounds of fresh and 41 pounds of processed pork (fig. 10), compared with14 and 24 pounds consumed by women (fig. 11). As expected, porkconsumption rose with age initially and then declined among senior citizens(age 60 and over). Men aged 40-59 ate more than 76 pounds of pork (30pounds of fresh and 46 pounds of processed). Women of the same agegroup consumed 42 pounds (17 pounds fresh and 25 pounds processed).
14Factors Affecting U.S. Pork Consumption /LDP-M-130-01
Economic Research Service/USDA
Figure 9
Pork consumption by urban/rural location
Pounds per capita
Source: U.S. Department of Agriculture, Economic Research Service, based on data fromAgricultural Research Service, 2000: 1994-96 and 1998 Continuing Survey of Food Intakesby Individuals.
Urban Suburban Rural0
10
20
30
40
50
60
70
ProcessedFresh-market
Table 9—Rural/urban per capita pork consumption
Item Population All pork Fresh-market Processed
Percent Percent Pounds Percent Pounds Percent Poundsper capita per capita per capita
Urban 31.8 30.6 49.2 34.1 20.4 28.6 28.8Suburban 47.0 44.5 48.4 42.1 17.0 46.1 31.4Rural 21.2 24.9 59.5 23.8 21.3 25.3 38.2
Processed consists of canned and dehydrated. See text Calculating Per Capita Shares for an explanation of methodology.Source: U.S. Department of Agriculture, Economic Research Service, based on data from Agricultural Research Service, 2000: 1994-96 and1998 Continuing Survey of Food Intakes by Individuals.

15Factors Affecting U.S. Pork Consumption/LDP-M-130-01
Economic Research Service/USDA
Table 10—Market distribution and per capita pork consumption
Gender and age Population All pork Fresh-market Processed
Percent Percent Pounds Percent Pounds Percent Pounds
Male, years: 49.0 62.4 65.2 62.7 24.3 62.6 40.92-11 9.0 6.1 35.2 5.4 11.4 6.7 23.812-19 5.9 7.5 65.6 6.9 22.2 8.0 43.420-39 16.0 22.8 72.2 22.4 26.6 22.8 45.640-59 11.6 17.3 76.5 18.4 30.1 16.8 46.360 and over 6.7 8.7 66.9 9.6 27.2 8.3 39.6
Female, years: 51.0 37.6 37.4 37.3 13.9 37.4 23.52-11 8.5 4.8 28.9 3.5 7.8 5.6 21.112-19 5.7 4.0 34.9 3.4 11.3 4.2 23.620-39 15.9 12.1 38.4 12.8 15.3 11.5 23.140-59 12.1 10.0 42.0 10.6 16.6 9.6 25.460 and over 8.6 6.8 39.8 6.9 15.2 6.6 24.6
Components may not sum vertically due to rounding. Processed consists of canned and dehydrated. Percent of population consuming at least one food at the specific location is identified. See text Calculating Per Capita Shares for an explanation of methodology.Source: U.S. Department of Agriculture, Economic Research Service, based on data from Agricultural Research Service, 2000: 1994-96 and1998 Continuing Survey of Food Intakes by Individuals.
Figure 10
Pork consumption by males by age
All 2-11 12-19 20-39 40-59 60 and over
Processed Fresh-market
Source: U.S. Department of Agriculture, Economic Research Service, based on data fromAgricultural Research Service, 2000: 1994-96 and 1998 Continuing Survey of Food Intakesby Individuals.
0
10
20
30
40
50
60
70
80
90Pounds per capita
Figure 11
Pork consumption by females by agePounds per capita
Source: U.S. Department of Agriculture,Economic Research Service, based on data fromAgricultural Research Service, 2000: 1994-96 and 1998 Continuing Survey of Food Intakes by Individuals.
All 2-11 12-19 20-39 40-59 60 and over05
10
15
20
25
30
35
40
45Processed Fresh-market

What do consumption patterns tell us about the future of the hog industry?Although eaten less frequently than poultry or beef, pork is and willcontinue to be an important source of protein for Americans. Using USDA’sCSFII survey data, we described pork consumption in terms of who eatspork and pork products, along with where and how much. Such informa-tion, while useful to retailers, processors, hog producers, and others investi-gating the health and structure of the industry, has not been readilyavailable. Some important findings of this study include:
� Most of the pork eaten by consumers was purchased at retail stores andconsumed at home.
� The South had a higher market share of pork consumption than otherregions, thanks to its large population base and its above-average con-sumption. However, on a per capita basis, Midwest consumers ate 58pounds of pork, followed by 52 pounds in the South, 51 pounds in theNortheast, and 42 pounds in the West.
� Black consumers had the highest per capita pork consumption overall,but other ethnic groups, especially Asians, consumed more fresh porkthan others on a per capita basis. White consumers ate less fresh porkbut more processed pork than Hispanics.
� Higher income consumers ate less pork than lower income consumers.As eating out has become more popular, higher income consumers haveeaten a larger portion of pork away from home than lower income con-sumers.
� Men consumed 74 percent more pork than women, on a per capita basis.Per capita pork consumption was highest for those aged 40-59 and thendeclined with age. Older Americans typically eat less food than youngerones due to lower activity levels and energy needs, and dine out less fre-quently (Ballenger and Blaylock, 2003).
It is difficult to say whether these same characteristics of pork consumptionwill continue, given changes in prices relative to other meats, the composi-tion of products offered, health concerns, and many other factors affectingconsumption or production. Some of the above findings suggest that,holding other factors constant, per capita pork consumption is likely to fallover the next two decades. Other ERS research shows that expenditures onaway-from-home food now account for about 47 percent of total U.S. foodexpenditures, and the National Restaurant Association projects away-from-home food expenditures will exceed at-home food expenditures by 2010(Davis and Stewart, 2002). Because eating out is on the rise, it is expectedthat future consumption of pork away from home will rise while porkconsumed at home will decline, which may affect the mix of productsoffered in both away-from-home and at-home markets. However, becausepork is less often eaten in away-from-home markets, the result may be thatper capita consumption may decline relative to other meats.
Eating pork seems to be associated with the age of the consumer. As peopleage, their consumption patterns change. Will younger people choose meats
16Factors Affecting U.S. Pork Consumption /LDP-M-130-01
Economic Research Service/USDA
Implications for the Future

other than pork as they age? Will middle-aged men begin to curb theireating habits as they grow older? ERS research shows that as people agethey eat less protein and eat out less often (Lin et al., 2003). As the U.S.population “grays,” per capita pork consumption may decrease.
Over the next two decades, the Hispanic population will claim a muchlarger share of the U.S. population, while growth in the White populationwill slow. As Hispanics become a larger portion of the population, theirlower per capita consumption of pork, assumed to continue at the samelevel, will bring down total per capita consumption. This populationdynamic could also affect the distribution of pork consumption by producttype—compared to Hispanics, White consumers prefer processed over freshpork. It remains to be seen if the pork industry can profit from this diversityby creating products that appeal to changes in preferences and Americans’love of novel taste experiences. Even so, while ERS research indicatesfuture per capita pork consumption is likely to fall, the total pork marketand total pork consumption will likely expand due to an anticipated popula-tion growth of 50 million people in the next two decades (Lin et al., 2003).
17Factors Affecting U.S. Pork Consumption/LDP-M-130-01
Economic Research Service/USDA

Ballenger, Nicole, and James Blaylock. 2003. “Consumer-Driven Agricul-ture: Changing U.S. Demographics Influence Eating Habits,” Amber Waves,April. Accessed on 11/30/04 at:http://www.ers.usda.gov/Amberwaves/April03/Features/ConsumerDrivenAg.htm
Boehlje, M. 1992. “Alternative Models of Structural Change in Agricul-ture and Related Industries,” Agribusiness: An International Journal.(8)3:219-31.
Davis, David E., and Hayden Stewart. 2002. “Changing Consumer DemandsCreate Opportunities for U.S. Food System,” in Consumer-Driven Agricul-ture, Rosanna Mentzer Morrison, editor. U.S. Dept. of Agriculture,Economic Research Service, Food Review, Vol. 25, No. 1, May.
Lin, Biing-Hwan, Jayachandran N. Variyan, Jane Allshouse, and JohnCromartie. 2003. Food and Agricultural Commodity Consumption in theUnited States: Looking Ahead to 2020. U.S. Dept. of Agriculture, EconomicResearch Service, AER-820. Feb.
Martinez, Steven W., and Kelly Zering. 2004. Pork Quality and the Role ofMarket Organization. U.S. Dept. of Agriculture, Economic ResearchService, AER-835. Nov.
McBride, W.D., and Nigel Key. 2003. Economic and Structural Relationshipsin U.S. Hog Production. U.S. Dept. of Agriculture, Economic ResearchService, AER-818. Feb.
National Pork Producers Council. U.S. Pork Manual, Today’s Pork Industry.Oct. 2003.
U.S. Dept. of Agriculture, Agricultural Research Service. 1994-96 Contin-uing Survey of Food Intakes by Individuals and 1994-96 Diet and HealthKnowledge Survey. 1998 CD-ROM available from National Technical Infor-mation Service, Springfield, VA.
U.S. Dept. of Agriculture, Economic Research Service. “Red meats andchicken (retail cut equivalent): Per capita consumption.” Last updated Dec.27, 2004.
U.S. Dept. of Agriculture, World Agricultural Supply and DemandEstimates. WASDE-413. Aug. 12, 2004, and 1998-2002.
U.S. Dept. of Commerce, Bureau of the Census. Statistical Abstract of theUnited States. Dec. 2000.
18Factors Affecting U.S. Pork Consumption /LDP-M-130-01
Economic Research Service/USDA
References