factors affecting tritium and 14carbon distributions in ... · factors affecting tritium and...
TRANSCRIPT

Factors Affecting Tritium and 14Carbon Distributions in the Unsaturated Zone Near the Low-Level Radioactive-Waste Burial Site South of Beatty, Nevada
By R.G. Striegl, D.E. Prudic, J.S. Duval, R.W. Healy, E.R. Landa, D.W. Pollock, D.C. Thorstenson, anc/E.P. Weeks
U.S. GEOLOGICAL SURVEY
Open-File Report 96-110
Denver, Colorado 1996
U.S. DEPARTMENT OF THE INTERIOR
BRUCE BABBITT, Secretary
U.S. GEOLOGICAL SURVEY
Gordon P. Eaton, Director
The use of trade, product, industry, or firm names is for descriptive purposes only and does not imply endorsement by the U.S. Government.
For additional information write to: Copies of this report can be purchasedfrom:
Chief, Branch of Regional Research U.S. Geological Survey U.S. Geological Survey Earth Science Information Center Box 25046, Mail Stop 418 Open-File Reports Section Denver Federal Center Box 25286, Mail Stop 517 Denver, CO 80225-0046 Denver Federal Center
Denver, CO 80225-0425

CONTENTS
Executive summary................................................................................................................................................................ 1
Introduction........................................................................................................................ 1
Factors affecting tritium and 14carbon distributions............................................................................................................... 5
Waste disposal............................................................................................................................................................. 5
Precipitation.........................................................................................._^ 5
Site geology................................................................................................................................................................. 6
Transport................................................................................................................_^ 7
Chemical and isotopic equilibrium assumptions.......................................................................................................... 7
Diff usion....................................................................................................................................................................... 7
Gas advection.............................................................................................................................................................. 8
Preferential pathways.................................................................................................................................................. 12
Summary ............................................................................................................................................................................... 14
References ............................................................................................................................................................................ 14
FIGURES
1. Map showing location of (A) study site and distant test hole within the Amargosa Desert hydrographic areaand (B) sampling sites near low-level radioactive-waste burial site.......................................................................... 2
2. Graphs showing (A) activity of tritium in water vapor and (B) activity of 14carbon in carbon dioxide from test hole UZB-2, near the burial site for low-level radioactive waste south of Beatty, Nevada, April 1994 and July 1995 ........................................................................................................................................................... 4
3. Modeled relative HTO(V) and 14CO2 concentration distributions at 0 and 30 years................................................... 9
4. Diagram showing conceptual model of tritium movement along preferential flow paths ........................................... 13
TABLES
1. Tritium in water vapor and 14carbon in carbon-dioxide gas pumped from unsaturated sediments near thelow-level radioactive-waste burial site south of Beatty, Nevada, June 1992, April 1994, and July 1995.................. 3
2. Steady-state pressure differences, in pascals, required for first arrival of 14CO2 , at 100 meters from a sourcein 30 years ................................................................................................................................................................. 10
3. Steady-state pressure differences, in pascals, required for first arrival of tritium at 100 m from asource in 30 years ..................................................................................................................................................... 11
CONTENTS III

CONVERSION FACTORS
Multiply By To obtain
inch foot
foot per yearmile
galloncubic footcubic foot
atmospheretritium unit (TU)
percent modern carbon (pmc)
25.400.30480.30481.609
.00378528.32
0.02832101,325
3.20.061
millimetermetermeter per yearkilometercubic meterlitercubic meterpascalpicocurie per literpicocurie per gram of carbon
Temperature: Degree Celsius (°C) may be converted to degree Fahrenheit (°F) by using the formula°F = [1.8(°C)]+32. Degree Fahrenheit (°F) can be converted to degrees Celsius (°C) by using the formula°C = 0.556(°F-32).

Factors Affecting Tritium and 14Carbon Distributions in the Unsaturated Zone Near the Low-Level Radioactive-Waste Burial Site South of Beatty, Nevada
By R.G. Striegl, D.E. Prudic, J.S. Duval, R.W. Healy, E.R. Landa, D.W. Pollock, D.C. Thorstenson, and E.P Weeks
EXECUTIVE SUMMARY
Interpretations of the distributions of tritiated water vapor (HTOV) and 14carbon dioxide gas (14CO2) concentrations in the unsaturated zone adjacent to the low-level radioactive-waste burial site south of Beatty, Nevada, suggest that observed concentrations of 14CO2 could be explained by either diffusive or advective transport of the radioactive gas from the site.
The distribution of HTOV cannot be explained by vapor transport, either by diffusive or advec tive mechanisms. Thus, liquid transport appears to have played a role in moving HTOV to well UZB-2. Although the process by which this occurred cannot be determined from available data (and indeed may never be known), it is likely that liquid wastes disposed directly into the trenches during the period from 1962 to 1975 contributed to the offsite contamination.
Liquid transport may have been enhanced by precipitation and runoff into open trenches that resulted in the occasional accumulation of ponded water in the trenches and flow along pref erential pathways in the underlying unsaturated zone.
INTRODUCTION
Tritium as HTOV and 14carbon as 14CO2 were measured in much greater than ambient concentrations in the unsaturated zone south of the fenced boundary of the low-level radioactive-waste burial site near Beatty, Nevada, in April 1994 and July 1995 (fig. 1; Prudic and Striegl, 1995). Elevated HTOV activities prevail throughout the unsaturated thickness (~ 357 ft), and elevated 14CO2 activities are discernible to a depth of at least 112 ft at borehole UZB-2, approximately 350 ft south of the southwest corner of the fence surrounding the site (table 1, fig. 2). Concentration gradients in the unsaturated zone, and comparative measurements from a distant test hole, 2 miles to the south, identify the waste burial site as the probable origin of the increased radioactivity.
This observation is supported by comparison of tritium activities in water collected from six creosote bushes (Larrea tridentata; range of activity 2960 ± 50 to 9800 ± 90 tritium units) and one Russian thistle (Salsola pestifer, 4120 ± 50 tritium units) near the southwest corner of the site with tritium activity in water collected from a single creosote bush near the distant test hole (6 ± 7 tritium units) during July 10-14,1995.

36°45' -
AMARGOSA DESERT HYDROGRAPHICAREA
36°30' -
36°15' -
36°46'15"
36°45'45"
116°41'So il 6°41'
Probe AResearch shaft
UZB-2
MR-3 k Buffer zone
500 METERS
1,500 FEET
Figure 1. Location of (A) study site and distant test hole within the Amargosa Desert hydrographic area and (B) sampling sites near low-level radioactive-waste burial site. Hydrographic area from Harrill and others (1988).

Table 1 . Tritium in water vapor and 14carbon in carbon-dioxide gas pumped from unsaturated sediments near the low-level radioactive-waste burial site south of Beatty, Nevada, June 1992, April 1994, and July 1995.
[Location of sampling sites shown in figure 1. Symbol: --, not determined]
Depth (feet below
land surface)
Date sampled
Tritium (tritium units) 1
carbon (percent modern
carbon)2
Test hole UZB-2
18
39
59
79
112
157189
309
348
357
4/15-20/947/09-10/957/10-11/957/11-12/957/12-13/95 7/13-14/95 7/08-14/95
4/15-20/947/11-12/957/08-14/95
4/15-20/947/09-10/957/12-13/957/08-14/95
4/15-19/947/10-11/957/08-14/95
4/15-19/944/15-20/947/11-12/957/12-13/957/08-14/95
4/16-20/944/15-20/94
4/16-20/94
4/15-19/944/15-20/94
4/16-20/94
199 ±5249 ±8253 ±8240 ±8247 ±8 243 ±8
737 ±10883 ± 12
~
581 ±8723 ± 11640 ± 12
~
762 ±101,100 ±14
266 ± 10
437 ±9372 ±9
-
198 ±5215±5
143 ±5
133 ±5~
162 ±6
1,700 ±19-
2,160 + 11
__
815+5.1
297 ±3.5_
(3)
199 ±2.6-
201 ±1.5
_81 ±1.2 -
133 ±0.90
-28 ±0.69
-
_22 ±0.17
-
Depth (feet below
land surface)
34
441
61
93
20
36
43
5.5
5.5
n«,t- Tritium
SE?Distant test hole
6/05-09/927/09-11/95 3 ±67/11-12/95 0±6
6/05-09/92 7/09-10/95 5 ±6 7/10-11/95 -1±6
6/05-09/92
6/05-09/92
Research shaft
7/11-12/95 92 ±67/12-13/95 92 ±67/09-14/95
7/10-11/95 619 ±107/12-13/95 615 ±107/09-14/95
7/12-13/95 229 ±77/09-14/95
Shallow probe A
7/09-10/95 8,980 ± 707/09-14/95
Shallow probe B
7/10-11/95 29,400 ±2107/09-14/95
14carbon (percent modern
carbon)2
101 ±0.76__
90 ± 0.72
78 ± 0.67
55 ±0.75
_
(5)
_
(5)
(5)
45 1,000 ±2,800
_517,000 ±2,100
1 Tritium was analyzed by Robert Michel at U.S. Geological Survey isotope laboratory, Menlo Park, California. Uncertainty associated with each tritium value represents the counting error at one standard deviation. Values from the distant test hole are less than reported uncertainty. Measurement uncertainty does not include uncertainties associated with sampling or processing. Tritium units can be con verted to picocuries per liter by multiplying with 3.2 (Fritz, and Fontes, 1980, p. 14).
2Carbon-14 was analyzed by Herbert Haas at the Radiocarbon Laboratory, Desert Research Institute, Las Vegas, Nevada. Uncertainty associated with each carbon-14 activity represents the counting error at one standard deviation. Measurement uncertainty does not include uncertainties associated with sampling or processing. Percent modem carbon can be converted to picocuries per gram of carbon by multiplying with 0.061.
3Sample for carbon-14 was collected from air port at a depth of 59 feet in test hole UZB-2, and a value of 132-percent modern carbon was measured in laboratory. However, a leak was noted in tapered joint of collector and sample likely is contaminated with atmospheric carbon dioxide.
4Depths of uppermost two air ports not precisely known.
5Samples were collected in July 1995 from research shaft at depths of 20,36, and 43 feet below land surface. Sample depths were not recorded on bottles; thus, individual sample depths are not known. Activities for the three depths are 3,580 ±25,10,700 ±51, and 18,100 ±192 percent modem carbon.

LUo
3 200
CD
LLI LLI
- 300
D_ LLI Q
400
Sampled April 1994
O Sampled July 1995
0 200 400 600 800 1,000 1,200
TRITIUM ACTIVITY IN UNSATURATED-ZONE WATER VAPOR, IN TRITIUM UNITS
LLI O
£DC
1LLI CD
LLI U_
D_ LLI Q
200
~ 300
400
rfc
Sampled April 1994
O Sampled July 1995
500 1,000 1,500 2,000
14CARBON ACTIVITY IN UNSATURATED-ZONE CARBON DIOXIDE, IN PERCENT MODERN CARBON
2,500
Figure 2. (A) Activity of tritium in water vapor, and (B) activity of 14carbon in carbon dioxide from test hole UZB-2, near the burial site for low-level radioactive waste south of Beatty, Nevada, April 1994 and July 1995.

The observed HTOV and 14CO2 distributions require a source of contamination (assumed to be somewhere within the fenced perimeter of the waste burial site), a pathway for movement of the contaminants from the source, and plausible physical and geochemical mechanisms that allow movement to occur. The purpose of this report is to identify the factors that may have caused the observed HTOV and 14CO2 distributions. The history of waste burial at Beatty as it relates to possible HTOV and 14CO2 sources, precipitation records and site geology as they relate to radionuclide movement, physical and geochemical mechanisms that are known to control gas, water and radionuclide movement in the unsaturated zone, and possible conditions needed to produce the observed concentration distributions are described.
FACTORS AFFECTING TRITIUM AND 14CARBON DISTRIBUTIONS
Waste Disposal
The commercial site for burial of low-level radioactive waste is in the Amargosa Desert, about 10 miles south of Beatty, Nevada (fig. 1). Burial at the site began in September 1962 and contin ued through 1992, when the site was closed to further burial of low-level radioactive waste. The site operator continues to bury hazardous chemical wastes at an adjacent location. Radioactive wastes were buried in unlined trenches excavated into dry alluvium and were covered with the excavated materials. From 1962-66, 5 trenches were excavated that were about 40 ft wide, 350 ft long, and 20 ft deep. Beginning in 1965 and continuing through 1973, 8 trenches were exca vated that were 4 to 10 ft wide, 350 to 650 ft long, and 6 ft deep, and 5 trenches were excavated that were 35 to 75 ft wide, 650 ft long, and 20 ft deep. Since 1975, 4 trenches were excavated that were 90 to 300 ft wide, 670 to 800 ft long, and 30 to 50 ft deep. Wastes buried at the site include solid wastes in metal drums, concrete casks, and wooden and cardboard boxes. Liquid wastes could also be shipped to the site, however, the operating license required that liquid waste be solidified with portland cement before being buried. In contrast to this, a 1976 U. S. Nuclear Regulatory Commission (USNRC) investigation (Nevada Dept. of Human Resources, 1976; USNRC, 1976) suggests that liquid wastes delivered to the site between 1962 and 1975 were disposed directly into the trenches. According to site records, at least 600,000 gallons of liq uid waste were delivered to the site during this period.
Site records do not identify the waste form(s) that are the source of the observed HTO(V) and 14CO2 . Tritiated water in the liquid waste is a likely source of the tritium, but tritium can also occur in a variety of liquid, dissolved, sorbed, or solid phases, both inorganic and organic. Simi larly, 14C can occur in dissolved inorganic or organic carbon in liquid waste, in volatile organic compounds, sorbed to solids, or in the chemical structure of inorganic or organic solids. Release of 14CO2 or HTO(V) from waste requires phase equilibration, chemical reaction, and/or microbial activity. Therefore, the timing and sources of HTO(V) and 14CO2 releases may vary considerably within and among burial trenches (Striegl, 1991).
Precipitation
Large rainfalls could have enhanced migration of the liquid wastes. Several storms occurred between 1962 and 1992 that may have resulted in standing water in the bottoms of open

trenches. Precipitation events of 1 inch or more during a 24-hour period generally are sufficient to increase soil moisture and initiate downward movement of water. In undisturbed areas, this movement is limited to the upper few feet of unsaturated sediments because the water is evapo- transpired by plants. However, in areas having no vegetation, continued downward movement beyond a few feet is possible (Nichols, 1987, p. 34; Gee and others, 1994).
Measurements of precipitation at the burial site began in November 1977 by the U.S. Geolog ical Survey and continued until May 1980 (Brown and Nichols, 1990). The site operator (U.S. Ecology, Inc.) began measuring precipitation in 1981, and the U.S. Geological Survey reestab lished a percipitation gage at their research facility in August 1984 (Fischer, 1992, p. 6). Prior to 1977, precipitation at the site can be estimated from National Oceanic and Atmospheric Adminis tration records at Beatty and Amargosa Farms (previously Lathrop Wells); however, the records are incomplete. During the period when liquid wastes may have been poured directly into the trenches, precipitation exceeded 1 inch during a 24-hour period at least 5 times: February 10, 1968; November 7,1969; February 21,1970; October 4,1972 (Nichols, 1987, p.22). From November 1977 through 1992, precipitation of about 1 inch or more during a 24-hour period was recorded 13 times.
Site GeologyThe burial site is in the Amargosa Desert, a northwest-trending valley in the Basin and Range
Province. The valley is bounded by block-faulted mountains composed of lower Paleozoic rocks and Tertiary volcanic rocks. Moderate to steeply sloping alluvial fans have formed at the foot of the mountains, and the central part of the valley slopes gently to the southeast. The burial site is located on a small promontory in the gently sloping part of the valley about 0.5 mile west of the toe of an alluvial fan. The valley at the burial site is about 8 miles wide. The uppermost 100 ft of sediments at the site are predominately layers of moderately sorted sand and gravel that were deposited in ancestral Amargosa River channels separated by intervals of a more poorly sorted mixture of silt, sand, and gravel that was deposited in the adjacent flood plains. Lake and debris flow deposits predominate from depths of about 100 ft to the water table (Nichols, 1987, p. 9). The water table at the site ranges from about 280 to 380 ft below land surface (Fischer, 1992).
The uppermost 1 to 3 ft of sediment at the site is a sandy silt, which caps a sand and gravel layer that is 2 to 4 ft thick. These near-surface deposits are prevalent in the vicinity of the burial site. Three additional sand and gravel sequences were observed between the depths of 10 and 65 ft on an exposed wall of trench 11 at the adjacent chemical-waste site. Below a depth of about 100 ft, the sediments become finer grained and have a greater moisture content (Andraski and Prudic, In Press). A thick sandy silt, similar to the sandy silt at land surface, was present in test hole UZB-2 at a depth of 280 to 300 ft. This unit was previously described as a clay in several test holes where mud or foam was used to remove drill cuttings. Test hole UZB-2 was drilled dry, using air to remove the cuttings.
Plant roots do not extend much below the depth of the surficial sandy silt (upper 1 to 3 ft) and peak chloride concentrations in pore water are at depths between 4 and 7 ft. Both of these factors indicate that most of the precipitation that falls on the land surface is transpired or evaporated back to the atmosphere and does not infiltrate into deeper sediments.

Additionally, the sand and gravel layer underlying the surficial sandy silt should act as a capillary barrier, inhibiting deeper water movement (Fischer, 1992, p. 43). Water stored in the surficial sandy silt during fall and winter is generally used by plants during the spring and summer growing season or evaporated to the atmosphere.
TRANSPORT
Chemical and Isotopic Equilibrium Assumptions
Models of subsurface radionuclide transport generally assume instantaneous chemical and isotopic equilibrium. The unsaturated zone is regarded as a mixture of gas, water, and solids and the saturated zone is regarded as a mixture of water and solids. Instantaneous chemical equilib rium assumes that all gases, aqueous reactants and products, and solid reactants and products achieve chemical equilibrium on contact with each other. It also assumes that, for the unsatur ated zone, contact of any two phases implies contact of all phases. This is important when con sidering movement of highly reactive gases, such as CO2, because it requires that gaseous CO2 equilibrates instantaneously with dissolved CO2 , all other aqueous inorganic carbon species, and any reactive mineral surfaces present as it moves through the unsaturated zone. Isotopic equilib rium additionally assumes that the ratios of isotopes must be essentially equal among all phases. This is important for the cases of HTOV and 14CO2 movement, where the concentrations of the radioactive gases per unit volume of unsaturated zone are minute compared to the concentra tions of non-radioactive liquid water or of dissolved and surface-bound carbon species in that same volume. The non-gaseous fractions therefore act as very large sinks for the radioisotopes that retard or inhibit radioactive gas transport. Consequently, these radioactive gases would be expected to move very slowly in the unsaturated zone unless they are somehow able to bypass interaction with the other phases. Such a scenario could be plausible for unsaturated zones that are very wet and that possibly contain zones of high water content that are isolated from gas movement pathways, but it is not likely for arid or semi-arid systems where water is fairly evenly distributed and gas pathways are well connected.
Diffusion
Diffusion is the predominant mechanism of gas transport in unsaturated zones and thus is the first mechanism of transport considered for HTOV and 14CO2 movement from waste disposal trenches. We use the model described by Smiles and others (1995) for diffusion of tritium in arid disposal sites. Although this model is not an exact analog of the Beatty site, it is similar enough to provide insight on the process. Smiles and others (1995) used a volumetric moisture content of 0.06 and a total porosity of 0.30 for their analysis. These values are within the ranges reported by Fischer (1992, p. 25) for the Beatty site, and result in an effective diffusion coefficient of 0.00373 m2yr~1 .
Tritium is assumed to diffuse in both the liquid and gas phases with instantaneous equilibrium between phases described by Henry's Law. Spherical symmetry, uniform moisture content, and uniform effective diffusion coefficient are assumed. At time equal 0, a slug of tritium is introduced to the system and is assumed to spread instantaneously over a sphere of radius "a". These assumptions should be viewed as conservative: we expect that the model

over-predicts actual tritium diffusion at the Beatty site because it ignores the presence of the atmosphere and initially distributes the source term over a large region.
We applied the Smiles and others (1995) model with effective diffusion coefficients equal to 0.00373 and 0.0373 m2yr" 1 (an order of magnitude greater) and radii of 1 and 25 m (corresponding to initial water volumes of approximately 0.25 and 3,900 m3 contained in the spherical source) for a period of 30 years. Model results after 30 years are displayed in figure 3 in terms of concentration relative to initial source concentration (C/C0). The initial source concentrations for time equal to 0 are represented by the dashed lines. The tritium diffuses very slowly because most of it is stored in, or exchanges to, the liquid water phase; the diffusion coefficient for liquid water is about 10,000 times less than that for water vapor.
We examined two cases for 14CO2 diffusion: one without retardation and the other with retardation. The Smiles and others (1995) model was used again with the same moisture content and porosity. An effective diffusion coefficient of 81.5 m2yr~ 1 was used. A retardation factor of 100 was incorporated into the second case. The resulting effective diffusivities encompass the range of values determined by Thorstenson and others (1983) for CO2 diffusion in the unsaturated zone and by Striegl and Healy (1990) for 14CO2 diffusion. Thus, actual retardation of 14CO2 should be less than that modeled for the second case. Figure 3 shows results for the two cases. Even with retardation, 14C02 is able to diffuse much more quickly than tritium, largely because the ratio of gas-phase mass to total mass is much greater for 14CO2 than for tritium.
By all indications it does not appear that diffusion alone can explain the distribution of tritium in the subsurface at the Beatty site. Using realistic parameter values, simulation of 30 years of diffusion results in a tritium concentration 16 orders of magnitude less than the original sourceconcentration at a distance of about 15 m from the source (fig. 3A). On the other hand, 14CO2 can diffuse to distances indicated by the data in table 1. However, if diffusion were the lone mechanism, the large differences in 14C02 concentration as a function of depth at UZB-2 (table 1, fig. 2B) would not be expected.
Gas AdvectionIn contrast to diffusion, where gases move along partial-pressure gradients within an other
wise isobaric system, gases can also move advectively along a total-pressure gradient. The pressure gradient can arise from (1) buoyant forces due to thermal or topographic effects, or (2) atmospheric pressure fluctuations. To evaluate whether either driving force is adequate to move sufficient gas to produce the observed 14CO2 and HTOV concentrations, the following test calcu lations were made. Continuous steady-state non-dispersive piston gas flow was assumed to occur for a 30-year period. The pressure differentials that must be maintained to produce first arrival of 14CO2 and HTOV in 30 years were calculated as a function of permeability of the medium, and the degree of interaction with pore water. As in the diffusion calculations, moisture content was assumed to be 0.06, and total porosity to be 0.30.
Table 2 shows the total pressure differences, in pascals (Pa), that are required for first arrival of 14CO2 at a distance of 100 m from a source, as a function of permeability and degree of retar dation. Pressure differences would be expected to be slightly smaller for the case of coupled gas

NATURAL LOG OF RELATIVE CONCENTRATION (C/Co)-*zr QJ -ncfi g CD S' o' c: c -^
r-» ro § 3 » a $2 Q CO CDs§"5s CD =i CD <
i. a 5- ?-, O CO CD CO O
»a 5-^ag-"^is D3 - 9: Q,a Oc S o "1-w 3a 0*-* f^9J o = '
Q. S"
S if S- q Q. =
17 CD Q.CD ^ QJ3; CD iS.2 & CD G < -
n n n n ^co o co co *< *< o o r1 r" »< »<n HOP ro -* nen 3 ro -*
en o* w °' 3 2.
O CD =£(D 3 S35 o 22. o' CD' oCD' ^ 3 3 -^ Q)=i o coo^o -» O QJ
2 2 o 7^ O c yico^-
g co CDro^ Q.
NATURAL LOG OF RELATIVE CONCENTRATION (C/Co)
Q)O Q.
. O
CD
§ 8
.

advection and dispersion. In table 2, the permeability range at the Beatty site lies below the dot ted line. For the largest site permeability values, small pressure differences maintained over the 30-yr period can transport 14CO2 the required distance because the ratio of the mass of 14CO2 stored as dissolved inorganic carbon in pore waters relative to that stored in the gas phase is not exceedingly large (as opposed to the large quantity of tritiated water occurring in the pore space relative to the quantity of HTOV). If, as with the diffusion modeling, a retardation factor of 100 is assumed for 14CO2 , with permeability equal to 5 x 10" 10m2 , a pressure difference of 9.2 Pa can produce the required flow over 30 years. A pressure difference of this magnitude can easily be produced by temperature and pressure buoyancy effects (a physically reasonable upper limit is on the order of 100 Pa). However, although the magnitude of the pressure difference is feasible on a daily or seasonal basis, we are unaware of a mechanism that could continuously maintain such a pressure difference.
Table 2. Steady-state pressure differences, in pascals, required for first arrival of 14CO2 at 100 meters from a source in 30 years, as a function of permeability and degree of retardation.
Permeability, k, Retardation factor, in percent
in meterssquared o.O 10 100
l.OxlO'6 4.6xlO'5 4.6xlO'4 4.6xlO'3
l.OxlO'7 4.6xlO'4 4.6xlO'3 4.6xlO'2
l.OxlO'8 4.6xlO-3 4.6xlO'2 0.46
l.OxlO'9 4.6xlO'2 0.46 4- 6
S.OxlO' 10 9.2xlO'2 0.92 9.2
l.OxlO' 10 0.46 4- 6 46
l.OxlO'11 4-6 46 460
l 46 460 4,600
Table 3 shows pressure differences necessary to produce first arrival of HTOV at a distance of 100 m, in 30 years, calculated as a function of permeability of the medium, and the degree of interaction with pore water. As in Table 2, a volumetric moisture content of 0.06 and total porosity of 0.30 are used.
10

Table 3: Steady-state pressure differences, in pascals, required for first arrival of tritium at 100 meters from a source in 30 years, as a function of permeability and degree of retardation. Possible conditions that could advect tritium a distance of 100 m, if a mechanism could be found, are bold and in italics.
Permeability, k,
in meters
squared 0.0
Retardation factor, in percent
0.1 1.0 10 100
l.OxKT6
l.OxlO'7
l.OxlO'8
l.OxlO'9
S.OxlO'10
l.OxlO'10
l.OxlO'11
l.OxlO'12
0.0
4.6xlO'5
4.6xlO'4
4.6xlO'3
4.6xlO'2
5UxlO-2
0.46
0.1
7.1xlO'4
7.1xlO'3
7.1xlO'2
0.71
1.4
7.1
1.0
6.6xlO'3
6.6xlO'2
0.66
6.6
13
66
10
6.6xlO'2
0.66
6.6
66
130
660
100
0.66
6.6
66
660
1,300
6,600
4.6
46
71
710
660
6,600
6,600
6.6x10^
Assumtions and calculations for tables 2 and 3
v = particle velocity = 100m/30yr = 3.33 m yr' 1qd = drained porosity = 0.24; qw = water filled porosity - 0.06Q = Darcy velocity = (v)(qd) - 0.80 m yr" 1Q = (k /u) (delta PI delta x)k = permeability in m 2u = dynam ic viscosity = 5.7x1 0" 1 3 Pa yr (Bird and others, 1 960)delta x = 100mdelta P . [(0.80 m yr 1 )(5.7 x 10'13 Pa yr)(100 m)] / k = 4.56 x 10' 11 Pa k' 1At 20° C, 1 cubic meter of water saturated air contains 17.3 g = 0.0173 kg water
1 cubic meter of water contains 1 ,000 kg waterFor equal volumes, Kd - 57,803Volume adjusted Kd = 57,803x0.06/0.24 = 14,451Retardation coefficient = 1 + Kd = 14,452
6.6xl04
6.6xl05
11
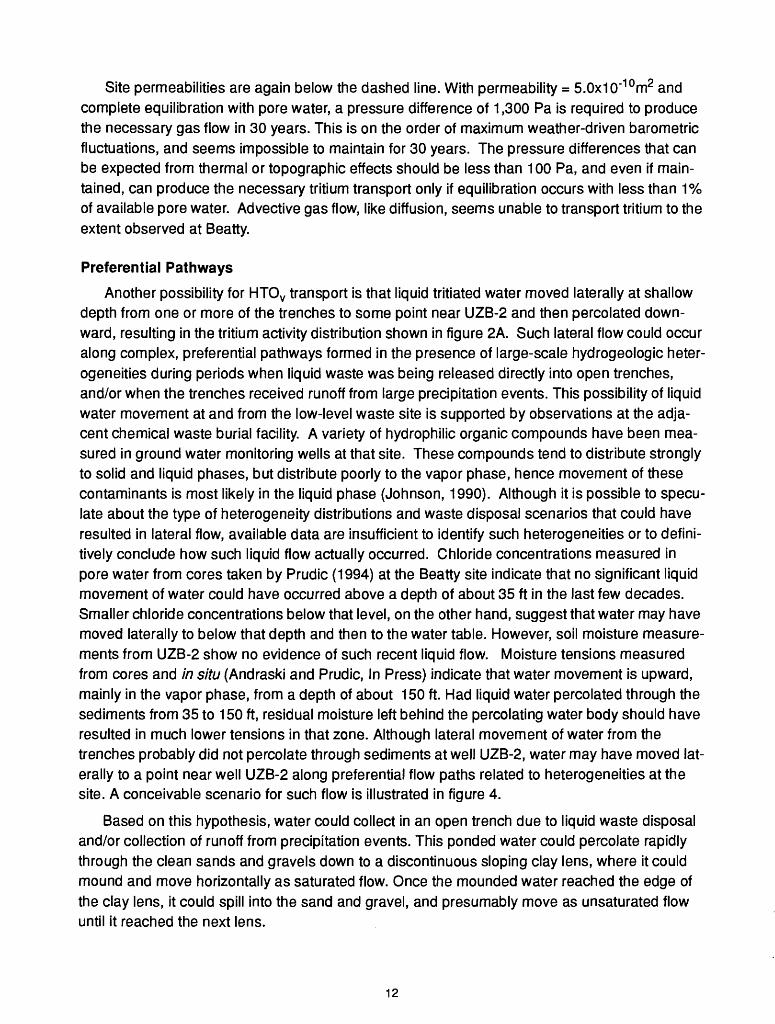
Site permeabilities are again below the dashed line. With permeability = 5.0x10'10 m2 and complete equilibration with pore water, a pressure difference of 1,300 Pa is required to produce the necessary gas flow in 30 years. This is on the order of maximum weather-driven barometric fluctuations, and seems impossible to maintain for 30 years. The pressure differences that can be expected from thermal or topographic effects should be less than 100 Pa, and even if main tained, can produce the necessary tritium transport only if equilibration occurs with less than 1% of available pore water. Advective gas flow, like diffusion, seems unable to transport tritium to the extent observed at Beatty.
Preferential Pathways
Another possibility for HTOV transport is that liquid tritiated water moved laterally at shallow depth from one or more of the trenches to some point near UZB-2 and then percolated down ward, resulting in the tritium activity distribution shown in figure 2A. Such lateral flow could occur along complex, preferential pathways formed in the presence of large-scale hydrogeologic heter ogeneities during periods when liquid waste was being released directly into open trenches, and/or when the trenches received runoff from large precipitation events. This possibility of liquid water movement at and from the low-level waste site is supported by observations at the adja cent chemical waste burial facility. A variety of hydrophilic organic compounds have been mea sured in ground water monitoring wells at that site. These compounds tend to distribute strongly to solid and liquid phases, but distribute poorly to the vapor phase, hence movement of these contaminants is most likely in the liquid phase (Johnson, 1990). Although it is possible to specu late about the type of heterogeneity distributions and waste disposal scenarios that could have resulted in lateral flow, available data are insufficient to identify such heterogeneities or to defini tively conclude how such liquid flow actually occurred. Chloride concentrations measured in pore water from cores taken by Prudic (1994) at the Beatty site indicate that no significant liquid movement of water could have occurred above a depth of about 35 ft in the last few decades. Smaller chloride concentrations below that level, on the other hand, suggest that water may have moved laterally to below that depth and then to the water table. However, soil moisture measure ments from UZB-2 show no evidence of such recent liquid flow. Moisture tensions measured from cores and in situ (Andraski and Prudic, In Press) indicate that water movement is upward, mainly in the vapor phase, from a depth of about 150 ft. Had liquid water percolated through the sediments from 35 to 150 ft, residual moisture left behind the percolating water body should have resulted in much lower tensions in that zone. Although lateral movement of water from the trenches probably did not percolate through sediments at well UZB-2, water may have moved lat erally to a point near well UZB-2 along preferential flow paths related to heterogeneities at the site. A conceivable scenario for such flow is illustrated in figure 4.
Based on this hypothesis, water could collect in an open trench due to liquid waste disposal and/or collection of runoff from precipitation events. This ponded water could percolate rapidly through the clean sands and gravels down to a discontinuous sloping clay lens, where it could mound and move horizontally as saturated flow. Once the mounded water reached the edge of the clay lens, it could spill into the sand and gravel, and presumably move as unsaturated flow until it reached the next lens.
12

A major requirement of this hypothesis is the presence of quite low-permeability clay lenses. Fischer (1992, fig. 4) indicates that such clay lenses may be present, based on the interpretation of geophysical logs for US Ecology wells 302 and 303. However, clay lenses have not been identified in cuttings from any of the wells or in sediments excavated during installation of the research shaft (fig. 1), nor have they been identified in the extensive cut face of chemical waste trench 11. Tritium activities that are a few times higher than those for overlying (18 ft) and underlying (112 ft) depths were measured in vapor samples from the 39-foot and 79-foot depths in well UZB-2 (table 1.) These activities suggest that liquid water moved to the vicinity of the well at relatively shallow depth, requiring that the lenses also be shallow and fairly extensive.
oc§
Discontinuous clay lenses
Wetting front produced by percolating water.
Figure 4. Conceptual model of tritium movement along preferential flow paths
An alternative mechanism for preferential flow would involve fingering of liquid flow through the coarsest gravels, downward percolation through the finer materials until water reached the
13

underlying contact, where it would be inhibited from entering the coarser material because of a capillary barrier effect. The water might then migrate down the sloping contact until sufficient head built up to again finger through the next coarse-grained bed. This mechanism depends on the presence of layering with large contrasts in grain size, porosity, and capillary properties. Such contrasts typically occur in alluvium, like at Beatty, where channel, flood-plain, eolian, lacustrine, and debris-flow sediments are present. However, the alluvium has not been extensively mapped at the site and the exact distribution of sediment types is unknown.
SUMMARY
It appears likely that the source of high HTOV and 14CO2 activities in well UZB-2 is from the Beatty disposal site. In addition, modeling indicates that gaseous diffusion is a viable transport mechanism for the 14CO2 . The only mechanism that appears viable for tritium transport involves lateral liquid movement along preferential flow paths. Ponded water likely occurred occasionally in the trenches due both to liquid waste disposal and to runoff collection, and such ponding might have resulted in preferential flow. However, mechanisms that would produce a dominantly lateral component to this flow have yet to be identified at the site. Thus, although the presence of tritium in high concentration in vapor samples from well UZB-2 indicates the probability of liquid transport, we cannot determine, from our current state of knowledge, how such flow could have occurred.
Determination of the mechanisms that caused the movement of tritium and 14C movement from the Beatty site to UZB-2 requires better understanding of (1) the source of the radionuclides at the disposal trenches and the relation of source strength to disposal practices, (2) probable pathways of liquid and gas movement, and (3) the concentration distribution of HTOV and 14CO2 in the unsaturated zone at and surrounding the site.
14

REFERENCES
Andraski, B. and Prudic D.E., In Press, Soil, plant and structural considerations for surface barriers in arid environments - Application of results from studies in the Mojave Desert near Beatty, Nevada, in, Barriers for Long-Term Isolation, Denver, CO, August 1995, Proceedings: Washington D.C., National Academy Press.
Bird, R.B., Stewart, W.E., and Lightfoot, E.W., 1960, Transport Phenomena: New York, John Wiley and sons, 780 p.
Brown, R.G., and Nichols, W.D., 1990, Selected meteorological data for an arid climate over bare soil near Beatty, Nye County, Nevada, November 1977 through May 1980: U.S. Geological Survey Open-File Report 90-195,48 p.
Fischer J.M., 1992, Sediment properties and water movement through shallow unsaturated alluvium at an arid site for disposal of low-level radioactive waste near Beatty, Nye County, Nevada: U.S. Geological Survey Water-Resources Investigations Report 92-4032,48 p.
Fritz, P., and Fontes, J.Ch., 1980, Handbook of Environmental Isotope Geochemistry, Volume 1: New York, Elsevier Scientific Publishing Co., 545 p.
Gee, G.W., Wierenga, P.J., Andraski, B.J., Young, M.H., Fayer, M.J., and Rockhold, M.L., 1994, Variations in water balance and recharge potential at three western desert sites: Soil Science Society of America Journal, v. 58, no. 1, p. 63-72.
Harrill, J.R., Gates, J.S., and Thomas, J.M., 1988, Major ground-water flow systems in the Great Basin region of Nevada, Utah and adjacent states: U.S. Geological Survey Hydrologic Investigations Atlas HA-694-C, 2 sheets.
Johnson, R.L., 1990, A review of organic contaminants in the unsaturated zone and groundwater zones at the Beatty, Nevada TSD site: Report to USEPA, Region IX, September 27,1990, 8 p.
National Research Council, 1995, Ward Valley, An Examination of Seven Issues in Earth Sciences and Ecology: Washington, D.C., National Academy Press, 212 p., plus appendices.
Nevada Department of Human Resources, 1976, Letter from R.S. Trounday to Governor O'Callaghan, March 31,1976.
Nichols, W.D., 1987, Geohydrology of the unsaturated zone at the burial site for low-level radioactive waste near Beatty, Nye County, Nevada: U.S. Geological Survey Water Supply Paper 2312, 57 p.
Prudic, D.E., 1994, Estimates of percolation rates and ages of water in unsaturated sediments at two Mojave Desert sites, California - Nevada: U.S. Geological Survey Water-Resources Investigations Report 94-4160,19 p.
15

Prudic, D.E., and Striegl, R.G., 1995, Tritium and radioactive carbon (14C) analyses of gas collected from unsaturated sediments next to a low-level radioactive-waste burial site south of Beatty, Nevada, April 1994 and July 1995: U.S. Geological Survey Open-File Report 95-741, 7 p.
Smiles, D.E., Gardner, W.R., and Shulz, R.K., 1995, Diffusion of tritium in arid disposal sites: Water Resources Research, v. 31, no. 6, p. 1483-1488.
Striegl, R.G., 1991, Gases in the unsaturated zone, in Ryan, B.J., Results of hydrologic research at a low-level radioactive-waste disposal site near Sheffield, Illinois: U.S. Geological Survey Water-Supply Paper 2367, p. 45-51.
Striegl, R.G., and Healy, R.W., 1990, Transport of 14CO2 in unsaturated glacial and eolian sediments, in Bassett, R.L. and Melchoir, D.C., eds., Chemical Modeling of Aqueous Systems II: American Chemical Society Symposium Series, no. 416, chap. 15, p. 202-210.
Thorstenson, D.C., Weeks, E.P., Haas, H., and Fisher, D.W., 1983, Distributions of gaseous 12CO2 , 13CO2 , and 14CO2 in the sub-soil unsaturated zone of the Western U.S. Great Plains: Radiocarbon, v. 25, no. 2, p. 315-346.
U.S. Nuclear Regulatory Commission, Office of Inspection and Enforcement, Region V, 1976, IE Inspection Report 76-02.
16