factors affecting translational efficiency of …...factors affecting translational efficiency of...
TRANSCRIPT

Factors affecting translational efficiency of
bacteriophages
Ramanandan Prabhakaran
Supervisor : Dr. Xuhua Xia
Thesis submitted to the
Faculty of Graduate and Postdoctoral Studies
University of Ottawa
In partial fulfillment of the requirements for a
Master’s degree from the
Ottawa-Carleton Institute of Biology
Thèse soumise à la
Faculté des Etudes Supérieures et Postdoctorales
Université d’Ottawa
En vue de l’obtention de la maîtrise
L’Institut de Biologie d’Ottawa-Carleton
© Ramanandan Prabhakaran, Ottawa, Canada, 2015

II
Abstract
Mass production of translationally optimized bacteriophages (hereafter referred to as
phages) is the need of the hour in the application of phages to therapy. Understanding
translational efficiency of phages is the major preliminary step for mass producing efficient
phages. The objective of this thesis is to understand factors affecting translational efficiency
of phages.
In chapter two, we hypothesized that weak translation initiation efficiency is
responsible for weak codon concordance of Escherichia coli lambdoid phages with that of
their hosts. We measured the strength of translation initiation using two indices namely
minimum folding energy (MFE) and proportion of Shine-Dalgarno sequence (PSD).
Empirical results substantiate our hypothesis suggesting lack of strong selection for
improving codon adaptation in these phages is due to their weak translation initiation.
In chapter three, we measured codon usage concordance between GC-rich and GC-
poor Aeromonas phages with their GC-rich host Aeromonas salmonicida. We found low
codon usage concordance in the GC-poor Aeromonas phages. We were interested in testing
for the role of tRNAs in the GC-poor phages. We observed that the GC-poor phages carry
tRNAs for codons that are overused by the phages and underused by the host. These findings
suggest that the GC-poor Aeromonas phages carry their own tRNAs for compensating for the
compositional difference between their genomes and that of their host.
Previously several studies have reported observed avoidance of stable secondary
structures in start site of mRNA in a wide range of species. We probed the genomes of 422
phage species and measured their secondary structure stability using MFE. We observed
strong patterns of secondary structure avoidance (less negative MFE values) in the
translation initiation region (TIR) and translation termination region (TTR) of all analyzed
phages. These findings imply selection is operating at these translationally important sites to
control stable secondary structures in order to maintain efficient translation.

III
Résumé
La production en série de bactériophages (dorénavant surnommés « phages ») avec
codons optimisés pour la traduction est en haute demande étant donné l’utilité de ces derniers
en phagothérapie. Il est donc critique de comprendre les mécanismes de traduction efficace
chez ces phages. L’objectif de cette thèse est de mieux comprendre les facteurs affectant
l’efficacité traductionnelle d’ARNm chez les phages.
Au deuxième chapitre, nous vérifions l’hypothèse que les transcrits à faible
démarrage traductionnelle portent également une séquence de codons sous-optimale chez les
phages lambdoïdes vis-à-vis leur hôte, Escherichia coli, duquel ils empruntent la machinerie
traductionnelle. Nous avons quantifié l’efficacité de démarrage à l’aide de deux indices, à
savoir l’énergie minimale de repliement (MFE) et la proportion de séquences Shine-
Dalgarno (PSD). Nos résultats empiriques consolident notre hypothèse que l’affaiblissement
de pression sélective, qui nuit l’optimisation des codons dans ces phages, peut être attribué
au pauvre démarrage de traduction.
Au troisième chapitre, nous quantifions le rapport entre codons utilisés par les phages
Aeromonas riches et pauvres en bases GC, et ceux employés par leur hôte riche en GC,
Aeromonas salmonicida. Nous avons trouvé une faible correspondance phage-hôte pour les
phages pauvres en GC. Nous testons d’abord le rôle des ARNt dans ces derniers. Nous avons
observé que ces phages comportent des ARNt correspondants aux codons surutilisés dans
leurs gènes mais sous-utilisés dans ceux de leur hôte. Ceci suggère que les phages
Aeromonas à composition pauvre en GC fournissent leurs propres ARNt comme moyen de
combler leur constitution génomique sous-optimale par rapport à l’hôte.
Plusieurs études antérieures ont démontré que les séquences de démarrage évitent une
structure secondaire stable dans un étalage d’espèces. Nous avons sondé les séquences
initiatrices des génomes de 422 phages et quantifié leurs structures secondaires utilisant le
MFE. Tel que rapporté pour autres espèces, nous observons une tendance à éviter les
structures secondaires fortes (valeurs MFE moins négatives) dans les régions d’initiation
(TIR) et de terminaison (TTR) de traduction pour tous phages étudiés. Ces résultats sous-
entendent une sélection sur la structure secondaire de ces sites pour maintenir une traduction
efficace.

IV
Acknowledgements
I am extremely grateful to my supervisor Dr Xuhua Xia for providing me the
opportunity to work in his lab as his master’s student. I cannot thank Dr Xia enough for his
immense support, constant encouragement and words of wisdom.
I would like to thank my advisory committee members, Dr Stéphane Aris-Brosou, and
Dr Ashkan Golshani for their useful inputs and guidance. In addition, I would also like to
thank, Dr Douglas Johnson, Dr Marc Ekker and Dr Ashkan Golshani and for accepting to be
my thesis examiners.
I take this opportunity to thank my past and present lab members for their huge support
and guidance. I thank my wife Shivapriya for being very helpful while developing this thesis,
for her useful suggestions and for reviewing my thesis multiple times. I wish to thank all my
friends for their support and motivation. I thank my father (Harihar alias Prabhakaran),
mother (Jayenthi), brother (Ramanujam) and my spiritual guru (Praghad Guru Hariprasad
swamiji) for giving me the strength and for surrounding me with positive energy, without
their love and support the completion of this thesis would not have been possible. Finally, I
would like to acknowledge the financial support from my dad, international admission
scholarship from Faculty of Graduate and Postdoctoral Studies (FGPS), University of Ottawa
and NSERC for their generous funding.
V
“குரு ப்ரம்மா குரு விஷ்ணு குரு தேதவா மதேஸ்வராஹ் குரு சாக்ஷாத் பரம்ப்ரம்மா
ேஸ்மம ஸ்ரீ குரதவ நமஹா” in Tamil language.
“Guru Brahma Guru Vishnu
Guru Devo Maheshwara
Guru Sakshath Parambrahma
Tasmai Shri Gurave Namaha”
A spiritual verse about the teacher in Hinduism.
Translation:
The teacher is like Lord Brahma as he generates the knowledge within us,
like Lord Vishnu as he operates the ideas/knowledge in our mind into the right
path, and like Lord Mahesha (Shiva) as he destroys the wrong concepts
attached to our knowledge, while enlightening us on the desired path. Thus the
teacher is like our ultimate God and we should pray and give respect to our
teacher. To that teacher I bow.
To all my teachers

VI
List of Publications
A. Publications related to my thesis
1) Ramanandan Prabhakaran, Shivapriya Chithambaram, and Xuhua Xia
(2014) ‘Aeromonas phages encode tRNAs for their overused codons’,
Int. J. Computational Biology and Drug Design, Vol. 7, Nos. 2/3,
pp.168–182.
2) Ramanandan Prabhakaran, Shivapriya Chithambaram, and Xuhua Xia.
E. coli and Staphylococcus phages: Effect of translation initiation
efficiency on differential codon adaptation mediated by virulent and
temperate lifestyles. J. Gen. Virol. 2015 : vir.0.000050v1-vir.0.000050.
B. Other publications
1) Shivapriya Chithambaram, Ramanandan Prabhakaran, Xuhua Xia.
2014. Differential codon adaptation between dsDNA and ssDNA
phages in Escherichia coli. Mol. Biol. Evol. 31:1606-1617.
2) Shivapriya Chithambaram, Ramanandan Prabhakaran, Xuhua Xia.
2014. The Effect of Mutation and Selection on Codon Adaptation in
Escherichia coli Bacteriophage. Genetics 197:301-315.
C. Oral and poster presentations in conferences
1) Ramanandan Prabhakaran, Shivapriya Chithambaram, Xuhua Xia:
“Aeromonas phages encode tRNAs for their overused codons”.
International Conference on Intelligent Biology and Medicine. August
11-13, 2013, Nashville, TN, USA.
2) Xuhua Xia, Ramanandan Prabhakaran: “Selection for translation
elongation efficiency depends on translation initiation efficiency in E.
coli phages”. Society of Molecular Biology and Evolution. June 8-12,
2014, Puerto Rico.

VII
Table of Contents
ABSTRACT ...................................................................................................................................................... II
RÉSUMÉ ........................................................................................................................................................ III
ACKNOWLEDGEMENTS ................................................................................................................................. IV
LIST OF PUBLICATIONS .................................................................................................................................. VI
LIST OF TABLES .............................................................................................................................................. IX
LIST OF FIGURES ............................................................................................................................................. X
LIST OF ABBREVIATIONS............................................................................................................................... XII
1. CHAPTER ONE - INTRODUCTION ........................................................................................................... 1
1.1. PROTEIN SYNTHESIS.................................................................................................................................. 1 1.2. COMPONENTS OF TRANSLATION INITIATION .................................................................................................. 1 1.2.1. RIBOSOME STRUCTURE ............................................................................................................................. 1 1.2.2. TRANSLATION INITIATION REGION ............................................................................................................... 2 1.2.2.1. ROLE OF SHINE-DALGARNO SEQUENCE.................................................................................................... 2 1.2.2.2. ROLE OF MRNA SECONDARY STRUCTURE ................................................................................................. 4 1.2.2.3. ROLE OF START CODON ........................................................................................................................ 5 1.2.2.4. ROLE OF SPACING BETWEEN SD AND START CODON ................................................................................... 5 1.2.3. INITIATOR TRNA ..................................................................................................................................... 6 1.2.4. TRANSLATION INITIATION FACTORS .............................................................................................................. 6 1.3. TRANSLATION INITIATION .......................................................................................................................... 8 1.4. GENETIC CODE ...................................................................................................................................... 10 1.5. TRANSLATION ELONGATION ..................................................................................................................... 11 1.6. TRANSLATION TERMINATION .................................................................................................................... 12 1.7. PHAGE REPLICATION LIFECYCLE ................................................................................................................. 14 1.7.1. ADSORPTION ........................................................................................................................................ 15 1.7.2. PENETRATION ....................................................................................................................................... 15 1.7.3. TRANSCRIPTION AND REPLICATION OF PHAGE PROTEINS ................................................................................. 15 1.7.4. ASSEMBLY OF PROTEINS INTO PHAGE PROTEIN SHELL..................................................................................... 15 1.7.5. RELEASE OF FULLY ASSEMBLED PHAGE PARTICLES ......................................................................................... 16 1.8. PHAGE CODON-ANTICODON ADAPTATION ................................................................................................... 16 1.9. SIGNIFICANCE OF THE STUDY .................................................................................................................... 17
2. CHAPTER TWO .................................................................................................................................... 19
2.1. ABSTRACT ............................................................................................................................................ 19 2.2. CONTRIBUTION ..................................................................................................................................... 20 2.3. INTRODUCTION ..................................................................................................................................... 20 2.4. MATERIALS AND METHODS ..................................................................................................................... 25 2.4.1. GENOMIC DATA .................................................................................................................................... 25 2.4.2. IDENTIFICATION OF SD SEQUENCES ........................................................................................................... 26 2.4.3. MEASURING STABILITY OF LOCAL MRNA SECONDARY STRUCTURE ................................................................... 29 2.5. RESULTS .............................................................................................................................................. 29 2.5.1. COMPARISON OF SD FEATURES BETWEEN CLADE A AND CLADE B PHAGES ........................................................ 30 2.5.2. COMPARISON OF SECONDARY STRUCTURE STABILITY BETWEEN CLADE A AND CLADE B PHAGES ............................. 31 2.5.3. RELATIONSHIP BETWEEN SD FEATURES AND SECONDARY STRUCTURE STABILITY .................................................. 34 2.6. DISCUSSION .......................................................................................................................................... 37
VIII
3. CHAPTER THREE .................................................................................................................................. 40
3.1. ABSTRACT ............................................................................................................................................ 40 3.2. CONTRIBUTION ..................................................................................................................................... 40 3.3. INTRODUCTION ..................................................................................................................................... 41 3.4. MATERIALS AND METHODS ..................................................................................................................... 45 3.4.1. SEQUENCE SELECTION ............................................................................................................................ 45 3.4.2. RELATIVE SYNONYMOUS CODON USAGE .................................................................................................... 45 3.4.3. TRNA DATASET ..................................................................................................................................... 47 3.4.4. PHYLOGENETIC ANALYSIS ......................................................................................................................... 47 3.5. RESULTS AND DISCUSSION ....................................................................................................................... 48 3.5.1. THE GC-RICH AND GC-POOR PHAGES DIFFER DRAMATICALLY IN THEIR CODON USAGE RELATIVE TO THEIR HOST ........ 48 3.5.2. AEROMONAS PHAGES ENCODE TRNA FOR THEIR OVERUSED CODONS ............................................................... 51 3.5.3. PRESENCE OF TRNA GENES IN AEROMONAS PHAGES APPEARS TO BE A DERIVED TRAIT BASED ON PHYLOGENETIC
ANALYSIS… ......................................................................................................................................................... 54 3.6. CONCLUSION ........................................................................................................................................ 58
4. CHAPTER FOUR ................................................................................................................................... 59
4.1. ABSTRACT ............................................................................................................................................ 59 4.2. INTRODUCTION ..................................................................................................................................... 59 4.3. MATERIALS AND METHODS ..................................................................................................................... 63 4.3.1. DATASET AND SEQUENCES ....................................................................................................................... 63 4.3.2. MEASURING THE STABILITY OF LOCAL MRNA SECONDARY STRUCTURES IN EACH GENE ......................................... 63 4.4. RESULTS .............................................................................................................................................. 64 4.4.1. SELECTION AGAINST STRONG MRNA SECONDARY STRUCTURE NEAR TIR IN E. COLI PHAGES .................................. 64 4.4.2. SELECTION AGAINST STRONG MRNA SECONDARY STRUCTURE NEAR TTR IN E. COLI PHAGES ................................. 65 4.4.3. UNIVERSAL PATTERN OF SELECTION FOR WEAK STRUCTURES AT TIR AND TTR IN OTHER PHAGES ........................... 67 4.5. DISCUSSION .......................................................................................................................................... 71 4.6. CONCLUSION ........................................................................................................................................ 73
5. CONCLUSIONS ..................................................................................................................................... 74
6. REFERENCES ........................................................................................................................................ 76
7. SUPPLEMENTAL TABLES ...................................................................................................................... 85

IX
List of Tables Table 2.1. Percentage of SD-containing genes (PSD) and mean number of consecutively matched sites
in SD-aSD matches (MSD) in Clade A phages (first eight phage species) and Clade B phages (last 16
phage species). ..................................................................................................................................... 32
Table 2.2. Secondary structure stability, measured by the minimum folding energy (MFE) for Clade
A and Clade B phages. MFE is measured at two mRNA locations: 1) 40 bases upstream of the start
codon (MFE40nt) and 2) from 4 bases upstream of the start codon to 37 bases downstream of the start
codon (MFE--4+37). ............................................................................................................................... 33
Table 3.1. Basic genome features of the Aeromonas host and their phages. ....................................... 46
Table 3.2. Aeromonas phage phiAS5 encodes tRNAs for its overused codons. ................................. 52
Table A. Genome details of CladeA and Clade B E. coli phages ........................................................ 85
Table B. Phage genome details of E. coli, M. smegmatis, S. aureus and P. aeruginosa ..................... 86

X
List of Figures
Figure 1.1. An overview of bacterial translation initiation. Picture reproduced from (Milon et al.
2012) with permission. .......................................................................................................................... 9
Figure 1.2. The standard genetic code of 64 codons. .......................................................................... 10
Figure 1.3. Bacterial translation elongation pathway. Picture reproduced from (Steitz 2008) with
permission. ........................................................................................................................................... 12
Figure 1.4. Comparison of the structures of RF1 and RF2 termination complexes. Picture reproduced
from (Korostelev et al. 2008; Laurberg et al. 2008) with permission. ................................................. 14
Figure 1.5. An overview of phage replication life cycle. Picture reproduced from (Campbell 2003)
with permission. ................................................................................................................................... 16
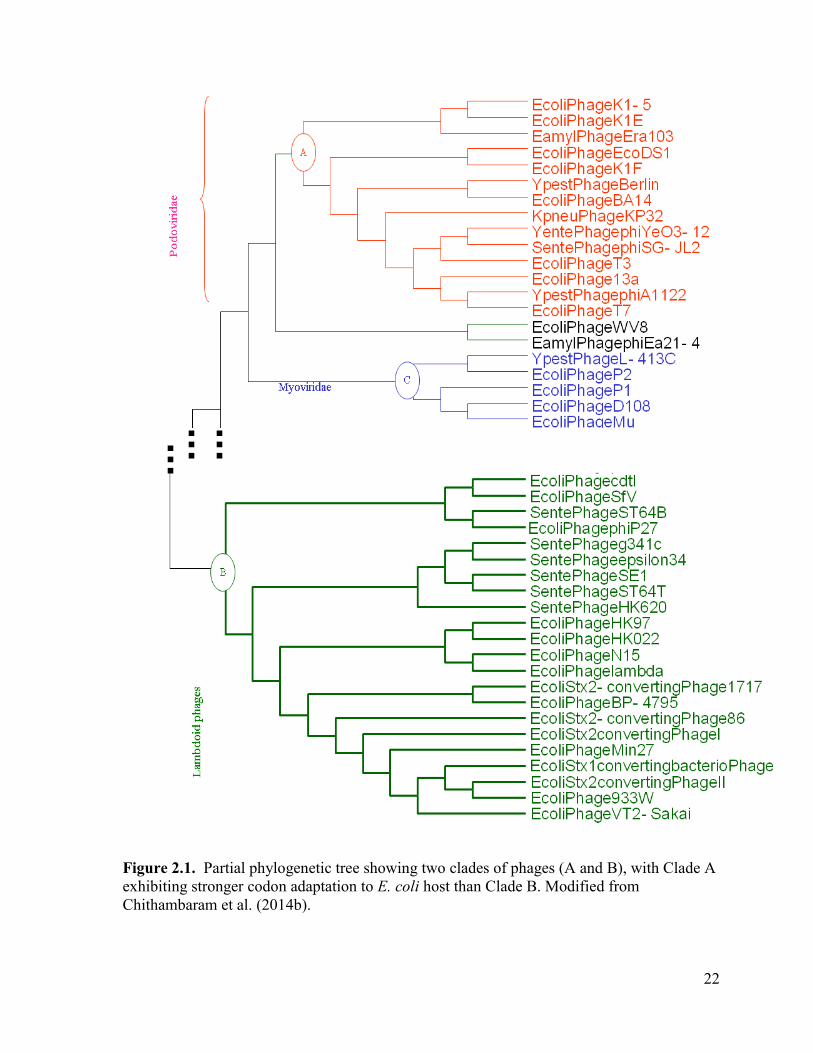
Figure 2.1. Partial phylogenetic tree showing two clades of phages (A and B), with Clade A
exhibiting stronger codon adaptation to E. coli host than Clade B. Modified from Chithambaram et al.
(2014b)................................................................................................................................................. 22
Figure 2.2. Schematic representation of Shine-Dalgarno (SD) sequence on mRNA pairing with anti-
SD (aSD) sequence on the small subunit (SSU) rRNA (a). Also drawn are the free 3' end of SSU
rRNA (b), the frequency distribution of 4577 putative matches of at least four bases between the 3'
tail of rRNA and the upstream 30 nucleotides of CDSs (c), and the number of times each nucleotide
sites at 3' tail of rRNA participated in the SD-aSD matches (d). ......................................................... 28
Figure 2.3. The effect of presence of SD measured by proportion of SD-containing genes (PSD),
increases with the strength of folding energy at 5’UTR measured by folding energy (MFE) in
analyzed E. coli phages. Positive association between SD presence (PSD) and strength of folding
energy (MFE) in analyzed E. coli phages. A) PSD versus MFE (-40 bases), B) PSD versus MFE (-4 to
+37 bases). ........................................................................................................................................... 35
Figure 2.4. The strength SD measured by matching strength of SD (MSD), increases with the strength
of folding energy at 5’UTR measured by folding energy (MFE) in analyzed E. coli phages. Positive
correlation between strength of SD (MSD) and strength of folding energy (MFE) in analyzed E. coli
phages. A) MSD versus MFE (-40 bases), B) MSD versus MFE (-4 to +37 bases). ............................... 36
Figure 3.1. Comparison of codon usage of GC-rich and GC-poor Aeromonas phages with their host.
A) RSCU plot of GC-rich dsDNA Aeromonas phage phiAS7 and its host, B) RSCU plot of GC-poor
dsDNA Aeromonas phage 65 and its host. .......................................................................................... 49
Figure 3.2. The number of phage encoded tRNA genes plotted against the difference in GC content
between the phage and its host. ........................................................................................................... 50
Figure 3.3. Relationship between Myoviridae Aeromonas phage encoded tRNAs and their overused
codons.Only NNR codons are considered for this analysis. * represents presence of tRNAs in phages
for their respective codons. Filled bars represent host codon usage and striped bars represent phage
codon usage. ........................................................................................................................................ 53
Figure 3.4. Phylogeny based comparison of tRNA gene loss and gain events in phages based on ASH.
A+
represents ancestor with tRNA genes, lineage names marked with square represents tRNA gene
loss events. ........................................................................................................................................... 56

XI
Figure 3.5. Phylogeny based comparison of tRNA gene loss and gain events in phages based on DSH.
A- represents ancestor without tRNA genes, lineage names marked with circle represents tRNA gene
gain events, lineage names marked with square represents tRNA gene loss events. .......................... 57
Figure 4.1. A) Comparison of 112 Escherichia coli phages MFE, using mRNA sliding window
analysis between TIR (-11 to 40, -1 to -30, 1 to 30 and 11 to 40 nt) and non-TIR (-21 to 50, 21 to 150
nt, window size =30 nt, step size =10 nt) windows. B) Comparison of 112 Escherichia coli phages
MFE, using mRNA sliding window analysis between TTR (71 to 100, 81 to 110 and 91 to 120 nt)
and non-TTR (1 to 70 and 121 to 150 nt, window size =30 nt, step size =10 nt) windows. ............... 66
Figure 4.2. A) Comparison of 177 Mycobacterium smegmatis phages MFE, using mRNA sliding
window analysis between TIR (-11 to 40, -1 to -30, 1 to 30 and 11 to 40 nt) and non-TIR (-21 to 50,
21 to 150 nt, window size =30 nt, step size =10 nt) windows. B) Comparison of 177 Mycobacterium
smegmatis phages MFE, using mRNA sliding window analysis between TTR (71 to 100, 81 to 110
and 91 to 120 nt) and non-TTR (1 to 70 and 121 to 150 nt, window size =30 nt, step size =10 nt)
windows. .............................................................................................................................................. 68
Figure 4.3. A) Comparison of 67 Staphylococcus aureus phages MFE, using mRNA sliding window
analysis between TIR (-11 to 40, -1 to -30, 1 to 30 and 11 to 40 nt) and non-TIR (-21 to 50, 21 to 150
nt, window size =30 nt, step size =10 nt) windows. B) Comparison of 67 Staphylococcus aureus
phages MFE, using mRNA sliding window analysis between TTR (71 to 100, 81 to 110 and 91 to
120 nt) and non-TTR (1 to 70 and 121 to 150 nt, window size =30 nt, step size =10 nt) windows. ... 69
Figure 4.4. A) Comparison of 66 Pseudomonas aeruginosa phages MFE, using mRNA sliding
window analysis between TIR (-11 to 40, -1 to -30, 1 to 30 and 11 to 40 nt) and non-TIR (-21 to 50,
21 to 150 nt, window size =30 nt, step size =10 nt) windows. B) Comparison of 66 Pseudomonas
aeruginosa phages MFE, using mRNA sliding window analysis between TTR (71 to 100, 81 to 110
and 91 to 120 nt) and non-TTR (1 to 70 and 121 to 150 nt, window size =30 nt, step size =10 nt)
windows. .............................................................................................................................................. 70
XII
List of Abbreviations
A Adenosine
C Cytosine
G Guanine
T Thymine
U Uracil
I Inosine
Y Pyrimidines (U/T and C)
R Purines (A and G)
N A, C, U/T and G
DNA Deoxyribonucleic acid
RNA Ribonucleic acid
dsDNA Double Stranded DNA
mRNA messenger RNA
rRNA ribosomal RNA
tRNA transfer RNA
aaRS aminoacyl tRNA synthetases
GTP Guanosine triphosphate
GDP Guanosine diphosphate
ATP Adenosine triphosphate
PTC Peptidyl transferase centre
HIV Human immune deficiency virus
AA or aa Amino acid
EF-G Elongation factor G
EF-Tu Elongation factor Tu
CDS Coding sequences
CF Codon frequency
HEG Highly expressed genes
LEG Lowly expressed genes
SD Shine-Dalgarno
aSD anti-SD
RBS Ribosome binding site
UTR Untranslated regions
SSU Small subunit
PSD Proportion of SD-containing genes
MSD Mean number of consecutively matched sites
NSD Number of SD-containing genes
DF Degree of freedom
TIR Translation initiation region
TTR Translation termination region
ASH Ancestor state hypothesis
DSH Derived state hypothesis

XIII
NCBI National Center for Biotechnology Information
DAMBE Data analysis in Molecular Biology and Evolution
gtRNAdb Genomic tRNA database
RSCU Relative Synonymous Codon Usage
CAI Codon Adaptation Index
tAI tRNA Adaptation Index
Nc Effective number of codons
ITE Index for translation elongation
MFE Minimum folding energy
SASS Selection against stable structure
Amino acids abbreviations:
Ala Alanine
Arg Arginine
Asn Asparagine
Asp Aspartic acid
Cys Cysteine
Gln Glutamine
Glu Glutamic acid
Gly Glycine
His Histidine
Ile Isoleucine
Leu Leucine
Lys Lysine
Met Methionine
fMet Formyl-methionine
Phe Phenylalanine
Pro Proline
Ser Serine
Thr Threonine
Trp Tryptophan
Tyr Tyrosine
Val Valine
1
1. Chapter One - Introduction
1.1. Protein synthesis
The central dogma of protein synthesis involves the transcription of DNA to messenger
RNA (mRNA) followed by the translation of mRNA to proteins. Ribosomes are the site of
protein synthesis. A prokaryotic ribosome consists of a large (50S) and small (30S) subunit.
Bacterial translation can be subdivided into the following three steps, translation initiation,
elongation and termination. The sequence of events that occur between ribosomal attachment
to the 5’untranslated region (UTR) in mRNA and the positioning of ribosome to start codon
is referred to as translation initiation. Next, the ribosomes scan down the mRNA and decode
the information present in the codons (triplets of nucleotides that contain information about
amino acid to be coded for) of mRNA. Transfer RNAs (tRNAs) are molecules responsible
for serving appropriate amino acid residues to the codons. The initiation codon AUG
(methionine) on the mRNA is decoded by formyl-methionine tRNA (tRNAfMet
). This process
continues until the ribosome encounters a stop codon which is termed as termination of
protein synthesis. The step in between translation initiation and termination is referred to as
translation elongation, since it involves the elongation of peptide chain. Details of each step
are explained below.
1.2. Components of translation initiation
1.2.1. Ribosome structure
Ribosomes are responsible for translating mRNA transcripts into polypeptide
sequences. Intact ribosome has a sedimentation coefficient of 70S which is composed of one
large 50S subunit and a small 30S subunit. Both the ribosomal subunits consist of three
2
tRNA binding sites namely, exit site for deacyl-tRNA (E), peptidyl site for peptidyl-tRNA
(P) and aminoacyl site for accepting incoming aminoacyl-tRNA (A) (Yusupov et al. 2001).
The 30S ribosomal subunit acts as a decoding centre (Schluenzen et al. 2000). During
initiation step, the 30S ribosomal subunit in combination with initiation factor IF2 and IF3
discriminates whether the initiator tRNA is positioned in the P-site and ensures that initiator
tRNA binds only with the start codon (Wu, RajBhandary 1997). Similarly, during the
elongation step, the 30S subunit assesses whether the incoming tRNA (aminoacyl-tRNA) is
cognate, near cognate or non-cognate (Ogle et al. 2001; Ramakrishnan 2002). Therefore, the
30S subunit directly monitors the translation accuracy. The 30S ribosomal subunit comprises
of 16S ribosomal RNA (rRNA) (1542 nt) and 21 ribosomal proteins named from S1 to S21.
Ribosomal proteins range from 4kDa to 61kDa in size. The 50S ribosomal subunit acts as
peptidyl transferase centre (PTC), which possesses peptidyl transferase activity and catalyzes
the polymerization of amino acids through peptide bond formation (Ban et al. 2000). The
peptide bond is formed between the nascent peptide chain of tRNA attached at P-site and the
amino acid present in the incoming tRNA at A-site. In addition during translation
termination stage, PTC in combination with class I release factors perform peptidyl-tRNA
hydrolysis, i.e., ejection of fully synthesized polypeptide chain from ribosome. The 50S
subunit is comprised of 23S rRNA (2900 nt), 5S rRNA (115 nt) and 34 ribosomal proteins
named from L1 to L34.
1.2.2. Translation initiation region
1.2.2.1. Role of Shine-Dalgarno sequence
In a majority of bacterial and bacteriophage (phage) mRNAs, the ribosomes distinguish
between normal methionine and initiator start codon (formyl-methionine) with the help of a

3
Shine-Dalgarno (SD) sequence present upstream of the start codon (Dreyfus 1988). The SD
sequence is enriched with purines and is located within the ribosome binding site (RBS). The
SD sequence hybridizes with the complementary sequence, anti-SD (aSD) located in the
3’end of 16S rRNA (Shine, Dalgarno 1974). This SD-aSD interaction helps in positioning
the start codon at the ribosomal P-site. Evidence substantiating SD-aSD interaction during
translation initiation complex formation has been documented in prokaryotes (Hui, de Boer
1987; Osada, Saito, Tomita 1999). Furthermore, the snapshot of ribosome structure
interacting with SD motif has been presented in support of SD-aSD interaction (Kaminishi
et al. 2007).
Studies carried out to understand the base pairing potential of SD-aSD duplex using
free energy approach, developed indices that measure the most energetically stable SD-aSD
interaction (Schurr, Nadir, Margalit 1993; Osada, Saito, Tomita 1999; Starmer et al. 2006) .
The base pairing potential between SD and aSD is determined by two degrees of freedom,
i.e., SD motif length and content. SD motif can base pair either partially or completely with
an aSD sequence, as a result different variations of SD are possible. Ringquist et al.,
investigated gene expression in E. coli by varying the length of its SD sequence. They
observed that eight bases SD motif UAAGGAGG approximately enables four fold higher
gene expression than the five bases SD motif AAGGA (Ringquist et al. 1992). Another
intriguing function of extended SD-aSD interaction is their role in destabilizing strong
secondary structures at translation initiation site (Olsthoorn, Zoog, van Duin 1995). In
contrast, an overly long SD-aSD duplex has been demonstrated to inhibit translation due to
the strong interaction between 30S subunit and RBS. Such a strong binding with SD prevents
the ribosome from proceeding to elongation step (Komarova et al. 2002).

4
1.2.2.2. Role of mRNA secondary structure
Each RNA secondary structure involves base pairs that require energy to shake them
apart. Single stranded mRNA sequence tends to form stem and loop secondary structures.
Strong secondary structures can mask the translation initiation signals such as SD and start
codon from ribosome. Consequently, it becomes difficult for the ribosome to recognize the
SD and start codon (de Smit, van Duin 1990). Ribosomes have to spend a lot of time and
energy in unwinding such strong secondary structures resulting in wastage of cell’s energy
and resources. Furthermore, studies have reported that stable secondary structures in 5’ UTR
decreased protein production significantly (de Smit, van Duin 1990; Osterman et al. 2013)
and they can also influence degradation of mRNA (Diwa et al. 2000). Reduced secondary
structure patterns were reported near the translational start site across different cellular
species (Kudla et al. 2009; Gu, Zhou, Wilke 2010; Tuller et al. 2010).
Measuring secondary structure stability: Different base pairs are assigned different
energy indices related to the strength of the base pair bonds. For example, C/G, A/U and G/U
pairs could be assigned values -3, -2, and -1, respectively. Folding energy (FE) is a function
of these allowed base pairs, with the simplest being the summation of these index values for
all pairs. Thus, more negative FE implies more stable secondary structure. RNA can take
many possible conformations with different FE values. MFE is the minimum FE
corresponding to the theoretically most stable secondary structure. We used MFE as a proxy
for translation initiation in our study. Tools available for measuring secondary structure
stability are Vienna RNA Package (Hofacker 2003), mfold (Zuker 2003) and UNAfold
software (Markham, Zuker 2005).

5
1.2.2.3. Role of start codon
The start codon is the very first codon of any gene and the recognition of the start
codon is crucial for efficient translation initiation. The three major codon start codons are
AUG, GUG and UUG. Based on observed codon counts AUG is the most preferred codon
followed by GUG, and UUG respectively (Ma, Campbell, Karlin 2002). Reduced pairing
strength of tRNAfMet
with other start codons has been suggested to be one of the main
reasons for the preference of AUG start codon. Empirical evidence suggests that start codon
AUG produced higher protein yield when compared to mutant strain with AUA and GUG
start codons (Hartz, McPheeters, Gold 1991). In addition, genes with AUG start codon are
reported to have a greater proportion of SD sequence when compared to those with GUG and
UUG start codons (Ma, Campbell, Karlin 2002).
1.2.2.4. Role of spacing between SD and start codon
Experimental studies have shown that optimal SD-aSD interaction occurs only when
there is a specific distance (spacers) separating the start codon and SD in prokaryotes (Hartz,
McPheeters, Gold 1991; Ringquist et al. 1992; Chen et al. 1994). This SD-aSD interaction
positions the 5’end of ribosome at the start codon of mRNA. The spacers between SD and
the start codon acts like a hinge to facilitate the start codon to form base pairing with the
tRNAfMet
located in the ribosomal P-site. The 30S complex formation is determined by three
potent factors –length of SD, SD content and length of spacers (Osterman et al. 2013). It has
been proposed that spacers are responsible for maintaining the SD site conservation in E. coli
genes (Shultzaberger et al. 2001). In addition, optimal spacer sequences have been reported
to enhance translation initiation (Barrick et al. 1994) and improve gene expression (Ma,

6
Campbell, Karlin 2002). Chen et al (Chen et al. 1994) demonstrated a method to measure the
distance between SD and the start codon from aligned mRNAs.
1.2.3. Initiator tRNA
Initiator tRNAfMet
is the tRNA that decodes the start codon of a gene. The initiator
tRNA plays a vital role in translation initiation. The sequence and structural difference
between initiator and other aminoacyl-tRNAs allows for their discrimination by the cell.
Certain unique properties of initiator tRNAs differentiate them from aminoacyl-tRNAs. They
are formylated by methionyl-tRNA transformylases to form tRNAfMet
(Dickerman et al.
1967). Second, initiator tRNA occupies the P-site of the ribosome from the start of
translation process unlike aminoacyl-tRNAs which occupy the A-site initially and then move
to the P-site with the progress of translation elongation process. Initiator tRNAs are
restrained from binding to the A-site for the following reason. First, in order to bind to A-
site, it is required that a tRNA should be able to bind well with the elongation factor (EF)-
Tu.GTP dimer. However, initiator tRNA has weak binding ability with this dimer. Initiator
tRNA is the only tRNA can bind to 30S ribosomal complex, whereas other aminoacylated
tRNAs need the intact 70S ribosomal complex.
1.2.4. Translation initiation factors
Initiation factor 1 (IF1) is the smallest of all the initiation factors in bacteria. IF1
consists of 71 amino acid (aa) residues and is encoded by infA gene. A crystal structure of
intermediate initiation complex IF1 with 30S ribosomal subunit revealed that IF1 specifically
binds to the A-site of the 30S ribosomal subunit (Carter et al. 2001). Proposed roles of IF1 is
to promote IF2 and IF3 interaction with 30S subunit (Pon, Gualerzi 1984). IF1 in

7
combination with 30S blocks the A-site from initiator tRNA and also stimulates the base
pairing of anticodon in tRNAfMet
with the start codon in mRNA at P-site (Milon et al. 2008).
Initiation factor 3 (IF3) participates in initiation and ribosome recycling. IF3 is 180aa-
long and encoded by infC gene. IF3 is responsible for preventing the two ribosomal subunits
from interacting with each other while they are not taking part in translation and thereby
supplies a pool of unbound 30S subunits for translation initiation (Karimi et al. 1999).
During translation initiation stage, IF3 acts as a fidelity factor in actively discriminating
between initiator tRNA and other aminoacylated incoming tRNAs. Consequently, it ensures
that only initiator tRNA is positioned at P-site. Then IF3 recognizes the anticodon stem of
initiator tRNA (tRNAfMet
) (Hartz et al. 1990) and monitors codon-anticodon interaction with
start codon at P-site. During ribosome recycling stage, IF3 is also referred as ribosome
disassembly factor because it has high affinity towards 30S subunit and separates the
deacylated-tRNAs from termination complex. IF3 in combination with ribosomal recycling
factor (RRF) and elongation factor G facilitates the dissociation of 70S ribosome (Hirokawa
et al. 2002).
Initiation factor 2 (IF2) belongs to the GTP binding protein family and is the largest of
all initiation factors in bacteria. infB gene encodes for IF2 protein, which is 890aa long. IF2
consists of three domains i.e., N-terminal, central domain, and a C-terminal domain. IF2’s C-
terminal domain detects the formyl-methionyl group of initiator tRNA to discriminate from
aminoacyl-tRNAs used in elongation phase (Guenneugues et al. 2000). The role of IF2 is to
stabilize tRNAfMet
binding to the 30S subunit (Milon et al. 2010). Next, when the 30S
complex comes into contact with the 50S subunit, IF2 promotes the formation of 70S
complex. IF2 catalyzes the GTP hydrolysis resulting in the ejection of all release factors

8
from 70S complex. After the completion of GTP-hydrolysis, 70S complex enters the
elongation phase and cannot revert back to initiation phase.
1.3. Translation initiation
Translation initiation is one of the major determinants of overall gene expression level
(Kudla et al. 2009). Efficiency of translational initiation rate in bacteria is determined by
local components of the mRNA present in the regions flanking the start codon (de Smit, van
Duin 1994a). The regulatory region comprising RBS, start codon and bases in the immediate
downstream of start codon is referred to as translation initiation region (TIR). TIR generally
extends 20-25 nucleotides on both the sides of the start codon (Dreyfus 1988). Bacterial
translation initiation is a multi-phase process which involves three transitional initiation
complexes (Figure 1.1). Firstly, initiation factor IF3 interacts with 30S ribosomal subunit,
which in turn promotes dissociation of the complete 70S ribosome by altering ribosomal
conformation. Consequently, IF3 supplies a pool of unbound 30S ribosomal subunits that are
available for translation initiation. Next, initiation factor IF1 binds to the A-site of 30S
ribosomal subunit in order to prevent the incoming tRNA from occupying the free A-site
(Carter et al. 2001). Then this ribosomal trimer comprising 30S subunit, IF3 and IF1 anchors
the RBS region in mRNA and positions the ribosome complex to the start codon. Ribosome
hybridization is initiated between the SD sequence in RBS and aSD region of the 16S rRNA
within the 30S subunit through complementary base pairing (Shine, Dalgarno 1974; Hui, de
Boer 1987; Ringquist et al. 1992). This SD-aSD interaction positions the start codon at P-site
of 30S subunit. Subsequently, IF2, GTP and tRNAfMet
ternary complex bind to the 30S
subunit to form 30S pre-initiation complex (30S PIC). In order to form a stable 30S initiation
complex (30S IC), the unstable 30S PIC shifts its equilibrium to favour the interaction of

9
tRNA anticodon and the start codon in mRNA (Laursen et al. 2005). With the exception of
initiator tRNA, the recruitment of all other tRNAs to mRNA requires the assembly of both
the ribosomal subunits to form the complete ribosome. Therefore, the 50S subunit binds to
the 30S IC which leads to the formation of a third initiation complex, the 70S initiation
complex (70S IC). The 30S IC and 50S subunit interaction, following the formation of 70S
IC leads to the hydrolysis of GTP catalyzed by IF2 which promotes the expulsion of IF1, IF2
and IF3 from the intact 70S IC. The formation of 70S IC is the main determinant of overall
translation efficiency of a gene (Laursen et al. 2005) and this marks the completion of
initiation stage.
Figure 1.1. An overview of bacterial translation initiation. Picture reproduced from (Milon et
al. 2012) with permission.

10
1.4. Genetic code
The genetic code is degenerate. This means an amino acid can be coded for by more
than one codon. Such codons which code for the same amino acid are termed as synonymous
codons. The standard genetic code consists of 64 codons. Among these, 61 are sense codons
and the remaining three are stop codons. AUG is the main start codon and the three stop
codons include UAA, UAG and UGA. With the exception of methionine and tryptophan all
other amino acids can be coded by more than one codon. Codons are grouped into codon
families based on the number of synonymous codons they contain. There are five possible
codon families in the standard genetic code. They are single, two-fold, three-fold, four-fold
and six-fold codon families (Figure 1.2 shows the various codon families). One or more
codons are much more likely to be preferentially overused when compared to others in a
codon family. Such a preference for certain synonymous codon over other is known as codon
usage bias.
Figure 1.2. The standard genetic code of 64 codons.
11
Codon usage bias might be a result of either a strong mutational bias or tRNA
mediated-selection. For instance a strongly A-biased genome may tend to overuse A-ending
codons. Another reason for codon usage bias is tRNA mediated-selection ie., codons that
have maximum tRNAs available in the tRNA pool to decode them are preferentially selected
over the rest of the synonymous codons.
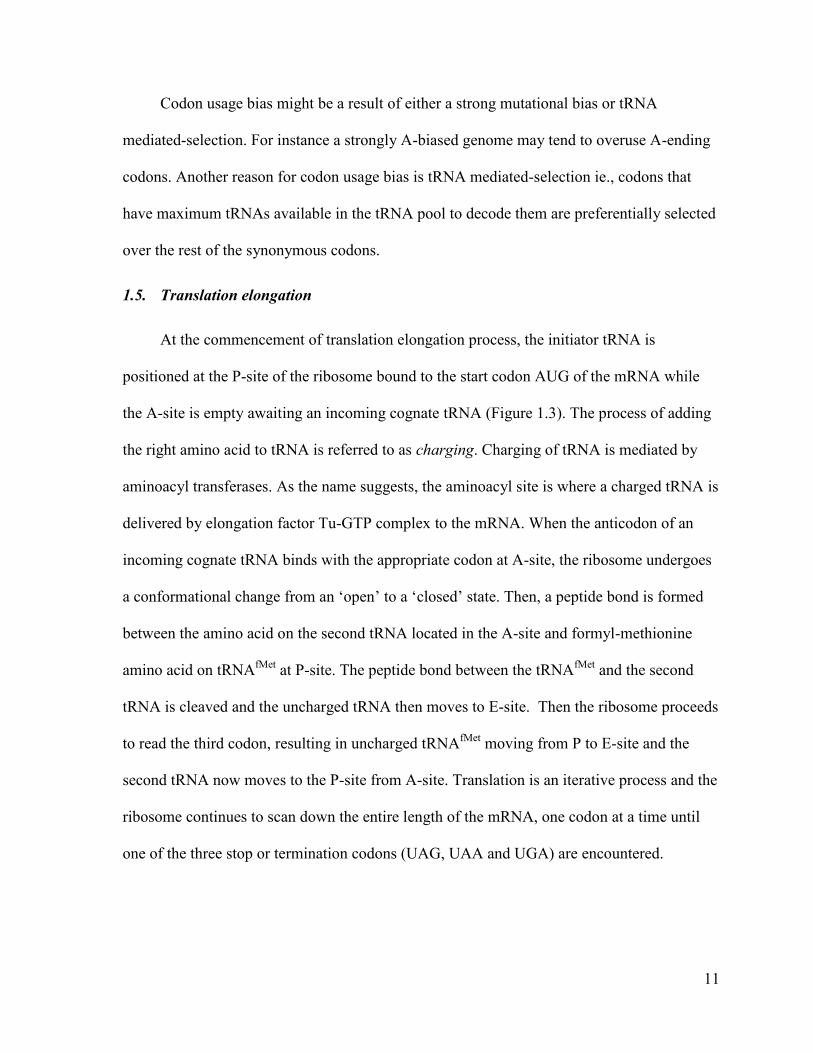
1.5. Translation elongation
At the commencement of translation elongation process, the initiator tRNA is
positioned at the P-site of the ribosome bound to the start codon AUG of the mRNA while
the A-site is empty awaiting an incoming cognate tRNA (Figure 1.3). The process of adding
the right amino acid to tRNA is referred to as charging. Charging of tRNA is mediated by
aminoacyl transferases. As the name suggests, the aminoacyl site is where a charged tRNA is
delivered by elongation factor Tu-GTP complex to the mRNA. When the anticodon of an
incoming cognate tRNA binds with the appropriate codon at A-site, the ribosome undergoes
a conformational change from an ‘open’ to a ‘closed’ state. Then, a peptide bond is formed
between the amino acid on the second tRNA located in the A-site and formyl-methionine
amino acid on tRNAfMet
at P-site. The peptide bond between the tRNAfMet
and the second
tRNA is cleaved and the uncharged tRNA then moves to E-site. Then the ribosome proceeds
to read the third codon, resulting in uncharged tRNAfMet
moving from P to E-site and the
second tRNA now moves to the P-site from A-site. Translation is an iterative process and the
ribosome continues to scan down the entire length of the mRNA, one codon at a time until
one of the three stop or termination codons (UAG, UAA and UGA) are encountered.

12
Figure 1.3. Bacterial translation elongation pathway. Picture reproduced from (Steitz 2008)
with permission.
1.6. Translation termination
Termination of protein synthesis begins when the A-site of the 30S ribosomal subunit
encounters any one of the stop codons. This signals the class-I release factors to bind to the
ribosome, instead of a tRNA resulting in its interaction with the stop codon. This interaction
stimulates the release of synthesized polypeptide chain. In bacteria, all signals required for
the termination process are present in three different stop codons UAA, UGA and UAG and
are decoded by two class-I release factors, RF1 and RF2 (Figure 1.4 B and A). In E. coli,
RF1 and RF2 are encoded by the prfA and prfB genes respectively; they share homologous
sequences and their 3D structures are also similar, hence they are grouped under class-I
release factors. RF1 uniquely catalyzes termination at UAG stop codon, RF2 catalyzes at
UGA stop codon but UAA stop codon is recognized by both the release factors RF1 and RF2
13
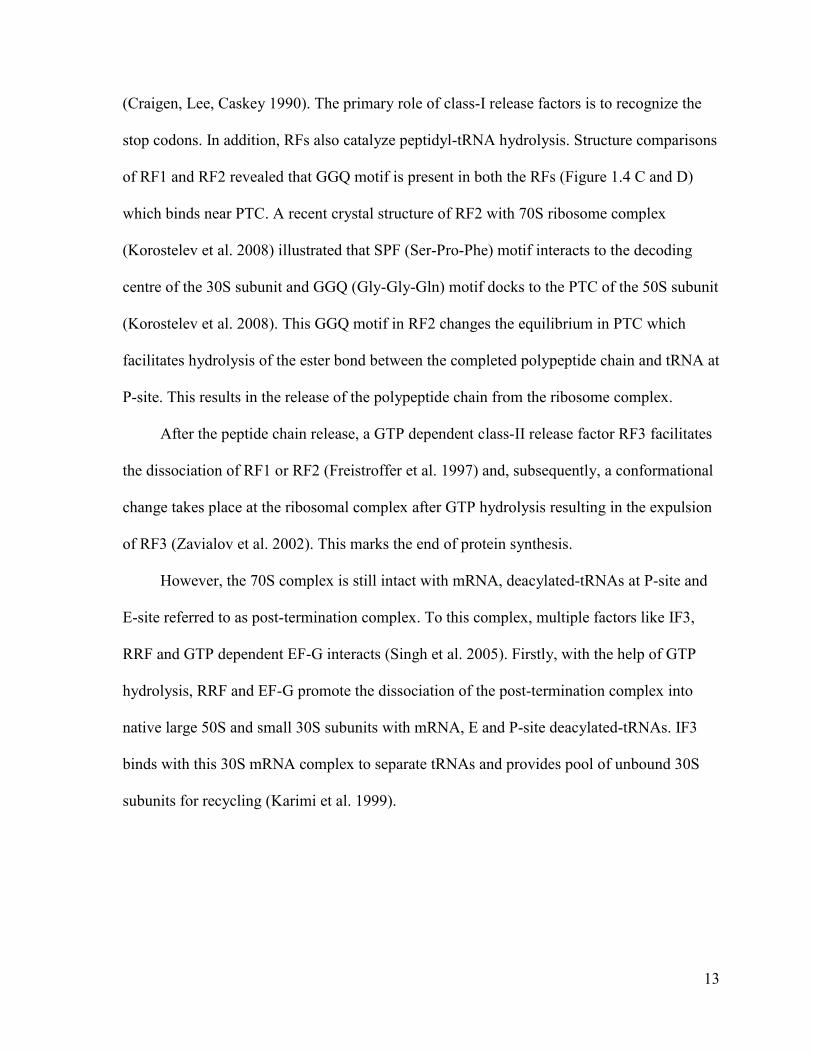
(Craigen, Lee, Caskey 1990). The primary role of class-I release factors is to recognize the
stop codons. In addition, RFs also catalyze peptidyl-tRNA hydrolysis. Structure comparisons
of RF1 and RF2 revealed that GGQ motif is present in both the RFs (Figure 1.4 C and D)
which binds near PTC. A recent crystal structure of RF2 with 70S ribosome complex
(Korostelev et al. 2008) illustrated that SPF (Ser-Pro-Phe) motif interacts to the decoding
centre of the 30S subunit and GGQ (Gly-Gly-Gln) motif docks to the PTC of the 50S subunit
(Korostelev et al. 2008). This GGQ motif in RF2 changes the equilibrium in PTC which
facilitates hydrolysis of the ester bond between the completed polypeptide chain and tRNA at
P-site. This results in the release of the polypeptide chain from the ribosome complex.
After the peptide chain release, a GTP dependent class-II release factor RF3 facilitates
the dissociation of RF1 or RF2 (Freistroffer et al. 1997) and, subsequently, a conformational
change takes place at the ribosomal complex after GTP hydrolysis resulting in the expulsion
of RF3 (Zavialov et al. 2002). This marks the end of protein synthesis.
However, the 70S complex is still intact with mRNA, deacylated-tRNAs at P-site and
E-site referred to as post-termination complex. To this complex, multiple factors like IF3,
RRF and GTP dependent EF-G interacts (Singh et al. 2005). Firstly, with the help of GTP
hydrolysis, RRF and EF-G promote the dissociation of the post-termination complex into
native large 50S and small 30S subunits with mRNA, E and P-site deacylated-tRNAs. IF3
binds with this 30S mRNA complex to separate tRNAs and provides pool of unbound 30S
subunits for recycling (Karimi et al. 1999).

14
Figure 1.4. Comparison of the structures of RF1 and RF2 termination complexes. Picture
reproduced from (Korostelev et al. 2008; Laurberg et al. 2008) with permission.
1.7. Phage replication lifecycle
Phages are natural obligate parasites of bacteria. Phages do not possess an inherent
translation apparatus; hence they depend on their host’s translational machinery for
replication. There are two paths in phage replication, namely lytic and lysogenic replication
pathways (Figure 1.5). In the lytic phage, synthesis of phage particles takes place within the
host without integration of phage DNA with host DNA. It results in the host cell death.
However in the lysogenic pathway the phage integrates its DNA with host DNA and it is
simultaneously replicated along with host DNA. Unlike lytic lifecycle, lysogeny does not
result in death of the host cell. The lytic phage replication life cycle consists of the following
five major steps.

15
1.7.1. Adsorption
This is the very first step of phage replication life cycle where the phage comes into
contact with its bacterial host. The phage attaches to the bacterial cell wall with the help of
its tail fibers. The phage tail fiber is very specific to its host cell’s receptor. The specificity of
the phages to their host is attributed to their tail fibers.
1.7.2. Penetration
Following phage attachment to the bacterial cell wall, the phage sheath contraction for
irreversible binding takes place. Next, the phage injects its DNA from the phage head into
the bacterial cell through a hollow tail fiber. Thus, only the phage DNA enters the bacterial
cell while the rest of phage particles remains outside of the bacterium. At this stage the phage
can chose to enter either a lytic or lysogenic path depending on the lifestyle of the phage.
1.7.3. Transcription and replication of phage proteins
Phages hi-jack their bacterial host’s translational machinery and directs the synthesis of
their proteins and mRNA using bacterial ribosomes, tRNAs, initiation, elongation and
termination factors. Two sets of phage proteins known as early and late proteins are
produced. Early proteins are the one that are synthesized first, and are crucial for phage
replication. Late proteins are the ones that are synthesized in the later part of the phage
lifecycle. Late proteins mainly include structural proteins such as coat and tail.
1.7.4. Assembly of proteins into phage protein shell
Once the replication of phage proteins reaches completion, phage DNA is packaged
into the head and tail particles are assembled with the head to form complete phage particles.
Simultaneously, a late protein lysozyme is synthesized and added to the tail of phages.

16
1.7.5. Release of fully assembled phage particles
Phage lysozyme helps in breaking or lysing the peptidoglycan layer of the bacterial cell
wall. This facilitates the release of mature phage particles out of the bacterial cell.
Figure 1.5. An overview of phage replication life cycle. Picture reproduced from (Campbell
2003) with permission.
1.8. Phage codon-anticodon adaptation
Use of optimal codons (codons having abundant cognate tRNAs) speeds up cognate
tRNA recruitment to translation site while the use of rare codons stalls translation process. In
corroboration, there exists a positive correlation between codon usage and tRNA levels
(Ikemura 1981b). Synonymous codon usage can interfere with free ribosome movement
(Zhang, Goldman, Zubay 1994) and cause ribosomal pausing during translation of rare
codons. Thus, use of appropriate synonymous codons with respect to the tRNA availability
of the cell can influence phage gene expression by altering translation elongation efficiency.
It is advantageous for phages to have a synonymous codon usage choice concordant with the
17
bacteria, as this would expedite the time consuming and expensive translation process. It is
for this reason that phage species exhibit codon adaptation to their host translation machinery
(Sharp, Rogers, McConnell 1984; Carbone 2008). Viruses usually mimic the genomic
content of their host mRNAs, in order to escape from the host defence mechanism
(Greenbaum et al. 2008) and improve translation of their proteins (Lucks et al. 2008).
Mutation (Xia 2005b; van Weringh et al. 2011) and selection (Sharp, Rogers, McConnell
1984) are the universal factors shaping synonymous codon usage. Recent studies have
illustrated the joint effect of mutation and selection pressure on codon usage (Palidwor,
Perkins, Xia 2010; Chithambaram, Prabhakaran, Xia 2014b; Chithambaram, Prabhakaran,
Xia 2014a). Moreover, virus-encoded tRNAs, render viruses less dependent on their host
tRNA pool (Limor-Waisberg et al. 2011; van Weringh et al. 2011; Prabhakaran,
Chithambaram, Xia 2014). Translation elongation efficiency is measured using following
indices Fop (Ikemura 1981b), CBI (Bennetzen, Hall 1982), CAI (Sharp, Li 1987; Xia 2007),
Nc (Wright 1990; Sun, Yang, Xia 2013), tAI (dos Reis, Savva, Wernisch 2004) and ITE (Xia
2014).
1.9. Significance of the study
Current antibiotic treatment methods suffer from bacterium acquiring resistance.
Therefore there is a pressing need for switching to alternate treatment approaches. Phages
could be potential candidates in overcoming the above mentioned predicaments (Burrowes et
al. 2011; J. Oliveira 2012). The lytic ability of phages can be exploited to control bacterial
infections. Application of phages in therapy against bacterial infections demands mass
production of such clinically important phages. Understanding the key elements dictating
phage translation efficiency is fundamental to synthesizing large phage libraries of
18
therapeutically desirable phages (Skiena 2001). In order to reengineer more efficient phages
for their prospective biopharmaceutical applications (e.g. for tuberculosis disease
(Danelishvili, Young, Bermudez 2006) , Staphylococcus infections (Abedon et al. 2011) and
Pseudomonas infections (McVay, Velasquez, Fralick 2007)), we need to gain clear insights
about factors affecting phage translation fidelity and efficiency. Our findings imply that
selection for translation elongation efficiency depends on translation initiation efficiency.
This suggests that tuning of translation initiation in combination with optimized codon usage
(efficient elongation) could maximize overall translation output by many folds.
19
2. Chapter Two
E. coli phages: Differential translation initiation efficiency results
in differential codon adaptation
2.1. Abstract
Rapid biosynthesis is key to the success of bacteria and viruses. Highly expressed
genes in bacteria exhibit strong codon usage bias corresponding to the differential
availability of tRNA species. However, a large clade of E. coli lambdoid phages exhibit
relatively poor codon adaptation to the host translation machinery, especially in Y-ending
codons, in contrast to other E. coli phages that exhibit strong codon adaptation to the host.
Three possible explanations were previously proposed but dismissed based on empirical
ground: 1) the phage genome-encoded tRNA genes that reduce the dependence of the phage
mRNA on host tRNA pool, 2) lack of time needed for evolving codon adaptation due to
recent host switching, and 3) strong strand asymmetry associated with biased mutation
disrupting codon adaptation. Here we examine the possibility that phages with relatively
poor codon adaptation have poor translation initiation which would weaken the selection on
translation elongation and codon adaptation. We measure translation initiation by: 1) the
strength and position of the SD sequence and (2) stability of secondary structure of
sequences flanking the start codon known to affect accessibility of the start codon. Phage
genes with strong codon adaptation have significantly stronger SD sequences than those with
poor codon adaptation. The former also have significantly weaker secondary structure in
sequences flanking the start codon than those in the latter. These results explain why
lambdoid phages do not exhibit strong codon adaptation because they have relatively
inefficient translation initiation and would benefit little from increased elongation efficiency.

20
2.2. Contribution
The data, results and interpretations in this chapter were published in Journal of
General Virology. Ramanandan Prabhakaran (RP) is the first author, Shivapriya
Chithambaram (SC) is the co-author and Dr Xuhua Xia (XX) is the corresponding author.
This work was the result of a collaborative project between me and members of the Xia lab:
SC and XX. The development of the hypotheses, data analyses and interpretations resulted
from discussions among RP, SC and XX.
This research work has also been presented as a poster work at SMBE conference at
2014.
2.3. Introduction
Bacterial species and viruses need to replicate themselves rapidly in order to compete
successfully against others. Translation is a key limiting factor in biosynthesis and microbial
species typically evolve features to improve translation efficiency. Codon usage in E. coli,
Salmonella typhimurium and Saccharomys cerevisiae depends strongly on the availability of
their cognizant tRNA species (Ikemura 1981a; Ikemura 1981b; Ikemura 1982; Ikemura
1992; Xia 1998), especially in highly expressed genes (Comeron, Aguade 1998; Duret,
Mouchiroud 1999; Coghlan, Wolfe 2000; Xia 2007). Similarly, codon usage in phages is
strongly shaped by the tRNA pool of their host (Chithambaram, Prabhakaran, Xia 2014b;
Chithambaram, Prabhakaran, Xia 2014a). Experimental modification to improve or disrupt
codon adaptation generally leads to predictable change in protein production rate (Robinson
et al. 1984; Sorensen, Kurland, Pedersen 1989; Haas, Park, Seed 1996; Ngumbela et al.
2008). In fact, gene-specific codon usage indices (Sharp, Li 1987; Wright 1990; Xia 2007;

21
Sun, Yang, Xia 2013) are excellent predictors of translation efficiency (Coghlan, Wolfe
2000).
In this context, it is puzzling that a large cluster of 16 E. coli lambdoid phages (Clade
B in Figure 2.1), consisting of 10 siphophages, four podophages and two myophages,
exhibit poor codon adaptation in Y-ending codons in their protein-coding genes whereas
eight E. coli podophages in Clade A (Figure 2.1) uniformly exhibit strong codon adaptation
(Chithambaram, Prabhakaran, Xia 2014b). The same pattern remains if one measures codon
adaptation by using CAI (Sharp, Li 1987) and its improved version (Xia 2007) when E. coli
highly expressed genes are used as a reference set, or by the index of translation elongation
(ITE) that takes into account the effect of background mutation bias (Xia 2014). Thus, genes
in the Clade B phages have significantly weaker codon adaptation than those in Clade A
phages.
Three possible explanations for poor codon adaptation in Clade B phages to the host
tRNA pool have been proposed but dismissed on the basis of empirical evidence
(Chithambaram, Prabhakaran, Xia 2014b; Chithambaram, Prabhakaran, Xia 2014a). The first
invokes the differential presence of phage genome-encoded tRNA genes which vary from 0
to 20 in different E. coli phages (Chithambaram, Prabhakaran, Xia 2014a). A large number
of phage-encoded tRNA genes would reduce the dependence of phage codon decoding on
host tRNAs and allow the phage codon usage to deviate from host codon usage
(Prabhakaran, Chithambaram, Xia 2014). Indeed, the degree of codon adaptation decreases
with increasing number of phage-encoded tRNA genes (Chithambaram, Prabhakaran, Xia
2014a). It has also been reported that selective enrichment of host tRNA by HIV-1 can also
decrease the likelihood of the virus acquiring a codon usage similar to the host (van Weringh
et al. 2011).
22
Figure 2.1. Partial phylogenetic tree showing two clades of phages (A and B), with Clade A
exhibiting stronger codon adaptation to E. coli host than Clade B. Modified from
Chithambaram et al. (2014b).

23
However, the difference in phage-encoded tRNA genes is minimal between the two
clades in Figure 2.1. Five Clade B phages (Enterobacteria phages 933W, Min27, VT2-Sakai,
Stx2 converting phages II and 86) have three phage-encoded tRNA genes, and one Clade B
phage (Enterobacteria phage phiP27) has two phage-encoded tRNA genes. All other Clade B
phages, as well as all Clade A phages, do not have phage-encoded tRNA genes. Those six
Clade B phages carrying two or three tRNA genes do not have codon adaptation worse than
other Clade B phages. Some of these phage-encoded tRNA genes are associated with long
branches in phylogenetic analysis with E. coli tRNA genes. If E. coli tRNAs are adapted to
the E. coli translation machinery, then some of these phage-encoded tRNA species, being
deviant from E. coli counterparts, are probably not even functional.
The second explanation attributes poor codon adaptation to lack of evolutionary time if
phages have recently switched hosts. However, this explanation also is inapplicable to the
differential codon adaptation between Clade A and Clade B phages because both have
diverse lineages parasitizing E. coli and should have evolved in the E. coli host for a long
time.
The third explanation invokes strand asymmetry and associated mutation bias often
observed in circular microbial and mitochondrial genomes (Marin, Xia 2008; Xia 2012a; Xia
2012c). Highly expressed E. coli genes prefer CCU over CCC codons, and UUC over UUU
codons. However, phage CCY codons are mainly found in C-rich segments of the phage
genome with over-represented CCC codons that is not preferred by E. coli highly expressed
genes. Similarly, UUY codons are mainly found in T-rich genomic segments of the phage
genome with over-represented UUU codons that are not preferred by E. coli highly
expressed genes. However, while this explanation works well for single-stranded DNA
phages (Chithambaram, Prabhakaran, Xia 2014b), it does not seem sufficient to explain the

24
poor codon adaptation in the double-stranded DNA phages in Clade B relative to those in
Clade A.
Here we propose a hypothesis invoking differential translation initiation between the
two clades of phages, based on recent recognition that codon adaptation depends on
translation initiation efficiency (Xia et al. 2007; Supek, Smuc 2010; Tuller et al. 2010; Xia
2014). If translation initiation is highly efficient, then translation elongation will become
rate-limiting and the selection for increasing translation efficiency will drive codon
adaptation. If translation initiation is not efficient, then the selection for increasing
translation efficiency will not reach codon usage because elongation is not rate-limiting.
Thus, if translation initiation is more efficient in Clade A phages than in Clade B phages,
then the selection for translation elongation efficiency will be stronger on Clade A phages
than on Clade B phages, leading to differential codon adaptation.
To test the hypothesis that Clade A and Clade B phages have different translation
initiation efficiency, we need to measure translation initiation efficiency. In bacterial species,
translation initiation efficiency depends strongly on three factors, 1) nature of the start codon
(Hartz, McPheeters, Gold 1991; Ringquist et al. 1992; O'Donnell, Janssen 2001; Ma,
Campbell, Karlin 2002; Osterman et al. 2013), 2) base pairing potential and position of SD
sequence (Shine, Dalgarno 1974; Hui, de Boer 1987; de Smit, van Duin 1994b; Olsthoorn,
Zoog, van Duin 1995; Osterman et al. 2013), and 3) stability of secondary structure of
sequences flanking the start codon (de Smit, van Duin 1990; de Smit, van Duin 1994b;
Nivinskas et al. 1999; Milon et al. 2012; Milon, Rodnina 2012; Osterman et al. 2013), with
higher translation initiation generally associated with weaker secondary structure. Double-
stranded DNA phages are known to have reduced secondary structure near the start codon
(Zhou, Wilke 2011).

25
Pairing between SD sequence and anti-SD (aSD) sequence on the small ribosomal
rRNA is important for start codon localization (Hui, de Boer 1987; Vimberg et al. 2007),
although such pairing is not always essential in translating E. coli messages (Melancon et al.
1990; Fargo et al. 1998) or in Chlamydomonas reinhardtii chloroplasts (Fargo et al. 1998).
Some leaderless genes with an AUG start codon can be translated efficiently in E. coli
(O'Donnell, Janssen 2002; Krishnan, Van Etten, Janssen 2010; Vesper et al. 2011; Giliberti
et al. 2012) or in the halophilic archaeon Halobacterium salinarum (Sartorius-Neef, Pfeifer
2004). However, translation initiation of most E. coli genes appear to benefit from a well-
positioned SD sequence, especially genes that follow the first gene in a multigene operon
(Osterman et al. 2013). In general, the effects of SD and the stability of secondary structure
flanking the start codon have become so well established that they serve as key design
principles for computational tools optimizing translation initiation, such as RBSdesigner (Na,
Lee 2010), RBScalculator (Salis 2011) and UTRdesigner (Seo et al. 2013). Because protein-
coding genes in both Clade A phages and Clade B phages use AUG as the start codon, we
tested the difference in the second and third factors between the two groups of phages. We
predict that Clade A phage genes have stronger well-positioned SD sequences than those in
Clade B phages and that Clade A phage genes also have weaker secondary structure in
sequences flanking the start codon than those in Clade B phages. These predictions are
strongly supported from our empirical analysis of host and phage genomic sequences.
2.4. Materials and Methods
2.4.1. Genomic Data
The genomes of E. coli and its 24 phages shown in Figure 2.1 were retrieved from
GenBank, including eight Clade A phages and 16 Cluster B. Coding sequences (CDSs) were

26
extracted and their codon usage analyzed by using DAMBE (Xia 2013b). Only CDSs with at
least 33 codons were included to alleviate stochastic fluctuations of codon usage. All E. coli
phage genomes were scanned for tRNAs by using tRNAscan-SE Search Server (Schattner,
Brooks, Lowe 2005). Phage data compilation consisting of Clade, phage family, phage name,
phage accession, phage genome length, number of CDSs in each phage genome, Index of
translation elongation (ITE) number of tRNA genes encoded in each phage genome are
included in Supplemental Table A. We also extracted 30 nucleotides (nt) upstream of the
start codon (Upstream30) from each gene in phage and host genomes, and the last 20 nt of
the E. coli small subunit rRNA by using DAMBE (Xia 2013b).
2.4.2. Identification of SD sequences
As we show below, it is not appropriate to define SD simply as an AGGAGG motif
within a fixed distance range upstream of the start codon. The SD sequence on the mRNA
and the aSD sequence on the small subunit (SSU) rRNA pair to position the anticodon of the
initiation tRNA at the start codon (Figure 2.2a). The optimal location of SD in literature is
often measured by the distance from SD to the start codon (e.g., D1 and D2 in Figure 2.2a) or
from the middle of SD to the start codon (Osterman et al. 2013). However, this approach is
probably incorrect as illustrated in Figure 2.2a. Both SD1 and SD2 position the tRNA
anticodon properly at the start codon AUG, but their associated D1 and D2 are different
(Figure 2.2a). A correct distance measure should take into consideration the relative position
of both mRNA and the rRNA 3’ tail. One such distance is the distance from the end of the
SSU rRNA to the beginning of the start codon (DtoAUG, Figure 2.2a).
Based on the E. coli SSU rRNA secondary structure (Woese et al. 1980; Yassin,
Fredrick, Mankin 2005), there are 13 nt at the 3’ end of the rRNA (referred to as rRNA 3’

27
Tail hereafter) that are free to base-pair with SD (Figure 2.2b). We searched each
Upstream30 sequence against the rRNA 3’ Tail for matches with a length of at least 4
consecutive bases. The frequency distribution of DtoAUG from 4577 such matches peaks at
DtoAUG = 13, and decreases rapidly towards DtoAUG = 10 and DtoAUG = 20 (Figure 2.2c). We
thus operationally define an SD as a sequence four bases or longer that can pair with the
rRNA 3’ Tail leading to a DtoAUG within the range of 10-20. Note that an SD such as
AGGAGG would need a space of five bases between the end of SD and the beginning of
start codon in order to have a DtoAUG = 13. An SD such as AGGAG would need to have six
bases between the end of SD and the beginning of start codon in order to have a DtoAUG = 13.
Although the rRNA 3’ Tail has 13 bases free (Figure 2.2b), the sites that are involved
in SD-aSD base pairing belong mainly to the first six sites (Figure 2.2d). However, 754
putative SDs (including 156 GUGA, 166 GAGGU, 169 AGGU, and 263 UGAU) in
Upstream30 in E. coli genes involve the second A from the 3’ end of SSU rRNA. This is
consistent with the experimental observation that mutations at that site is are moderately
deleterious (Yassin, Fredrick, Mankin 2005).
We computed two indices for each phage: 1) percentage of SD-containing genes (PSD)
and 2) mean number of consecutively matched sites (MSD). Previous studies have shown that
highly expressed E. coli genes are more likely to have an SD than lowly expressed genes
(Ma, Campbell, Karlin 2002) and that MSD is important for gene expression (Osterman et al.
2013).

28
0
100
200
300
400
500
600
700
800
0 10 20 30 40
Nu
mb
er o
f S
D-a
SD
pa
irs
DtoAUG
0
100
200
300
400
500
600
700
A U U C C U C C A C U A G
Nu
mb
er o
f h
its
3' tail of SSU rRNA
aSD: pyrimidine-rich
SD1 A U G
DtoAUG
mRNA
ssu Ribosome
SD2
D1
D2
(a)
(b)
(c)
(d)
Figure 2.2. Schematic representation of Shine-Dalgarno (SD) sequence on mRNA pairing
with anti-SD (aSD) sequence on the small subunit (SSU) rRNA (a). Also drawn are the free
3' end of SSU rRNA (b), the frequency distribution of 4577 putative matches of at least four
bases between the 3' tail of rRNA and the upstream 30 nucleotides of CDSs (c), and the
number of times each nucleotide sites at 3' tail of rRNA participated in the SD-aSD matches
(d).

29
2.4.3. Measuring stability of local mRNA secondary structure
The stability of local secondary structure formed in mRNA is generally measured by
minimum folding energy (MFE) expressed in KJ/mol. The more negative the MFE value, the
greater is the stability of secondary structure. We computed MFE using DAMBE which
implements the functionality of Vienna RNA package (Hofacker 2003). The settings used
are: folding temperature as 37◦C, with no lonely pairs and with no G/U pairs at the end of
helices. Changing these settings does not affect the relative magnitude of MFE.
Translation initiation depends heavily on the secondary structure of sequences
flanking the start codon (de Smit, van Duin 1990; de Smit, van Duin 1994b; Nivinskas et al.
1999; Xia, Holcik 2009; Xia et al. 2011). Burying either the SD sequence or the start codon
in a stable secondary structure would affect its accessibility and decreases protein production
dramatically in E. coli (Osterman et al. 2013). For this reason we measured the stability of
secondary structure for two associated regions: 1) 40 bases upstream of start codon where the
presence of a hairpin strongly inhibits translation (Osterman et al. 2013), and 2) sites -4 to
+37 which has been previously studied and considered as a key contributor to translation
initiation (Kudla et al. 2009; Osterman et al. 2013; Xia 2014). MFE for the two regions are
designated as MFE40nt and MFE-4+37, respectively. The two regions are related, respectively,
to the accessibility of the SD sequence and the start codon.
2.5. Results
Our objective is to explain why Clade A phages exhibit better codon adaptation to the
E. coli host than Clade B phages, and our hypothesis is that translation initiation is more
efficient in the former than the latter so that codon adaptation would increase protein
production rate more in the former than in the latter. Our specific predictions are that 1) PSD

30
(proportion of SD-containing genes) is higher in Clade A phages than in Clade B phages, 2)
MSD (length of SD-aSD pairing) should be closer to the optimal in Clade A phages than in
Clade B phages, with the optimal SD length being six (Schurr, Nadir, Margalit 1993;
Komarova et al. 2002; Vimberg et al. 2007), and 3) MFE40nt (minimum folding energy in 40
nt upstream of the start codon) and MFE-4+37 (MFE at sites from 4 sites upstream of the start
codon to 37 sites downstream of the start codon) are less negative in sequences flanking the
start codon in Clade A phages than in Clade B phages.
2.5.1. Comparison of SD features between Clade A and Clade B phages
PSD is highly significantly higher in the eight Clade A phages (mean PSD = 94.20%)
than in the 16 Clade B phages (mean PSD = 68.27%) as we have predicted (Table 2.1, t-test
assuming unequal variances: t = 10.9900, DF = 21, p < 0.0001, two-tailed test). We used the
t-test with unequal variances because the two variances are significantly different from each
other according to an F-test (F = 8.2400, DFnumerator = 15, DFdenominator = 7, p = 0.0045).
However, a regular t-test assuming equal variance also strongly reject the null hypothesis of
equal PSD between Clade A and Clade B phages (t = 8.3340, DF = 22, p < 0.0001, two-tailed
test).
MSD is smaller than the optimal 6 (Schurr, Nadir, Margalit 1993; Vimberg et al. 2007)
for both Clade A and Clade B phages, which simplifies our statistical analysis. That is, we
only need to test whether MSD is significantly greater in Clade A phages than in Clade B
phages which is equivalent to testing which mean MSD is closer to the optimal MSD. The
mean MSD is greater for the eight Clade A phages (= 5.8930) than the 16 Clade B phages (=
5.0190), the difference being statistically highly significant (t-test assuming equal variance, t
= 12.5160, DF = 22, p < 0.0001, two-tailed test). The variance in MSD is nearly identical

31
between the two groups. In short, both PSD and MSD support our hypothesis that translation
initiation is more efficient in Clade A phages than in Clade B phages.
2.5.2. Comparison of secondary structure stability between Clade A and Clade B phages
Secondary structure formed of the 40 bases upstream of the start codon may bury the
SD sequence and consequently interfere with the SD-aSD pairing. Our hypothesis predicts
that Clade A phages have weaker secondary structure (less negative MFE40nt) than Clade B
phages. The empirical evidence strongly supported this prediction (Table 2.2), with MFE40nt
significantly weaker in Clade A phages (mean MFE40nt = -5.1770) than in Clade B phages
(mean MFE40nt = -6.4610, t= 6.7879, DF = 22, p < 0.0001, two-tailed test).
Secondary structure formed around the start codon may interfere with the accessibility
of the start codon which is crucially important for translation initiation in bacterial species
(Nakamoto 2006). Our hypothesis predicts that Clade A phages should have less negative
MFE-4+37 (weaker secondary structure) at this region than Clade B phages, which is again
supported by empirical evidence (Table 2.2). The mean MFE-4+37 is -4.7690 for the eight
Clade A phages and -5.7760 for the 16 Clade B phages, the difference being statistically
significant: t = 3.4170, DF = 22, p = 0.0025, two-tailed test). Thus, the differences in
secondary structure stability between Clade A and Clade B phages are also consistent with
the interpretation that genes in Clade A phages have more efficient translation initiation than
those in Clade B phages.

32
Table 2.1. Percentage of SD-containing genes (PSD) and mean number of consecutively
matched sites in SD-aSD matches (MSD) in Clade A phages (first eight phage species) and
Clade B phages (last 16 phage species).
Phage Accession NCDS PSD MSD
T7 NC_001604 60 96.67 5.879
T3 NC_003298 55 90.91 6.020
K1F NC_007456 43 88.37 5.921
K1E NC_007637 62 95.16 5.763
K1-5 NC_008152 52 96.15 5.600
BA14 NC_011040 52 94.23 5.878
EcoDS1 NC_011042 53 94.34 6.140
13 a NC_011045 55 96.36 5.943
VT2-Sakai NC_000902 83 62.65 5.000
933W NC_000924 80 70.00 5.036
Lambda NC_001416 73 69.86 4.922
N15 NC_001901 60 80.00 5.000
HK022 NC_002166 57 56.14 4.875
HK97 NC_002167 61 68.85 5.024
phiP27 NC_003356 58 67.24 5.359
SFV NC_003444 53 69.81 4.676
STX2-I NC_003525 166 47.59 4.873
BP-4795 NC_004813 85 63.53 5.019
STX1-Phage NC_004913 84 80.95 5.162
STX2-II NC_004914 89 75.28 5.239
STX2-86 NC_008464 81 74.07 5.150
cdtI NC_009514 60 71.67 4.977
Min27 NC_010237 83 71.08 4.915
STX2-1717 NC_011357 77 63.64 5.082
(1) NSD – Number of SD-containing genes, (2) PSD – Proportion of SD-containing genes,
(3) MSD - Mean number of consecutively matched sites.

33
Table 2.2. Secondary structure stability, measured by the minimum folding energy (MFE)
for Clade A and Clade B phages. MFE is measured at two mRNA locations: 1) 40 bases
upstream of the start codon (MFE40nt) and 2) from 4 bases upstream of the start codon to 37
bases downstream of the start codon (MFE--4+37).
Phage Accession Ngene MFE40nt MFE-4+37
13 a NC_011045 55 -5.3735 -4.7076
EcoDS1 NC_011042 53 -5.5532 -5.6291
K1-5 NC_008152 52 -5.2631 -3.8735
K1E NC_007637 62 -4.8619 -4.196
K1F NC_007456 43 -5.8679 -6.5579
T3 NC_003298 55 -5.1473 -4.6391
T7 NC_001604 60 -5.0047 -4.2622
BA14 NC_011040 52 -4.3469 -4.2873
phiP27 NC_003356 58 -5.7564 -5.2038
SFV NC_003444 53 -6.5808 -6.0811
933W NC_000924 80 -6.2833 -6.4413
Min27 NC_010237 83 -6.4707 -6.001
VT2-Sakai NC_000902 83 -5.9863 -6.2927
STX2-I NC_003525 166 -6.4645 -6.6228
BP-4795 NC_004813 85 -7.0353 -5.9579
cdtI NC_009514 60 -7.0232 -6.1
HK022 NC_002166 57 -6.2793 -4.6179
HK97 NC_002167 61 -6.6669 -4.7044
Lambda NC_001416 73 -6.9789 -5.7668
N15 NC_001901 60 -7.0329 -5.689
STX1-Phage NC_004913 84 -6.0289 -5.6139
STX2-II NC_004914 89 -6.3666 -5.92
STX2-1717 NC_011357 77 -6.6052 -5.8212
STX2-86 NC_008464 81 -5.8188 -5.5885
34
2.5.3. Relationship between SD features and secondary structure stability
If efficient translation initiation is evolutionary beneficial, then both SD features (PSD
and MSD) and MFE of sequences flanking the start codon will be subject to the same
selection and consequently are expected to have correlated changes. That is, a gene that
requires high translation initiation efficiency is expected to have both high PSD and MSD and
weak MFE40nt and MFE-4+37. On the other hand, if there is an optimal rate of translation with
a rate too high or too low being not as good, then an increase in PSD and MSD may result in
selection increasing stability of secondary structure to maintain the optimal rate. In that case,
we may observe a negative correlation between PSD and MSD on one hand and MFE40nt and
MFE-4+37 on the other.
We observe a highly significant positive correlation between PSD and two secondary
structure features (MFE40nt and MFE-4+37, Figure 2.3). A strong positive correlation is also
observed for MSD and the two MFE measures (Figure 2.4). This suggests selection operating
to maximize translation initiation efficiency in phages instead of stabilizing it at one
particular level.
Because some phage species share common ancestry, a more appropriate
characterization of the relationship between SD features (PSD and MSD) and secondary
structure features (MFE40nt and MFE-4+37) should be carried out with a phylogeny-based
independent contrasts (Felsenstein 1985). We performed the contrasts by using DAMBE
(Xia 2013b) which implemented the method with extensions (Xia 2013a) and the tree from a
previous study (Chithambaram, Prabhakaran, Xia 2014b). The four positive associations
(Figures 2.3-2.4) are still significant (p < 0.05).
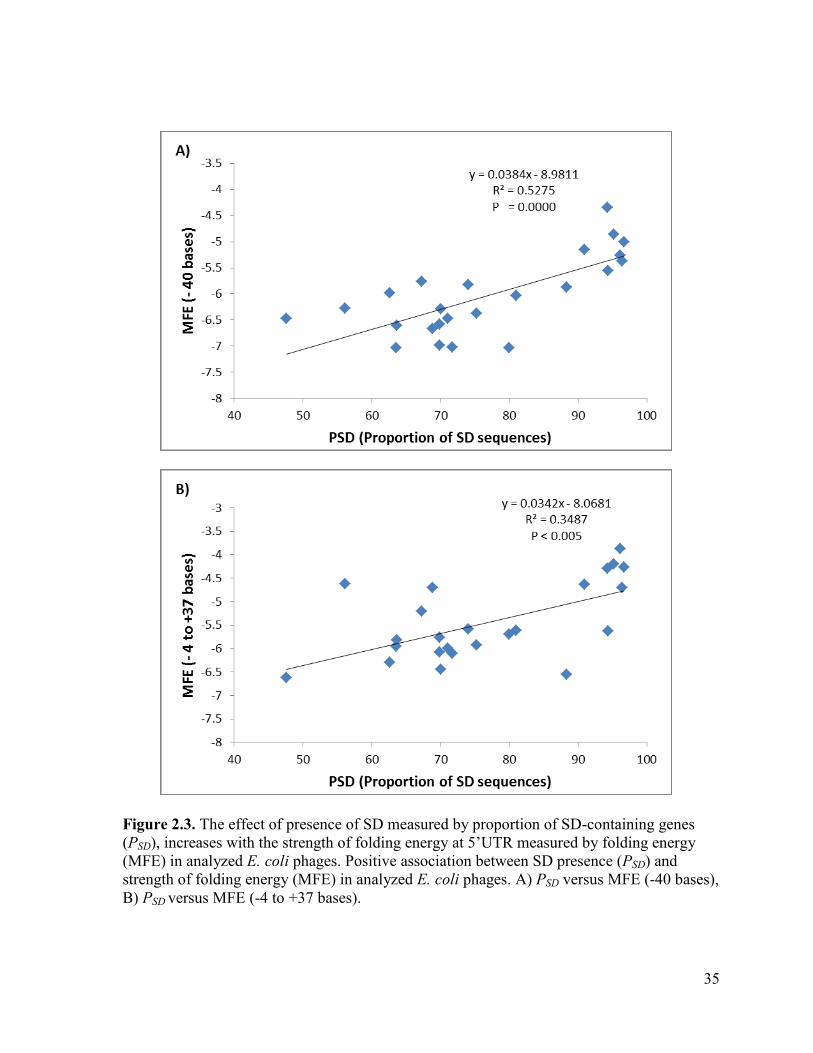
35
Figure 2.3. The effect of presence of SD measured by proportion of SD-containing genes
(PSD), increases with the strength of folding energy at 5’UTR measured by folding energy
(MFE) in analyzed E. coli phages. Positive association between SD presence (PSD) and
strength of folding energy (MFE) in analyzed E. coli phages. A) PSD versus MFE (-40 bases),
B) PSD versus MFE (-4 to +37 bases).
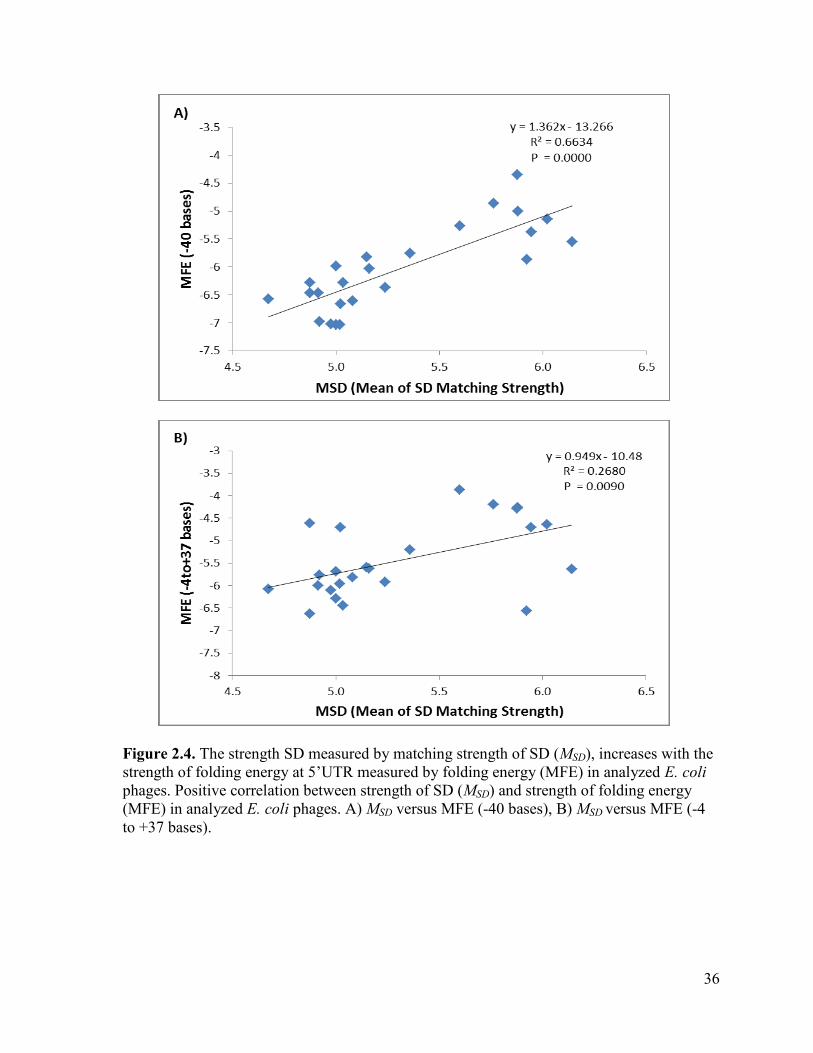
36
Figure 2.4. The strength SD measured by matching strength of SD (MSD), increases with the
strength of folding energy at 5’UTR measured by folding energy (MFE) in analyzed E. coli
phages. Positive correlation between strength of SD (MSD) and strength of folding energy
(MFE) in analyzed E. coli phages. A) MSD versus MFE (-40 bases), B) MSD versus MFE (-4
to +37 bases).

37
2.6. Discussion
Evolution of codon usage and translation elongation efficiency has recently been
recognized to depend on translation initiation efficiency (Xia et al. 2007; Supek, Smuc 2010;
Tuller et al. 2010; Xia 2014). In short, an mRNA with low translation initiation efficiency is
not expected to increase protein production with optimized codon usage. In contrast, protein
production for an mRNA with high translation initiation efficiency may become limited by
translation elongation and such an mRNA can increase protein production with optimized
codon usage. This implies little selection for codon optimization for genes with low
translation initiation efficiency but strong selection for codon optimization for genes with
high translation initiation efficiency.
We have extended this hypothesis to explain why two clades of E. coli phages differ
much in codon adaptation to their hosts (Chithambaram, Prabhakaran, Xia 2014b). In
particular, why Clade A phages exhibit stronger codon adaptation than Clade B phages. Our
hypothesis that genes in Clade A phages have higher translation initiation efficiency than
those in Clade B phages is highly consistent with our empirical results (Tables 2.1-2.2), with
the Clade A phages having both a higher PSD and greater MSD than the Clade B phages.
Higher PSD has also been observed in highly expressed genes than lowly expressed genes in
E. coli (Ma, Campbell, Karlin 2002).
Our finding of a positive correlation between strong SD and weak secondary structure
(Figure 2.3-2.4) suggests that natural selection may operate simultaneously to optimize these
features to increase translation initiation efficiency. One may suggest that the presence of an
SD sequence, which is typically purine-rich, may itself result in a change in the two MFE
measures, so that the positive correlations in Figure 2.3-2.4 has little to do with simultaneous
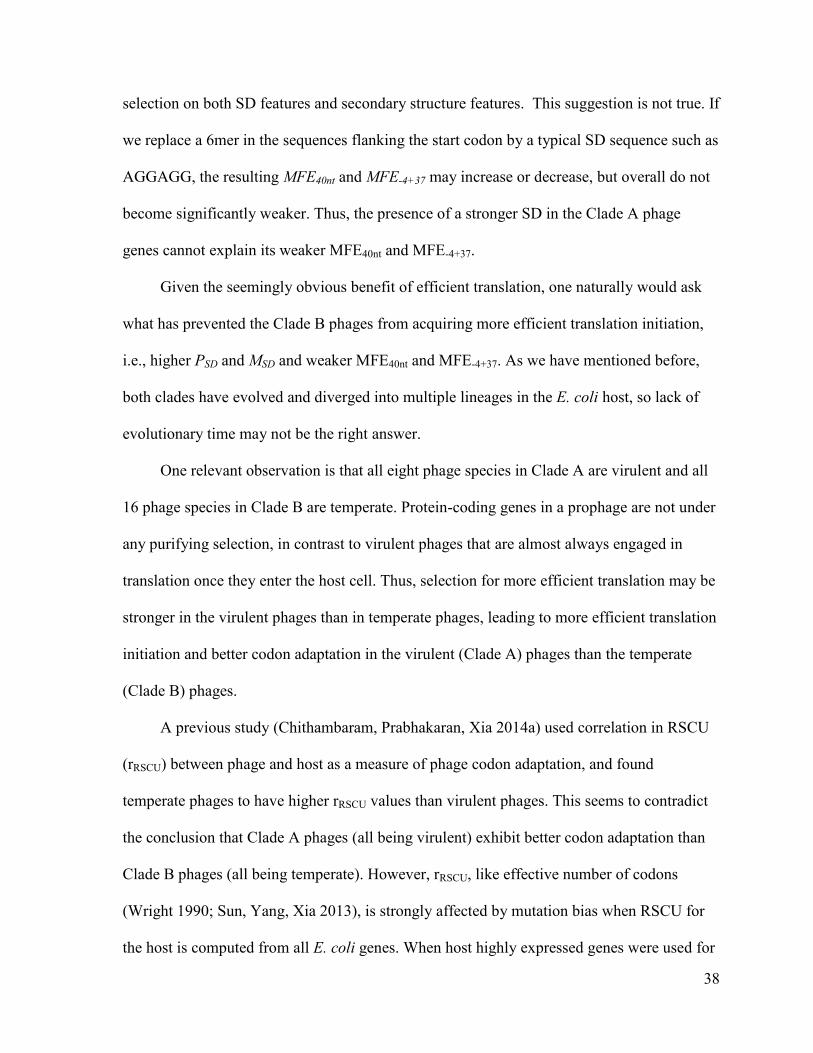
38
selection on both SD features and secondary structure features. This suggestion is not true. If
we replace a 6mer in the sequences flanking the start codon by a typical SD sequence such as
AGGAGG, the resulting MFE40nt and MFE-4+37 may increase or decrease, but overall do not
become significantly weaker. Thus, the presence of a stronger SD in the Clade A phage
genes cannot explain its weaker MFE40nt and MFE-4+37.
Given the seemingly obvious benefit of efficient translation, one naturally would ask
what has prevented the Clade B phages from acquiring more efficient translation initiation,
i.e., higher PSD and MSD and weaker MFE40nt and MFE-4+37. As we have mentioned before,
both clades have evolved and diverged into multiple lineages in the E. coli host, so lack of
evolutionary time may not be the right answer.
One relevant observation is that all eight phage species in Clade A are virulent and all
16 phage species in Clade B are temperate. Protein-coding genes in a prophage are not under
any purifying selection, in contrast to virulent phages that are almost always engaged in
translation once they enter the host cell. Thus, selection for more efficient translation may be
stronger in the virulent phages than in temperate phages, leading to more efficient translation
initiation and better codon adaptation in the virulent (Clade A) phages than the temperate
(Clade B) phages.
A previous study (Chithambaram, Prabhakaran, Xia 2014a) used correlation in RSCU
(rRSCU) between phage and host as a measure of phage codon adaptation, and found
temperate phages to have higher rRSCU values than virulent phages. This seems to contradict
the conclusion that Clade A phages (all being virulent) exhibit better codon adaptation than
Clade B phages (all being temperate). However, rRSCU, like effective number of codons
(Wright 1990; Sun, Yang, Xia 2013), is strongly affected by mutation bias when RSCU for
the host is computed from all E. coli genes. When host highly expressed genes were used for
39
computing RSCU, the difference in rRSCU between the virulent and temperate phages
becomes smaller. If one uses wi eq.2 in (Xia 2014) from the host as host RSCU (wi is
essentially RSCU corrected for mutation bias), then rRSCU is significantly greater for the
virulent phages than for the temperate phages.
Another relevant observation is that all eight phage species in Clade A have all genes
on the same DNA strand and all 16 phage species in Clade B have genes distributed on both
DNA strands. Strong strand asymmetry can affect both synonymous and nonsynonymous
substitutions (Marin, Xia 2008; Xia 2012b; Xia 2012c; Chithambaram, Prabhakaran, Xia
2014b). If two DNA strands have dramatically different mutation bias, then mutation bias in
one strand that is in the same direction as codon adaptation is necessarily accompanied by
mutation bias in the other strand going against codon adaptation.

40
3. Chapter Three
Aeromonas phages encode tRNAs for their overused codons
3.1. Abstract
The GC-rich bacterial species, Aeromonas salmonicida, is parasitized by both GC-rich
phages (Aeromonas phages - phiAS7 and vB_AsaM-56) and GC-poor phages (Aeromonas
phages – 25, 31, 44RR2.8t, 65, Aes508, phiAS4 and phiAS5). Both the GC-rich Aeromonas
phage phiAS7 and Aeromonas phage vB_AsaM-56 have nearly identical codon usage bias as
their host, while all the remaining seven GC-poor Aeromonas phages differ dramatically in
codon usage from their GC-rich host. Here, we investigated whether tRNA encoded in the
genome of Aeromonas phages facilitate the translation of phage proteins. We found that
tRNAs encoded in the phage genome correspond to synonymous codons overused in the
phage genes but not in the host genes.
3.2. Contribution
The data, results and interpretations in this chapter were published in International
Journal of Computational Biology and Drug Design. Ramanandan Prabhakaran (RP) is the
first author, Shivapriya Chithambaram (SC) is the co-author and Dr Xuhua Xia (XX) is the
corresponding author. This work was the result of a collaborative project between me and
members of the Xia lab: SC and XX. The development of the hypotheses, data analyses and
interpretations resulted from discussions among RP, SC and XX.
This research work has also been selected for paper presentation at ICIBM conference
at 2013.
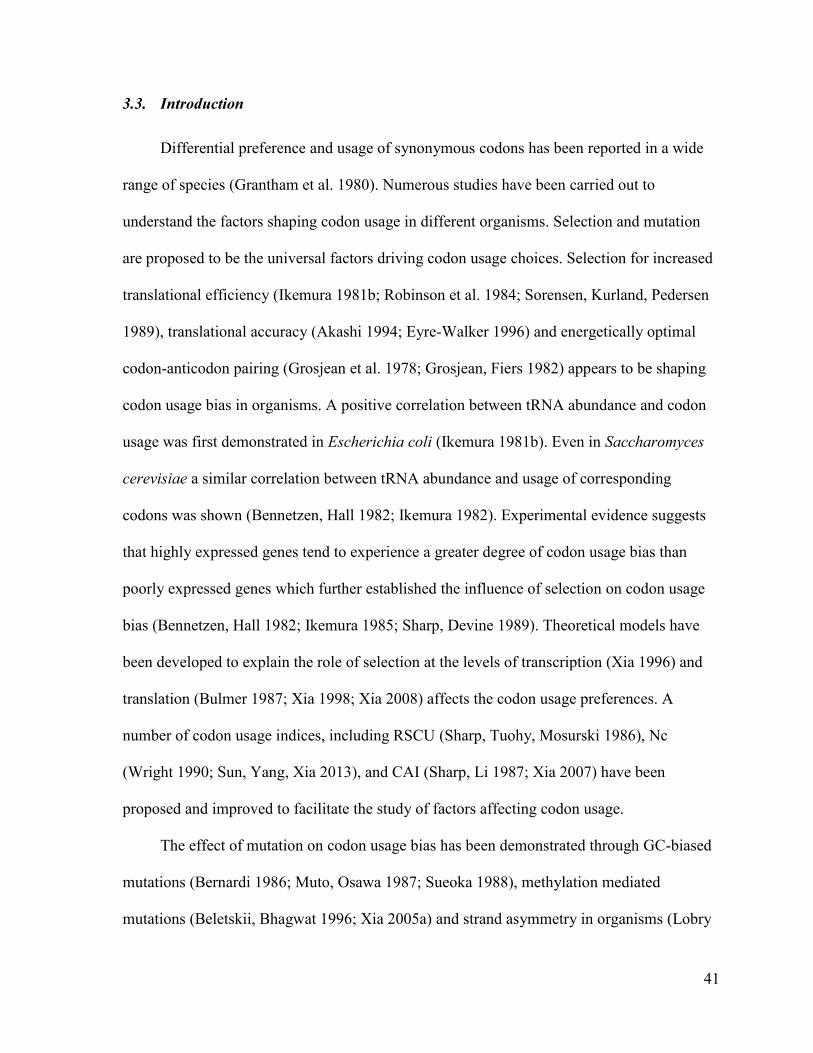
41
3.3. Introduction
Differential preference and usage of synonymous codons has been reported in a wide
range of species (Grantham et al. 1980). Numerous studies have been carried out to
understand the factors shaping codon usage in different organisms. Selection and mutation
are proposed to be the universal factors driving codon usage choices. Selection for increased
translational efficiency (Ikemura 1981b; Robinson et al. 1984; Sorensen, Kurland, Pedersen
1989), translational accuracy (Akashi 1994; Eyre-Walker 1996) and energetically optimal
codon-anticodon pairing (Grosjean et al. 1978; Grosjean, Fiers 1982) appears to be shaping
codon usage bias in organisms. A positive correlation between tRNA abundance and codon
usage was first demonstrated in Escherichia coli (Ikemura 1981b). Even in Saccharomyces
cerevisiae a similar correlation between tRNA abundance and usage of corresponding
codons was shown (Bennetzen, Hall 1982; Ikemura 1982). Experimental evidence suggests
that highly expressed genes tend to experience a greater degree of codon usage bias than
poorly expressed genes which further established the influence of selection on codon usage
bias (Bennetzen, Hall 1982; Ikemura 1985; Sharp, Devine 1989). Theoretical models have
been developed to explain the role of selection at the levels of transcription (Xia 1996) and
translation (Bulmer 1987; Xia 1998; Xia 2008) affects the codon usage preferences. A
number of codon usage indices, including RSCU (Sharp, Tuohy, Mosurski 1986), Nc
(Wright 1990; Sun, Yang, Xia 2013), and CAI (Sharp, Li 1987; Xia 2007) have been
proposed and improved to facilitate the study of factors affecting codon usage.
The effect of mutation on codon usage bias has been demonstrated through GC-biased
mutations (Bernardi 1986; Muto, Osawa 1987; Sueoka 1988), methylation mediated
mutations (Beletskii, Bhagwat 1996; Xia 2005a) and strand asymmetry in organisms (Lobry

42
1996; Lobry, Sueoka 2002; Marin, Xia 2008). Mutation mediated by DNA methylation has
been proposed to be an important factor in shaping codon usage bias among coronaviruses
(Woo et al. 2007). Mutation bias was invoked to explain the deviation in codon usage among
some of the prokaryotes with extreme high GC or AT content (Ohama, Muto, Osawa 1990).
In general, it is known that mutational and translational selection pressures are the factors
accountable for codon usage bias.
Viruses that parasitize bacterium are termed as phages. When a phage infects a
bacterial cell, it is advantageous to have a codon usage bias concordant with the bacteria, as
this would expedite the time consuming and expensive translation process. Accordingly,
phage species have been shown to exhibit codon adaptation to their host translation
machinery (Carbone 2008). A comparative codon usage study among different viruses
infecting a broad range of hosts spanning from bacteria to humans illustrated that phages
displayed the highest degree of concordance both in terms of codon usage and GC content
with respect to their hosts (Bahir et al. 2009).
While codon adaptation may lead to the benefit of more efficient and accurate
translation, there are several factors associated with phages that may act against codon
adaptation. First, phages typically have a high mutation rate which would prevent them from
reaching an optimal state of codon adaptation. Second, phages and their hosts may
experience different mutation spectrum leading to different compositional bias and
consequently discordant codon usage bias.
Several recent studies have suggested a role of phage-encoded tRNA in codon
adaptation, i.e., phage-encoded tRNA may enhance the translation of phage proteins
(Kunisawa 1992; Sahu et al. 2004) and expand the host range of phage species (Bailly-
Bechet, Vergassola, Rocha 2007; Limor-Waisberg et al. 2011). A conceptually similar codon

43
adaptation has been recently documented in HIV-1, which has many A-ending codons with
few cognate tRNA in the human cell. Empirical evidence strongly suggests that tRNA
species decoding A-ending codons are enriched when late HIV-1 genes are translated (van
Weringh et al. 2011). This tRNA enrichment has also been reported in vaccinia and influenza
A viruses (Pavon-Eternod et al. 2013).
Aeromonas phages present a unique case for studying codon adaptation mediated by
tRNA encoded by the phage genome. Aeromonas phages are double-stranded DNA (dsDNA)
tailed phages parasitizing the bacterial host Aeromonas salmonicida. They belong to two
families, Podoviridae (Kim et al. 2012) and Myoviridae (Ackermann et al. 1985), classified
by their tail morphology. Myoviridae have a long and contractile tail while Podoviridae have
a very short tails. Most of the analyzed myoviruses have longer genome than podoviruses.
The GC-rich bacterial species, A. salmonicida, is parasitized by both GC-rich and GC-poor
Aeromonas phages (Table 3.1). While GC-rich Aeromonas phages phiAS7 and vB_AsaM-56
have nearly identical codon usage bias as their GC-rich host, the remaining seven GC-poor
Aeromonas phages differ dramatically in codon usage from their GC-rich host. Since the
seven GC-poor Aeromonas phages encode a set of their own tRNAs, it is natural for one to
ask if these phage-encoded tRNAs decode codons that are overused in the phage, especially
those with few cognate host tRNAs.
A GC-rich host and a GC-poor phage typically would have dramatically different
codon usage bias. For a given R-ending codon family (where R stands for either A or G), the
GC-rich host may overuse G-ending codons and may have many tRNAs decoding G-ending
codons, whereas the GC-poor phage may overuse A-ending codons which would be difficult
to find their decoding tRNAs in the host cytoplasm. It would therefore be beneficial if the
phage encodes its own tRNAs decoding these A-ending codons by the phage genes, i.e., the

44
phage tRNA should have a wobble U instead of a wobble C if A-ending codons are overused
in the phage genes but not in the host genes. This argument can also be applied to the R-
ending codons within a four-fold codon family. For example, GGA and GGG codons for
glycine are translated by tRNAGly/UCC
and tRNAGly/CCC
. If GGA is overused in the phage but
not in the host, then we expect the phage tRNA for glycine should have a wobble U instead
of a wobble C.
We cannot generate the same prediction concerning Y-ending codons. While R-
ending codons are frequently translated by tRNAs with a wobble U or wobble C, Y-ending
codons are always translated by tRNA with a wobble G but not by tRNA with a wobble
nucleotide A. A wobble A in a tRNA is always modified to inosine. This avoidance of a
wobble A in tRNA has been explained by structural modelling, i.e., a tRNA with a wobble
A, once moved to the P-site, will interfere with the entry/pairing of a tRNA at the A-site
(Lim 1994). Thus, for a Y-ending codon family, even if the host overuses the C-ending
codon and the phage overuses the U-ending codon, we would not predict that the phage
should carry a tRNA with a wobble A to facilitate the decoding of the overused U-ending
codons, simply because a tRNA with a wobble A is so deleterious that it is not observed
unmodified in nature. Here, we investigate the codon usage of the GC-rich bacterial host and
its phages and evaluate the prediction concerning the wobble nucleotide of tRNAs encoded
in the Aeromonas phage genomes.
Among the nine phages parasitizing A. salmonicida, two are GC-rich (Aeromonas
phage phiAS7 and Aeromonas phage vB_AsaM-56) and the remaining seven are GC-poor
phages (Aeromonas phage 25, 31, 44RR2.8t, 65, Aes508, phiAS4 and phiAS5). We report
that the seven Aeromonas phages, being GC-poor (AT-rich), have codon usage dramatically
different from their GC-rich host. These GC-poor phage genomes encode 11 to 24 tRNAs,
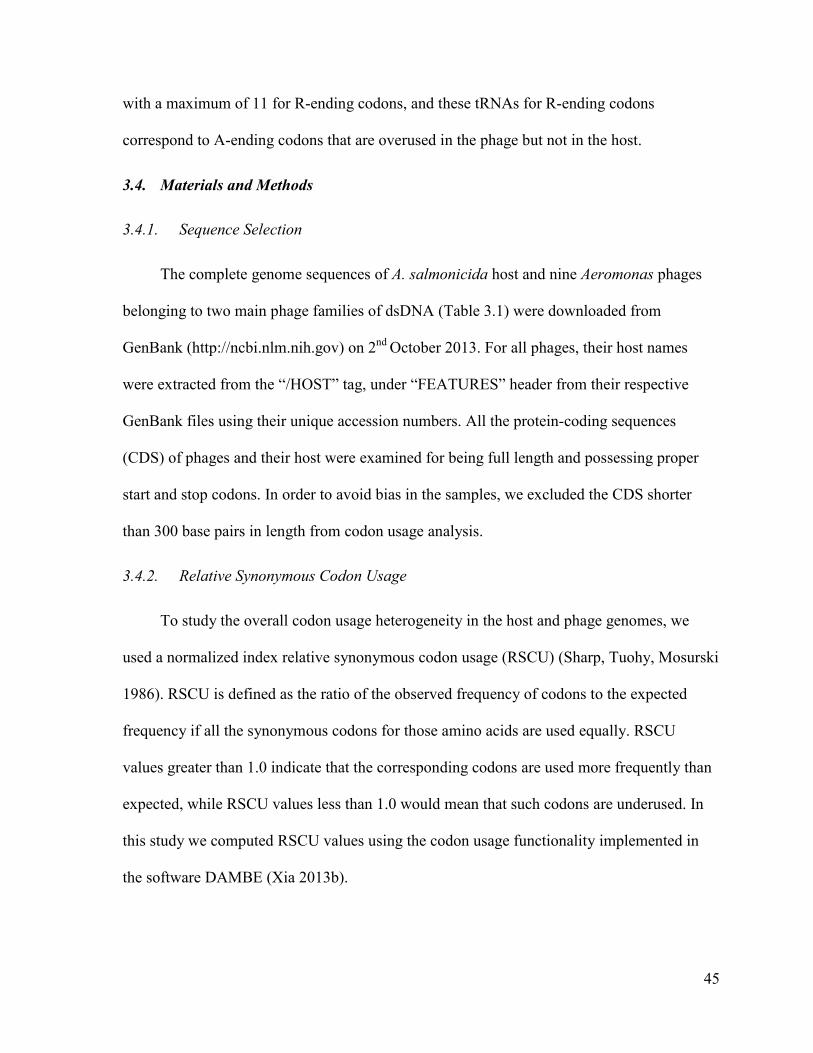
45
with a maximum of 11 for R-ending codons, and these tRNAs for R-ending codons
correspond to A-ending codons that are overused in the phage but not in the host.
3.4. Materials and Methods
3.4.1. Sequence Selection
The complete genome sequences of A. salmonicida host and nine Aeromonas phages
belonging to two main phage families of dsDNA (Table 3.1) were downloaded from
GenBank (http://ncbi.nlm.nih.gov) on 2nd
October 2013. For all phages, their host names
were extracted from the “/HOST” tag, under “FEATURES” header from their respective
GenBank files using their unique accession numbers. All the protein-coding sequences
(CDS) of phages and their host were examined for being full length and possessing proper
start and stop codons. In order to avoid bias in the samples, we excluded the CDS shorter
than 300 base pairs in length from codon usage analysis.
3.4.2. Relative Synonymous Codon Usage
To study the overall codon usage heterogeneity in the host and phage genomes, we
used a normalized index relative synonymous codon usage (RSCU) (Sharp, Tuohy, Mosurski
1986). RSCU is defined as the ratio of the observed frequency of codons to the expected
frequency if all the synonymous codons for those amino acids are used equally. RSCU
values greater than 1.0 indicate that the corresponding codons are used more frequently than
expected, while RSCU values less than 1.0 would mean that such codons are underused. In
this study we computed RSCU values using the codon usage functionality implemented in
the software DAMBE (Xia 2013b).

46
Table 3.1. Basic genome features of the Aeromonas host and their phages.
Name Accession # Length # CDS GC%
Aeromonas salmonicida (host) NC_009348 4702402 3373 58.51
Aeromonas phage 25 (M) NC_008208 161,475 242 41.04
Aeromonas phage 31 (M) NC_007022 172,963 247 43.91
Aeromonas phage 44RR2.8t (M) NC_005135 173,591 252 43.88
Aeromonas phage 65 (M) NC_015251 235,229 437 37.20
Aeromonas phage Aes508 (M) NC_019543 160,646 230 41.23
Aeromonas phage phiAS4 (M) NC_014635 163,875 271 41.30
Aeromonas phage phiAS5 (M) NC_014636 225,268 343 43.00
Aeromonas phage vB_AsaM-56
(M) NC_019527 43,551 83 55.42
Aeromonas phage phiAS7 (P) NC_019528 41572 51 56.92
*M stands for Myoviridae phage family and P stands for Podoviridae phage family.
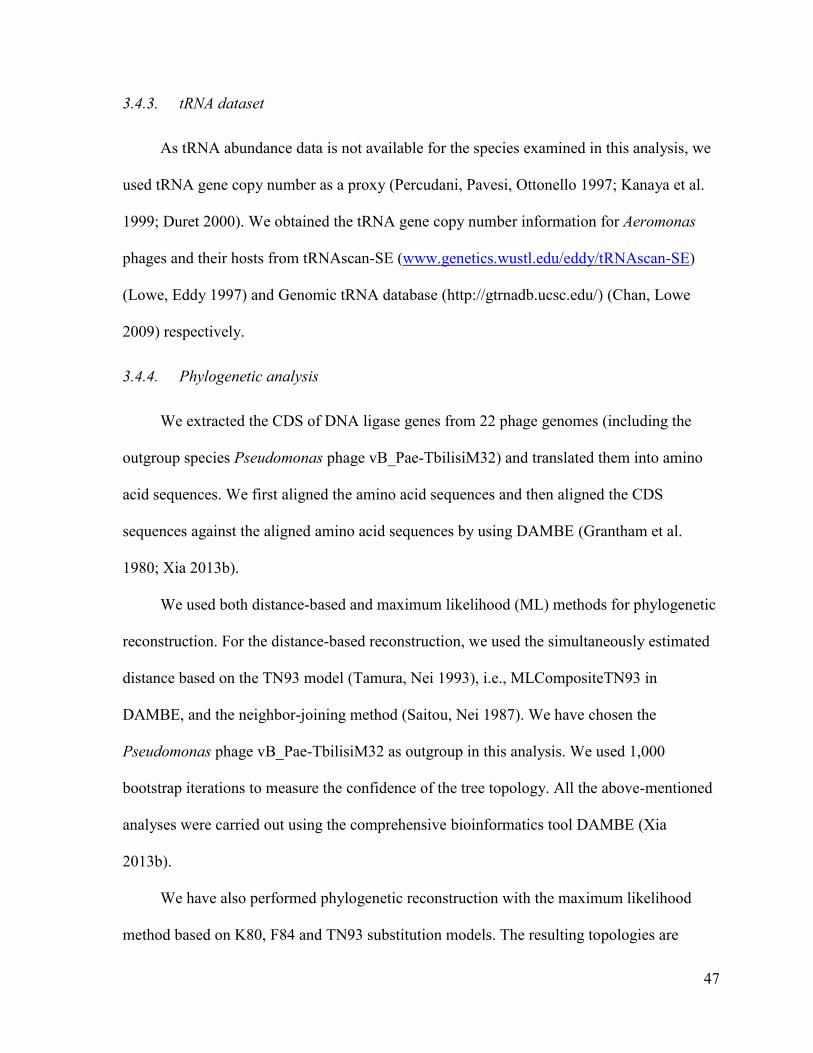
47
3.4.3. tRNA dataset
As tRNA abundance data is not available for the species examined in this analysis, we
used tRNA gene copy number as a proxy (Percudani, Pavesi, Ottonello 1997; Kanaya et al.
1999; Duret 2000). We obtained the tRNA gene copy number information for Aeromonas
phages and their hosts from tRNAscan-SE (www.genetics.wustl.edu/eddy/tRNAscan-SE)
(Lowe, Eddy 1997) and Genomic tRNA database (http://gtrnadb.ucsc.edu/) (Chan, Lowe
2009) respectively.
3.4.4. Phylogenetic analysis
We extracted the CDS of DNA ligase genes from 22 phage genomes (including the
outgroup species Pseudomonas phage vB_Pae-TbilisiM32) and translated them into amino
acid sequences. We first aligned the amino acid sequences and then aligned the CDS
sequences against the aligned amino acid sequences by using DAMBE (Grantham et al.
1980; Xia 2013b).
We used both distance-based and maximum likelihood (ML) methods for phylogenetic
reconstruction. For the distance-based reconstruction, we used the simultaneously estimated
distance based on the TN93 model (Tamura, Nei 1993), i.e., MLCompositeTN93 in
DAMBE, and the neighbor-joining method (Saitou, Nei 1987). We have chosen the
Pseudomonas phage vB_Pae-TbilisiM32 as outgroup in this analysis. We used 1,000
bootstrap iterations to measure the confidence of the tree topology. All the above-mentioned
analyses were carried out using the comprehensive bioinformatics tool DAMBE (Xia
2013b).
We have also performed phylogenetic reconstruction with the maximum likelihood
method based on K80, F84 and TN93 substitution models. The resulting topologies are

48
identical to that from the distance-based method. We have also checked the sufficiency of the
substitution models by likelihood ratio test and information-theoretic indices by using
DAMBE.
3.5. Results and Discussion
3.5.1. The GC-rich and GC-poor phages differ dramatically in their codon usage relative to their
host
The bacterial host A. salmonicida and Aeromonas phage phiAS7 are both GC-rich and
exhibit similar codon usage, with their RSCU values showing a positive and highly
significant correlation (Figure 3.1(A)). In contrast, the GC-poor Aeromonas phage 65 has
dramatically different codon usage from that of the host, with its RSCU values showing a
highly significant negative correlation (Figure 3.1(B)).
Similarly, all other GC-poor Aeromonas phages also maintain an extremely poor
correlation with the host. A conventional mutationist explanation for the pattern in Figure
3.1(B) is that the host and the phage differ in codon usage because of differential mutation
spectra experienced by the host and the phage, partially reflected in their differences in
nucleotide composition.
This difference in mutation bias between the host and the phage counteracts against
codon adaptation of the phage to the host. However, the fact that the GC-poor Aeromonas
phages encode a set of tRNA genes in their genome suggests an additional dimension of the
system, i.e., the phage genome may encode tRNA that decodes specifically the synonymous
codons that are overused in the phage but not in the host.

49
Figure 3.1. Comparison of codon usage of GC-rich and GC-poor Aeromonas phages with
their host. A) RSCU plot of GC-rich dsDNA Aeromonas phage phiAS7 and its host, B)
RSCU plot of GC-poor dsDNA Aeromonas phage 65 and its host.

50
What phage would benefit from carrying its own tRNAs? Two factors may be major
contributors. The first is the difference in nucleotide composition between the phage and the
host and the second is when the host tRNA pools is uncertain i.e., when a phage has a broad
range of host such as KVP40 (Sau et al. 2007). This hypothesis leads to a testable prediction
that the number of tRNAs carried by the phage should increase with the differences between
the host and phage GC% (the greater the difference in GC%, the greater the difference in
codon usage bias). The result for this prediction is strongly substantiated by data from the
nine Aeromonas phages (Figure 3.2). The general trend is a positive relationship, i.e., more
phage tRNA is associated with greater differences in GC% between the host and the phages.
Figure 3.2. The number of phage encoded tRNA genes plotted against the difference in GC
content between the phage and its host.

51
3.5.2. Aeromonas phages encode tRNA for their overused codons
The GC-rich Aeromonas phage phiAS7 and phage vB_AsaM-56 does not encode any
tRNA genes. Given their similarity in codon usage to their host, one would expect little
necessity or selection pressure for the phage to maintain its own tRNA genes. In contrast, the
GC-poor Aeromonas phages, with their codon usage dramatically different from that of their
host (Figure 3.1(B)), could benefit from having their own tRNA genes decoding synonymous
codons that are overused in the phages but not in the host (and consequently with few host
cognate tRNAs). In particular, for R-ending codons, the GC-rich host invariably overuses G-
ending codons whereas GC-poor Aeromonas phages tend to overuse A-ending codons (Table
3.2 and Figure 3.3).
As per our prediction mentioned in the introduction that tRNA genes encoded in the
Aeromonas phage genomes, if present for R-ending codons, should have a wobble U to
decode these A-ending codons overused in the phages but not in the host. Of the 24 tRNA
genes encoded in the genome of Aeromonas phage phiAS5, 10 tRNAs are for R-ending
codons (Table 3.2). In all these 10 sets of R-ending codons, the phage uses more A-ending
codons than the host, and the phage-encoded tRNAs invariably have a wobble U to enhance
the translation of the A-ending codons that are overused in the phage but not in the host.
Take the two-fold arginine codons (AGA and AGG) for example. The host overuses the
AGG codon whereas the phage overuses the AGA codon. One would predict that the phage-
encoded tRNA should have a wobble U to decode the A-ending codon overused in the phage
but not in the host. This prediction is consistent with the empirical data (Table 3.2).
Similarly, we tested this prediction in the other six GC-poor Aeromonas phage 25, phage 31,

52
phage 44RR2.8t, phage 65, phage Aes508 and phage phiAS4 (Figure 3.3). Again the results
from these GC-poor Aeromonas phages are also in agreement with our prediction.
Table 3.2. Aeromonas phage phiAS5 encodes tRNAs for its overused codons.
Host Phage
Codon AA #Codon RSCU tRNA Anti-
codon #Codon RSCU tRNA
GCA Ala 13759 0.427 3 UGC 1293 1.243 1
GCG Ala 28030 0.870 CGC 772 0.742
GAA Asp 26196 0.722 6 UUC 2754 1.406 1
GAG Asp 46416 1.278 CUC 1163 0.594
GGA Gly 6322 0.257 2 UCC 870 0.874 1
GGG Gly 18504 0.753 1 CCC 189 0.190
AAA Lys 14791 0.593 3 UUU 2552 1.173 1
AAG Lys 35059 1.407 1 CUU 1798 0.827
CUA Leu 2538 0.077 1 UAG 411 0.566 1
CUG Leu 90545 2.747 6 CAG 1386 1.909
UUA Leu 2559 0.259 1 UAA 333 0.538 1
UUG Leu 17201 1.741 2 CAA 906 1.462 1
CCA Pro 5833 0.395 2 UGG 624 1.249 1
CCG Pro 23154 1.566 1 CGG 722 1.445
CAA Gln 13243 0.433 5 UUG 1294 1.304 1
CAG Gln 47870 1.567 CUG 690 0.696
AGA Arg 2773 0.896 1 UCU 562 1.816 1
AGG Arg 3420 1.104 1 CCU 57 0.184
ACA Thr 5944 0.384 1 UGU 955 1.050 1
ACG Thr 8132 0.525 1 CGU 348 0.383
*See the text for reasons of including only R-ending codons.

53
Figure 3.3. Relationship between Myoviridae Aeromonas phage encoded tRNAs and their
overused codons.Only NNR codons are considered for this analysis. * represents presence of
tRNAs in phages for their respective codons. Filled bars represent host codon usage and
striped bars represent phage codon usage.
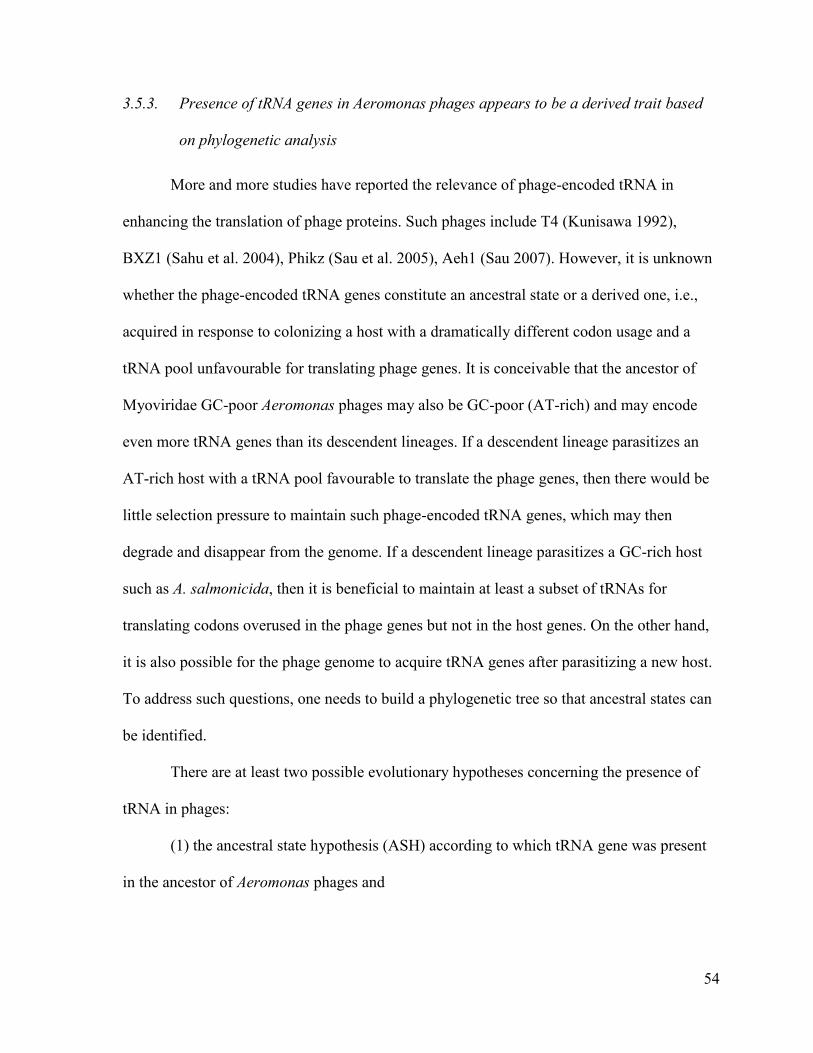
54
3.5.3. Presence of tRNA genes in Aeromonas phages appears to be a derived trait based
on phylogenetic analysis
More and more studies have reported the relevance of phage-encoded tRNA in
enhancing the translation of phage proteins. Such phages include T4 (Kunisawa 1992),
BXZ1 (Sahu et al. 2004), Phikz (Sau et al. 2005), Aeh1 (Sau 2007). However, it is unknown
whether the phage-encoded tRNA genes constitute an ancestral state or a derived one, i.e.,
acquired in response to colonizing a host with a dramatically different codon usage and a
tRNA pool unfavourable for translating phage genes. It is conceivable that the ancestor of
Myoviridae GC-poor Aeromonas phages may also be GC-poor (AT-rich) and may encode
even more tRNA genes than its descendent lineages. If a descendent lineage parasitizes an
AT-rich host with a tRNA pool favourable to translate the phage genes, then there would be
little selection pressure to maintain such phage-encoded tRNA genes, which may then
degrade and disappear from the genome. If a descendent lineage parasitizes a GC-rich host
such as A. salmonicida, then it is beneficial to maintain at least a subset of tRNAs for
translating codons overused in the phage genes but not in the host genes. On the other hand,
it is also possible for the phage genome to acquire tRNA genes after parasitizing a new host.
To address such questions, one needs to build a phylogenetic tree so that ancestral states can
be identified.
There are at least two possible evolutionary hypotheses concerning the presence of
tRNA in phages:
(1) the ancestral state hypothesis (ASH) according to which tRNA gene was present
in the ancestor of Aeromonas phages and

55
(2) the derived state hypothesis (DSH) which states that tRNA gene was absent in
the ancestor, but gained along subsequent descendent lineages, likely in response to
compositional differences with their hosts. We assessed which of the above two hypotheses
received more empirical support by mapping the presence/absence of tRNA genes onto the
phylogenetic tree built using shared genes of phages ( Figure 3.4 and Figure 3.5).
The presence of tRNA genes in all phages along lineage B except Bacillus phage
SP10 (lineage E) and Enterobacteria phage Bp7 (lineage F) and the absence of tRNAs in the
descendent phage lineages C and D could be the outcome of two possible evolutionary
scenarios.
Consider scenario one as ancestor A encoding tRNA genes (ASH), under this
assumption the possible events are listed below (1) tRNA genes encoded by ancestor A must
have been passed on to all subsequent descendent lineages through lineage B but Bacillus
phage SP10 (lineage E) and Enterobacteria phage Bp7 (lineage F) have experienced tRNA
gene loss events in lineage B (Figure 3.4). (2) The descendent lineages C and D have
experienced tRNA gene loss events (Figure 3.4).
Consider another scenario where ancestor A does not encode tRNA genes (DSH).
Again, under this assumption the two possible events are listed below, lineage B experienced
a tRNA gene gain event and passed on this trait to all its descendents but Bacillus phage
SP10 (lineage E) and Enterobacteria phage Bp7 (lineage F) have experienced tRNA gene
loss events (Figure 3.5).
ASH predicts four tRNA gene loss events while DSH predicts 1 tRNA gene gain and
2 tRNA gene loss events. During the process of evolution loss/gain of a trait is always
gradual; however ASH predicts that there are four complete tRNA gene loss events which
are very unlikely to occur. Hence as per the principle of parsimony, DSH gains more
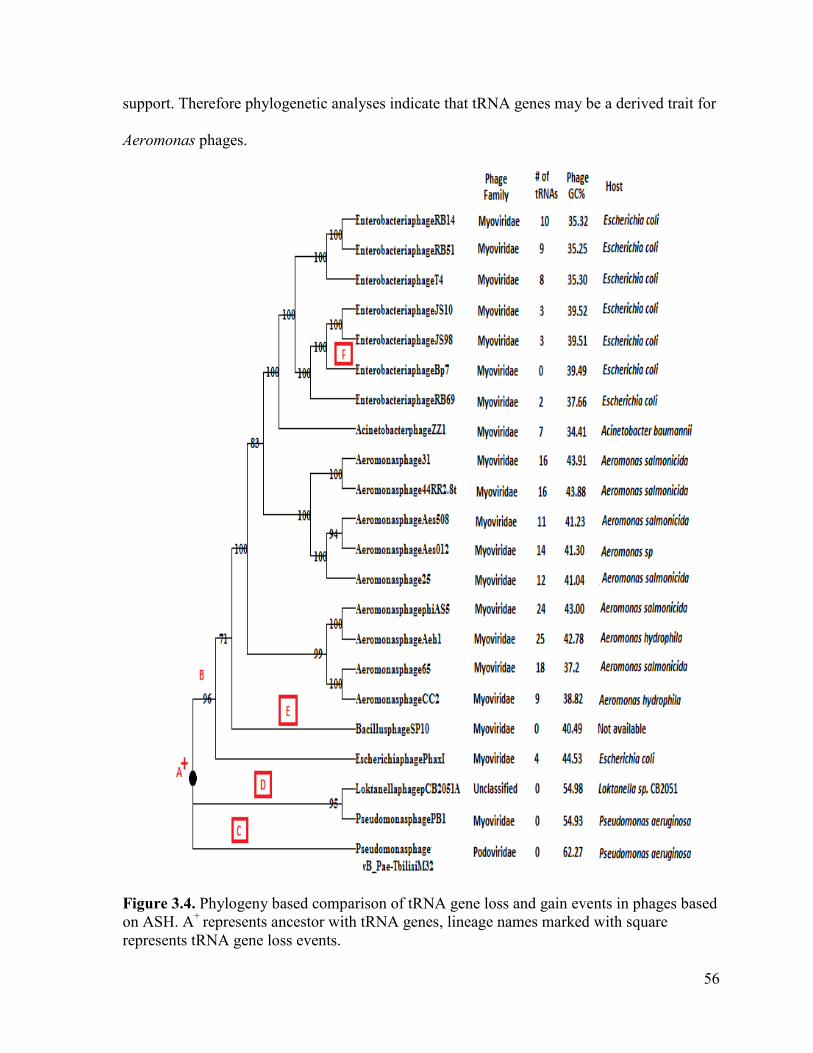
56
support. Therefore phylogenetic analyses indicate that tRNA genes may be a derived trait for
Aeromonas phages.
Figure 3.4. Phylogeny based comparison of tRNA gene loss and gain events in phages based
on ASH. A+
represents ancestor with tRNA genes, lineage names marked with square
represents tRNA gene loss events.

57
Figure 3.5. Phylogeny based comparison of tRNA gene loss and gain events in phages based
on DSH. A- represents ancestor without tRNA genes, lineage names marked with circle
represents tRNA gene gain events, lineage names marked with square represents tRNA gene
loss events.

58
3.6. Conclusion
To summarize, our study revealed considerable differences between synonymous
codon preferences of GC-rich and GC-poor Aeromonas phages with respect to their host.
Compositional differences between phages and hosts appear to be the causative factor for the
presence of phage-encoded tRNA genes in the GC-poor Aeromonas phages. Finally, our
phylogentic analyses suggest that the presence of tRNAs in Aeromonas phages is a derived
trait.
59
4. Chapter Four
Secondary structure avoidance at translation initiation and
termination sites in phages
4.1. Abstract
Selection for avoidance of stable secondary structures in the vicinity of translation
initiation and termination regions has been reported in a wide range of species including
bacteria. Phages experience selection pressure to match host translational signals in order to
replicate effectively. In our present study, we examined if such a selection pressure for
secondary structure avoidance exists in phages as well. We compared the folding energies of
translational initiation and termination regions with those of other regions of mRNA in 478
phages. Here, we used minimum folding energy (MFE) as a proxy for measuring secondary
structure stability. Our results revealed weak secondary structure (less negative MFE values)
near translational initiation and termination site when compared to other regions of the
mRNA. These findings further confirm that there exists a generality in pattern of secondary
structure avoidance for maintaining high translation efficiency across a widespread species
range.
4.2. Introduction
Gene expression differs by several orders of magnitude while attempting to encode the
same protein under identical conditions (Kudla et al. 2009). Gene expression can be
controlled by three equally potent determinants operating at different stages of translation
process. First, local properties of mRNA transcript at 5’ region such as Shine-Dalgarno (SD)
sequence (Hui, de Boer 1987; de Smit, van Duin 1994a; Olsthoorn, Zoog, van Duin 1995),
60
start codon (Hartz, McPheeters, Gold 1991; Ringquist et al. 1992; Ma, Campbell, Karlin
2002) which operate in the translation initiation step, next is codon-anticodon adaptation
(Ikemura 1981b; Xia 1998) operating at the translation elongation step and thirdly the
mRNA signals near the stop codon operates at the translation termination step (Li et al.
2003). The mRNA secondary structures impede the rate of ribosome movement across the
mRNA and may result in ribosomal stalling. Irrespective of the stage of translation, the
formation of mRNA secondary structures is a road block for efficient translation.
The mRNA sequence interacts extensively with itself to form local secondary
structures such as stems and loops through complementary base pairing. Formation of folded
secondary structures, at translation initiation region (TIR) makes it difficult for the ribosome
to bind with SD sequence and also the interaction of tRNA with start codon. The rate of
initiation is primarily determined by the accessibility of the start codon (Nakamoto 2006) and
SD sequence in TIR to the ribosome (de Smit, van Duin 1990; Studer, Joseph 2006). As a
result, folded secondary structures negatively regulate gene expression. An early
experimental study revealed a significant correlation between protein production and
stability of the hair pin secondary structures by stabilizing/destabilizing the coat protein of
RNA phage MS2 (de Smit, van Duin 1990). Kudla et al. observed that protein abundance
decreases as the stability of the mRNA secondary structure near the start codon increases.
Secondary structures can explain 44% of variance in protein expression (Kudla et al. 2009).
Therefore it becomes necessary to unwind these structures for effective recognition of start
codon by the ribosome.
Furthermore, a recent study confirmed that strong secondary structures are selected
against at start site of genes in E. coli and yeast (Tuller et al. 2010). In corroboration,
computational studies on several cellular organisms (Gu, Zhou, Wilke 2010) and viruses

61
(Zhou, Wilke 2011) have shown a universal trend in reduced stable structures at the
beginning of genes. Several computational studies have focussed on investigating the
stability of secondary structure in the downstream region of start codon. However, it has
been demonstrated that position and strength of secondary structures involving the SD and
start codon impacts protein expression significantly (Osterman et al. 2013). SD is one of the
most important regulatory elements affecting translation initiation (Hui, de Boer 1987; Ma,
Campbell, Karlin 2002). Hence, one may expect that there should be strong selection
pressure acting not only downstream of start codon but also the upstream region of start
codon which involves SD sequence. Studies including the immediate upstream region of start
codon while testing for the presence of strong secondary structures in phages is rather
limited. This prompted us to examine whether local mRNA secondary structures are avoided
at TIR which involves nucleotides (nt) from the 5’-untranslated region (UTR) and from the
5’-end of coding sequence (CDS) in all phage genes. This hypothesis hereafter referred as
selection against stable structure (SASS). We extended the SASS hypothesis to the
comparison of TIR and non-TIR windows (refer methods and materials section). Here we
used minimum folding energy (MFE) as a proxy of secondary structure stability. We predict
that TIR windows should have less negative MFE (weaker structure) compared to non-TIR
windows.
A crystal structure study confirmed that stop codon and release factor interaction is
crucial for translation termination complex formation (Korostelev et al. 2008) which in turn
influences termination efficiency. Stable secondary structures could impede translation
termination efficiency by masking the stop codon within its stem-loop structures. Hence, by
causing inaccessibility of stop codon, these RNA structures become a hindrance for the class
I release factor binding. Increased secondary structure formation in the proximity of stop
62
codon reduces the protein production significantly (Niepel, Ling, Gallie 1999). Therefore, we
expect purifying selection would act to reduce secondary structures at the termination site.
Such an avoidance has been observed in prokaryotes (Rocha, Danchin, Viari 1999; Tuller et
al. 2010), yeast (Tuller et al. 2010) and mammals (Shabalina, Ogurtsov, Spiridonov 2006).
We would like to extend SASS hypothesis at translation termination region referred as TTR
(cover bases from CDS upstream of stop codon and 3’-UTR) to phages. We predict that TTR
windows should have less negative MFE (weaker structure) compared to non-TTR windows.
To know bases covered in TTR and non-TTR windows (refer methods and materials
section). Studying the effect of mRNA secondary structures on the translation termination
process will add another dimension to our current understanding of phage translation.
The role of secondary structure formation at the termination site and 5’ UTR has not
yet been explored to the extent of their presence in 5’ end of CDS in phages. Lack of
complete understanding of factors contributing to translation efficiency of phages hampers
their application as antibacterial agents against bacterial pathogens. Therefore, in this study,
we have investigated 478 phages in the light of factors affecting their translation initiation
and termination efficiency. We addressed the following questions in all phages:
1) Does selection operate against stable structures at TIR window (immediate upstream
and downstream bases of start codon)?
2) Does selection operate against stable structures at the termination site (immediate
upstream and downstream bases of start codon)?
Indeed, our results substantiate the SASS hypothesis significantly.

63
4.3. Materials and Methods
4.3.1. Dataset and sequences
422 phages and their respective bacterial genomes were considered for the analyses in
this study. The selected phages belong to the Siphoviridae, Myoviridae, Podoviridae and
Tectiviridae phage families. GenBank sequences of the phage and host species were
downloaded from National Center for Biotechnology Information (NCBI;
www.ncbi.nlm.nih.gov). We only considered coding sequences (CDS) longer than 200 bases
for our analyses. The phage family, phage name, accession numbers, genome length, and
bacterial host are all listed in Supplemental Table B. We retrieved the upstream sequences
(5’UTR), CDS and downstream sequences of all genes in phage and bacterial genomes from
the GenBank file using DAMBE software (Xia 2013b).
We considered the following bases in TIR (-11to-40, -1to-30,1to30, 11to40 nt)
windows, Non-TIR (-21to50, 21to50, 31to60, 41to70, 51to80, 61to90, 71to100, 81to110,
91to120 nt) windows, TTR (71to100, 81to110, 91to120 nt) windows, and Non-TTR (1to30,
11to40, 21to50, 31to60, 41to70, 51to80, 61to90, 101to130, 111to140, 121to150 nt)
windows.
4.3.2. Measuring the stability of local mRNA secondary structures in each gene
The stability of local secondary structure formed in mRNA is generally measured by
minimum folding energy (MFE), which is the amount of energy require to break the
secondary structure. MFE is expressed in KJ/mol. The more negative the MFE value, the
greater is the stability of secondary structure. We computed MFE using DAMBE software
(version: 5.3.108) which implements the functionality of Vienna RNA package (Hofacker

64
2003); the settings considered are as follows, folding temperature is 37◦C, with no lonely
pairs and with no GU pairs at the end of helices.
4.4. Results
mRNA secondary structures obstruct ribosome movement and thereby affect
translation rate. Therefore, it is natural to expect reduced stability of mRNA secondary
structure at translation initiation and termination sites. We hypothesize that purifying
selection should act against stable secondary structures at translation initiation and
termination sites in phages. We analyzed mRNA secondary structure in 422 phage genomes
whose genomic GC contents ranges from 32% to 68%. Our specific predictions are that 1)
TIR windows should have weaker secondary structure (less negative MFE) than non-TIR
windows in all phages, 2) TTR windows should have weaker secondary structure (less
negative MFE) than non-TTR windows in all phages.
4.4.1. Selection against strong mRNA secondary structure near TIR in E. coli phages
The MFE of TIR (-40 to -11, -30 to -1, 1 to 30 and 11 to 40 nt) windows were
compared to MFE of non-TIR (upstream and downstream regions) windows of each of the
phage mRNA sequences. In the sliding window analysis, the +1 position, which is the first
base of the start codon, was used as the reference point in each mRNA sequence. We
compiled the MFE across the mRNA sequence including 5’UTR and 5’end of CDS using
sliding windows of 30 nt length. Then in steps of 10 nt, we moved up to 50 nt upstream of
the start codon (total of 3 windows from -1 to -50) and for the downstream region we moved
upto 150 nt downstream from the start codon (total of 13 windows from 1 to 150 in the
interval of 30 nt).

65
Secondary structure stability profile in TIR and non-TIR windows of E. coli phage
genes are shown in Figure 4.1 (A). As predicted, we observed a highly significant difference
in MFE values between TIR windows and non-TIR windows (e.g., 1. TIR-MFE(-1to-30) = -
2.8104 vs nonTIR-MFE(61to90) = -3.5761, n =11,163; Mannwhitney Paired test: p < 10-16
; 2.
TIR-MFE(1to30) = -2.0665 vs nonTIR-MFE(61to90) = -3.5761, n =11,163; Mannwhitney Paired
test: p < 10-16
). Similarly highly significant differences were also observed between four
TIR windows and other non-TIR windows in E. coli phages.
4.4.2. Selection against strong mRNA secondary structure near TTR in E. coli phages
Secondary structure formed of the 30 bases near the stop codon may encompass the
stop codon and consequently interfere with the interaction between stop codon and release
factors (Korostelev et al. 2008). We compiled the MFE across the mRNA sequence including
100 bases from 5’CDS and 50 bases from 3’UTR using sliding windows of 30 nt length. We
predicted that all phages should have weaker secondary structure in TTR windows (less
negative MFE) than non-TTR windows. This expectation is consistent with the data from all
E. coli phages. Secondary structure stability profile in TTR and non-TTR windows of E. coli
phage genes are shown in Figure 4.1 (B). We observed significant difference in MFE values
between TTR windows against the non-TTR windows (e.g., TTR-MFE(81to110) = -2.2644 vs
nonTTR-MFE(111to140) = -4.0304, n =12,966; Mannwhitney Paired test: p < 10-16
). Similar
significant results were also observed between four TTR windows and other non-TTR
windows in E. coli phages.

66
Figure 4.1. A) Comparison of 112 Escherichia coli phages MFE, using mRNA sliding
window analysis between TIR (-11 to 40, -1 to -30, 1 to 30 and 11 to 40 nt) and non-TIR (-
21 to 50, 21 to 150 nt, window size =30 nt, step size =10 nt) windows. B) Comparison of 112
Escherichia coli phages MFE, using mRNA sliding window analysis between TTR (71 to
100, 81 to 110 and 91 to 120 nt) and non-TTR (1 to 70 and 121 to 150 nt, window size =30
nt, step size =10 nt) windows.

67
4.4.3. Universal pattern of selection for weak structures at TIR and TTR in other phages
We performed the same analysis at initiation and termination sites across different set
of phages covering a wide range of nucleotide composition. We witnessed a uniform pattern
across 177 Mycobacterium smegmatis phages (Figure 4.2), 67 Staphylococcus aureus phages
(Figure 4.3) and 66 Pseudomonas aeruginosa phages (Figure 4.4). Universally, the TIR and
TTR windows are having significantly less negative MFE values (i.e., weaker mRNA
structures). In short, our MFE from TIR and TTR windows from all analyzed phages support
SASS hypothesis that weak structures are selected for at translation initiation and termination
site.
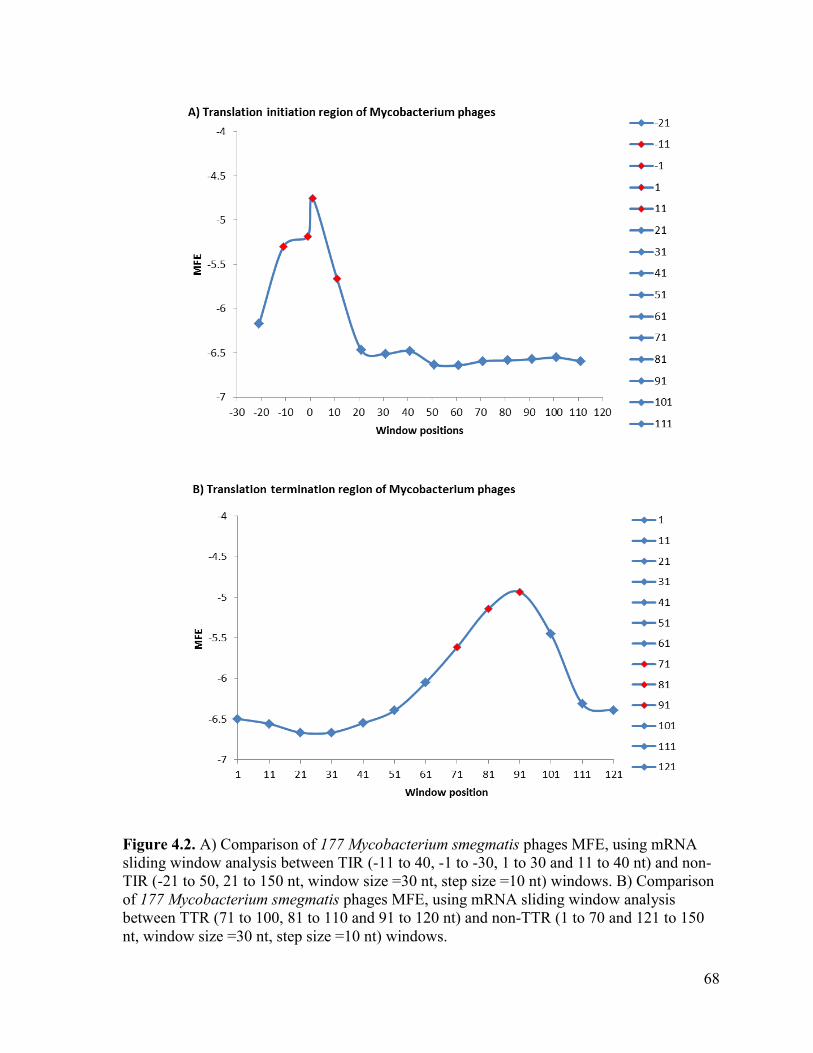
68
Figure 4.2. A) Comparison of 177 Mycobacterium smegmatis phages MFE, using mRNA
sliding window analysis between TIR (-11 to 40, -1 to -30, 1 to 30 and 11 to 40 nt) and non-
TIR (-21 to 50, 21 to 150 nt, window size =30 nt, step size =10 nt) windows. B) Comparison
of 177 Mycobacterium smegmatis phages MFE, using mRNA sliding window analysis
between TTR (71 to 100, 81 to 110 and 91 to 120 nt) and non-TTR (1 to 70 and 121 to 150
nt, window size =30 nt, step size =10 nt) windows.

69
Figure 4.3. A) Comparison of 67 Staphylococcus aureus phages MFE, using mRNA sliding
window analysis between TIR (-11 to 40, -1 to -30, 1 to 30 and 11 to 40 nt) and non-TIR (-
21 to 50, 21 to 150 nt, window size =30 nt, step size =10 nt) windows. B) Comparison of 67
Staphylococcus aureus phages MFE, using mRNA sliding window analysis between TTR
(71 to 100, 81 to 110 and 91 to 120 nt) and non-TTR (1 to 70 and 121 to 150 nt, window size
=30 nt, step size =10 nt) windows.

70
Figure 4.4. A) Comparison of 66 Pseudomonas aeruginosa phages MFE, using mRNA
sliding window analysis between TIR (-11 to 40, -1 to -30, 1 to 30 and 11 to 40 nt) and non-
TIR (-21 to 50, 21 to 150 nt, window size =30 nt, step size =10 nt) windows. B) Comparison
of 66 Pseudomonas aeruginosa phages MFE, using mRNA sliding window analysis between
TTR (71 to 100, 81 to 110 and 91 to 120 nt) and non-TTR (1 to 70 and 121 to 150 nt,
window size =30 nt, step size =10 nt) windows.
71
4.5. Discussion
mRNA local secondary structures may impact many essential biological processes like
stability of mRNA (Cebe, Geiser 2006), mRNA splicing (Buratti, Baralle 2004), and
translation (de Smit, van Duin 1990; de Smit, van Duin 1994a). These local mRNA
secondary structures have been identified in 5’UTR (de Smit, van Duin 1990; Allert, Cox,
Hellinga 2010; Osterman et al. 2013), coding regions (Katz, Burge 2003; Gu, Zhou, Wilke
2010; Zhou, Wilke 2011; Seo et al. 2013) and 3’UTR (Zhang et al. 2006; Tuller et al. 2010).
Systematic analysis revealed that local mRNA secondary structures can mask the key
regulatory elements (for example the start codon, the SD sequence and stop codon) of
mRNA from ribosomes. These structures have been demonstrated to have regulatory effects
at the gene expression level (Osterman et al. 2013). In short, an mRNA with stable secondary
structures near TIR/TTR is expected to decrease protein production. On the contrary, an
mRNA with weak secondary structure may increase protein production provided it has
optimal codon usage. This implies that there should be a strong purifying selection pressure
acting against the stable secondary structures especially at the translation initiation and
termination sites.
We tested the SASS hypothesis by comparing stability of structure in translation
initiation (TIR) windows versus non-initiation (non-TIR) windows. As we predicted, TIR
windows have lower MFE (i.e., weaker secondary structure) than those in non-TIR windows
in all analyzed phage genes (Figure 4.1a – 4.4a). Reduced secondary structures has also
been observed at the beginning of start codon in prokaryotes (Rocha, Danchin, Viari 1999;
Gu, Zhou, Wilke 2010; Tuller et al. 2010), yeast (Tuller et al. 2010), other cellular organisms
like archaea, fungi, plants, birds (Gu, Zhou, Wilke 2010) and mammals (Shabalina,

72
Ogurtsov, Spiridonov 2006; Gu, Zhou, Wilke 2010), and dsDNA viruses (Zhou, Wilke
2011).
Interestingly, a study reported that the detrimental effects of stable secondary structures
concealing the RBS can be compensated by an extended SD complementarity (Olsthoorn,
Zoog, van Duin 1995). It has been postulated that an SD motif with better base pairing
potential might play a significant role in neutralizing the effect of stable structures by
unfolding them. The energy for unfolding the mRNA comes from the interaction between
SD – aSD (Studer, Joseph 2006). This suggests that tuning of secondary structure in
combination with SD sequence allows better translation of endogenous genes. However,
secondary structures in the TIR do not hamper translation all the time. Accordingly these
structures can be classified as hindering long range and non-hindering short stem loop
structures based on their effects. Hindering structures generally serve as negative regulators
of translation efficiency (Kudla et al. 2009), whereas non-hindering structures can have
neutral effect (de Smit, van Duin 1994a) or/and instrumental effect (Nivinskas et al. 1999) on
translation efficiency.
We also tested the SASS hypothesis by comparing stability of structure in translation
termination (TTR) windows versus non-termination (non-TTR) windows. Similarly, as we
predicted, phage genes at TTR windows have lower MFE (i.e., weaker secondary structure)
than those in non-TTR windows (Figure 4.1b – 4.4b). Reduced secondary structures at the
termination site have been witnessed in E. coli (Tuller et al. 2010), B. subtilis (Rocha,
Danchin, Viari 1999), yeast (Tuller et al. 2011), Drosophila melanogaster, Caenorhabditis
elegans (Li et al. 2012), mouse and human mRNAs (Shabalina, Ogurtsov, Spiridonov 2006).
Our results are consistent with their findings.

73
4.6. Conclusion
Current antibiotic treatment methods suffer from bacterium acquiring resistance.
Therefore there is a pressing need for switching to alternate treatment approaches. Phages
could be potential candidates in overcoming the above mentioned predicaments. Therefore, it
is prerequisite to gain clear insights about factors affecting phage translation fidelity and
efficiency, for their prospective biopharmaceutical applications. Our findings imply that
selection for weak secondary structures at translation initiation and termination sites are
prevalent in phages. This suggests that tuning of translation initiation in combination with
termination could maximize overall translation output by many folds.
74
5. Conclusions
Phages, like other viruses depend on their host’s (bacterial) translational machinery for
replication of their proteins. Understanding phage translation is a pre-requisite for the
application of phages to therapeutic purposes. Although phage therapy has been in existence
for more than a century now, the widespread use of phages as an alternative to antibiotics
still remains a distant reality. The main reason for this situation is the lack of detailed
understanding of the mechanisms of phage translation. While measuring translation
efficiency, previous studies on codon- anticodon adaptation failed to take the efficiency of
translation initiation into consideration. This has led to wrong conclusions. If translation
initiation is poor, increasing translation elongation will not affect protein production, i.e., it is
important assess strength of translation initiation before proceeding to study the effect of
translation elongation on overall translation efficiency.
In chapter two, we studied the factors affecting codon adaptation in E. coli phages. It is
necessary for phages to closely match the codon usage of their bacterial host in order to
maximize their translational output. However in our previous study we observed that one
group of E. coli lambdoid phages uniformly exhibited poor codon adaptation. We
hypothesized that weak translation initiation in these lambdoid phages could be responsible
for reduced selection for improving elongation efficiency in these phages. Indeed these
phages had a significantly lower proportion of SD sequences and stable secondary structures
when compared to E. coli phages with good codon adaptation. Both of these factors imply
weak translation efficiency. Our results suggest weak initiation efficiency to be the cause of
low codon adaptation in these lambdoid phages.

75
In chapter three, we studied codon adaptation in GC-rich and GC-poor Aeromonas
phages that parasitized the same GC-rich bacterial host Aeromonas salmonicida. Our results
indicate good codon usage concordance in the GC-rich phages and weak concordance in the
GC-poor Aeromonas phages. The GC-poor Aeromonas phages harbor tRNAs for codon
overused in the phage genome and underused in the host genome. In addition, our
phylogenetic analyses suggest that the presence of tRNAs in Aeromonas phages is a derived
trait. Previous studies have assessed the role of viral tRNAs, however studies on phage
encoded tRNAs are rather limited. In addition, such studies have not differentiated between
R- and Y-ending codon families while attempting to elucidate the role of phage encoded
tRNAs. This is erroneous and we have offered an explanation in chapter three. Our study is
the first to consider only Y-ending codons while studying codon anticodon adaptation in
phages.
In the final chapter, we studied the formation of mRNA secondary in a large group of
phages. Similar studies conducted previously have focused mainly on the secondary structure
formation in the 5’ end of CDS in mRNA sequence. However, our study is the first to reveal
selection for avoidance of stable secondary structures in the translation initiation region
(5’UTR and 5’ end of CDS) and the translation termination region (regions flanking stop
codon on both sides) in a comprehensive phage dataset. Our results revealed strong selection
in favour of avoidance of stable secondary structures in both these areas. These findings
suggest that phages have evolved a pattern for avoidance of stable secondary structures at
important sites of translation in order to preserve their translation efficiency.

76
6. References
Abedon, ST, SJ Kuhl, BG Blasdel, EM Kutter. 2011. Phage treatment of human infections.
Bacteriophage 1:66-85.
Ackermann, HW, C Dauguet, WD Paterson, M Popoff, MA Rouf, JF Vieu. 1985.
Aeromonas bacteriophages:Reexamination and classification. Annales de l'Institut
Pasteur / Virologie 136:175-199.
Akashi, H. 1994. Synonymous codon usage in Drosophila melanogaster: natural selection
and translational accuracy. Genetics 136:927-935.
Allert, M, JC Cox, HW Hellinga. 2010. Multifactorial determinants of protein expression in
prokaryotic open reading frames. J Mol Biol 402:905-918.
Bahir, I, M Fromer, Y Prat, M Linial. 2009. Viral adaptation to host: a proteome-based
analysis of codon usage and amino acid preferences. Mol Syst Biol 5:311.
Bailly-Bechet, M, M Vergassola, E Rocha. 2007. Causes for the intriguing presence of
tRNAs in phages. Genome Res 17:1486-1495.
Ban, N, P Nissen, J Hansen, PB Moore, TA Steitz. 2000. The complete atomic structure of
the large ribosomal subunit at 2.4 A resolution. Science 289:905-920.
Barrick, D, K Villanueba, J Childs, R Kalil, TD Schneider, CE Lawrence, L Gold, GD
Stormo. 1994. Quantitative analysis of ribosome binding sites in E.coli. Nucleic
Acids Res 22:1287-1295.
Beletskii, A, AS Bhagwat. 1996. Transcription-induced mutations: increase in C to T
mutations in the nontranscribed strand during transcription in Escherichia coli. Proc
Natl Acad Sci U S A 93:13919-13924.
Bennetzen, JL, BD Hall. 1982. Codon selection in yeast. J Biol Chem 257:3026-3031.
Bernardi, G. 1986. Compositional constraints and genome evolution. J Mol Evol 24:1-11.
Bulmer, M. 1987. Coevolution of codon usage and transfer RNA abundance. Nature
325:728-730.
Buratti, E, FE Baralle. 2004. Influence of RNA secondary structure on the pre-mRNA
splicing process. Mol Cell Biol 24:10505-10514.
Burrowes, B, DR Harper, J Anderson, M McConville, MC Enright. 2011. Bacteriophage
therapy: potential uses in the control of antibiotic-resistant pathogens. Expert Rev
Anti Infect Ther 9:775-785.
Campbell, A. 2003. The future of bacteriophage biology. Nat Rev Genet 4:471-477.
Carbone, A. 2008. Codon bias is a major factor explaining phage evolution in translationally
biased hosts. J Mol Evol 66:210-223.
Carter, AP, WM Clemons, Jr., DE Brodersen, RJ Morgan-Warren, T Hartsch, BT Wimberly,
V Ramakrishnan. 2001. Crystal structure of an initiation factor bound to the 30S
ribosomal subunit. Science 291:498-501.
Cebe, R, M Geiser. 2006. Rapid and easy thermodynamic optimization of the 5'-end of
mRNA dramatically increases the level of wild type protein expression in Escherichia
coli. Protein Expr Purif 45:374-380.
Chan, PP, TM Lowe. 2009. GtRNAdb: a database of transfer RNA genes detected in
genomic sequence. Nucleic Acids Res 37:D93-97.

77
Chen, H, M Bjerknes, R Kumar, E Jay. 1994. Determination of the optimal aligned spacing
between the Shine-Dalgarno sequence and the translation initiation codon of
Escherichia coli mRNAs. Nucleic Acids Res 22:4953-4957.
Chithambaram, S, R Prabhakaran, X Xia. 2014a. Differential codon adaptation between
dsDNA and ssDNA phages in Escherichia coli. Mol Biol Evol 31:1606-1617.
Chithambaram, S, R Prabhakaran, X Xia. 2014b. The effect of mutation and selection on
codon adaptation in Escherichia coli bacteriophage. Genetics 197:301-315.
Coghlan, A, KH Wolfe. 2000. Relationship of codon bias to mRNA concentration and
protein length in Saccharomyces cerevisiae. Yeast 16:1131-1145.
Comeron, JM, M Aguade. 1998. An evaluation of measures of synonymous codon usage
bias. Journal of Molecular Evolution 47:268-274.
Craigen, WJ, CC Lee, CT Caskey. 1990. Recent advances in peptide chain termination. Mol
Microbiol 4:861-865.
Danelishvili, L, LS Young, LE Bermudez. 2006. In vivo efficacy of phage therapy for
Mycobacterium avium infection as delivered by a nonvirulent mycobacterium.
Microb Drug Resist 12:1-6.
de Smit, MH, J van Duin. 1990. Secondary structure of the ribosome binding site determines
translational efficiency: a quantitative analysis. Proceedings of the National Academy
of Sciences of the United States of America 87:7668-7672.
de Smit, MH, J van Duin. 1994a. Control of translation by mRNA secondary structure in
Escherichia coli. A quantitative analysis of literature data. J Mol Biol 244:144-150.
de Smit, MH, J van Duin. 1994b. Translational initiation on structured messengers. Another
role for the Shine-Dalgarno interaction. J Mol Biol 235:173-184.
Dickerman, HW, E Steers, Jr., BG Redfield, H Weissbach. 1967. Methionyl soluble
ribonucleic acid transformylase. I. Purification and partial characterization. J Biol
Chem 242:1522-1525.
Diwa, A, AL Bricker, C Jain, JG Belasco. 2000. An evolutionarily conserved RNA stem-
loop functions as a sensor that directs feedback regulation of RNase E gene
expression. Genes Dev 14:1249-1260.
dos Reis, M, R Savva, L Wernisch. 2004. Solving the riddle of codon usage preferences: a
test for translational selection. Nucleic Acids Res 32:5036-5044.
Dreyfus, M. 1988. What constitutes the signal for the initiation of protein synthesis on
Escherichia coli mRNAs? J Mol Biol 204:79-94.
Duret, L. 2000. tRNA gene number and codon usage in the C. elegans genome are co-
adapted for optimal translation of highly expressed genes. Trends Genet 16:287-289.
Duret, L, D Mouchiroud. 1999. Expression pattern and, surprisingly, gene length shape
codon usage in Caenorhabditis, Drosophila, and Arabidopsis. Proceedings of the
National Academy of Sciences of the United States of America 96:4482-4487.
Eyre-Walker, A. 1996. Synonymous codon bias is related to gene length in Escherichia coli:
selection for translational accuracy? Mol Biol Evol 13:864-872.
Fargo, DC, M Zhang, NW Gillham, JE Boynton. 1998. Shine-Dalgarno-like sequences are
not required for translation of chloroplast mRNAs in Chlamydomonas reinhardtii
chloroplasts or in Escherichia coli. Molecular & General Genetics 257:271-282.
Felsenstein, J. 1985. Phylogenies and the comparative method. Amer. Nat. 125: 1-15.
Freistroffer, DV, MY Pavlov, J MacDougall, RH Buckingham, M Ehrenberg. 1997. Release
factor RF3 in E.coli accelerates the dissociation of release factors RF1 and RF2 from
the ribosome in a GTP-dependent manner. EMBO J 16:4126-4133.

78
Giliberti, J, S O'Donnell, WJ Etten, GR Janssen. 2012. A 5'-terminal phosphate is required
for stable ternary complex formation and translation of leaderless mRNA in
Escherichia coli. RNA 18:508-518.
Grantham, R, C Gautier, M Gouy, R Mercier, A Pave. 1980. Codon catalog usage and the
genome hypothesis. Nucleic Acids Res 8:r49-r62.
Greenbaum, BD, AJ Levine, G Bhanot, R Rabadan. 2008. Patterns of evolution and host
gene mimicry in influenza and other RNA viruses. PLoS Pathog 4:e1000079.
Grosjean, H, W Fiers. 1982. Preferential codon usage in prokaryotic genes: the optimal
codon-anticodon interaction energy and the selective codon usage in efficiently
expressed genes. Gene 18:199-209.
Grosjean, H, D Sankoff, WM Jou, W Fiers, RJ Cedergren. 1978. Bacteriophage MS2 RNA: a
correlation between the stability of the codon: anticodon interaction and the choice of
code words. J Mol Evol 12:113-119.
Gu, W, T Zhou, CO Wilke. 2010. A universal trend of reduced mRNA stability near the
translation-initiation site in prokaryotes and eukaryotes. PLoS Comput Biol
6:e1000664.
Guenneugues, M, E Caserta, L Brandi, R Spurio, S Meunier, CL Pon, R Boelens, CO
Gualerzi. 2000. Mapping the fMet-tRNA(f)(Met) binding site of initiation factor IF2.
EMBO J 19:5233-5240.
Haas, J, E-C Park, B Seed. 1996. Codon usage limitation in the expression of HIV-1
envelope glycoprotein. Current Biology 6:315-324.
Hartz, D, J Binkley, T Hollingsworth, L Gold. 1990. Domains of initiator tRNA and
initiation codon crucial for initiator tRNA selection by Escherichia coli IF3. Genes
Dev 4:1790-1800.
Hartz, D, DS McPheeters, L Gold. 1991. Influence of mRNA determinants on translation
initiation in Escherichia coli. J Mol Biol 218:83-97.
Hirokawa, G, MC Kiel, A Muto, M Selmer, VS Raj, A Liljas, K Igarashi, H Kaji, A Kaji.
2002. Post-termination complex disassembly by ribosome recycling factor, a
functional tRNA mimic. EMBO J 21:2272-2281.
Hofacker, IL. 2003. Vienna RNA secondary structure server. Nucleic Acids Res 31:3429-
3431.
Hui, A, HA de Boer. 1987. Specialized ribosome system: preferential translation of a single
mRNA species by a subpopulation of mutated ribosomes in Escherichia coli. Proc
Natl Acad Sci U S A 84:4762-4766.
Ikemura, T. 1981a. Correlation between the abundance of Escherichia coli transfer RNAs
and the occurrence of the respective codons in its protein genes. Journal of Molecular
Biology 146:1-21.
Ikemura, T. 1981b. Correlation between the abundance of Escherichia coli transfer RNAs
and the occurrence of the respective codons in its protein genes: a proposal for a
synonymous codon choice that is optimal for the E. coli translational system. J Mol
Biol 151:389-409.
Ikemura, T. 1982. Correlation between the abundance of yeast transfer RNAs and the
occurrence of the respective codons in protein genes. Differences in synonymous
codon choice patterns of yeast and Escherichia coli with reference to the abundance
of isoaccepting transfer RNAs. J Mol Biol 158:573-597.
Ikemura, T. 1985. Codon usage and tRNA content in unicellular and multicellular organisms.
Mol Biol Evol 2:13-34.

79
Ikemura, T. 1992. Correlation between codon usage and tRNA content in microorganisms.
In: DL Hatfield, BJ Lee, RM Pirtle, editors. Transfer RNA in protein synthesis. Boca
Raton: CRC Press. p. 87-111.
J. Oliveira, FC, A. Cunha,M. J. Pereira 2012. Bacteriophage therapy as a bacterial control
strategy in aquaculture. Aquaculture International 20:879-910.
Kaminishi, T, DN Wilson, C Takemoto, JM Harms, M Kawazoe, F Schluenzen, K Hanawa-
Suetsugu, M Shirouzu, P Fucini, S Yokoyama. 2007. A snapshot of the 30S
ribosomal subunit capturing mRNA via the Shine-Dalgarno interaction. Structure
15:289-297.
Kanaya, S, Y Yamada, Y Kudo, T Ikemura. 1999. Studies of codon usage and tRNA genes
of 18 unicellular organisms and quantification of Bacillus subtilis tRNAs: gene
expression level and species-specific diversity of codon usage based on multivariate
analysis. Gene 238:143-155.
Karimi, R, MY Pavlov, RH Buckingham, M Ehrenberg. 1999. Novel roles for classical
factors at the interface between translation termination and initiation. Mol Cell 3:601-
609.
Katz, L, CB Burge. 2003. Widespread selection for local RNA secondary structure in coding
regions of bacterial genes. Genome Res 13:2042-2051.
Kim, JH, JS Son, CH Choresca, SP Shin, JE Han, JW Jun, DH Kang, C Oh, SJ Heo, SC
Park. 2012. Complete genome sequence of bacteriophage phiAS7, a T7-like virus
that infects Aeromonas salmonicida subsp. salmonicida. J Virol 86:2894-2895.
Komarova, AV, LS Tchufistova, EV Supina, IV Boni. 2002. Protein S1 counteracts the
inhibitory effect of the extended Shine-Dalgarno sequence on translation. RNA
8:1137-1147.
Korostelev, A, H Asahara, L Lancaster, M Laurberg, A Hirschi, J Zhu, S Trakhanov, WG
Scott, HF Noller. 2008. Crystal structure of a translation termination complex formed
with release factor RF2. Proc Natl Acad Sci U S A 105:19684-19689.
Krishnan, KM, WJ Van Etten, 3rd, GR Janssen. 2010. Proximity of the start codon to a
leaderless mRNA's 5' terminus is a strong positive determinant of ribosome binding
and expression in Escherichia coli. J Bacteriol 192:6482-6485.
Kudla, G, AW Murray, D Tollervey, JB Plotkin. 2009. Coding-sequence determinants of
gene expression in Escherichia coli. Science 324:255-258.
Kunisawa, T. 1992. Synonymous codon preferences in bacteriophage T4: a distinctive use of
transfer RNAs from T4 and from its host Escherichia coli. J Theor Biol 159:287-298.
Laurberg, M, H Asahara, A Korostelev, J Zhu, S Trakhanov, HF Noller. 2008. Structural
basis for translation termination on the 70S ribosome. Nature 454:852-857.
Laursen, BS, HP Sorensen, KK Mortensen, HU Sperling-Petersen. 2005. Initiation of protein
synthesis in bacteria. Microbiol Mol Biol Rev 69:101-123.
Li, F, Q Zheng, P Ryvkin, et al. 2012. Global analysis of RNA secondary structure in two
metazoans. Cell Rep 1:69-82.
Li, M, Q Hu, J Xuan, D Deng, M Weng. 2003. lambdaN gene expression regulated by
translation termination in ribosome L24 mutant. Sci China C Life Sci 46:127-134.
Lim, VI. 1994. Analysis of action of wobble nucleoside modifications on codon-anticodon
pairing within the ribosome. J Mol Biol 240:8-19.
Limor-Waisberg, K, A Carmi, A Scherz, Y Pilpel, I Furman. 2011. Specialization versus
adaptation: two strategies employed by cyanophages to enhance their translation
efficiencies. Nucleic Acids Res 39:6016-6028.
80
Lobry, JR. 1996. Asymmetric substitution patterns in the two DNA strands of bacteria. Mol
Biol Evol 13:660-665.
Lobry, JR, N Sueoka. 2002. Asymmetric directional mutation pressures in bacteria. Genome
Biol 3:RESEARCH0058.
Lowe, TM, SR Eddy. 1997. tRNAscan-SE: a program for improved detection of transfer
RNA genes in genomic sequence. Nucleic Acids Res 25:955-964.
Lucks, JB, DR Nelson, GR Kudla, JB Plotkin. 2008. Genome landscapes and bacteriophage
codon usage. PLoS Comput Biol 4:e1000001.
Ma, J, A Campbell, S Karlin. 2002. Correlations between Shine-Dalgarno sequences and
gene features such as predicted expression levels and operon structures. J Bacteriol
184:5733-5745.
Marin, A, X Xia. 2008. GC skew in protein-coding genes between the leading and lagging
strands in bacterial genomes: new substitution models incorporating strand bias. J
Theor Biol 253:508-513.
Markham, NR, M Zuker. 2005. DINAMelt web server for nucleic acid melting prediction.
Nucleic Acids Res 33:W577-581.
McVay, CS, M Velasquez, JA Fralick. 2007. Phage therapy of Pseudomonas aeruginosa
infection in a mouse burn wound model. Antimicrob Agents Chemother 51:1934-
1938.
Melancon, P, D Leclerc, N Destroismaisons, L Brakier-Gingras. 1990. The anti-Shine-
Dalgarno region in Escherichia coli 16S ribosomal RNA is not essential for the
correct selection of translational starts. Biochemistry 29:3402-3407.
Milon, P, M Carotti, AL Konevega, W Wintermeyer, MV Rodnina, CO Gualerzi. 2010. The
ribosome-bound initiation factor 2 recruits initiator tRNA to the 30S initiation
complex. EMBO Rep 11:312-316.
Milon, P, AL Konevega, CO Gualerzi, MV Rodnina. 2008. Kinetic checkpoint at a late step
in translation initiation. Mol Cell 30:712-720.
Milon, P, C Maracci, L Filonava, CO Gualerzi, MV Rodnina. 2012. Real-time assembly
landscape of bacterial 30S translation initiation complex. Nat Struct Mol Biol 19:609-
615.
Milon, P, MV Rodnina. 2012. Kinetic control of translation initiation in bacteria. Crit Rev
Biochem Mol Biol 47:334-348.
Muto, A, S Osawa. 1987. The guanine and cytosine content of genomic DNA and bacterial
evolution. Proc Natl Acad Sci U S A 84:166-169.
Na, D, D Lee. 2010. RBSDesigner: software for designing synthetic ribosome binding sites
that yields a desired level of protein expression. Bioinformatics 26:2633-2634.
Nakamoto, T. 2006. A unified view of the initiation of protein synthesis. Biochem Biophys
Res Commun 341:675-678.
Ngumbela, KC, KP Ryan, R Sivamurthy, MA Brockman, RT Gandhi, N Bhardwaj, DG
Kavanagh. 2008. Quantitative Effect of Suboptimal Codon Usage on Translational
Efficiency of mRNA Encoding HIV-1 gag in Intact T Cells. PLoS One 3:e2356.
Niepel, M, J Ling, DR Gallie. 1999. Secondary structure in the 5'-leader or 3'-untranslated
region reduces protein yield but does not affect the functional interaction between the
5'-cap and the poly(A) tail. FEBS Lett 462:79-84.
Nivinskas, R, N Malys, V Klausa, R Vaiskunaite, E Gineikiene. 1999. Post-transcriptional
control of bacteriophage T4 gene 25 expression: mRNA secondary structure that
enhances translational initiation. J Mol Biol 288:291-304.

81
O'Donnell, SM, GR Janssen. 2001. The initiation codon affects ribosome binding and
translational efficiency in Escherichia coli of cI mRNA with or without the 5'
untranslated leader. J Bacteriol 183:1277-1283.
O'Donnell, SM, GR Janssen. 2002. Leaderless mRNAs bind 70S ribosomes more strongly
than 30S ribosomal subunits in Escherichia coli. J Bacteriol 184:6730-6733.
Ogle, JM, DE Brodersen, WM Clemons, Jr., MJ Tarry, AP Carter, V Ramakrishnan. 2001.
Recognition of cognate transfer RNA by the 30S ribosomal subunit. Science
292:897-902.
Ohama, T, A Muto, S Osawa. 1990. Role of GC-biased mutation pressure on synonymous
codon choice in Micrococcus luteus, a bacterium with a high genomic GC-content.
Nucleic Acids Res 18:1565-1569.
Olsthoorn, RC, S Zoog, J van Duin. 1995. Coevolution of RNA helix stability and Shine-
Dalgarno complementarity in a translational start region. Mol Microbiol 15:333-339.
Osada, Y, R Saito, M Tomita. 1999. Analysis of base-pairing potentials between 16S rRNA
and 5' UTR for translation initiation in various prokaryotes. Bioinformatics 15:578-
581.
Osterman, IA, SA Evfratov, PV Sergiev, OA Dontsova. 2013. Comparison of mRNA
features affecting translation initiation and reinitiation. Nucleic Acids Res 41:474-
486.
Palidwor, GA, TJ Perkins, X Xia. 2010. A general model of codon bias due to GC mutational
bias. PLoS One 5:e13431.
Pavon-Eternod, M, A David, K Dittmar, P Berglund, T Pan, JR Bennink, JW Yewdell. 2013.
Vaccinia and influenza A viruses select rather than adjust tRNAs to optimize
translation. Nucleic Acids Res 41:1914-1921.
Percudani, R, A Pavesi, S Ottonello. 1997. Transfer RNA gene redundancy and translational
selection in Saccharomyces cerevisiae. J Mol Biol 268:322-330.
Pon, CL, CO Gualerzi. 1984. Mechanism of protein biosynthesis in prokaryotic cells. Effect
of initiation factor IF1 on the initial rate of 30 S initiation complex formation. FEBS
Lett 175:203-207.
Prabhakaran, R, S Chithambaram, X Xia. 2014. Aeromonas phages encode tRNAs for their
overused codons. Int J Comput Biol Drug Des 7:168-182.
Ramakrishnan, V. 2002. Ribosome structure and the mechanism of translation. Cell 108:557-
572.
Ringquist, S, S Shinedling, D Barrick, L Green, J Binkley, GD Stormo, L Gold. 1992.
Translation initiation in Escherichia coli: sequences within the ribosome-binding site.
Molecular Microbiology 6:1219-1229.
Robinson, M, R Lilley, S Little, JS Emtage, G Yarranton, P Stephens, A Millican, M Eaton,
G Humphreys. 1984. Codon usage can affect efficiency of translation of genes in
Escherichia coli. Nucleic Acids Res 12:6663-6671.
Rocha, EP, A Danchin, A Viari. 1999. Translation in Bacillus subtilis: roles and trends of
initiation and termination, insights from a genome analysis. Nucleic Acids Res
27:3567-3576.
Sahu, K, SK Gupta, TC Ghosh, S Sau. 2004. Synonymous codon usage analysis of the
mycobacteriophage Bxz1 and its plating bacteria M. smegmatis: identification of
highly and lowly expressed genes of Bxz1 and the possible function of its tRNA
species. J Biochem Mol Biol 37:487-492.
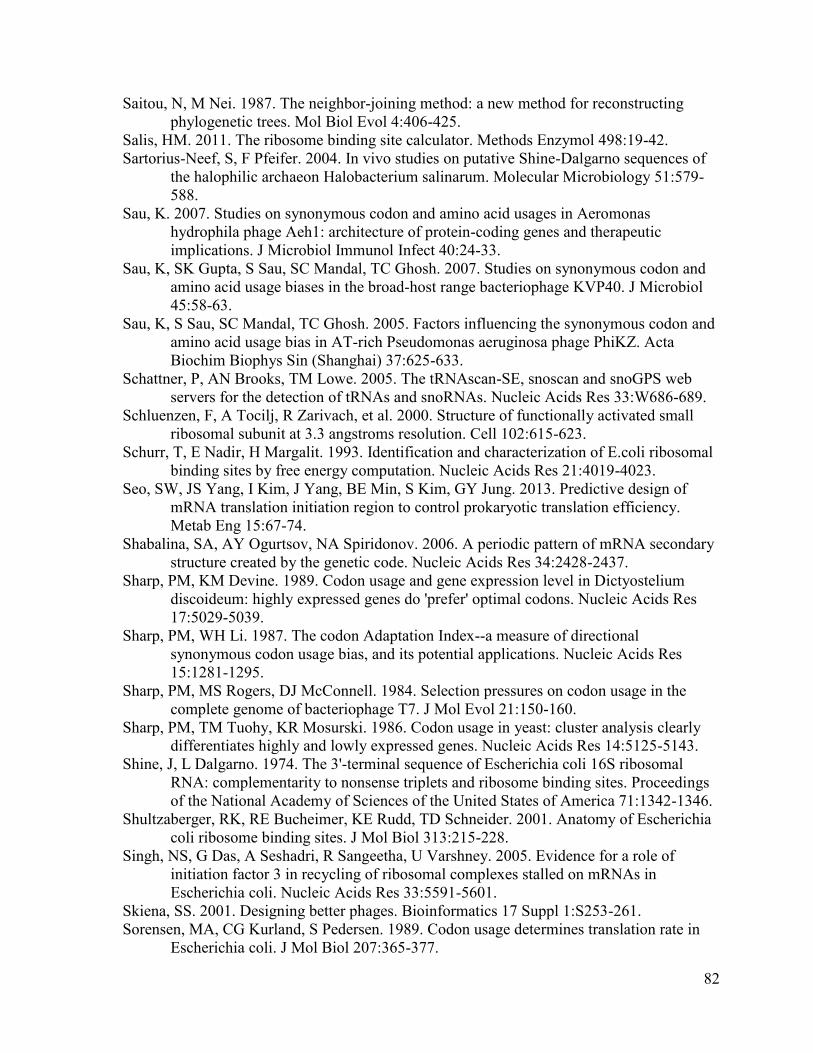
82
Saitou, N, M Nei. 1987. The neighbor-joining method: a new method for reconstructing
phylogenetic trees. Mol Biol Evol 4:406-425.
Salis, HM. 2011. The ribosome binding site calculator. Methods Enzymol 498:19-42.
Sartorius-Neef, S, F Pfeifer. 2004. In vivo studies on putative Shine-Dalgarno sequences of
the halophilic archaeon Halobacterium salinarum. Molecular Microbiology 51:579-
588.
Sau, K. 2007. Studies on synonymous codon and amino acid usages in Aeromonas
hydrophila phage Aeh1: architecture of protein-coding genes and therapeutic
implications. J Microbiol Immunol Infect 40:24-33.
Sau, K, SK Gupta, S Sau, SC Mandal, TC Ghosh. 2007. Studies on synonymous codon and
amino acid usage biases in the broad-host range bacteriophage KVP40. J Microbiol
45:58-63.
Sau, K, S Sau, SC Mandal, TC Ghosh. 2005. Factors influencing the synonymous codon and
amino acid usage bias in AT-rich Pseudomonas aeruginosa phage PhiKZ. Acta
Biochim Biophys Sin (Shanghai) 37:625-633.
Schattner, P, AN Brooks, TM Lowe. 2005. The tRNAscan-SE, snoscan and snoGPS web
servers for the detection of tRNAs and snoRNAs. Nucleic Acids Res 33:W686-689.
Schluenzen, F, A Tocilj, R Zarivach, et al. 2000. Structure of functionally activated small
ribosomal subunit at 3.3 angstroms resolution. Cell 102:615-623.
Schurr, T, E Nadir, H Margalit. 1993. Identification and characterization of E.coli ribosomal
binding sites by free energy computation. Nucleic Acids Res 21:4019-4023.
Seo, SW, JS Yang, I Kim, J Yang, BE Min, S Kim, GY Jung. 2013. Predictive design of
mRNA translation initiation region to control prokaryotic translation efficiency.
Metab Eng 15:67-74.
Shabalina, SA, AY Ogurtsov, NA Spiridonov. 2006. A periodic pattern of mRNA secondary
structure created by the genetic code. Nucleic Acids Res 34:2428-2437.
Sharp, PM, KM Devine. 1989. Codon usage and gene expression level in Dictyostelium
discoideum: highly expressed genes do 'prefer' optimal codons. Nucleic Acids Res
17:5029-5039.
Sharp, PM, WH Li. 1987. The codon Adaptation Index--a measure of directional
synonymous codon usage bias, and its potential applications. Nucleic Acids Res
15:1281-1295.
Sharp, PM, MS Rogers, DJ McConnell. 1984. Selection pressures on codon usage in the
complete genome of bacteriophage T7. J Mol Evol 21:150-160.
Sharp, PM, TM Tuohy, KR Mosurski. 1986. Codon usage in yeast: cluster analysis clearly
differentiates highly and lowly expressed genes. Nucleic Acids Res 14:5125-5143.
Shine, J, L Dalgarno. 1974. The 3'-terminal sequence of Escherichia coli 16S ribosomal
RNA: complementarity to nonsense triplets and ribosome binding sites. Proceedings
of the National Academy of Sciences of the United States of America 71:1342-1346.
Shultzaberger, RK, RE Bucheimer, KE Rudd, TD Schneider. 2001. Anatomy of Escherichia
coli ribosome binding sites. J Mol Biol 313:215-228.
Singh, NS, G Das, A Seshadri, R Sangeetha, U Varshney. 2005. Evidence for a role of
initiation factor 3 in recycling of ribosomal complexes stalled on mRNAs in
Escherichia coli. Nucleic Acids Res 33:5591-5601.
Skiena, SS. 2001. Designing better phages. Bioinformatics 17 Suppl 1:S253-261.
Sorensen, MA, CG Kurland, S Pedersen. 1989. Codon usage determines translation rate in
Escherichia coli. J Mol Biol 207:365-377.

83
Starmer, J, A Stomp, M Vouk, D Bitzer. 2006. Predicting Shine-Dalgarno sequence locations
exposes genome annotation errors. PLoS Comput Biol 2:e57.
Steitz, TA. 2008. A structural understanding of the dynamic ribosome machine. Nat Rev Mol
Cell Biol 9:242-253.
Studer, SM, S Joseph. 2006. Unfolding of mRNA secondary structure by the bacterial
translation initiation complex. Mol Cell 22:105-115.
Sueoka, N. 1988. Directional mutation pressure and neutral molecular evolution. Proc Natl
Acad Sci U S A 85:2653-2657.
Sun, X, Q Yang, X Xia. 2013. An improved implementation of effective number of codons
(nc). Mol Biol Evol 30:191-196.
Supek, F, T Smuc. 2010. On relevance of codon usage to expression of synthetic and natural
genes in Escherichia coli. Genetics 185:1129-1134.
Tamura, K, M Nei. 1993. Estimation of the number of nucleotide substitutions in the control
region of mitochondrial DNA in humans and chimpanzees. Mol Biol Evol 10:512-
526.
Tuller, T, I Veksler-Lublinsky, N Gazit, M Kupiec, E Ruppin, M Ziv-Ukelson. 2011.
Composite effects of gene determinants on the translation speed and density of
ribosomes. Genome Biol 12:R110.
Tuller, T, YY Waldman, M Kupiec, E Ruppin. 2010. Translation efficiency is determined by
both codon bias and folding energy. Proc Natl Acad Sci U S A 107:3645-3650.
van Weringh, A, M Ragonnet-Cronin, E Pranckeviciene, M Pavon-Eternod, L Kleiman, X
Xia. 2011. HIV-1 modulates the tRNA pool to improve translation efficiency. Mol
Biol Evol 28:1827-1834.
Vesper, O, S Amitai, M Belitsky, K Byrgazov, AC Kaberdina, H Engelberg-Kulka, I Moll.
2011. Selective translation of leaderless mRNAs by specialized ribosomes generated
by MazF in Escherichia coli. Cell 147:147-157.
Vimberg, V, A Tats, M Remm, T Tenson. 2007. Translation initiation region sequence
preferences in Escherichia coli. BMC Mol Biol 8:100.
Woese, CR, LJ Magrum, R Gupta, et al. 1980. Secondary structure model for bacterial 16S
ribosomal RNA: phylogenetic, enzymatic and chemical evidence. Nucleic Acids Res
8:2275-2293.
Woo, PC, BH Wong, Y Huang, SK Lau, KY Yuen. 2007. Cytosine deamination and
selection of CpG suppressed clones are the two major independent biological forces
that shape codon usage bias in coronaviruses. Virology 369:431-442.
Wright, F. 1990. The 'effective number of codons' used in a gene. Gene 87:23-29.
Wu, XQ, UL RajBhandary. 1997. Effect of the amino acid attached to Escherichia coli
initiator tRNA on its affinity for the initiation factor IF2 and on the IF2 dependence
of its binding to the ribosome. J Biol Chem 272:1891-1895.
Xia, X. 1996. Maximizing transcription efficiency causes codon usage bias. Genetics
144:1309-1320.
Xia, X. 1998. How optimized is the translational machinery in Escherichia coli, Salmonella
typhimurium and Saccharomyces cerevisiae? Genetics 149:37-44.
Xia, X. 2005a. Content sensors based on codon structure and dna methylation for gene
finding in vertebrate genomes. in N. Kolchanov and R. Hofestadt (eds)
Bioinformatics of Genome Regulation And Structure II. Springer Science+Business
Media, Inc. p. Pp. 21-29.

84
Xia, X. 2005b. Mutation and selection on the anticodon of tRNA genes in vertebrate
mitochondrial genomes. Gene 345:13-20.
Xia, X. 2007. An improved implementation of codon adaptation index. Evol Bioinform
Online 3:53-58.
Xia, X. 2008. The cost of wobble translation in fungal mitochondrial genomes: integration of
two traditional hypotheses. BMC Evol Biol 8:211.
Xia, X. 2012a. DNA replication and strand asymmetry in prokaryotic and mitochondrial
genomes. Current Genomics 13:16-27.
Xia, X. 2012b. Position Weight Matrix, Gibbs Sampler, and the Associated Significance
Tests in Motif Characterization and Prediction. Scientifica 2012: Article ID 917540,
15 pages.
Xia, X. 2012c. Rapid evolution of animal mitochondria. In: RS Singh, J Xu, RJ Kulathinal,
editors. Evolution in the fast lane: Rapidly evolving genes and genetic systems.
Oxford: Oxford University Press. p. 73-82
Xia, X. 2013a. Comparative genomics.: Springer.
Xia, X. 2013b. DAMBE5: a comprehensive software package for data analysis in molecular
biology and evolution. Mol Biol Evol 30:1720-1728.
Xia, X. 2014. A new codon index resolves a major controversy in codon-anticodon
adaptation. Genetics (in press).
Xia, X, M Holcik. 2009. Strong Eukaryotic IRESs Have Weak Secondary Structure. PLoS
One 4:e4136.
Xia, X, H Huang, M Carullo, E Betran, EN Moriyama. 2007. Conflict between Translation
Initiation and Elongation in Vertebrate Mitochondrial Genomes. PLoS One 2:e227.
Xia, X, V MacKay, X Yao, J Wu, F Miura, T Ito, DR Morris. 2011. Translation Initiation: A
Regulatory Role for Poly(A) Tracts in Front of the AUG Codon in Saccharomyces
cerevisiae. Genetics 189:469-478.
Yassin, A, K Fredrick, AS Mankin. 2005. Deleterious mutations in small subunit ribosomal
RNA identify functional sites and potential targets for antibiotics. Proceedings of the
National Academy of Sciences of the United States of America 102:16620-16625.
Yusupov, MM, GZ Yusupova, A Baucom, K Lieberman, TN Earnest, JH Cate, HF Noller.
2001. Crystal structure of the ribosome at 5.5 A resolution. Science 292:883-896.
Zavialov, AV, L Mora, RH Buckingham, M Ehrenberg. 2002. Release of peptide promoted
by the GGQ motif of class 1 release factors regulates the GTPase activity of RF3.
Mol Cell 10:789-798.
Zhang, S, E Goldman, G Zubay. 1994. Clustering of low usage codons and ribosome
movement. J Theor Biol 170:339-354.
Zhang, W, W Xiao, H Wei, J Zhang, Z Tian. 2006. mRNA secondary structure at start AUG
codon is a key limiting factor for human protein expression in Escherichia coli.
Biochem Biophys Res Commun 349:69-78.
Zhou, T, CO Wilke. 2011. Reduced stability of mRNA secondary structure near the
translation-initiation site in dsDNA viruses. BMC Evol Biol 11:59.
Zuker, M. 2003. Mfold web server for nucleic acid folding and hybridization prediction.
Nucleic Acids Res 31:3406-3415.

85
7. Supplemental Tables
Table A. Genome details of CladeA and Clade B E. coli phages
Node PhageFam PhageName Phageaccession GenomeLen NumCDS MeanITE
A Podoviridae Enterobacteria phage 13a NC_011045 38841 55 0.7365
A Podoviridae Enterobacteria phage EcoDS1 NC_011042 39252 53 0.7513
A Podoviridae Enterobacteria phage K1-5 NC_008152 44385 52 0.7203
A Podoviridae Enterobacteria phage K1E NC_007637 45251 62 0.7121
A Podoviridae Enterobacteria phage K1F NC_007456 39704 43 0.7510
A Podoviridae Enterobacteria phage T3 NC_003298 38208 55 0.7430
A Podoviridae Enterobacteria phage T7 NC_001604 39937 60 0.7433
A Podoviridae Enterobacteria phage BA14 NC_011040 39816 52 0.7529
B Myoviridae Enterobacteria phage phiP27 NC_003356 42575 58 0.6993
B Myoviridae Enterobacteria phage SfV NC_003444 37074 53 0.7145
B Podoviridae Enterobacteria phage 933W NC_000924 61670 80 0.7144
B Podoviridae Enterobacteria phage Min27 NC_010237 63395 83 0.7159
B Podoviridae Enterobacteria phage VT2-Sakai NC_000902 60942 83 0.7124
B Podoviridae Stx2 converting phage I NC_003525 61765 166 0.7067
B Siphoviridae Enterobacteria phage BP-4795 NC_004813 57930 85 0.7102
B Siphoviridae Enterobacteria phage cdtI NC_009514 47021 60 0.7017
B Siphoviridae Enterobacteria phage HK022 NC_002166 40751 57 0.7170
B Siphoviridae Enterobacteria phage HK97 NC_002167 39732 61 0.7187
B Siphoviridae Enterobacteria phage lambda NC_001416 48502 73 0.7118
B Siphoviridae Enterobacteria phage N15 NC_001901 46375 60 0.7177
B Siphoviridae Escherichia Stx1 converting bacteriophage NC_004913 59866 84 0.7146
B Siphoviridae Stx2 converting phage II NC_004914 62706 89 0.7180
B Siphoviridae Stx2-converting phage 1717 NC_011357 62148 77 0.7165
B Siphoviridae Stx2-converting phage 86 NC_008464 60238 81 0.7111

86
Table B. Phage genome details of E. coli, M. smegmatis, S. aureus and P. aeruginosa
Phage family Phage name Accession Genome length Host
Podoviridae Enterobacter phage IME11 NC_019423 72570 nt Escherichia coli Podoviridae Enterobacteria phage 13a NC_011045 38841 nt Escherichia coli Podoviridae Enterobacteria phage 285P NC_015249 39270 nt Escherichia coli Myoviridae Enterobacteria phage 4MG NC_022968 148567 nt Escherichia coli Podoviridae Enterobacteria phage 933W NC_000924 61670 nt Escherichia coli Siphoviridae Enterobacteria phage 9g NC_024146 56702 nt Escherichia coli Podoviridae Enterobacteria phage BA14 NC_011040 39816 nt Escherichia coli Siphoviridae Enterobacteria phage BP-4795 NC_004813 57930 nt Escherichia coli Podoviridae Enterobacteria phage Bp4 NC_024142 72605 nt Escherichia coli Myoviridae Enterobacteria phage Bp7 NC_019500 168066 nt Escherichia coli Myoviridae Enterobacteria phage CC31 NC_014662 165540 nt Escherichia coli Siphoviridae Enterobacteria phage EK99P-1 NC_024783 44332 nt Escherichia coli Siphoviridae Enterobacteria phage EPS7 NC_010583 111382 nt Escherichia coli Podoviridae Enterobacteria phage EcoDS1 NC_011042 39252 nt Escherichia coli Siphoviridae Enterobacteria phage HK022 NC_002166 40751 nt Escherichia coli Siphoviridae Enterobacteria phage HK140 NC_019710 40710 nt Escherichia coli Siphoviridae Enterobacteria phage HK225 NC_019717 45366 nt Escherichia coli Siphoviridae Enterobacteria phage HK446 NC_019714 39026 nt Escherichia coli Siphoviridae Enterobacteria phage HK578 NC_019724 43741 nt Escherichia coli Siphoviridae Enterobacteria phage HK629 NC_019711 47288 nt Escherichia coli Siphoviridae Enterobacteria phage HK630 NC_019723 47090 nt Escherichia coli Siphoviridae Enterobacteria phage HK633 NC_019719 41528 nt Escherichia coli Siphoviridae Enterobacteria phage HK97 NC_002167 39732 nt Escherichia coli Myoviridae Enterobacteria phage HX01 NC_018855 169158 nt Escherichia coli Myoviridae Enterobacteria phage IME08 NC_014260 172253 nt Escherichia coli Podoviridae Enterobacteria phage IME10 NC_019501 39646 nt Escherichia coli Siphoviridae Enterobacteria phage JK06 NC_007291 46072 nt Escherichia coli Siphoviridae Enterobacteria phage JL1 NC_019419 43457 nt Escherichia coli Myoviridae Enterobacteria phage JS10 NC_012741 171451 nt Escherichia coli
Continued on next page

87
Phage family Phage name Accession Genome length Host
Myoviridae Enterobacteria phage JS98 NC_010105 170523 nt Escherichia coli
Myoviridae Enterobacteria phage JSE NC_012740 166418 nt Escherichia coli
Podoviridae Enterobacteria phage K1-5 NC_008152 44385 nt Escherichia coli
Podoviridae Enterobacteria phage K1E NC_007637 45251 nt Escherichia coli
Podoviridae Enterobacteria phage K1F NC_007456 39704 nt Escherichia coli
Podoviridae Enterobacteria phage Min27 NC_010237 63395 nt Escherichia coli
Myoviridae Enterobacteria phage Mu NC_000929 36717 nt Escherichia coli
Siphoviridae Enterobacteria phage N15 NC_001901 46375 nt Escherichia coli
Podoviridae Enterobacteria phage NJ01 NC_018835 77448 nt Escherichia coli
Myoviridae Enterobacteria phage P1 NC_005856 94800 nt Escherichia coli
Myoviridae Enterobacteria phage P2 NC_001895 33593 nt Escherichia coli
Myoviridae Enterobacteria phage P4 NC_001609 11624 nt Escherichia coli
Tectiviridae Enterobacteria phage PRD1 NC_001421 14927 nt Escherichia coli
Myoviridae Enterobacteria phage Phi1 NC_009821 164270 nt Escherichia coli
Podoviridae Enterobacteria phage Phieco32 NC_010324 77554 nt Escherichia coli
Myoviridae Enterobacteria phage RB16 NC_014467 176788 nt Escherichia coli
Myoviridae Enterobacteria phage RB49 NC_005066 164018 nt Escherichia coli
Myoviridae Enterobacteria phage RB69 NC_004928 167560 nt Escherichia coli
Siphoviridae Enterobacteria phage RTP NC_007603 46219 nt Escherichia coli
Siphoviridae Enterobacteria phage SPC35 NC_015269 118351 nt Escherichia coli
Siphoviridae Enterobacteria phage SSL-2009a NC_012223 44899 nt Escherichia coli
Siphoviridae Enterobacteria phage T1 NC_005833 48836 nt Escherichia coli
Podoviridae Enterobacteria phage T3 NC_003298 38208 nt Escherichia coli
Myoviridae Enterobacteria phage T4 NC_000866 168903 nt Escherichia coli
Siphoviridae Enterobacteria phage T5 NC_005859 121750 nt Escherichia coli
Podoviridae Enterobacteria phage T7 NC_001604 39937 nt Escherichia coli
Siphoviridae Enterobacteria phage TLS NC_009540 49902 nt Escherichia coli
Continued on next page

88
Phage family Phage name Accession Genome length Host
Podoviridae Enterobacteria phage VT2-Sakai NC_000902 60942 nt Escherichia coli Siphoviridae Enterobacteria phage cdtI NC_009514 47021 nt Escherichia coli Myoviridae Enterobacteria phage fiAA91-ss NC_022750 33628 nt Escherichia coli Myoviridae Enterobacteria phage ime09 NC_019503 166499 nt Escherichia coli Siphoviridae Enterobacteria phage lambda NC_001416 48502 nt Escherichia coli Siphoviridae Enterobacteria phage mEp043 c-1 NC_019706 42780 nt Escherichia coli Siphoviridae Enterobacteria phage mEp235 NC_019708 37595 nt Escherichia coli Siphoviridae Enterobacteria phage mEp237 NC_019704 44375 nt Escherichia coli Siphoviridae Enterobacteria phage mEp460 NC_019716 44510 nt Escherichia coli Siphoviridae Enterobacteria phage mEpX1 NC_019709 41567 nt Escherichia coli Siphoviridae Enterobacteria phage mEpX2 NC_019705 38759 nt Escherichia coli Myoviridae Enterobacteria phage phiEcoM-GJ1 NC_010106 52975 nt Escherichia coli Myoviridae Enterobacteria phage phiP27 NC_003356 42575 nt Escherichia coli Myoviridae Enterobacteria phage vB_EcoM-FV3 NC_019517 136947 nt Escherichia coli Myoviridae Enterobacteria phage vB_EcoM-VR7 NC_014792 169285 nt Escherichia coli Myoviridae Enterobacteria phage vB_EcoM_ACG-C40 NC_019399 167396 nt Escherichia coli Podoviridae Enterobacteria phage vB_EcoP_ACG-C91 NC_019403 43731 nt Escherichia coli Siphoviridae Enterobacteria phage vB_EcoS_ACG-M12 NC_019404 46054 nt Escherichia coli Siphoviridae Enterobacteria phage vB_EcoS_Rogue1 NC_019718 45805 nt Escherichia coli Siphoviridae Enterobacterial phage mEp213 NC_019720 44120 nt Escherichia coli Siphoviridae Enterobacterial phage mEp234 NC_019715 39578 nt Escherichia coli Siphoviridae Enterobacterial phage mEp390 NC_019721 40029 nt Escherichia coli Siphoviridae Escherichia Stx1 converting phage NC_004913 59866 nt Escherichia coli Myoviridae Escherichia phage 2 JES-2013 NC_022323 136910 nt Escherichia coli Myoviridae Escherichia phage Cba120 NC_016570 157304 nt Escherichia coli Myoviridae Escherichia phage D108 NC_013594 37235 nt Escherichia coli Siphoviridae Escherichia phage HK639 NC_016158 49576 nt Escherichia coli Siphoviridae Escherichia phage HK75 NC_016160 36661 nt Escherichia coli Podoviridae Escherichia phage KBNP1711 NC_023593 76184 nt Escherichia coli Podoviridae Escherichia phage KBNP21 NC_018854 69855 nt Escherichia coli
Continued on next page
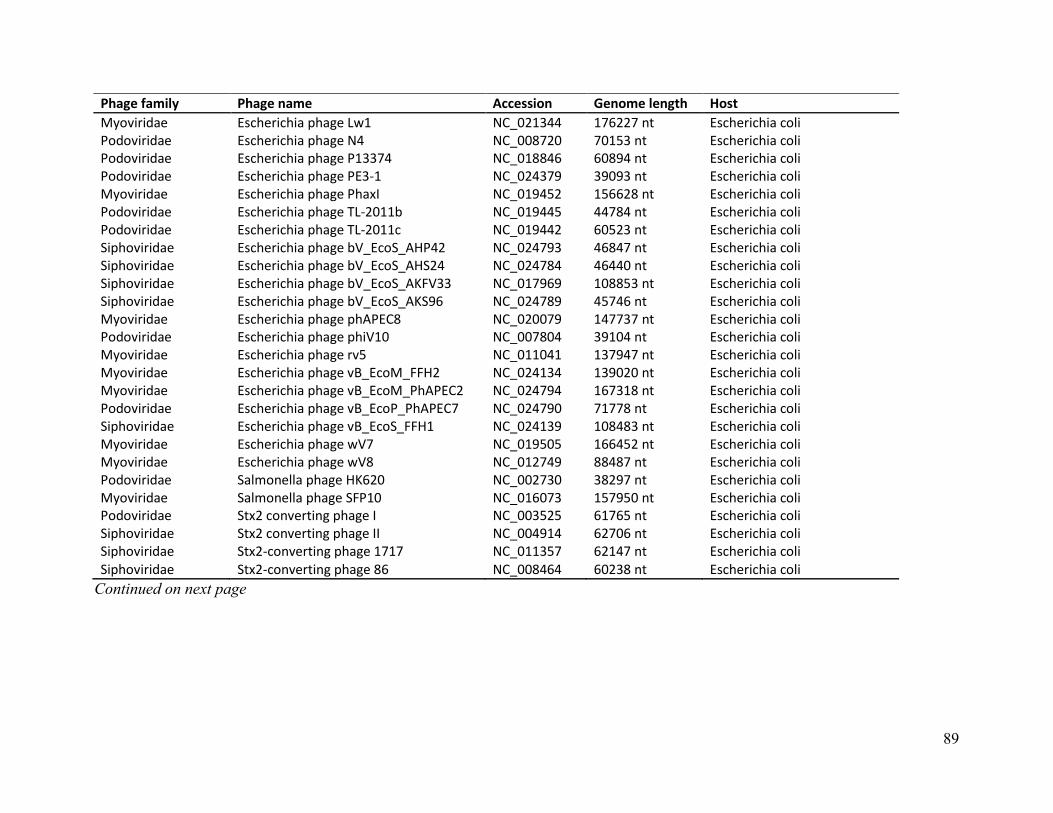
89
Phage family Phage name Accession Genome length Host
Myoviridae Escherichia phage Lw1 NC_021344 176227 nt Escherichia coli Podoviridae Escherichia phage N4 NC_008720 70153 nt Escherichia coli Podoviridae Escherichia phage P13374 NC_018846 60894 nt Escherichia coli Podoviridae Escherichia phage PE3-1 NC_024379 39093 nt Escherichia coli Myoviridae Escherichia phage PhaxI NC_019452 156628 nt Escherichia coli Podoviridae Escherichia phage TL-2011b NC_019445 44784 nt Escherichia coli Podoviridae Escherichia phage TL-2011c NC_019442 60523 nt Escherichia coli Siphoviridae Escherichia phage bV_EcoS_AHP42 NC_024793 46847 nt Escherichia coli Siphoviridae Escherichia phage bV_EcoS_AHS24 NC_024784 46440 nt Escherichia coli Siphoviridae Escherichia phage bV_EcoS_AKFV33 NC_017969 108853 nt Escherichia coli Siphoviridae Escherichia phage bV_EcoS_AKS96 NC_024789 45746 nt Escherichia coli Myoviridae Escherichia phage phAPEC8 NC_020079 147737 nt Escherichia coli Podoviridae Escherichia phage phiV10 NC_007804 39104 nt Escherichia coli Myoviridae Escherichia phage rv5 NC_011041 137947 nt Escherichia coli Myoviridae Escherichia phage vB_EcoM_FFH2 NC_024134 139020 nt Escherichia coli Myoviridae Escherichia phage vB_EcoM_PhAPEC2 NC_024794 167318 nt Escherichia coli Podoviridae Escherichia phage vB_EcoP_PhAPEC7 NC_024790 71778 nt Escherichia coli Siphoviridae Escherichia phage vB_EcoS_FFH1 NC_024139 108483 nt Escherichia coli Myoviridae Escherichia phage wV7 NC_019505 166452 nt Escherichia coli Myoviridae Escherichia phage wV8 NC_012749 88487 nt Escherichia coli Podoviridae Salmonella phage HK620 NC_002730 38297 nt Escherichia coli Myoviridae Salmonella phage SFP10 NC_016073 157950 nt Escherichia coli Podoviridae Stx2 converting phage I NC_003525 61765 nt Escherichia coli Siphoviridae Stx2 converting phage II NC_004914 62706 nt Escherichia coli Siphoviridae Stx2-converting phage 1717 NC_011357 62147 nt Escherichia coli Siphoviridae Stx2-converting phage 86 NC_008464 60238 nt Escherichia coli
Continued on next page

90
Phage family Phage name Accession Genome length Host
Siphoviridae Mycobacterium phage 20ES NC_023597 53124 nt Mycobacterium smegmatis
Siphoviridae Mycobacterium phage Acadian NC_023701 69864 nt Mycobacterium smegmatis
Siphoviridae Mycobacterium phage Adawi NC_022328 70236 nt Mycobacterium smegmatis
Siphoviridae Mycobacterium phage Adjutor NC_010763 64511 nt Mycobacterium smegmatis
Siphoviridae Mycobacterium phage Adzzy NC_022058 52519 nt Mycobacterium smegmatis
Siphoviridae Mycobacterium phage Aeneas NC_023723 53684 nt Mycobacterium smegmatis
Siphoviridae Mycobacterium phage Akoma NC_023742 68711 nt Mycobacterium smegmatis
Siphoviridae Mycobacterium phage Alma NC_023716 53177 nt Mycobacterium smegmatis
Siphoviridae Mycobacterium phage Alsfro NC_023862 52136 nt Mycobacterium smegmatis
Siphoviridae Mycobacterium phage Angel NC_012788 41441 nt Mycobacterium smegmatis
Siphoviridae Mycobacterium phage Angelica NC_014458 59598 nt Mycobacterium smegmatis
Siphoviridae Mycobacterium phage AnnaL29 NC_022087 53253 nt Mycobacterium smegmatis
Myoviridae Mycobacterium phage ArcherS7 NC_021348 156558 nt Mycobacterium smegmatis
Unknown Mycobacterium phage Ardmore NC_013936 52141 nt Mycobacterium smegmatis
Siphoviridae Mycobacterium phage Artemis2UCLA NC_022977 52344 nt Mycobacterium smegmatis
Myoviridae Mycobacterium phage Astraea NC_021349 154872 nt Mycobacterium smegmatis
Siphoviridae Mycobacterium phage Avani NC_023698 54470 nt Mycobacterium smegmatis
Siphoviridae Mycobacterium phage BPs NC_010762 41901 nt Mycobacterium smegmatis
Siphoviridae Mycobacterium phage BTCU-1 NC_021533 45942 nt Mycobacterium smegmatis
Siphoviridae Mycobacterium phage Babsiella NC_023697 48420 nt Mycobacterium smegmatis
Siphoviridae Mycobacterium phage Bane1 NC_022331 69309 nt Mycobacterium smegmatis
Siphoviridae Mycobacterium phage Bane2 NC_022327 69306 nt Mycobacterium smegmatis
Siphoviridae Mycobacterium phage BarrelRoll NC_023747 59672 nt Mycobacterium smegmatis
Siphoviridae Mycobacterium phage BellusTerra NC_023562 51236 nt Mycobacterium smegmatis
Siphoviridae Mycobacterium phage Bernal13 NC_024135 42392 nt Mycobacterium smegmatis
Siphoviridae Mycobacterium phage Bernardo NC_022983 68196 nt Mycobacterium smegmatis
Siphoviridae Mycobacterium phage BigNuz NC_023692 48984 nt Mycobacterium smegmatis
Siphoviridae Mycobacterium phage BillKnuckles NC_023739 51821 nt Mycobacterium smegmatis
Continued on next page

91
Phage family Phage name Accession Genome length Host
Siphoviridae Mycobacterium phage BillKnuckles NC_023739 51821 nt Mycobacterium smegmatis
Siphoviridae Mycobacterium phage Blue7 NC_023713 52288 nt Mycobacterium smegmatis
Siphoviridae Mycobacterium phage Bobi NC_022055 59179 nt Mycobacterium smegmatis
Siphoviridae Mycobacterium phage Breezona NC_021296 76652 nt Mycobacterium smegmatis
Siphoviridae Mycobacterium phage Bruin NC_022988 74210 nt Mycobacterium smegmatis
Siphoviridae Mycobacterium phage Brujita NC_011291 47057 nt Mycobacterium smegmatis
Siphoviridae Mycobacterium phage Bruns NC_023687 53003 nt Mycobacterium smegmatis
Siphoviridae Mycobacterium phage Butters NC_021061 41491 nt Mycobacterium smegmatis
Siphoviridae Mycobacterium phage Butterscotch NC_011286 64562 nt Mycobacterium smegmatis
Siphoviridae Mycobacterium phage Bxb1 NC_002656 50550 nt Mycobacterium smegmatis
Siphoviridae Mycobacterium phage CASbig NC_021324 53369 nt Mycobacterium smegmatis
Siphoviridae Mycobacterium phage CRB1 NC_023606 52963 nt Mycobacterium smegmatis
Siphoviridae Mycobacterium phage Catdawg NC_022057 72108 nt Mycobacterium smegmatis
Myoviridae Mycobacterium phage Catera NC_008207 153766 nt Mycobacterium smegmatis
Siphoviridae Mycobacterium phage Chah NC_011284 68450 nt Mycobacterium smegmatis
Siphoviridae Mycobacterium phage Charlie NC_023729 43036 nt Mycobacterium smegmatis
Siphoviridae Mycobacterium phage Chy4 NC_021338 46639 nt Mycobacterium smegmatis
Siphoviridae Mycobacterium phage Chy5 NC_021318 51214 nt Mycobacterium smegmatis
Siphoviridae Mycobacterium phage CloudWang3 NC_022965 52873 nt Mycobacterium smegmatis
Siphoviridae Mycobacterium phage Conspiracy NC_022973 50755 nt Mycobacterium smegmatis
Siphoviridae Mycobacterium phage Contagion NC_022065 74533 nt Mycobacterium smegmatis
Siphoviridae Mycobacterium phage Courthouse NC_023690 110569 nt Mycobacterium smegmatis
Siphoviridae Mycobacterium phage CrimD NC_014459 59798 nt Mycobacterium smegmatis
Siphoviridae Mycobacterium phage Crossroads NC_022071 76129 nt Mycobacterium smegmatis
Siphoviridae Mycobacterium phage DNAIII NC_021859 39520 nt Mycobacterium smegmatis
Siphoviridae Mycobacterium phage Daenerys NC_022068 58043 nt Mycobacterium smegmatis
Continued on next page
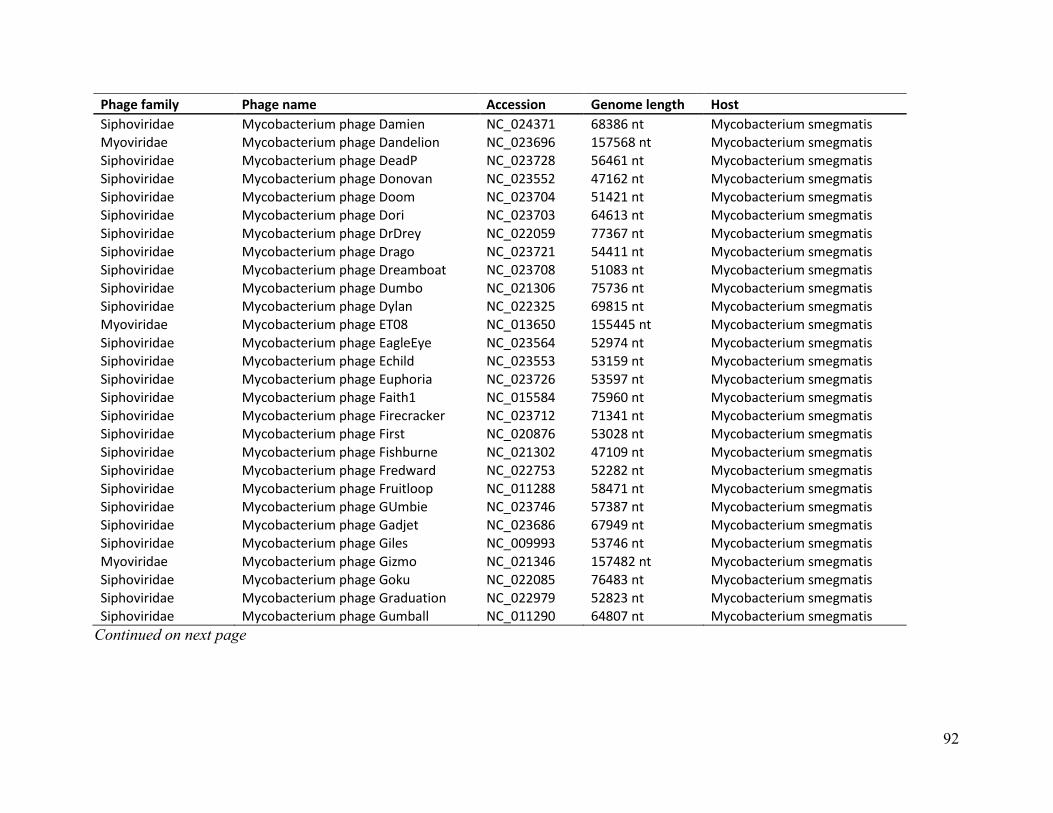
92
Phage family Phage name Accession Genome length Host
Siphoviridae Mycobacterium phage Damien NC_024371 68386 nt Mycobacterium smegmatis Myoviridae Mycobacterium phage Dandelion NC_023696 157568 nt Mycobacterium smegmatis Siphoviridae Mycobacterium phage DeadP NC_023728 56461 nt Mycobacterium smegmatis Siphoviridae Mycobacterium phage Donovan NC_023552 47162 nt Mycobacterium smegmatis Siphoviridae Mycobacterium phage Doom NC_023704 51421 nt Mycobacterium smegmatis Siphoviridae Mycobacterium phage Dori NC_023703 64613 nt Mycobacterium smegmatis
Siphoviridae Mycobacterium phage DrDrey NC_022059 77367 nt Mycobacterium smegmatis Siphoviridae Mycobacterium phage Drago NC_023721 54411 nt Mycobacterium smegmatis Siphoviridae Mycobacterium phage Dreamboat NC_023708 51083 nt Mycobacterium smegmatis Siphoviridae Mycobacterium phage Dumbo NC_021306 75736 nt Mycobacterium smegmatis Siphoviridae Mycobacterium phage Dylan NC_022325 69815 nt Mycobacterium smegmatis Myoviridae Mycobacterium phage ET08 NC_013650 155445 nt Mycobacterium smegmatis
Siphoviridae Mycobacterium phage EagleEye NC_023564 52974 nt Mycobacterium smegmatis Siphoviridae Mycobacterium phage Echild NC_023553 53159 nt Mycobacterium smegmatis Siphoviridae Mycobacterium phage Euphoria NC_023726 53597 nt Mycobacterium smegmatis Siphoviridae Mycobacterium phage Faith1 NC_015584 75960 nt Mycobacterium smegmatis Siphoviridae Mycobacterium phage Firecracker NC_023712 71341 nt Mycobacterium smegmatis Siphoviridae Mycobacterium phage First NC_020876 53028 nt Mycobacterium smegmatis Siphoviridae Mycobacterium phage Fishburne NC_021302 47109 nt Mycobacterium smegmatis Siphoviridae Mycobacterium phage Fredward NC_022753 52282 nt Mycobacterium smegmatis Siphoviridae Mycobacterium phage Fruitloop NC_011288 58471 nt Mycobacterium smegmatis Siphoviridae Mycobacterium phage GUmbie NC_023746 57387 nt Mycobacterium smegmatis Siphoviridae Mycobacterium phage Gadjet NC_023686 67949 nt Mycobacterium smegmatis Siphoviridae Mycobacterium phage Giles NC_009993 53746 nt Mycobacterium smegmatis Myoviridae Mycobacterium phage Gizmo NC_021346 157482 nt Mycobacterium smegmatis Siphoviridae Mycobacterium phage Goku NC_022085 76483 nt Mycobacterium smegmatis Siphoviridae Mycobacterium phage Graduation NC_022979 52823 nt Mycobacterium smegmatis Siphoviridae Mycobacterium phage Gumball NC_011290 64807 nt Mycobacterium smegmatis
Continued on next page

93
Phage family Phage name Accession Genome length Host
Siphoviridae Mycobacterium phage HINdeR NC_021308 52617 nt Mycobacterium smegmatis
Siphoviridae Mycobacterium phage Hamulus NC_022056 57155 nt Mycobacterium smegmatis
Siphoviridae Mycobacterium phage HanShotFirst NC_022975 52390 nt Mycobacterium smegmatis
Siphoviridae Mycobacterium phage Hawkeye NC_024209 67383 nt Mycobacterium smegmatis
Siphoviridae Mycobacterium phage HufflyPuff NC_022981 76323 nt Mycobacterium smegmatis
Siphoviridae Mycobacterium phage JAMaL NC_023554 70841 nt Mycobacterium smegmatis
Siphoviridae Mycobacterium phage Jabbawokkie NC_022069 55213 nt Mycobacterium smegmatis
Siphoviridae Mycobacterium phage JacAttac NC_023740 68311 nt Mycobacterium smegmatis
Siphoviridae Mycobacterium phage Job42 NC_021538 59626 nt Mycobacterium smegmatis
Siphoviridae Mycobacterium phage Jobu08 NC_021535 50679 nt Mycobacterium smegmatis
Siphoviridae Mycobacterium phage Jolie2 NC_023604 44306 nt Mycobacterium smegmatis
Siphoviridae Mycobacterium phage Jovo NC_022984 51319 nt Mycobacterium smegmatis
Siphoviridae Mycobacterium phage Kampy NC_024141 51378 nt Mycobacterium smegmatis
Siphoviridae Mycobacterium phage KayaCho NC_022061 70838 nt Mycobacterium smegmatis
Siphoviridae Mycobacterium phage Konstantine NC_011292 68952 nt Mycobacterium smegmatis
Siphoviridae Mycobacterium phage Kugel NC_023702 52379 nt Mycobacterium smegmatis
Siphoviridae Mycobacterium phage LHTSCC NC_023745 51813 nt Mycobacterium smegmatis
Siphoviridae Mycobacterium phage Lamina13 NC_024143 53255 nt Mycobacterium smegmatis
Siphoviridae Mycobacterium phage Larva NC_023724 62991 nt Mycobacterium smegmatis
Siphoviridae Mycobacterium phage LeBron NC_014461 73453 nt Mycobacterium smegmatis
Siphoviridae Mycobacterium phage Leo NC_021556 39981 nt Mycobacterium smegmatis
Siphoviridae Mycobacterium phage Liefie NC_023705 41650 nt Mycobacterium smegmatis
Siphoviridae Mycobacterium phage Lilac NC_023689 76260 nt Mycobacterium smegmatis
Myoviridae Mycobacterium phage LinStu NC_023714 153882 nt Mycobacterium smegmatis
Siphoviridae Mycobacterium phage LittleCherry NC_022086 50690 nt Mycobacterium smegmatis
Siphoviridae Mycobacterium phage Manad NC_024363 68807 nt Mycobacterium smegmatis
Siphoviridae Mycobacterium phage MichelleMyBell NC_023572 42240 nt Mycobacterium smegmatis
Myoviridae Mycobacterium phage MoMoMixon NC_023733 154573 nt Mycobacterium smegmatis
Continued on next page

94
Phage family Phage name Accession Genome length Host
Siphoviridae Mycobacterium phage MosMoris NC_024138 65243 nt Mycobacterium smegmatis
Siphoviridae Mycobacterium phage Muddy NC_022054 48228 nt Mycobacterium smegmatis
Siphoviridae Mycobacterium phage Murphy NC_021305 76179 nt Mycobacterium smegmatis
Myoviridae Mycobacterium phage Myrna NC_011273 164602 nt Mycobacterium smegmatis
Siphoviridae Mycobacterium phage Nala NC_022976 75894 nt Mycobacterium smegmatis
Myoviridae Mycobacterium phage Nappy NC_023725 156646 nt Mycobacterium smegmatis
Siphoviridae Mycobacterium phage Newman NC_021310 68598 nt Mycobacterium smegmatis
Siphoviridae Mycobacterium phage Nigel NC_011044 69904 nt Mycobacterium smegmatis
Siphoviridae Mycobacterium phage Nyxis NC_023565 51250 nt Mycobacterium smegmatis
Siphoviridae Mycobacterium phage Oaker NC_023578 69099 nt Mycobacterium smegmatis
Siphoviridae Mycobacterium phage Obama12 NC_023577 51797 nt Mycobacterium smegmatis
Siphoviridae Mycobacterium phage OkiRoe NC_024366 62661 nt Mycobacterium smegmatis
Siphoviridae Mycobacterium phage Oline NC_023711 68720 nt Mycobacterium smegmatis
Siphoviridae Mycobacterium phage Pacc40 NC_011287 58554 nt Mycobacterium smegmatis
Siphoviridae Mycobacterium phage Papyrus NC_022053 70657 nt Mycobacterium smegmatis
Siphoviridae Mycobacterium phage Patience NC_023691 70506 nt Mycobacterium smegmatis
Siphoviridae Mycobacterium phage PattyP NC_021297 52057 nt Mycobacterium smegmatis
Siphoviridae Mycobacterium phage Peaches NC_013694 51376 nt Mycobacterium smegmatis
Siphoviridae Mycobacterium phage PegLeg NC_021299 80955 nt Mycobacterium smegmatis
Siphoviridae Mycobacterium phage Perseus NC_023720 53142 nt Mycobacterium smegmatis
Siphoviridae Mycobacterium phage Phantastic NC_024148 50101 nt Mycobacterium smegmatis
Siphoviridae Mycobacterium phage PhatBacter NC_022969 76217 nt Mycobacterium smegmatis
Siphoviridae Mycobacterium phage Phaux NC_021311 76479 nt Mycobacterium smegmatis
Siphoviridae Mycobacterium phage Phelemich NC_022063 70115 nt Mycobacterium smegmatis
Siphoviridae Mycobacterium phage Phlyer NC_012027 69378 nt Mycobacterium smegmatis
Siphoviridae Mycobacterium phage PhrostyMug NC_022329 53636 nt Mycobacterium smegmatis
Siphoviridae Mycobacterium phage Phrux NC_021309 74711 nt Mycobacterium smegmatis
Siphoviridae Mycobacterium phage Pinto NC_024368 50610 nt Mycobacterium smegmatis
Continued on next page

95
Phage family Phage name Accession Genome length Host
Myoviridae Mycobacterium phage Pleione NC_023737 155586 nt Mycobacterium smegmatis
Siphoviridae Mycobacterium phage Predator NC_011039 70110 nt Mycobacterium smegmatis
Siphoviridae Mycobacterium phage Quink NC_022330 76586 nt Mycobacterium smegmatis
Siphoviridae Mycobacterium phage Ramsey NC_011289 58578 nt Mycobacterium smegmatis
Siphoviridae Mycobacterium phage Redi NC_023730 42594 nt Mycobacterium smegmatis
Siphoviridae Mycobacterium phage Redno2 NC_022066 108297 nt Mycobacterium smegmatis
Siphoviridae Mycobacterium phage Reprobate NC_022064 70120 nt Mycobacterium smegmatis
Siphoviridae Mycobacterium phage RhynO NC_023609 46739 nt Mycobacterium smegmatis
Unknown Mycobacterium phage RidgeCB NC_023710 50844 nt Mycobacterium smegmatis
Siphoviridae Mycobacterium phage Rumpelstiltskin NC_023732 69279 nt Mycobacterium smegmatis
Siphoviridae Mycobacterium phage SDcharge11 NC_021303 67702 nt Mycobacterium smegmatis
Siphoviridae Mycobacterium phage SG4 NC_023699 59016 nt Mycobacterium smegmatis
Siphoviridae Mycobacterium phage SWU1 NC_017973 52474 nt Mycobacterium smegmatis
Siphoviridae Mycobacterium phage Saal NC_023580 57775 nt Mycobacterium smegmatis
Siphoviridae Mycobacterium phage Sarfire NC_022324 53701 nt Mycobacterium smegmatis
Siphoviridae Mycobacterium phage SargentShorty9 NC_022326 53693 nt Mycobacterium smegmatis
Siphoviridae Mycobacterium phage Severus NC_021307 49894 nt Mycobacterium smegmatis
Siphoviridae Mycobacterium phage SiSi NC_021301 56279 nt Mycobacterium smegmatis
Siphoviridae Mycobacterium phage SkiPole NC_023748 53137 nt Mycobacterium smegmatis
Siphoviridae Mycobacterium phage Solon NC_011267 49487 nt Mycobacterium smegmatis
Siphoviridae Mycobacterium phage Stinger NC_023741 69641 nt Mycobacterium smegmatis
Siphoviridae Mycobacterium phage Suffolk NC_023563 68262 nt Mycobacterium smegmatis
Siphoviridae Mycobacterium phage Thibault NC_023738 106327 nt Mycobacterium smegmatis
Siphoviridae Mycobacterium phage Trixie NC_023731 53526 nt Mycobacterium smegmatis
Siphoviridae Mycobacterium phage Troll4 NC_011285 64618 nt Mycobacterium smegmatis
Siphoviridae Mycobacterium phage Trouble NC_022062 52102 nt Mycobacterium smegmatis
Siphoviridae Mycobacterium phage Turbido NC_023707 53169 nt Mycobacterium smegmatis
Siphoviridae Mycobacterium phage Tweety NC_009820 58692 nt Mycobacterium smegmatis
Continued on next page

96
Phage family Phage name Accession Genome length Host
Siphoviridae Mycobacterium phage Validus NC_023498 62466 nt Mycobacterium smegmatis Siphoviridae Mycobacterium phage Velveteen NC_022060 54314 nt Mycobacterium smegmatis Siphoviridae Mycobacterium phage Violet NC_023695 52481 nt Mycobacterium smegmatis Siphoviridae Mycobacterium phage Vista NC_023727 68494 nt Mycobacterium smegmatis Siphoviridae Mycobacterium phage WIVsmall NC_021334 53359 nt Mycobacterium smegmatis Siphoviridae Mycobacterium phage Wanda NC_022067 109960 nt Mycobacterium smegmatis Siphoviridae Mycobacterium phage Wee NC_014901 59230 nt Mycobacterium smegmatis Siphoviridae Mycobacterium phage Wheeler NC_022070 53588 nt Mycobacterium smegmatis Siphoviridae Mycobacterium phage Whirlwind NC_022052 76050 nt Mycobacterium smegmatis Siphoviridae Mycobacterium phage Wile NC_023709 51308 nt Mycobacterium smegmatis Siphoviridae Mycobacterium phage Zaka NC_022985 52122 nt Mycobacterium smegmatis Siphoviridae Mycobacterium phage ZoeJ NC_024147 57315 nt Mycobacterium smegmatis
Siphoviridae Staphylococcus phage 11 NC_004615 43604 nt Staphylococcus aureus Siphoviridae Staphylococcus phage 2638A NC_007051 41318 nt Staphylococcus aureus Siphoviridae Staphylococcus phage 29 NC_007061 42802 nt Staphylococcus aureus Siphoviridae Staphylococcus phage 37 NC_007055 43681 nt Staphylococcus aureus Siphoviridae Staphylococcus phage 3A NC_007053 43095 nt Staphylococcus aureus Siphoviridae Staphylococcus phage 42E NC_007052 45861 nt Staphylococcus aureus Podoviridae Staphylococcus phage 44AHJD NC_004678 16784 nt Staphylococcus aureus Siphoviridae Staphylococcus phage 47 NC_007054 44777 nt Staphylococcus aureus Siphoviridae Staphylococcus phage 52A NC_007062 41690 nt Staphylococcus aureus Siphoviridae Staphylococcus phage 53 NC_007049 43883 nt Staphylococcus aureus Siphoviridae Staphylococcus phage 55 NC_007060 41902 nt Staphylococcus aureus Podoviridae Staphylococcus phage 66 NC_007046 18199 nt Staphylococcus aureus Siphoviridae Staphylococcus phage 69 NC_007048 42732 nt Staphylococcus aureus Siphoviridae Staphylococcus phage 71 NC_007059 43114 nt Staphylococcus aureus Siphoviridae Staphylococcus phage 77 NC_005356 41708 nt Staphylococcus aureus Siphoviridae Staphylococcus phage 80alpha NC_009526 43864 nt Staphylococcus aureus Siphoviridae Staphylococcus phage 85 NC_007050 44283 nt Staphylococcus aureus Siphoviridae Staphylococcus phage 88 NC_007063 43231 nt Staphylococcus aureus Siphoviridae Staphylococcus phage 92 NC_007064 42431 nt Staphylococcus aureus
Continued on next page

97
Phage family Phage name Accession Genome length Host
Siphoviridae Staphylococcus phage 96 NC_007057 43576 nt Staphylococcus aureus Siphoviridae Staphylococcus phage EW NC_007056 45286 nt Staphylococcus aureus Myoviridae Staphylococcus phage G1 NC_007066 138715 nt Staphylococcus aureus Myoviridae Staphylococcus phage GH15 NC_019448 139806 nt Staphylococcus aureus Podoviridae Staphylococcus phage GRCS NC_023550 17869 nt Staphylococcus aureus Myoviridae Staphylococcus phage JD007 NC_019726 141836 nt Staphylococcus aureus Siphoviridae Staphylococcus phage JS01 NC_021773 43458 nt Staphylococcus aureus Podoviridae Staphylococcus phage P68 NC_004679 18227 nt Staphylococcus aureus Siphoviridae Staphylococcus phage P954 NC_013195 40761 nt Staphylococcus aureus Unknown Staphylococcus phage PT1028 NC_007045 15603 nt Staphylococcus aureus Siphoviridae Staphylococcus phage PVL NC_002321 41401 nt Staphylococcus aureus Unknown Staphylococcus phage ROSA NC_007058 43155 nt Staphylococcus aureus Podoviridae Staphylococcus phage S24-1 NC_016565 18168 nt Staphylococcus aureus Unknown Staphylococcus phage SA11 NC_019511 136326 nt Staphylococcus aureus Siphoviridae Staphylococcus phage SA12 NC_021801 42902 nt Staphylococcus aureus Siphoviridae Staphylococcus phage SA13 NC_021863 42652 nt Staphylococcus aureus Podoviridae Staphylococcus phage SAP-2 NC_009875 17938 nt Staphylococcus aureus Siphoviridae Staphylococcus phage SAP-26 NC_014460 41207 nt Staphylococcus aureus Siphoviridae Staphylococcus phage SMSAP5 NC_019513 45552 nt Staphylococcus aureus Myoviridae Staphylococcus phage Sb-1 NC_023009 127188 nt Staphylococcus aureus Siphoviridae Staphylococcus phage StauST398-1 NC_021326 45242 nt Staphylococcus aureus Siphoviridae Staphylococcus phage StauST398-2 NC_021323 45572 nt Staphylococcus aureus Siphoviridae Staphylococcus phage StauST398-3 NC_021332 41392 nt Staphylococcus aureus Siphoviridae Staphylococcus phage StauST398-4 NC_023499 42906 nt Staphylococcus aureus Siphoviridae Staphylococcus phage StauST398-5 NC_023500 43301 nt Staphylococcus aureus Siphoviridae Staphylococcus phage TEM123 NC_017968 43786 nt Staphylococcus aureus Myoviridae Staphylococcus phage Twort NC_007021 130706 nt Staphylococcus aureus Siphoviridae Staphylococcus phage X2 NC_007065 43440 nt Staphylococcus aureus Siphoviridae Staphylococcus phage YMC/09/04/R1988 NC_022758 44459 nt Staphylococcus aureus Siphoviridae Staphylococcus phage phi 12 NC_004616 44970 nt Staphylococcus aureus Siphoviridae Staphylococcus phage phi13 NC_004617 42722 nt Staphylococcus aureus
Continued on next page

98
Phage family Phage name Accession Genome length Host
Siphoviridae Staphylococcus phage phiETA NC_003288 43081 nt Staphylococcus aureus Siphoviridae Staphylococcus phage phiETA2 NC_008798 43265 nt Staphylococcus aureus Siphoviridae Staphylococcus phage phiETA3 NC_008799 43282 nt Staphylococcus aureus Siphoviridae Staphylococcus phage phiMR11 NC_010147 43011 nt Staphylococcus aureus Siphoviridae Staphylococcus phage phiMR25 NC_010808 44342 nt Staphylococcus aureus Siphoviridae Staphylococcus phage phiN315 NC_004740 44082 nt Staphylococcus aureus Siphoviridae Staphylococcus phage phiNM NC_008583 43128 nt Staphylococcus aureus Unknown Staphylococcus phage phiPVL-CN125 NC_012784 44492 nt Staphylococcus aureus Siphoviridae Staphylococcus phage phiPVL108 NC_008689 44857 nt Staphylococcus aureus Myoviridae Staphylococcus phage phiSA012 NC_023573 142094 nt Staphylococcus aureus Siphoviridae Staphylococcus phage phiSLT NC_002661 42942 nt Staphylococcus aureus Siphoviridae Staphylococcus phage phiSauS-IPLA35 NC_011612 45344 nt Staphylococcus aureus Siphoviridae Staphylococcus phage phiSauS-IPLA88 NC_011614 42526 nt Staphylococcus aureus Siphoviridae Staphylococcus phage tp310-2 NC_009762 45710 nt Staphylococcus aureus Myoviridae Staphylococcus phage vB_SauM_Remus NC_022090 134643 nt Staphylococcus aureus Myoviridae Staphylococcus phage vB_SauM_Romulus NC_020877 131332 nt Staphylococcus aureus Siphoviridae Staphylococcus prophage phiPV83 NC_002486 45636 nt Staphylococcus aureus
Podoviridae Pseudomonas phage 119X NC_007807 43365 nt Pseudomonas aeruginosa Siphoviridae Pseudomonas phage 73 NC_007806 42999 nt Pseudomonas aeruginosa Siphoviridae Pseudomonas phage B3 NC_006548 38439 nt Pseudomonas aeruginosa Myoviridae Pseudomonas phage CHA_P1 NC_022974 88255 nt Pseudomonas aeruginosa Siphoviridae Pseudomonas phage D3 NC_002484 56425 nt Pseudomonas aeruginosa Siphoviridae Pseudomonas phage D3112 NC_005178 37611 nt Pseudomonas aeruginosa Siphoviridae Pseudomonas phage DMS3 NC_008717 36415 nt Pseudomonas aeruginosa Myoviridae Pseudomonas phage EL NC_007623 211215 nt Pseudomonas aeruginosa Siphoviridae Pseudomonas phage F10 NC_007805 39199 nt Pseudomonas aeruginosa Podoviridae Pseudomonas phage F116 NC_006552 65195 nt Pseudomonas aeruginosa Myoviridae Pseudomonas phage F8 NC_007810 66015 nt Pseudomonas aeruginosa Siphoviridae Pseudomonas phage JD024 NC_024330 37380 nt Pseudomonas aeruginosa Myoviridae Pseudomonas phage JG004 NC_019450 93017 nt Pseudomonas aeruginosa Myoviridae Pseudomonas phage JG024 NC_017674 66275 nt Pseudomonas aeruginosa
Continued on next page
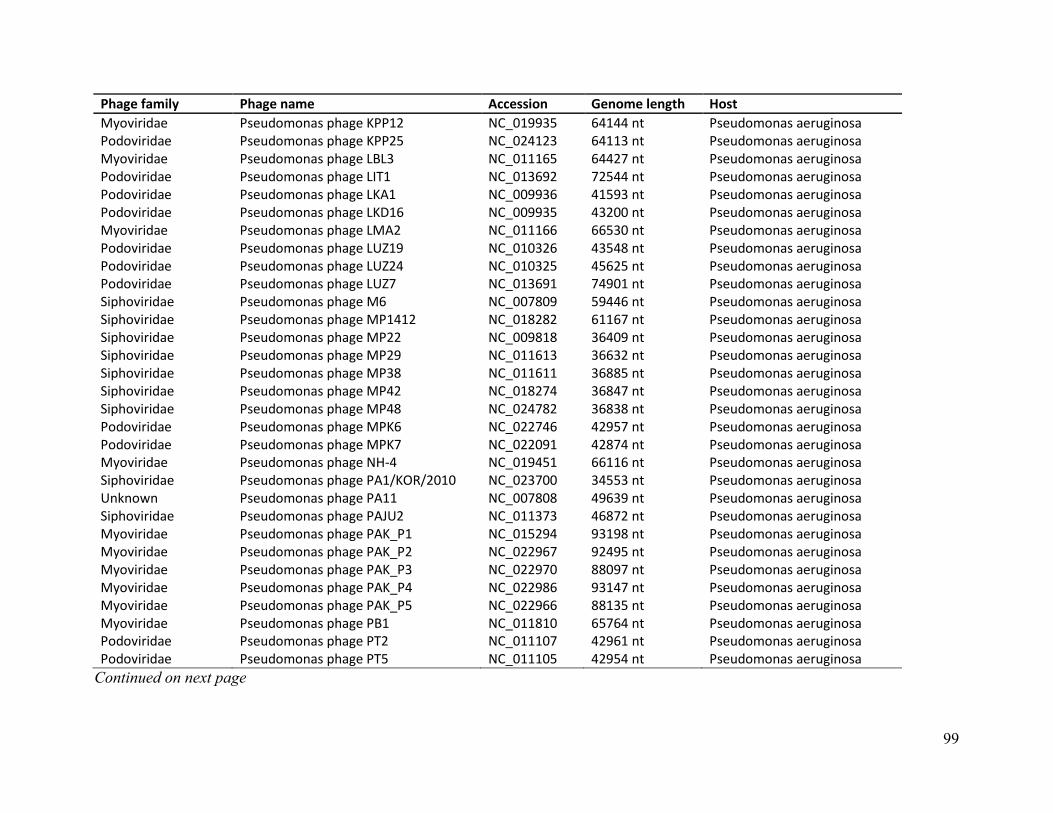
99
Phage family Phage name Accession Genome length Host
Myoviridae Pseudomonas phage KPP12 NC_019935 64144 nt Pseudomonas aeruginosa Podoviridae Pseudomonas phage KPP25 NC_024123 64113 nt Pseudomonas aeruginosa Myoviridae Pseudomonas phage LBL3 NC_011165 64427 nt Pseudomonas aeruginosa Podoviridae Pseudomonas phage LIT1 NC_013692 72544 nt Pseudomonas aeruginosa Podoviridae Pseudomonas phage LKA1 NC_009936 41593 nt Pseudomonas aeruginosa Podoviridae Pseudomonas phage LKD16 NC_009935 43200 nt Pseudomonas aeruginosa Myoviridae Pseudomonas phage LMA2 NC_011166 66530 nt Pseudomonas aeruginosa Podoviridae Pseudomonas phage LUZ19 NC_010326 43548 nt Pseudomonas aeruginosa Podoviridae Pseudomonas phage LUZ24 NC_010325 45625 nt Pseudomonas aeruginosa Podoviridae Pseudomonas phage LUZ7 NC_013691 74901 nt Pseudomonas aeruginosa Siphoviridae Pseudomonas phage M6 NC_007809 59446 nt Pseudomonas aeruginosa Siphoviridae Pseudomonas phage MP1412 NC_018282 61167 nt Pseudomonas aeruginosa Siphoviridae Pseudomonas phage MP22 NC_009818 36409 nt Pseudomonas aeruginosa Siphoviridae Pseudomonas phage MP29 NC_011613 36632 nt Pseudomonas aeruginosa Siphoviridae Pseudomonas phage MP38 NC_011611 36885 nt Pseudomonas aeruginosa Siphoviridae Pseudomonas phage MP42 NC_018274 36847 nt Pseudomonas aeruginosa Siphoviridae Pseudomonas phage MP48 NC_024782 36838 nt Pseudomonas aeruginosa Podoviridae Pseudomonas phage MPK6 NC_022746 42957 nt Pseudomonas aeruginosa Podoviridae Pseudomonas phage MPK7 NC_022091 42874 nt Pseudomonas aeruginosa Myoviridae Pseudomonas phage NH-4 NC_019451 66116 nt Pseudomonas aeruginosa Siphoviridae Pseudomonas phage PA1/KOR/2010 NC_023700 34553 nt Pseudomonas aeruginosa Unknown Pseudomonas phage PA11 NC_007808 49639 nt Pseudomonas aeruginosa Siphoviridae Pseudomonas phage PAJU2 NC_011373 46872 nt Pseudomonas aeruginosa Myoviridae Pseudomonas phage PAK_P1 NC_015294 93198 nt Pseudomonas aeruginosa Myoviridae Pseudomonas phage PAK_P2 NC_022967 92495 nt Pseudomonas aeruginosa Myoviridae Pseudomonas phage PAK_P3 NC_022970 88097 nt Pseudomonas aeruginosa Myoviridae Pseudomonas phage PAK_P4 NC_022986 93147 nt Pseudomonas aeruginosa Myoviridae Pseudomonas phage PAK_P5 NC_022966 88135 nt Pseudomonas aeruginosa Myoviridae Pseudomonas phage PB1 NC_011810 65764 nt Pseudomonas aeruginosa Podoviridae Pseudomonas phage PT2 NC_011107 42961 nt Pseudomonas aeruginosa Podoviridae Pseudomonas phage PT5 NC_011105 42954 nt Pseudomonas aeruginosa
Continued on next page

100
Phage family Phage name Accession Genome length Host
Myoviridae Pseudomonas phage PaBG NC_022096 258139 nt Pseudomonas aeruginosa
Myoviridae Pseudomonas phage PaP1 NC_019913 91715 nt Pseudomonas aeruginosa
Podoviridae Pseudomonas phage PaP2 NC_005884 43783 nt Pseudomonas aeruginosa
Podoviridae Pseudomonas phage PaP3 NC_004466 45503 nt Pseudomonas aeruginosa
Myoviridae Pseudomonas phage SN NC_011756 66390 nt Pseudomonas aeruginosa
Myoviridae Pseudomonas phage SPM-1 NC_023596 65729 nt Pseudomonas aeruginosa
Podoviridae Pseudomonas phage TL NC_023583 45696 nt Pseudomonas aeruginosa
Siphoviridae Pseudomonas phage YuA NC_010116 58663 nt Pseudomonas aeruginosa
Siphoviridae Pseudomonas phage phi297 NC_016762 49135 nt Pseudomonas aeruginosa
Myoviridae Pseudomonas phage phiCTX NC_003278 35580 nt Pseudomonas aeruginosa
Podoviridae Pseudomonas phage phiIBB-PAA2 NC_022971 45344 nt Pseudomonas aeruginosa
Podoviridae Pseudomonas phage phiKMV NC_005045 42519 nt Pseudomonas aeruginosa
Myoviridae Pseudomonas phage phiKZ NC_004629 280334 nt Pseudomonas aeruginosa
Podoviridae Pseudomonas phage phikF77 NC_012418 43152 nt Pseudomonas aeruginosa
Siphoviridae Pseudomonas phage vB_Pae-Kakheti25 NC_017864 42844 nt Pseudomonas aeruginosa
Podoviridae Pseudomonas phage vB_Pae-TbilisiM32 NC_017865 42966 nt Pseudomonas aeruginosa
Myoviridae Pseudomonas phage vB_PaeM_C2-10_Ab1 NC_019918 92777 nt Pseudomonas aeruginosa
Unknown Pseudomonas phage vB_PaeP_Tr60_Ab31 NC_023575 45550 nt Pseudomonas aeruginosa
Podoviridae Pseudomonas phage vB_PaeP_p2-10_Or1 NC_019813 44030 nt Pseudomonas aeruginosa
Siphoviridae Pseudomonas phage vB_PaeS_PMG1 NC_016765 54024 nt Pseudomonas aeruginosa
Siphoviridae Pseudomonas phage vB_PaeS_SCH_Ab26 NC_024381 43056 nt Pseudomonas aeruginosa