factors affecting tissue perfusion and the efficacy of...
TRANSCRIPT

Final Report on NAG 9-134/4
Factors Affecting Tissue Perfusion and the Efficacy of Astronaut Denitrogenation for Extravehicular Activity
March 1, 1990 - October 1, 1994
Richard D. Vann, Ph.D. and Wayne A. Gerth, Ph.D.
March 31, 1995
F.G. Hall Hypo/Hyperbaric Center Box 3823 Duke University Medical Center Durham, NC 27710

2
CONTENTS
SECTION PAGE
INTRODUCTION ...................................................................................................... 3 BACKGROUND ........................................................................................................ 4 Inert gas exchange ............................................................................................ 4 Bubble formation .............................................................................................. 5 METHODS ................................................................................................................ 8 Experimental design ........................................................................................ 8 Outcome variables ............................................................................................ 9 Nitrogen elimination ............................................................................ 11 Precordial Doppler bubbles .................................................................. 14 Decompression sickness........................................................................ 15 Predictor variables ........................................................................................... 20 CONCLUSION AND FOLLOW-ON STUDIES ..................................................... 21 REFERENCES ......................................................................................................... 23 APPENDIX Phase I Summary Report (NASA1.DOC) Phase II Summary Report (NASA2.DOC) Phase III Summary Report (NASA3.DOC) Phase IV Summary Report (NASA4.DOC) Phase V Summary Report (NASA5.DOC) Phase VI Summary Report (NASA6.DOC) Floppy disk containing all Summary Reports

3
INTRODUCTION Tasks at high altitude and in space expose man to reduced atmospheric pressure and to the risk of bubble formation and decompression sickness (DCS). Decompression risk is minimized by eliminating dissolved nitrogen through oxygen breathing, stage decompression, or a combination of both. Because these procedures are lengthy, an understanding of how environmental and physiological conditions affect risk is essential. Strategies which accelerate nitrogen elimination and reduce bubble formation will decrease DCS risk, save materiel and crew time, and limit the impact of pre-EVA DCS prevention protocols on other flight operations. Knowledge of behaviors (e.g., anaerobic exercise) which may predispose to DCS might allow scheduling of pre-EVA activities to minimize DCS risk. Understanding decompression sickness requires knowledge of inert gas exchange and bubble formation mechanisms. While gas exchange can be investigated by measuring respiratory N2 elimination, a N2 elimination curve is the summation of washouts from all body tissues, and the contribution of individual tissues cannot be resolved mathematically. Manipulation of environmental and physiological conditions, however, induces changes in N2 elimination that allow indirect study of blood flow regulation, gas solubility, and diffusion. Bubble formation can be investigated by pre-flight maneuvers that might change the number of bubble nucleation sites. Anaerobic exercise such as weight-lifting, for example, may increase the number of these sites. Changes in the incidences of bubbles and DCS produced by pre-flight maneuvers could provide evidence concerning bubble formation in man. The hypothesis of this study was that the risk of decompression sickness (DCS) at altitude can be influenced by the enviromental and physiological conditions in effect prior to altitude exposure. We investigated the following prebreathe conditions: body position (seated; supine and 6° head-down-tilt rest), exercise, pharmacologic vasodilation, and warm water immersion. We also studied O2 prebreathe duration and weight-lifting before prebreathing. We assessed the effects of these conditions on whole-body nitrogen elimination during oxygen prebreathing and on precordial Doppler bubble grades and DCS incidence during 4 hr simulated EVA at 30,000 feet (4.3 psia). We developed quantitative statistical correlations between the environmental and physiological conditions as predictor variables and whole-body N2 elimination, precordial Doppler bubbles, and DCS incidence as outcome variables. We also developed a statistical correlation between N2 elimination during prebreathe and DCS incidence during subsequent altitude exposure. One hundred and seventy-four experiments were conducted in six phases. The first 162 experiments are analyzed in this report. Complete data on all experiments are presented in the six summary reports of the Appendix. These summary reports are also provided in digital form on the enclosed 3.25" IBM-format floppy disk as text (.TXT) and MicroSoft Word 6.0 (.DOC) files.
4
BACKGROUND To participate in extravehicular activity (EVA), flightcrew must decompress from a 14.7 psia cabin pressure to a current 4.3 psia spacesuit pressure. Present measures to prevent DCS involve both staged decompression and O2 breathing to decrease nitrogen dissolved in the tissues (Waligora et al. 1984). The design of pre-EVA procedures is based on ground-based studies of bubble formation and DCS incidence in humans, but ground-based studies do not include the physiological adaptations to microgravity that may influence DCS susceptibility in space. While DCS has been denied by flightcrew during EVA, ground-based studies report an incidence of 20-30% pain-only symptoms and 2-3% chokes or cerebral symptoms (Waligora et al. 1984). Incomplete reporting of DCS during EVA seems unlikely to account for this difference (Powell et al. 1992) suggesting that the duration of present pre-EVA protocols might be reduced without adversely affecting safety if the factors that distinguish DCS susceptibility in spaceflight from that in ground-based studies were understood. DCS is caused by gas bubbles in supersaturated tissue in either a terrestrial or orbital environment (Vann and Thalmann 1993). The relevant factors include: (a) the production of in vivo gas supersaturation, and; (b) the nucleation and growth of bubbles in tissue. Supersaturation (SS), defined as, SS = Pg - PH (1) occurs when the sum of the vapor pressures of all volatile components (Pg) exceeds the local hydrostatic pressure (PH). This is a state of thermodynamic disequilibrium which can be sustained metastably or relieved by the formation of a vapor and gas-filled bubble (Gerth 1979). The probability of bubble formation increases with the supersaturation. As long as supersaturation is sustained metastably, excess gas dissolved in blood and tissue can be eliminated harmlessly through the lungs via the circulation. Thus, factors that govern the magnitude of SS in tissues -- the dissolved gas load and local hydrostatic pressure -- are key to DCS susceptibility in all environments. Inert Gas Exchange To decrease DCS susceptibility, dissolved nitrogen is eliminated by breathing 100% O2 before decompression and/or by residence at an intermediate pressure where DCS risk is minimal prior to final decompression (Waligora et al. 1984). Implementation of these strategies in the Shuttle differs from pre-launch denitrogenation in earlier on-launch cabin decompressions of the Mercury, Gemini and Apollo flights. In the Shuttle, pre-launch denitrogenation is unnecessary because of its 1 ata pressure, but before EVA, Shuttle crew must prebreathe O2 while undergoing physiological adaptation to microgravity. Body tissues equilibrate with an altered atmosphere gradually. The kinetics of the approach to equilibrium govern the time at a stage pressure or during oxygen breathing needed to achieve
5
DCS protection (Jones 1951). These kinetics are governed by tissue perfusion which is hypothesized to change in microgravity. Factors which alter tissue perfusion are known to influence N2 elimination during O2 breathing. Respiratory nitrogen elimination from humans is accelerated by ambient temperature increase, water immersion, exercise, shifts of body position from sitting to supine, administration of a vasodilator, and increased inspired carbon dioxide (Balldin et al. 1971; Balldin and Lundgren 1972; Balldin 1973a; Balldin 1976; Theis et al. 1978). The enhancement of nitrogen elimination is related to improved tissue perfusion caused by increased cardiac output, capillary recruitment, and/or distribution of cardiac output. Some of these factors have been shown to affect DCS protection acquired during denitrogenation. Altitude DCS incidence was lower with denitrogenation during exercise (Balke 1954) or immersion in warm water instead of air (Balldin 1973b). DCS incidence was lower in rabbits injected with a vasodilator prior to oxygen breathing than in untreated controls (Balldin and Liner 1978). Divers who exercised during decompression required less decompression than resting divers (Vann 1982). These results suggest that microgravity-induced changes in perfusion might accelerate nitrogen elimination from flightcrew over the same individuals who were adapted to 1-g. Indeed, water immersion and supine rest are thought to produce cardiovascular responses similar to those of microgravity (Nixon et al. 1979; Nicogossian and Parker 1982; Levy and Talbot 1983). How such microgravity-induced changes in nitrogen elimination might affect inflight pre-DCS prevention protocols is of great interest as conditions that augment pre-EVA denitrogenation might simulate the effects of microgravity. In consideration of these issues, we have investigated the relationships between denitrogenation, whole-body nitrogen elimination, and DCS risk during subsequent simulated EVA. Results presented below provide evidence for the beneficial effect of exercise and other perfusion effectors and indicate that a measure of DCS risk can be derived from whole-body nitrogen elimination curves. Significantly, however, no simulation of microgravity (6° head-down tilt and water immersion) eliminated DCS. In part, this may be because microgravity simulation was not continued at reduced pressure, and denitrogenation was consequently slowed. On the other hand, factors which may influence bubble formation must also be considered. Bubble Formation For bubble formation, hydrostatic pressure, not ambient atmospheric pressure, is the relevant factor. Under most in vitro conditions, bubbles form at low supersaturations from pre-existing gas cavities called gaseous micro-nuclei (Harvey et al. 1944). In the absence of gas nuclei, bubbles form spontaneously, or de novo at high supersaturations (Harvey et al. 1944; Hemmingsen 1989). Recent experimental evidence has confirmed theoretical predictions that de novo bubble nucleation in pure water requires vapor supersaturations (tension or superheat) of about 1,400 ata (Zheng et al. 1991). Other evidence indicates that de novo bubble nucleation occurs in aqueous solutions at lower dissolved gas supersaturations (Gerth and Hemmingsen 1976; Gerth 1979). With an apparent relationship to the solubility of gas in liquid, spontaneous

6
nucleation in water requires a supersaturation of 120 atm for methane, 190 atm for nitrogen, and over 350 atm for helium (Gerth and Hemmingsen 1976; Finkelstein and Tamir 1985). These thresholds are largely uneffected by surfactants or electrolytes (Hemmingsen 1989). While lower than the vapor-supersaturations required to rupture pure water, gas-supersaturations still far exceed those at which bubbles and DCS occur in man. It is therefore unlikely that bubbles in man arise from de novo nucleation. De novo bubble nucleation can also occur at phase boundaries, such as solid-liquid interfaces, where diminished cohesive forces can lower the required supersaturations below those in bulk liquid (Gerth and Hemmingsen 1980). Theoretically, the geometry of the solid-liquid interface is an important factor. Certain interfacial configurations force the existence of microscopic "trapped" vapor phases from which macroscopic bubbles will grow in the presence of sufficient supersaturation (Tikuisis 1986). Finally, turbulence in moving liquid (Harvey 1947) and viscous adhesion of liquid to separating solid surfaces (Cottrell 1964) can create small liquid regions with negative absolute pressures, and higher supersaturations (Eq. 1), than in surrounding regions. Thus, by mechanically reducing the absolute pressure, de novo nucleation can occur at relatively low apparent gas-supersaturations. By increasing the magnitude of the supersaturation per se, these mechanisms are effective promoters of bubble formation from pre-existing gas nuclei. Physiological surfaces separated by liquid often slide over one another or are pulled apart. The hydrostatic pressure in liquid between separating surfaces is reduced in direct proportion to the liquid viscosity and in indirect proportion to the cube of the distances between the surfaces. Liquid tensions or negative pressures exceeding hundreds of atmospheres are produced in this manner (Campbell 1968; Dowson et al. 1971). Hayward (1967) applied the term "tribonucleation" to this process when it generates a supersaturation sufficient to cause bubble formation. Gas bubbles that cause DCS may originate from nuclei that form from tribonucleation after decompression. Using Doppler ultrasound to detect moving intravascular bubbles, Powell and Spencer (1980) reported greater numbers of bubbles in veins draining active tissues such as muscle than nonactive tissues such as kidney and brain. McDonough and Hemmingsen (1984a,b; 1985a,b) showed that bubble formation in marine animals occurred at gaseous supersaturations of 2 ATM when the animals moved voluntarily or were mechanically stimulated, but with immobilization, supersaturations of up to 50 ATM could be sustained without bubble formation. Similarly, exercise at altitude significantly increased DCS incidence in man (Kumar et al. 1992). Evidence also indicates that gas nuclei may always support in vivo bubble formation whenever tissues become gas-supersaturated. As these nuclei are dissolved by surface tension, new nuclei are created by the tribonucleation associated with physical activity. Evans and Walder (1969) found that exercise after pressure treatment but before altitude decompression increased bubble formation in shrimp. Daniels et al. (1984) found increased bubble formation in shrimp which were allowed to move about freely at sea level for 24 hours after pressure treatment but before decompression.
7
This principle has been proposed to account for the "anomalously low" DCS incidence during EVA where the substantially reduced activity of the lower extremeties and absence of g-related forces are hypothesized to cause a reduction of gas nuclei (Powell et al. 1992). Based on of precordial bubbles in subjects bed-rested for 4 days prior to simulated EVA at 6.5 psia, Powell estimated that the hypokinesia and adynamia of spaceflight provide DCS protection equivalent to about 3 hr of oxygen breathing at 1-g. Results of our program suggest that this may also arise from the dynamic unloading of the lower body during the hypokinetic exposure in microgravity. Direct evidence exists for pre-existing bubbles in humans in the form of gas and vapor-filled voids in joints placed in traction. These voids, known as "vacuum phenomena", were first seen by Fick in 1910 in X-rays of cadaver joints (Mayall 1964; Martel and Poznanski 1970). Vacuum phenomena have since been widely described in radiographic and CT-scan studies of most of the major synovial and cartilagenous joints of living subjects, including the fingers, wrists, elbows, shoulders, spine, sacroilliac joint, illium, symphis pubis, hips, and knees (Vann 1989). If traction is maintained for 10 to 20 minutes, the voids usually fill with fluid and disappear, demonstrating that they are indeed under a relative vacuum (Rubin 1939; Gershon-Cohen 1945; Martel and Poznanski 1970). Analysis of gas aspirated from a vacuum phenomenon showed that it contained 91-92% nitrogen (Ford et al. 1977). Vacuum phenomena occur at all ages, but spinal vacuum phenomena in disks, facet joints, vertebrae, and the spinal canal itself, are more common with advancing age and are diagnostic of degeneration (Knutsson 1942). This may explain the increased DCS risk with age. Vacuum phenomena produced by traction of the wrist (Yousefzadeh 1979) have the same appearance as gas in the wrist caused by altitude decompression (Thomas and Williams 1945). Gas in a joint space, however, be it a vacuum phenomenon or the result of decompression, does not cause pain. Thus, vacuum phenomena in joints under normal atmospheric conditions are not harmful (Swezey and Swezey 1975). The common occurrence of vacuum phenomena enable ready visualization of how microscopic nuclei might form by similar tribonucleation processes at sites involved in DCS. Thomas and Williams (1945) found decompression pain at an altitude 35,000 feet to be most frequently associated with gas streaks along fascial planes and tendons. In 74 observations of such gas streaking, pain was present on 47 occasions. The gas in these cases probably originates from nuclei generated by tribonucleation during the relative motion of fascia and tendons. Exercise would promote such tribonucleation, and the resulting bubbles would expand after decompression by the inward diffusion of nitrogen from supersaturated tissue. In accord with this hypothesis, we have observed 4 cases in which heavy weight training within 24 hours before diving was associated with DCS and/or high precordial Doppler bubble grades. Nishi reported two similar cases at DCIEM (Nishi et al. 1982). Physical activity as an effector of bubble nucleation was also included for study in the present program. Results indicate that heavy anaerobic exercise by weight-trainers may persist to influence DCS risk even after two weeks of inactivity. This inactive period was longer than expected for the lifetimes of bubble nuclei produced by the exercise. Thus, other influences, such as altered surface properties in the tissues involved, may also be important.

8
METHODS Motivated by the foregoing, we investigated how environmental and physiological conditions influence inert gas washout during oxygen breathing and DCS incidence during subsequent simulated EVA. Correlations between DCS risk and its various effectors, including N2 elimination during prebreathe, are emerging that may provide noninvasive evaluation of denitrogenation protocols. Factors identified in the previous sections as potentially influencing inert gas exchange or DCS risk were screened in 10 preliminary trials for their effects on the outcome variables: (a) nitrogen eliminaton, (b) precordial Doppler bubbles, and (c) DCS incidence. If an effect was suggested, additional trials were conducted. The 10 trial screen can detect large effects but overlooks small effects. Statistically significant effects were found for some factors while others had little or no effect. Still others may prove significant with further testing. Experimental Design The experimental design was based on a NASA DCS prevention protocol used extensively in ground-based tests but infrequently during Shuttle operations (Waligora et al. 1984). The protocol employed 3.5 hrs of oxygen prebreathing followed by 4 hrs of exercise to simulate EVA at the Shuttle suit pressure of 4.3 psia (30,000 feet). EVA simulation was interrupted every 16 min for 4 min of precordial Doppler bubble detection. In our adaptation of this protocol, subjects performed separate prebreathes under different conditions while respiratory nitrogen elimination was measured using an open-circuit breath-by-breath method developed specifically for the task ( Gerth et al. 1987). Because the nitrogen elimination measurements were complex, only one subject could be studied per experiment. The strength of this methodology is that potential predictor variables can be tested for association with nitrogen elimination and DCS occurrence in the same experiments. Thirty minutes before flight time, respiratory nitrogen elimination measurements were stopped, and the subject was transferred to an altitude chamber using a portable oxygen system to avoid air-breathing. The standard NASA EVA exercise simulation was performed at altitude yielding results (precordial bubble scores; DCS or no-DCS) that characterized the efficacy of the preceding denitrogenation. A minimum of six days separated successive flights by a given subject to ensure independence. The prebreathe conditions and altitude exposure parameters examined in the 162 experiments discussed below were selected to simulate microgravity, to be pertinent to aerospace operations, or to adjust DCS incidences to levels useful in statistical tests. Included were: (a) Microgravity simulations. There are no truly satisfactory terrestrial simulations of microgravity, and we could only study imperfect analogs. These were: body position (seated

9
verses supine or 6° head-down tilt), immersion in thermoneutral (35°C water), and continuous infusion of the vasodilator sodium nitroprusside (nipride). (b) Work. Aerobic arm and leg exercise (rest, 25 watts, 50 watts) during oxygen prebreathing was studied as a potential means for accelerating nitrogen elimination. Anaerobic exercise (weight training) was studied for its possible effect on individual DCS susceptibility. During exercising denitrogenations, the subjects worked their arms and legs on a Schwinn Airdyne ergometer. The ergometer was mounted either vertically or horizontally to accommodate a sitting or semi-supine position (supine with knees and hips flexed 90°). No subject had difficulty sustaining 25 watts (equivalent to a walking speed of 2 mph) or 50 watts (equivalent to 3 mph) for the required periods (up to 2 hr, 50 min). The mean O2 consumption was 2 to 3 times resting level at 25 watts and 4 to 5 times the resting level at 50 watts. Exercising prebreathes began after 10 minutes of oxygen breathing at rest in order to allow the measured nitrogen elimination profiles to be corrected for nitrogen washout from the lung residual volume. Thirty minutes before the scheduled flight time, the subjects stopped exercising and transferred to an altitude chamber. Thus, a 2.5 hr pre-flight denitrogenation had 1 hr, 50 min of exercise and a 3.5 hr period had 2 hrs, 50 min. (c) Immersion in oxygen. Astronauts are immersed in oxygen during inflight prebreathing while subjects in ground-based studies are immersed in air. Does cutaneous nitrogen diffusion put the ground-based subjects at greater DCS risk than astronauts? We addressed this question by testing subjects in sealed bags filled with either oxygen or air. (d) Adjustments to DCS incidence. Statistical tests are most effective when the range of DCS incidence is wide. We varied the duration of preflight oxygen breathing (2.5 hr or 3.5 hr) and the ascent rate to altitude (1,000 or 3,500 fpm) to establish incidence ranges that would be appropriate to conditions tested. Outcome Variables We first discuss how the three outcome variables -- nitrogen elimination, Doppler bubble incidence, and DCS incidence -- were affected by all predictor variables. Next, we consider the effects of the individual predictors. Fifteen sets of experimental conditions were tested. The predictor and outcome variables for each condition are summarized in Table 1.

Tab
le 1
. P
redi
ctor
and
out
com
e va
riab
les
for
the
15 e
xper
imen
tal
cond
itio
ns.
("W
T"
= 1
ind
icat
es s
ubje
cts
who
wer
e w
eigh
t tr
aine
rs.
"Lif
t" =
1 in
dica
tes
that
the
subj
ects
lift
ed w
eigh
ts f
or 6
day
s be
fore
a f
ligh
t. "O
2" =
1 in
dica
tes
that
sub
ject
s w
ere
imm
erse
d in
a b
ag o
f ox
ygen
. "A
ir"
= 1
ind
icat
es t
hat
subj
ects
wer
e im
mer
sed
in a
bag
of
air.
"N
2/kg
" is
the
mea
n ni
trog
en v
olum
e el
imin
ated
aft
er 2
or
3 ho
urs
of o
xyge
n br
eath
ing.
)
P
redi
ctor
Var
iabl
e
O
utco
me
Var
iabl
eC
ond
DC
S F
lts
Rat
eT
ime
Wor
kS
eat
Sup
HD
TN
ipIm
mW
T L
ift
O2
Air
N2/
kg%
Bub
%D
CS
5 4
15
1000
3.5
0 0
0 1
0 0
0 0
00
11.3
833
27
6
4 10
10
002.
525
0
1 0
0 0
0 0
00
11.8
350
40
7
0 5
1000
3.5
25
0 1
0 0
0 0
0 0
015
.18
20
0 10
3
10
1000
2.5
50
0 1
0 0
0 0
0 0
023
.06
40
30
4 2
7 10
003.
50
0 1
0 0
0 0
0 0
011
.214
29
8
3 10
10
003.
50
0 1
0 0
0 0
0 0
115
.92
10
30
9 3
9 10
003.
50
0 1
0 0
0 0
0 1
013
.48
33
33
14
6 12
10
003.
50
0 0
1 0
0 1
0 0
010
.51
58
50
15
4 10
10
003.
50
0 0
1 0
0 1
1 0
011
.85
50
40
1 9
14
3500
3.5
0 1
0 0
0 0
0 0
00
6.11
64
64
2 9
19
3500
3.5
0 0
0 1
0 0
0 0
00
12.0
863
47
3
0 10
35
003.
525
1
0 0
0 0
0 0
00
10.6
310
0
11
2 10
35
003.
525
0
1 0
0 0
0 0
00
21.8
430
20
12
2
11
3500
3.5
0 0
0 0
0 1
0 0
00
15.8
327
18
13
2
10
3500
3.5
0 0
1 0
1 0
0 0
00
12.5
420
20

11
ogen Elimination Nitrogen elimination measurements were made during 122 of the 162 experiments. (Technical problems precluded elimination measurements during all experiments. Data are available for eight other experiments but have not yet been analyzed.) Each subject was tested in 1-5 experiments. Measurements began when a subject exhaled to residual volume and breathed high purity oxygen. Subsequent elimination curves were cumulative sums of the nitrogen volume in each exhaled breath. As there were about 4,000 breaths (data points) per experiment, washout curves were summarized by a least squares fit to the sum of two exponential compartments and one linear compartment (Eq. 2) where Ai, ki, and m are fitting parameters, and L is the system response latency (Gerth et al. 1987). Compartment halftimes are given by 0.693/ki.
V = A 1 - e m(t - L)N i-k
i=1
2
2
i(t-L)� + (2)
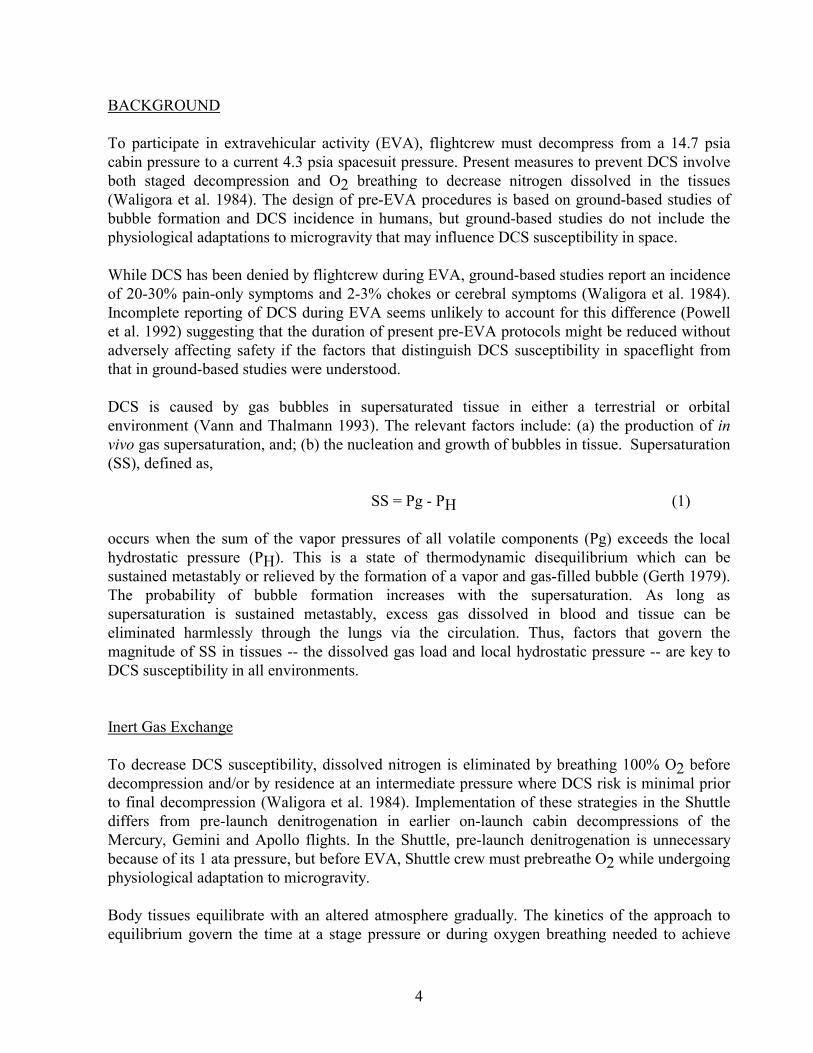
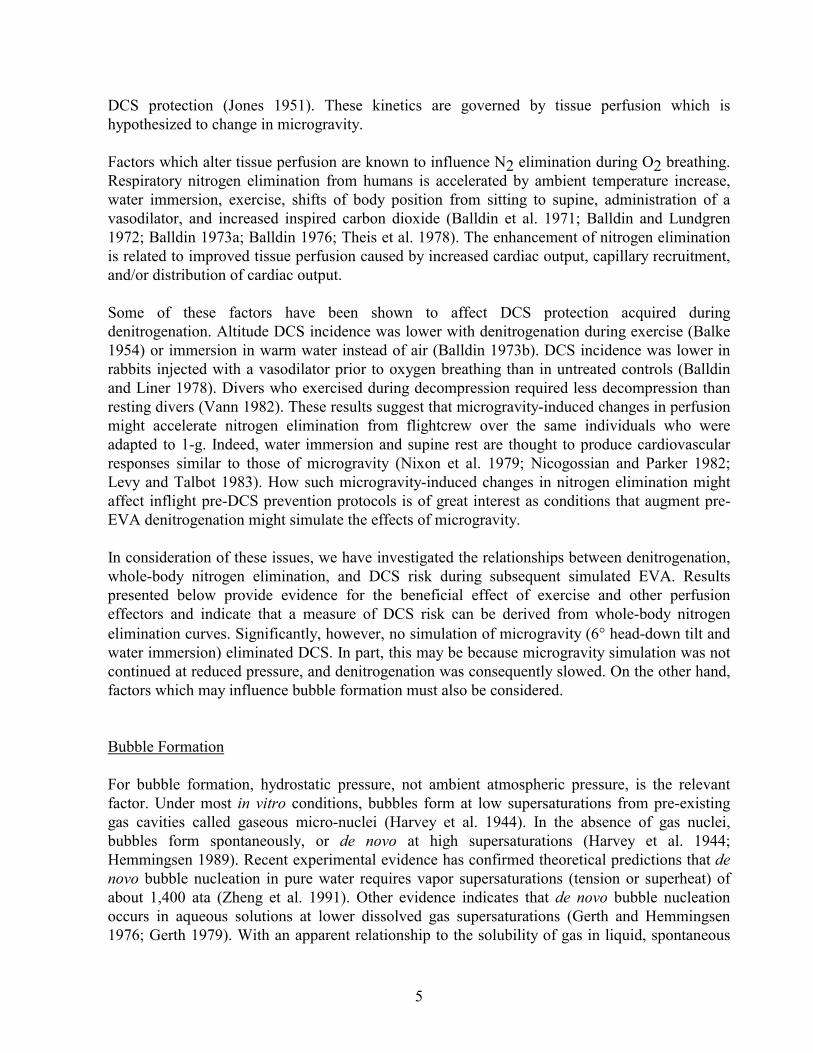
The first compartment had halftimes on the order of 0.5 min and was assumed to represent gaseous nitrogen washed from the lung. This compartment was subtracted from the measured elimination curve (Fig. 1), and the resulting curve was taken to represent nitrogen exolved from the subject's body. Exercising experiments began with ten minutes of rest so that lung washout would occur at the same rate for all subjects. The halftime of the second exponential compartment was on the order of 20 min (range 9-92 min). Mean nitrogen elimination after 2 or 3 hours for the 114 experiments was 1,032 ml (S.D. 454.8 ml; range 307-2,931 ml). For analysis, washout curves were described by the parameters of Eq. 1, the total volume of eliminated nitrogen, and the volume eliminated in 30 minute increments (Fig. 2). Figures 3-7 show washout curves for all conditions tested. Each figure represents a different subject during 2-4 experiments. Except where the 2 hr prebreathes are indicated, subjects breathed oxygen for 3 hrs while at rest in room air. Comparison of the curves in Figs. 3-7
030 60 90 120 1500
2500
Time (min)
�V0-30
�V30-60
�V60-90
180
Cumulative NitrogenElimination(ml)
Figure 2. Nitrogen eliminated during 30 minute intervals.
CumulativeNitrogenElimination(ml)
0 2000
2000
Time (min)
SubtractPulmonaryCompartment
Figure 1. Subtraction of the pulmonary compartment from a measured nitrogen elimination curve.
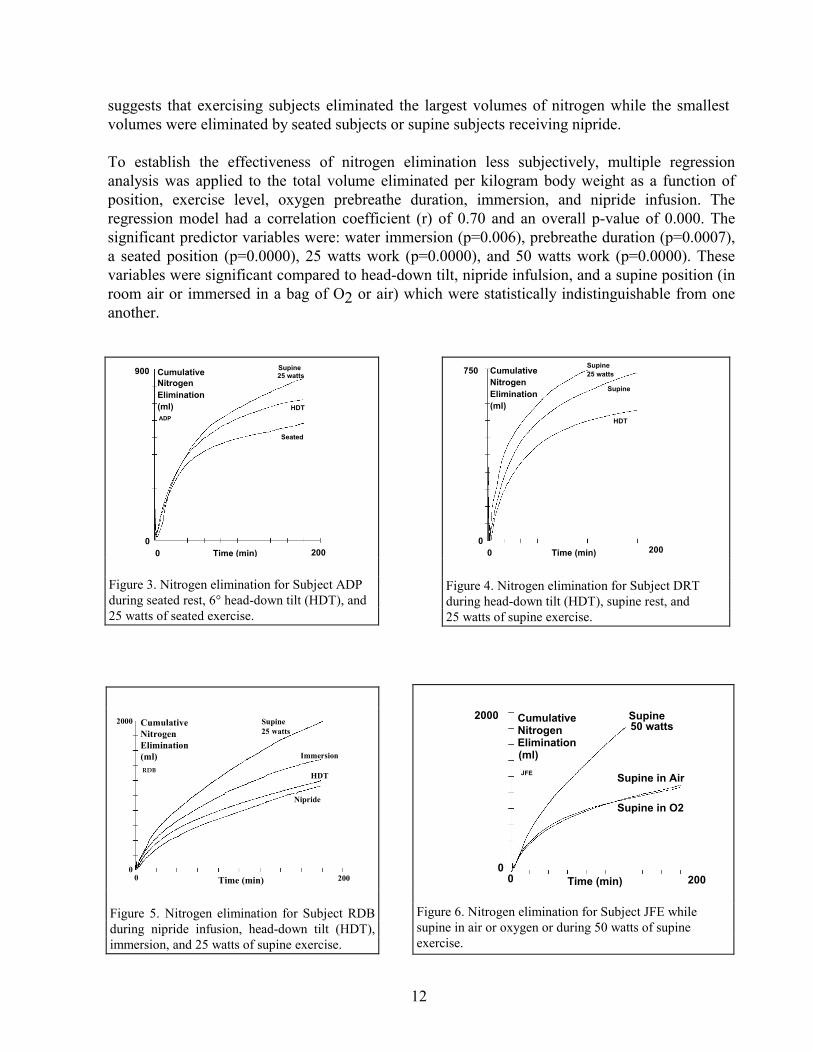
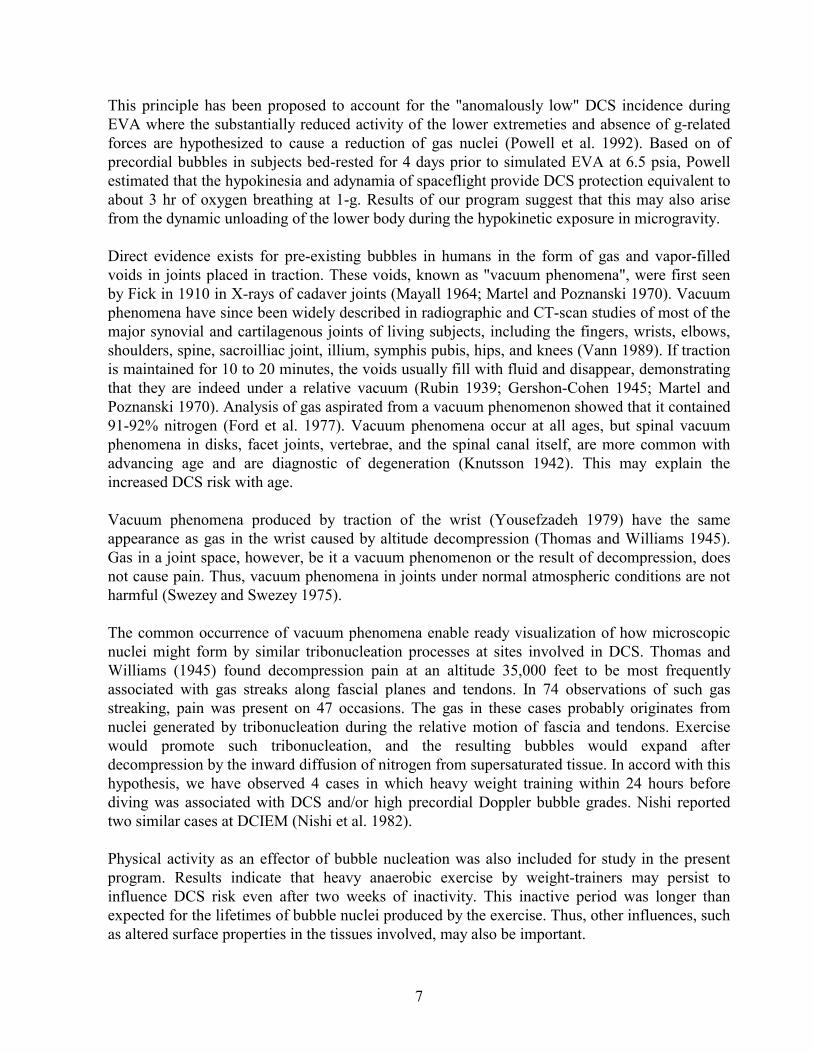
12
suggests that exercising subjects eliminated the largest volumes of nitrogen while the smallest volumes were eliminated by seated subjects or supine subjects receiving nipride. To establish the effectiveness of nitrogen elimination less subjectively, multiple regression analysis was applied to the total volume eliminated per kilogram body weight as a function of position, exercise level, oxygen prebreathe duration, immersion, and nipride infusion. The regression model had a correlation coefficient (r) of 0.70 and an overall p-value of 0.000. The significant predictor variables were: water immersion (p=0.006), prebreathe duration (p=0.0007), a seated position (p=0.0000), 25 watts work (p=0.0000), and 50 watts work (p=0.0000). These variables were significant compared to head-down tilt, nipride infulsion, and a supine position (in room air or immersed in a bag of O2 or air) which were statistically indistinguishable from one another.
900
0
CumulativeNitrogenElimination(ml)ADP
Seated
HDT
Supine25 watts
0 200Time (min) Figure 3. Nitrogen elimination for Subject ADP during seated rest, 6° head-down tilt (HDT), and 25 watts of seated exercise.
CumulativeNitrogenElimination(ml)
750
00 200Time (min)
Supine25 watts
Supine
HDT
Figure 4. Nitrogen elimination for Subject DRT during head-down tilt (HDT), supine rest, and 25 watts of supine exercise.
Time (min)0 2000
2000 Supine25 watts
Immersion
HDT
Nipride
CumulativeNitrogenElimination(ml)RDB
Figure 5. Nitrogen elimination for Subject RDB during nipride infusion, head-down tilt (HDT), immersion, and 25 watts of supine exercise.
Time (min)0 2000
2000 CumulativeNitrogenElimination(ml)
Supine in Air
Supine in O2
50 wattsSupine
JFE
Figure 6. Nitrogen elimination for Subject JFE while supine in air or oxygen or during 50 watts of supine exercise.

13
Figure 8 presents the means and standard deviations for all experimental conditions in increasing order of washout volume. Multiple regression estimates and their 95% upper confidence limits (UCL) are shown for conditions in which there were significant correlations. The least effective condition for eliminating nitrogen was three hours of seated rest. The most effective condition was 2 hrs of supine exercise at 50 watts. Subjects exercising at 50 watts eliminated almost 3-times as much nitrogen per kg as seated subjects who breathed oxygen for one hour longer.
Experimental Condition
Nit
rog
en V
olu
me
Elim
inat
ed (
ml/k
g)
0
5
10
15
20
25
30
1- Seated 3- 25wSeated
6- 2h 25wHDT
2,4,5,8,9,14,15-HDT/Supine/Nipride
7,11- 3h25w HDT
12-Immersion
10- 2h 50wHDT
S.D.
Experimental Mean
95% UCL
Predicted Mean
n= 8
8
9
649
9
7
Figure 8. Measured and estimated nitrogen volumes eliminated per kg of body weight for the 15 conditions tested. The numbers in parentheses refer to the conditions listed in Table 1.
Time (min)0 200
CumulativeNitrogenElimination(ml)
0
1500
2 weeksrest
1 weekweights
CMW
Figure 7. Nitrogen elimination for Subject CMW after two weeks of rest and one week of weight lifting.
14
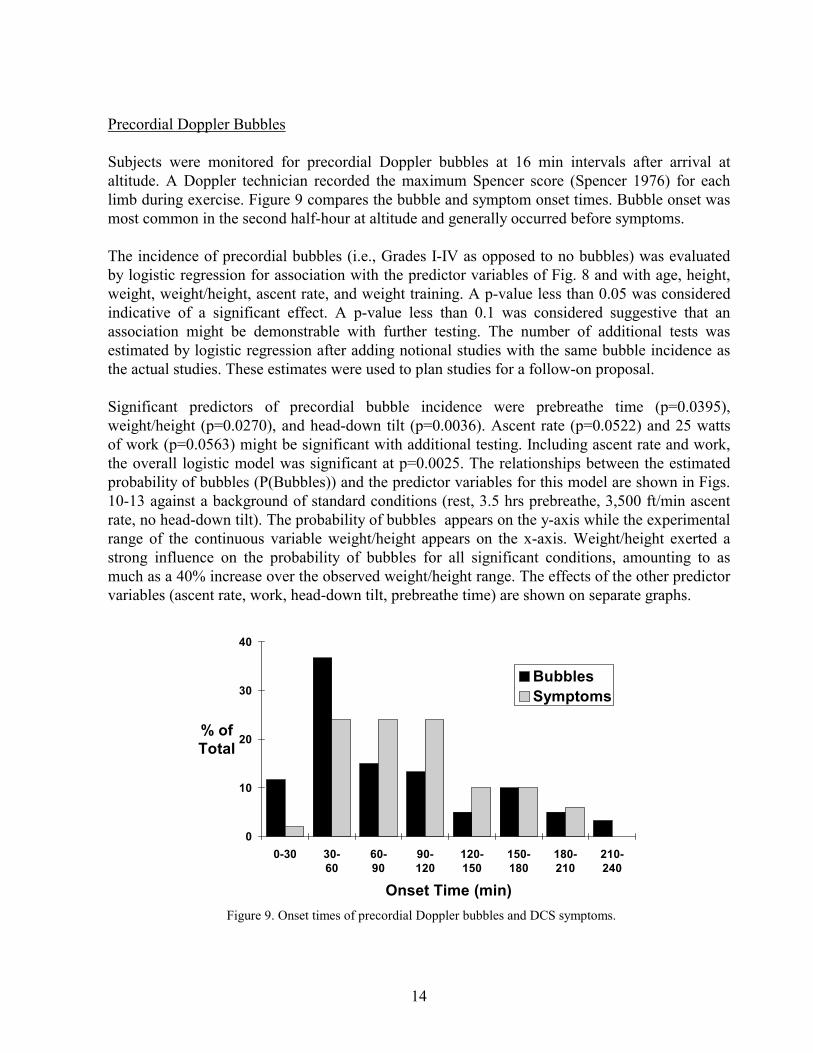
Precordial Doppler Bubbles Subjects were monitored for precordial Doppler bubbles at 16 min intervals after arrival at altitude. A Doppler technician recorded the maximum Spencer score (Spencer 1976) for each limb during exercise. Figure 9 compares the bubble and symptom onset times. Bubble onset was most common in the second half-hour at altitude and generally occurred before symptoms. The incidence of precordial bubbles (i.e., Grades I-IV as opposed to no bubbles) was evaluated by logistic regression for association with the predictor variables of Fig. 8 and with age, height, weight, weight/height, ascent rate, and weight training. A p-value less than 0.05 was considered indicative of a significant effect. A p-value less than 0.1 was considered suggestive that an association might be demonstrable with further testing. The number of additional tests was estimated by logistic regression after adding notional studies with the same bubble incidence as the actual studies. These estimates were used to plan studies for a follow-on proposal. Significant predictors of precordial bubble incidence were prebreathe time (p=0.0395), weight/height (p=0.0270), and head-down tilt (p=0.0036). Ascent rate (p=0.0522) and 25 watts of work (p=0.0563) might be significant with additional testing. Including ascent rate and work, the overall logistic model was significant at p=0.0025. The relationships between the estimated probability of bubbles (P(Bubbles)) and the predictor variables for this model are shown in Figs. 10-13 against a background of standard conditions (rest, 3.5 hrs prebreathe, 3,500 ft/min ascent rate, no head-down tilt). The probability of bubbles appears on the y-axis while the experimental range of the continuous variable weight/height appears on the x-axis. Weight/height exerted a strong influence on the probability of bubbles for all significant conditions, amounting to as much as a 40% increase over the observed weight/height range. The effects of the other predictor variables (ascent rate, work, head-down tilt, prebreathe time) are shown on separate graphs.
Onset Time (min)
% ofTotal
0
10
20
30
40
0-30 30-60
60-90
90-120
120-150
150-180
180-210
210-240
BubblesSymptoms
Figure 9. Onset times of precordial Doppler bubbles and DCS symptoms.

15
Decompression Sickness There were 53 DCS incidents in 162 experimental flights for an overall incidence of 33%. Fifty incidents were joint pain, one was "thermal skin bends," and one was visual disturbances. The "thermal skin bend" was a sensation of severe cutaneous heat which increased progressively reaching a subjective intensity of 7 out of 10 while covering most of the subject's body. There was no apparent rash, and symptoms resolved at 10,000 feet on descent, but the subject's skin was sore for several days after the flight.
Figure 11. The effect of work on the probability of Doppler bubbles (p=0.0047).
Figure 10. The effect of ascent rate on the probability of Doppler bubbles (p=0.0080).
Figure 12. The effect of nipride infusion (p=0.0889) and immersion (p=0.0143) on the probability of Doppler bubbles.
Figure 13. The effect of oxygen prebreathe time on the probability of Doppler bubbles (p=0.0041).
16
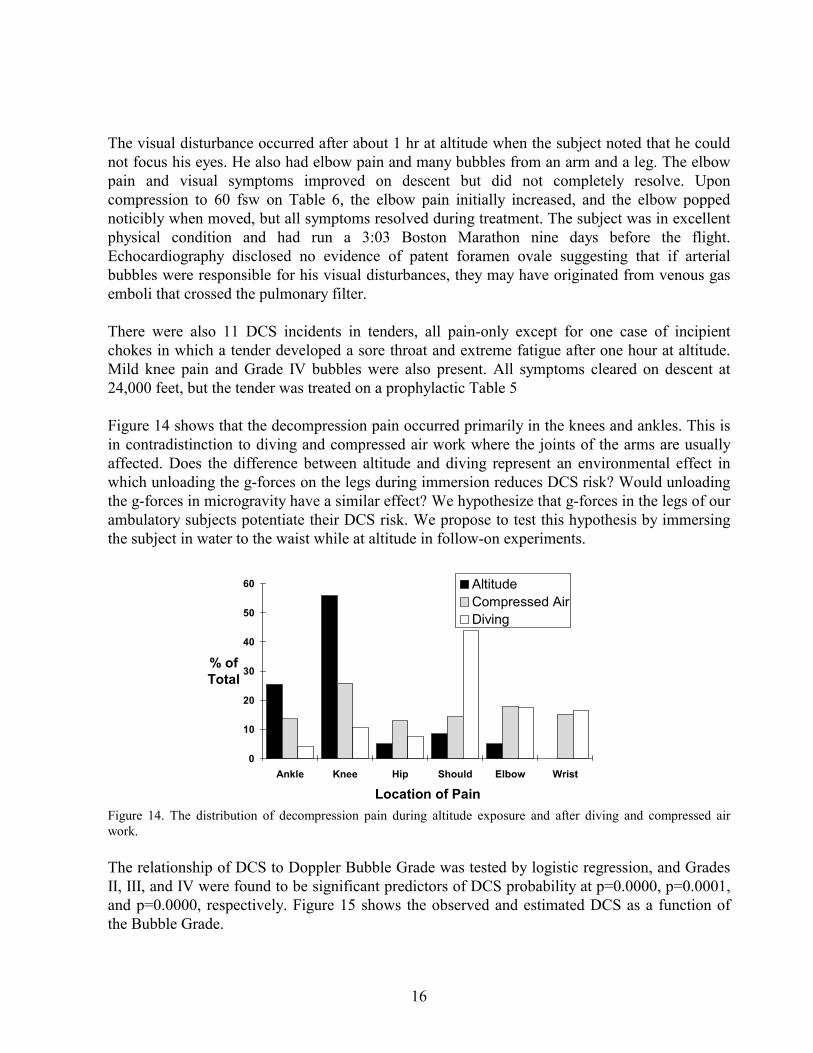
The visual disturbance occurred after about 1 hr at altitude when the subject noted that he could not focus his eyes. He also had elbow pain and many bubbles from an arm and a leg. The elbow pain and visual symptoms improved on descent but did not completely resolve. Upon compression to 60 fsw on Table 6, the elbow pain initially increased, and the elbow popped noticibly when moved, but all symptoms resolved during treatment. The subject was in excellent physical condition and had run a 3:03 Boston Marathon nine days before the flight. Echocardiography disclosed no evidence of patent foramen ovale suggesting that if arterial bubbles were responsible for his visual disturbances, they may have originated from venous gas emboli that crossed the pulmonary filter. There were also 11 DCS incidents in tenders, all pain-only except for one case of incipient chokes in which a tender developed a sore throat and extreme fatigue after one hour at altitude. Mild knee pain and Grade IV bubbles were also present. All symptoms cleared on descent at 24,000 feet, but the tender was treated on a prophylactic Table 5 Figure 14 shows that the decompression pain occurred primarily in the knees and ankles. This is in contradistinction to diving and compressed air work where the joints of the arms are usually affected. Does the difference between altitude and diving represent an environmental effect in which unloading the g-forces on the legs during immersion reduces DCS risk? Would unloading the g-forces in microgravity have a similar effect? We hypothesize that g-forces in the legs of our ambulatory subjects potentiate their DCS risk. We propose to test this hypothesis by immersing the subject in water to the waist while at altitude in follow-on experiments.
Location of Pain
% ofTotal
0
10
20
30
40
50
60
Ankle Knee Hip Should Elbow Wrist
AltitudeCompressed AirDiving
Figure 14. The distribution of decompression pain during altitude exposure and after diving and compressed air work.
The relationship of DCS to Doppler Bubble Grade was tested by logistic regression, and Grades II, III, and IV were found to be significant predictors of DCS probability at p=0.0000, p=0.0001, and p=0.0000, respectively. Figure 15 shows the observed and estimated DCS as a function of the Bubble Grade.

17
The relationship of DCS to nitrogen elimination was explored by comparing the percentage differences for the 30 min washout periods (see Fig. 2) between subjects who did not and who did develop DCS. These differences are shown on the y-axis in Fig. 16 where the x-axis is the washout period. Subjects who did not develop DCS eliminated 40% more nitrogen during the third hour of washout compared to subjects who did develop DCS. The nitrogen volume eliminated in the third hour was very small (Fig. 2) suggesting that slow tissues having limited nitrogen capacity may be responsible for mild DCS. The practical significance of this observation may be that a short air breathing interval during or after a long oxygen prebreathe has little effect on DCS risk. Thus, the oxygen "pay-back" for an air break may be shorter than presently believed.
Figure 15. DCS observed experimentally and estimated by logistic regression as a function of the precordial Doppler Bubble Grade.
Prebreathe Period (min)
% N2Elimination
(NoDCS-DCS)
-15
-5
5
15
25
35
45
0-30 30-60
60-90
90-120
120-150
150-180
Figure 16. Differences in nitrogen elimination between subjects who did not and did develop DCS in relation to the gas volumes (expressed as percentages) eliminated in 30 min washout periods.

18
When the gas volumes eliminated during the 30 min prebreathe periods were tested for association with DCS by logistic regression, 120-150 min was the only period found to be significant (p=0.0254). Figure 17 shows the estimated relationship of DCS probability to the observed range of nitrogen elimination in ml/lb during the 120-150 min period. P(DCS) approached 50% for low nitrogen volumes and fell to below 10% for large volumes. A final test was conducted to assess the association of DCS with the predictor variables as done earlier for precordial bubbles (Figs. 10-13). Variables found to be significant were: 25 watts of prebreathe exercise (p=0.0025), 50 watts of prebreathe exercise (p=0.0114), prebreathe duration (p=0.0062), weight/height (p=0.048), and immersion (p=0.033). Two other variables, nipride infusion (p=0.0528) and ascent rate (p=0.0636), might reach significance with additional testing proposed below. The overall model had a p-value of 0.0034. Figures 18-21 show P(DCS) as a function of weight/height with the remaining predictors as parameters against the background of standard conditions: 3500 ft/min, 3.5 hrs O2, and rest.
Figure 17. DCS probability estimated by logistic regression as a function of the nitrogen volume per pound body weight eliminated during 120 to 150 min.

19
Figure 18. The effect of ascent rate on the probability of decompression sickness (p=0.0802).
Figure 19. The effect of work on the probability of decompression sickness (p=0.0018).
Figure 21. The effect of oxygen prebreathe time on the probability of decompression sickness (p=0.0036).
Figure 20. The effect of nipride infusion (p=0.0727) and immersion (p=0.0470) on the probability of decompression sickness.

20
Predictor Variables Table 2 summarizes the significance of the predictor variables in descending order from most to least for all three outcomes -- nitrogen elimination, precordial bubbles, and DCS. The multiple regression model of nitrogen elimination proved to be the best fit as indicated by its overall p-value of 0.000. The logistic models for bubbles and DCS were less significant. The predictors -- prebreathe work, prebreathe time, weight/height, and immersion -- were most strongly associated with the outcome variables making them the best candidates for real effects. Further testing may prove ascent rate to be significant as well. Body position and nipride infusion are of uncertain significance although this may simply reflect effects too small to resolve in the testing conducted to date. The individual predictors are discussed below. Table 2. Predictor variable significance from best to worst for all outcome variables. Outcome p-values Variable Model O2 Time 25 W 50 W Immer Wt/Ht Rate HDT Nipride Seated SupineN2 Vol 0.000 0.0007 0.0000 0.0000 0.006 ns na ns ns 0.0000 ns P(Bub) 0.0025 0.0395 (0.0563) ns ns 0.0270 (0.052) 0.0036 ns ns ns P(DCS) 0.0034 0.0062 0.0025 0.0114 0.0330 0.0480 (0.064) ns (0.053) ns ns "na" = not applicable; "ns" = not significant; "( )" = potentially significant with further testing
Prebreathe Exercise. Prebreathe exercise was a clearly effective method for accelerating nitrogen washout, reducing decompression risk, and perhaps reducing oxygen prebreathe time. This was suggested by the preliminary study of Webb et al. (1993) that used a high workload for a short duration. Oxygen Prebreathe Duration. The significance of oxygen prebreathe duration is no surprise and confirms what has been known for 50 years. The strength of the effect is emphasized by the relatively few studies (20) that were conducted with 2.5 hr prebreathes. Immersion. The beneficial effects of warm water immersion previously reported by Balldin were also confirmed. In addition, immersion may have a role to play in simulating microgravity during altitude exposure. This factor remains to be explored as a possible explanation for the apparent difference between EVA and ground-based DCS risk. Weight Training and Weight/Height. For the reasons outlined in the review of bubble formation above, we tested the possibility that weight trainers might be at a greater risk of DCS than non-weight trainers (Vann et al. 1993). We recruited weight trainers and required them to abstain from exercise for two weeks before the first of two flights (Table 1, Condition 14). Our hypothesis was that the effects of previous weight training would dissipate during this period. After their first flight, the subjects undertook a strenuous six day program of weight lifting which culminated seven days later in a flight identical to the first flight (Table 1, Condition 15). The DCS incidence was lower after the second flight (4/10) than after the first (6/12). In accord with this outcome, three subjects for whom nitrogen elimination data were available for both flights eliminated more nitrogen after the second prebreathe (e.g., Fig. 7). Weight trainers had an overall DCS incidence of 45% (10/22) while non-weight trainers (Table 1, Condition 5) had an incidence of 10% (1/10).
21
A number of phenomena may have been operative during these studies: (a) If increased DCS susceptibility accompanies weight training, it make take longer than two weeks to dissipate. (b) The subjects may have eliminated more nitrogen and may have been at lower risk during the second flight because the six days of weight lifting improved their physical fitness. The differences in DCS incidence and nitrogen elimination are too small to prove this, however. (c) As postulated in literature reviews above, g-forces on the lower limbs may contribute to DCS susceptibility during ground-based studies, and weight/height may be a measure of lower-body dynamic loading in 1-g. This is consistent with the effects of weight/height in Figs. 10-13 and 18-21. Indeed, the weight trainers of Conditions 14 and 15 had a mean weight to height ratio of 2.61 lb/in as opposed to non-weight trainers of Condition 5 whose ratio was 2.23 lb/in. It is not possible to reach conclusions concerning issues (a)-(c) with data currently available. We will attempt to develop additional data in follow-on studies. Ascent Rate. Recent reviews of the effects of ascent to altitude have proven frustrating despite many thousands of trials in the literature because of inhomogeneity in the data (Kumar et al. 1991, 1992). We will continue to explore the differences between 1,000 and 3,500 ft/min ascent rates as our analysis suggests that significance may be achieved within a reasonable number of trials. Body Position. While the effects of body position may be small when compared to exercise or immersion, we will continue to explore it as necessary component of other studies. Nipride Infusion. Table 2 suggests that the effect of nipride infusion was weak. To avoid clinical side-effects in our subjects such as headache, we limited the dosage to that which would produce a mean arterial pressure drop of not more than 10 torr. We do not plan further nipride experiments. Immersion in Oxygen. Immersion in oxygen appeared to have little effect on nitrogen washout (Fig. 6), and we do not plan further studies. Conclusion and Follow-On Studies The results of these studies are consistent with the proposed hypotheses. In our follow-on studies, we expect to better define the statistical correlations of physiological and environmental conditions with respiratory nitrogen elimination, probability of central venous bubbles, and DCS probability. By immersing the subjects during altitude exposure to simulate microgravity, we also expect to provide an indication of whether DCS risk might be intrinsically lower in microgravity than at 1-g.

22
We will conduct two experiments per month in which we measure respiratory nitrogen elimination during 3.5 hrs of preflight oxygen breathing under conditions including seated and supine body positions, immersion, and exercise. Subjects will be decompressed at 1,000 or 3,500 ft/min to 4.3 psia (30,000 feet) and remain for up to 4 hrs while performing standard EVA-simulation exercises. Subjects will be monitored for signs and symptoms of DCS and for precordial Doppler bubbles. We will increase the number of trials to at least 15 for conditions already studied, add new conditions to fill out the experimental matrix, and simulate microgravity during hypobaric exposure by immersion. Nitrogen elimination data will be analyzed by multiple regression. DCS and Doppler bubble data will be analyzed by logistic regression and survival analysis. Our ultimate goals are to understand the fundamental physiology of decompression and, in particular, the physiological adaptations to microgravity, and to apply this understanding to safely reduce the time necessary to prepare for EVA.

23
REFERENCES Balke, B. 1954. Rate of gaseous nitrogen elimination during rest and work in relation to the
occurrence of decompression sickness at high altitude. USAF School of Aviation Medicine Project No. 21-1201-0014, Report No. 6, Oct. 1954.
Balldin, U.I. 1973. Effects of ambient temperature and body position on tissue nitrogen elimination in man. Aerosp. Med. 44(4): 365-370.
Balldin, U.I. 1973. The preventive effect of denitrogenation during warm water immersion on decompression sickness in man. Proc. 1st Ann. Scientific Meeting of the European Undersea Biomedical Society, Stockholm. Forsvarsmedicin (Stockholm) 9: 239-243.
Balldin, U.I. 1976. The effects of body position and a vasodilator on xenon 133 elimination from human subcutaneous fat. Undersea Biomed. Res. 3(4): 379-385.
Balldin, U.I. and M. Liner. 1978. Preventive effect of a vasodilator on the occurrence of decompression sickness in rabbits. Aviat. Space Environ. Med. 49(6):759-762.
Balldin, U.I. and C.E.G. Lundgren. 1972. Effects of immersion with the head above water on tissue nitrogen elimination in man. Aerosp.Med. 43(10): 1101-1108.
Balldin, U.I., C.E.G. Lundgren, J.Lundvall, and S.Mellander. 1971. Changes in the elimination of 133 xenon from the anterior tibial muscle in man induced by immersion in water and by shifts in body position. Aerosp. Med. 42(5):489-493.
Campbell, J. 1968. The tribonucleation of bubbles. Brit, J. Appl. Phys. (J. Phys. D), Ser. 2, 1: 1085-1088.
Cottrell, A.H. The mechanical properties of matter. New York: Wiley, 1964. Daniels, S., K.C. Eastaugh, W.D.M. Paton, and E.B. Smith. 1984. Micronuclei and bubble
formation: a quantitative study using the common shrimp, crangon cragnon. In: Underwater Physiol. VIII, pp. 147-157, Ed. A.J. Bachrach and M.M. Matzen, Undersea Med. Soc., Bethesda.
Dowson, D., A. Unsworth, and V. Wright. The cracking of human joints - a study of 'cavitation' in the metacarpo-phalangeal joint. In: Proc. Tribology Convention 1971. Tribology Group, Ddouglas, Isle of Man, Engl. May 12-15, 1971. Instn. of Mech. Engrs., London. Pp. 120-127.
Evans, A. and D.N. Walder. 1969. Significance of gas micronuclei in the aetiology of decompression sickness. Nature, Lond. 222: 251-252.
Finkelstein, Y. and A. Tamir. 1985. Formation of gas bubbles in supersaturated solutions of gases in water. AIChE J. 31(9): 1409-1418.
Ford, L.T., L.A. Gilula, W.A. Murphy, and M. Gado. 1977. Analysis of gas in vacuum lumbar disc. Am. J. Roentgenol. 128: 1056-1057.
Gershon-Cohen, J. 1945. Internal derangements of the knee joint. The diagnostic scope of the soft tissue. Roentgen examinations and the vacuum technique demonstration of the menisci. AJR 54: 338-347.
Gerth, W.A. and E.A. Hemmingsen. 1976. Gas supersaturation thresholds for spontaneous cavitation in water with gas equilibration pressures up to 570 atm. Z. Naturforsch. 31a: 1711-1716.
Gerth, W.A. 1979. Studies of Spontaneous Bubble Nucleation in Gas Supersaturated Liquids In Vitro with Implications for Bubble Formation In Vivo. Dissertation. University of California, San Diego. 151 pp.

24
Gerth, W.A., R.D. Vann, N.E. Leatherman, and M.D. Feezor. 1987. Effects of microgravity on tissue perfusion and the efficacy of astronaut denitrogenation for EVA. Aviat. Space Environ. Med. 58(9, Suppl.): A100-105
Harvey, E.N., D.K. Barnes, W.D. McElroy, A.H. Whiteley, D.C. Pease, and K.W. Cooper. 1944. Bubble formation in animals. I. Physical factors. J. Cellular Comp. Physiol. 24(1):1-22.
Harvey, E.N. On cavity formation in water. J. Appl. Physics 1947; 18(2): 162-172. Hayward, A.T.J. 1967. Tribonucleation of bubbles. Brit. J. Appl. Phys. 18: 641-644. Hemmingsen, E.A. 1989. Nucleation of bubbles in vitro and in vivo. In: Supersaturation and
Bubble Formation in Fluids and Organisms. Brubakk, A.O., Hemmingsen, B.B. and Sundnes, G., Eds. Trondheim, Norway.
Jones, H.B. 1951. Preoxygenation and nitrogen elimination. Part II. Gas exchange and blood-tissue perfusion factors in various body tissues. In: Decompression Sickness. Ed. J.F.Fulton. Pp.278-321. Philaphelphia: Saunders.
Knutsson, F. 1942. The vacuum phenomenon in the intervertebral discs. Acta Radiologica 23: 173-179.
Kumar, K.V. Waligora, J.M. and Calkins, D.S. 1990. Threshold altitidue resulting in decompression sickness. Aviat. Space Environ. Med. 61:685-689.
Levy, M.N. and Talbot, J.M. 1983. Cardiovascular deconditioning of space flight. The Physiologist 26: 297-303.
Martel, W. and A.K. Poznanski. 1970. The value of traction during roentgenography of the hip. Rad. 94: 497-503.
Mayall, G.F. 1964. The vacuum phenomenon as evidence of degeneration in the pubic symphysis. Br. J. Radiol. 37: 608-609.
McDonough, P.M. and E.V. Hemmingsen. 1984a. Bubble formation in crustaceans following decompression from hyperbaric gas exposures. J. Appl. Physiol.: Respirat. Environ. Exercise Physiol. 56(2): 513-519.
McDonough, P.M. and E.V. Hemmingsen. 1984b. Bubble formation in crabs induced by limb motions after decompression. J. Appl. Physiol.: Respirat. Environ. Exercise Physiol. 57(1): 117-122.
McDonough, P.M. and E.V. Hemmingsen. 1985. A direct test for the survival of gaseous nuclei in vivo. Aviat. Sp. Environ. Med. 56: 54-56.
McDonough, P.M. and E.V. Hemmingsen. 1985. Swimming movements initiate bubble formation in fish decompressed from elevated gas pressures. Comp. Biochem. Physiol. 81A(1): 209-212.
Nicogossian, A.E., Parker Jr., J.F. 1982. Space Physiology and Medicine. National Aeronautics and Space Administration. NASA SP-447:141-152.
Nishi, R.Y., B.C. Eatock, I.P. Buckingham, and B.A. Ridgewell. 1982. Assessment of decompression profiles by ultrasonic monitoring. Phase III: no-decompression diving. DCIEM Report No. 82-R-38.
Nixon, J.V., Murray, R.G., Bryant, C., Johnson Jr., R.L., Mitchell, J.H., Holland, O.B., Gomez-Sanchez, C., Vergne-Marini, P. and Blomquist, C.G. 1979. Early cardiovascular adaptation to simulated zero gravity. J. Appl. Physiol.: Respirat. Environ. Exercise Physiol. 46:541-548.
Powell, M.R. and Spencer, M.P. 1980. The pathophysiology of decompression sickness and the effects of Doppler-detected bubbles. Final Report. O.N.R. Contract #N00014-73-C-0094. I.A.P.M., Seattle, WA 98122.

25
Powell, M.R., Waligora, J., Norfleet, W. and Kumar, K.V., "Project Argo: Gas Phase Formation in Simulated Microgravity." NASA Technical Report DRAFT, 1992.
Rubin, E.L. 1939. The delineation of articular cartilage by x-rays without the aid of contrast media. Br. J. Rad. 12(144): 649-657.
Swezey, R.L. and S.E. Swezey. 1975. The consequences of habitual knuckle cracking. West. J. Med. 122: 377-397.
Thomas, S.F. and O.L. Williams. 1945. High altitude joint pains (bends): their roentgenographic aspects. Radiology 44: 259-261.
Tikiuisis, P. 1986. Modeling the observations of in vivo bubble formation with hydrophobic crevices. Undersea Biomed. Res. 13:165-180.
Vann, R.D., J. Grimstad, and C.H. Nielsen. 1980. Evidence for gas nuclei in decompressed rats. Undersea Biomed. Res. 7(2): 107-112.
Vann, R.D. 1982. Decompression theory and application. In: The physiology of diving and compressed air work, 3rd edn., pp. 352-382. Ed. P.B. Bennett and D.H. Elliott. London: Bailliere Tindall.
Vann, R.D. 1989. Vacuum phenomena: an annotated bibliography. In: The physiological basis of decompression. Proc. of the 38th Undersea and Hyperbaric Medical Society Workshop. UHMS Pub. 75(Phys)6/1/89. Pp. 179-195.
Vann, R.D., W.A. Gerth and R.D. Thompson. 1993. "Six Days of Weight Training Did Not Increase Susceptibility to Mild Altitude Decompression Sickness." Undersea and Hyperbaric Medicine, 20(Suppl): 69.
Vann, R.D. and Thalmann, E.D. 1993. Decompression physiology and practice. In: Bennett P.B. and Elliott, D.H., Eds. The Physiology and Medicine of Diving. 4th ed. London: Bailliere Tindall, 376-432.
Waligora, J.M., D.J. Horrigan, J. Conklin, and A.T. Hadley III. Verification of an altitude decompression sickness prevention protocol for Shuttle operations utilizing a 10.2 psi pressure stage. NASA JSC Report of Jan. 30, 1984.
Webb, J.T., M.Fischer, J.Wiegman. 1993. Prebreathe enhancement with dual-cycle ergometry may increase decompression sickness protection. Aviat. Space Environ. Med. 64: 420.
Yousefzadeh, D.K. 1979. The value of traction during roentgenography of the wrist and metacarpophalangeal joints. Skel. Radiol. 4:29-33.
Zheng, Q, Durben D.J., Wolf, G.H., Angell, C.A. 1991. Liquids at large negative pressures: water at the homogeneous nucleation limit. Science 254:829-832.

26
Final Report on NAG 9-134/4 Factors Affecting Tissue Perfusion and the
Efficacy of Astronaut Denitrogenation for Extravehicular
Activity R.D. Vann, Ph.D. and W.A. Gerth, Ph.D.
March 31, 1995 F.G. Hall Hypo/Hyperbaric Center Duke University Medical Center
Durham, NC
Final Report on NAG 9-134/4 Factors Affecting Tissue Perfusion and the
Efficacy of Astronaut Denitrogenation for Extravehicular
Activity R.D. Vann, Ph.D. and W.A. Gerth, Ph.D.
March 31, 1995 F.G. Hall Hypo/Hyperbaric Center Duke University Medical Center
Durham, NC
Final Report on NAG 9-134/4 Factors Affecting Tissue Perfusion and the
Efficacy of Astronaut Denitrogenation for Extravehicular
Activity R.D. Vann, Ph.D. and W.A. Gerth, Ph.D.
March 31, 1995 F.G. Hall Hypo/Hyperbaric Center Duke University Medical Center
Durham, NC
Final Report on NAG 9-134/4 Factors Affecting Tissue Perfusion and the Efficacy of Astronaut Denitrogenation for Extravehicular Activity R.D. Vann, Ph.D. and W.A. Gerth, Ph.D. March 31, 1995 F.G. Hall Hypo/Hyperbaric Center Duke University Medical Center Durham, NC

27