factors affecting the production of concentrated blue
TRANSCRIPT

Clemson UniversityTigerPrints
All Theses Theses
8-2012
Factors Affecting the Production of ConcentratedBlue Cheese FlavoringsJason RainesClemson University, [email protected]
Follow this and additional works at: https://tigerprints.clemson.edu/all_theses
Part of the Food Science Commons
This Thesis is brought to you for free and open access by the Theses at TigerPrints. It has been accepted for inclusion in All Theses by an authorizedadministrator of TigerPrints. For more information, please contact [email protected].
Recommended CitationRaines, Jason, "Factors Affecting the Production of Concentrated Blue Cheese Flavorings" (2012). All Theses. 1436.https://tigerprints.clemson.edu/all_theses/1436

FACTORS AFFECTING THE PRODUCTION OF CONCENTRATED BLUE CHEESE
FLAVORINGS
A Thesis
Presented to
the Graduate School of
Clemson University
In Partial Fulfillment
of the Requirements for the Degree
Master of Science
Food, Nutrition, and Culinary Sciences
By
Jason Charles Raines
August 2012
Accepted by:
Dr. John U. McGregor, Committee Chair
Dr. Terry Walker
Dr. Feng Chen
ii
ABSTRACT
The effects of media type and culture selection on the aroma profile of Blue
cheese flavorings produced using submerged culture fermentation were studied.
Fermentations were carried out for 16 hours then compared using sensory analysis and
GC/MS SPME. The differences between samples were minimal. Samples produced with
adjunct media were found to have higher concentrations of methyl ketones and more
“creamy” aroma character than samples produced from standard media. Higher levels of
free fatty acids were found in standard media samples. Adjunct cultures appear to
enhance the “creamy” character of Blue cheese flavorings.
Near-critical and supercritical carbon dioxide were used to concentrate the aroma active
compounds of a traditional Blue cheese and a Blue cheese flavoring. Pressures used ranged from
73 to 90 Bar, temperatures used were 35 and 45 degrees Celsius. The extracts were selective for
2-heptanone and 2-nonanone, the characteristic compounds of Blue cheese. Two-heptanone was
more soluble than 2-nonanone and comprised 67 to 71 percent of the extracts. Near-critical
extraction (73 Bar; 35 degrees Celsius) of Blue cheese flavoring yielded the most methyl ketones.
Results indicate that carbon dioxide may be effective for the concentration of methyl ketones on
an industrial scale.

iii
DEDICATION
I dedicate this thesis to my mother and father who have always supported me in
the pursuit of knowledge.

iv
ACKNOWLEDGEMENTS
Thank you, Dr. McGregor, for being a great mentor throughout my time at
Clemson University and guiding me through the many challenges of designing a research
study. Thank you, Dr. Walker and Dr. Chen, for sharing your expertise and graciously
allowing me to use your laboratories for my research study. Thank you, Dr. Rieck, for all
your help with the statistical design and data analysis for the fermentation study.
Thank you, Edlong Dairy Flavors, for funding and supporting this research
project. Thank you, Dave Schumacker, for working to bring this research project to
Clemson University as well as helping with sample analysis.
Thank you, Greg Jones, for your help developing methods for GC analysis and
training me to use the instrument. Thank you, Keri Lipscomb and Dr. Coffee, for your
help designing and implementing the sensory study. Thank you, Dr. Nishanth Tharayil,
for your help with analysis of the extraction samples.
Tim, Anthony, and Becky, thank you, for answering my questions about Clemson
Blue Cheese and allowing me to collect whey for my study. Thank you, Chr. Hansen and
Danisco, for providing ingredients and technical support.
Thank you, Kim Collins and Glenda Brown, for all your help throughout the
years. I would also like to thank all the students, faculty, and staff in the Food, Nutrition,
and Packaging Sciences department for making my time at Clemson University
memorable.

v
TABLE OF CONTENTS
Page
TITLE PAGE ................................................................................................................... i
ABSTRACT ..................................................................................................................... ii
DEDICATION ................................................................................................................ iii
ACKNOWLEDGMENTS .............................................................................................. iv
LIST OF TABLES ........................................................................................................... x
LIST OF FIGURES ....................................................................................................... xii
CHAPTER 1: REVIEW OF BLUE CHEESE FLAVOR TECHNOLOGY AND
SUPERCRITICAL FLUID EXTRACTION IN THE FOOD INDUSTRY ................... 1
Demand for Blue Cheese and Natural Flavorings ........................................................... 1
Demand for Blue-type Cheeses ........................................................................... 1
Demand for Natural Flavors ................................................................................ 2
Manufacture of Blue Cheese and Concentrated Cheese Flavorings ................................ 2
Traditional Blue Cheese Manufacturing .............................................................. 2
Methods of Accelerating Ripening of Traditional Cheese .................................. 6
Production of Concentrated Cheese Flavors ........................................................ 8
Production of Concentrated Blue Cheese Flavorings ........................................ 11
Flavor Chemistry and Biochemistry of Blue Cheese ..................................................... 17
Ketones .............................................................................................................. 17
Fatty Acids ......................................................................................................... 21
Alcohols ............................................................................................................. 25
vi
Esters .................................................................................................................. 26
Lactones ............................................................................................................. 28
Aldehydes .......................................................................................................... 29
Sulfur Compounds ............................................................................................. 29
Supercritical Fluid Extraction ........................................................................................ 30
Supercritical Fluid Background ......................................................................... 30
Supercritical Fluid Uses in Foods ...................................................................... 31
Supercritical Fluid Uses in Dairy Products ........................................................ 32
Supercritical Fluid Extraction of Dairy Aroma Compounds ............................. 34
Supercritical Fluid Extraction for the Production of Aroma Extracts ............... 36
Literature Cited .............................................................................................................. 39
CHAPTER 2: THE EFFECT OF MICROBIAL POPULATION AND
FERMENTATION MEDIA ON THE PRODUCTION OF NATURAL BLUE
CHEESE FLAVORINGS .............................................................................................. 47
Abstract .......................................................................................................................... 47
1. Introduction ................................................................................................................ 47
2. Materials and Methods ............................................................................................... 50
2.1 Fermentation of Blue Cheese Flavorings ..................................................... 50
2.2 Sensory Analysis of Blue Cheese Flavorings .............................................. 52
2.3 GC/MS SPME Analysis ............................................................................... 53
2.4 Statistical Analysis ....................................................................................... 54

vii
3. Results ........................................................................................................................ 54
3.1 Sensory Analysis Data ................................................................................. 54
3.1.1 Creamy Aroma .............................................................................. 55
3.1.2 Cheesy/Rancid Aroma .................................................................. 56
3.1.3 Blue Cheese Aroma ...................................................................... 56
3.2 GC/MS SPME Data ..................................................................................... 56
4. Discussion .................................................................................................................. 60
4.1 Creamy Aroma ............................................................................................. 60
4.2 Cheesy/Rancid Aroma and Free Fatty Acid Concentration ......................... 61
4.3 Blue Cheese Aroma and Methyl Ketones .................................................... 64
4.4 Limitations ................................................................................................... 67
4.4.1 Limitations of Sensory Study........................................................ 67
4.4.2 Limitations of GC/MS SPME ....................................................... 68
5. Conclusions ................................................................................................................ 69
6. Future Studies ............................................................................................................ 69
Acknowledgements ........................................................................................................ 70
Literature Cited .............................................................................................................. 71
CHAPTER 3: EXTRACTION OF BLUE CHEESE FLAVOR COMPOUNDS FROM
NATURAL SOURCES WITH NEAR-CRITICAL AND SUPERCRITICA CARBON
DIOXIDE ....................................................................................................................... 73
Abstract .......................................................................................................................... 73

viii
1. Introduction ................................................................................................................ 73
2. Materials and Methods ............................................................................................... 76
2.1 Samples ........................................................................................................ 76
2.1.1 Blue Cheese Samples ......................................................................... 76
2.1.2 Blue Cheese Flavoring Samples ........................................................ 76
2.2 Extractions ................................................................................................... 77
2.3.1 Blue Cheese Extractions ............................................................... 78
2.3.2 Blue Cheese Flavoring Extractions ............................................... 78
2.3 GC/MS Analysis .......................................................................................... 78
3. Results and Discussion .............................................................................................. 79
4. Conclusions ................................................................................................................ 83
5. Future Studies ............................................................................................................ 83
Acknowledgements ........................................................................................................ 83
Literature Cited .............................................................................................................. 84
CHAPTER 4: CONCLUSIONS .................................................................................... 87
APPENDICES ............................................................................................................... 90
Appendix A ........................................................................................................ 90
Appendix B ........................................................................................................ 91
Appendix C ........................................................................................................ 96
Appendix D ........................................................................................................ 98
Appendix E ...................................................................................................... 101
Appendix F....................................................................................................... 106

ix
Appendix G ...................................................................................................... 109

x
LIST OF TABLES
Table Page
1.1 Treatment Layout .................................................................................................... 51
1.2 Original Balanced Incomplete Block Design ......................................................... 53
1.3 Estimated Blue Cheese Flavoring Aroma Characteristic Intensity Scores ............. 55
1.4 Estimate Effect of Media and Adjunct Culture on the Aroma Characteristic
Scores ...................................................................................................................... 55
1.5 GC/MS SPME Average Peak Areas ....................................................................... 58
1.6 Estimate of Media and Culture Effects on Relative Peak Areas of Blue Cheese
Aroma Compounds ................................................................................................. 59
2.1 Total Extracted 2-heptanone and 2-nonanone for Blue Cheese and Blue Cheese
Flavorings ............................................................................................................. 79
2.2 Extract Percent Composition ................................................................................. 81
2.3 Relative Peak Areas of Aroma Compounds in Blue Cheese Flavoring prior to
Centrifugation and Extraction ................................................................................ 82
A.1 Raw Aroma Intensity Scores for Sensory Analysis .............................................. 91
A.2 Methyl Ketone Peak Areas ................................................................................... 96
A.3 Free Fatty Acid Peak Areas .................................................................................. 97
A.4 Sensory Qualities of Cheddar EMC Extracts ........................................................ 99
A.5 Preliminary SFE Results for Various Raw Materials ......................................... 100
A.6 GC/MS Peak Areas 2-heptanone and 2-nonanone .............................................. 101
A.7 GC/MS Standards Data ....................................................................................... 104

xi
A.8 Calculated 2-heptanone and 2-nonanone Concentrations ................................... 105
xii
LIST OF FIGURES
Figure Page
1.1 Sample Chromatograph GC/MS SPME for Blue Cheese Flavorings ...................... 51
2.1 Total Extracted 2-heptanone and 2-nonanone for Blue Cheese and Blue
Cheese Flavoring ................................................................................................... 79
A.1 Relative Peak Area of 2-heptanone and 2-nonanone Extracted from Blue
Cheese .................................................................................................................. 103
A.2 Relative Peak Area of 2-heptanone and 2-nonanone Extracted from Blue
Cheese Flavoring ................................................................................................. 104
A.3 GC/MS Calibration Curve .................................................................................... 105
A.4 Proposed Process Flow Diagram for Concentrated Blue Cheese Flavoring
Production ........................................................................................................... 110

CHAPTER 1: REVIEW OF BLUE CHEESE FLAVOR TECHNOLOGY AND
SUPERCRITICAL FLUID EXTRACTION IN THE FOOD INDUSTRY
Demand for Blue-type Cheeses
Blue-type cheeses are enjoyed around the world for their unique strong and
piquant flavors. Most dairying countries have their own variety or varieties of Blue
cheese. England has Stilton, Huntsman, and Shropshire Blue. France has Roquefort and
Bleu d’Auvergne. Italy has Gorgonzola. Spain has Cabrales. Ireland has Cashel Blue.
The United States, Argentina, and Denmark all have their own varieties of Blue cheese
(Cantor and others, 2004; McCalman and Gibbons, 2009; Wolf and others, 2011). Most
of these varieties follow century old recipes. Gorgonzola dates back to at least 879.
Roquefort has been reported as early as 1070. Some blue-type cheeses have been granted
Protected Designation of Origin (PDO) status meaning that they can only be produced in
defined regions (Cantor and others, 2004). To be called “Roquefort cheese”, a cheese
must be aged in specific caves in the Roquefort region of France (Dalby, 2009). Of
these, Stilton, Roquefort, Gorgonzola, Cabrales, and Blue are the most famous blue-type
cheeses worldwide (McCalman and Gibbons, 2009).
Demand for cheese flavors is growing in large part due to their use in salty snacks
(Ziegler, 2007). Compared to Cheddar cheese, Blue cheese occupies a small segment of
the market. Yet considering the large market demand for cheese flavors, there is still
significant demand for Blue cheese in North American and European markets (Wright,
2004).
2
Demand for Natural Flavors
Demand for flavorings has been growing continually over the last hundred years.
In 2011, the Flavor and Fragrance industry was valued at 21.8 billion dollars (US)
worldwide (Leffingwell and others, 2012). Since the mid-1990’s, consumers have been
demanding food products containing natural ingredients and flavors (Ziegler, 2007). In
the United States, natural flavors are defined as:
“The term natural flavor or natural flavoring means the essential oil, oleoresin,
essence or extractive, protein hydrolysate, distillate, or any product of roasting,
heating or enzymolysis, which contains the flavoring constituents derived from a
spice, fruit or fruit juice, vegetable or vegetable juice, edible yeast, herb, bark,
bud, root, leaf or similar plant material, meat, seafood, poultry, eggs, dairy
products, or fermentation products thereof, whose significant function in food is
flavoring rather than nutritional.” (Code of Federal Regulations: Title 21, Part
101.22.a.3, 2012).
Consumers perceive natural flavors as being more healthful and having better flavor
characteristics (Ziegler, 2007). Natural flavors, thus, demand a higher price (Cheetham,
1997).
Traditional Blue Cheese Manufacturing:
The basic steps involved in the manufacture of cheese include preparation of the
cheese milk, acidification, coagulation, syneresis, pressing, and salting followed by aging

3
(Nelson, 1970; Fox and others, 2000; Cantor and others, 2004 Azarnia and others, 2006;
McSweeny, 2007; Karlin, 2011).
Important in the production of all cheeses is the selection of cheesemilk.
Traditional Blue cheeses are made from cow, sheep, or goat milk. Blends of milk are
also used in keeping with tradition or to create a unique flavor profile (McCalman and
Gibbons, 2009). Individual differences in the breed of dairy animal, even within a
species, can also impact flavor and cheese yield due to variations in the fat content,
protein content, or fatty acid profile of the milk (Fox and others, 2000). Milking schedule
and status of the animal can also impact the type of milk yielded. Gorganzola cheese is
named for the use of rich, creamy milk from over-milked cows (Dalby, 2009). Besides
breed, the diet of the animal and the native microflora in the milk also effect cheese
flavor. The subtle yet unique flavors produced by the combination of breed, diet, and
microflora are often referred to as terrior by cheese connoisseurs (McCalman and
Gibbons, 2009).
Preparation of the cheese milk typically involves pasteurization. Pasteurization is
used by some cheesemakers to ensure the safety of the milk and also produce cheeses
with a more consistent flavor profile. Other cheesemakers use raw milk for the
production of their Blue cheeses. Raw milk cheese producers report a more nuanced
flavor profile for their cheeses as compared to pasteurized milk cheeses (McCalman and
Gibbons, 2009). Stilton by definition must be made from pasteurized milk whereas
Roquefort must be made with raw milk. The Food and Drug Administration (FDA)
4
prohibits the sale of unpasteurized cheeses aged less than 60 days in the United States of
America due to the possibility of pathogenic bacteria in cheese milk (McSweeny, 2007).
Starter bacteria acidify the milk lending a tart flavor to the cheese as well as
preparing the milk for coagulation by the rennet. Acidification times vary based on
starter culture, temperature, and desired pH. Times are typically between half of an hour
to one and a half hours at 86 degrees Fahrenheit (Karlin, 2011). Ideally, acidification
occurs within six hours of inoculation (Gobbetti and others, 2007). Longer acidification
times delay productivity and provide greater opportunity for growth of contaminant
organisms. Mesophilic starter bacteria are the predominate culture in the acidification of
most Blue cheese varieties (Cantor and others, 2004). Cheesemakers measure
acidification progress using titratable acidity and pH (Fox and others, 2000). P.
roqueforti cultures are typically added to the cheese milk with the starter Lactic Acid
Bacteria (LAB) or added during the whey drainage or moulding steps (Nelson, 1970;
Cantor and others, 2004; Karlin, 2011).
Coagulation for all aged cheeses occurs due to the addition of renneting enzyme
which cleaves off the water soluble portion of casein molecules and allows preliminary
curd formation. Rennet, from animal, vegetable, or microbial source, degrades casein
micelles by cleaving the 105-106 (PHE-MET) bond on the casein molecule thereby
removing the glycomacro peptide. Removal of the glycomacro portion (water-soluble) of
casein allows bonding between the now hydrophobic portions of the remaining casein.
Traditionally, the enzymes used in cheese manufacture are derived from an animal
source, but modern rennet enzymes can also be purified from vegetable and microbial
5
sources (Fox and others, 2000). Renneting typically lasts for one hour to one and a half
hours at 30 degrees Celsius (86 degrees Fahrenheit) for Blue cheese (Karlin, 2011).
After the milk is coagulated, the gelled mass is cut into small (1/2 to 1 inch) cube
shaped curds. These curds are then slowly heated in the cooking step to tighten the
protein network and remove water. Blue cheeses, being relatively moist cheeses (37 to
47 percent moisture), are cooked at milder temperatures for shorter times than hard
cheeses like Emmental or Parmesan. Some Blue cheese recipes do not utilize a cooking
step (Cantor and others, 2004; Karlin, 2011).
The curds are then separated from the whey through a draining process (Fox and
others, 2000). Due to the high salt requirements of Blue cheese, the curds are typically
salted after draining and prior to knitting and pressing. By directly adding salt to the
curds, cheesemakers can insure even distribution and a high concentration of salt in the
cheese (Cantor and others, 2004). Salt helps control mold growth and prevent excessive
proteolysis/bitterness in the ripened cheese (Kinesella and Hwang, 1976b).
Knitting and pressing of Blue cheese curds is important in reaching the target
moisture content and water activity of the finished cheese. Harder blue veined cheeses,
like Stilton, have moisture removed by pressing. Softer varieties, like Gorganzola,
achieve proper moisture levels by allowing curds to knit together under their own weight
(Karlin, 2011).
Blue-veined cheeses are unique among other varieties in that holes are
deliberately created to allow more oxygen to enter the cheese (Nelson, 1970). Oxygen
facilitates the growth and sporulation of P. roqueforti as well as the development of

6
characteristic Blue cheese flavor (Kinsella and Hwang, 1976a,b; Cantor and others,
2004). Blue-type cheeses are typically aged at 8 to 15 degrees Celsius for 60 to 90 days
(Cantor and others, 2004; Karlin, 2011).
Methods of Accelerating Ripening of Traditional Cheese
Much effort and research has been devoted to decreasing the time required to
develop flavor in cheese without perceptible changes in cheese quality. Methods for the
advanced ripening of traditional style cheese include elevation of ripening temperature,
addition of enzymes, use of adjunct/attenuated cultures, and the use of genetically
modified cultures (Fox and others, 2000; Azarnia and others, 2006).
Elevated ripening temperatures increase the rate of biochemical activity in the
curd. Raising the temperature just a few degrees can shorten aging periods by several
weeks. However, the potential for growth of pathogenic microorganisms increases at
higher temperatures (Fox and others, 2000; Azarnia and others, 2006). Furthermore,
metabolic reactions may be sensitive to the change in temperature potentially creating
off-flavors (Azarnia and others, 2006). Skilled manufacturers can cut ripening time by as
much as 50% by increasing the temperature of the ripening chamber (Fox and others,
2000).
Addition of enzymes at various times (acidification, coagulation, salting, etc.) in
the production of traditional cheeses will increase the rates of certain reactions in the
curd. Since cheese flavor is developed from a complex system of reactions, addition of
one or two enzymes could create an unbalanced flavor profile or excessive bitterness in
the finished cheese (Azarnia and others, 2006). Commercial enzyme manufacturers have

7
developed enzymes and/or enzyme systems specifically for such applications (Fox and
others, 2000). In United States Patent No. 3,975,544, Kosikowski outlines the addition of
lipase and protease enzymes to Cheddar cheese curds after the drainage of whey (1976).
Attenuated and adjunct cultures are also added as sources of enzymes to reduce
the ripening time for various types of cheese. Over-addition of starter bacteria or other
lactose utilizing strains can lead to rapid pH changes in the curd which can cause death of
starter and non-starter bacteria ultimately resulting in slower ripening times; attenuated
starters and non-starter organisms are used instead (Fox and others, 2000). Attenuated
cultures provide a variety of enzymes to the cheese media which more closely resemble
natural enzyme systems without metabolizing lactose. These cells are also highly
autolytic which releases their enzymes into the cheese media for catalytic activity (Fox
and others, 2000). Adjunct cultures also provide multiple enzymes to promote faster
development of flavor within the curd (Azarnia and others, 2006). Adjunct cultures are
considered non-starter LAB since they do not metabolize lactose. Studies suggest
cheeses with adjunct organisms ripen faster than traditional cheeses (Florez and others,
2006; Hickey and others, 2007; Albenzio and others, 2010).
Advances in genetic engineering have inspired attempts to create genetically
modified cultures for the accelerated ripening of cheese. One study tried unsuccessfully
to alter the metabolism of a starter bacterium by creating a shift from homolactic
fermentation to a mixed acid fermentation for the enhanced development of diacetyl and
acetoin in cheese (Akyol and others, 2009). Other attempts at speeding the ripening

8
process with genetically modified organisms have only endured marginal success (Fox
and others, 2000; Azarnia and others, 2006; Weimer and others, 2007).
Production of Concentrated Cheese Flavors
An alternative approach to developing cheese flavor rapidly is the production of
concentrated cheese slurries, pastes, or powders to be used as flavorings and additives in
the food industry. These concentrated flavorings can enhance or replace traditional
cheese in a wide variety of food products. Methods for producing concentrated cheese
flavorings allow manufactures to develop full flavor in as little as 12 hours while also
providing enhanced control over flavor development (Pratt, 1989; Han and others, 2001;
Reddy and others, 2002).
The level of moisture and the time required for ripening are closely related (Fox
and others, 2000). Enzymatic reactions associated with flavor development take place
much faster in higher moisture cheese. More specifically, the growth and metabolic
reactions of ripening bacteria are closely related to the water activity of cheese. High
moisture content in some cheeses (Cheddar, Parmesan) can correlate with excessive
proteolysis and bitterness (Fox and others, 2000). However, higher moisture content in
other cheeses correlates with shorter ripening periods (Brie, Gorganzola; Fox and others,
2000). The production of concentrated cheese flavorings relies heavily on increased
water activity to increase enzymatic reaction rates (Bordeaux, 1987; Marshall and others,
1987; Pratt, 1989).

9
Compared to the traditional and accelerated methods for manufacturing cheese,
production of cheese flavorings has several benefits including reduced cost of raw
materials, reduced production time, greater control over quality, and reduced transport
and storage costs (Pratt, 1989; Kwon and others, 2000 Reddy and others, 2002).
Operations may also be simplified which creates opportunities for savings on operational
costs as well as equipment costs. Concentrated cheese flavorings lose the nuanced flavor
profiles found in artisan cheeses.
A great number of patents have been submitted describing and improving
methods for developing concentrated dairy flavors (Bordeaux, 1987; Marshall and others,
1987; Pratt, 1989; Hagberg and others, 1998; Veal, 1999; Reddy and others, 2002). As
early as the 1960’s, manufacturers began using these methods as well as advances in
biotechnology to create intensely flavored products for use in the food industry (Day and
Anderson, 1966; Moskowitz and Noelck, 1986; Marshall and others, 1987; Han and
others, 2001).
The developments in the field of cheese flavorings include heterogeneous cheese
slurries created by grinding immature (“green”) cheese curd, mixing with water, adding
enzymes, and incubating the mixture for several days (Dooley, 1979; Moskowitz and
Noelck, 1986; Kwon and others, 2000). The mixture is then heated at a temperature and
time sufficient to inactivate the enzymes as well as pasteurize the cheese slurry. The
increased moisture in the system allows large increases in the enzymatic reaction rates
(Kinsella and Hwang, 1976a).
10
These processes provide a value-added use for cheese industry wastes such as
trimmings and rejected product (Kwon and others, 2000; Groesbeck, 2005). United
States Patent No. 6,054,151 describes a process for making a Parmesan cheese flavor by
adding protease, lipase, and at least one strain of lactic acid bacteria to a slurried mixture
of partially aged cheese curd (Kwon and others, 2000). This process requires the
formation of cheese curd which is an added cost to the operation.
More recent approaches allow flavor manufacturers to use homogenous liquid
feed stocks and avoid the steps (and costs) associated with curd formation. Homogenous
liquid media also mixes with greater ease and is much easier to pump. Components of
the feed stock can be derived from any number of sources not limited to dairy (Lecouteux
and others, 2000). United States Patent No. 4,678,673 describes a method for producing
dairy flavors through the fermentation of oilseed with lactic acid bacteria (Marshall and
others, 1987). Other patents stipulate the use of whey protein as an amino acid source for
the production of flavor compounds (Hagberg and others, 1998; Lecouteux and others,
2000; Reddy and others, 2002). Use of non-dairy ingredients allows manufacturers to
produce dairy-free cheese flavors that comply with Kosher, Halal, and vegan standards
(Pratt, 1989; Reddy and others, 2002).
The provisions of United States Patent No. 6,406,724 describe one application of
cheese flavor technology in use today. Using various feed stocks, inoculums, and
enzymes, manufacturers produce a three part flavoring system comprised of a strong
Cheddar type flavor, a buttery type flavor, and cheesy type flavor (2002). By blending

11
these components in different proportions, flavorists can create a wide array of flavor
profiles to simulate various cheese varieties and flavor profiles. The Cheddar-type
component is made by first adding proteolytic and lipolytic enzymes as well as lactic acid
cultures to a feed stock containing ample sulfur containing substrate (cysteine and
methionine). After an incubation period of about 24 hours at around 30 degrees Celsius
(86 degrees F), the mixture is inoculated with a Brevibacterium linens or yeast culture to
catalyze the conversion of sulfur containing substrate to volatile sulfur compounds. The
incubation then proceeds for 3 to 10 days until a desired flavor level is reached at which
time the mixture is heated to inactivate flavor producing enzymes. The buttery type and
cheesy type flavors are produced in a similar fashion. For the buttery type flavor, a feed
stock is inoculated with a lactic acid culture and lipolytic enzyme and incubated. After
about 24 hours, the mixture is inoculated with a diacetyl producing strain, and a source of
citric acid is added to the broth. Flavor is allowed to develop through fermentation for a
period of three to ten days after which the broth is pasteurized. The cheesy flavor is
developed through addition of proteolytic and lipolytic enzymes which are deactivated by
heating once desired cheesy flavor has been produced. These flavoring components can
be used as is or further concentrated by evaporation or spray drying (Reddy and others,
2002).
Production of Concentrated Blue Cheese Flavorings
Concentrated Blue cheese flavorings are produced through the conversion
of fat substrates to methyl ketones. Submerged culture fermentation with aeration and

12
agitation is the preferred method for the production of Blue cheese flavorings (Dwivedi
and Kinsella, 1974a; Kinsella and Hwang, 1976a; Pratt 1989). In some cases, solid state
fermentations are used in the production of concentrated Blue cheese flavorings
(Tomasini and others, 1995; Humphrey and others, 2001). Typically, Penicillium
roqueforti is the organism used in the production of Blue cheese flavorings (Luksas,
1973; Dwivedi and Kinsella, 1974a; Kosikowski and others, 1979). However, other
organisms have demonstrated advantages for certain production methods (Kinderlerer
and Hatton, 1991; Kranz and others, 1992; Van Grinsven and others, 1994; Humphrey
and others, 2001). Both spores and mycelia of P. roqueforti have been used in the
production of Blue cheese flavorings (Fan and others, 1976; King and Clegg, 1980).
Mycelia are more metabolically active than spores (Fan and others, 1976; Groesbeck and
others, 1995). Yet, spores are generally preferred to mycelia because they produce higher
concentrations of methyl ketones, are more resistant to free fatty acid toxicity, and are
less likely to further metabolize methyl ketones to secondary alcohols (Anderson and
Day, 1966; Kinsella and Hwang, 1976; Groesbeck and others, 1995).
Fatty substrates are chosen as a good source of short to medium chain saturated
fatty acids (C4 to C16). Milk fat (from cream, milk, and butter oil) and coconut oil are
used most frequently (Jolly and Kosikowski, 1975; Pratt, 1989; Van Grinsven and others,
1994). Purified free fatty acids are sometimes used in analytical studies of submerged
culture fermentation (Dartley and Kinsella, 1973; Larroche and Gros, 1989). Purified
free fatty acids are too costly for most industrial applications so lipase enzymes are
typically added instead (Jolly and Kinsella, 1975; Kinsella and Hwang, 1976b;

13
Kosikowski and others, 1979; Pratt, 1989; Tomasini and others 1995). Fat content up to
50 percent is reportedly feasible for submerged culture fermentation of Blue cheese
flavorings (Luksas, 1973). For most practical applications, fat content ranges from 3 to
20 percent (Dwivedi and Kinsella, 1974; Jolly and Kosikowski, 1975; Kosikowski, 1979;
Pratt, 1989).
The level of free fatty acid in the culture medium is one of the most important
factors in the production of quality Blue cheese flavorings (Kinsella and Hwang, 1976a,b;
Pratt, 1989; Pannel and Olson, 1991). Fat conversion to methyl ketones occurs in two
steps. First, fatty acids are removed from triglycerides by enzymatic action of lipase.
Then, they are converted to methyl ketones via the classical β-oxidation pathway
(Nelson, 1970; Kinsella and Hwang, 1976a,b). P. roqueforti naturally synthesize lipase;
however, Blue cheese flavoring production is accomplished much faster and more
efficiently when lipase is added to the fermentation broth (Nelson, 1970, Kinsella and
Hwang, 1976a,b; Pratt, 1989; Groesbeck and others, 1995). Lipase, derived from animal
and/or microbial sources, is used in concentrations around 0.5 percent (Amu and Jarvis,
1974; Kosikowski, 1979; Pratt, 1989; Groesbeck and others, 1995). Lipase is either used
prior to fermentation to liberate fatty acids from the fat source or added directly to the
fermentation vessel (Jolly and Kosikowski, 1975; Kosikowski, 1979; Pratt, 1989;
Groesbeck and others, 1995).
Some production methods often include adjunct nutrients (whey protein, sodium
caseinate, milk powder, yeast extract, corn steep liquor, etc.) to promote the growth of P.
14
roqueforti and improve the overall flavor profile (Nelson, 1970; Luksas, 1973; Jolly and
Kinsella, 1975). Though, Pratt has patented a process that achieves a good Blue cheese
flavor without an added nitrogen source (1989). King and Clegg report that adding
soluble casein to submerged fermentation media increased P. roqueforti breakdown of
free fatty acids and production of methyl ketones (1980). Luksas similarly indicates that
sodium caseinate induces blue-type cheese flavor production; surprisingly, calcium
caseinate seems to inhibit flavor production (1973). Amino acids have been shown to
stimulate methyl ketone production (Kinsella and Hwang, 1976b). Amino acids are also
important precursors to various Blue cheese flavor compounds including aldehydes,
esters, and alcohols (Kinsella and Hwang, 1976b, Molimard and Spinnler, 1996).
Glucose has been shown to promote the production of 2-undecanone in P. roqueforti
spores (Kinsella and Hwang, 1976b).
Salt is also added in some submerged culture fermentations (Nelson, 1970; Amu
and Jarvis, 1974; Dwivedi and Kinsella, 1974a,b; Jolly and Kosikowski, 1975). Levels
from 0 to 5.5 percent have been reported for submerged culture fermentation; levels
around 3 percent are most commonly used (Nelson, 1970; Amu and Jarvis, 1974;
Dwivedi and Kinsella, 1974a,b). This correlates with the sodium chloride levels of 2 to 5
percent commonly used in the manufacture of traditional Blue cheese (Cantor and others,
2004). Nelson suggests that salt increases the production of methyl ketones in spores
(1970). Cantor and others report that growth of P. roqueforti is stimulated by sodium
chloride levels up to 3.5 percent (2004). However, evidence suggests that adding 2
percent salt decreases the rate of production of methyl ketones by P. roqueforti mycelia

15
and increases sporulation during submerged culture fermentation (Dwivedi and Kinsella,
1974). Additionally, salt enhances the overall flavor profile of the finished Blue cheese
flavoring (Groesbeck and others, 1995; Fox and others, 2000).
Temperature, time, pH, level of aeration, and agitation speed are other factors that
affect the flavor profile of concentrated Blue cheese flavorings. Temperature
dramatically impacts the rate of enzymatic reactions as well as the health of organisms
used in the production of Blue cheese flavorings (Kinsella and Hwang, 1976 a,b; Fox and
others, 2000; Cantor and others, 2004). Optimum temperature for P. roqueforti lipase is
between 30 and 35 degrees Celsius (Hwang and Kinsella, 1976a,b). This lipase begins to
lose activity rapidly at temperatures above 37 degrees Celsius (Hwang and Kinsella,
1976b). Optimum temperature for ketone formation was found to be between 25 and 28
degrees Celsius (Hwang and Kinsella 1976a,b). Fermentation temperature for P.
roqueforti submerged culture fermentation typically ranges from 15 to 40 degrees Celsius
(Luksas, 1973). Most producers use fermentation temperatures around 25 or 30 degrees
Celsius for optimal flavor characteristics (Nelson, 1970; Amu and Jarvis, 1974; Dwivedi
and Kinsella, 1974a,b; Kosikowski and others, 1979; Pratt, 1989).
Fermentation time not only impacts production schedules but also proper flavor
profile development in the Blue cheese flavorings. With the addition of lipase or
lipolyzed fat, P. roqueforti spores can produce adequate Blue cheese flavor within 8
hours (Pratt, 1989). Longer fermentation times can allow more flavor development and
better overall flavor balance (Nelson, 1970; Groesbeck and others, 1995). Typically,

16
fermentation times are less than 72 hours (Nelson, 1970; Luksas, 1973; Kosikowski and
others, 1979; Pratt, 1989).
The pH also impacts enzymatic activity and the health of the organisms involved
in the fermentation. The optimum pH for P. roqueforti lipase has been reported to be 6.0
(Kinsella and Hwang, 1976b; Cantor and others, 2004). Optimum pH range for methyl
ketone production has been reported to be 5.7-6.0 (Kinsella and Hwang, 1976). The pH
also effects how free fatty acids behave in the media due to their acidic nature (Cantor
and others, 2004). Typically, submerged culture fermentations are carried out in a pH
range of 5.7 to 6.2 (Pratt, 1989; Groesbeck and others, 1995). Buffers are sometimes
used to help maintain consistent pH (Dwivedi and Kinsella, 1974a,b; Groesbeck and
others, 1995).
Aeration is important to oxygenate the system. Oxygen levels of at least 4 to 21
percent are needed for the growth of P. roqueforti (Cantor and others, 2004). Oxygen is
also required for P. roqueforti to convert free fatty acids to methyl ketones via the β-
oxidation pathway (Kinsella and Hwang, 1976a,b). Kinsella and Hwang report that the
optimum oxygen content for methyl ketone production appears to be around 5 percent O2
(1976b). Aeration rates for submerged culture fermentations typically range from 200 to
1000 cubic centimeters (cc) of air per liter of substrate per minute (Nelson, 1970; Pratt,
1989; Groesbeck and others, 1995). Nelson reports that aeration rates over 1000
cc/L/min cause loss of volatile aroma compounds through stripping (1970).

17
Agitation in submerged culture fermentation is maintained to increase
substrate/catalyst interaction, prevent filamentous mycelia growth, and promote
homogeneity of reaction mixture. Excessive agitation speeds may cause damage to P.
roqueforti cells or break the milk fat emulsion. Reported agitation rates are around 200
RPM (Jolly and Kosikowski, 1975).
Flavor Chemistry and Biochemistry of Blue Cheese
The flavor of Blue cheese is developed through metabolism of carbohydrate,
protein, and milk fat in the cheese curd. A variety of complex biochemical reactions
create the strong, spicy, piquant flavors associated with Blue and blue-type cheeses
(Kinsella and Hwang, 1976). The main classes of aromatic compounds that impact Blue
cheese flavor are ketones, fatty acids, lactones, esters, alcohols, and volatile sulfur
compounds.
Ketones
Methyl Ketones are the most abundant aroma compounds in Blue cheese (Gallois
and Langlois, 1990). They are also considered the most important compounds for the
characteristic odor of Blue cheese (Jolly and Kosikowski, 1975; Gallois and Langlois,
1990; Molimard and Spinnler, 1996; Curioni and Bosset, 2002; Qian and others, 2002;
Collins and others, 2003; Cantor and others 2004). Of these, methyl ketones with odd
numbered carbon chains are typically the most abundant and have the greatest impact on
Blue cheese flavor (Kinsella and Hwang, 1976; Gallois and Langlois, 1990; Gonzales de
Llano and others, 1990; Molimard and Spinnler, 1996; Florez and others, 2006). Two-

18
heptanone and 2-nonanone are typically the most abundant methyl ketones in Blue cheese
(Gallois and Langlois, 1990; Molimard and Spinnler, 1996; Cantor and others 2004).
Two-pentanone and 2-undecanone are considered important in the flavor of Blue cheese
(Cantor and others 2004). Some unsaturated methyl ketones are also found in blue-type
cheeses. The most notable of these is 8-nonen-2one (Gallois and Langlois, 1990; Voigt
and others, 2010; Wolf and others, 2011)
Methyl ketones in Blue cheese are produced by P. roqueforti through the classic
β-oxidation pathway for fatty acids (Kinsella and Hwang, 1976). In the presence of
oxygen, P. roqueforti typically converts free fatty acids to methyl ketones of one less
carbon (Kinsella and Hwang, 1976). However, smaller chain methyl ketones can be
produced if the β-oxidation cycle continues (Kinsella and Hwang, 1976). Octanoic and
decanoic acids are preferentially selected as substrates for the production of methyl
ketones by P. roqueforti (Dwivedi and Kinsella, 1974; Pannell and Olson, 1991). This
explains the high concentrations of 2-heptanone and 2-nonanone seen in most Blue
cheeses (Gallois and Langlois, 1990; Florez and others, 2006; Gkatzionis and others,
2009).
Lipase activity is important in the formation of methyl ketones in cheese (Collins
and others, 2003; Wilkinson, 2007). Concentration of free fatty acids has been shown to
impact methyl ketone production by P. roqueforti. Low levels of free fatty acids induce
the complete oxidation to carbon dioxide; high levels of free fatty acids stimulate the
conversion to methyl ketones. Very high levels of free fatty acids are toxic to P.

19
roqueforti and inhibit cell growth as well as methyl ketone production (Kinsella and
Hwang 1976; King and Clegg, 1980; Cantor and others, 2004). Low lipase activity has
been associated with poor organoleptic quality in Blue cheese (Kinsella and Hwang,
1976; Gallois and Langlois, 1990).
Both spores and mycelia of P. roqueforti are able to convert fatty acids to methyl
ketones (Dwivedi and Kinsella, 1974; Kinsella and Hwang, 1976; Pratt, 1989; Groesbeck
and others, 1995). Spores are typically better methyl ketone producers than mycelia (Fan
and others, 1976; Pratt, 1989; Groesbeck and others, 1995). Spore-rich zones in Stilton
cheese have been shown to have significantly higher concentrations of 2-heptanone and
2-nonanone than other zones of the cheese (Gkatzionis and others, 2009). This is
partially because spores are less likely to further metabolize methyl ketones to other end
products (Fan and others, 1976; Pratt, 1989). Spores are also more resistant to free fatty
acid toxicity than mycelia (Fan and others, 1976; Pratt, 1989; Pannell and Olson, 1991).
Spores are typically preferred for the production of Blue cheese flavorings by submerged
culture fermentation (Nelson, 1970; Jolly and Kosikowski, 1975; Larroche and Gros,
1989; Pratt, 1989; Pannell and Olson, 1991).
The aroma characteristics of methyl ketones include fruity, spicy, blue, green,
floral, and herbaceous. Methyl ketones are also often described as having “Blue cheese”,
“Gorganzola cheese”, “Roquefort cheese”, etc. aroma (Molimard and Spinnler, 1996;
Sable and Cottenceau, 1999; Curioni and Bosset, 2002; Qian and others 2002). Reported
descriptors for individual methyl ketones vary.

20
Two- heptanone has been described as fruity (Curioni and Bosset, 2002; Qian and
Wang, 2005), spicy (Sable and Cottenceau, 1999; Curioni and Bosset, 2002), fatty,
herbaceous, green, animal (Curioni and Bosset, 2002), Blue cheese (Molimard and
Spinnler, 1996; Sable and Cottenceau, 1999; Curioni and Bosset, 2002; Qian and others
2002), and musty (Sable and Cottenceau, 1999). Low threshold values for 2-heptanone
have been reported as ranging from 0.001 to 15 parts per million (ppm) (Molimard and
Spinnler, 1996; Sable and Cottenceau, 1999; Curioni and Bosset, 2002; Qian and Wang,
2005). Surprisingly, aroma extract dilution analysis data indicates (AEDA) a flavor
dilution (FD) value of 256 which is relatively low compared to other aroma compounds
that comprise Blue cheese flavor (Qian and others, 2002).
Two-nonanone has been described as Blue cheese (Qian and others, 2002), green,
hot milk (Curioni and Bosset, 2002; Flavornet), malty, smoked cheese, Gorganzola
cheese (Curioni and Bosset, 2002), fruity (Molimard and Spinnler, 1996; Sable and
Cottenceau, 1999; Curioni and Bosset, 2002; Qian and Wang, 2005), floral (Sable and
Cottenceau, 1999; Wang and Xu, 2009), grassy (Wang and Xu, 2009), and musty
(Molimard and Spinnler, 1996; Sable and Cottenceau, 1999). Threshold values for 2-
nonanone have been reported as ranging from 0.041 to 20 ppm (Molimard and Spinnler,
1996; Sable and Cottenceau, 1999; Curioni and Bosset, 2002; Qian and Wang, 2005).
The AEDA flavor dilution value was found to be 128 (Qian and others, 2002).
Two-undecanone, another important Blue cheese flavor ketone, has been
described as floral (Molimard and Spinnler, 1996; Sable and Cottenceau, 1999; Curioni

21
and Bosset, 2002), fruity, musty (Curioni and Bosset, 2002; Qian and others, 2002),
orange (Qian and Wang, 2005; Flavornet), rose (Sable and Cottenceau, 1999),
herbaceous (Molimard and Spinnler, 1996; Sable and Cottenceau, 1999), peach, and
sweet (Wang and Xu, 2009). Threshold values for 2-undecanone have been reported
between 0.007 and 100 ppm (Molimard and Spinnler, 1996; Sable and Cottenceau, 1999;
Qian and Wang, 2005). Flavor dilution value for 2-undecanone was determined to be 64
(Qian and others, 2002).
Two-pentanone has been given sweet (Sable and Cottenceau, 1999; Curioni and
Bosset, 2002), orange peel (Curioni and Bosset, 2002), malty (Qian and others, 2002),
fruity (Molimard and Spinnler, 1996; Sable and Cottenceau, 1999; Curioni and Bosset,
2002; Qian and others, 2002), ethereal (Sable and Cottenceau, 1999; Qian and Wang,
2005), and acetone (Molimard and Spinnler, 1996; Sable and Cottenceau, 1999)
descriptors. Threshold values for 2-pentanone have been set between 0.01 and 61 ppm
(Molimard and Spinnler, 1996; Sable and Cottenceau, 1999 Qian and Wang, 2005). A
flavor dilution value of 1 was set for 2-pentanone (Qian and others, 2002).
Fatty Acids
Milk fat typically constitutes 3.5-5% of bovine milk. Of which, a vast major (~
98%) is incorporated into triglycerides (Collins and others, 2003). Native milk lipases as
well as microbial lipases act to breakdown milk fat triglyceride and release fatty acids
into the cheese matrix (Kinsella and Hwang, 1976; Collins and others, 2003; Wilkinson,
2007). Pasteurization destroys native milk lipase (Hickey and others, 2007).

22
Homogenization allows greater lipase access to triglycerides through the breakdown of
the milk fat globule membrane (Kinsella and Hwang, 1976; Collins and others, 2003;
Wilkinson, 2007).
P. roqueforti is highly lipolytic (Kinsella and Hwang, 1976). Though, lipolytic
activity can vary significantly between strains (Kinsella and Hwang, 1976; Larsen and
Jensen, 1999). P. roqueforti lipases are typically selective for removal of shorter chain
fatty acids (C4-C12; Larsen and Jensen, 1999). The shorter chain fatty acids are highly
volatile and have a greater impact on cheese flavor (Qian and others, 2002; Collins and
others 2003; Cantor and others, 2004).
The strong metabolic activity of P. roqueforti dominates the lipolytic activity in
blue-type cheeses (Kinsella and Hwang, 1976; Collins and others, 2003; Cantor and
others, 2004). However, there is evidence that other microflora organisms enhance the
lipolysis of cheese. Typically, enhanced lipolysis is attributed to non-starter lactic acid
bacteria and yeast. Hickey and others reported greater lipolysis in raw milk cheese
(2007). Randazzo and others observed greater production of hexanoic acid by wild-type
starters used in the production of Pecorino Siciliano cheese (2010). Albenzio and others
observed higher lipolysis in ovine cheese when probiotic bacteria were added with the
starter (2010). Non-starter lactic acid bacteria added to Caciotta cheese increased
lipolysis of all treatments compared to a control cheese (Cagno and others, 2006).
Vannini and others found that yeast were responsible for increased levels of free fatty
acids in Pecorino cheeses (2008).
23
Free fatty acids impart cheesy, rancid, pungent, and sweaty notes to Blue cheese
(Qian and others, 2002; Cantor and others, 2004). Hexanoic and octanoic acids (C6 and
C8 respectively) are two of the most important fatty acids in the aroma profile of Blue
cheese (Cantor and others, 2004). Free fatty acid concentration, along with methyl ketone
concentration, correlates directly with blue-type cheese flavor intensity and quality
(Gallois and Langlois, 1990). Individual fatty acids have been characterized by their
aroma profiles.
Hexanoic acid has been given descriptors such as sweaty, cheesy (Curioni and
Bosset, 2002; Qian and others 2002), pungent, Blue cheese, (Molimard and Spinnler,
1996; Sable and Cottenceau, 1999), sour (Sable and Cottenceau, 1999), rancid (Curioni
and Bosset, 2002; Qian and Wang, 2005), bad breath, and goaty (Christensen and
Reineccius, 1995; Curioni and Bosset, 2002). Threshold values for hexanoic acid range
from 1 to 15 ppm (Molimard and Spinnler 1996; Sable and Cottenceau, 1999; Qian and
Wang, 2005). The AEDA flavor dilution value for hexanoic acid was found to be 32
(Qian and others, 2002).
Octanoic acid has received descriptors such as sour (Qian and Wang, 2005), goaty
(Molimard and Spinnler, 1996; Sable and Cottenceau, 1999; Qian and Wang, 2005),
waxy, soapy, musty, fruity (Molimard and Spinnler, 1996; Sable and Cottenceau, 1999),
rancid (Molimard and Spinnler, 1996; Sable and Cottenceau, 1999, Curioni and Bosset,
2002), cheesy, body odor, sweat (Curioni and Bosset, 2002, Flavornet), fatty, and
pungent (Curioni and Bosset, 2002). Threshold values reported in the literature for
24
octanoic acid range from 0.91 to 19 ppm (Molimard and Spinnler, 1996; Sable and
Cottenceau, 1999; Qian and Wang, 2005). No flavor dilution value was established for
octanoic acid (Qian and others, 2002).
Butanoic (butyric) acid is an important compound in the aroma of many cheeses
(Christensen and Reineccius, 1995; Curioni and Bosset, 2002). Butanioc acid is also
prevalent in many blue-type cheeses (Kinsella and Hwang, 1976; Gallois and Langlois,
1990; Tomasini and others, 1995; Qian and others, 2002). Butanoic acid is typically
described as sweaty, cheesy (Christensen and Reineccius, 1995; Molimard and Spinnler,
1996; Sable and Cottenceau, 1999; Curioni and Bosset, 2002; Qian and others 2002; Qian
and Wang, 2005), and rancid (Molimard and Spinnler, 1996; Sable and Cottenceau, 1999;
Curioni and Bosset, 2002; Qian and Wang, 2005). Very low threshold values have been
established between 0.3 and 6.8 ppm (Molimard and Spinnler, 1996; Sable and
Cottenceau, 1999; Curioni and Bosset, 2002; Qian and Wang, 2005). The flavor dilution
value of butyric acid observed by Qian and others was 512, one of the highest found for
Blue cheese (2002).
Other free fatty acids of importance to blue-type cheese include: decanoic,
dodecanoic, and acetic acids as well as some small branched chain fatty acids (Kinsella
and Hwang, 1976). Free fatty acids are also important precursors for Blue cheese flavor
compounds including methyl ketones, secondary alcohols, lactones, alcohols, and
aldehydes (Kinsella and Hwang, 1976; Gallois and Langlois, 1990; Collins and others,
2003).
25
Alcohols
Gallois and Langlois found that alcohols constitute 15-30% of blue-type cheese
aroma profile (1990). Two classes of alcohols typically occur in blue-type cheeses:
primary and secondary alcohols. For most blue-type cheeses, secondary alcohols are
more abundant than primary alcohols (Gallois and Langlois, 1990; Gonzales and others,
1990; Collins and others, 2003; Florez and others 2006; Wolf and others, 2011).
Secondary alcohols are produced by P. roqueforti through reduction of methyl ketones
(Molimard and Spinnler, 1996; Collins and others, 2003).
The most notable secondary alcohols in Blue cheese are 2-pentanol, 2-heptanol,
and 2-nonanol (Gonzales and others, 1990; Collins and others, 2003; Florez and others,
2006; Wolf and others, 2011). These aroma compounds impart fresh (2-pentanol), oily,
green (2-heptanol and 2-nonanol), herbaceous, and earthy (2-heptanol) notes to Blue
cheese (Curioni and Bosset, 2002).
Primary alcohols are produced through lactose or amino acid metabolism
(Molimard and Spinnler, 1996). Lactose fermentation can produce ethanol through the
pentose phosphate pathway (Molimard and Spinnler, 1996). Ethanol, though not very
important to the flavor profile of Blue cheese, is an important precursor to esters found in
blue-type cheeses (Molimard and Spinnler, 1996; Liu and others, 2004; Wolf and others,
2011). Primary alcohols are formed from amino acids by Strecker degradation or
Erhlich’s pathway (Molimard and Spinnler, 1996; Wolf and others, 2011). A good
example is phenylethanol which gives a yeasty flavor to Blue cheese (Gallois and
26
Langlois, 1990; Molimard and Spinnler, 1996). Three-methyl-1-butanol, 2-methyl-1-
propanol, and 1-pentanol are some other primary alcohols that have been observed in
blue-type cheeses (Gallois and Langlois, 1990; Wolf and others, 2011).
Esters
Esters are found in a wide variety of blue-type cheeses (Gallois and Langlois,
1990; Qian and others, 2002; Collins and others, 2003; Cantor and others, 2004; Wolf
and others, 2011). They are especially prevalent in Gorgonzola cheese (Liu and others,
2004). Esters are formed through the combination of a fatty acid and an alcohol
(Molimard and Spinnler, 1996; Collins and others, 2003; Liu and others, 2004). In Blue
cheese, esters are thought to be produced by microbial esterase activity as a means of
eliminating toxic fatty acids and alcohols (Molimard and Spinnler, 1996; Collins and
others, 2003; Cantor and others, 2004). Sources suggest Blue cheese molds may produce
esters (Liu and others, 2004). Yet, most ester biosynthesis in Blue cheese is attributed to
yeasts, especially Geotricum candidum (Molimard and Spinnler, 1996; Liu and others
2004). Lactic acid bacteria, particularly Lactococcus lactis subsp. lactis, are also known
for their ability to synthesize esters (Collins and others, 2003; Liu and others, 2004).
Lactic acid bacteria and dairy yeast also play an important role in the production of
ethanol and other ester precursors (Molimard and Spinnler, 1996; Liu and others, 2004;
Randazzo and others, 2008)
Esters are typically described as having a fruity odor with descriptors including
banana, pineapple, pear, apricot, apple, melon, sweet, floral, grape, and, wine
27
(Christensen and Reineccius, 1995; Molimard and Spinnler, 1996; Sable and Cottenceau,
1999; Qian and others, 2002; Qian and Wang, 2005). It has been suggested that these
fruity notes help to reduce sharpness and bitterness in blue-types cheeses (Gallois and
Langlois, 1990).
The most common esters reported in blue-type cheeses are the ethyl esters,
formed through esterification of short to medium chain FFAs and ethanol (Kinsella and
Hwang, 1976; Gallois and Langlois, 1990; Molimard and Spinnler, 1996). These
include: ethyl acetate, ethyl butanoate, ethyl hexanoate, ethyl octanoate, and ethyl
decanoate (Gonzales de Llano and others, 1990; Molimard and Spinnler, 1996; Qian and
others, 2002; Wolf and others, 2011).
Methyl esters are also commonly reported in blue-type cheeses and Blue cheese
flavor concentrates (Anderson and Day, 1966; Gonzales de Llano and others 1990;
Tomasini and others, 1995; Sable and Cottenceau, 1999; Wolf and others, 2011).
Evidence suggests methyl esters are formed faster than ethyl esters (Gonzales de Llano
and others 1990; Tomasini and others, 1995). Methyl esters found in blue-type cheese
include: methyl butanoate, methyl hexanoate, methyl octanoate, methyl decanoate, and
methyl dodecanoate (Anderson and Day, 1966; Gonzales de Llano and others 1990;
Tomasini and others, 1995; Sable and Cottenceau, 1999; Wolf and others, 2011).
Thioesters are another important class of esters to the flavor of a wide variety of
cheeses including some blue-type cheeses (Gallois and Langlois, 1990; Collins and
others, 2003; Landaud and others, 2008). These compounds contribute sulfurous notes
28
that are typically described as garlic, cabbage, rancid, and crab (Landaud and others,
2008).
Lactones
Lactones are typically described as having fruity (peach, apricot, coconut, etc) and
buttery aroma characteristics (Molimard and Spinnler, 1996; Sable and Cottenceau, 1999;
Wilkinson, 2007). They are thought to act synergistically with other cheese aroma
compounds to increase the creamy, buttery character of the cheese (Wilkinson, 2007;
Moran and others, 2010).
Lactones comprise a relatively small proportion of Blue cheese aroma (Kinsella
and Hwang, 1976). However, lactones are generally found in higher levels in Blue
cheese than in Cheddar cheese (Collins and others, 2003). Higher occurrence of lactones
in Blue cheese compared to Cheddar is expected since lipolysis is positively correlated
with lactone development (Gallois and Langlois, 1990; Collins and others, 2003;
Wilkinson, 2007). Lactone precursors, hydroxyacids, are native components to milk fat
which are formed in the mammary glands of dairy animals (Gallois and Langlois, 1990;
Collins and others, 2003). The conversion mechanism from hydroxyacid to lactone has
not yet been discovered (Molimard and Spinnler, 1996). Higher levels of lactones have
been reported in pasteurized-milk cheeses due to the heating step (Gallois and Langlois,
1990).
Lactones occur in the α, β, γ, and δ (alpha, beta, gamma, and delta)
conformations; however, only the γ and δ forms are stable in the cheese matrix (Collins

29
and others, 2003). The γ- lactones typically have lower detection thresholds than δ-
lactones (Wilkinson, 2007). Detection levels for γ-decalactone and γ-dodecalactone are
as low as 11 parts per billion (ppb) in water (Molimard and Spinnler, 1996).
Aldehydes
Aldehydes have been identified in Blue cheese, but their importance to Blue
cheese flavor is unknown (Gallois and Langlois, 1990; Sable and Cottenceau, 1999).
Aldehydes are known for their characteristic green, grassy, and sometimes malty notes
(Sable and Cottenceau, 1999; Wilkinson, 2007; Wolf and others, 2011). Relatively high
levels of aldehydes are thought to cause “unclean” off-flavors in Blue cheese (Gallois and
Langlois, 1990). Some aldehydes are detectable at levels as low as 10 ppb (Molimard
and Spinnler, 1996).
Aldehydes originate from amino acids (via transamination or Strecker
degradation) and unsaturated fatty acids (via β-oxidation pathways) (Molimard and
Spinnler, 1996; Collins and others, 2003; Wilkinson, 2007). Lactic acid bacteria are also
able to convert glucose to short chain aldehydes, particularly acetaldehyde (Molimard
and Spinnler, 1996; Randazzo and others, 2008).
Sulfur Compounds
Sulfur compounds, produced through methionine degradation, are common to
many cheeses. Sulfur compounds are more important to the flavor profile of some
cheeses than others (Landaud and others, 2008). Sulfur compounds are typically

30
considered less important to blue variety cheeses than other soft-ripened cheese varieties
(Molimard and Spinnler, 1996; Sable and Cottenceau, 1999). Blue-type cheeses vary
considerably in amount and type of sulfur compounds between varieties (Gallois and
Langlois, 1990).
Hydrogen sulfide, methional, dimethyl sulfide, dimethyl disulfide and, dimethyl
trisulfide are some of the sulfur compounds that have been reported in blue-type cheeses
(Gallois and Langlois, 1990; Qian and others, 2002, Gkatzionis and others, 2009). The
aroma characteristics of these compounds have been describe as cabbage, garlic, meaty,
boiled potato, over-ripe cheese, and sulfurous (Molimard and Spinnler, 1996; Sable and
Cottenceau, 1999; Qian and others, 2002). Thioesters (see Esters section) are also
considered sulfur compounds found in cheese (Landaud and others, 2008).
Supercritical Fluid Background
The supercritical fluid state is a thermodynamic state of matter distinct from solid,
liquid, and gaseous states. The supercritical state of matter was discovered by Hannay
and Hogarth in the late 1800’s. In the supercritical state, fluids have properties
intermediate to liquids and gases. Density of supercritical fluids is highly variable upon
changes in the temperature and/or pressure of the system. Supercritical fluids have
received much attention from industry and academia for their unique chemical properties
(McHugh and Krukonis, 1994).
31
Supercritical Fluid Uses in Foods
In foods, supercritical fluids are used most commonly as solvents for the
extraction or fractionation of food components. The main industrial uses for supercritical
fluids in food are the decaffeination of coffee and the extraction of flavor compounds
from hops for beer brewing (McHugh and Krukonis, 1994; Brunner, 2005). Supercritical
fluids have also received much attention for the production of flavor extracts on the
industrial scale (Reverchon, 1997; Mukhopadhyay, 2000). Supercritical fluids are also
used for the analysis of a variety of foods. Typically, aroma and non-polar food
constituents are studied using supercritical fluids.
Carbon dioxide (Tc = 31.1 C; Pc = 73.9 Bar) is the supercritical solvent of choice
in most food applications since it is non-toxic, readily available, easy to remove, and has
a low critical temperature. Supercritical CO2 is a strong solvent for non-polar, slightly
polar molecules, and low molecular weight compounds (Brunner, 2005). Supercritical
carbon dioxide is gaining popularity as a non-toxic alternative to hexane for the
extraction of fat and flavor compounds from food materials. In addition to being toxic,
hexane is also much harder to remove from food materials post-extraction than carbon
dioxide. Furthermore, hexane extractions typically required much higher temperatures
than supercritical CO2 extractions, which not only increases the operating cost of hexane
extractions, but is also detrimental to the thermo-liable compounds in the food
(Mukhopadhyay, 2000). Due to lower operating temperatures, supercritical extractions
allow more accurate flavor analysis and flavor extracts more similar to the raw material
(Reverchon, 1997).
32
Another advantage of supercritical carbon dioxide is the selectivity of the solvent
based on the operating conditions. Most sources cite density of the supercritical fluid as
the main factor effecting solubility (Haan and others, 1990). Lower density conditions
(250-600 kg/m3) have been shown to be more selective for aroma compounds, whereas
higher density conditions (above 800 kg/m3) have demonstrated extraction of higher
amounts of non-volatile, non-polar compounds. Modifiers, such as ethanol, can also be
added to fine tune the selectivity of the supercritical solvent and improve the extraction of
compounds with increasing polarity.
Articles also suggest vapor pressure is a determining factor in the selectivity of
supercritical solvents. Increasing the temperature of the system has been said to also
increase the vapor pressure (Poiana, 1999; Reverchon, 2006).
Supercritical Fluid Uses in Dairy Products
Supercritical carbon dioxide has been tested as a means to meet consumer
demands for low fat and low cholesterol dairy products. Yee and her colleagues
demonstrated a 55% reduction in fat (wet-basis) in Parmesan cheese and a 51% reduction
in fat in Cheddar cheese using Supercritical Fluid Extraction (SFE). Higher percentage
of fat was removed from Parmesan cheese at 350 Bar and 35 degrees Celsius whereas
200 Bar and 40 degrees Celsius was found to be better for fat removal in Cheddar cheese
(2007). This is potentially due to the higher fat content of Cheddar cheese or the lower
moisture content of Parmesan cheese (Yee et al., 2007). Gas chromatography indicated
that aroma compounds were still present in both cheeses post-extraction. However,
sensory analysis showed that panelists could differentiate between the fat removed (SFE)

33
Cheddar cheese and the full-fat Cheddar cheese. Panelists were not able to discriminate
between the full-fat and SFE Parmesan (Yee et al., 2007).
Bradley showed that cholesterol can be reduced by up to 90% in butter using SFE
(Bradley, 1989). Rizvi also indicates strong solubility of milk fat cholesterol in SCCO2
at pressures around 150 atmospheres and temperatures of 40 to 45 degrees Celsius
(1987). Cholesterol is more easily and efficiently extracted from lower moisture dairy
products (Mukhopadhyay, 2000). Similarly, a patent process for reducing cholesterol
from eggs has been developed (Ogasahara, et al. 1992).
SCCO2 can also be used to enrich or remove specific fractions of butter fat in
dairy products. Costa and others used SFE combined with ultra-filtration to produce a
buttermilk powder enriched in milk fat globule phospholipids. Non-polar milk fat was
removed by SFE to yield a product with good emulsification properties (2010). Spence
and others were able to achieve similar results (2009). Researchers have also shown the
ability to fractionate milk fat to create high and low melting products (Rizvi, 1987).
Torres’ work shows fractionation of milk fat ethyl esters (2008).
Singh and Rizvi showed that continuous fractionation of anhydrous milk fat
(AMF) was economical for plants processing 10,000 tonnes per year (1994).
Fractionation of AMF into three fractions allows mixing of fractions to produce a high
value, multi-functional butter product with better melting properties, lower cholesterol,
and higher amounts of beta-carotene (Singh and Rizvi, 1994). Bhaskar and Rizvi
describe fractionation of AMF into five fractions using progressively lower pressure

34
separators (1993). Solubility of milk fat triglyceride in SCCO2 increases linearly with
pressure (Mukhopadhyay, 2000).
Methods have also been tested to determine the levels of conjugated linoleic acid
(CLA) in dairy products. Currently, solvent extraction methods are more efficient for
determination of CLA of most cheeses. Still, SFE seems promising for the analysis of
CLA as methods are updated (Domagala et al., 2010).
Supercritical fluid extraction coupled with supercritical fluid chromatography has
been used to measure amounts of FFAs in different types of Blue cheese. SFE/SFC
analysis of cheese is more accurate due to the relatively low extraction temperature and
elimination of the need to derivitize FFAs. Highest efficiency for the extraction of FFAs
from Blue and Roquefort cheese with supercritical carbon dioxide was found to be 60 C
and 680 atm when using 5% methanol as a modifier. However, C4 to C14 fatty acids
were extracted with higher efficiently at 540 atm than 680 atm when no modifier was
used (Mohyuddin, 1993). This indicates better extraction of volatile compounds at lower
densities of CO2. Methanol modifiers are not useful in the production of food grade
extracts due to toxicity. Ethanol is a possible safe alternative.
Supercritical Fluid Extraction of Dairy Aroma Compounds
Tuomala and Kallio developed methods to identify FFAs and other Swiss cheese
aroma compounds using SFE with online gas chromatography. Extraction conditions
used were 40 degrees Celsius and 100 Bar. High efficiency of FFA recovery (over 85%)
was shown during 20 minute extractions of Swiss cheese samples. Researchers indicated

35
that further fractionation was required to measure amounts of less abundant compounds
(i.e. carbonyls and lactones) due to high levels of FFAs in the extract (1996).
Larrayoz and others used SFE to determine the aroma profile of Roncal cheese.
Their study highlights the importance of trapping temperature and solvent in the analysis
of cheese aroma compounds. Temperatures of 0 degrees Celsius were found to be too
high to effectively trap highly volatile aroma compounds. Minus 5 degrees Celsius and
below was found to be optimal for the retention of volatile compounds in the collection
solvent. Hexane combined with acetone was also found to be more effective at trapping
cheese aroma compounds than hexane alone (Larrayoz and others, 1999).
Supercritical carbon dioxide has also been shown to significantly reduce the
amount of off-odors in whey protein isolate (Lamsen and Zhong, 2011). A variety of
pressure and temperature combinations were tested for extraction efficiency. The
experimenters found 65 degrees Celsius and 300 Bar to be the optimal condition for
deodorization. Under these conditions, sixty-three volatile compounds were removed
completely, and the remaining eight compounds were significantly reduced. At this
relatively high density of CO2, up to 62% milk fat could be co-extracted preventing
further fat oxidation off-flavors during storage (Zhong and Jin, 2008). Lower density
conditions ([100 Bar, 65 degrees Celsius]; [75 Bar, 35 degrees Celsius]; and [100 Bar, 35
degrees Celsius]) also removed comparable amounts of volatile compounds (61, 61, and
62 respectively) (Lamsen and Zhong, 2011). Similarly, SCCO2 has been shown to
remove a majority of the odiferous compounds in fish sauce (Shimoda, 2000). Increase
in pressure from 100 to 300 Bar did not affect the removal of odor compounds from the

36
fish sauce, however increases in the flow rate significantly enhanced the removal of
aroma compounds (Shimoda, 2000).
Haan and others have demonstrated the concentration of milk fat flavor
compounds using SCCO2. They found that two stage extractions using SCCO2 in the
density range of 600-700 kg/m3 could concentrate milk fat lactones over 500 times
(1990). Single stage extractions of milk fat exhibited concentration of around 20 times.
Data indicates that as pressure and temperature increase, the concentration factor of d12
lactone decreases due to the increasing solubility of milk fat triglyceride (Haan and
others, 1990).
Larrayoz and others showed that extracts from Roncal cheese at 109 Bar and 50
degrees Celsius retain their native aroma characteristics. Sensory tests were carried out to
test the aroma profile of cheese extracts. Panelists were able to correctly match cheese
aroma extracts with the original cheeses (2000).
Supercritical Extraction for the Production of Aroma Extracts
Supercritical fluid extraction is an alternative method to distillation and solvent
extraction for the production of high quality flavor and fragrance extracts
(Mukhopadhyay, 2000). Extraction by SCCO2 retains an aroma profile more similar to
the raw material due to lower temperatures and less exposure to oxygen throughout the
process (Reverchon, 1997). SCCO2 extraction is also better suited to capturing the
highly volatile aroma compounds often lost in steam distillation (Oszagyan, 1996).
Energy costs are typically lower for SFE production of essential oils and oleoresins than
using steam distillation and solvent extraction techniques (Mukhopadhyay, 2000).
37
Hamdan and others found 100 Bar and 35 degrees Celsius to be the best
conditions for the concentration of cardamom aroma compounds. These authors reported
less oxidative changes to cardamom oil extracts at sub-critical extraction conditions (25
degrees Celsius and 80/100 Bar). Though, sub-critical extracts contained lower
concentrations of important aroma compounds and saturated fatty acids than supercritical
extracts at 100 bar and 35 degrees Celsius (2008).
Similarly, Garcia and others found the highest concentration of aroma compounds
from sugar cane spirits at 100 Bar and 40 degrees Celsius. They observed an increase in
yield under higher pressure and temperature extraction conditions. However, aroma
intensity of extracts decreased as the yields increased. This is due to higher recovery of
non-aroma active and non-volatile components (2007).
Black pepper oleoresin was produced by supercritical CO2 extraction of ground
black pepper at pressures of 280 Bar and temperatures ranging from 24 to 60 degrees
Celsius. Extractions progressed more rapidly at higher temperatures. The authors
attributed faster extraction rates to increased diffusivity of solvent and increased
solubility of piperine (Sovova and others, 2008). Increasing temperature with constant
pressures decreases the solvent power of the supercritical fluid while increasing the vapor
pressure of volatile compounds (Reverchon and Marco, 2006).
Moldao-Martins and others found that pressure was the most important variable in
the extraction of essential oils from thyme. They found 180 Bar to be the ideal pressure
for extraction with temperatures around 37 degrees Celsius. SCCO2 produced a higher

38
yield of essential oil than steam distillation, however SCCO2 extracts also contained non-
volatile compounds such as waxy esters, pigments, and alkanes (2000).
Roy and others found that lower pressures (100 Bar) produce extracts with higher
concentrations of peppermint essential oil when extracting with SCCO2 at 40 degrees
Celsius than using higher pressures (up to 300 Bar). Temperatures above 40 degrees
Celsius were not used in this experiment due to potential of thermal degradation of aroma
compounds (1996).
Pioana and others found that increasing the temperature from 40 to 50 degrees
Celsius with similar density in the extraction of bergamot increased the solubility of and
kinetics of bergamot essential oil. While bergamot extractions at 50 to 60 degrees
Celsius show similar solubility and kinetics. However, total extract volume at 60 degrees
Celsius was higher than extracted volumes of bergamot oil at 40 and 50 degrees Celsius
(1999). The increase in solubility is most likely due to higher vapor pressure of essential
oil components under these conditions (Pioana and others, 1999; Reverchon and Marco,
2006).

39
Literature Cited:
Akyol, I. and others. 2009. Redirection of Pyruvate Pathway of Lactic Acid Bacteria to
Improve Cheese Quality. Food Biotechnology 23: 200-213.
Albenzio and others. 2010. Biochemical patterns in ovine cheese: Influence of probiotic
strains. Journal of Dairy Science 93: 3487-3496.
Amu, L and Jarvis, B. 1974. Blue Cheese Flavored Product. British Patent No. 1361817.
Anderson, D. and Day, E. 1966. Quantitation, Evaluation, and Effect of Certain
Microorganisms on Flavor Components of Blue Cheese. Journal of Agriculture and Food
Chemistry 14(3): 241-245.
Azarnia, S. and others. 2006. Biotechnological Methods to Accelerate Cheddar Cheese
Ripening. Critical Reviews in Biotechnology 26: 121-143.
Bhaskar, A. and others. 1993. Anhydrous Milk Fat Fractionation with Continuous
Countercurrent Supercritical Carbon Dioxide. Journal of Food Science 58(4): 748-752.
Bordeaux, D. 1987. Cheese-flavored substance and method for producing. US Patent No.
4,675,193.
Bradley, R. 1989. Removal of Cholesterol from Milk Fat Using Supercritical Carbon
Dioxide. Journal of Dairy Science 72: 2834-2840.
Brunner, G. 2005. Supercritical Fluids: Technology and Application to Food Processing.
Journal of Food Engineering 67: 21-33.
Cagno, R and others. 2006. Assessing the proteolytic and lipolytic activities of single
strains of mesophilic lactobacilli as adjunct cultures using a Caciotta cheese model
system. International Dairy Journal 16: 119-130.
Cheetham, P. 1997. Combining the Technical Push and the Business Pull for Natural
Flavors. Advances in Biochemical Engineering and Biotechnology. 55: 3-48.
Christensen, K. and Reineccius, G. 1995. Aroma Extract Dilution Analysis of Aged
Cheddar Cheese. Journal of Food Science 60(2): 318-320.
Collins, Y. and others. 2003. Lipolysis and Free Fatty Acid Catabolism in Cheese: a
Review of Current Knowledge. International Dairy Journal 13: 841-866.

40
Costa, M. and others. 2010. Use of Ultrafiltration and Supercritical Fluid Extraction to
Obtain a Whey Buttermilk Powder Enriched in Milk Fat Globule Membrane
Phospholipids. International Dairy Journal 20 (9): 598-602.
Curioni, P. and Bosset, J. 2002. Key Odorants in Various Cheese Types as Determined
by Gas Chromatography- Olfactometry. International Dairy Journal 12: 959-984.
Dalby, Andrew. 2009. Cheese: A Global History. London: Reaktion Books. 152 p.
Dartley, C. and Kinsella, J. 1973. Metabolism of Lauric Acid to Methyl Ketones by the
Spores of Penicillium roqueforti. Journal of Agricultural and Food Chemistry 21(6): 933-
936.
Domagala, J. and others. 2010. The Influence of Cheese Type and Fat Extraction Method
on the Content of Conjugated Linoleic Acid. Journal of Food Composition and Analysis
(23): 238-243.
Dooley, J. 1979. Natural Cheese of Intensified Flavor. US Patent No. 4,172,900.
Dwivedi, B. and Kinsella, J. 1974. Continuous Production of Blue-type Cheese Flavor by
Submerged Fermentation of Penicillium roqueforti. Journal of Food Science 39: 620-622.
Fan, and others. 1976. Methyl Ketone Formation during Germination of Penicillium
roqueforti. Journal of Agriculture and Food Chemistry 24(3): 443-448.
Florez, A. and others. 2006. Microbial, Chemical, and Sensorial Variables of Spanish
Traditional Blue-veined Cabrales Cheese, as Affected by Inoculation with Commercial
Penicillium roqueforti Spores. European Food Research and Technology 222: 250-257.
Fox, P. and others. 2000. Fundamentals of Cheese Science. Gaithersburg: Aspen
Publishers. 587 p.
Gallois, A. and Langlois, D. 1990. New Results in the Volatile Odorous Compounds of
French Cheeses. Le Lait 70: 89-106.
Garcia, I. and others. 2007. Isolation of Aroma Compounds from Sugar Cane Spirits by
Supercritical CO2. Journal of Supercritical Fluids 43: 37-42.
Gkatzionis, K. and others. 2009. Volatile Profile of Stilton Cheeses: Differences Between
Zones Within a Cheese and Dairies. Food Chemistry 113: 506-512.
41
Gobbetti, M. and others. 2007. Contributions of Starter and Non-starter Bacteria. In:
Improving Cheese Flavors. New York: CRC Press. 580 p.
Gonzalez de Llano, D. and others. 1990. Evolution of the Volatile Components of an
Artisanal Blue Cheese During Ripening. Journal of Dairy Science 73(7): 1676-1683.
Groesbeck, C and others. 1995. Process for preparing a blue cheese flavorant. US Patent
No. 5,455,051.
Haan, A. and others. 1990. Extraction of Flavors from Milk Fat with Supercritical Carbon
Dioxide (3): 15-19.
Hagberg, E. and others. 1998.Method for producing a highly flavored cheese ingredient.
US Patent No. 4,752,483.
Hamdan, S. and others. 2008. Extraction of Cardamom Oil by Supercritical Carbon
Dioxide and Sub Critical Propane. Journal of Supercritical Fluids 44: 25-30.
Han, X and others. 2001. Method for Producing Enzyme Modified Cheese Flavorings.
US Patent No.6,251,445.
Hickey and others. 2007. Lipolysis in Cheddar Cheese Made from Raw, Thermized, and
Pasteurized Milks. Journal of Dairy Science 90: 47-56.
Humphrey, A. and others. 2001. Biotransformation of Fatty Substrates. US Patent No.
6,218,158.
Jolly, R and Kosikowski, F. 1975. Blue Cheese Flavor by Microbial Lipase and Mold
Spores Utilizing Whey Powder, Butter and Coconut Fats. Journal of Food Science (40):
285-287.
Karlin, M. 2011. Artisan Cheese Making At Home. Berkeley: Ten Speed Press. 247 p.
Kinderlerer, J. and Hatton, P. 1991. The Effect of Temperature, Water Activity, and
Sorbic Acid on Ketone Rancidity Produced by Penicillium crustosum Thom in Coconut
and Palm Kernel oils. Journal of Applied Bacteriology 70: 502-506.
King, R and Clegg, G. 1980. The Effects of Casein on the Metabolism of Fatty Acids,
Methyl Ketones and Secondary Alcohols by Penicillium roqueforti in Buffered Solutions.
J. Sci. Food Agric. 31: 481-486.
42
Kinsella, J and Hwang, D. 1976a. Biosynthesis of Flavors by Penicillium roqueforti.
Biotechnology and Bioengineering 17: 927-938.
Kinsella, J. and Hwang, D. 1976b. Enzymes of Penicillium roqueforti Involved in the
Biosynthesis of Cheese Flavor. Critical Reviews in Food Science and Technology
8(2):191-228.
Kosikowski, F. and others. 1979. Preparation of Blue Cheese Flavor. US Patent No.
4,133,895.
Kranz, C. and others. 1992. Biotransformation of Free Fatty Acids in Mixtures to Methyl
Ketones by Monascus purpureus. Applied Microbiology and Biotechnology 36: 436-439.
Kwon, S. and others. 2000.Cheese Flavor. US Patent No. 6,054,151.
Lamsen, M. and Zhong, Q. 2011. Impacts of Supercritical Extraction on GC/MS Profiles
of Volatiles in Whey Protein Isolate Sampled by Solid-Phase Microextraction. Journal of
Food Processing and Preservation (35): 869-883.
Landaud, S. and others. 2008. Formation of Volatile Sulfur Compounds and Metabolism
of Methionine and Other Sulphur Compounds in Fermented Food. Applied Microbiology
and Biotechnology 77: 1191-1205.
Larrayoz, P. and others. 1999. Optimization of the Indirect Parameters of Which Affect
the Extractability of Volatile Aroma Compounds from Idiazabal Cheese Using Analytical
Supercritical Fluid Extraction. Food Chemistry 64: 123-127.
Larrayoz, P. and others. 2000. Evaluation of Supercritical Fluid Extraction as Sample
Preparation Method for the Study of Roncal Cheese Aroma. International Dairy Journal
10 (11): 755-759.
Larroche, C and Gros, J. 1989. Batch and Continuous 2-Heptanone Production by Ca-
Alginate/Eudragit RL Entrapped Spores of Pencillium roquefortii. Biotechnology and
Bioengineering 34: 30-38.
Larsen, M and Jensen, K. 1999. The Effects of Environmental Conditions on the
Lipolytic Activity of strains of Penicillium roqueforti. Journal of Food Microbiology 46:
159-166.
Lecouteux, C. and others. 2000. Flavor Enhancer. US Patent No. 6,022,567.
Liu, S. and others. 2004. Esters and Their Biosynthesis in Fermented Dairy Products: A
Review. International Dairy Journal 14: 923-945.

43
Luksas, A. 1973. Preparation of Bleu Cheese Flavored Product. US Patent No. 3,720,520.
Marshall, W. and others. 1987. Fermented oilseed product for preparing imitation dairy
products. US Patent No. 4,678,673.
McCalman, M. and Gibbons, D. 2009. Mastering Cheese: Lessons for Connoisseurship
from a Maitre Fromager. New York: Clarkson Potter Publishers. 384 p.
McHugh, M. and Krukonis, V. 1994. Supercritical Fluid Extract Principles and Practice.
2nd
Edition. Boston: Butterworth-Heinemann. 512 p.
McSweeny, P. L. 2007. Cheese Manufacture and Ripening and their Influence on Cheese
Flavor. In: Improving the Flavour of Cheese. New York: CRC Press. 580 p.
Moldao-Martins, M. and others. 2000. Supercritical CO2 Extraction of Thymus zygis L.
subsp. sylvestris Aroma. Journal of Supercritical Fluids 18: 25-34.
Molimard, P. and Spinnler, H. 1996. Review: Compounds Involved in the Flavor of
Surface Mold-Ripened Cheeses: Origins and Properties. Journal of Dairy Science 79:
169-184.
Mohyuddin, G. 1993. Supercritical Fluid Extraction and Chromatographic Analysis of
Fatty Acids in Blue Cheese. Dissertation: University of Illinois Urbana-Champagne.
Moran, J. and others. 2010. Fresh Cheese Products Containing Biogenerated Flavor
Components and Methods for Producing. US Patent No. 7,674,489.
Moskowitz, G. and Noelck, S. 1986. Enzyme modified cheese technology. Journal of
Dairy Science. 70: 1761-1769.
Mukhopadhyay, M. 2000. Natural Extracts Using Supercritical Carbon Dioxide. Boca
Raton: CRC Press. 339 p.
Nelson, J. 1970. Production of Blue Cheese Flavor via SubmergedFermentation by
Penicillium roqueforti. Journal of Agricultural and Food Chemistry 18(4): 567-569.
Ogasahara and others. 1992. Process for producing liquid egg having reduced cholesterol
content. US
Patent No. 5,116,628.
Oszagyan, M. and others. 1996. Supercritical Fluid Extraction of Volatile Compounds
from Lavandin and Thyme. Flavor and Fragrance Journal 11: 157-165.

44
Pannell, K and Olson, N. 1991. Methyl Ketone Production in Milk-Fat-Coated
Microcapsules Variation of Lipase and Spore Concentrations. Journal of Dairy Science
74: 2048-2053.
Pratt, N. 1989. Preparation of a Blue Cheese Flavour. US Patent No. 4,832,964.
Qian, M. and others. 2002. Evaluation of Fat-Derived Aroma Compounds in Blue Cheese
by Dynamic Headspace GC/Olfactometry-MS. Journal of American Oil Chemists’
Society 79(7): 663-667.
Qian, M. and Wang, Y. 2005. Seasonal Variation of Volatile Composition and Odor
Activity Value of ‘Marion’ (Rubus spp. hyb) and ‘Thornless Evergreen’ (R. laciniatus L.)
Blackberries. Journal of Food Science 70(1): 13-20.
Randazzo, C. and others. 2008. Effect of Wild Strains Used as Starter Cultures and
Adjunct Cultures on the Volatile Compounds of Pecorino Siciliano Cheese. International
Journal of Food Microbiology 122: 269-278.
Randazzo, C and others. 2010. Pecorino Crotonese cheese: Study of bacterial population
and flavour compounds. Food Microbiology 27: 363-374.
Reddy, D. and others. 2002. Natural Biogenerated Cheese Flavoring System. US Patent
No. 6,406,724.
Reverchon, E. 1997. Supercritical Fluid Extraction and Fractionation of Essential Oils
and Related Products. Journal of Supercritical Fluids 10: 1-37.
Reverchon, E. and Marco, I. 2006. Supercritical Fluid Extraction and Fractionation of
Natural Matter. Journal of Supercritical Fluids 38: 146-166.
Rizvi, S. 1987. Supercritical Fluid Extraction of Dairy Foods. New York’s Food & Life
Science Quarterly 17(3): 23-26.
Roy, B. and others. 1996. Supercritical CO2 Extraction of Essential Oils and Cuticular
Waxes from Peppermint Leaves. Journal of Chemical Technology and Biotechnology 67:
21-26.
Sable, S. and Cottenceau, G. 1999. Current Knowledge of Soft Cheeses Flavor and
Related Compounds. Journal of Agriculture and Food Chemistry 47: 4825-4836.
Singh,B. and Rizvi, S. 1994. Design and Economic Analysis for Continuous
Countercurrent Processing of Milk Fat with Supercritical Carbon Dioxide. Journal of
Dairy Science 77: 1731-1745.

45
Shimoda, M. and others. 2000. Deodorization of Fish Sauce by Continuous-Flow
Extraction with Microbubbles of Supercritical Carbon Dioxide. Journal of Food Science
65(8): 1349-1351.
Sovona, H. and others. 1995. Supercritical Carbon Dioxide Extraction of Black Pepper.
Journal of Supercritical Fluids 8: 295-301.
Spence, A. and others. 2009. Phospholipid Enrichment in Sweet and Whey Cream
Buttermilk Powders Using Supercritical Fluid Extraction. Journal of Dairy Science 92(6):
2373-2381.
Tomasini, A. and others. 1995. Production of Blue Cheese Flavour Concentrates form
Different Substrates Supplemented with Lipolyzed Cream. International Dairy Journal 5:
247-257.
Torres, C. 2009. Supercritical Fluid Fractionation of Fatty Acid Ethyl Esters from
Butteroil. Journal of Dairy Science 92 (5): 1840-1845.
Tuomala, T. and Kallio, H. 1996. Identification of Free Fatty Acids and Some Other
Volatile Flavour Compounds from Swiss Cheese Using On-line Supercritical Fluid
Extraction-Gas Chromatography. Z Lebensm Unters Forsch (203): 236-240.
Van Grinsven, A. and others. 1994. Process for Producing Alkyl-methyl Ketones. US
Patent No. 5,364,640.
Veal, R. 1999. Highly flavored cheese product and method for producing. US Patent No.
5,952,022.
Vannini and others. 2008. Effect of a pre-treatment of milk with high pressure
homogenization on yield as well as on microbiological, lipolytic and proteolytic patterns
of "Pecorino" cheese. International Journal of Food Microbiology 128: 329-335.
Voigt, D. and others. 2010. Effect of High-pressure Treatment on Microbiology,
Proteolysis, Lipolysis and Levels of Flavour Compounds in Mature Blue-veined Cheese.
Innovative Food Science and Emerging Technologies 11: 68-77.
Wang, B. and Xu, S. 2009. Effects of Different Commercial Lipases on the Volatile
Profile of Lipolysed Milk Fat. Flavour and Fragrance Journal 24: 335-340.
Weimer, B.C. 2007. Genomics and cheese flavor. In: Improving the Flavour of Cheese.
New York: CRC Press. 580 p.

46
Wilkinson, M. 2007. Lipolysis and Cheese Flavor Development. In: Improving Cheese
Flavour. Cambridge: Woodhead Publishing. p103-120.
Wolf, I. and others. 2011. Composition and Volatile Profiles of Commercial Argentinean
Blue Cheeses. Journal of the Science of Food and Agriculture 91:385-393.
Wright, J. 2004. Flavor Creation. Carol Stream: Allured. 248 p.
Yee, J. and others. 2007. Flavor Partition and Fat Reduction in Cheese by Supercritical
Fluid Extraction:
Processing Variables. Le Lait (87): 269-285.
Zeigler, H. 2007. A Dynamic Business with Taste: The Flavor Industry. In: Flavorings.
Weinheim: Wiley-VCH. 827 p.
47
CHAPTER 2: THE EFFECT OF MICROBIAL POPULATION AND
FERMENTATION MEDIA ON THE PRODUCTION OF NATURAL BLUE
CHEESE FLAVORINGS
ABSTRACT
The effects of media type and culture selection on the aroma profile of Blue
cheese flavorings produced using submerged culture fermentation were studied.
Fermentations were carried out for 16 hours then compared using sensory analysis and
GC/MS SPME. The differences between samples were minimal. Samples produced with
adjunct media were found to have higher concentrations of methyl ketones and more
“creamy” aroma character than samples produced from standard media. Higher levels of
free fatty acids were found in standard media samples. Adjunct cultures appear to
enhance the “creamy” character of Blue cheese flavorings.
6. Introduction
Due to consumer and market demands, natural Blue cheese flavorings are
commonly used as an economical replacement for traditionally manufactured Blue cheese
in a variety of food products including salad dressings, snack crackers, and sauces.
Traditional Blue cheeses are typically aged at least 60-90 days for full flavor
development and thus incur the manufacturing costs associated with climate controlled
storage. Blue cheese and blue-type cheese flavorings produced by submerged culture
fermentation can develop a full flavor profile in 24 hours or less. Blue cheese flavorings
produced in this way have the added advantage of being highly concentrated so they are
easily shipped, stored, and incorporated into food formulations.
48
The production of blue-type cheese flavorings by submerged culture fermentation
has been well documented in patent and scientific literature (Pratt 1989; Amu and Jarvis
1974; Kosikowski and others 1979; Groesbeck and others 1995; Taylor 1995; Jolly and
Kosikoski 1975; Dwivedi and Kinsella 1974). Typical embodiments of Blue cheese
flavoring production involve the use of Penicillium roqueforti, a source of medium chain
(C 6 – C12) free fatty acid, and a sealed reactor with external controls for temperature,
pH, dissolved oxygen, and mixing with the primary goal of producing high
concentrations of methyl ketones.
Methyl ketones, especially 2-heptanone, are the most prominent aroma
compounds found in Blue type cheeses and are positively correlated with flavor
development in Blue cheese (Gallois and Langlois, 1990; Taylor, 1995; Molimard and
Spinnler, 1996). Production of methyl ketones can be accomplished with both the
mycelia and spores of P. roqueforti (Kinsella and Hwang, 1976). Spores are generally
preferred to mycelia because they produce higher concentrations of methyl ketones, are
more resistant to free fatty acid toxicity, and are less likely to further metabolize methyl
ketones to secondary alcohols (Kinsella and Hwang, 1976).
In addition to methyl ketones, other aroma compounds are important for the
complete flavor profile of Blue cheese. Traditional Blue cheese ripening occurs due to
the complex interaction of microbial populations and metabolic activity that involves the
catabolism of not only fatty acids, but also casein and residual lactose (Cantor and others
2004). Some authors have reported success in developing protein-related flavor in Blue

49
cheese flavorings. Luksas added sodium caseinate to the reaction mixture to produce a
“protein background flavor” (1973). Groesbeck and others fermented crumbled blue
cheese in buffered media with lipase, protease, and P. roqueforti to produce a Blue
cheese paste with “intense” flavor (1995). Concentrated sweet and acid whey have also
been used to boost the flavor profile of Blue cheese flavorings (Kosikowski and others
1979; Jolly and Kosikowski 1975). However, Pratt claims that good Blue cheese flavor
can be obtained without a protein source in the fermentation media (1989). No studies to
date have compared the aroma profile of Blue cheese flavorings produced with and
without a protein source.
The microbial population, or microflora, of cheese has been shown to play an
important role in the development of fine flavors. Microflora organisms native to certain
regions are a vital component of what the French termed terroir. Terroir describes the
subtle flavors resulting from aspects unique to specific areas of production. These unique
flavors can appear in the cheese through feed, the breed of dairy animal, or a distinctive
microflora. Cheese connoisseurs have long touted raw milk cheeses for their complexity
of flavor (McCalman and Gibbons 2009). Scientists, too, are beginning to find
significant differences in the aroma and flavor of cheeses produced with raw and
pasteurized milk. Hickey and others found positive correlation between the number of
surviving microflora organisms and lipolysis in Cheddar cheese (2007). Albenzio and
others found that ovine cheeses with added probiotic bacteria also showed increased
lipolysis compared to control cheeses (2010). Other researchers suggest that wild type
bacteria can promote increases in levels of free fatty acids and methyl ketones in ripened

50
cheese (Randazzo and others 2008, 2010). There have been no studies that have
investigated the effect of the microbial population on production of Blue cheese
flavorings. This study was undertaken to test the use of adjunct starter Lactic Acid
Bacteria (LAB) and native Blue cheese microflora (from local Blue cheese whey) in Blue
cheese flavoring systems to determine the effect these populations have on flavor
production.
The results of this study give insight to the optimal system for the production of
Blue cheese flavor. Data obtained provides information to help inform a cost-benefit
analysis for manufacturing decisions regarding the use of adjunct cultures/media in the
production of Blue cheese flavorings.
2. Materials and Methods
2.1 Fermentation of Blue Cheese Flavorings
Submerged culture fermentations were carried out in a 7.0 liter Bioflo 110
fermenter (New Brunswick Scientific) with a working volume of 4.0 L. Fermentations
ran for 16 hours at 25 degrees Celsius with agitation (150 RPM). The fermenter was
sparged with sterile-filtered air at a rate of approximately 400 cc/L/min. The pH was
adjusted manually to 6.0 with citric acid solution or sodium hydroxide solution prior to
sterilization. Heavy whipping cream (UHT; 36 % milk fat) was used as the substrate for
concentrated Blue cheese flavor production. Two media compositions were used:
standard media and Blue cheese whey adjunct media.

51
Standard Media: The standard media was comprised of 1.5 liters of cream, 2.5
liters of filtered tap water, and 100 grams of Kosher salt.
Adjunct media: The adjunct media was be comprised of 1.5 liters of cream, 2.0
liters of Blue cheese whey (Clemson, SC), 500 milliliters of filtered tap water, and
100 grams of Kosher salt.
A total of five treatments were evaluated: 1) standard media with P. roqueforti
(STD/PR), 2) standard media with P. roqueforti and LAB (STD/LAB), 3) adjunct media
with P. roqueforti (ADJ/PR), 4) adjunct media with P. roqueforti and LAB (ADJ/LAB),
5) adjunct media with P. roqueforti and native microflora (ADJ/NM).
Table 1.1: Treatment Layout
Treatment Media Flora
STD/PR Standard Media P. roqueforti
STD/LAB Standard Media P. roqueforti + LAB
ADJ/PR Adjunct Media P. roqueforti
ADJ/LAB Adjunct Media P. roqueforti + LAB
ADJ/NM Adjunct Media P. roqueforti + native microflora
For the STD/PR, STD/LAB, ADJ/PR, and ADJ/LAB treatments, the media was
sterilized at 121 degrees Celsius for 15 minutes in the fermentation vessel and cooled to
25 degrees Celsius with cold water. Each treatment was inoculated with 2.0E+9 spores
of P. roqueforti (PR4; Chr. Hansen: Milwaukee, WI) and 20 grams of lipase (Lipase 600;
Danisco, New Century, KS). The STD/LAB and ADJ/LAB treatments were also
inoculated with 40 grams of starter lactic acid bacteria (LAB) (Chr. Hansen).

52
For the ADJ/NM treatment, cream, water, and salt were sterilized and cooled to
25 degrees Celsius in the fermentation vessel. Untreated natural Blue cheese whey was
added aseptically to the fermentation vessel after sterilization and cooling. This
treatment was also inoculated with 2.0E+9 spores of P. roqueforti (PR4; Chr. Hansen:
Milwaukee, WI) and 20 grams of lipase (Lipase 600; Danisco, New Century, KS).
For all treatments, the inoculum was suspended in a sterile cream media
consisting of 150 milliliters of cream and 100 milliliters of filtered tap water. Each
inoculum was added aseptically to the fermentation vessel.
After 16 hours, the Blue cheese flavorings were removed from the fermentation
vessel. Samples were taken for sensory and instrumental analysis. These samples were
frozen until needed. The remainder of the flavoring was reserved for further processing.
2.2 Sensory Analysis of Blue Cheese Flavorings
Eight panelists were selected from a Dairy Products Evaluation course to evaluate
the aroma of each Blue cheese flavoring. The panelists were presented with standards
during two training sessions. The panelists were given cream, high-intensity (lipolyzed)
milkfat, and fermented cream high in methyl ketones as standards for “Creamy”,
“Cheesy/rancid”, and “Blue cheese” attributes respectively. Standards were anchored at
“7” on a ten point line scale. Panelists were asked to rate “Creamy”, “Cheesy/Rancid”,
and “Blue cheese” attributes of the aroma profile on the ten point line scale ranging from
0 to 9.

53
Samples (15 milliliters) of the Blue cheese flavorings were presented to the
panelist in lidded 4 ounce cups (HDPE). A balanced incomplete block design was used
for the five products (t = 5) evaluated four at a time (k = 4) in five sessions (b = 5). Eight
panelists evaluated the products at each session and the same panelist participated in all
five sessions. Sample order and arrangement of blocks were randomized (see Table 2).
Table 1.2: Original Balanced Incomplete Block Design
Session 1 2 3 4 5
Treatments
to Evaluate
STD/PR
STD/LAB
ADJ/PR
ADJ/LAB
STD/PR
STD/LAB
ADJ/PR
ADJ/NM
STD/PR
ADJ/PR
ADJ/LAB
ADJ/NM
STD/PR
STD/LAB
ADJ/LAB
ADJ/NM
STD/LAB
ADJ/PR
ADJ/LAB
ADJ/NM Sessions and product order randomized
2.3 GC/MS SPME Analysis
Samples (10 milliliters) were placed in 20 milliliters glass headspace vials with
PTFE lined septa. Vials were warmed in a water bath at 50 degrees Celsius and allowed
to equilibrate for 15 minutes. The SPME fiber (DVB/CAR/PDMS; Supelco) was
introduced to the headspace for 45 minutes. Extracted compounds were desorbed in the
injection port for 5 minutes at 250 degrees Celsius and introduced to the column in split-
less mode. A Shimadzu GC 17a instrument was used for all samples.
The column (DB5; 60 meters) was held at 40 degrees Celsius for 8 minutes, then
ramp to 220 degrees Celsius at a rate of 8 degrees Celsius per minute. The temperature
was held at 220 degrees Celsius for 5 minutes, then increased to 275 degrees Celsius at a
rate of 10 degrees Celsius per minute. Helium at a flow rate of 0.9 cubic centimeters per
54
minute was used as the carrier gas. The detector (Shimadzu QP5050) was set to 250
degrees Celsius and scan from 20 to 250 m/z.
2.4 Statistical Analysis
Sensory characteristics and chemical properties were examined using analysis of
variance to compare the means for the five products. Tukey’s multiple comparison
procedure was used when the analysis of variance indicated there were differences among
the product means. Linear contrasts were used to examine the media effect, adjunct
effect and the interaction between the media and adjunct effects. Pearson’s correlation
coefficient I was used to compare the correlation between the sensory characteristics and
chemical properties for each of the five products.
3. Results and Discussion
3.1 Sensory Analysis Data
Sensory data indicates similar aroma profiles across all treatment types. No
significant difference was found for the creamy, cheesy, or blue cheese descriptors
between any of the Blue cheese flavorings individually (p < 0.05; Table 1.3)). However,
when comparing the effects of the media and addition of adjunct culture, some trends are
indicated (Table 1.4).

55
Table 1.3: Estimated Intensity of Blue Cheese Flavoring Aroma
Characteristic Intensity Scores
Treatment “Creamy” “Cheesy/Rancid” “Blue Cheese”
STD/PR 2.56 3.60 4.23
STD/LAB 3.08 3.48 4.32
ADJ/PR 3.08 3.33 3.72
ADJ/LAB 3.60 3.64 3.71
ADJ/NM 3.32 4.16 3.79
Standard Error 0.42 0.39 0.28 Panelists selected intensity on a ten point line scale ranging from 0 to 9. No significant difference
found between any individual sample scores (p < 0.05).
Table 1.4: Estimate Effect of Media and Adjunct Culture on the Aroma
Characteristic Scores
“Creamy” “Cheesy/Rancid” “Blue Cheese”
Media Effect -0.52191
0.0553 0.5585*
Culture Effect -0.51881
-0.0968 -0.04194
Standard Error 0.2932 0.3105 0.2305
“*” indicates p < 0.05 and “1” indicates p < 0.10. Values are representative the average effect of
the media and culture variables on the perceived aroma intensity. Possible values range from -9 to
9. Positive values indicate higher estimated intensity for standard media/cultures. Negative values
indicate higher intensity for adjunct media/cultures.
3.1.1 Creamy Aroma
No statistical difference was found between the “creamy” aroma intensity of any
of the five treatments compared individually (p < 0.05; Table 1.3). However, the use of
whey in the fermentation media increased perception of creamy notes (p < 0.1). The
flavors produced with the addition of lactic acid bacteria also tended to receive higher
marks on the creamy intensity scale (p < 0.1; Table 1.4).

56
3.1.2 Cheesy/Rancid Aroma
No statistical difference was found between the perceived “cheesy/rancid” aroma
characteristic of any of the five treatments (p < 0.05; Table 1.3). Media and adjunct
cultures also appear to have no effect on the perceived cheesiness of Blue cheese
flavorings (p < 0.05; Table 1.4).
3.1.3 Blue Cheese Aroma
There was no statistically significant difference found between “Blue cheese”
aroma intensity scores for the five treatments compared individually (p < 0.05; Table
1.3). However, the standard media treatments were found to receive higher scores for
“Blue cheese” aroma than those treatments produced with the adjunct media (p < 0.05;
Table 1.4). Adjunct cultures did not significantly affect perceived “Blue cheese” aroma
intensity (Table 1.4).
3.2 GC/MS SPME Data
Only three compounds detected were found to vary significantly across the five
treatments (p < 0.05). No significant difference was seen in the relative peak areas of any
of the identifiable free fatty acids (hexanoic, octanoic, decanoic, and dodecanoic acids).
Two methyl ketones (2-heptanone and 2-undecanone) were also found to have
statistically equivalent peak areas for all five treatments (Table 1.5).
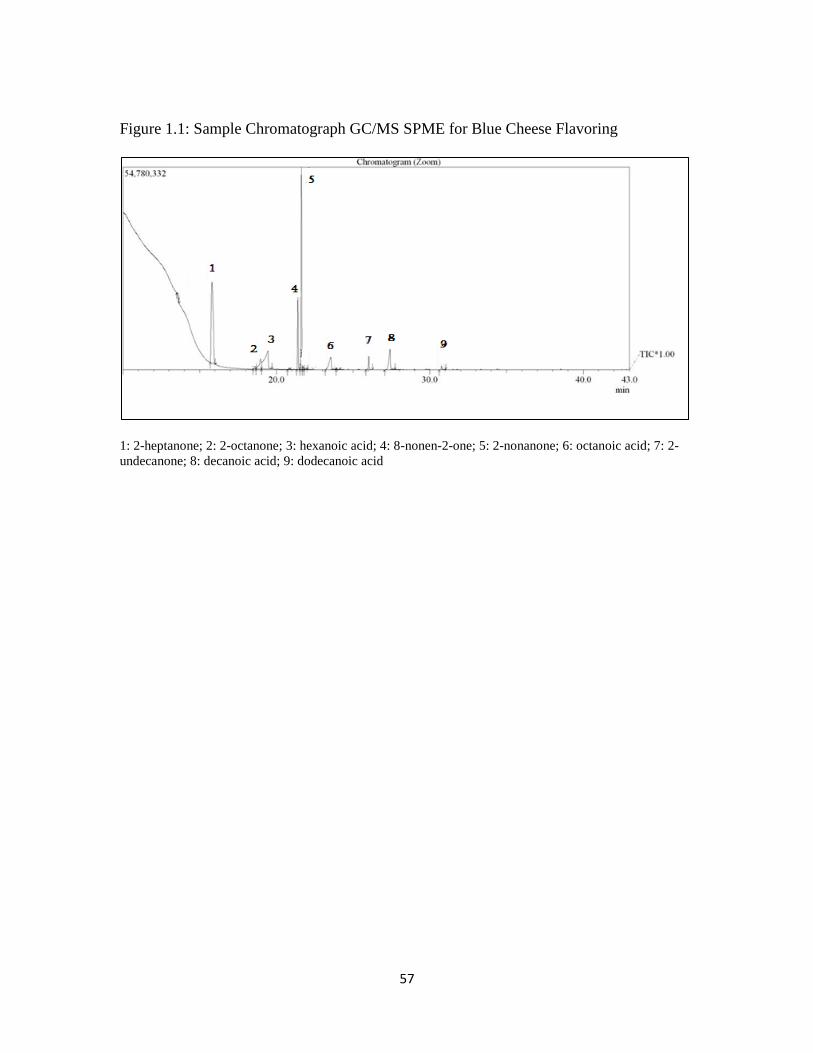
57
Figure 1.1: Sample Chromatograph GC/MS SPME for Blue Cheese Flavoring
1: 2-heptanone; 2: 2-octanone; 3: hexanoic acid; 4: 8-nonen-2-one; 5: 2-nonanone; 6: octanoic acid; 7: 2-
undecanone; 8: decanoic acid; 9: dodecanoic acid

58
Table 1.5: GC/MS SPME Average Peak Areas
RT
(mins
)
STD/PR STD/LA
B
ADJ/PR ADJ/LA
B
ADJ/N
M
Standar
d Error
2-
Heptanone
15.78
4 5.6E+07a 5.6E+07
a 6.4E+07
a 6.1E+07
a 5.0E+07a
5.0E+0
6
2-Octanone 18.88
7
1.7E+06a
bc
1.6E+06b
c 2.3E+06
a
b
2.6E+06a 1.4E+06
c 1.9E+0
5
2-
Nonanone
21.62
5
4.4E+07a
b
4.4E+07a
b
5.7E+07a
b
6.2E+07a 4.1E+07
b
4.4E+0
6
2-
Undecanon
e
25.99
7
3.5E+06a 3.7E+06
a 4.9E+06
a 5.5E+06
a 3.4E+06
a
5.2E+0
5
8-nonen-2-
one
21.38
0
1.5E+07a
b
1.4E+07a
b
1.9E+07a 1.9E+07
a 1.3E+07
b
1.3E+0
6
Hexanoic
Acid
19.40
1
9.6E+06a 9.6E+06
a 7.0E+06
a 4.5E+06
a 1.1E+06
a
1.8E+0
6
Octanonic
Acid
23.66
1
3.9E+06a 4.2E+06
a 1.9E+06
a 1.7E+06
a 5.1E+06
a
1.1E+0
6
Decanocic
Acid
27.38
7
3.8E+06a 3.7E+06
a 2.8E+06
a 2.2E+06
a 3.1E+06
a
6.0E+0
5
Dodecanoci
c Acid
30.73
5
3.0E+05a 2.6E+05
a 1.9E+05
a 1.6E+05
a 1.9E+05
a
5.9E+0
4 Peak values in arbitrary units. Letters represent Tukey groupings by row.
Two-Octanone, 2-nonanone, and 8-nonen-2-one concentrations were shown to
vary between at least two of the treatments. The STD/PR, ADJ/PR, and ADJ/LAB
treatments ranked in the highest statistical grouping for all three of these methyl ketones.
The STD/LAB and ADJ/NM treatments had significantly smaller peak areas for 2-
octanone than the ADJ/LAB treatment. Two-nonanone peak areas were statistically
similar for the STD/PR, STD/LAB, ADJ/PR, and ADJ/LAB treatments as well as the
STD/PR, STD/LAB, ADJ/PR, and ADJ/NM treatments. 8-nonen-2-one peak areas were
statistically equivalent for the STD/PR, STD/LAB, ADJ/PR, and ADJ/LAB treatments as
well as the STD/PR, STD/LAB, and ADJ/NM treatments.

59
Comparing the aroma profiles of Blue cheese flavorings produced with standard
and adjunct media reveals a few trends (Table 1.6). Significantly larger average peak
areas were found for methyl ketones (excluding 2-heptanone) in the whey based media (p
< 0.05). Conversely, trends indicate that free fatty acid concentrations tended to be
higher in the standard media treatments (p < 0.1). No significant trends were observed
when comparing the treatments with standard and adjunct cultures (Table 1.6).
Table 1.6: Estimate of Media and Culture Effects on Relative Peak Areas of Blue
Cheese Aroma Compounds
Compound Media Effect Culture Effect Standard Error
2-heptanone -6.5E+06 1.6E+06 5.0E+06
2-octanone -7.5E+05*** -7.7E+04 1.9E+05
2-nonanone -1.5E+07*** -2.2E+06 4.4E+06
2-undecanone -1.7E+06** -3.6E+05 5.2E+05
8-nonen-2-one -4.6E+06*** 3.0E+05 1.3E+06
Hexanoic Acid 3.8E+061
1.2E+06 1.8E+06
Octanonic Acid 2.2E+061
-3.6E+04 1.1E+06
Decanoic Acid 1.3E+061
3.8E+05 6.0E+05
Dodecanoic Acid 1.1E+051
3.3E+04 5.9E+04
Values represent the estimate difference between relative peak areas (arbitrary units). Positive values
indicate higher peak areas for standard media/cultures. Negative values indicate higher peak areas for
adjunct media/culture. (“1” indicates p < 0.1; “**” indicates p < 0.01; “***” indicates p < 0.005)
60
4. Discussion
Sensory data indicates that the treatment variations had little impact on the overall
aroma characteristics of the Blue cheese flavorings . When comparing individual
samples, aroma intensity scores for “creamy”, “cheesy/rancid”, and “Blue cheese” were
similar across all five treatments (Table 1.3). Further, analytical data indicates
concentrations of key Blue cheese flavor compounds showed little variation between
individual treatments (Table 1.5). Thus, from a production standpoint the standard media
and standard culture treatment would likely be most cost effective.
4.1 Creamy Aroma
Though, there is some evidence to indicate the potential of adjuncts to increase
the “creamy” character of the Blue cheese flavorings (Table 1.4). Enhanced creaminess
in Blue cheese flavorings could be especially advantageous to manufacturers of a wide
variety of Blue cheese flavored food products (dressings, sauces, etc.). Creamy notes act
to bring balance and cohesiveness to the Blue cheese flavor and may increase consumer
acceptance. Creamy notes also help Blue cheese pair well with various food items
(Mcallman and Gibbons, 2009).
The “creamy” aroma intensity scores for both adjunct media and adjunct cultures
were around 0.5 higher compared to their standard counterparts. Higher “creamy” aroma
intensity for the adjunct media treatments was likely due to native compounds in the Blue
cheese whey. In addition to the native aroma compounds, cheese whey also added
substrate for the production of Maillard compounds during high heat of the sterilization
61
process. These compounds enhanced the cooked notes that panelists likely associated
with the “creamy” aroma descriptor. Yet, it is uncertain whether cooked notes were
pleasant or off-putting. The added substrate in the cheese whey may have also provided
additional substrate for the production of compounds which have been shown to
contribute to creamy background aroma notes important to Blue cheese (Kinsella and
Hwang, 1976; Gallois and Langlois, 1990).
Aroma compounds produced by lactic acid bacteria accentuated the “creamy”
notes in the Blue cheese flavorings. Lactic acid bacteria are known to utilize citric acid
in the production of diacetyl which has a strong buttery note (Fox, 2000; Reddy and
others, 2002; McSweeny, 2007).
“Creamy” aroma compounds including lactones, aldehydes, and browning
products were not detected using gas chromatography. Future work could work to isolate
and quantify these compounds.
4.2 Cheesy/Rancid Aroma and Free Fatty Acids
Based on the GC/MS SPME profile of free fatty acids, differences in
“cheesy/rancid” character were expected to be subtle (Table 1.5). Butyric acid, a major
contributor to cheese aroma and rancidity, was not identifiable using these methods, and
therefore, no GC/MS SPME data could be collected for this compound. Variation in
butyric acid concentration could have a major impact on the perceived “cheesy/rancid”
aroma intensity (Qian and others, 2002; Christensen and Reineccius, 1995). Other aroma
compounds generally associated with “cheesy” flavor such as volatile sulfur compounds

62
and aldehydes were also undetectable with the instrument used in this study. Sensory
data indicates that the treatments were similar in “cheesy/rancid” intensity indicating that
undetectable compounds were either similar in concentration or not important in the
aroma profile of the Blue cheese flavorings.
Taking media effects into account, standard media treatments tended to have
higher concentrations of fatty acids (p < 0.1). However, sensory data does not indicate
higher intensity of “cheesy/rancid” notes in the Blue cheese flavorings produced with
standard media. Fatty acids have low threshold values and high flavor dilution values so
panelists were likely not able to detect small differences in the concentration of fatty
acids. Shorter chain free fatty acids have a greater impact on cheese aroma than longer
chain free fatty acids (Curioni and Bosset, 2002). Shorter chain free fatty acids are
described as “cheesy, sweaty, and sour” while longer free fatty acids are typically given
“waxy and soapy” descriptors (Qian and others, 2002; Curioni and Bosset, 2002; Wang
and Xu, 2009).
Compounds in the adjunct media may have supplemented the “cheesy/rancid”
characteristics of these treatments causing panelists to rank these samples as having
similar intensity. Amino acids are important precursors for alcohols, aldehydes,
thioesters, and sulfur compounds which help impart “cheesy” aroma (Gallois and
Langlois, 1990; Molimard and Spinnler, 1996; Landaud and others, 2008). These added
nutrients/precursors in the whey were expected to increase the perceived “cheesy” aroma.

63
Higher “cheesy/rancid” character for the STD/LAB, ADJ/LAB, and ADJ/NM
treatments was also expected due to the adjunct organisms in the fermentation system.
Microflora organisms are often associated with cheese flavor complexity (McCalman and
Gibbons, 2009). Microflora organisms have also been associated with greater lipolysis in
Cheddar cheese (Hickey and others, 2007). Further, P. roqueforti has been shown to act
synergistically with a number of yeasts, molds, and bacteria to produce a variety of
cheese flavor compounds (Cantor, 2004).
Due to the short fermentation time, differences between the treatments were not
pronounced. Longer fermentation times may allow greater “cheesy/rancid” aroma
production and greater overall aroma profile complexity from the whey nutrients as well
as the microflora organisms. However, longer fermentation times increase production
costs and may allow further metabolism of methyl ketones (Kinsella and Hwang, 1976;
Pratt, 1989).
Other aroma compounds generally associated with “cheesy” flavor such as
volatile sulfur compounds and aldehydes were not detectable with the instrument used in
this study. Lower column temperatures and liquid nitrogen traps are needed to study
these highly volatile compounds. Volatile sulfur compounds and other compounds
produced through protein degradation have some impact on Blue cheese aroma (Gallois
and Langlois, 1990), and may impact the aroma profile of the Blue cheese flavorings
produced in this study.
64
Cheesiness is also closely associated with the salty, savory flavors created through
polypeptide degradation (Kinsella and Hwang, 1976; Fox, 2000; Cantor, 2004). Amino
acids and dipeptides enhance the richness and meatiness of cheese. Hydrophobic oligo-
peptides (3-8 amino acid subunits) typically have a bitter taste, and are thus undesirable
in cheese in high quantities. Longer peptides generally do not have much flavor (Fox,
2000). The sapid profile of the Blue cheese flavorings was not determined. Differences
in taste between the five treatments may have been more pronounced than differences in
the aroma profile of these Blue cheese flavorings.
4.3 Blue Cheese Aroma and Methyl Ketones
Some variation was found in the concentration of three methyl ketones between
Blue cheese flavorings (Table 1.5). However, aroma intensity scores for the Blue cheese
flavorings were not significantly different despite these variations in the concentrations of
methyl ketones (Table 1.3). Based on the sensory data, the variation in methyl ketone
concentrations did not significantly impact the aroma intensity of the flavorings. Two
compounds of the three are considered less important to Blue cheese flavor (2-octanone
and 8-nonen-2-one), and variation was seen only between a few treatments.
Surprisingly, 8-nonen-2-one was found in much higher concentrations than 2-
undecanone. Typically, 8-nonen-2-one is only found in small quantities in Blue cheese
(Anderson and Day, 1966; Moio and others, 2000; Qian and others, 2002; Gkatzionis and
others, 2009). Yet, Wolf and others report higher levels of 8-nonen-2-one than 2-
undecanone in Argentine Blue cheeses (2011). Aroma characteristics of 8-nonen-2-one
65
have not been published so it is unknown what impact this compound has on the aroma
profile of the Blue cheese flavorings.
Qian and others found higher levels 2-nonanone than 2-heptanone in Blue cheese
flavorings produced from submerged culture fermentation (2002). Dwivedi and Kinsella
also report higher 2-nonanone production in Blue cheese flavorings from continuous
submerged culture fermentations (1974). This study found 2-heptanone to be the most
abundant aroma compound in all Blue cheese flavorings (Table 1.5).
The concentration of all methyl ketones except 2-heptanone was higher in
flavorings produced with adjunct media than those produced with standard media (Table
1.6). Higher levels of methyl ketones in the adjunct media indicates that free fatty acids
were more easily converted to methyl ketones when cheese whey was present in the
media. Conversely, higher levels of free fatty acids were found in the standard media
samples. Nutrients present in the cheese whey likely aided production of methyl ketones.
Kinsella and Hwang report that the presence of amino acids in cheese media stimulates P.
roqueforti production of methyl ketones (1976). They also report that glucose stimulates
the production of 2-undecanone by resting spores (Kinsella and Hwang, 1976).
Samples from the ADJ/NM treatment were consistently lower in methyl ketone
concentrations than the ADJ/PR and ADJ/LAB treatments suggesting that the reactions
during the sterilization process were important for the bioavailability of whey nutrients
(Table 1.5).
66
The adjunct cultures did not have an effect on the production of methyl ketones or
“Blue cheese” aroma (Tables 4 and 6). Due to the short fermentation period, the adjunct
cultures did not impact the production of methyl ketones or free fatty acids. LAB may
have had a greater impact over longer fermentation periods. LAB were expected to
increase methyl ketone production as synergistic effects have been observed between P.
roqueforti and LAB.
Panelists reported higher “Blue cheese” intensity for standard media treatments
despite significantly higher levels of methyl ketones in treatments produced with adjunct
media (Tables 1.4 & 1.6). Adjunct media aroma components likely masked some “Blue
cheese” character leading panelists to mark these samples as less intense. Thus, higher
perception of “Blue cheese” aroma in standard media samples was likely due to the
simplicity of the standard media aroma profile. Standards for the “Blue cheese”
descriptor were most similar to the Blue cheese flavorings produced with the standard
media so panelists were most familiar identifying “Blue cheese” aroma in this context.
Aroma notes from the adjunct media likely made detection of “Blue cheese” aroma
character more difficult for these panelists due to their limited training.
Proteins, particularly heat-denatured proteins, have been shown to bind 2-
alkanones through hydrophobic interactions (Matheis, 2007). The proteins in the adjunct
media may have bound aroma active compounds more strongly during sensory analysis
(samples at room temperature) than during GC/MS SPME analysis (samples at 50
degrees C). Differences in the volatility of methyl ketones during these two conditions

67
may explain the discrepancy between sensory and analytical data. Temperature has been
shown to impact binding affinity of 2-alkanones to milk protein (Matheis, 2007).
Alternatively, the higher relative concentrations of free fatty acids in the standard
media samples may have increased perceived “Blue cheese” aroma. FFA’s and methyl
ketones have been shown to act synergistically in Blue cheese aroma profiles (Gallois
and Langlois, 1990).
4.4.1 Limitations of Sensory Study
Panelists showed low reproducibility of aroma intensity scores for the same
treatment over the various trials. Low reproducibility was likely due to variability in the
fermentation process. Low reproducibility may also be due to limited training of sensory
panelists. Ideally, panelists would receive extensive training in the detection of Blue
cheese aroma components before completion of a descriptive analysis study. Limited
time and resources available for this study allowed only a few orientation sessions.
In the orientation sessions, panelists seemed to have a hard time differentiating
between “cheesy/rancid” and “Blue cheese” characteristics. These descriptors were
likely difficult to separate because of their synergistic contribution to the flavor of Blue
cheese. Both methyl ketones (Blue cheese character) and free fatty acids (cheesy/rancid
character) have low threshold values and contribute important notes to the aroma profile
of blue-type cheeses (Gallois and Langlois, 1990). Furthermore, varying concentrations
of one or more of the major aroma contributors can have a dramatic effect of the
perceived aroma of the cheese or cheese flavor (Qian and others, 2002). For this reason,

68
blue-type cheeses from around the world have markedly different flavor profiles
(McCalman and Gibbons, 2009).
The descriptors used did not accurately profile nuanced differences between the
aroma characteristics of the samples. Other aroma characteristics not studied may have
an impact on the usefulness of a Blue cheese flavoring. Also, sensory analysis did not
account for overall balance of aroma components or measure panelist liking. Affective
testing (such as paired comparison or hedonic scale tests) could be applied in future
studies to determine panelist liking of Blue cheese flavorings. A much larger sample size
would be needed for this type of study. Discrimination testing using triangle, duo-trio, or
paired-comparison tests could also be beneficial to see if panelists can perceive a
difference between individual samples. Many more sessions and a sophisticated design
would be required to discriminate between 5 products.
4.4.2 Limitations of GC/MS SPME Analysis
Due to the use of SPME, some variability likely occurred between extractions.
Triplicate analysis of Blue cheese flavorings with GC/MS SPME would have been ideal.
Time and equipment restraints prevented triplicate analysis in this study. The variation in
media composition may have affected the equilibration of aroma compounds during the
solid-phase extraction.
Furthermore, many high volatile compounds important to cheese aroma were not
detectable on the instrument used for analysis. Lower column temperatures are needed to
separate and detect these compounds.

69
5. Conclusions
Minimal differences were found between Blue cheese flavorings produced with
adjunct media and adjunct cultures. Some evidence was found to indicate that the
adjunct media increased the “creamy” character of Blue cheese flavorings. Findings also
indicate higher levels of methyl ketones are produced in Blue cheese flavorings created
from adjunct media. However, panelists perceived higher “Blue cheese” aroma intensity
in standard media samples. The addition of adjunct cultures increased perceived
“creamy” aroma, but did not impact the production of methyl ketones or free fatty acids.
Benefits of adjunct culture and adjunct media do not seem to justify the increased
operation costs. Adjuncts may have a greater impact on the Blue cheese flavorings over
longer fermentation times. Affective testing should be applied to determine if treatment
variations impact liking among panelists.
6. Further Studies
Further studies could alter the fermentation conditions (i.e. time, temperature, pH,
substrate concentration, etc.) to see if these variables increase the impact of adjunct
media or cultures in the Blue cheese flavor fermentations. Furthermore, alternate sensory
tests could be applied to examine if treatment conditions impact the consumer liking of
the Blue cheese flavorings.
70
Acknowledgements
The author would like to thank, Dr. Jim Rieck, for help with statistical design and
data analysis. Thank you, Greg Jones, for helping develop chromatography methods.
Thank you, Keri Lipscomb, for help running the sensory panels. The author would also
like to thank, Chr. Hansen and Danisco, for providing ingredients and technical support.
71
Literature Cited
Albenzio and others. 2010. Biochemical patterns in ovine cheese: Influence of probiotic
strains. Journal of Dairy Science 93: 3487-3496.
Amu, L and Jarvis, B. 1974. Blue Cheese Flavored Product. British Patent No. 1361817.
Christensen, K. and Reineccius, G. 1995. Aroma Extract Dilution Analysis of Aged
Cheddar Cheese. Journal of Food Science 60(2): 318-320.
Curioni, P. and Bosset, J. 2002. Key Odorants in Various Cheese Types as Determined
by Gas Chromatography- Olfactometry. International Dairy Journal 12: 959-984.
Dwivedi, B and Kinsella, J. 1974. Carbonyl Production from Lipolyzed Milk Fat by the
Continuous Mycelial Culture of Penicillium roqueforti. Journal of Food Science (39): 83-
87.
Fox, P. and others. 2000. Fundamentals of Cheese Science. Gaithersburg: Aspen
Publishers. 587 p.
Gallois, A. and Langlois, D. 1990. New Results in the Volatile Odorous Compounds of
French Cheeses. Le Lait 70: 89-106.
Gkatzionis, K. and others. 2009. Volatile Profile of Stilton Cheeses: Differences Between
Zones Within a Cheese and Dairies. Food Chemistry 113: 506-512.
Groesbeck, C and others. 1995. Process for preparing a blue cheese flavorant. US Patent
No. 5,455,051.
Hickey and others. 2007. Lipolysis in Cheddar Cheese Made from Raw, Thermized, and
Pasteurized Milks. Journal of Dairy Science 90: 47-56.
Jolly, R and Kosikowski, F. 1975. Blue Cheese Flavor by Microbial Lipase and Mold
Spores Utilizing Whey Powder, Butter and Coconut Fats. Journal of Food Science 40:
285-287.
Kinsella, J and Hwang, D. 1976. Biosynthesis of Flavors by Penicillium roqueforti.
Biotechnology and Bioengineering 17: 927-938.
Kinsella, J. and Hwang, D. 1976. Enzymes of Penicillium roqueforti Involved in the
Biosynthesis of Cheese Flavor. Critical Reviews in Food Science and Technology
8(2):191-228.

72
Kosikowski, F and others. 1979. Preparation of blue cheese flavor. US Patent 4,133,895.
Landaud, S. and others. 2008. Formation of Volatile Sulfur Compounds and Metabolism
of Methionine and Other Sulphur Compounds in Fermented Food. Applied Microbiology
and Biotechnology 77: 1191-1205.
Matheis, G. 2007. Flavour Binding and Release: Introduction. In: Flavourings.
Weinheim: Wiley-VCH. 827 p.
McCalman, M. and Gibbons, D. 2009. Mastering Cheese. New York: Clarkson Potter.
384 p.
McSweeny, P. L. 2007. Cheese Manufacture and Ripening and their Influence on Cheese
Flavor. In: Improving the Flavour of Cheese. New York: CRC Press. 580 p.
Moio, L. and others. 2000. Odour-impact compounds of Gorgonzola cheese. Journal of
Dairy Research 67: 273-285.
Molimard, P. and Spinnler, H. 1996. Review: Compounds Involved in the Flavor of
Surface Mold-Ripened Cheeses: Origins and Properties. Journal of Dairy Science 79:
169-184.
Pratt, N. 1989. Preparation of a blue cheese flavor. US Patent No. 4,832,964.
Reddy, D. and others. 2002. Natural Biogenerated Cheese Flavoring System. US Patent
No. 6,406,724.
Taylor, F. 1995. Bleu cheese flavor production by submerged fermentation with on-line
monitoring by gas chromatography. Journal of Industrial Microbiology 15: 71-74.
Qian, M. and others. 2002. Evaluation of Fat-Derived Aroma Compounds in Blue Cheese
by Dynamic Headspace GC/Olfactometry-MS. Journal of American Oil Chemists’
Society 79(7): 663-667.
Wang, B. and Xu, S. 2009. Effects of Different Commercial Lipases on the Volatile
Profile of Lipolysed Milk Fat. Flavour and Fragrance Journal 24: 335-340.
Wolf, I. and others. 2011. Composition and Volatile Profiles of Commercial Argentinean
Blue Cheeses. Journal of the Science of Food and Agriculture 91:385-393.
73
CHAPTER 3: EXTRACTION OF BLUE CHEESE FLAVOR COMPOUNDS FROM
NATURAL SOURCES USING NEAR-CRITICAL AND SUPERCRITICAL CARBON
DIOXIDE
Abstract
Near-critical and supercritical carbon dioxide were used to concentrate the aroma active
compounds of a traditional Blue cheese and a Blue cheese flavoring. Pressures used ranged from
73 to 90 Bar, temperatures used were 35 and 45 degrees Celsius. The extracts were selective for
2-heptanone and 2-nonanone, the characteristic compounds of Blue cheese. Two-heptanone was
more soluble than 2-nonanone and comprised 67 to 71 percent of the extracts. Near-critical
extraction (73 Bar; 35 degrees Celsius) of Blue cheese flavoring yielded the most methyl ketones.
Results indicate that carbon dioxide may be effective for the concentration of methyl ketones on
an industrial scale.
1. Introduction
Due to consumer and market demands, natural Blue cheese flavorings are
commonly used as an economical replacement for traditionally manufactured Blue cheese
in a variety of food products including salad dressings, snack crackers, and sauces.
Traditional Blue cheeses are typically aged at least 60-90 days for full flavor
development and thus incur the manufacturing costs associated with climate controlled
storage. Blue cheese and blue cheese type flavorings produced by submerged culture
fermentation can develop a full flavor profile in 24 hours or less. Blue cheese flavorings
produced in this way have the added advantage of being highly concentrated so they are
easily shipped, stored, and incorporated into food formulations.
74
The production of Blue cheese type flavorings by submerged culture fermentation
has been well documented in patent and scientific literature (Pratt 1989; Amu and Jarvis
1974; Kosikowski and others 1979; Groesbeck and others 1995; Taylor, 1995; Jolly and
Kosikoski 1975; Dwivedi and Kinsella 1974). Typical embodiments of Blue cheese
flavor production involve the use of Penicillium roqueforti, a source of medium chain (C
6 – C12) free fatty acid, and a sealed reactor with external controls for temperature, pH,
dissolved oxygen, and mixing with the primary goal of producing high concentrations of
methyl ketones.
Methyl ketones, especially 2-heptanone and 2-nonanone, are the most prominent
aroma compounds found in blue-type cheeses and are positively correlated with flavor
development in Blue cheese (Gallois and Langlois, 1990; Taylor, 1995). The aroma
characteristics of methyl ketones include fruity, spicy, blue, green, floral, and herbaceous.
Methyl ketones are also often described as having “Blue cheese” aroma (Molimard and
Spinnler, 1996; Sable and Cottenceau, 1999; Curioni and Bosset, 2002; Qian and others
2002).
Highly concentrated Blue cheese flavors are prized in the food industry for their
versatility in food product application, increased shelf stability, and reduced
transportation costs. Traditional methods of concentrating Blue cheese flavors include
spray drying and distillation (Jolly and Kosikoski 1975; Sibeijn and Wouters, 2009).
These processes require large amounts of energy and have the potential to alter flavor
characteristics due to high heat. Supercritical fluid extraction (SFE) has been proposed as
75
an energy saving, low temperature alternative concentration method for the flavor
industry (Mukhopadhyay, 2000).
Supercritical carbon dioxide (SCCO2) is currently used in the food industry to
decaffeinate coffee and tea as well as extract hop oils for the beer industry (Brunner,
2005). Research has also shown the effectiveness of SFE for the production of essential
oils and aroma extracts (Reverchon, 1997; Reverchon and Marco, 2006). SCCO2
extraction is better suited for capturing the highly volatile aroma compounds often lost
with steam distillation (Oszagyan, 1996).
Low molecular weight compounds are important for complexity and balance of
cheese flavors, however, little research has been conducted using SFE to preserve
volatiles during concentration (Sibeijn and Wouters, 2009). Larrayoz and others showed
that extracts from Roncal cheese at 109 Bar and 50 degrees Celsius retain their native
aroma characteristics (2000). Further, Haan and others found that two stage extractions
using SCCO2 in the density range of 600-700 kg/m3 could concentrate lactones from
milk fat over 500 times (1990). Mohyuddin demonstrated that SFE was effective for the
quantification of Blue cheese and Roquefort cheese fatty acids (1993). However, no
studies have been published on the extraction of methyl ketones from Blue cheese.
This study examines the concentration of methyl ketones, 2-heptanone and 2-
nonanone, from traditional Blue cheese and natural Blue cheese flavorings using
supercritical and near-critical carbon dioxide.

76
2. Materials and Methods:
2.1 Samples
2.1.1 Blue Cheese Samples
Cheese samples (25 g) were taken from a single wheel of locally produced
Clemson Blue cheese (Clemson, SC). Blue cheese was crumbled manually to produce
pieces approximately 5 mm in diameter. Samples were mixed with an equal weight of
glass beads (3 mm) and added to the extraction vessel.
2.1.2 Blue Cheese Flavor Samples
Blue cheese flavor was produced by submerged culture fermentation. Submerged
culture fermentations were carried out in a 7.0 liter Bioflo 110 fermenter (New
Brunswick Scientific) with a working volume of 4.0 L. Fermentations ran for 16 hours at
25 degrees Celsius with agitation (150 RPM). The fermenter was sparged with sterile-
filtered air at a rate of approximately 400 cc/L/min. The pH was adjusted manually to 6.0
with citric acid solution or sodium hydroxide solution prior to sterilization. The media
was sterilized at 121 degrees Celsius for 15 minutes in the fermentation vessel and cooled
to 25 degrees Celsius with cold water. Each treatment was inoculated with 2.0E+9 spores
of P. roqueforti (PR4; Chr. Hansen: Milwaukee, WI), 40 grams of starter lactic acid
bacteria (Chr. Hansen), and 20 grams of lipase (Lipase 600; Danisco, New Century, KS).
After fermentation, the Blue cheese flavor was centrifuged to separate the
aqueous and lipid fractions. The lipid fraction was collected and stored at 0 degrees
77
Celsius. The aqueous fraction along with any solids was discarded. Lipid fractions from
four submerged culture fermentations were pooled and then centrifuged a second time for
further purification. Samples of this lipid fraction (25 g) were mixed with an equal
weight of glass beads (3 mm) and added to the extraction vessel.
2.2 Extractions
Supercritical fluid extractions were performed in a 70 ml extraction vessel (Thar).
The extraction vessel was heated to extraction temperature using an incubator. The
vessel was filled with pressurized carbon dioxide using two syringe pumps (Isco). Flow
was measured using a flow meter and maintained at approximately 300 cc/min using a
microcontroller valve (HPP). Samples were extracted for 3 hours following a 30 minute
equilibration time. Extracted compounds were collected in 50 ml centrifuge tubes filled
with 3 ml of ethanol and 20 ml of glass beads (3 mm). Collection tubes were chilled
externally using a dry ice-ethanol bath. Sampling took place at 30, 60, 120, and 180
minutes. New collection tubes were used for each sampling period. All collection tubes
were stored at 0 degrees Celsius until analysis. All extractions were performed in
triplicate.
The pressures used in this study were selected to avoid triglyceride extraction
which not only diluted the extracts, but also would have caused problems with
instrumental analysis. By lowering the pressure, conditions became highly selective for
methyl ketones.
78
2.2.1 Blue Cheese Extractions
Traditional Blue cheese samples were extracted at 1) 78 Bar and 35 degrees
Celsius and 2) 90 Bar and 45 degrees Celsius.
2.2.2 Blue Cheese Flavor Extractions
Blue cheese flavorings samples were extracted at 1) 73 Bar and 35 Celsius and 2)
77 Bar and 45 degrees Celsius.
2.3 GC/MS Analysis
The separation of compounds were achieved on a DB-5 MS capillary column (30
m length x 0.25 mm internal diameter x 0.20 μm film thickness) using a split (1:10)
injection (1μl) with the following temperature program: 45 degrees Celsius for 3 minutes
followed by a ramp of 15 degrees Celsius per minute to 280 degrees Celsius and held for
5 minutes.
The carrier gas (He) was maintained at a constant pressure of 10 psi, the injection
port and the MS interface was maintained at 270 degrees Celsius, the MS quad
temperature was maintained at 150 C and MS source temperature was set at 240 degrees
Celsius. The electron multiplier was operated at a constant gain of 10 (EMV = 1478V)
and the scan range was set at 50 to 200 amu resulting in 7.96 scans /sec. The compounds
were positively identified with Wiley 9th + NIST08 MS Libraries and with authentic
standards.

79
3. Results
Table 2.1: Total Extracted 2-heptanone and 2-nonanone (mg/kg raw material) for
Blue Cheese and Blue Cheese Flavoring.
2-Heptanone 2-Nonanone Combined
Blue Cheese (35 C;
78 Bar)
2.2803 ± 0.245 1.4250 ± 0.668
3.7053 ± 0.911
Blue Cheese (45 C;
90 Bar)
1.9133 ± 0.266 0.8057 ± 0.190 2.7190 ± 0.126
Flavoring (35 C; 73
Bar)
65.024 ± 6.354 31.779 ± 5.876 96.803 ± 12.228
Flavoring (45 C; 77
Bar)
47.235 ± 8.430 20.000 ± 6.045 67.234 ± 14.469
Figure 2.1: Total Extracted 2-heptanone and 2-nonanone (mg/kg raw material) for
Blue Cheese and Blue Cheese Flavoring
Recovery of 2-heptanone and 2-nonanone from Blue cheese in this study was
within the ranges reported by the literature (Table 1). Levels of 2-heptanone in blue-type
cheeses have been reported ranging from 0.4 to 14.7 parts per million (mg/kg), while
levels of 2-nonanone have been reported from 0.4 to 17.6 mg/kg (Gallois and Langlois,
0.00
10.00
20.00
30.00
40.00
50.00
60.00
70.00
Blue Cheese(35 C; 78bar)
Blue Cheese(45 C; 90 bar)
Flavoring (35C; 73 Bar)
Flavoring (45C; 77 Bar)
2-Heptanone(mg/kg)
2-Nonanone(mg/kg)

80
1990; Gonzales de Llano and others, 1990; Moio and others, 2000; Florez and others,
2006; Gkatzionis and others, 2009). Therefore, SFE could be a viable option for the
analysis of 2-heptanone and 2-nonanone content in blue-type cheeses. The low yield of
methyl ketones from traditional Blue cheese likely makes SFE economically impractical
on an industrial scale.
Factors effecting the extraction of methyl ketones from Blue cheese could have
included particle size, moisture content, and initial ketone concentration. The fairly large
particle size of Blue cheese used in this study could have limited diffusion of carbon
dioxide into the cheese. Further, moisture in the cheese may have acted as a barrier
against diffusion of supercritical fluid into the cheese crumbles (Reverchon, 1997).
High volatile compounds were not measured in this study since they were
disguised by the solvent peak. However, sensory qualities indicate that extracts retain
similar aroma characteristics as the Blue cheese. High volatile aroma compounds from
fermented fish sauce were effectively removed using SCCO2 at 35 degrees Celsius and
100 Bar (Shimoda and others, 2000). Larrayoz and others showed that panelists were
able to correctly match cheese aroma extracts with the original cheeses for Roncal cheese
at 109 Bar and 50 degrees Celsius (2000).
Blue cheese flavoring extracts were significantly higher in methyl ketones than
the Blue cheese extracts (Table 2.1). Blue cheese flavorings have been reported to
contain at least seven times the 2-heptanone and four times the 2-nonanone per gram of
fat than traditional Blue cheese. With a fat content of around 30 percent, this means Blue

81
cheese flavorings can contain over 21 times the 2-heptanone and 12 times the 2-nonanone
by weight of traditional cheese (Jolly and Kosikowski, 1975). Dwivedi and Kinsella
found their submerged culture based flavorings to produce 2 times more 2-heptanone and
5 times more 2-nonanone than Blue cheese (1974). This study found 2-heptanone was
approximately 28 times and 2-nonanone 22 times greater in flavoring extracts than Blue
cheese extracts (Table 2.1).
Blue cheese flavoring extract data indicates good solubility of 2-heptanone and 2-
nonanone in near-critical and supercritical CO2 (Table 2.1). Two-heptanone was more
soluble than 2-nonanone under the conditions tested. Two-heptanone comprised 67 – 71
% of the flavoring extracts (Table 2.2). SPME analysis of the flavoring prior to
centrifugation and extraction indicated that levels of 2-heptanone and 2-nonanone were
approximately equal (Table 2.3). Two-heptanone comprised 63 – 70 % of the Blue
cheese extracts (Table 2.2). Relative compositions of 2-heptanone and 2-nonanone in the
cheese were not tested. However, most sources report 2-nonanone concentrations of
equal or greater than 2-heptanone concentrations for typical blue-type cheeses (Gallois
and Langlois, 1990; Gonzales de Llano and others, 1990; Moio and others, 2000; Florez
and others, 2006; Gkatzionis and others, 2009).
Table 2.2: Extract Percent Composition 2-heptanone and 2-nonanone.
2-Heptanone (%) 2-Nonanone (%) Standard Deviation
(%)
BC 35 C 63.5 36.5 7.93
BC 45 C 70.2 29.8 6.13
Flavoring 35 C 67.4 32.6 1.79
Flavoring 45 C 70.9 29.1 2.87

82
Table 2.3: Relative Peak Areas of Aroma Compounds in Blue Cheese Flavoring
Prior to Centrifugation and Extraction (GC/MS SPME Analysis)
Compound Relative Peak Area
(arbitrary units)
2-Heptanone 6.1E+07
2-Octanone 2.6E+06
2-Nonanone 6.2E+07
2-Undecanone 5.5E+06
8-Nonen-2-one 1.9E+07
Hexanoic Acid 4.5E+06
Octanonic Acid 1.7E+06
Decanocic Acid 2.2E+06
Dodecanocic Acid 1.6E+05
From Table 1.5 (ADJ/LAB treatment)
Two-heptanone has been reported as having a higher flavor dilution value than 2-
nonanone (Qian and others, 2002). Therefore, SCCO2 extracts may have stronger
aromas and superior organoleptic quality. However, flavor profile may be unbalanced
due to lower concentration of 2-nonanone. A sensory study is needed to determine the
perceived aroma characteristics of these extracts.
Scale-up for an industrial process could include the use of continuous counter-
current extraction for greater through-put and efficiency (Singh and Rizvi, 1994). At
least one separator could also be used to improve extract yield. Haan and others found
that lactones could be concentrated 500 times using a two stage extraction compared to
20 times using a single stage extraction (1990). Addition of separators could also allow
fractionation of milk fat for the creation of high value by-products (Bhaskar and Rizvi,
1993). Spent milk fat could also be re-introduced into the fermentation system for

83
conversion to methyl ketones. Shimoda and others found that flow rate was important to
the efficiency of aroma compound extraction. Faster flow rates increased removal of
aroma compounds from fish sauce (2000). Faster flow rates may improve the extraction
of aroma compounds from Blue cheese and Blue cheese flavorings.
4. Conclusions
Supercritical and near-critical carbon dioxide are effective solvents for the
concentration of 2-heptanone and 2-nonanone from natural sources. Near-critical carbon
dioxide (35 C; 73 Bar) was a better solvent for these compounds than supercritical carbon
dioxide (45 C; 77 Bar). Submerged culture fermentation combined with near-critical
carbon dioxide extraction may be viable for the industrial production of highly
concentrated, natural Blue cheese flavorings.
5. Further Studies
Further studies could look into the other compounds extracted from Blue cheese
and Blue cheese flavorings. Future studies could also more closely examine the vapor
pressure effect on solubility of Blue cheese aroma compounds by maintaining a constant
fluid density while varying temperature.
Acknowledgements
The author would like to thank, Dr. Nishanth Tharayil, for performing the
analysis of the samples from this study.
84
Literature Cited
Amu, L and Jarvis, B. 1974. Blue Cheese Flavored Product. British Patent No. 1361817.
Bhaskar, A. and others. 1993. Anhydrous Milk Fat Fractionation with Continuous
Countercurrent Supercritical Carbon Dioxide. Journal of Food Science 58(4): 748-752.
Brunner, G. 2005. Supercritical Fluids: Technology and Application to Food Processing.
Journal of Food Engineering 67: 21-33.
Curioni, P. and Bosset, J. 2002. Key Odorants in Various Cheese Types as Determined
by Gas Chromatography- Olfactometry. International Dairy Journal 12: 959-984.
Dwivedi, B. and Kinsella, J. 1974. Continuous Production of Blue-type Cheese Flavor by
Submerged Fermentation of Penicillium roqueforti. Journal of Food Science 39: 620-622.
Florez, A. and others. 2006. Microbial, Chemical, and Sensorial Variables of Spanish
Traditional Blue-veined Cabrales Cheese, as Affected by Inoculation with Commercial
Penicillium roqueforti Spores. European Food Research and Technology 222: 250-257.
Gallois, A. and Langlois, D. 1990. New Results in the Volatile Odorous Compounds of
French Cheeses. Le Lait 70: 89-106.
Gkatzionis, K. and others. 2009. Volatile Profile of Stilton Cheeses: Differences Between
Zones Within a Cheese and Dairies. Food Chemistry 113: 506-512.
Gonzalez de Llano, D. and others. 1990. Evolution of the Volatile Components of an
Artisanal Blue Cheese During Ripening. Journal of Dairy Science 73(7): 1676-1683.
Groesbeck, C and others. 1995. Process for preparing a blue cheese flavorant. US Patent
No. 5,455,051.
Haan, A. and others. 1990. Extraction of Flavors from Milk Fat with Supercritical Carbon
Dioxide (3): 15-19.
Jolly, R and Kosikowski, F. 1975. Blue Cheese Flavor by Microbial Lipase and Mold
Spores Utilizing Whey Powder, Butter and Coconut Fats. Journal of Food Science (40):
285-287.
Kosikowski, F. and others. 1979. Preparation of Blue Cheese Flavor. US Patent No.
4,133,895.

85
Larrayoz, P. and others. 2000. Evaluation of Supercritical Fluid Extraction as Sample
Preparation Method for the Study of Roncal Cheese Aroma. International Dairy Journal
10 (11): 755-759.
Moio, L. and others, 2000. Odour-impact Compounds of Gorgonzola Cheese. Journal of
Dairy Research 67: 273-285.
Molimard, P. and Spinnler, H. 1996. Review: Compounds Involved in the Flavor of
Surface Mold-Ripened Cheeses: Origins and Properties. Journal of Dairy Science 79:
169-184.
Mohyuddin, G. 1993. Supercritical Fluid Extraction and Chromatographic Analysis of
Fatty Acids in Blue Cheese. Dissertation: University of Illinois Urbana-Champagne.
Mukhopadhyay, M. 2000. Natural Extracts Using Supercritical Carbon Dioxide. Boca
Raton: CRC Press. 339 p.
Oszagyan, M. and others. 1996. Supercritical Fluid Extraction of Volatile Compounds
from Lavandin and Thyme. Flavor and Fragrance Journal 11: 157-165.
Pratt, N. 1989. Preparation of a Blue Cheese Flavour. US Patent No. 4,832,964.
Qian, M. and others. 2002. Evaluation of Fat-Derived Aroma Compounds in Blue Cheese
by Dynamic Headspace GC/Olfactometry-MS. Journal of American Oil Chemists’
Society 79(7): 663-667.
Reverchon, E. 1997. Supercritical Fluid Extraction and Fractionation of Essential Oils
and Related Products. Journal of Supercritical Fluids 10: 1-37.
Reverchon, E. and Marco, I. 2006. Supercritical Fluid Extraction and Fractionation of
Natural Matter. Journal of Supercritical Fluids 38: 146-166.
Sable, S. and Cottenceau, G. 1999. Current Knowledge of Soft Cheeses Flavor and
Related Compounds. Journal of Agriculture and Food Chemistry 47: 4825-4836.
Sibeijn, M. and Wouters, J. 2009. Production of Dairy Aromas and Flavors: New
Directions. In: Dairy-Derived Ingredients. Boca Raton: CRC Press. 690 p.
Singh,B. and Rizvi, S. 1994. Design and Economic Analysis for Continuous
Countercurrent Processing of Milk Fat with Supercritical Carbon Dioxide. Journal of
Dairy Science 77: 1731-1745.

86
Shimoda, M. and others. 2000. Deodorization of Fish Sauce by Continuous-Flow
Extraction with Microbubbles of Supercritical Carbon Dioxide. Journal of Food Science
65(8): 1349-1351.
Taylor, F. 1995. Bleu cheese flavor production by submerged fermentation with on-line
monitoring by gas chromatography. Journal of Industrial Microbiology 15: 71-74.
Tuomala, T. and Kallio, H. 1996. Identification of Free Fatty Acids and Some Other
Volatile Flavour Compounds from Swiss Cheese Using On-line Supercritical Fluid
Extraction-Gas Chromatography. Z Lebensm Unters Forsch (203): 236-240.

87
CHAPTER 4: CONCLUSIONS
It was hypothesized that the use of frozen Blue cheese whey as an adjunct to the
fermentation media would increase the organoleptic quality of Blue cheese flavorings.
The addition of adjunct organisms (starter lactic acid bacteria and native microflora
organisms) was also predicted to increase the quality of Blue cheese flavorings.
Under the conditions tested, the differences between the flavorings produced
using standard and adjunct media were minimal. Sensory analysis data indicates that
panelists detected more “creamy” type aroma in the flavorings produced with Blue
cheese whey as an adjunct. “Creamy” aroma in these treatments was believed to come
from native compounds in the whey, browning products from the sterilization process,
and added precursors for creamy-type aroma compounds.
Panelists detected stronger “Blue cheese” aroma in the flavorings produced with
the standard media. However, gas chromatography data indicates higher methyl ketone
concentrations in the adjunct media samples. Thus, the detection of stronger “Blue
cheese” aroma in the standard media based flavorings was to be due to the simplicity of
the media. Aroma compounds from the Blue cheese whey likely masked some of the
“Blue cheese” character in the adjunct samples. Furthermore, the added proteins from
the cheese whey may have bound some of the aroma active compounds in flavorings
produced with adjunct media. Alternatively, the higher concentrations of free fatty acids
in the standard media samples may have acted synergistically with the methyl ketones to
create an aroma profile that was perceived as stronger in “Blue cheese” character. Media
composition did not affect the perceived “cheesy/rancid” character of the flavorings.

88
Data indicates that the adjunct media did promote the conversion of free fatty acids to
methyl ketones.
Adjunct organisms were shown to increase the perceived “creamy” character of
the Blue cheese flavorings. Lactic acid bacteria used in this study were known to
produce diacetyl, which gives a buttery note to dairy products. Adjunct organisms did
not affect perceived “cheesy/rancid” aroma, “Blue cheese” aroma, or concentration of
Blue cheese flavor compounds produced.
Blue cheese flavoring producers may benefit from increased “creamy” aroma
character for a variety of product applications including dressings, sauces, and imitation
cheeses. However, the increased “creamy” aroma may not justify the additional
production costs of adjunct media or cultures. Further studies need to examine the
costs/benefits of adding adjunct components to the media to increase methyl ketone
yields. Overall, Blue cheese flavorings produced with standard media and pure cultures
were comparable to the flavorings produced with adjuncts.
It was also postulated that near-critical and supercritical carbon dioxide could be
used to concentrate the aroma compounds of Blue cheese and Blue cheese flavorings.
Under the conditions tested, 2-heptanone and 2-nonanone were highly soluble in carbon
dioxide. These compounds were removed from both Blue cheese and Blue cheese
flavoring. Methyl ketone yields from traditional Blue cheese were low. Sensory
properties also indicated that nuanced aroma profile of Blue cheese remained intact.
Carbon dioxide extraction looks to be promising for the concentration of methyl ketones

89
from Blue cheese flavorings on an industrial scale. The low temperature/pressure
conditions tested were able to remove methyl ketones with very low co-extraction of fatty
acids and triglyercides.
Scale-up of the concentration process could involve the use of continuous carbon
dioxide extraction and the use of multiple separators for high-value by-products or
recycling of fat for substrate in the fermentation operation. The removed aqueous
fraction could also be recycled into the fermentation operation for a process with very
little waste (Figure A.4)
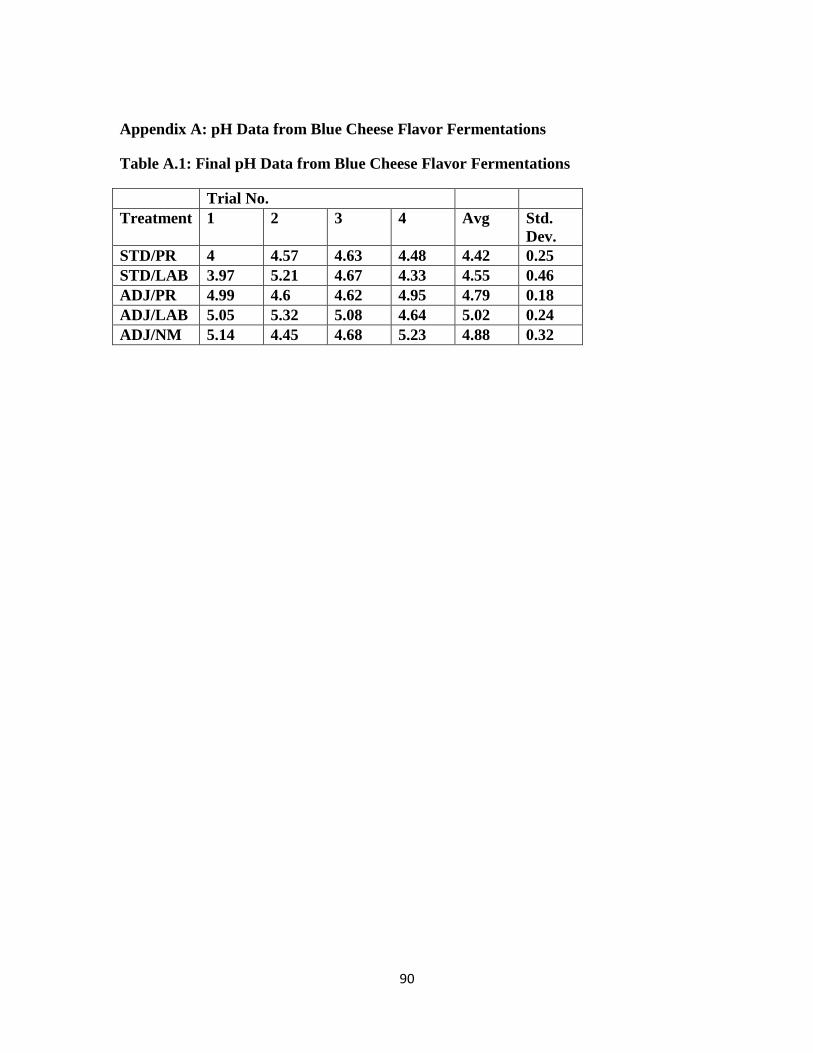
90
Appendix A: pH Data from Blue Cheese Flavor Fermentations
Table A.1: Final pH Data from Blue Cheese Flavor Fermentations
Trial No.
Treatment 1 2 3 4 Avg Std.
Dev.
STD/PR 4 4.57 4.63 4.48 4.42 0.25
STD/LAB 3.97 5.21 4.67 4.33 4.55 0.46
ADJ/PR 4.99 4.6 4.62 4.95 4.79 0.18
ADJ/LAB 5.05 5.32 5.08 4.64 5.02 0.24
ADJ/NM 5.14 4.45 4.68 5.23 4.88 0.32

91
Appendix B: Raw Sensory Data
Table A.2: Raw Aroma Intensity Scores for Sensory Analysis
Session Panelist Product
Code
Creamy Cheesy/
Rancid
Blue
Cheese
1 507 2 6.9 3 0.1
1 507 3 4 7.1 4.3
1 507 4 6 6 2
1 507 5 5.9 6 3.6
1 454 2 2.9 5 6.9
1 454 3 3 5 5
1 454 4 7.9 5.9 5
1 454 5 5 7 4.9
1 889 2 2 6 6
1 889 3 4 3.9 5
1 889 4 1 5.9 5
1 889 5 2.9 4 2.9
1 713 2 4 3.9 6
1 713 3 3 4.9 6
1 713 4 6 3 4
1 713 5 2.1 6 5
1 112 2 1.9 6 5.1
1 112 3 2.9 3.1 4
1 112 4 4 3 4
1 112 5 2 5 5
1 383 2 0.8 3.9 3.9
1 383 3 4.5 3.2 3.7
1 383 4 3 1.4 4.2
1 383 5 1.1 3.8 5.6
1 214 2 4 6 4
1 214 3 2 2.9 5.5
1 214 4 5 3 3.9
1 214 5 6 3 3
1 629 2 1 4 6
1 629 3 2 3 3
1 629 4 4 5 5
1 629 5 5 3 5
1 74 2 1 5 2.1
1 74 3 3 3.1 2

92
1 74 4 4.1 5 3
1 74 5 4 2 1
2 507 1 7.9 4 3.4
2 507 3 6 4 1
2 507 4 4 6.2 4.1
2 507 5 3 3.1 5.4
2 889 1 1.9 3.2 2.3
2 889 3 0.8 4.9 3.9
2 889 4 1.2 3.9 3.9
2 889 5 0.9 2.9 4.9
2 713 1 2 5 6
2 713 3 5 5 4.1
2 713 4 5 4 5
2 713 5 4 6 2.9
2 112 1 3 4.1 5.1
2 112 3 2 3 5
2 112 4 4 2 4.1
2 112 5 5 5.9 3.1
2 383 1 3.1 3.1 5.1
2 383 3 3 2 2
2 383 4 2 1 3.8
2 383 5 4 3.9 6
2 214 1 6 4 3.9
2 214 3 5.4 5 3.9
2 214 4 5 4.6 5
2 214 5 6 6 2.9
2 629 1 1 3 4
2 629 3 3 2 3
2 629 4 5 3 3
2 629 5 2 5 5
2 74 1 1 6 4.1
2 74 3 3.1 3.1 5
2 74 4 4.1 2 3
2 74 5 1 8 2
3 507 1 1.6 3.1 4.7
3 507 2 6.8 1.1 5.2
3 507 4 4.3 5.7 4.1
3 507 5 4.9 2.1 3.4
3 889 1 2.9 3.4 4.6

93
3 889 2 0.7 2.9 5
3 889 4 3 3.3 3.5
3 889 5 2.7 3.9 4
3 713 1 1 6 2
3 713 2 1.9 4 6
3 713 4 4 6 3
3 713 5 4 5.9 4
3 112 1 2 3 4
3 112 2 2 4 3
3 112 4 3 2.9 4
3 112 5 4 5 3
3 383 1 2.3 2.4 5.5
3 383 2 1.4 1.6 6.9
3 383 4 2.6 2.3 5.8
3 383 5 2.7 5.5 2.6
3 214 1 6 4 3
3 214 2 4 3.9 4
3 214 4 6 2 4.1
3 214 5 2.9 7 5.9
3 629 1 1 3 4
3 629 2 2.1 3 6
3 629 4 4 2 4
3 629 5 5 3 3
3 74 1 1 2 5
3 74 2 3.1 2 3
3 74 4 1 5 1
3 74 5 3 1 3
4 629 1 1 2 4
4 629 2 5 2 4
4 629 3 2 3 3
4 629 4 3 2 3
4 74 1 2 2 4
4 74 2 2 5.1 6
4 74 3 0 3 4
4 74 4 1 4 4
4 507 1 4.3 6 4.5
4 507 2 2.1 0 7.7
4 507 3 0.8 1.4 2
4 507 4 6.1 8.1 2.2

94
4 889 1 1.9 2.2 2.8
4 889 2 3.5 2.6 5
4 889 3 3 1.9 3.6
4 889 4 0.7 2 3
4 713 1 3 4 6
4 713 2 5 5 5
4 713 3 4 4 3
4 713 4 4 4 2
4 112 1 4 2 4
4 112 2 5 2 4
4 112 3 2 2.1 4
4 112 4 3 5 3.1
4 383 1 1.2 3.3 4.3
4 383 2 1.7 3.5 5.8
4 383 3 5.5 2.5 2.2
4 383 4 3.1 1.1 5.4
4 214 1 6 3 6.9
4 214 2 0 0 1
4 214 3 4.9 4.9 3.9
4 214 4 3 3 4
5 507 1 1.3 2.8 3.3
5 507 2 7.3 5.2 0.2
5 507 3 0.3 0.3 1.3
5 507 5 4.2 0.8 1.9
5 889 1 1.8 4 5.3
5 889 2 1.9 3.5 3.6
5 889 3 2.2 3.4 4.2
5 889 5 0.8 1.9 4.4
5 713 1 1.9 6 5
5 713 2 4 5 6
5 713 3 6 5 4.1
5 713 5 2 4 4
5 112 1 1.9 4 3
5 112 2 2 4 3
5 112 3 4 1 2
5 112 5 3 2 2
5 383 1 0.8 0.9 5.5
5 383 2 2.6 4.5 5.5
5 383 3 1.1 3.1 6.3

95
5 383 5 1.2 2.9 3.8
5 214 1 3 2 2
5 214 2 3 2 3.1
5 214 3 4 4.9 6
5 214 5 6 5 3.9
5 629 1 3 1.9 4
5 629 2 5 3 5
5 629 3 3.1 4 4
5 629 5 3 4 4
5 74 1 1.1 7.1 4
5 74 2 4.9 2 1
5 74 3 2.1 3 4
5 74 5 2 8 5
Product code 1: STD/PR, 2: STD/LAB, 3: ADJ/PR, 4: ADJ/LAB, 5: ADJ/NM;
Aroma intensity ranged from 0 to 9.

96
Appendix C: Raw GC/MS SPME Data
Table A.3: Methyl Ketone Peak Areas
Rep Code 2- Heptanone 2-Octanone 2-Nonanone 2-Undecanone
8-Nonen-2-one
1 1 79233773 2072528 44409971 2639444 15972924
1 2 56810572 1446563 35754515 3038510 12001320
1 3 68668442 3092404 60758664 5877168 20967433
1 4 69713381 2888734 65298121 5545412 20773561
1 5 55083983 1306375 35531921 2510723 11201098
2 1 46833695 1424733 43334259 3793863 13232905
2 2 57175051 1535611 42598307 3291532 13820860
2 3 69766423 2201916 58633838 4449348 19592261
2 4 55239359 2370675 61733311 5608665 17791844
2 5 33614385 762507 20337985 1490421 6802973
3 1 52966573 1940215 45945710 3789520 15495199
3 2 51109418 1735574 44778029 3371638 14122979
3 3 50287056 1808445 51201725 4798100 16807994
3 4 62364610 2523104 58571694 5148158 19151836
3 5 55514754 1606376 45860191 3456154 14314780
4 1 46399827 1529180 43520978 3624147 13964537
4 2 58538589 1876234 54008158 4910671 17790834
4 3 67543108 2166380 59395797 4642712 20095891
4 4 57836143 2472457 61744283 5605040 18269004
4 5 55035792 1968467 61630950 6075207 18137098
Product code 1: STD/PR, 2: STD/LAB, 3: ADJ/PR, 4: ADJ/LAB, 5: ADJ/NM; Peak areas in arbitrary units

97
Table A.4: Free Fatty Acid Peak Areas
Vial
(Rep)
Product
Code
Hexanoic
Acid
Octanoic
Acid
Decanoic
Acid
Dodecanoi
c Acid
1 1 15446072 6130056 4460926 362368
1 2 12599945 6539680 4934662 381256
1 3 6643475 2260992 2776860 219818
1 4 5798740 1830109 3040219 257927
1 5 17214163 9511155 5327339 314859
2 1 8302393 3921530 5384939 549323
2 2 11943313 5691541 4877453 373732
2 3 6634945 48350 3156784 215780
2 4 3516123 2095104 2004915 149805
2 5 16053669 7470079 3512979 198089
3 1 7239641 2991647 2786571 185479
3 2 6337408 1974141 2094571 132721
3 3 7819994 2792454 2828762 173148
3 4 5357017 1816867 2242822 145784
3 5 7197682 2390534 2208535 147326
4 1 7234897 2552010 2683870 115301
4 2 7707153 2402891 2747051 165146
4 3 7051209 2378301 2337922 148874
4 4 3327805 1012134 1450067 96949
4 5 5045987 1216695 1484403 89221
Product code 1: STD/PR, 2: STD/LAB, 3: ADJ/PR, 4: ADJ/LAB, 5: ADJ/NM; Peak areas in arbitrary units
98
Appendix D: Preliminary SFE Results
Preliminary testing using SFE for the concentration of dairy aroma compounds
was conducted using Cheddar EMC (enzyme modified cheese), butter, brown butter base,
hard Italian cheese (Cheese B), smear-ripened cheese (Cheese C), and high intensity milk
fat (HMF) as raw materials. Five gram samples of Cheddar EMC were extracted at
pressures ranging from 100 to 300 Bar and temperatures ranging from 40 to 55 degrees
Celsius. Extracted compounds were collected 50 ml collection tubes using 25 ml of
canola oil as a capture solvent. Extractions lasted approximately 4 hours with a flow rate
of around 300 cc/min. Extracts were profiled by flavorists at Edlong Dairy Flavors.
Sensory analysis indicated similarity of extracts based on pressure with small differences
based on temperature. Most notable differences based on temperature were observed at
300 Bar. Overall, aroma characteristics of the extracts were similar (with the exception
of the 300 Bar 55 degrees Celsius extract). Extracts at 100 Bar were reported as stronger.
Some solid particulate (presumably milk fat) was observed in extracts at 200 and 300
Bar.
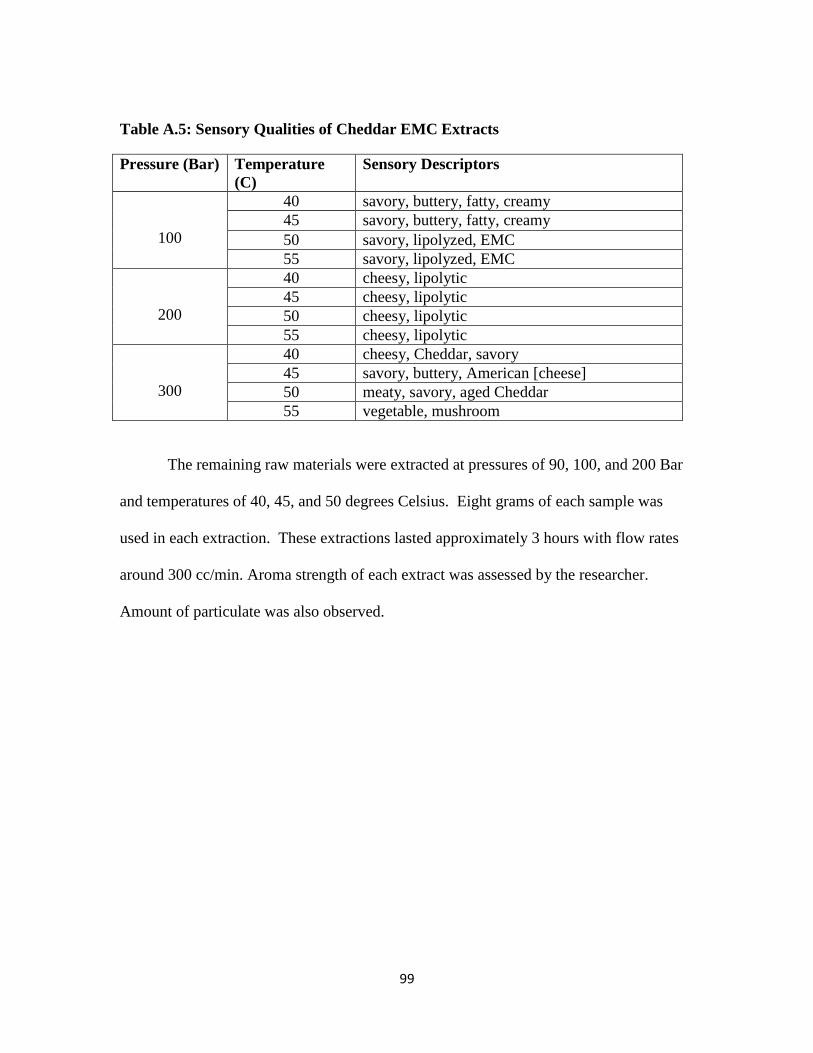
99
Table A.5: Sensory Qualities of Cheddar EMC Extracts
Pressure (Bar) Temperature
(C)
Sensory Descriptors
100
40 savory, buttery, fatty, creamy
45 savory, buttery, fatty, creamy
50 savory, lipolyzed, EMC
55 savory, lipolyzed, EMC
200
40 cheesy, lipolytic
45 cheesy, lipolytic
50 cheesy, lipolytic
55 cheesy, lipolytic
300
40 cheesy, Cheddar, savory
45 savory, buttery, American [cheese]
50 meaty, savory, aged Cheddar
55 vegetable, mushroom
The remaining raw materials were extracted at pressures of 90, 100, and 200 Bar
and temperatures of 40, 45, and 50 degrees Celsius. Eight grams of each sample was
used in each extraction. These extractions lasted approximately 3 hours with flow rates
around 300 cc/min. Aroma strength of each extract was assessed by the researcher.
Amount of particulate was also observed.
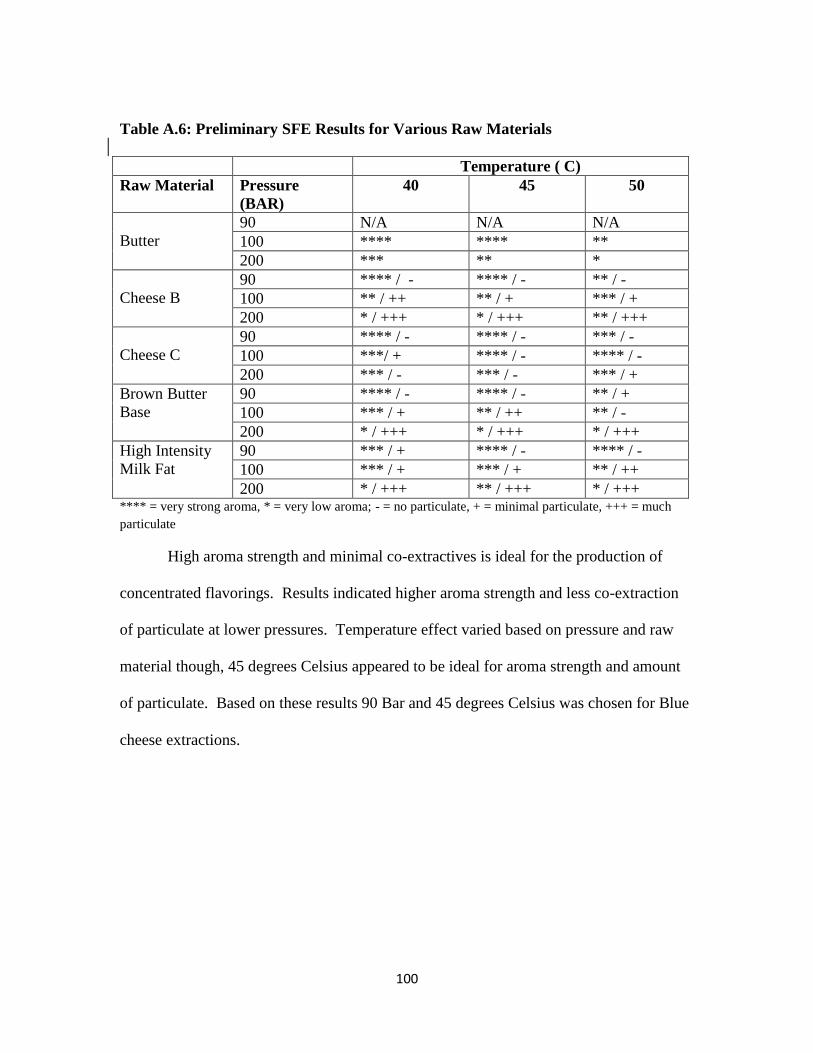
100
Table A.6: Preliminary SFE Results for Various Raw Materials
Temperature ( C)
Raw Material Pressure
(BAR)
40 45 50
Butter
90 N/A N/A N/A
100 **** **** **
200 *** ** *
Cheese B
90 **** / - **** / - ** / -
100 ** / ++ ** / + *** / +
200 * / +++ * / +++ ** / +++
Cheese C
90 **** / - **** / - *** / -
100 ***/ + **** / - **** / -
200 *** / - *** / - *** / +
Brown Butter
Base
90 **** / - **** / - ** / +
100 *** / + ** / ++ ** / -
200 * / +++ * / +++ * / +++
High Intensity
Milk Fat
90 *** / + **** / - **** / -
100 *** / + *** / + ** / ++
200 * / +++ ** / +++ * / +++ **** = very strong aroma, * = very low aroma; - = no particulate, + = minimal particulate, +++ = much
particulate
High aroma strength and minimal co-extractives is ideal for the production of
concentrated flavorings. Results indicated higher aroma strength and less co-extraction
of particulate at lower pressures. Temperature effect varied based on pressure and raw
material though, 45 degrees Celsius appeared to be ideal for aroma strength and amount
of particulate. Based on these results 90 Bar and 45 degrees Celsius was chosen for Blue
cheese extractions.

101
Appendix E: SFE Raw Data
Table A.7: GC/MS Peak Areas 2-Heptanone and 2-Nonanone
Vial Extract Sample
Time
(min)
Total
Flow
(cc)
Product Conditions 2-
Heptanone
2-
Nonanone
1 1 30 10000 1 1 2538508 300751
2 1 60 20000 1 1 7353183 2822734
3 1 120 37000 1 1 3662172 5717386
4 1 180 52000 1 1 994627 1472132
5 2 30 9000 1 1 1397381 942854
6 2 60 18000 1 1 3249578 551525
7 2 120 35000 1 1 5313105 2462652
8 2 180 52000 1 1 2504469 953618
9 3 30 10000 1 1 3800065 807895
10 3 60 18000 1 1 2445413 399858
11 3 120 35000 1 1 3669772 869202
12 3 180 54000 1 1 1537787 1651320
13 4 30 10000 1 2 1703046 124031
14 4 60 18000 1 2 3591679 1335939
15 4 120 35000 1 2 2781311 2694592
16 4 180 50000 1 2 897473 388514
17 5 30 9000 1 2 4039494 426781
18 5 60 18000 1 2 2846480 1423326
19 5 120 35000 1 2 3657802 1635190
20 5 180 52000 1 2 887525 368023
21 6 30 10000 1 2 4436939 669784
22 6 60 18500 1 2 2349747 366625
23 6 120 32000 1 2 3590737 1304021
24 6 180 47500 1 2 1898032 236751
25 7 30 11000 2 1 123948100 45427413
26 7 60 19000 2 1 93342387 39047082
27 7 120 36000 2 1 97585353 46094820
28 7 180 53500 2 1 74844933 41710056
29 8 30 8500 2 1 94537439 29509310
30 8 60 18000 2 1 75421440 25237144
31 8 120 34000 2 1 75740329 32329301
32 8 180 52000 2 1 74399919 31541114
33 9 30 8000 2 1 87081525 22876221
34 9 60 17500 2 1 83602102 31574674
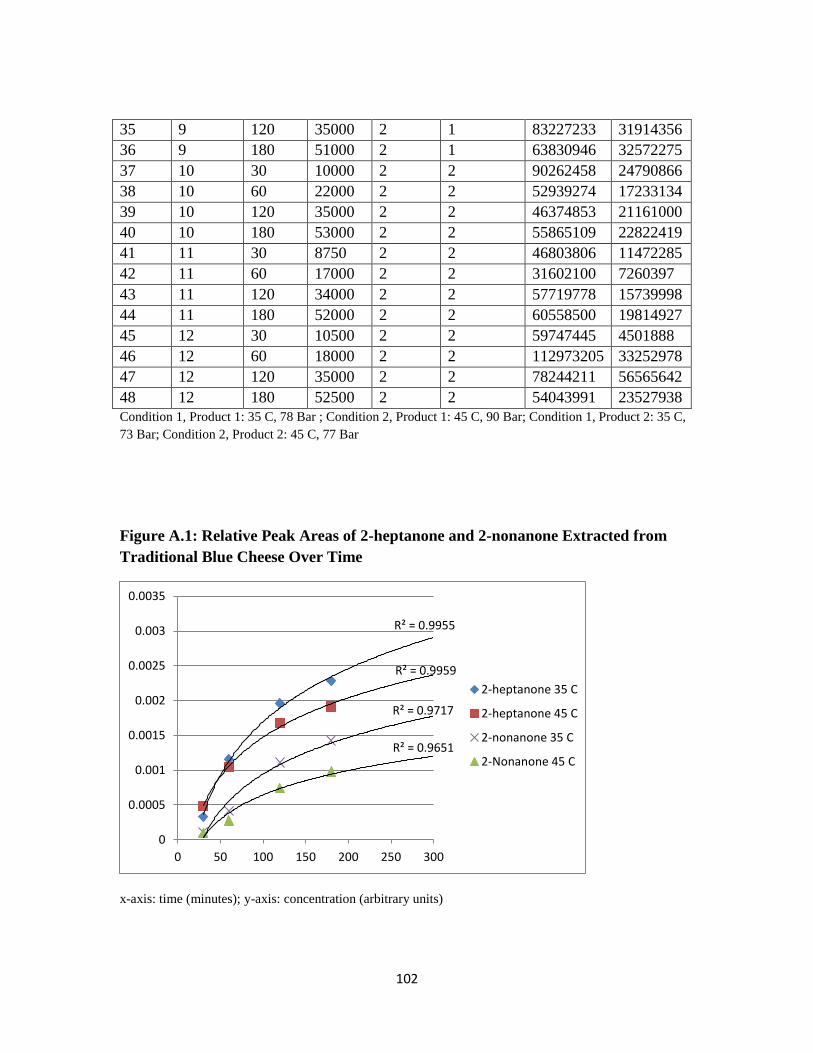
102
35 9 120 35000 2 1 83227233 31914356
36 9 180 51000 2 1 63830946 32572275
37 10 30 10000 2 2 90262458 24790866
38 10 60 22000 2 2 52939274 17233134
39 10 120 35000 2 2 46374853 21161000
40 10 180 53000 2 2 55865109 22822419
41 11 30 8750 2 2 46803806 11472285
42 11 60 17000 2 2 31602100 7260397
43 11 120 34000 2 2 57719778 15739998
44 11 180 52000 2 2 60558500 19814927
45 12 30 10500 2 2 59747445 4501888
46 12 60 18000 2 2 112973205 33252978
47 12 120 35000 2 2 78244211 56565642
48 12 180 52500 2 2 54043991 23527938
Condition 1, Product 1: 35 C, 78 Bar ; Condition 2, Product 1: 45 C, 90 Bar; Condition 1, Product 2: 35 C,
73 Bar; Condition 2, Product 2: 45 C, 77 Bar
Figure A.1: Relative Peak Areas of 2-heptanone and 2-nonanone Extracted from
Traditional Blue Cheese Over Time
x-axis: time (minutes); y-axis: concentration (arbitrary units)
R² = 0.9955
R² = 0.9959
R² = 0.9717
R² = 0.9651
0
0.0005
0.001
0.0015
0.002
0.0025
0.003
0.0035
0 50 100 150 200 250 300
2-heptanone 35 C
2-heptanone 45 C
2-nonanone 35 C
2-Nonanone 45 C
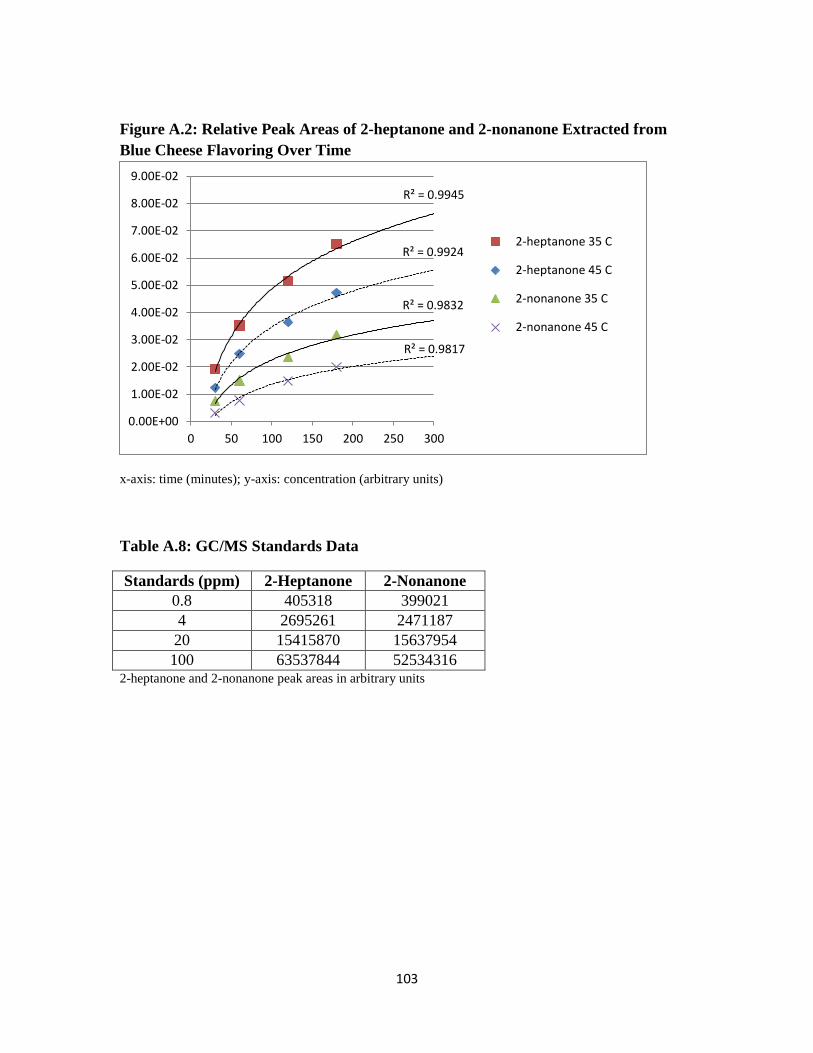
103
Figure A.2: Relative Peak Areas of 2-heptanone and 2-nonanone Extracted from
Blue Cheese Flavoring Over Time
x-axis: time (minutes); y-axis: concentration (arbitrary units)
Table A.8: GC/MS Standards Data
Standards (ppm) 2-Heptanone 2-Nonanone
0.8 405318 399021
4 2695261 2471187
20 15415870 15637954
100 63537844 52534316 2-heptanone and 2-nonanone peak areas in arbitrary units
R² = 0.9945
R² = 0.9924
R² = 0.9832
R² = 0.9817
0.00E+00
1.00E-02
2.00E-02
3.00E-02
4.00E-02
5.00E-02
6.00E-02
7.00E-02
8.00E-02
9.00E-02
0 50 100 150 200 250 300
2-heptanone 35 C
2-heptanone 45 C
2-nonanone 35 C
2-nonanone 45 C

104
Figure A.3: GC/MS Calibration Curve
A(H): 2-heptanone calibration curve ; A(N): 2-nonanone calibration curve (x-axis – ppm; y-axis – arbitrary
units)
Table A.9: Calculated 2-heptanone and 2-nonanone Concentrations (mg extracted
per kg of raw material)
Vial Extract Sample
Time
(min)
Total
Flow
(cc)
Product Conditions 2-
Heptanone
(mg/kg)
2-
Nonanone
(mg/kg)
1 1 30 10000 1 1 0.323 0.023
2 1 60 20000 1 1 1.723 0.681
3 1 120 37000 1 1 2.420 2.013
4 1 180 52000 1 1 2.609 2.356
5 2 30 9000 1 1 0.106 0.173
6 2 60 18000 1 1 0.725 0.302
7 2 120 35000 1 1 1.736 0.875
8 2 180 52000 1 1 2.212 1.097
9 3 30 10000 1 1 0.563 0.142
10 3 60 18000 1 1 1.029 0.235
11 3 120 35000 1 1 1.727 0.437
12 3 180 54000 1 1 2.020 0.822
13 4 30 10000 1 2 0.164 -0.018
14 4 60 18000 1 2 0.848 0.294
A(H) = 630567x + 839881 R² = 0.998
A(N) = 515090x + 2E+06 R² = 0.9896
0
10000000
20000000
30000000
40000000
50000000
60000000
70000000
0 50 100 150
Heptanone Standards
Nonanone Standards
Linear (HeptanoneStandards)
Linear (NonanoneStandards)

105
15 4 120 35000 1 2 1.377 0.921
16 4 180 50000 1 2 1.548 1.012
17 5 30 9000 1 2 0.609 0.053
18 5 60 18000 1 2 1.151 0.384
19 5 120 35000 1 2 1.847 0.765
20 5 180 52000 1 2 2.016 0.851
21 6 30 10000 1 2 0.685 0.109
22 6 60 18500 1 2 1.132 0.195
23 6 120 32000 1 2 1.815 0.499
24 6 180 47500 1 2 2.176 0.554
25 7 30 11000 2 1 23.428 10.537
26 7 60 19000 2 1 41.192 19.633
27 7 120 36000 2 1 59.763 30.372
28 7 180 53500 2 1 74.006 40.089
29 8 30 8500 2 1 17.831 6.828
30 8 60 18000 2 1 32.184 12.708
31 8 120 34000 2 1 46.598 20.239
32 8 180 52000 2 1 60.757 27.587
33 9 30 8000 2 1 16.412 5.283
34 9 60 17500 2 1 32.322 12.639
35 9 120 35000 2 1 48.161 20.074
36 9 180 51000 2 1 60.308 27.662
37 10 30 10000 2 2 17.018 5.729
38 10 60 22000 2 2 27.092 9.744
39 10 120 35000 2 2 35.918 14.674
40 10 180 53000 2 2 46.549 19.990
41 11 30 8750 2 2 8.747 2.626
42 11 60 17000 2 2 14.761 4.318
43 11 120 34000 2 2 25.746 7.984
44 11 180 52000 2 2 37.270 12.601
45 12 30 10500 2 2 11.210 1.002
46 12 60 18000 2 2 32.710 8.749
47 12 120 35000 2 2 47.600 21.927
48 12 180 52500 2 2 57.885 27.408 Condition 1, Product 1: 35 C, 78 Bar ; Condition 2, Product 1: 45 C, 90 Bar; Condition 1, Product 2: 35 C,
73 Bar; Condition 2, Product 2: 45 C, 77 Bar

106
Appendix F: Informed Consent Form for Participation in the Sensory Study
Information about a Research Study at
Clemson University
Aroma Analysis of Blue Cheese Flavorings
Description of the Study
This study is being conducted to determine sensory properties of Blue cheese flavorings. You
will use your training from FD SC 304 – Evaluation of Dairy Products to evaluate the aroma of
each Blue cheese flavoring sample presented to you. Samples will be evaluated on four criteria:
Blue, Cheesy, Creamy, and Overall. Scores will be given on a nine point hedonic scale.
This study is being conducted under the direction of Dr. Johnny McGregor
([email protected]) and Jason Raines ([email protected]) as part of a research grant
from Edlong Dairy Flavors (Chicago, IL).
You will take part in 5 sessions (Feb. 13, Feb. 15, Feb. 20, Feb. 22, and Feb. 27) during class time.
Four samples will be presented individually during each session with at least one minute rest
period between each sample. Each session will take approximately 10 minutes.
Risks and Discomforts
We do not know of any risks or discomforts to you in this research study.

107
Possible Benefits
Taking part in this study will enhance your ability to evaluate the aroma of cheese and other
fermented dairy products. Your participation in this study will help us identify any differences in
the Blue cheese flavorings.
Incentives
Taking part in this study will satisfy part of your course requirements for FD SC 304. If you chose
not to take part in this study, please see Dr. McGregor for an alternative assignment.
Protection of Privacy and Confidentiality
We will do everything we can to protect your privacy and confidentiality. We will not tell
anybody outside of the research team that you were in this study or what information we
collected about you in particular.
We might be required to share the information we collect from you with the Clemson University
Office of Research Compliance, the federal Office for Human Research Protections, and/or
Edlong Dairy Flavors. If this happens, the information would only be used to find out if we ran
this study properly and protected your rights in the study.
Choosing to Be in the Study
You do not have to be in this study. You may choose not to take part and you may choose to
stop taking part at any time. You will not be punished in any way if you decide not to be in the

108
study or to stop taking part in the study. If you decide not to take part or to stop taking part in
this study, it will not affect your grade in any way.
If you choose to stop taking part in this study, the information you have already provided will be
kept in a confidential manner.
Contact Information
If you have any questions or concerns about this study or if any problems arise, please contact
Dr. Johnny McGregor at Clemson University at 864-650-0817. If you have any questions or
concerns about your rights in this research study, please contact the Clemson University Office
of Research Compliance (ORC) at 864-656-6460 or [email protected]. If you are outside of the
Upstate South Carolina area, please use the ORC’s toll-free number, 866-297-3071.
Consent
I have read this form and have been allowed to ask any questions I might have. I agree to take
part in this study.
Participant’s signature: ________________________________ Date:______________
A copy of this form will be given to you.
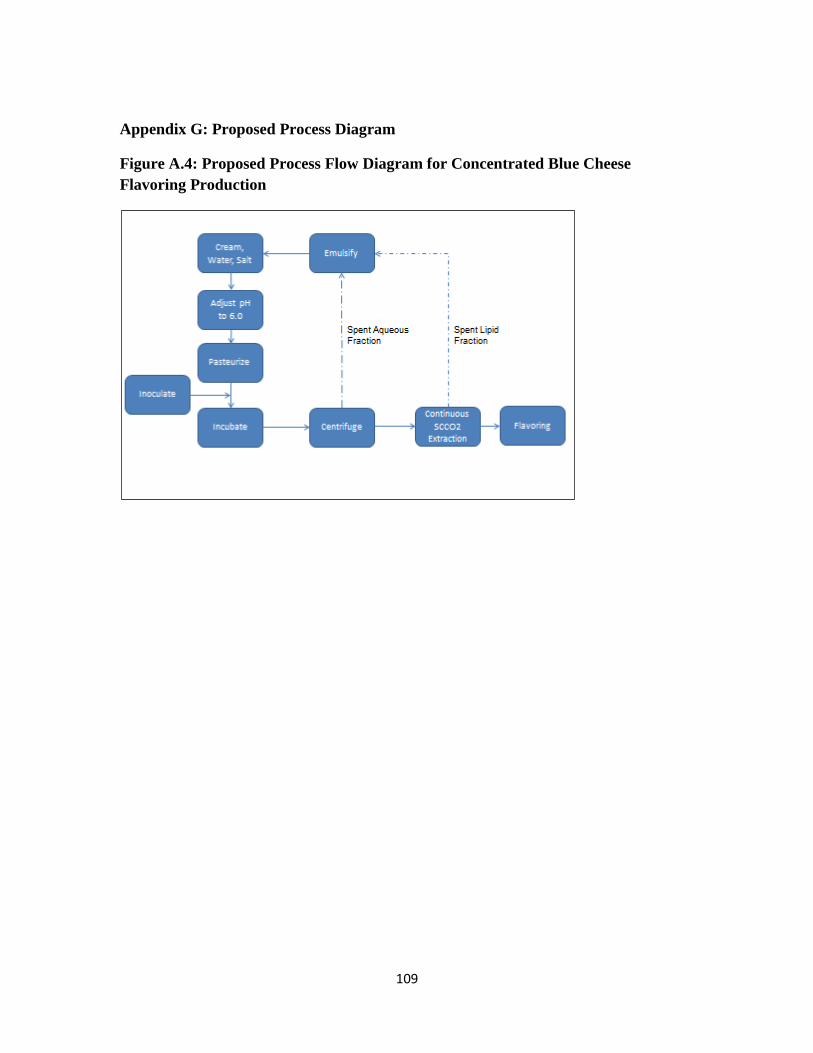
109
Appendix G: Proposed Process Diagram
Figure A.4: Proposed Process Flow Diagram for Concentrated Blue Cheese
Flavoring Production