factors affecting the effectiveness of donor funded projects adhiambo p… · factors affecting the...
TRANSCRIPT
UNIVERSITY OF NAIROBI
Department of Sociology and Social Work
FACTORS AFFECTING THE EFFECTIVENESS OF DONOR FUNDED
PROJECTS IN PROMOTING DEVELOPMENT IN KIBERA
BY
LILLIAN ADHIAMBO
C50/P/7492/03
A research project in partial fulfilment for the award of degree of M.A. Sociology, Department of Sociology and Social Work, College of Humanities and Social Sciences
University of Nairobi
October 2012

i
DECLARATION
I hereby declare that this submission is my own work and that to the best of my knowledge
and belief, it contains no material previously published or written by another person nor
material which to substantial extent has been accepted for the award of any other degree or
diploma of the University or any other institute of higher learning, except where due
acknowledgement has been made in the text.
___________________________________ Lillian Adhiambo B.Ed.(hons) UoN
This project has been submitted with my approval as University supervisor
Signed__________________________________ Prof. E.K. Mburugu Department of Sociology and Social Work
College of Humanities and Social Sciences Department of Sociology and Social Work University of Nairobi 2012
ii
ACKNOWLEDGEMENTS
The following individuals are acknowledged for their special contribution throughout the
study:
My supervisor Professor E.K. Mburugu for his patient guidance, constructive
recommendations and readiness to give feedback on this project.
My family members Bernard, Sarah, Cedric and Vanessa they were a great source of support and encouragement, I thank them all and wish them all the best in their lives. Last but not least to the Lord God Almighty for the gift of all I have and have not that has contributed to this project. Sincere gratitude to you all!

iii
DEDICATION
To my late Parents for their contribution to who I am in life: Henry Ogutu and Edwina Aoko rest in peace.

iv
ABSTRACT
The study explored the donor funded projects in Kibera. The donor funded projects aim to
promote development by strengthening organizations at the community level. The research
questions addressed the characteristics of development projects. The connection between
development and four key concepts suggested by the literature; community empowerment,
accountability, technology and monitoring and evaluation and the impact of the projects on
poverty. In the study the data was collected and triangulated by means of structured
interviews, key informant interview and document reviews. From the 150 questionnaires
distributed in the 8 dominant villages a total of 119 were collected and used in the analysis.
The study concludes that there is need for more involvement of the donor recipients in
project planning and implementation in order for the projects to meet their objective of
promoting development.

v
TABLE OF CONTENTS
DECLARATION ............................................................................................................... i ACKNOWLEDGEMENTS ............................................................................................. ii ABSTRACT ..................................................................................................................... iv TABLE OF CONTENTS ................................................................................................. v LIST OF TABLES ......................................................................................................... vii CHAPTER ONE ............................................................................................................... 1 1.0 INTRODUCTION ................................................................................................. 1
1.1 Background of the study ......................................................................................... 1 1.2 Statement of the Problem ........................................................................................ 3 1.3 Research Questions ................................................................................................. 4 1.4 Objective of the study ............................................................................................. 5
1.4.1 General objective ........................................................................................... 5 1.4.2 Specific objectives ......................................................................................... 5
1.5 Importance of the study........................................................................................... 5 1.6 Scope of the study ................................................................................................... 6
CHAPTER TWO.............................................................................................................. 7 2.0 LITERATURE REVIEW ...................................................................................... 7
2.1 Introduction ............................................................................................................ 7 2.2 Theoretical Framework ........................................................................................... 7
2.2.1 The Paris Declaration on aid effectiveness ..................................................... 7 2.2.2 The European Code of Conduct.................................................................... 10
2.3 Effectiveness of Development Interventions ......................................................... 12 2.4 Factors affecting donor funded projects................................................................. 13
2.4.1 Empowerment of Primary Stakeholders ....................................................... 13 2.4.2 Accountability of Development Intervention ................................................ 16 2.4.3 Technology .................................................................................................. 17 2.4.4 Monitoring and evaluation ........................................................................... 18 2.4.5 Theory of Culture of Poverty ........................................................................ 20
2.5 The Conceptual Framework .................................................................................. 24 CHAPTER THREE ....................................................................................................... 25 3.0 RESEARCH METHODOLOGY ........................................................................ 25
3.1 Site description ..................................................................................................... 25 3.2 Research Design ................................................................................................... 25 3.3 Target Population ................................................................................................. 25 3.4 Sample Size and Sampling Procedures .................................................................. 26 3.5 Data Collection ..................................................................................................... 27 3.6 Data Analysis Techniques ..................................................................................... 28
CHAPTER FOUR .......................................................................................................... 29 4.0 DATA ANALYSIS, RESULTS AND DISCUSSION .......................................... 29
4.1 Introduction .......................................................................................................... 29 4.2 Social and Demographic Characteristics ............................................................... 29 4.3 Influence of Donor Funding in Empowerment of the Residents ............................. 33 4.4 Influence of Donor Funding in Improving Technology Among Residents ............. 37
vi
4.5 Influence of Monitoring and Evaluation on Effectiveness of Donor Funded Projects in Promoting Development ................................................................................... 39
4.6 Influence of Accountability on Effectiveness of Projects ....................................... 43 CHAPTER FIVE ............................................................................................................ 47 5.0 SUMMARY, CONCLUSIONS AND RECOMMENDATIONS ........................ 47
5.1 Summary of findings ............................................................................................ 47 5.2 Conclusions .......................................................................................................... 48 5.3 Recommendations................................................................................................. 49 5.4 Suggestions for further research ............................................................................ 50
REFERENCES ............................................................................................................... 51 Appendix 1: Research Questionnaire for Residents ....................................................... 57 Appendix 2: Interview Guide for Project Management Team ........................................ 60

vii
LIST OF TABLES
Contents Table 1: Sampling........................................................................................................ 27 Table 3: Age distribution ............................................................................................ 30 Table 4: Distribution by level of education ................................................................ 31 Table 5: Distribution by lenght of residence .............................................................. 32 Table 6: Length of association with projects .............................................................. 34 Table 7: Response on whether residents are involved in running the projects ......... 35 Table 8: Response on type of technology used ........................................................... 37 Table 9: Response on whether technology used was appropriate ............................. 39 Table 10: Who supervises the projects ....................................................................... 40 Table 11: Number of times supervision is done.......................................................... 41 Table 12: When is supervision carried out ................................................................. 42 Table 13: Who are involved in supervision ................................................................ 43 Table 14: Whether Project Managers are Answerable .............................................. 44 Table 15: Success of Projects in Realizing their Purposes ......................................... 45 Table 16: Reasons for Failure of Projects .................................................................. 46
1
CHAPTER ONE
1.0 INTRODUCTION
1.1 Background of the study In response to the challenges posed by the Millennium Development Goals, the key
stakeholders in international development set out a new agenda to improve the
effectiveness of aid. This agenda, embodied in the Paris Declaration on Aid
Effectiveness, articulates a series of commitments reflected by the following tenets:
ownership, alignment, harmonization, managing for results, and mutual accountability.
The World Bank's private arm, the International Finance Corporation, found that only
half of its Africa projects succeed (Associated Press, 2007). Many other donors have not
done much better. Some of these projects are as follows. The World Bank initiated a $4.2
billion project dubbed Chad-Cameroon oil pipeline to the Atlantic Ocean in Chad. The
pipeline was the biggest development project in Africa when it was completed in 2003. It
was funded on condition that the money be spent with international supervision to
develop Chad. However, President Idris Deby's government announced in 2005 that oil
money would go toward the general budget and the purchase of weapons, or else oil
companies would be expelled.
In Lesotho, the World Bank, European Investment Bank and African Development Bank
initiated a project dubbed Lesotho Highlands water project at a cost of $3.5 billion. The
project to divert fresh water from the mountains for sale to South Africa and for
electricity began in 1986. But the electricity proved too expensive for most people, and
the diversion of so much water caused environmental and economic havoc downstream.
The development fund raised from selling the water was shut down in 2003. The courts
convicted three of the world's largest construction firms on corruption charges and the
project's chief executive was jailed. Tens of thousands of people whose lives were ruined
by the diversion are still waiting for compensation.
In Mali the goal in 1932 was to irrigate 2.47 million acres to grow cotton and rice and
develop hydropower in the Mali desert. A project dubbed Office du Niger was funded by

2
France at a cost of more than $300 million over 50 years. More than 30,000 people were
forced to move to the desert to work on the largest aid project attempted by French
colonial authorities. The African workers largely ignored French attempts to change
traditional agricultural practices. By 1982, only 6 percent of the region was developed
and the infrastructure was falling apart. The World Bank took over the project in 1985
and has shown limited success with rice farming.
A project called Roll Back Malaria across Africa was funded by multiple agencies at a
cost of about $500 million. Roll Back Malaria, established in 1998, aimed to halve
malaria incidence by 2010. The program said Africa needed $1.9 billion a year to slow
the disease, but by 2002 donors had only come up with $200 million a year. By 2004 the
infection rate had risen 12 percent. Experts say donors rarely followed through with
pledges and some programs were subject to political considerations, such as what kinds
of insecticides to use, whether to buy cheap generic drugs or how much poor people
should pay for mosquito nets.
The Lake Turkana fish processing plant was initiated by the Norwegian Government at a
cost of $22 million in Kenya. The project was designed in 1971 to provide jobs to the
Turkana people through fishing and fish processing for export. However, the Turkana are
nomads with no history of fishing or eating fish. The plant was completed and operated
for a few days, but was quickly shut down. The cost to operate the freezers and the
demand for clean water in the desert were too high. It remains a "white elephant" in
Kenya's arid northwest.
Politically, Kibera is a volatile area because of its history. Residents here are Nubian
squatters who were settled on this land after the World War II by the British Colonial
government. On the other hand there are the "illegal" local squatters who have been
squatting on the land as a means of survival. The official Kenya government position is
that the land belongs to the government. Till recently, the land tenure policy regarding
"illegal" settlements was that the government could not develop or invest on such land.
The government has therefore not developed any infrastructure according to its policy on
investment which states that this can only be done on legally owned land. This scenario
pits the tenants of Kibera against landlords who do not put up proper water and sanitation

3
facilities in the area to match the rental housing units. Urban interventions that address
the issues of slums have been triggered only by external factors such as land development
and speculation, health and safety threats to the wealth owned by external landlords, etc.
This has therefore been mainly reactive rather than proactive to emerging problems in the
area. Regardless of the case, there is an absence or failure of coordinating mechanisms
that set the roles and jurisdiction in the area effectively. Compounded by lack of a clear
policy framework, there are no effective government programs for meeting the needs of
the residents of Kibera informal settlement. Poor water supply and sanitation are among
the most serious infrastructure problem. Notable interventions have only been received
from other agencies i.e donors, development partners, NGOs. However these efforts are
still to a large extent uncoordinated.
Kibera residents consist of different ethnic communities as alluded to earlier on. Most of
them have come to the city to look for sustainable livelihoods. In the event of social
conflicts in the area, ethnic reactions tend to flare up especially between the original
Nubian community on one hand and other local ethnic groups. Kenya’s water resources
crisis carries significant social risks. Growing demand over limited endowment of water
generates competition and causes conflicts over water use within the village, posing
considerable social risks to the poor and the communities without adequate representation
in the location in decision making. In terms of family pattern, households consist of either
single persons with an average family size of 7. Most households are female-headed
households as the village is a big source of day domestic workers who work in the middle
and high class estates around Nairobi.
1.2 Statement of the Problem
Hough (2004) demonstrates common problems with donor funded projects in South
Africa which is pretty much the case with the problems seen in other parts of Africa. He
offers proposals on how to make such projects effective using a model called ‘simplify,
standardize, replicate and monitor’. The problems with such projects are varied and

4
include erroneous use of technology, monitoring and evaluation, empowerment of
primary stakeholders, and accountability issues.
There have been several projects funded by donors such as the World Bank to help
alleviate poverty in Kenya. Most of these projects have been designed for various
communities living in Kenya. Kibera has been the centre of focus for many donor funded
projects. The question that this study seeks to answer is why the projects are not effective
in achieving their objectives. What are the factors that hinder the effectiveness of these
projects in promoting development in Kibera?
This study will examine some of the projects in Kibera with a focus on their aims and
objectives; evaluate and assess the objectives against the intended achievements and
establish why there has been no visible/tangible positive effect in improving the
livelihood of the people.
1.3 Research Questions The study answered the following research questions:
i) Are donor funded projects effective in promoting development in Kibera?
ii) What are the most important factors that influence the donor funded projects in promoting development in Kibera? iii) How are the beneficiaries involved in the projects and at what stage?
iv) Have the projects empowered the beneficiaries if so how?
v) How has technology influenced these projects?
vi) Who is accountable for these projects?
vii) How is monitoring and evaluation carried out in these projects?
5
1.4 Objective of the study
1.4.1 General objective
The study sought to establish the factors that affect the effectiveness of donor funded
projects in promoting development in Kibera.
1.4.2 Specific objectives
The specific objectives of this study were:
a) To ascertain the existence of donor funded projects in Kibera.
b) To determine the level of awareness of the Kibera community about these
projects.
c) To establish the relationship between the stakeholders.
d) To establish the effect of the donor funded projects among the residents of Kibera.
e) To identify specific actions required to make the projects effective.
1.5 Importance of the study This study is important to the Government agencies that deal with donor funded projects
in Kenya. The findings reveal the factors that impede the effectiveness of donor funded
projects in Kenya and especially in Kibera and offers insights into what needs to be done
to make the funding effective.
The research is also important to the donors as it points out the factors that may have
influence on the various projects they carry out in the country and will enable them plan
effectively before initiating projects.
The beneficiaries of various donor funded projects will also find the results of this study
useful as it points out the important role stakeholders play in establishing effective donor
funded projects in Kenya.

6
1.6 Scope of the study The study covers donor funded projects in Kibera. These will be selected given that there
have been many projects channelled in this area yet the benefits are not tangible. The
concept scope is the factors that affect the effectiveness of donor funded projects in
promoting development.

7
CHAPTER TWO
2.0 LITERATURE REVIEW
2.1 Introduction Aid effectiveness is a growing concern for the donor community. In the recent past,
development practitioners have been focusing on efficient aid delivery to education. The
shift from project mode to Sector Wide Approaches, Structural Adjustment measures to
Poverty Reduction Strategy Papers1, Programmes-based Approaches, Direct Budget
Support, Medium-Term Expenditure Frameworks reflect this concern for reducing the
fragmentation of development systems and change the way aid is delivered by shifting
the balance of power.
More recently, randomized evaluation techniques have been used to evaluate the impact
of educational programmes in developing countries and therefore improve development
effectiveness. The Monterrey Conference on financing for development (2002), the Rome
Declaration on Harmonization (2003), the Paris Declaration on Aid effectiveness (2005)
and the High-Level Forum on Aid Effectiveness in Ghana (2008) that was to review
progress in implementing the Paris Declaration are examples of moves towards
addressing this concern. The European Union adopted a Code of Conduct on the
Complementarity and Division of Labour in development policy at its Council in May
2007. In addition, the international community’s recent commitment to double aid flows
in order to finance the Millennium Development Goals has raised new questions
regarding actions to reform aid and combat world poverty.
2.2 Theoretical Framework
This first section reviews recent key policy reforms and new trends for Aid flows.
2.2.1 The Paris Declaration on aid effectiveness
Recent debates surrounding aid effectiveness have turned crucial as they address issues
related to country ownership. New policy documents have initiated the efforts to break
the donor-driven agenda and its excessive fragmentation of aid by relying on recipient or

8
“partners” countries’ development strategies, institutions and procedures. Developing
countries’ needs and priorities are now at the centre of development policies: Aid is
viewed (at least in theory) more as a partnership than as donor-owned. According to
OECD: “The Paris Declaration is all about changing behaviour” (OECD 2006, 54) At a
more practical level, the World Bank and the International Monetary Fund, introduced
the Sector-Wide Assistance Programs (SWAPs) and Poverty Reduction Strategy Papers
(PRSPs) to improve country ownership in the development process.
The Paris Declaration is a political as well as technical tool to strengthen country
ownership of development efforts. Aid effectiveness is clearly linked to a better
allocation and delivery of aid on the part of the donors and an improvement in
management of the funds received from part of the recipients. To improve development
impact and aid effectiveness, hundreds of donors and developing countries signed the
Paris declaration in 2005. It was designed by the “Aid Effectiveness” working group of
the OECD’s Development Assistance Committee (DAC). The Declaration is often
presented in a pyramid form as seen below (Figure1).
Figure 1: Aid Effectiveness Pyramid
9
For the first time donors and developing countries made a commitment to measure their
success – or failure – in making aid more effective by setting targets for the year 2010.
The Paris Declaration is an action-oriented roadmap. Based on key principles, this
bottom-up approach begins with recipients’ needs and aims to improve the quality and its
impact on development:
• Ownership (effective leadership from developing countries)
• Mutual alignment
• Harmonization of donors (planning, funding and implementing development programs),
managing for results
• Mutual accountability (improvement of transparency both from donors and recipients,
ownership).
This document marks a shift in policy theory, advancing towards the empowerment of
host countries. It is the first document that addresses the issue of the fragmentation of aid.
On the basis of these objectives, the Development Assistance Committee implemented
the Paris Declaration through a strategy which includes:
a) A calibration survey made in 2006,
b) Two surveys in 2008 and 2010, on monitoring the,
implementation of the Paris Declaration
c) A forum which took place in Accra in September 2008 to
evaluate and discuss progress.
In 2006, the OECD-DAC Development Cooperation Report 2005 entitled Aid
Effectiveness highlighted three good reasons why the Paris Declaration will make a
difference and takes an in-depth look at these three reasons and argues that the
Declaration is less a wish list than an action tool kit for increasing aid effectiveness to
meet MDGs. The report advances three good reasons for the Declaration to be
implemented:
i) it goes beyond previous agreement,
ii) it uses twelve indicators to measure progress in achieving
results
iii) it creates stronger mechanisms for accountability.

10
The 2006 OCDE survey for Paris declaration review of progress of implementing the
Paris Declaration provides a summary of conclusions and key policy recommendations to
achieve the Paris declaration commitments. The survey finds that most donors and
development agencies have tried to implement the declaration, but still more coordination
and harmonization between donors and partners is needed. Two years after signing the
declaration, major challenges remain:
i) deepen ownership, to promote partners’ national budgets
ii) strengthen and use country systems
iii) reduce transaction costs of delivering and managing aid
iv) make better use of performance assessment frameworks
v) define a mutual action agenda (OECD 2006, p.56).
Furthermore, the survey finds that partner countries would like donor practices to change
by coordinating between headquarters policies with in-country practices, changing the
donor driven development agenda and reducing conditionality.
2.2.2 The European Code of Conduct
As a follow-up and complement to the Paris Declaration, the European Code of Conduct
on the complementarity and division of labour in the development policy (2007)
constitutes a flexible tool for European member donors, their policy and actions. Based
on the five pillars of the Paris Declaration, the European Code of Conduct promotes a
reallocation of aid to:
(i) “fragile” and “forgotten” states,
(ii) that is based on needs and priorities of countries.
It formulates the progressive idea that partner countries should choose their donors and
not the opposite. It is, like the Paris Declaration, partner-centred and promotes
collaboration for common actions.
Even if the goals are not met, the Paris Declaration emphasizes the necessity to de-
compartmentalize aid and to understand the development concept as a whole rather than
in separate projects.

11
A first step towards that direction was made by Sen when he defined the
multidimensional aspects of poverty. The concept of poverty, as it is now accepted by the
international community has greatly evolved over the past ten years. No longer solely by
economic metrics, Amartya Sen’s human development approach now focuses on the
philosophical, social and political aspects of poverty. The Human Development Report
(2001) defines poverty as a multidimensional phenomenon comprising different factors
that are interactive and mutually reinforced as follows:
i. the lack of economic opportunities,
ii. limited capacities linked to weak levels of education and linked to
health related problems,
iii. absence of participation in the decision process,
insecurity or exposure to risks (vulnerability) affecting physical
integrities of persons and their economic and social well-being.
It is crucial to understand the multidimensional and complex aspect of poverty in
order to implement social policies that will simultaneously combat its causes. As the
World Development Report states: “the criteria for distinguishing the poor from the
non-poor tend to reflect specific national priorities and normative concepts of welfare
and rights” (1990, p.27). If we accept the human development approach to poverty, it
is preferable to attack poverty simultaneously with multi-sector projects rather than
with separate projects as defined by the structure of the Millennium Development
Goals. Though the MDGs represent a unique international consensus, their
effectiveness remain to be seen as the international community addresses each
separately and in a non integrative manner.
The European Code of Conduct and the Paris Declaration draw a new line in aid motives,
the focus should no longer be economic or diplomatic but turn towards human
development and poverty reduction. Both declarations are based on common principles
and values that imply moral obligations and duties towards developing countries. These
policy documents might change the way donor and recipient countries do business
together; development should be more equitable and more inclusive. Aid is considered
effective only if it achieves development results (OECD 2006, p.54). For the first time,

12
donors did not try to impose their policy visions in the development process, but instead
included the active participation of the host countries. Effective aid requires now a
partnership of shared responsibilities and obligations. The balance of responsibility and
obligation between aid recipients and aid donors also needs attention.
2.3 Effectiveness of Development Interventions NPA (2002) defines effectiveness as the extent to which an intervention is
successful in achieving its objectives. The proponents of participatory theory are in
agreement that one of the most important contributions of primary stakeholder’s
participation is the effectiveness of development efforts. Karl (2002) is of the view that
development interventions will achieve their objectives if the people who are most
affected are involved. The World Bank maintains that participation is an effective
mechanism for poverty reduction capable of achieving immediate and lasting results at
the grassroots level (Dongier et al., 2002b).
There are several ways in which participation makes projects more effective. As Karl
(2000) asserts, participation assures better targeting of benefits to the poor, increases the
impact and ensures that the development gains are equitably distributed. The role of
participation in ensuring better targeting of the poor is also shared by Chambers (1994)
and Oakley (1991).
Another important contribution of participation in project effectiveness is that it ensures
that the development activities are based upon indigenous knowledge and are more
relevant to locals (Karl, 2000). Local people understand their problems better and can
therefore use their skills and resources to find flexible solutions that are tailored to suit
their unique needs. This is why Oakley et al (1998) is of the idea that in order for the
development efforts to have sustainable changes in the poor people’s lives, they must
take into account local values.

13
Participation of primary stakeholders in project monitoring can also help to detect
problems before they escalate into major sources of conflict and wastefulness (Rudqvist
and Woodford-Berger, 1996). As Karl (2000) puts it, local people’s judgments of what
constitutes success give a more realistic view about what works and what does not work.
Oakley (1991) observed that more effective interventions will be achieved when people
have a voice in determining their objectives, to support their implementation, to evaluate
their outcomes, and to make indigenous knowledge available. Effectiveness equals the
successful completion of objectives. Participation can help ensure this (ibid).
As far as studies on effectiveness of donor funded projects in Kenya is concerned, there
appears from the above review that nothing has been done up to date on the issue. Given
the large donor funding in various projects in Kenya, this gap in literature provides a need
for a study on the same.
2.4 Factors affecting donor funded projects
2.4.1 Empowerment of Primary Stakeholders
Empowerment is a complex term that is not easily defined and has different
interpretations, just like participation. Empowerment focuses on the notions of power
(Oakley and Clayton, 2000) and capacity-building (Narayan, 1995). Power is one of the
most contested and controversial concepts of social and political theory (Barnes, 1993).
Numerous conceptualizations of power have been advanced in the literature, but little
agreement has been reached among academics as to what power is, how it can be
identified and studied, where it is, and how it operates. It thus comes as no surprise that
the notion of empowerment has multiple and contested meanings.
As Cornwall (2000) points out, empowerment is a highly malleable idea and the language
of empowerment has been adopted by people across the political spectrum to mean very
different things. This diversity of meanings is reflected in the literature reviewed on the
empowering effects of participatory development interventions. Generally however, no
explicit definition of empowerment is provided in the studies reviewed. This renders the
identification of different empowering dimensions of participation difficult.

14
The World Bank (2008) defines empowerment as the process of enhancing the capacity
of individuals or groups to make choices and to transform those choices into desired
actions and outcomes. Central to this process are actions which both build individual and
collective assets, and improve the efficiency and fairness of the organizational and
institutional context which govern the use of these assets. Empowered people have
freedom of choice and action. This in turn enables them to better influence the course of
their lives and the decisions which affect them (ibid.).
Perceptions of being empowered vary across time, culture and domains of a person's life:
in India, a low caste woman currently feels empowered when she is given a fair hearing
in a public meeting, which comprise men and women from different social and economic
groups; in Brazil, in Porto Allegre, citizens – both men and women -- feel empowered if
they are able to engage in decisions on budget allocations; in Ethiopia, citizens and civil
society groups report feeling empowered by consultations undertaken during the
preparation of the poverty reduction support program; in the USA, immigrant workers
feel empowered through unionization which has allowed them to negotiate working
conditions with employers; and in the UK, a battered woman feels empowered when she
is freed from the threat of violence and becomes able to make decisions about her own
life (The World Bank, 2008(b)).
In essence empowerment speaks to self determined change. It implies bringing together
the supply and demand sides of development – changing the environment within which
poor people live and helping them build and capitalize on their own attributes.
Empowerment is a cross-cutting issue. From education and health care to governance and
economic policy, activities which seek to empower poor people are expected to increase
development opportunities, enhance development outcomes and improve people's quality
of life (The World Bank, 2008(b)).
One of the grounds of participation is that it fosters empowerment and social capital
formation – both regarded as a means to poverty reduction. Moreover, some recent Bank

15
documents (Narayan, 2000, World Bank 2008 (a)) argue that empowerment is not only a
means to poverty reduction, but also an end in itself as it provides for expansion of
freedom of choice and action to shape one’s life. Powerlessness has been identified by
the poor as one of the multiple dimensions of poverty (Narayan, 2000). Hence,
empowering the poor can be regarded in itself as a reduction in poverty.
Various mechanisms through which participation empowers the primary stakeholders of
development intervention can be drawn from participatory theory. Oakley (1991)
contends that participation empowers the primary stakeholders by helping break the
mentality of dependence, promoting self-awareness and confidence, by leading the poor
to examine their problems and to think positively about solutions. Participation also
empowers the primary stakeholders by helping the poor to acquire new skills and abilities
which could enable them to better defend and promote their livelihoods (Oakley et al.,
1997). Participation helps in building up the capacity of people to generate and influence
development at various levels, increasing their access to and influence over resources and
institutions (Karl, 2000). Karl (2000) also asserts that participation helps in building
social capital, promoting networks and facilitating better management of risks by
households through reciprocal self-help, sharing information and strengthening local
institutions. The World Bank (2001) further avers that participation of primary
stakeholders strengthen the poor’s voice.
Chambers (1983) points out that poverty often refers to powerlessness and exclusion
from social participation, resulting in discrimination; empowerment is seen as very
crucial to poverty reduction. This is because empowerment allows people to have access
to productive resources which enables them to increase their earning and obtain goods
and services that they need, and to participate in the decisions that affect them.
As the foregoing review reveals, empowerment as a factor that influences the
effectiveness of donor funded projects in Kenya has not been tackled by researchers. This
present a knowledge gap on what influence empowerment of primary stakeholders may
pose on the effectiveness of such projects thus a need to study the same in Kenya.

16
2.4.2 Accountability of Development Intervention
The notion of accountability has a range of connotations. It can refer to ‘giving an
account’ to another party who has a stake in what has been done, or ‘being held to
account’, that is being held responsible by others (Cornwall et al., 2000). NPA (2008)
defines accountability as responsibility, reliability, confidence and transparency in the
context of development cooperation; associated specifically with financial issues, but
includes all relevant matters of development concern and cooperation between partners
(NPA, 2008). A distinction can be made between political, administrative and social
accountability (Narayan, 2002). While political accountability takes place through
elections, administrative accountability is ensured through internal accountability
mechanisms both within and between agencies (ibid.). Social accountability, which is by
definition of vertical mechanism, holds agencies and elected officials accountable to
citizens (Reuben, 2003). This study shall use the definition of accountability in the
context of development intervention where it is related to information, reliability,
confidence and transparency.
Participatory methods can be used to guarantee the inclusion of all the stakeholders, the
establishment of agreements between them, and the provision of appropriate information
at each level and for different purposes. Information is a key ingredient for accountability
because it is only when people know what resources are available, how they are being
channelled, and how decisions are being made, that they can hold project’s staff to
account (Sen, 1997). Cornwall et al., (2000) says that when primary stakeholders can
hold other stakeholders accountable, power shifts to them. Thus, the objective of
improving accountability and empowerment are strongly related to each other.
Stein (1998) avers that people’s participation provides an opportunity to establish new
habits of control, reporting and joint responsibility in development interventions. The
people’s participation also helps for an improved understanding of the role of the several
stakeholders involved and the limitation of technical and financial resources that exists to
address the problems of the poor (ibid.).

17
Accountability issues on donor funded projects in Kenya have also not received the
necessary attention they deserve as the foregoing review on the same can reveal. Thus,
this is another knowledge gap that the present study seeks to bridge.
2.4.3 Technology
Technology in this context refers to the making, modification, usage and knowledge of
tools, techniques, crafts, system methods of organization in order to solve a problem,
improve a pre-existing solution to a problem, achieve a goal or perform a specific
function( www.en.wikipedia.org). It can also refer to the collection of such tools,
machinery modifications and arrangements of procedures. Various implementation of
technology influence the values of a society and new technology often raises new ethical
questions. Examples include the rise of the notion of efficiency in terms of human
productivity, a term originally applied only to machines and the challenge of traditional
norms (ibid).
Innovation climates in developing countries are problematic characterized by poor
business and governance conditions, low educational levels and mediocre infrastructure.
This raises particular challenges for promotion of technology. Still technology may be
sound in purely technical terms but still fail because it does not take account of special
issues, for example the different roles of men and women in production, or the attitudes
towards communal production systems.
This argument applies also to local inputs. A technology which requires a saturation level
of extension agents will be restricted to a short period of time, or a limited area. A
technology which is the development or improvement of an existing practice will be
accepted more readily than something which is completely new
In Kenya mobile phones have become an integral part of money transfer schemes
enabling poor people in urban areas to transact business regardless of social class. Most
residents of Kibera have mobile phones though voice calls are used more than data
services. Money transferring services by the mobile phone was readily accepted by
residents of Kibera for transacting business because most of them did not use banks
(which are not available in Kibera).

18
It has already been stressed that technology can only be successfully implemented if it is
suitable for the particular conditions, and this requires that it must be tested before being
built into a project.
The World Bank 1986 review showed that the use of untested packages of technology
led to poor results in 61 percent of projects, whereas tested packages had an 80 percent
success rate. This is confirmed by several other reports, thus Cassen (1986): "Where
projects have run into trouble, it is often because they have attempted to persuade
beneficiaries to abandon existing practices in favour of new ones without sufficient
testing of the new ones".
As has been noted, donor funding may have a positive impact on technology application
in projects. This has not received attention from scholars and therefore presents a
knowledge gap that the present study seeks to unravel.
2.4.4 Monitoring and evaluation
There is a clear consensus that good monitoring throughout the project is essential, and
also that it is frequently inadequate. It has been shown that blueprint projects which are
finalized at preparation are less likely to be successful than flexible projects which can
adjust to experience gained as the project develops. This implies that there must be a
regular and reliable programme of measuring, recording and reporting the progress. This
in turn means that there must be close contact with the beneficiaries, and also defined
indicators of performance.
Evaluation studies show that it is very common for insufficient attention to be given at
project preparation to working out plans for monitoring, and the lack of a clearly laid out
plan encourages project staff to give it low priority. It is the impression that field staff
think of all returns and reports as being unwelcome chores that interrupt the real work.
The present position is that it has become customary to pay lip service to the importance
of monitoring, but there is room for making it happen more effectively. The information

19
to be gathered and reported will vary from project to project. Questions which every
project should be regularly asking are: is progress satisfactory? If not what are the
difficulties which need to be addressed? What new ideas are emerging? And, which ideas
may suggest changes to the project? If new technology is being introduced, the
beneficiary reaction and uptake needs to be closely monitored in case the technology
needs modification or can be improved.
The consensus is that evaluation, like monitoring, is important because it allows lessons
to be learned, leading to improvement in future projects. But like monitoring, it is not
done with sufficient rigour. For example, "many projects cannot precisely pinpoint who
has benefitted and by how much or in what way. This does not indicate the projects are
unsuccessful, but that existing methods of appraisal and evaluation are too limited. There
is a need for more thinking on how to appraise projects for institutional development,
sustainability, and environmental impact (Butcher 1988).
Few agencies feel that they have the resources to evaluate every project, and so
evaluation, particularly ex-post evaluation, tends to be biased towards projects with
problems. Also, small agencies particularly are reluctant to use the time of project staff
on evaluation when they could be getting on with the next project. The larger agencies
which have separate evaluation units face the difficulty that the independence of these
units makes them less able to influence the operational departments.
There are several different approaches to evaluation reporting. To some extent the
termination report by project staff can be considered as an evaluation, but it is often
biased by the frustrations and difficulties, and tends to be more a catalogue of problems
than a balanced account of performance. An ex-post evaluation either by an evaluation
unit or by sub-contractors tends to be more open-minded, but the very fact that it is done
after the event means that it is dependent upon records and reports, which are likely to be
unwritten, incomplete, unavailable, or less comprehensive than the evaluation team
would wish. The other source of information for ex-post evaluation teams is personal
recollection which is notoriously inaccurate.

20
Informal ex-post evaluations are also frequently done as part of a study of a group of
projects. This present study is one example and use has been made of many others.
Evaluations of this type are particularly useful in identifying trends, and frequently-
occurring good and bad factors, but being less detailed they are less effective at
evaluating individual projects.
The last type of evaluation is that which is carried out some years after the completion of
the project. The World Bank is the only agency identified as having made a formal study
of projects ten to fifteen years after their completion. The observations from that study
were found to be very instructive and perhaps this type of evaluation should be carried
out more frequently. Most development workers are familiar with cases where past
projects can only be located by the project buildings, now serving some other purpose, or
by the piles of rusting machinery - which leads to the question of continuity and
sustainability.
As the foregoing discussion notes, monitoring and evaluation is core to any project’s
effectiveness. Given that there is a lack of literature on Kibera as far as the influence of
monitoring and evaluation on the effectiveness of donor funded projects is concerned, the
present study seeks to bridge the knowledge gap by focusing on the same.
2.4.5 Theory of Culture of Poverty
Different theorists believe that the way poverty is approached, defined, and perceived,
plays a role in its perpetuation. The first theory of poverty, which emerged in sociology,
was the Darwinian theory of poverty. This theory tries to explain poverty in terms of the
behaviour and attitudes of the poor people. The poor are poor because they were lazy, did
not work hard, squandered money in gambling, drinking and unnecessary luxuries and
they had disorder of family life. They have no ambition, no inner calling for work, are
fatalistic and suffer from an intractable in educability” as the Brock Committee phrased it
(Matza, 1966:294). Psychologically this ‘behaviour’ of the poor could also be attributed
to their frustration, because of experiencing poverty situation, which they could not deal
with in a normal manner.

21
Oscar Lewis from his experience in Mexico also developed the theory of culture of
poverty (Oscar L. 1959). According to Lewis, the culture of poverty is a syndrome that
thrives in certain situations. It requires an economic setting of cash economy, a high rate
of unemployment and under employment, low wages and people with low skills. Without
voluntary or government support and stale families, the low income population tends to
develop the culture of poverty against the dominant ideology of accumulation of the
middle class. They somehow realize that they have a marginal position with a highly
stratified and individualistic society, which does not offer them any prospect for upward
mobility. For them to survive, they have to develop their own institution because the
other society tends to use and underpay them or simply ignore them. As a result the poor
embody a common set of values, norms and certain trends of behaviour which is different
from the normal culture. They develop a specific subculture. This is the situation in the
Kenyan slums where slum dwellers have developed ways of adapting to lifestyles that
differ from people in the upper class estates. They have further modified the standard
language of communication into a language Kenyans call sheng’ which has so far
broadened to the middle class areas.
Lewis found certain traits that underlay this subculture and classified them as follows:
i) Relationship between the subculture and the larger society (though in most parts
of the developing world the poor form the larger society): they tend to maintain a
distance, thus, developing a mistrust of the dominant institutions in the society,
like shying away from hospitals, banks and leisure facilities of the city.
ii) Nature of the slum community: the slum community is characterized by lack of
proper infrastructure, like housing, sanitation making it overcrowded and disease
infested.
iii) Nature of family: unstable marriages and single parenthood making it difficult for
appropriate nurturing of children. Morality is questionable because of the housing
conditions; children are exposed to sex at an early age.
iv) Attitudes, values and personality of the individual: the individual has a strong
feeling of fatalism, helplessness, inferiority, weak ego and so on

22
Once the culture is formed it tends to be rooted in the society and is transmitted from one
generation to another through socialization. Lewis writes: “Once the culture of poverty
has come into existence it tends to perpetuate itself. By the time slum children are six or
seven they have usually absorbed the basic attitudes and values of their subculture.
Thereafter, they are psychologically unready to take full advantage of changing
conditions or improving opportunities that may help develop in their lifetime”, Ryan,
1976:120).
Lewis saw this culture as an extreme form of adaptation that the poor are forced into
under certain circumstances and are unable to get out of. They adapt this culture as a way
of accepting their ‘situation’ and acknowledging the fact that they are doomed to remain
so and rarely make attempts to improve because they believe that somebody else is
responsible for their fate. This theory suggests that poverty is created by the transmission
over generations of a set of beliefs, values, and skills that are socially generated but
individually held. Individuals are not to blame because they are victims of their
dysfunctional subculture.
Situational theory of poverty holds that the poor behave like they do because they do not
have the resources and opportunities for adopting the middle class life style. Young
people from these backgrounds lack opportunities to further their education. They get
into early, marriages and because of lack of education, get large families that they are
unable to sustain. It gives prominence to the structural conditions that cause poverty,
focusing on the individual responses to the objective situation of poverty. It holds that
individuals rationally follow a way of behavior, which is suitable for the objective
situation of their life. They believe that they cannot achieve the middle class values so
they resist. Typically, politically conservative theoreticians blame individuals in poverty
for creating their own problems, and argue that with hard work and better choices, the
poor could avoid poverty situations. Other variations of the situational theory of poverty
ascribe poverty to lack of genetic qualities such as intelligence that are not easily
reversed. The belief that poverty stems from individual deficiencies is old. Religious
doctrine that equated wealth with the favour of God was central to the Protestant

23
reformation (Weber 2001). The blind, crippled, or deformed people were believed to be
punished by God for either their, or their parent’s sins.
Structural theories of poverty hold that poverty is caused by the structure of the larger
socio-economic order. It is the macro structure of the society that produces inequality and
consequently poverty. The gap between the rich and the poor gives rise to inequality and
poverty. The individual is not the source of poverty but the economic, political, and
social systems, which cause people to have limited opportunities and resources with
which to achieve income and well being. Karl Marx showed how the economic systems
of capitalism created the “reserve army of the unemployed” as a conscientious strategy to
keep wages low. Later Durkheim showed that even the most personal actions (suicide)
were in fact mediated by social systems.
Much of the literature on poverty now suggests that the economic system is structured in
such a way that poor people fall behind regardless of their competency. Minimum wages
do not allow single parents or their families to be economically self-sufficient (Jencks
1996:72). In the developing countries even married couples are not able to maintain their
families with the minimum wage or some skilled jobs depending on the sector one is
employed in. Likewise, the residents of Kibera cannot afford to support their families
because their wages are far below what they need to meet the bills for housing, food,
health, and education. In the public sector in Kenya salaries are increased by a percentage
across the board meaning that the highly paid get a larger increment and the lowly paid
get smaller increment thus widening the gap between the rich and the poor. This sort of
poverty relates to the structural theory of poverty where poverty is caused by the structure
of the larger socio-economic order this renders inequality.
Poverty has been defined as the inability of individuals to afford basic necessities
(Poverty Reduction Strategy Paper 2001-2004). Inequality is seen in relation to
differences in income which is evident in one’s inability to access primary needs such as
food water education and health care. Poverty which hinders education has a spill over
effect on one’s income and propagates inequalities in accessing opportunities for
24
individuals. Inequality has two effects on poverty levels; it slows economic growth and it
makes a given rate of economic growth less effective in reducing poverty, while equity
and economic growth are mutually reinforcing, inequality is socially destabilizing, bad
for growth, and of its nature restricts the capabilities of marginalized groups. Conversely,
equitable access to markets, political power, and social provision, on the basis of needs, is
the fastest and most effective route to poverty reduction’ ( Watt 2000 ). The donor funded
projects are therefore only likely to promote development under equitable conditions.
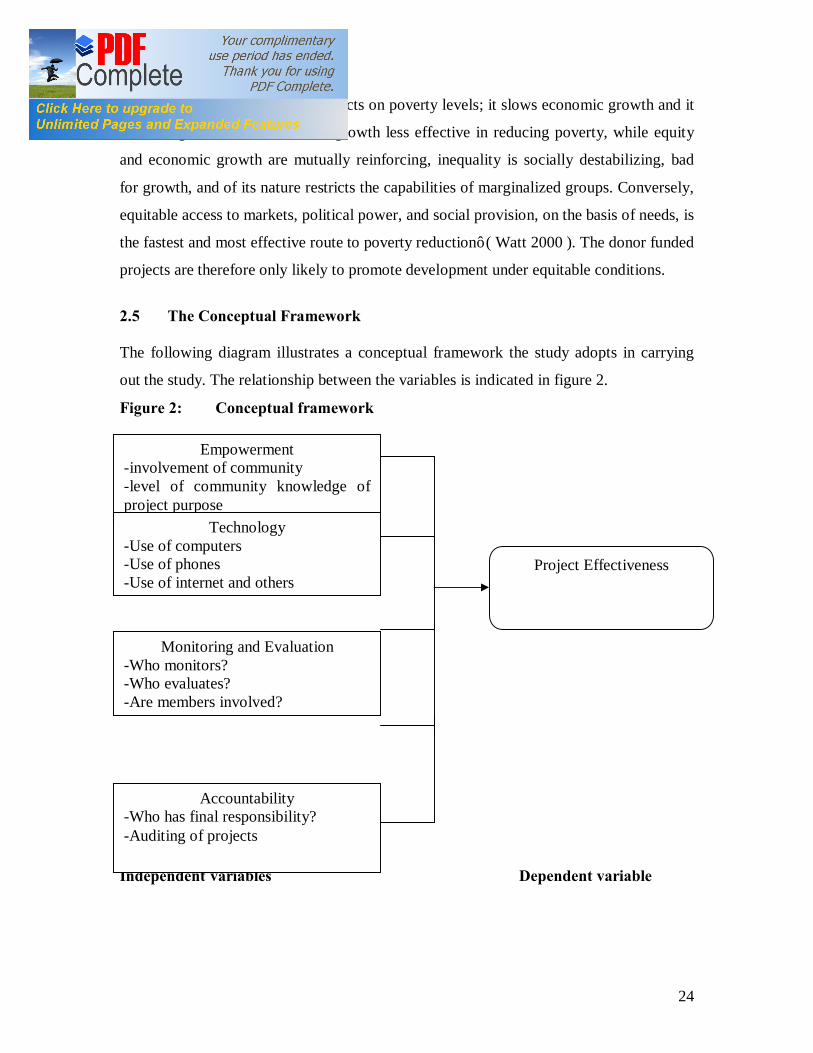
2.5 The Conceptual Framework The following diagram illustrates a conceptual framework the study adopts in carrying
out the study. The relationship between the variables is indicated in figure 2.
Figure 2: Conceptual framework
Independent variables Dependent variable
Empowerment -involvement of community -level of community knowledge of project purpose
Technology -Use of computers -Use of phones -Use of internet and others
Monitoring and Evaluation -Who monitors? -Who evaluates? -Are members involved?
Accountability -Who has final responsibility? -Auditing of projects
Project Effectiveness

25
CHAPTER THREE
3.0 RESEARCH METHODOLOGY
3.1 Site description Kibera is situated in Nairobi's South-Western Peri-urban zone approximately seven
kilometres from the Nairobi City Centre. Kibera is the largest informal settlement in
Kenya, officially divided into 8 villages, namely: Lindi, Kisumu Ndogo, Soweto, Laini
Saba, Silanga, Makina, Kianda and Mashimoni, covering approximately 250 hectares of
land (UNHCR, 2003). The 2009 Kenya Population and Housing Census reports Kibera's
population as 170,078 (2009 Kenya Population and Housing Census Vol 1A Population
Distributed by Adminstrative Units KNBS: 2010). That gives an average population
density of 681 people per hectare although some villages are more crowded than others.
The villages are densely populated with 95 percent of the residents living below poverty
line. Most of them are employed in the informal sector including street vending, domestic
work, drug dealing and prostitution, while others work in the industrial area of the city as
casual labourers with an average income of Kshs 300/= per day. An average family of
seven occupy a small room of 10 by 10 feet. Slums like Kibera are characterized by
inadequate access to sanitation, water, health facilities and other infrastructure, poor
quality of housing and lack of services like garbage collection.
3.2 Research Design
This study adopted a survey research design. Surveys are suitable in gathering data whose
intention is to describe the nature of the existing condition. It attempts to describe
characteristics of subjects, opinions, attitudes, preferences and perceptions of persons of
interest to the researcher (Borg 1989 and Orodho 2005). In this study the researcher
sought to establish the factors that affected effectiveness of donor funded projects in
promoting development in Kibera.
3.3 Target Population The target population was the residents of Kibera. These were the residents in dominant
villages in the area. The targeted residents were males and females aged 21-45 years and

26
were heads of households, who must have lived in the village for a period of not less than
3 years. In terms of the exact population size, the villages have the following populations:
Lindi, the largest, with 35,158 people; Kianda (29,356); Laini Saba (28,182); Makina
(25,242); Gatwikira (24.991); Siranga (17,363); and Kibera (9,786).
The analysis of factors affecting the effectiveness of donor funded projects in promoting
development in Kibera was the individuals who lived in Kibera. The individuals were
targeted because they were supposed to be the beneficiaries of the donor funded projects.
These individuals were the heads of various households in the area. A household
comprises of either one person living alone or a group of people who may not be related,
living or staying together in the same house with common house- keeping who either
share one meal a day or share common living accommodation:( Roger Thomas 1999).
The head of the household in this study was the husband if a household contained a
family of husband wife and children. Where a couple was cohabiting, the head of the
house hold was the male partner and in cases where the households were not related, the
head of the household was the one in whose name the house was under. The unit of
observation on the other hand was the households whose heads were the ones taking part
in the survey.
3.4 Sample Size and Sampling Procedures
From all the villages mentioned, a sample size of 150 respondents was selected for the
study as shown in Table 2. Stratified sampling technique was applied. The respondents
were stratified based on the villages in the area. Then, a sample was selected from each of
the stratum as shown in the table based on the composition of each village. The number
in each village was based on proportionate population distribution. Stratified Random
sampling was used because the research was being done in eight different villages which
had to be stratified by population size before selecting the final subjects proportionately.
Simple random sampling was used to select the sample by numbering the houses up to
500 though the total number of houses exceeded 500. The random numbers of tables
were used to select the 150 households used in the survey until the objective target
number was arrived at in the villages surveyed as in Table 1.

27
Table 1: Sampling
Dominant village Population Sample Percentage of total
Lindi 35,158 31 20.7
Kianda 29,356 26 17.3
Laini Saba 28,182 25 16.6
Makina 25,242 22 14.8
Gatwikira 24,991 22 14.7
Siranga 17,363 15 10.2
Kibera 9,786 9 5.8
Total 170,078 150 100
(2009 Kenya Population and Housing Census Vol. 1A Population Distributed by
Administrative Units KNBS: 2010).
3.5 Data Collection
Primary data was sought in the study. The study used interviews to gather information.
These interviews were done using a structured questionnaire and an interview guide
attached as appendix 1 and 2. This therefore entailed collection of both qualitative and
quantitative data. The qualitative data (non-numerical data) was collected using the
questionnaire. This data was collected from the open ended questions where the
responses were recorded verbatim. The quantitative data was collected using the closed
questions where the responses were scored on a numerical scale. These instruments were
developed to contain the items that helped in achieving the objectives of the study.
The first set of interviews was done with the residents in the villages. The second set of
interviews was with the heads of the project management teams. These were the heads of
the projects intended to promote development among residents of Kibera. One
interviewer was used for the study to gather data from the project management side.

28
3.6 Data Analysis Techniques
The gathered data was edited and coded. In the editing process the questionnaires were
scrutinized to check for any inadequate or out rightly irrelevant responses. In coding the
information, the researcher prepared a code book as a reference to facilitate entry of the
data into data entry sheets. Qualitative techniques were used to analyze the data. The
interview schedules were analyzed using content analysis. Qualitative analysis entailed
drawing inferences from the data. Therefore, content analysis was used to analyze the
contents of the instruments that could not be quantified. The independent variables in this
study were:
i. Empowerment
ii. Technology
iii. Monitoring and evaluation
iv. Accountability

29
CHAPTER FOUR 4.0 DATA ANALYSIS, RESULTS AND DISCUSSION
4.1 Introduction
This chapter presents the results of the study. From the 150 questionnaires distributed to
the residents of 4 villages of Kibera, 119 (however, some questions were left
unanswered) were collected and used in the analysis. This represents a response rate of
roughly 77.3 percent.
4.2 Social and Demographic Characteristics
The analysis in this section relates to the gender, age, education and length of residence.
4.2.1 Gender
The gender of the respondents was analysed in order to establish the representation of
respondents in terms of gender in the donor funded projects in Kibera. The results are
shown in Table 2.
Table 2: Gender of respondents
Gender Frequency Percent
Male 91 76.5
Female 28 23.5
Total 119 100.0
Table 2 shows that 76.5 percent were male and 23.5 percent were female. Thus, a
majority of staff in the donor funded projects researched were male. This reveals a gender
inequality in terms of representation in the donor funded projects in Kibera. Most females
were employed as casual house helps in the suburbs of Nairobi.

30
4.2.2 Age
The analysis of age was performed in order to establish the representation of members of
various donor funded projects in Kibera in terms of their ages. The results are shown in
Table 3.
Table 3: Age distribution
Age Frequency Percent
25 or below 70 58.8
26-30 years 35 29.4
31-35 years 14 11.8
Total 119 100.0
The results reveal that 58.8 percent of the respondents were aged 25 years or below, 29.4
percent were 26-30 years and 11.8 percent were 31-35 years. Thus, it can be observed
that majority of the respondents were young (below 26 years). According to the 2009
population and housing census, 34 percent of the Kenyan population is aged between 15
and 34. This is a substantial workforce that could contribute significantly to economic
growth. However, much of this labor force is unutilized.
The Kenyan Household Integrated Budget Survey (KIHBS) of 2005/06, indicated that
unemployment stood at 25 percent for the age group 15-19, 24.2 percent for 20–24-year-
olds, 15.7 percent for those aged 25-29 and 7.5 percent for the age group 30-34.
According the 2012 African Development Outlook, the high unemployment among the
young has an implication for income distribution. This is because returns to growth
accrue to only those who supply the factors of production. The report launched by
African Development Bank (ADB) further states that with the favourable economic
achievements realized in the last ten years, unemployed young people are missing out on
the gains. This calls for urgent intervention by the Kenyan government to address the
issue of youth unemployment.
31
4.2.3 Level of Education
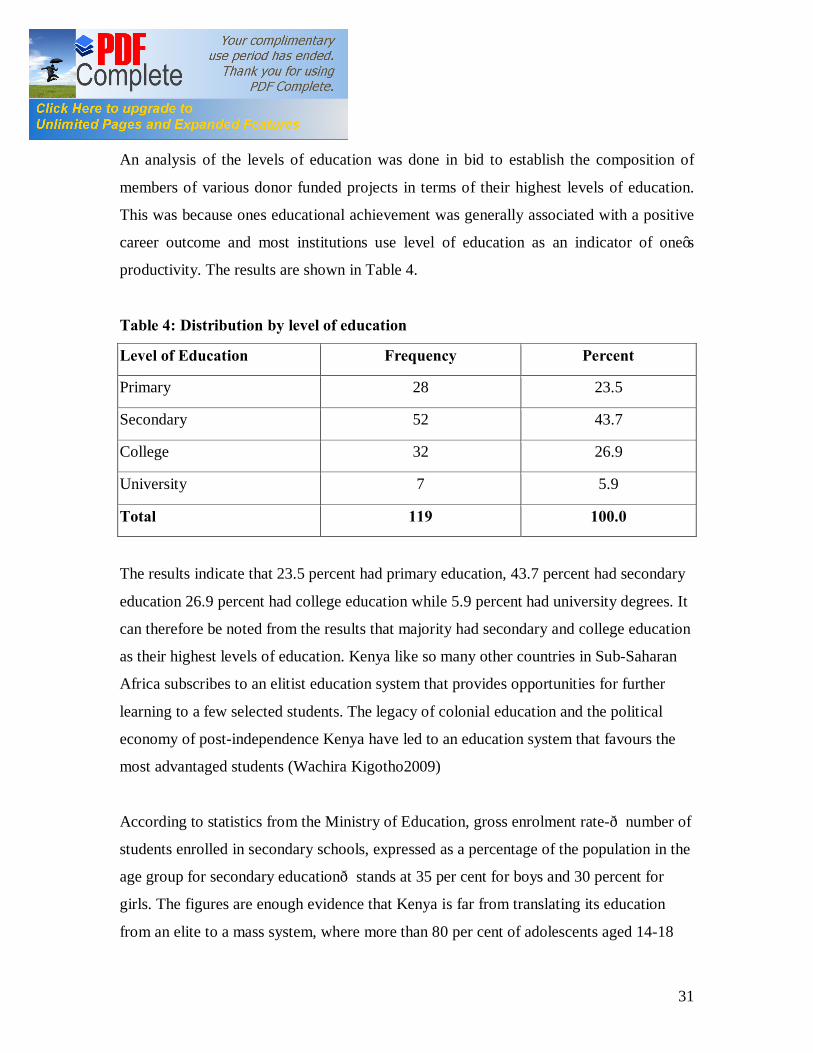
An analysis of the levels of education was done in bid to establish the composition of
members of various donor funded projects in terms of their highest levels of education.
This was because ones educational achievement was generally associated with a positive
career outcome and most institutions use level of education as an indicator of one’s
productivity. The results are shown in Table 4.
Table 4: Distribution by level of education
Level of Education Frequency Percent
Primary 28 23.5
Secondary 52 43.7
College 32 26.9
University 7 5.9
Total 119 100.0
The results indicate that 23.5 percent had primary education, 43.7 percent had secondary
education 26.9 percent had college education while 5.9 percent had university degrees. It
can therefore be noted from the results that majority had secondary and college education
as their highest levels of education. Kenya like so many other countries in Sub-Saharan
Africa subscribes to an elitist education system that provides opportunities for further
learning to a few selected students. The legacy of colonial education and the political
economy of post-independence Kenya have led to an education system that favours the
most advantaged students (Wachira Kigotho2009)
According to statistics from the Ministry of Education, gross enrolment rate-—number of
students enrolled in secondary schools, expressed as a percentage of the population in the
age group for secondary education—stands at 35 per cent for boys and 30 percent for
girls. The figures are enough evidence that Kenya is far from translating its education
from an elite to a mass system, where more than 80 per cent of adolescents aged 14-18

32
would be enrolled or complete secondary education and proceed to higher institutions of
learning. Consequently majority of slum dwellers are people with secondary and college
education.
4.2.4 Length of Residence
The length of residence in Kibera for the respondents was sought as it was important in
establishing the length of involvement in the projects and how it had benefited them. The
results are shown in Table 5.
Table 5: Distribution by length of residence
Length of Residence Frequency Percent
5-6 years 14 11.8
7-8 years 14 11.8
9-10 years 7 5.9
Over 10 years 84 70.6
Total 119 100.0
The study noted that 11.8 percent had stayed in the area for 5-6 years, 11.8 percent for 7-
8 years, 5.9 percent for 9-10 years and 70.6 percent for over 10 years. Thus, most of the
residents who took part in the survey had stayed in the area for more than 10 years. This
indicates that most of the projects were initiated by residents who were probably born in
Kibera as the projects are run mainly by the youth and it is also an indicator that most of
the have no formal employment rendering them vulnerable to the dependency syndrome
of donor funding. Even with the education that they have are unable to use their initiative
to create jobs because of inequality.

33
4.3 Influence of Donor Funding in Empowerment of the Residents 4.3.1 Examples and Aims of Donor Funded Projects
The study found that there were several projects funded by donors in Kibera. Most of
them were small self-help projects that donors initiate and fund. Examples included As-
SWAFAA Youth Welfare, Carolina for Kibera, Dudu Baya, Makongeni Youth Reform
Group, Ndiwa CBO, New Kedola Self-help Group, Solidarites, Shining Hope for
Community, Solver CBO, Youth Reform Self-help Group, and Institute for Development
and Welfare Services, among others.
From the interviews, it was noted that donor funded projects such as Carolina for Kibera
(CFK)’s primary mission was to promote youth leadership and ethnic and gender
cooperation in Kibera through sports, young women's empowerment, and community
development. Run by Kenyans and advised by American and Kenyan volunteers, CFK's
primary mission is to promote youth leadership and ethnic and gender cooperation in
Kibera through sports, young women's empowerment, and community development.
Additionally, CFK worked to improve basic healthcare, sanitation, and education in
Kibera. Serving as a model for holistic, community-based urban development world-
wide, CFK had helped grassroots organizations develop youth-based programs in six
other nations and dozens of communities in Kenya.
The interviews revealed that AS-SWAFFA Youth Welfare Organization was registered in
2000 as a self-help group to create awareness about HIV/AIDS and drug abuse. It covers
the Makina area and most of its members are male youth 18 years and above. They
perform songs at functions and ceremonies. They also hold seminars in collaboration
with the Supreme Council of Kenya Muslims (SUPKEM). With support from the
Community Development Trust Fund (CDTF), they built a water tank with a capacity of
10,000 litres and sell the water at one shilling per litre. They have also built five toilets
and three bathrooms that are used by the community at a fee. These projects generate a

34
modest income used to support other programs and emergencies. Every Saturday they
carry-out clean-ups in the Makina area in collaboration with Bunkers and CFK.
The interviews from Dudu Baya Self Help Group noted that it was established and
registered in 2005 to have a better Kibera with a cleaner environment and more educated
people. It has 35 volunteers who participate in its sanitation, sports and HIV/AIDS
awareness creation projects. These projects are funded by member contributions and
income made through garbage collection. The sanitation project is operational in Makina
and Kichinjioni areas. Every Sunday, members collect garbage from homes, sort it out
and burn organic waste then sell plastics and metals, creating a cleaner environment.
It can be observed from the results of the interviews that most of these groups have
parallel roles in Kibera. They range from HIV/Aids awareness, sanitation, sports and
education. These projects aim to uplift the standards of living of Kibera residents and are
initiated to provide clean water, collect garbage, provide clean toilets, to fight HIV/AIDS,
housing, pollution, training, as well as other income generating activities such as arts and
craft.
4.3.2 Resident Involvement with Projects
Table 6 shows the results of the length of time the residents who took part in the survey
had engaged in the donor funded projects.
Table 6: Length of association with projects
Length of association Frequency Percent
Less than 2 years 28 25.0
2-5 years 53 47.3
6-10 years 17 15.2
Over 10 years 14 12.5
Total 112 100.0

35
The study found that 25 percent had engaged in the projects for less than 2 years, 47.3
percent for 2-5 years, 15.2 percent for 6-10 years, and 12.5 percent for over 10 years.
These results show that majority had engaged in the projects for a period of 2-5 years.
Most of those engaged in these projects are youths, indicating the recency of the various
projects in Kibera, with the exception of a few that were started earlier such as Carolina
for Kibera. The residents who agreed that they were engaged cited that they were given
roles such as supervisors, trainers, peer educators, chefs in bakeries, garbage collectors,
water vendors, collecting bags for garbage, and other general capacities.
The respondents were asked to state whether they were involved in running the projects.
The results are summarized in Table 7.
Table 7: Response on whether residents are involved in running the projects
Response Frequency Percent
Yes 43 38.4
No 69 61.6
Total 112 100.0
The results revealed that 38.4 percent agreed while 61.6 percent disagreed. These results
show that the residents were involved in various capacities though those involved in top
capacities had high educational backgrounds and did not reside in Kibera. The lower
cadre of staff were the residents of Kibera whose educational backgrounds were much
lower.
The results from the interviews also revealed that most of these associations were run by
locals. For instance, the Carolina for Kibera project was run and managed by locals while
getting advice from foreigners and Kenyans living abroad. The University of North
Carolina was noted as a strong collaborator that houses a support centre for CFK at the
Centre for Global Initiatives at Chapel Hill. The university, in doing the same, partners

36
with the Population Council, Forum for African Women Educationalists (FAWE),
Centres for Disease Control (CDC) and Duke University among others.
Involving the community means people having active roles in the projects like taking part
in decision making and delivery from the commencement of the project and run through
to its planning, management, delivery, and evaluation. Thus involving them in the
development of activities. This increases the range of skills, knowledge and experience in
projects and ensures that the projects reflect local needs. However, the residents were not
involved in identifying the projects.
Established in 2001, Carolina for Kibera (CFK) is an international, nongovernmental
organization based in the Kibera slum of Nairobi, Kenya. Carolina For Kibera (CFK)
fights abject poverty and helps prevent violence through community-based development
in the Kibera slum of Nairobi, Kenya and beyond. CFK envisions a world where the
poor have a voice in their future and opportunities for healthy growth. The Organization
is rooted in the conviction that solutions to problems involving poverty are possible only
if those affected by it drive development. Concerned outsiders can help by mobilizing
communities, advising, networking, and providing resources. Ultimately, however, the
community possesses the knowledge and motivation that are necessary to solve its own
problems.
CFK’s leadership structure emphasizes grassroots decision-making and self-reliance.
CFK, Inc. is the patron of all four CFK-Kenya organizations: the Youth Sports Program,
Tabitha Medical Clinic, the Binti Pamoja Center, and Taka ni Pato. Although there is a
high degree of collaboration, each organization is operationally and financially
autonomous.
While a U.S.-based Board of Directors approves all major financial transactions, the
CFK-Kenya Executive Director, Deputy Director, and Program Officers in Kibera
manage all operations on the ground. CFK, Inc. invests money gradually and relies on
the Executive Director and the Kenyan staff to manage all program budgets. A
prominent Kenyan Board of Trustees provides local governance. This management
structure is important because it, in turn, promotes accountability.

37
4.4 Influence of Donor Funding in Improving Technology Among Residents The study sought to determine whether donor funding affects technology used among
residents in promoting development in Kibera.
4.4.1 Technology Used in Projects
The respondents were asked to state what type of technology was employed in their
projects. The results of the analysis are presented in Table 8.
Table 8: Response on type of technology used
Type of Technology Frequency Percent
Computers and mobile phones 42 42.9
Educational materials 7 7.1
Basic farm implements 14 14.3
Handcarts and wheelbarrows 21 21.4
Others (charcoal, gas firewood etc) 14 14.3
TOTAL 98 100.0
The study found that 43 percent used computers and mobile phones, 7.1 percent,
educational materials, 14.3 percent farm implements, 21.4 percent used handcarts and
wheelbarrows, and 14.3 percent used technologies such as charcoal and gas as fuel.
These results reveal that most of the respondents used computers, mobile phones,
handcarts and wheelbarrows as their chief technologies. The project managers also cited
that the most used technologies were the computers, mobile phones and the internet.
The key informant interviews revealed that the reasons for lack of better utilization of
modern technology arose from the fact that it was expensive given the poverty levels in
the area. Use of advanced technology was therefore an unattainable venture.
KWAHO is currently implementing a Solar Water Disinfection (SODIS) project in the
Kibera informal settlement in Nairobi as an effective and inexpensive initiative to

38
enhance the community's access to safe drinking quality water at the household level.
The SODIS project adds incremental value to KWAHO's sister water supply and
sanitation improvement project in the two slums. The major goal of the SODIS project is
to achieve sustainable improvement of health to the disadvantaged people in the slums by
providing quality solar treated water to them. This project is pertinent in this area as one
of the major problems for the residents of Kibera slum is having access to water as a
whole and more so to safe drinking water. The project is funded by SANDEC of
Switzerland and has a target of reaching 20,000 families (approximately 100,000 persons
as direct beneficiaries). The project commenced in March 2004 and has reached more
than three quarters of the target population. Families are now able to save on fuel that
was previously used to boil drinking water. Savings are made from reduced expenses on
medical care and other high cost methods of treating water i.e. chlorination and boiling.
Safe drinking water has led to reduction in diarrhoea related diseases by about 20percent
according to the survey by KWAHO
4.4.2 Technology Appropriateness
The respondents were asked to state whether the technology used was appropriate.
Appropriate technology is a small scale technology that is simple enough for people to
manage directly on a local level. This technology makes use of skills and technology that
are available in a local community to supply basic human needs such as gas, electricity
water, food and waste disposal. (Isa.Colorado.edu./essence/text.) It is based on the idea
that advanced technology is often inappropriate for the needs that it is attempting to
address within a place. The technological device must be able to stand alone to do the job
with few or no other supporting facilities or devices to aid in its functions (Jacquier:
1989)
An image of modernity is important to the success of technology for it elevates the social
status of the user. The cost however, is a very important factor to people who need it
most. Gosh (1984) indicates that the majority of appropriate technology although
developed with cost as a central consideration are still too expensive for most people. The
results are shown in Table 9.

39
Table 9: Response on whether technology used was appropriate
Frequency Percent
Yes 42 54.5
No 35 45.5
Total 77 100.0
The study revealed that 54.5 percent agreed and 45.5 percent disagreed. The results
indicate that majority of the respondents agreed that technology use was appropriate; this
was mainly as a result of what they have been exposed to and what was affordable. This
can be affirmed by the fact that the cost involved in modern technology is far beyond the
reach of most residents.
Solidarites is a French NGO which is funded by the French Government and it introduced
women groups in Kibera to vertical farming. The farms being in tall recycled sacks filled
with soil in which vegetables are grown on different levels after holes are poked in the
sacks. Vegetables such as kale, spinach and other indigenous varieties are planted and
sold by the women to generate income and are also consumed. Training and seedlings for
the vegetables and sacks were initially provided by the NGO. The women save the
money they would have used to buy vegetables and also earn some income from the sale
of these vegetables. This technology is appropriate here because they lack home farms
and farming is improvised as above.
4.5 Influence of Monitoring and Evaluation on Effectiveness of Donor Funded Projects in Promoting Development
The study sought to establish the effect of monitoring and evaluation on the effectiveness
of donor funded projects.
Monitoring is used to look at progress based on set goals. This is done by checking if the
projects are operational and activities are going on as planned. Workshops and seminars
are monitored by reviewing the number of participants through the number of bottles

40
distributed in the same. To monitor the community groups, the venue of meeting and the
participants who attend is taken into account. The success of door to door visits is
controlled by the number of bottles distributed and the number of households visited. The
users are registered. The field monitoring is done by verification during the follow up
visits.
The role of the supervisor in promoting development is to ensure that benefits are being
effectively delivered to the intended group and supervision is therefore viewed as a
process of guiding functions intended to promote the achievement of the organizational
goals.
The respondents were asked to state the people that supervise the projects. The results are
shown in Table 10.
Table 10: Who supervises the projects
Persons supervising Frequency Percent
Chairman 21 23.6
Coordinator 7 7.9
Other organs 29 32.6
Selected Members 18 20.2
Ministry 14 15.7
Total 89 100.0
The study found that 23.6 percent were supervised by the chairman, 7.9 percent by the
project coordinator, 32.6 percent by other organs such as the auditors and the donors,
20.2 percent by members and 15.7 percent by the respective ministries in which the
projects fell. Some did not respond to the question. These results show that most of the
projects were supervised by the chairpersons and the other organs. There is an indication
that the community is under represented in supervision of the projects. The best approach

41
is one where the beneficiaries, are involved in the design, planning, implementing and
monitoring of the projects. It is this kind of involvement that will bind all those involved
in the projects and make them accountable to each other and will ensure continuity and
sustainability of undertakings. The recipients must be made to feel that the project is their
own and not dictated and controlled from elsewhere.
The project managers added that the projects were supervised mainly to establish the
impact each of the donor funded projects had on positively influencing the community.
The projects were therefore evaluated and monitored based on the extent to which the
objectives they were intended to achieve were met or not. It is the beneficiaries who can
tell whether the projects met their intended objectives or not but since they are not
involved in monitoring they may not know the objectives of the projects.
The respondents were asked to state the number of times the projects were supervised.
The results are presented in Table11.
Table 11: Number of times supervision is done
Number of times Frequency Percent
3 times per month 18 17.5
Full time 6 5.8
Once a week 3 2.9
Quarterly 39 37.9
Twice a week 11 10.7
Twice in a month 26 25.2
Total 103 100.0
The results reveal that 17.5 percent were supervised three times per month, 5.8
percent full time, 2.9 percent once a week, 37.9 percent quarterly, 10.7 percent twice a
week, and another 25.2 percent twice in a month. These results indicate that most of the
projects were supervised on quarterly basis. Frequency of supervision matters, but quality
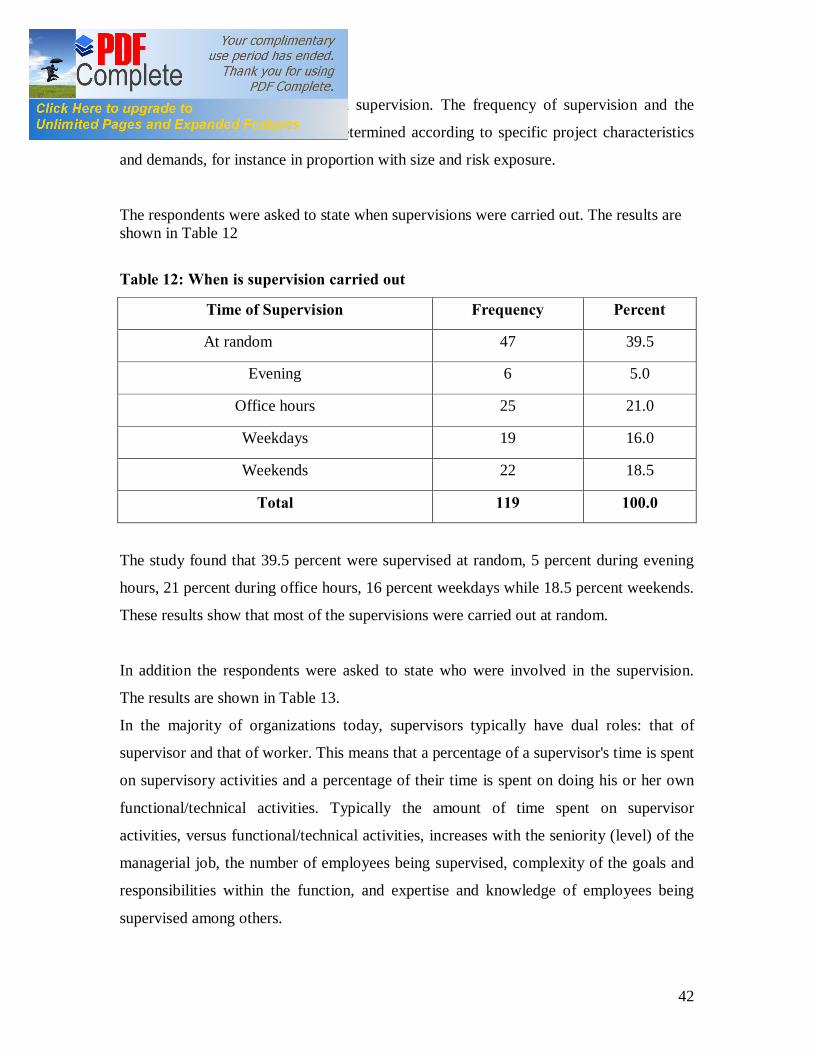
42
standards are equally important in supervision. The frequency of supervision and the
choice of instruments should be determined according to specific project characteristics
and demands, for instance in proportion with size and risk exposure.
The respondents were asked to state when supervisions were carried out. The results are shown in Table 12
Table 12: When is supervision carried out
Time of Supervision Frequency Percent
At random 47 39.5
Evening 6 5.0
Office hours 25 21.0
Weekdays 19 16.0
Weekends 22 18.5
Total 119 100.0
The study found that 39.5 percent were supervised at random, 5 percent during evening
hours, 21 percent during office hours, 16 percent weekdays while 18.5 percent weekends.
These results show that most of the supervisions were carried out at random.
In addition the respondents were asked to state who were involved in the supervision.
The results are shown in Table 13.
In the majority of organizations today, supervisors typically have dual roles: that of
supervisor and that of worker. This means that a percentage of a supervisor's time is spent
on supervisory activities and a percentage of their time is spent on doing his or her own
functional/technical activities. Typically the amount of time spent on supervisor
activities, versus functional/technical activities, increases with the seniority (level) of the
managerial job, the number of employees being supervised, complexity of the goals and
responsibilities within the function, and expertise and knowledge of employees being
supervised among others.

43
Table 13: Who are involved in supervision
Category of people involved Frequency Percent
All members 5 5.7
Top management 46 52.9
Committee members 33 37.9
The donors 3 3.5
87 100
The study found that 5.7 percent involved all members, 52.9 percent involved top
management only, 37.9 percent only involved committee members and 3.5 percent only
involved the donors. These results show that most of the projects were supervised by the
management teams with the involvement of some members. The supervisors functions
involve people management and task management. Each organization will need to define
the functions that best meet the specific needs of the organization and what the proper
balance is between the two functions.
4.6 Influence of Accountability on Effectiveness of Projects Accountability is the acknowledgement and assumption of responsibility for actions,
products, decisions and policies including the administration, governance and
implementation with the scope of the role or employment position and encompassing the
obligation to report, explain and be answerable for resulting consequences (Williams
Reyes: 2006). As Cornwall, Lucas & Pasteur: 2001 states, it refers to holding actors
responsible for their actions. Decisions about the way in which it is to be applied and the
actors and processes it applies to imply an agenda setting power and a degree of authority
to demand accountability from others. Therefore leaders must ensure that people
undertake the tasks they are responsible for in projects as expected and the expectations
must be set. This section presents the results of the analysis.

44
4.6.1 Accountability of Project Managers
The respondents were asked to state whether they believed that the project managers
were answerable for the projects. The results are presented in Table 14.
Table 14: Whether Project Managers are Answerable
Response Frequency Percent
Yes 91 81.3
No 21 18.7
Total 112 100.0
The study found that 81.3 percent agreed and 18.7 percent disagreed. These results show
that indeed the respondents believed that the project managers were answerable to the
projects. The project managers also added that they were fully accountable for the
projects failures or successes. It is critical that a project manager be able to account for
the efforts of her team. A client may want to know how their money has been spent, or
how much time is left on their contract. The ability to quickly access this data is
important for maintaining good client relationships and establishing their trust in your
methodologies. The ultimate measure of a successful project is delivery. A project is
usually broken down into several deliverables, with the final deliverable being the
finished project itself. Each one of these milestones is a signpost on the side of the road.
Without consistent and timely delivery, the project will become lost and increasingly
more difficult to complete on time (Reeve:2008)
The respondents were further asked to state whether the projects had been successful or
not in realising their purposes. The results are shown in table 15.

45
Table 15: Success of Projects in Realizing their Purposes
Whether successful Frequency Percent
Very successful 19 17.1
Successful 29 26.1
Not very successful 63 56.8
Total 111 100.0
The study found that 17.1 percent of the projects were very successful, 26.1 percent were
successful while 56.8 percent were not very successful. The results show that most of the
projects were unsuccessful. There are factors that contribute to the success or failure in
community projects. These include genuine community participation, ownership and
control, planning for financial viability, transparent and accountable governance,
leadership and decision making structures, monitoring and evaluation so that
communities and others can share and learn from experience among others. These factors
if taken into account will ensure the project succeeds and if not the project will not
succeed.
The reasons for malfunction of the projects were given as lack of commitment and
seriousness of all stakeholders 9.1 percent, lack of cooperation and hard work among the
members 36.4 percent and lack networking among the key stakeholders 14.3 percent. The
key challenge that limited the success of most of the projects was funding and
infrastructure issues 40.2 percent. These results are summarised and presented in table
16.

46
Table 16: Reasons for Failure of Projects
Reasons Frequency Percent
Lack of Commitment and seriousness 7 9.1
Lack of Cooperation and hard work 28 36.4
Lack of Networking 11 14.3
Limited Funding and infrastructure 31 40.2
Total 77 100.0

47
CHAPTER FIVE
5.0 SUMMARY, CONCLUSIONS AND RECOMMENDATIONS
5.1 Summary of findings
Regarding the involvement of community members (empowerment) in the donor funded
projects; the study found that 61.6 percent agreed that they were involved while 38.4
percent disagreed. The residents were involved in various capacities such as chefs in
bakeries, garbage collectors, selling water, collecting bags for garbage, trainers, peer
educators, general staff, and supervisors.
In terms of technology use, the study found that 42.9 percent used computers and mobile
phones, 7.1 percent used educational materials, 14.3 percent used farm implements, 21.4
percent used handcarts and wheelbarrows, and 14.3 percent used other traditional
technologies such as gas and charcoal as fuel. On the appropriateness of these
technologies, 55.5 percent agreed while 45.5 percent disagreed.
Regarding monitoring and evaluation of the projects, the study found that 23.6 percent
were supervised by the chairman, 7.9 percent by the project coordinator, 32.6 percent by
other organs such as the auditors and the donors, 20.2 percent by members and 15.7
percent by the respective ministries in which the projects fell.
The study found that 81.3 percent agreed while 18.7 percent disagreed that the project
managers were answerable to the projects. The study found that 17.1 percent of the
projects were very successful, 26.1 percent were successful while 56.8 percent were not
very successful.
The study found that the reasons for the successful projects were given as lack of
commitment and seriousness of all stakeholders 9.1 percent, cooperation and hard work
among the members 36.4 percent and networking among the key stakeholders 14.3

48
percent. The key challenge that led to unsuccessfulness of most of the projects was
funding and infrastructure issues 40.2 percent.
5.2 Conclusions
The study concludes that most of the residents were involved in the management of donor
funded projects. The project managers also noted that the community members were
involved in these projects in various capacities but were not empowered. Mofayane
2002:3 notes that ‘although many people get involved in some income generating
projects, they do not become empowered by them. Many organizations mistakenly
believe that meeting needs such as food will lead to empowerment of members.
These results revealed that most of the respondents used computers, phones, handcarts
and wheelbarrows as their chief technologies. The project managers also cited that indeed
the most used technologies were the computers, phones and the internet. The results
indicated that majority of the respondents agreed that the technology use was appropriate.
The study concludes that technology used in most of these projects though appropriate
was not advanced due to the nature of the place.
These results showed that most of the projects were supervised by the chairpersons and
the other organs. The project managers added that the projects were supervised mainly to
establish the impact each of the donor funded projects had had on positively influencing
the community. The projects were therefore evaluated and monitored based on the extent
to which the objects they were intended to achieve were met or not. The study concludes
that the project monitoring and evaluation did not involve the community members as
such and in some instances, the monitoring was done by the executive teams hence not
transparent. Hence the community was not given a chance to direct their development
project as should have been the case and there was no way of reporting the impact of the
project on the beneficiary.
These results showed that the respondents believed that the project managers were
answerable to the projects. The projects managers also added that they were fully
49
accountable for the projects failures or successes. The results showed that most of the
projects were unsuccessful. The study concludes that in terms of accountability, most of
the project managers were accountable.
5.3 Recommendations
The study makes the following recommendations based on the findings of the study.
i. There is need to encourage more involvement of stakeholders especially the
community of Kibera in the project planning and implementation in order to
increase the probability of sustaining the projects. This can be done through
encouraging members to elect the leaders in the projects and not leaving the task
of management to the donors or the sponsors.
ii. The technology used was appropriate but not modern and there is need for
improvement in order to enhance project viability and efficiency. Since the costs
involved in improving technology are high, there was need for donor agencies to
co-ordinate not only among themselves but with the recipients. Effective co-
ordination may help in cost sharing and standardization of supplies.
iii. With the executive team and the donors being left to supervise the projects, there
is a danger of concealing the weaknesses of the projects. Community members
should be involved in monitoring and evaluation in order to build their capacity in
directing their own development projects. More training needed to be given to the
community representatives to enlighten them on the goals the projects were meant
to achieve. This knowledge will help them know whether the projects achieved
their goals or not.
iv. In terms of accountability, the study recommends that the donors should take
account of the needs, concerns and capacities of community members and explain
its actions and decisions to them. In doing this, the community should be involved
by identifying their needs and coming up with a projects in which they will be
able to give feedback and the donors and community members will learn in the

50
process. Organizations that are accountable to the people they serve are
committed to improving the quality of their work and this demonstrates that they
listen to the community members and take action. (David Bainbridge:2008)
5.4 Suggestions for further research There is need to carry out more studies on this issue to establish whether there are other
factors that influence the effectiveness of donor funded projects in promoting
development as the study only considered four factors.

51
REFERENCES
Abers, R. (2000), Inventing local democracy: grassroots politics in Brazil, London:
Lynne Rienner.
Alsop R. and S. Forusz (2002), Community user groups: vehicles for collective action -
or personal gain?, PREM Network Notes 72, The World Bank, Washington D.C.
Anderson, R.A., McDaniel, R.R. Jr (1999), "RN participation in organisational decision-
making and improvements in resident outcomes", Healthcare Management
Review, Vol. 24 No.1, pp.7-16
Behar, A. and Y. Kumar (2002) Decentralization in Madhya Pradesh, India: from
Panchayati Raj to Gram Swaraj (1995 to 2001), ODI Working Paper 170, ODI,
London.
Black, J.S., Gregersen, H.B. (1997), "Participative decision making: an integration of
multiple dimensions", Human Relations, Vol. 50 No.7, pp.859-79
Caseley, J. (2003), Blocked drains and open minds: multiple accountability relationships
and improved service delivery performance in an Indian city, IDS Working Paper
211, IDS, Brighton.
Chambers, R. (1983) Rural Development: Putting the last first, Longman, Harlow. -
(1997) Whose Reality Counts? Putting the first last, Intermediate Technology
Publications, London
Daniels, K., Bailey, A. (1999), "Strategy development processes and participation in
decision-making: predictors of role stresses and job satisfaction", Journal of
Applied Management Studies, Vol. 8 No.1, pp.27-42.
Degeling, P., Hill, M., Kennedy, J., Coyle, B., Maxwell, S. (2000), "A cross-national
study of differences in the identities of nursing in England and Australia and how
this has affected nurses’ capacity to respond to hospital reform", Nursing Inquiry,
Vol. 7 pp.120-35
52
Fowler, A. (1998) 'Authentic NGDO Partnerships in the New Policy Agenda for
International Aid: Dead End or Light Ahead?', Development and Change, 29,
137-59.
Freire, P (1970) The Pedagogy of the Oppressed, The Seabury Press, New York. Goebel,
A. (1998) 'Process, Perception and Power: Notes from "Participatory" Research in
a Zimbabwean Resettlement Area', Development and Change, 29, 277-305.
Gatti, R., Gray-Molina, G. and J. Klugman (2003), ‘Determinants of corruption in local
health care provision: evidence from 105 municipalities in Bolivia’, World Bank
mimeo.
Gaventa, J. (2002), Towards Participatory Local Governance: Six Propositions for
Discussion,
http://www.ids.ac.uk/logolink/resources/downloads/Towards%20Participatory%2
0Governance _Currents_.pdf
Grant, U. (2003), ‘Local government decision-making: citizen participation and local
government accountability – A literature review’, University of Birmingham
mimeo.
http://www.idd.bham.ac.uk/research/Projects/municpal_accountability/Lit%20rev
iew%2 0engka rs.pdf
GTZ (1991) Where there is no participation, Deutsche Gessellschaft fur Technische
Zusammenarbeit, Eschborn.
HTTP/( www.en.wikipedia.org/technology).
Hackman, J.R., Oldham, G.R. (1980), Work Redesign, Addison-Wesley, Reading, MA
Healy, C.M., McKay, M.F. (2000), "Nursing stress: the effects of coping strategies and
job satisfaction in a sample of Australian nurses", Journal of Advanced Nursing,
Vol. 31 No.3, pp.681-8.

53
Hentschel J. (1994), Does Participation Cost the World Bank More? Emerging Evidence.
Human Resource Development and Operations Policy (HRO) Working Papers 31,
World Bank, Washington D.C.
Isham, J., Narayan, D., and L. Prichett (1994), Does participation improve project
performance: establishing causality with subjective data, World Bank Policy
Research Working Paper 1357, The World Bank, Washington D.C.
Jenkins, R. and A. M. Goetz (1999), ‘Accounts and Accountability: theoretical
implications of the right-to-information movement in India’, Third World
Quarterly, 20 (3): 603-622.
Kähkönen, S. (1999), Does social capital matter in water and sanitation delivery? A
review of the literature, The World Bank Social Capital Initiative Working Paper
9, The World Bank, Washington D.C.
Kanyesigye, J. and E. Muramira (2001), Decentralization, participation and
accountability: analyzing collaborative management models for Mt. Elgon
National Park and Mabira forest reserve in Uganda, Paper prepared for the World
Resource Institute.
Latham, G.P., Winters, D.C., Locke, E.A. (1994), "Cognitive and motivational effects of
participation: a mediator study", Journal of Organizational Behaviour, Vol. l
No.15, pp.49-63.
Lowndes, V., L. Pratchett and G. Stoker, (2005) ‘The locality effect: local government
and citizen participation’, cited in J. Aspden and D. Birch, New Localism –
Citizen Engagement, Neighbourhoods and Public Services: Evidence from Local
Government London: ODPM
Manikutty, S. (1998), ‘Community participation: lesson from experiences in five water
and sanitation projects in India’, Development Policy Review 16 (4): 373-404.
Narayan, D. (2000), ‘Poverty is Powerlessness and Voicelessness’, Finance and
Development, 37 (4): 18-21.
54
NVCO, (2003) It’s Who You Know that Counts: The Role of the Voluntary Sector in the
Development of Social Capital in Rural Areas (London: NCVO).
Oakley, P., Pratt, B., Clayton, A. (1998) Outcomes and Impact: Evaluating Change in
Social Development, INTRAC NGO Management and Policy Series No. 6.
Oxford: INTRAC
Ostroff, C. (1992), "The relationship between satisfaction, attitudes and performance: an
organisational level analysis", Journal of Applied Psychology, Vol. 77 No.6,
pp.963-74.
Parker, R. and T. Skytta. (2000), Rural water projects: lessons for OED evaluations, OED
Workin Paper Series (no number), World Bank, Washington D.C.
Peet, R. and M. Watts (1996) 'Liberation Ecology: Development, sustainability, and
environment in an age of market triumphalism', in R. Peet and M. Watts (eds)
Liberation Ecologies: Environment, development and social movements,
Routledge, London, 1-45.
Putnam, R. with Robert Leonardi and Raffaella Y. Nanetti, (1993) Making Democracy
Work: Civic Traditions in Modern Italy (Princeton, NJ: Princeton University
Press).
R. Putnam [ed.], (2002) Democracies in Flux: The Evolution of Social Capital in
Contemporary Society [Oxford: Oxford University Press].
Roy, D.D., Ghose, M. (1997), "Awareness of hospital environment and organisational
commitment", The Journal of Social Psychology, Vol. 137 No.3, pp.380-7
Sara, J. and T. Katz (1999.), Making rural water supply sustainable: report on the impact
of project rules, UNDP-World Bank Water and Sanitation Program,
http://www.wsp.org/pdfs/global_ruralreport.pdf

55
Schuurman, F. (1993) ‘Modernity, Post-modernity and the New Social Movements’, in
Schuurman, F. (ed) Beyond the Impasse: New Directions in Development Theory,
Zed Books, London, 187-206.
Subramanian, A., Jagannathan N. V., and R. Meinzen-Dick (eds.) (1997), User
organization for sustainable water services, The World Bank, Washington D.C.
The World Bank, (2000), World Development Report 2000/2001: Attacking Poverty.
NEW York: Oxford University Press.
Turton, C. and J. Farrington (1998), Enhancing rural livelihoods through participatory
watershed development in India, Natural Resource Perspectives 34, ODI, London.
United Nations Development Programme (1993) Human Development Report, Oxford
University Press, Oxford
Uphoff, N. and C. M. Wijayaratna (2000), ‘Demonstrated Benefits from Social Capital:
The Productivity of Farmer Organizations in Gal Oya, Sri Lanka’, World
Development, 28 (11): 1875-1890.
Walsh, J.P., Tseng, S.F. (1998), "The effects of job characteristics on active effort and
work", Work and Occupation, Vol. 25 pp.74-96
Williams, G. (2003), Towards a re-politicisation of development: political capabilities
and space of empowerment, paper presented a the Conference ‘Participation: from
tyranny to transition? Exploring new approaches to participatory development’,
University of Manchester, Manchester, 27-28 February 2003.
World Bank (1999), Improving basic education in Pakistan: community participation,
system accountability, and efficiency, The World Bank, Washington D.C.
World Bank (2002), Empowerment and Poverty Reduction: A Sourcebook, Washington,
D.C.: World Bank

56
Yammarino, F.J., Naughton, T.J. (1992), "Individualized and group-based views of
participation in decision-making", Group and Organization Management, Vol. 17
No.4, pp.398-413
Your friendship networks: are they any of the government’s business?, in H. McCarthy,
P. Miller and P. Skidmore (eds) Network Logic: Who Governs in an
Interconnected World? (London: Demos, 2004).
Zeffane, R.M. (1994), "Correlates of job satisfaction and their implications for work
redesign: a focus on the Australian telecommunications industry", Public
Personnel Management, Vol. 23 No.1, pp.61-76.

57
Appendix 1: Research Questionnaire for Residents This is a study intended to establish the factors that affect the effectiveness of donor
funded projects. Kindly fill in the information as accurately as possible. The
information provided here will be confidential and used only for research purposes.
1. What is your gender?
Male ( ) Female ( )
2. What is your age?
25 years or below ( ) 26-30 years ( )
31-35 years ( ) 36-40 years ( )
41-45 years ( )
3. What is your highest level of education?
Primary ( ) Secondary ( )
College ( ) University ( )
4. How long have you been a resident of this community?
5-6 years ( ) 7-8 years ( )
9-10 years ( ) Over 10 years ( )
5. Which development project is most familiar to you in Kibera estate?
....................................................................................................................................
..........................................................................
6. How long have you been associated with this project?
Less than 2 years ( ) 2-5 years ( )
6-10 years ( ) Over 10 years ( )
7. What does this project aim to achieve?
....................................................................................................................................
................................................................................................................
8. Are you involved in the running of the project?
Yes ( ) No ( )

58
Explain how
....................................................................................................................................
..........................................................................
9. In what positions are members incorporated in the management of the project?
....................................................................................................................................
..........................................................................
10. What kind of technology is used in the project?
....................................................................................................................................
..........................................................................
11. Do you think that the technology is appropriate?
....................................................................................................................................
.......................................................................
12. Who monitors the project?
....................................................................................................................................
..........................................................................
13. How many times is the monitoring done and in what ways is monitoring carried out?
....................................................................................................................................
..........................................................................
14. When is monitoring performed?
....................................................................................................................................
..........................................................................
15. Who are involved during monitoring?
....................................................................................................................................
..........................................................................

59
16. Do you think that the project managers are accountable for the project?
....................................................................................................................................
..........................................................................
17. State whether the project has been successful or unsuccessful in achieving its goals.
Very successful ( ) Not very successful ( )
Not successful at all ( ) Successful ( )
18. Give reasons why the project has been successful or failed.
....................................................................................................................................
..........................................................................
The end

60
Appendix 2: Interview Guide for Project Management Team This is a study intended to establish the factors that affect the effectiveness of donor
funded projects. Kindly cooperate in answering the questions as accurately as
possible. The information provided here will be confidential and used only for
research purposes.
1. How do you involve the residents of Kibera in your projects?
..........................................................................................................................................
....................................................................
2. What kind of technology do you employ in the project?
..........................................................................................................................................
....................................................................
3. How is the monitoring and evaluation of the project carried out?
.......................................................................................................
.......................................................................................................
4. What can you say about accountability of the project?
................................................................................................................................................
................................................................................................................................................
................................................