factors affecting the consurer perception towards the beverage industry in bd
TRANSCRIPT

“Factors affecting consumer perception
Beverage industry in BD perspective”

Project Proposal
Course Name: Project Course Code: Bus 498
Submitted to:
Dr. Abdul Momen Assistant Professor Department of Business Administration East West University
Submitted by:
Name: Md. Shultanuzzaman
ID# 2012-1-10-124
Major: Marketing & Finance
Department: Bachelor Business
Administration

Acknowledgement
I feel immensely pleased to have an opportunity, on the very occasion of submitting my Project
work report, to thank a number of individuals for their unprecedented support, cordial co-
operation, objective direction and endless encouragement that have significantly contributed to
the preparation of the report.
First and foremost, I would like to thank almighty Allah, the omniscient and omnipotent, who
bestowed me the capability of successful completion of my project work and the project work as
well.
It has been a great opportunity and wonderful experience for me to do a research report with a
really interesting and common topic but not been analyzed thoughtfully these days.
I would like to offer my heartfelt thanks and gratitude to my project instructor Dr Abdul Momen
Assistant Professor, Bachelor of Business Administration Department, East West University. His
delightful co-operation, benevolent patronage, intention to make other knowledgeable, not only
fascinated me but also inspired and encouraged me to work more effectively and efficiently.
And last but not the least; I would like to thank all the personnel working at beverage industry. I
know it is an industry optimized with lot of opportunity and challenges. For the better days lets
go together.

i
Letter of Transmittal
14 June, 2015
Dr. Abdul Momen
Assistant Professor
Department of Business Administration
East West University
Subject: Solicitation for acceptance of the report
Dear Sir,
With great pleasure, I am submitting this report. This marketing research report contains true
scenario of the effect of communication tools deriving customer perception about ―beverage
industry‖ that may reflect the main scenario.
I am grateful to you for giving us such an important assignment, which helped me
to understand project activities; it will be helpful for my careers. This report is
built by my true effort.
Sincerely Yours,
Md. Shultanuzzaman

ii
Abstract
The beverage industry is a very large industry itself in the overall marketing industry prospect in
the context of Bangladesh. It has a huge share in the overall profitability of the market. So
satisfying the customers in that huge market is a big challenge. Alongside that there are many
problems that the industry has to face. Companies use a series of communication tools and attract
the customers in this industry. And the communication tools have their own effect on the
consumer perception towards a particular company. Here comes the use of effect of different
communication tools catching attention towards particular company. This paper aims to
investigate the effects of those communication tools that may influence the consumer
perceptions. In order to achieve this aims, I have worked consistently and visited many places
especially some beverage store to investigate the consumers buying pattern. Moreover, the survey
approach I adopted for data collection and a questionnaire was designed base on the literature
review and research model. At the end of survey, I have collected 150 valid samples for this
research. After the data analysis and discussion, the results indicates that the advertisement, sales
promotion, online promotion, perceive value, are the direct factors influence consumers‘
beverage buying behavior. Moreover, satisfaction, perception, purchase are also the factors
influenced consumers buying behavior. And from the findings from the analysis of my survey, I
can see that Advertisement as a whole has the most importance as a factor in effecting consumer
perception. So when thinking of about satisfying the customers of beverage industry the
advertisement effect needs to be considered.

Table of Contents Chapter 1: Introduction ....................................................................................................... 1
1.1. Origin of the report ............................................................................................................... 1
1.2. Outlook of the beverage industry in Bangladesh ................................................................. 1
1.3. Back Ground of the Report .................................................................................................. 2
Lifestyle Changes .................................................................................................................... 2
High Perception ....................................................................................................................... 3
Entertainment ........................................................................................................................... 3
Globalization ........................................................................................................................... 3
Huge Amount of Customers .................................................................................................... 3
Differentiated Products & Change in Consumer‘s Buying Pattern ......................................... 4
1.4. Problem statement ................................................................................................................ 4
1.5. Objective of the study .......................................................................................................... 5
1.6. Scope of the report ............................................................................................................... 6
1.7. Limitation of this report ....................................................................................................... 6
Conclusion……………………………………………………………………………..………6
Chapter 2: Literature Review ............................................................................................. 7
Introduction………………………………………………………………………………….…7
2.1. Beverage Industry Worldwide ............................................................................................. 7
2.2. Beverage industry in Bangladesh ....................................................................................... 12
2.3: consumer perception and its favorable impact ................................................................... 14
2.4: Importance of Advertisement on consumer perception ..................................................... 17
2.5: Sales promotion and consumer perception ........................................................................ 21
2.6: Online advertisement and consumer perception ................................................................ 25
2.7. Graphical model ................................................................................................................. 29
2.8. Mathematical Model .......................................................................................................... 30
2.9. Conceptual Framework ...................................................................................................... 31
Conclusion……………………………………………………………………………………31
Chapter 3. Methodology of the Report ......................................................................... 33
Introduction……………………………….…….…………………………………………….33

3.1. Research Design.................................................................................................................. 33
3.2. Data Collection ................................................................................................................... 33
3.3. Respondent ......................................................................................................................... 33
3.3. Data Analysis ..................................................................................................................... 33
3.4. Information to obtain:......................................................................................................... 33
Conclusion…………………………………………………………………………………..…33
Chapter 4: Research Analysis and Findings ................................................................ 34
Introduction…………………………………………………………………………………...34
4.1. Descriptive Analysis .......................................................................................................... 34
4.2. Factor Analysis ................................................................................................................... 42
4.2.1. Reliability .................................................................................................................... 42
4.2.2. KMO and Bartlett‘s Test ............................................................................................. 43
4.2.3. Communality ............................................................................................................... 43
4.2.4. Total Variance Explained ............................................................................................ 44
4.2.5. Rotated Component Matrix ......................................................................................... 45
4.3. Regression Analysis ........................................................................................................... 47
4.3.1. Model Summary .......................................................................................................... 47
4.3.2. Anova Table ................................................................................................................ 47
4.3.3. Coefficients .................................................................................................................. 48
4.4. Conclusion and Recommendation ...................................................................................... 48
4.5. Questionnaire ..................................................................................................................... 49
References ................................................................................................................................. 53
1 | P a g e
Chapter1: Introduction
1.1. Origin of the report
This study and the resulting report are conducted and submitted as a project paper (BUS 498)
course, which is known as ―Project Work‖ that is taken when the student is at the pick of his
BBA Degree. In this course, the student has to make a research about any topic which is related
with current business situation. For this course a student will get a full semester to complete their
own project work. This course helps a student to know a lot about the topic and the related things
of the topic which he/she is going to do the project. It also helps to know a lot of things about
making a research about any real life topic. We know how to use statistics but this course helps
to implement the statistics in real life and real situation. We learn a lot of things in the whole
BBA program, but this course is the best way to implement all the knowledge we gather, and
bring out the bookish knowledge into practical life.
This report entitled ―Factors affecting consumer perception: Beverage industry in BD
perspective‖. This research paper will show the customer perception towards beverage industry
in Bangladesh. A series of question will be asked to the general people that, what is their
perception about the present situation of beverage industry and what are the factors that influence
them while buying any beverage. After conducting this research we will be able to show the
present market situation of beverage industry in Bangladesh, and consumer perception towards
it.
1.2. Outlook of the beverage industry in Bangladesh
The beverage industry of Bangladesh is an old, steady yet neglected industry. For many years,
the only product of the industry was Carbonated Beverage or Carbonated Soft Drink (CSD) and
the number of players was limited to only a handful. Today, the industry has flourished
considerably with a bunch of new enterprises and through the introduction of newer and more
diverse products. For the beverage industry of Bangladesh, at the present scenario, the major
objective of all the players are to grab the maximum of the potential market share. This is due to
the following reasons:
2 | P a g e
The market size is limited and the possibility of expansion of new market is very low.
The industry is overcrowded with huge number of players that the market can withstand.
New players are emerging all the time.
The products are seriously competed against the rival substitute products.
The industry, as a matured or even declining industry, is losing its consumer base day
by day.
Introduction of new product or new technology is apparently absent.
As the market itself is big and includes a variety of products, so the use of different
communication tools by the companies within are very important to grab the market share and to
increase profitability. The rapid economic growth, coupled with the huge development of
beverage industry all over the world, contributes to the significant changes of beverage consumer
behavior. Understanding behavior of consumers is a key to the success of business. As a huge
potential consumer group, understanding of their attitudes and buying behavior towards beverage
seems to be necessary. Advertisement, sales promotion and online promotions are some way to
ensure that in our country.
1.3. Back Ground of the Report
Bangladesh has experienced several colonial changes in the past, which has influenced and
filled this piece of land with diversely rich culture and has also triggered. Bangladeshi people
easily accept and experience foreign cultures and products and food also. Beverage is one of
the leading markets in the Bangladeshi arena. It has now become a part of the Bangladeshi
culture and their style.
Lifestyle Changes
Beverage is the part of our everyday life. As we like to follow everyone, like others from the
western country, we the Bangladeshis have grown the culture of beverage. As the history of the
beverage is so old not only over the world, but also in our country, it definitely has a serious
impact on our lifestyle. Like the western culture, we now like to hang out with soft drinks or low
3 | P a g e
alcoholic drinks in small occasions. We enjoy coffee breaks at office time, and use energy drinks
for refreshments.
High Perception
People‘s perception towards beverage industry is very positive. As their lifestyle is changing,
and many other reasons, they prefer beverage over any other as refreshment object. Specially in
Dhaka city, where the tension business of peoples life in the highest peak always, it‘s a good
source of passing time. So it had to have the highest bit of perception among the people
including all age group and all class.
Entertainment
Beverages are another source of a thing called entertainment. Often the beverage shops are the
main medium. There are many shops of beverages surrounding the whole country. And most of
the time the shops tend to be busy with people. People go there, may take seat and enjoy a small
break enjoying coffee, tea, or taking soft drinks. They think this as a source of relaxation and
entertainment as they are able to pass some of the quality times.
Globalization
We are going with the whole world‘s trend. Companies on social, economic and environmental
fronts," They face difficulties such as inadequate access to infrastructure, financial and market
resources. Despite all those factors, in Bangladesh Beverage industries are in very good
competitive market situations.
Huge Amount of Customers
Mostly, all the peoples in our country are the target market of the beverage industry. People of
all age and all class are the customer of beverage industry. Many of them are the existing
customers, and the left all people are the potential customers. So it is a plus point for the
industry. But having a huge target market can be a problem. Much cost goes on a big margin like
advertisement and some other too satisfy and attract the customers of that huge amount.
4 | P a g e
Differentiated Products & Change in Consumer’s Buying Pattern
As the market is big, so companies in this industry want to differentiate them by using some
communication tools or other differentiation techniques. As there are a lot of companies
competing in the industry, creating difference that the customer can recall the company name is a
big problem. And also the fact is true that, consumers buying pattern changes over time due to
the previous factor called globalization. So the companies should try and fix the problem by
market survey and finding out the customer preferences.
1.4. Problem statement
The problem of this research is to find out the relationship of consumer preference and consumer
buying behavior on beverage. Today the majority of beverage products target all kind of people
such as children, adults, middle age and old age; however there is a need for a nutritional drink
for the adult. The purpose of this study is to develop a better understanding of consumer
preferences and buying behavior on beverage products and find out which factors have more
impact on consumer preference and buying behavior. It is one for the needful study because now
every companies are running their business in high competitive market and ever changing
environment due that customers life style is changing day to day so that every organization have
to give more consideration on customer preferences and buying behavior because they are kings
in the market. Beverage industry is performing very well however they have to understand what
are the factors those derive customer preference and buying behavior on beverage buying to
capture huge market. Based on the research problem of the study the following research question
some research questions are to be formulated that will do I think to find the cause.

5 | P a g e
1.5. Objective of the study
Broad objective:
What kind of communication strategies will change the perception towards beverage
industry in Bangladesh?
Measuring the each and every communication tools how much they are effecting on
consumer perception.
Specific objective:
What are the factors for choosing beverage?
Do the factors influence choice criteria?
To determine whether the profile of consumer and their perceptions influence the
preference and behavior
What are the factors involved in customers satisfaction of beverage buying & do they
influence choice criteria?
What is the market share of various companies?
To find out which beverage firms are more popular and for which specific taste criteria?
What is the demographic and psychographic profile of the customers? Is there any
difference in the customer‘s profile from different areas?
Can communication tools help them getting into repurchase decisions?

6 | P a g e
1.6. Scope of the report
Bangladesh is no longer a poor country by any means. As they are economically getting more
and more good, their perceptions are changing rapidly. So finding new and new ways to satisfy
the customer needs and catching attention among so many is the need of time. As I had limitation
of time and tight work schedule, I couldn‘t focus on each and every part that was needed to do
find out the vast scenario of the actual problem lies beneath. If I had time then I would have liked
to do a more detailed work on this problem covering more are of work. Scope may be included
demographic perceptual changes, cultural barrier factors influence and many more.
1.7. Limitation of this report
To complete this term paper I have found some limitations and restrains.
The main limitation of the study is the unavailability of close information. At the
beginning stage of the study, the major problem was finding out the relevant
information and money constraints to collect that information.
Unavailability of literature and data and in many cases the up-to date information is not
found easy.
Another significant limitation was time constrain. It was difficult to perform all the
analysis about a whole business section within a shorter period of time.
Conclusion
As the study topic in my report is, ―Factors affecting consumer perception‖ on the beverage
industry perspective of BD, from the above mentioned point, it may be clear about our objectives
of report and by which process we are going to continue our study. What are the problems and
what is the limitation that I have faced while formulating this report. And I have also mentioned
the scope of reports that I have made.

7 | P a g e
Chapter 2: Literature Review
Introduction
A literature review is a very important part of a project work. As it helps to find out logical
explanations of the report and its elements that exists by the help of other studies associated with
the work done by everyone in the work. As it is a very important part of any research based study
it is used as one of the fourth main chapter in a report work.
A literature review is most often associated with academic-oriented literature, such as a thesis or
a peer-reviewed journal article, a literature review usually precedes the methodology and results
section although this is not always the case. Literature reviews are also common in a research
proposal or prospectus sometimes may be described as the document that is approved before a
student formally begins a dissertation or thesis. Its main goals are to situate the current study
within the body of literature and to provide context for the particular reader. Literature reviews
are a basis for research in nearly every academic field. The main types of literature reviews are:
Evaluative Review, Exploratory Review and Instrumental Review.
A systematic review is a
literature review focused on a research question, trying to identify, appraise, select and
synthesize all high quality research evidence and arguments relevant to that question.
2.1. Beverage Industry Worldwide
The global soft drinks industry increasingly finds itself at a crossroads. Volume growth has
become extremely hard to come by in high-income developed markets, while in emerging
markets substantial investment will be necessary to sustain the strong performance seen over
2009-2014. In this new report, Euro monitor International examines the changing face of an
industry, one where vast existing demand centers must be defended, while new growth markets
demand more resources by the day.
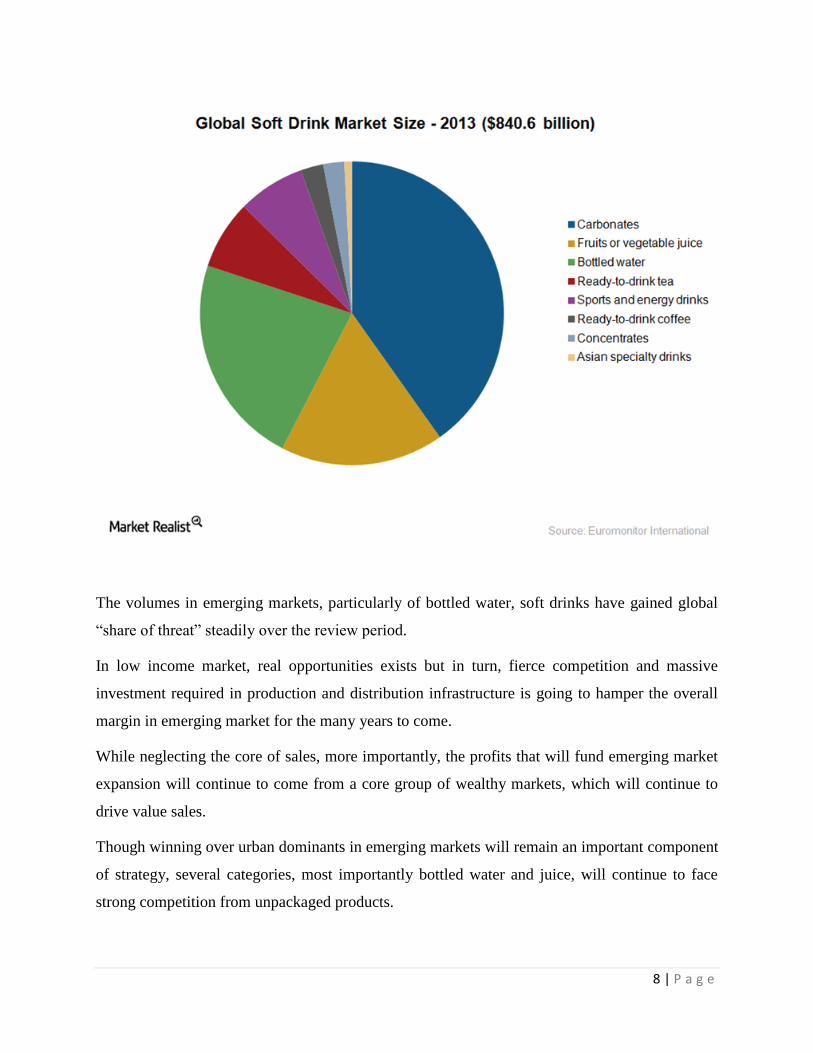
From the 2013 data, we can see the global soft drink market and how each of those capture
market share.
8 | P a g e
The volumes in emerging markets, particularly of bottled water, soft drinks have gained global
―share of threat‖ steadily over the review period.
In low income market, real opportunities exists but in turn, fierce competition and massive
investment required in production and distribution infrastructure is going to hamper the overall
margin in emerging market for the many years to come.
While neglecting the core of sales, more importantly, the profits that will fund emerging market
expansion will continue to come from a core group of wealthy markets, which will continue to
drive value sales.
Though winning over urban dominants in emerging markets will remain an important component
of strategy, several categories, most importantly bottled water and juice, will continue to face
strong competition from unpackaged products.

9 | P a g e
While consumers in the Middle East, Latin America, Africa, and India all retain a strong
preference for sweet beverages, carbonated soft drinks are just one part of the whole process,
with juices in particular set to make strong initiative.
The search for functionality and flavor, particularly in developed markets, has made categories
important for closer competition, as energy drinks add flavor, juices add functionality, and so on.
Consumers‘ beverage choices these days are not decided only by a need for refreshment but are
influenced by many other factors. As a result, the market has become increasingly diverse and
complex, putting pressure on ingredients suppliers to satisfy the evolving demands of innovators.
My report provides an overview of the market for beverage ingredients, and examines the key
trends and developments in each of the main ingredient categories, highlighting the best
opportunities for future growth in the international market of beverage industry as a whole.
When thinking of some of the leading beverage companies we can think of:
The world leader in the beverage industry
10 | P a g e
Industry overall analysis
In order to fully understand the soft drink industry, some factors need to be considered, such as,
the dominant economic factors, five competitive sources, industry trends, and the industry‘s key
factors. Based on the analyses of the industry, specific recommendations for competitors can
then be created.
Famous market analyst ―Barbara Murray‖ (2006c) explained the soft drink industry by stating,
―For years the story in the nonalcoholic sector centered on the power struggle between Coke and
Pepsi. But as the pop fight has topped out, the industry's giants have begun relying on new
product flavors and looking to noncarbonated beverages for growth.‖
There are some of the dominant economic factors that are nearly the decider of this industry
while talking about the beverage industry overall.
Dominant Economic Factors
Market size, growth rate and overall profitability are three economic indicators that can be used
to evaluate the soft drink industry. The market size of this industry has been changing. Soft drink
consumption has a market share of 46.8% within the non-alcoholic drink industry. Data monitor
(2005) analyzed and found that the total market value of soft drinks reached to $307.2 billion in
2004 with a market value forecast of $367.1 billion in 2009.
Further, in 2004, the soft drink volume was 325,367.2 million liters. Clearly, the soft drink
Industry is filled with a potential for high profits, but there are several obstacles to overcome in
order to recap the market share.
At that stage, the growth rate has been criticized due to the U.S. market saturation of soft Drinks.
As the Data monitor (2005) analyzed and stated, ―Looking ahead, despite solid growth in
consumption, the global soft drinks market is expected to slightly decelerate, reflecting
stagnation of market prices.‖ The change is due to the other growing sectors of the non-alcoholic
industry including tea and coffee (11.8%) and bottled water (9.3%). Sports drinks and energy
drinks were also expected to increase in growth as competitors started adopting new product
lines.

11 | P a g e
In terms of Profitability in the soft drink industry also expected to remain rather solid, but market
saturation especially in the U.S. has caused analysts to suspect a slight deceleration of growth in
the industry (2005). Because of this, soft drink leaders are establishing themselves in alternative
Markets such as the snack, confections, bottled water, and sports drinks industries, according to
Barbara Murray, 2006c. The suggestion was that, ―In order for soft drink companies to continue
to grow and increase profits they will need to diversify their product offerings‖.
The geographic scope of the competitive rivalry shows some of the economic features
That was found in the soft drink industry. In this case, According to Barbara Murray (2006c),
―The sector is dominated by three major players; for instance, Coca-Cola is king of the soft
drink-empire and boasts a global market share of around 50%, followed by PepsiCo at about
21%, and Cadbury Schweppes at 7%.‖ Alongside these major players, smaller companies such as
Cott Corporation and National Beverage Company make up the remaining market share. All five
of these companies make a portion of their profits outside of the United States. As the US does
not hold the highest percentage of the global market share; for that companies need to be able to
compete globally in order to be successful.
Coca-Cola has a similar distribution of sales in Europe, North America, and Asia. On the other
hand, the majority of PepsiCo‘s profits come from the United States. Compared to PepsiCo,
Cadbury Schweppes has a stronger global presence with their global mix. The other smaller
companies are also trying to establish a global presence. The saturation of the US markets has
increased the global expansion by soft drink leaders to increase their profits. The ease of entry
and exit does not cause competitive pressure on the major soft drink companies. It would be very
difficult for a new company to enter this industry because they would not be able to compete
with the established brand names, distribution channels, and high capital investment. As a result,
leaving this industry would be difficult with the significant loss of money from the fixed costs,
binding contracts with distribution channels, and advertisements used to create the strong brand
images. This industry is well established already, and it would be difficult for any company to
enter or exit successfully.
Overall, Three leading companies have prominent presence in the soft drink industry. As
expected, the leaders include the Coca-Cola Company, PepsiCo, and Cadbury Schweppes. From
the Coca- Cola annual report (2004), it has the most soft drink sales or market shares with a
proof of sales covering$22 billion range. The Coca-Cola product line has several popular soft

12 | P a g e
drinks including Coca-Cola, Diet Coke, Fanta, and Sprite, selling over 400 drink brands in about
200 nations as per (Murray 2006a) stated. PepsiCo is the next top competitor with soft drink
sales grossing $18 billion for the two beverage subsidiaries, according to PepsiCo Beverages
North America and PepsiCo International (PepsiCo Inc., 2004). PepsiCo‘s soft drink product line
includes Pepsi, Mountain Dew, and Slice which make up more than one quarter of its sales.
Despite being a secondary competitor in comparison with Coca-Cola and PepsiCo, Cadbury
Schweppes had soft drink sales of $6 billion with a product line consisting of soft drinks such as
A&W Root Beer, Canada Dry, and Dr. Pepper according to the data of (Cadbury Schweppes,
2004).
2.2. Beverage industry in Bangladesh
When we talk about the beverage industry‘s latest condition in Bangladesh, it‘s a long history to
see. The origin of soft drinks, also known as non-alcoholic beverages, is linked with Sherbet
That was developed by the early Arabs. However, there are different types of sherbets or forms
are available now a day in the version of juice, mineral water, and carbonated soft drinks in
Bangladesh. In a broader sense, soft drinks include colas, sparkling water, iced tea, lemonade,
squash and fruit punch at least in the contest of Bangladesh. Carbonated soft drinks are also
known as soda, pop or soda pop, fizzy drinks or sometimes just coke in some places of this
world. In the West, non-carbonated soft drinks date back to the 17th century and that of
carbonated drinks to the 18th century, while marketing in bottles started in the 19th
century. From
the early 20th century, sale of carbonated drinks increased dramatically and by the middle of the
same century brands like Coca Cola became the icon of the industry in throughout world. Today,
soft drinks both carbonated and non-carbonated have spread over in a variety of forms and
brands all over the world. However, in terms of carbonated drinks, Coca Cola and
Pepsi are the leading brands in most parts of the world including Bangladesh.
A long walk back to the history, Coca Cola was the first carbonated soft drink introduced in the
then undivided Pakistan in 1962. After 1971, the Coca Cola production unit in Bangladesh was
given to the Freedom Fighter Welfare Trust. Initially, the production capacity was 65 bottles per
minutes before the handover. The capacity was dropped to 45 bottles per minute later on.
However, with new machinery installed, the capacity was increased to 250 bpm in 1985. In
1990, another plant with 500 bpm production capacity was added to this unit. The marketing
13 | P a g e
territory of Coca-Cola Export Corporation whose brands are Coca Cola, Sprite and Fanta was
divided into 2 segments. Tabani Beverage got the marketing territory of Dhaka, Rajshahi and
Khulna divisions and part of Barishal division while Abdul Monem Limited got the marketing
territory of Chittagong and Sylhet divisions and a part of Barishal division. However, the Coca
Cola producing factories, especially the ones under Tabani Beverage, began to be under pressure
by worker disputes, management inefficiency, political interference and such other problems that
lead to the decrease in the supply of Coca Cola in the market. In 2002, Coca-Cola‘s Bangladesh
director had to flee Bangladesh after getting repeated extortion and death threats from a
notorious under world terrorist. Recently, production of Tabani Beverage Company has been
completely shut down that we can get the information from The Executive Times, (2008). The
soft drinks market in Bangladesh is more than a Tk. 8000 million (US $114.28 million; 1 US
dollar is equivalent to Tk. 70.00) market, which is expected to reach Tk.10, 000 million (US
$142.86 million) soon, and company insiders believe that there is a huge prospect of this product
for the market to expand.
The visual of the Bangladeshi beverage industry may look like:

14 | P a g e
When we come to talk about the second most popular beverage brand in Bangladesh, from the
look back at the market share of the soft drinks in Bangladesh, it is clear to us that Pepsi has now
positioned itself as the top brand. According to a survey carried out in 2007, Coke‘s market share
in Bangladesh is about 22 %, Pepsi 27% and RC‘s 16%. The survey also reveals 50% of the
market is occupied by international brands while the rest of 50% by local brands.
It is a matter of great courage that, the Bangladeshi local brands have covered up the 50% market
share in the overall Bangladesh arena despite the pressure of the international brands and their
different policies undertaken.
With various marketing campaign undertaken by Partex Beverages Ltd, Royal Crown (RC) is
poised to increase its market share. Compared to these three international brands, Virgin put up a
Weak performance as it was re-launched in 2005 by Global Beverages Ltd.
In terms of juices, Pran beverage has already earned a good reputation but its cola drink has yet
to make its position. Pran‘s soft drinks occupy 8% of the market share. And its promise in the
future is not ignorable and noticing in turn. Being a local brand, now it has already entered the
global market and created a name for itself. Mojo is another brand coming up and expanding in
a rapid rate as it is the symbol of the young people and the bottle size is appropriate to the
customers.
2.3. consumer perception and its favorable impact
Consumer behavior has been very important to all branded companies in all over the world
especially in the beverage sectors. Because the research about the consumer behavior shows that
what are the needs and wants of consumer, how consumer think, how consumer feel and select
the branded products. The behavior of the consumers remains not same in all the time the
consumers behavior change with the passage of time in future based on some of the situational
factors. The behavior of consumer is temporary for short time but not permanently. The factors
influences the consumer behavior may include culture, family, social, society, age, groups,
friends, environment and psychological factors according to (Brosekhan & Velayutham). The
purpose of the research is how the factors of consumer behavior affect or influences the branded
product. And the other purpose of this research can be mentioned as to gain more knowledge
about consumer behavior and improve the writing and thinking ability.

15 | P a g e
Gabbott (1994) and Mooij (2003) gives their points regarding that is every consumer in the
market has perceived value when he purchased the same product mean every consumer‘s shows
different behavior when they are purchasing the same product. It mean consumer behavior of
every individual is different from other depending on buying choice which is effected by their
social class, psychological factors, friends, family, groups and other personal factors.
As every individual being are different from one another, despite some factors being equal, all
consumers and their perceptions vary based on their individual choice criteria and the
environment they grow upon. From our survey, it is clear that the point I am mentioning. No
single factor can have individual dominating feature in terms of customer choice. In terms of
determining which factors indirectly can have the effect on consumer, I have identified that,
everyone are somewhat related and differentiating them in the context of the surveyed peoples
were not so easy.
According to Bhattacharya & Mitra (2012) ―Consumer psychology is the study of the
interactions between consumers and organizations that produce consumer products‖. There are
five various visions/roles of consumer when he purchase the branded products. 1st arises when
consumer purchase the product to solve the problem the consumer acting as a problem solver, 2nd
sometime consumer have some finance or source of money and when he thing how he spend the
money in market in this condition consumer act as an economic creature, 3rd sometime
consumer visit the market just for experience or for the judgment of branded products in this
condition consumer act as a revolvers, 4th sometime consumer has store the information about
branded products in their mind so in this condition consumer act as a computer and 5th is
happens when consumer visit the market for shopping in this condition consumer act as a
shopper. It means consumer shows different behavior in different condition.
Brand image has a significant impact on customer satisfaction especially across the E-banking,
landline, mobile phone, bank and supermarket industries and beverage. Chang et al. (2005)
identified that store infrastructure, convenience, store service and sales activities as the four
components of store image, and they all impact customer satisfaction directly. Chitty et al.
(2007) also empirically proved the dominant role of brand image in predicting customer
satisfaction in the hospitality industry. Moreover, the relation between the brand image and
customers‘ self-image would enhance customer satisfaction and customers‘ preference for the
brand as per chitty thinks.

16 | P a g e
When we talk about the brand feeling that results from good consumer perception we need to
look at traditional attitude theory. According to the theory, behavior is predicted from consumer
attitude when consumers buy the brand, which they like the most. An attitude may be defined as
―acquire behavioral disposition‖ by (Smith & Swinyard, 1983). However Adelaar et al. (2003)
explained that behavior is produced by emotional response which justifies the importance of
brand feeling in turn; He classified those by three factors:
Pleasure: Pleasure is the state in which person feel good, happy, or joyful in a particular
situation.
Arousal: Is the state of feeling that is varying from person to person in different situations i.e.
feeling of excitement, active, bored, or sleepy.
Dominance: this defines individual feelings, which are in control of or free to act in a particular
Situation.
Brand awareness plays a very important role as it ensures brand recall and brand recognition as
it ensures brand association in the memory of customers. According to Keller‘s statement from
2008 journal, though brand image is important, brand awareness is sufficient in the case when
consumer involvement is low. As a result, brand awareness is important as per the statement
from (Rios & Riquelme, 2010). In 2006, the journal published by Keller characterized brand
awareness with two elements like brand recognition and brand recall performance. Brand
recognition is defined as the consumers capacity to identify the brand while the brand itself is
given as a cue. Brand recall is the consumer ability to remind the concerned items. Here, instead
of the brand itself, purchase situation is given as cue. Brand recognition is important in store
based purchase decision while recall is important in other cases stated in (Rios & Riquelme,
2010).
There is definite effect of marketing communication tools on consumer perceptions. Those
effects may include advertisement, sales promotion, online advertisement and many others. In
this case I am using these three as my variables and the individual parts of it.
17 | P a g e
2.4. Importance of Advertisement on consumer perception
Though advertisement means differs, most of us would agree with the statement that,
Advertising is a non-personal paid form where ideas, concepts, products or services, and
information, are promoted through media which includes visual, verbal, and text by an identified
sponsor to persuade or influence behavior, by (Ayanwale et al., 2005 and Bovee, et al. 1995).
The behavioral concept of Consumers is based on the concept and idea that they simply decided
to purchase a product or service at the spot (Adelaar et al., 2003). The major aim of advertising is
to create positive attitude towards the ad and the brand until consumer purchases that product
and through this positive attitude create emotional response in the mind of consumer (Goldsmith
&Lafferty,2002). (Bijmolt et al., 1998) states this as the main reason for that. And as we know
that, awareness can be increased through different communication tools like PVC Banner,
Television commercial, Radio, Campaign and event etc.
Advertiser‘s introductory objective is to reach Prospective customers and influence their
awareness, attitudes and buying behavior. They spend a lot of money to keep individuals
(markets) Interested in their products. For getting the success they need to understand what
makes potential customers behave the way they do. The advertisers Goals is to get enough
relevant market data to develop accurate list of buyers-to-find the common group and signs for
communications this involves the study of consumer‘s behavior. The mental and emotional
processes and the Physical activities of people who purchase and Use goods and services to
satisfy particular needs and wants (Arens, 1996).
Proctor et al. (1982) noted that the principal aim of consumer behavior analysis is to explain why
consumers act in particular ways under certain circumstances. It tries to determine the factors
that influence consumer behavior, especially the economic, social and psychological aspects that
can indicate the most favored marketing mix that management should select. Consumer behavior
analysis helps to determine the direction that consumer behavior is likely to make and to give
preferred trends in product development, and attributes of alternatives communication method
etc.
Consumer behaviors analysis thinks the consumer as another variable in the marketing
sequence, a variable that cannot be-controlled and that will interpret the product or service not
only in terms of the physical characteristics, but in the context of this image according to the
social and psychological set up of that individual consumer or a group of them. Economic theory
18 | P a g e
has sought to establish relationships between selling prices, sales achieved and consumer‘s
income. Similarly, advertising expenditure is frequently compared with sales.
On other occasion‘s financial accounting principles maybe applied to analyze profit and loss.
Management ratios, net profit before tax, liquidity and solvency ratios can all be investigated.
Under the situations the importance of the consumer‘s motivations, perceptions, attitudes and
beliefs are largely ignored. The consumer is assumed to be ―rational‖ that means that, they will
react in the direction that would be suggested by economic theory and financial principles.
However, it is often in result that consumer behaviors do not fall directly into these expected
patterns. It is for this reason that consumer behavior analysis is conducted as yet another tool to
assess the complexities of marketing operations as per discussion of (Adeolu et al., 2005).
Advertisement is one of the effective tools of integrated marketing communication to
emotionally motivate consumers to buy the products. It also has strong linkage with
entertainment of media has entered the distinguishing lines between advertisements and
entertainment according to (Moore, 2004). Advertising is to create brand awareness, preference,
and selection of product or services. The most influencing theory in marketing and advertising
research is attitude-towards-the-advertisement. However, the attitude that is formed towards the
advertisement help in influencing consumer‘s attitudes toward the brand until their purchase
intent (Goldsmith and Lofferty,2002). Consumer buying behavior is based on the concept and
idea that they simply decided to purchase a product or service at the spot as the (Adelaar et al.
2003) stated. As the goal of effective advertising is to form positive attitude toward ad and the
brand, to increase the number of purchase, then a positive emotional response to an ad may be
the best indicator of effective advertising (Goldsmith and Lofferty, 2002). That‘s why basic aim
of advertising to encourage people to buy things and creates awareness (Bijmolt et al. 1998).
Advertising proliferate the beliefs that possessions are more important and desirable qualities
like beauty, achievement, prominence and happiness can be acquired only by material
possessions (Latif & Abideen, 2011). According to the traditional attitude theory consumer
behavior is predicted from consumer attitude when consumers buy the brand, which they like the
most.

19 | P a g e
As a promotional strategy, advertising provides a major tool in creating product awareness and
condition the mind of a potential consumer to take final purchase decision. As advertiser‘s
primary mission is to reach potential customers and influence their awareness, attitudes and
buying behavior according to (Ayanwale et al., 2005 Ayanwale et al (2005) conducted research
on advertisement of Bournvita, he found as advertising has a major influence on consumers‘
likeness for Bournvita food drink. Similar researches have already been conducted for the quality
of Bournvita.
As advertisement is a think of a sort of a mix of complex things, there are some factors that
influence the advertisement. Among them some influence directly and some other influence
indirectly.
Advertising through all mediums influence audiences, but television is one of the strongest
medium of advertising and due to its mass reach; it can influence not only the individual‘s
attitude, behavior, life style, exposure and in the long run, even the culture of the country, as per
(Latif and Abideen, 2011) stated. Advertising Research Conference which was happened in June,
there Nielsen Catalina Solutions and CBS presented a joint study that suggested the long-term
effects of television advertising could be stronger than that are originally believed. Their work
essentially updated the rule of thumb engrained in marketing analytics for a quarter century—
that the long-term sales lift from advertising is, on average, ―double‖ what occurred in the early
weeks. The so-called ―two-times‖ multiplier is used broadly to justify advertising spending;
marketers doubled the short-term effects of advertisements found in their marketing-mix models
to estimate the long-term effects. So this signifies the effect of Television commercial.
Findings from industry research (Black 2001; Briggs 2001; BusinessWeek Online 2001; shows
That banner advertising has attitudinal effects and that click through is a poor measure of
advertising response. In general, these findings are consistent with the findings of the
Academic research we discussed previously. Quite remarkably, in addition to the attitude effects
of banner advertising, we find a few studies that provide some informal evidence of its
behavioral effects as well. In this article, we use a formal model to investigate such behavioral
effects for current customers.
20 | P a g e
In the review paper of Holbrook, he has focused on the role played by content analysis on the
attitude, cognition and the purchasing behavior. Celsi in his study discussed the importance of
felt involvement for example the overall subjective feeling of personal relevance
of a consumer. Albernethy in his study showed that magazine advertisements contain more
informational content than television advertisement. Albernethy and Butler in his study showed
that newspaper advertisement were more informational than Magazine advertisements. Olson
and Reynolds and Mitchell in their study have shown how advertising works and the role of
advertising content. According to reports, it is obvious that majority of those effected with the
disease are the young people.
The use of the mass communication media therefore, is focused on reaching especially these set
of people and others too with the aim of sensitizing them. Bertrand & Anhang‘s (2006: 205-241),
highlighting the findings got from some other studies in their study, note that: based on these
findings, the authors conclude that mass media programs - particularly those that are
comprehensive - can be valuable in influencing HIV-related outcomes among young people
.They note that campaigns, which include television require the highest threshold of evidence,
yet they also yield the strongest evidence of effects. They also observe that – when comparing
interventions that use radio together with other media, on the one hand, and those that use radio
and television together with other media, on the other – for most outcomes, the two types of
interventions showed a surprisingly similar pattern... It might be tempting to conclude that radio
used with other media can produce the same results as radio and television used with other
media.

21 | P a g e
2.5. Sales promotion and consumer perception
Sales promotion has become a vital tool for marketing and its importance has been increasing
significantly over the years. One of the purposes of a sales promotion is to elicit a direct impact
on the purchase behavior of the firm‘s consumers. Firms have to rethink the relationship between
attitude and behavior of their consumers.
Sales promotions are highly effective in exposing consumers to products for the first time and
can serve as key promotional components in the early stages of new product presentation. The
purpose of this paper is to study of the effect of sales promotion on consumer interest to purchase
products of IKCO automotive company as well as Performance of sales promotion in for the
introduction of new product to consumer is studied.
(Brassington and Pettitt 2000, p. 643) provide a revised definition for sales promotions as a
range of marketing techniques designed within a strategic marketing framework to add extra
value to a product or service over and above the ‗normal‘ offering in order to achieve specific
sales and marketing objectives. This extra value may be a short-term tactical nature or it may be
part of a longer-term franchise-building program.‖
In the marketing mix Promotion is one of the key factors and has a key role in market success.
Promotion is used to make sure that consumers are aware of the products that the organization is
offering. The promotional mix is the combination of the different channels that can be used to
communicate the promotional message to the consumers. For implementing that we need to use
the channels like: advertising, direct marketing, public relations and publicity, personal selling,
sponsorship and sales promotion (Rowley, 1998). One of most important of channels is sales
promotion. Sales promotion is action-focused marketing events whose purpose is to have a direct
impact on the behavior of the firm‘s consumers. There are three major types of sales promotion
and those may include consumer promotion, retailer promotion, and trade promotion.
Consumer promotions are promotions offered by manufacturer directly to consumers (Blattberg
and Neslin 1990). Throughout the world, sales promotion offered to consumers are an integral
part of the marketing mix for many consumer products according to (Huff and Alden 1998,
Chandon et al. 2000). Studies that strive to understand the impact of sales promotion on
22 | P a g e
consumers are very important. Thus, sales promotion tools are amply employed by retailers and
manufacturers to achieve their commercial objectives in terms of sales volumes, market share,
category penetration, and so forth.
According to Low & Mohr (2000) manufacturers allocate a large amount of their total budget on
the sales promotion. They allocate around 75 percent of their marketing communication budgets
to sales promotion.(Hellman, 2005) In order to develop a successful sales promotion strategy a
clear definition of the targeted market must be included. It is important to note that the character
of sales promotion has been changing slightly over time, with the arising of relationship
marketing. Sales promotion, like other traditional forms of marketing activities, has been about
mass offer as per by the (Mitchell, H., 2000).
Sales promotions are action-focused marketing events whose purpose is to have a direct impact
on the behavior of the firm‘s consumers. There are three major types of sales promotions:
consumer promotions, retailer promotions and trade promotions. Consumer promotions are
promotions offered by manufacturers directly to consumers. Retailer promotions are promotions
offered by retailers to consumers. Trade promotions are promotions offered by manufacturers to
retailers or other trade entities (Blattberg and Neslin, 1990). The importance of sales promotion
has increased since the 1960‘s and also the sophistication of methods used.
Schultz (1998) says that, sales promotion generally works on a direct behavioral basis rather than
effecting awareness or attitude. Dwyer and Tanner (2006) states that, business consumer are
larger than individual consumer; meaning that each business consumers is more important to the
economic situation of the business marketers company. There are also few business, so each
business consumers is also more important to the economic situation of the company; unhappy
consumers can affect the business marketers business in a noteworthy way. As there the sales
promotions are getting more important day after day for proofing that as a percentage of the total
advertising and promotional budget (growth from 58% in 1976 to 72% in 1992 and increasing at
a rate of 12% per year over the last 10 years), Gardener and Treved (1998) study strive to
understand the impact of sales promotions on consumers behavior and how very important they
are.

23 | P a g e
The aim of the trade promotions, however, is usually to push products through the channel
towards the customer according to (Jobber and Lancaster, 2006). Similar to consumer
promotions, incentives are offered through extra rewards like discounts, increased margins on
sales, dealer competitions, exhibitions, provision of demonstrators and free holidays (often in the
guise of a conference or product launch). Personnel motivation is the promotions to the sales
force, but some apply to distributors and retailers. The most widely used sales force promotion is
the sales incentives scheme. Rewards are offered to participants on an equal basis which are over
and above normal sales compensation. Personal selling, according to Jobber (2001), is the
marketing task involving face-to-face contact with a customer. Unlike advertising, promotion,
sponsorship and other forms of non-personal communication, personal selling permits a direct
interaction between buyer and seller.
According to Kardes (1999), marketing manager aware of product trial and premium to
distributor related to behavioral experience of consumer toward the products. Therefore, transfer
free sample to the distributor that come as a premium take place in promotional tool. Free
sample refer to consumer are giving a free little sample of the product so that consumer have the
chance to try and use the product. The effects of the use of free sample have written by
Parmataris et al., (2001). According to Shimp (2003), free sample of product effect the
consumers buying behavior but Jackaria and Gilbert (2002) have not agree with this statement.
Discount pricing or Price promotion refers to reduction in price for a limited time, which
offered to customers. Price discount is famous tool for offering a good reduction in buying price,
which is openly mentioned on the product or point of purchase display (Fill, 2002). The
customers are more attracted to price-off promotions (Percy et al., 2001). Price promotions do
influence new product trial (Brand week, 1994). In a different study, Ehrenberg et al.(1994)
found that the short-term peaks in sales were due primarily to purchases made by occasional
users of a brand rather than by new customers According to Ehrenberg et al. (1994), the
temporary rises on sale be appropriate mostly to purchase made by infrequent user of the brands,
while they more warned to these irregular user, after winning advantages of prices reductions,
would mainly expected returns to their favorite brand in their portfolio rather than purchase
promoted brands at full prices. When we reduce product price, it play major parts in persuading

24 | P a g e
customer‘s product trial behavior and through this new customer can be attracted as per
(Blackwell, Miniard and Engel, 2001) stated.
When we come to talk about the effect of Commission on Sales and premium to distributor, it
has a serious effect on the sales towards the beverage customers. A study that is been recently
conducted by Sanjog Misra et al, examines the impact of capping salespeople‘s pay. They looked
at the compensation plan of a large U.S. contact-lens manufacturer. This company stopped
paying commissions once salespeople‘s performance reached a quota ceiling. In response, the
salespeople always held sales under the ceiling. By eliminating it and making other changes to
the compensation plan, the company kept its salespeople motivated and increased revenue by
about 9%.
A recent analysis of data on 22 Organisation for Economic Co-operation and Development
(OECD) countries from 1970-1992 concluded that comprehensive bans on advertising
promotions significantly reduce smoking, while limited bans have little or no effect, because of
this potential for shifting resources from banned activities to other marketing efforts according to
(Saffer & Chaloupka, inpress). Accordingly, there is concern that the potential impact of the
MSA billboard advertising ban may be merely to shift tobacco advertising and promotions to
other marketing efforts, including those at the point-of-purchase.
Word of mouth is the top most important sales promotion criteria. Holloway and Robinson
(2000) recognized that much communication about products actually takes place by Word-of-
mouth recommendation. Also Westbrook (1987) defined word-of-mouth as the opinion which
consumers communicate to others in an unofficial way after they have used a product or taken a
service. In the view of Bristor (1990), word-of-mouth is the approach to obtain others‘
experiences through the interaction of social network. This information communication channel
is normally thought to be more neutral and more reliable, because it is mostly generated directly
by consumers rather than by companies.
25 | P a g e
2.6: Online advertisement and consumer perception
Online advertisement is one of the three major topics undertaken by me for use. Advertising is
one component of the promotion mix commonly performed by a company which is a form of
promotion that is very instrumental in changing the image; introduce products and the interest of
consumers to buy a product. Given the importance of the company's advertising activities in
introducing new products, the company spent heavily on advertising expenses. Conditions of
tight competition makes companies use strategy in creating ads to establish a favorable position
in the market (Stoner, 2004: 12). In making the ads need to understand the direct purpose of
advertising is to create the effect of advertising because communication is a process of
communication which in turn will help the sale. Advertising is the message of a brand, product,
or company submitted to the audience through the media (SIH, 2010: 12).
Effective advertising does not just convey information, but also convey the message that will
generate a positive image for consumers. Advertising can be through a variety of media, namely
electronic media and print media. In this study will take the electronic media, especially
advertising on the internet. The development of advertising in today's world are growing rapidly
and is supported by rapid technological instrument especially internet companies the opportunity
to be selective in making advertising on the Internet to support sales. The use of the internet as a
promotional advertising today is very interesting because it is based on the development of
Internet users are very rapid and significant increase every year making the company began to
think of using the internet as a medium to promote their products (Taylor, 2007: 55). Through
the internet small, medium or large can provide product information, price, purchase terms,
ordering and payment, and delivery of goods to customers, prospective buyers, and business
partners around the world stated by the (Kleinsteurber, 2002: 30).
Internet media serves as a way to reach customers without being limited space and time, and
became popular in the world of business today. Online advertising is usually found on a website
yang made by the company that aims to promotional activities. Online advertising should be
made attractive to be able to turn away visitors last visited the site and was able to make visitors
can revisit those sites, online ads can be banners, sponsorships, pop-ups, in-stream ads,
webcasting, and a link is available at edge, top, bottom, or that suddenly appear on web pages

26 | P a g e
(Morisan, 2010: 323: 325). Therefore it is interesting to look at and investigated further aspects
of online advertising that influence attitudes and consumer interest in making a purchase online.
For that in this study adopts an online advertising model proposed by Yazer Nasdini (2012: 32)
on in making an online advertisement must have the factor content and Communicate. Factor
content in online advertising is how to design the content of the ads may attract the attention of
Internet users both in terms of appearance and layout of the ad. While factors Communicate
contains about how online advertising can provide clear and accurate information to consumers
about the product being advertised.
Internet marketing, also known as web marketing, online marketing, web advertising, or e-
marketing, is referred to as the marketing (generally promotion) of products or services over the
Internet. I marketing is used as an abbreviated form for Internet Marketing. Internet marketing is
considered to be broad in scope because it not only refers to marketing on the Internet, but also
includes marketing done via e-mail and wireless media. Digital customer data and electronic
customer relationship management (ECRM) systems are also often grouped together under
internet marketing.
Types of Internet marketing
Internet marketing is broadly divided in to the following types:
Display Advertising: the use of web banners or banner ads placed on a third-party
website to drive traffic to a company's own website and increase product awareness.
From the common sense it can be said like what we actually see on a shop.
Search Engine Marketing (SEM): Is a form of marketing that seeks to promote
websites by increasing their visibility in search engine result pages (SERPs) through the
use of paid placement, contextual advertising, and paid inclusion, or through the use of
free search engine optimization techniques.
Search Engine Optimization (SEO): the process of improving the visibility of a website
or a web page in search engines via the "natural" or un-paid ("organic" or "algorithmic")
search results.
Social Media Marketing: the process of gaining traffic or attention through social media
sites.
27 | P a g e
Email Marketing: involves directly marketing a commercial message to a group of
people using electronic mail.
Referral Marketing: a method of promoting products or services to new customers
through referrals, usually word of mouth.
Affiliate Marketing: a marketing practice in which a business rewards one or more
affiliates for each visitor or customer brought about by the affiliate's own marketing
efforts.
Content Marketing: involves creating and freely sharing informative content as a means
of converting
Advertising on the Internet started on October 27, 1994. On this date, the online version of
Wired Magazine was credited with being the TV and newspaper. ―Internet has been the clear
beneficiary of decelerating Print. Growth is driven by mobile devices which have leapfrogged
PC penetration. Online video is considered more and more by TV driven categories like FMCG
and Automobile. Paid social and rich media formats continue to keep the display market
invigorated,‖ the report said.
A social networking site is a web based service which allows people to make profiles, express or
share views with other members on the same connection, and allow them to make visible their
list of connection to others. [4](Boyed & Ellison, 2007). ―Social networking is new and relevant
for business use because it can enable employees to network with each other and exchange
knowledge‖. It is not only helpful to get in contact with employees but also helps companies to
reach out to the clients and customers (Sawyer, 2008). Therefore social networking sites can be
said to be a very beneficial tool to stay in contact with customers and employees as well.
According to an article published in The Economic Times about an ASSOCHAM survey dated
October 19th 2011,―Products like mobile phones, e-tablets, consumer electronics, gift articles,
apparel and ornaments are the major attractions for consumers who shop online‖. One of the
main reasons why customers prefer online shopping for such products is because of the large

28 | P a g e
variety of these items available in the market. The websites enables customers to search and
compare products with ease. Another important reason for the number of online shoppers to
constantly multiply is because of 24 hour open service for 360 days shopping advantage and the
home delivery of products. Shopping websites also provide discounts, vouchers and free gifts to
attract customers.
Osman et al (2010) examined the attitude forwards online purchasing behavior among Malaysian
students using purposive sampling method. The questionnaire consists of variable namely
demographic background attitude, purchase, perception and website quality. It indicated that
majority of respondents had moderate level of purchase perception and website quality towards
online purchase.
In terms of website, it is very much important.EC is defined that the process of distributing,
marketing, buying, selling or exchanging products, services and/or information including the
Internet, doing the business transactions electronically. For business-to -customer, the success of
shopping website is critical to the establishment of viable net-enabled business. B2C websites are
particularly challenging in many aspects. As the web become an increasingly essential interface,
usability study begin to focus more specifically on extending the basic usability principles into
the web environment According to Keeney.
29 | P a g e
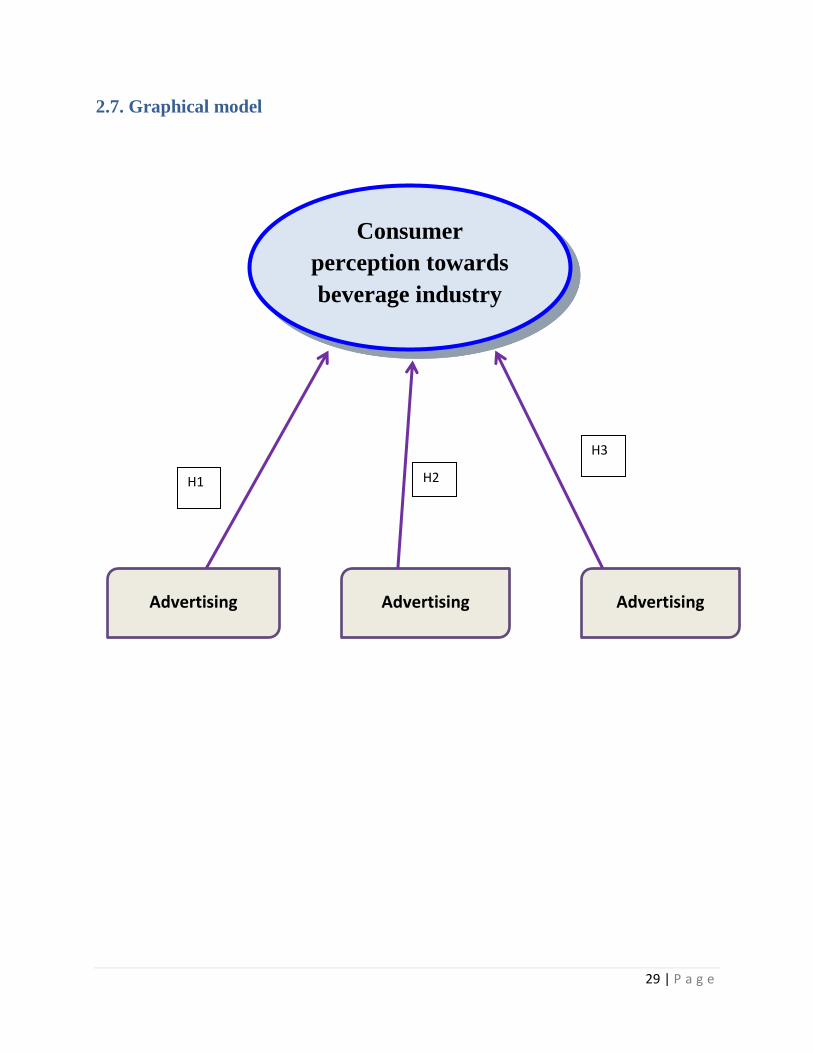
2.7. Graphical model
Consumer
perception towards
beverage industry
H1 H2
H3
Advertising Advertising Advertising
30 | P a g e
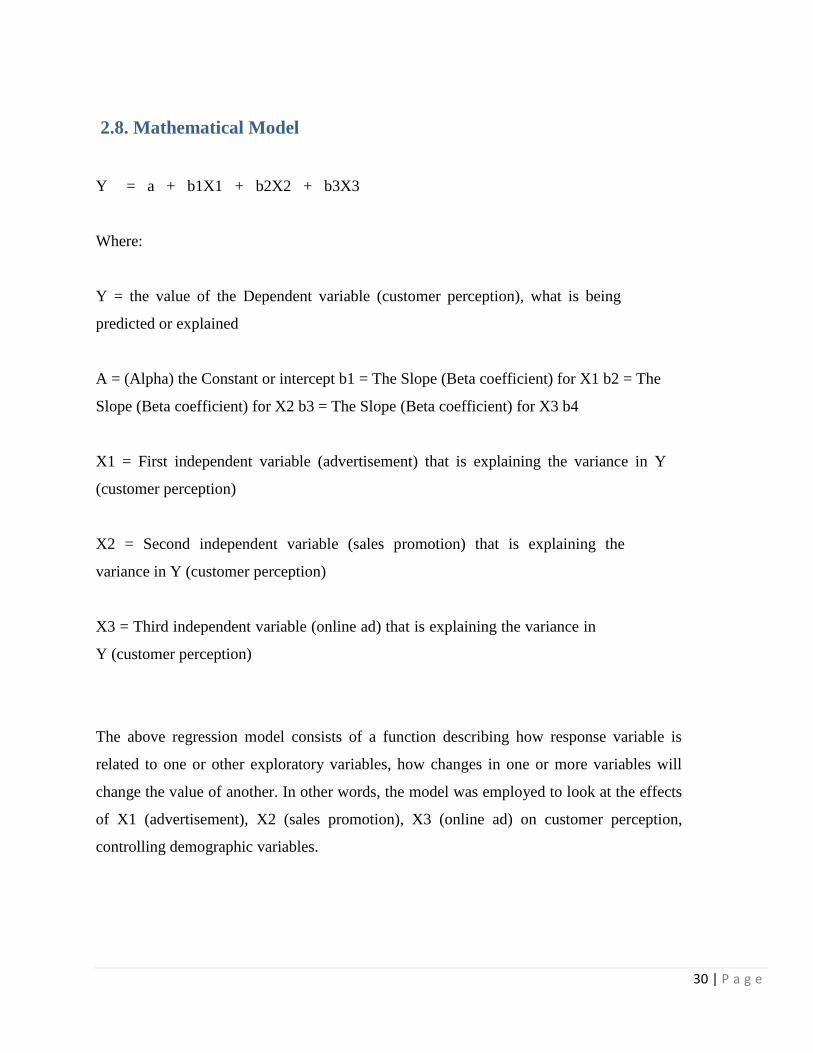
2.8. Mathematical Model
Y = a + b1X1 + b2X2 + b3X3
Where:
Y = the value of the Dependent variable (customer perception), what is being
predicted or explained
A = (Alpha) the Constant or intercept b1 = The Slope (Beta coefficient) for X1 b2 = The
Slope (Beta coefficient) for X2 b3 = The Slope (Beta coefficient) for X3 b4
X1 = First independent variable (advertisement) that is explaining the variance in Y
(customer perception)
X2 = Second independent variable (sales promotion) that is explaining the
variance in Y (customer perception)
X3 = Third independent variable (online ad) that is explaining the variance in
Y (customer perception)
The above regression model consists of a function describing how response variable is
related to one or other exploratory variables, how changes in one or more variables will
change the value of another. In other words, the model was employed to look at the effects
of X1 (advertisement), X2 (sales promotion), X3 (online ad) on customer perception,
controlling demographic variables.

31 | P a g e
2.9. Conceptual Framework
Television Commercial
Banner
Newspaper Ad
Campaign\Event
Discount Pricing
Commission on Sales
Shop Billboard
Word of Mouth
Social Network
Website
E-Mail Marketing
Display Ad
Content Marketing
Advertiseme
nt
Sales
Promotion
Online Ad
Brand Recall
Consumer Perception
Brand Feeling
Brand Recognition
Brand Image
Campaign\Event
Premium to Distributor

32 | P a g e
2.10 Research question & Hypothesis
RQ1: Does advertisement influence customer perception about the beverage industry?
H01: There is no significant relationship between customer perception and advertisement of beverage
industry.
Ha1: There is a significant relationship between customer perception and brand advertisement of
Coffee beverage industry.
RQ2: Does sales promotion of a beverage industry influences customer perception?
H02: There is no significant relationship between sales promotion of a beverage industry and customer
perception.
Ha2: There is a significant relationship between sales promotion of a beverage industry and customer
perception.
RQ3: Does online ad influences customer perception?
H03: There is no significant relationship between online ad of the beverage and customer
perception.
Ha3: There is a significant relationship between online ad and customer perception.
Conclusion
From the literature review we can find a lot of focus point onto which we can take judgment on
from the customers. Each of the factors like the advertisement, sales promotion and the online
advertisement have a lot of multifactor beneath which supports them. And from those factors and
based on consumer perception we can estimate the condition of the current beverage industry
condition in Bangladesh. And can give feedback to the industry companies about the topics they
need to focus on, need to invest more and in turn for some cases need to stop giving focus.

33 | P a g e
Chapter 3. Methodology of the Report
Introduction: For this survey based project, I have used primary data sources like the
respondents of my survey and some of the other sources like journals, articles and some
reports published on related topics.
3.1. Research Design: The research design is a descriptive research which is been used to
identify and evaluate the factors that are important for identifying the consumer perception
influential factors and their effect on beverage industry.
3.2. Data Collection: There are many related articles and journals to the topic of mine. So
I have gathered information and use them from some of the secondary sources like journal
and some articles which I will be giving reference and some primary sources will be present.
3.3. Respondent: The survey is conducted of a sample size of 150 people for data
collection purpose. That survey on different people from beverage shops, industries related
people, students and general public. Alongside that, I have also talked about it with some
people directly related with the industry corporate sector.
3.3. Data Analysis: After collecting the data, with the help of statistical software in this
case for instance Statistical Product and Service Solutions (SPSS) I have found and
interpreted the result. I did all the graph and chart with the regression part with SPSS from
the descriptive analysis. Factor analysis is done to categorizing the factors about who are
interrelated. Also the regression analysis is done to find out the hypothesis result about onto
which are to focus on and select.
3.4. Information to obtain:
Under the sample part, we will consider some factors that will help our research.
Population: people Students of EWU and people related to beverage industry
Sample Size: 150
Sampling method: Simple random sampling
Used beautifully organized question paper to find out pinpoint answers.
Conclusion: Above information‘s are the process of my survey and method that I
have used in my project paper. What are the instruments that are making it possible
here, and what are the potential respondents, I have mentioned.

34 | P a g e
Chapter 4: Research Analysis and Findings
Introduction: In my research analysis, I have basically done analysis on three factors like
descriptive, factor and regression analysis. By these different analyses, I have presented my
results by different tables, charts and graphs.
4.1. Descriptive Analysis
Frequencies
Statistics
Participants
Gender
Particip
ants Age
Participant
s education
level
Participant
s
Occupation
Participants
or family
monthly
income
Frequenc
y of
buying
Money
spending
on
buying
N Vali
d
150 150 150 150 150 150 150
Mis
sing
0 0 0 0 0 0 0
Mean 1.37 2.41 3.17 2.62 3.13 2.23 2.13
Median 1.00 2.00 3.00 3.00 3.00 2.00 2.00
Mode 1 2 3 3 4 2 2
Std.
Deviation
.485 .963 .951 1.047 1.273 .956 1.032
Variance .236 .927 .905 1.096 1.620 .915 1.064
Minimum 1 1 1 1 1 1 1
Maximum 2 5 5 5 6 4 4
From the frequency table, we can see the result from the demographic factors. Their valid
percentage, the respondent‘s average of the factors that is mean, their median and mode. Also
the standard deviations and the variance. The maximum the respondents range and the
minimum of those.

35 | P a g e
Frequency table And Graph
i. Gender
Participants Gender
Frequency Percent Valid
Percent
Cumulative
Percent
Valid Male 94 62.7 62.7 62.7
Female 56 37.3 37.3 100.0
Total 150 100.0 100.0
From the graph and the table of the sex of the genders, we can see that, among all the
respondents 94 of them were male comprises of 62% approximately and 56 were the female
comprises of 37% approximately on whom I did survey.
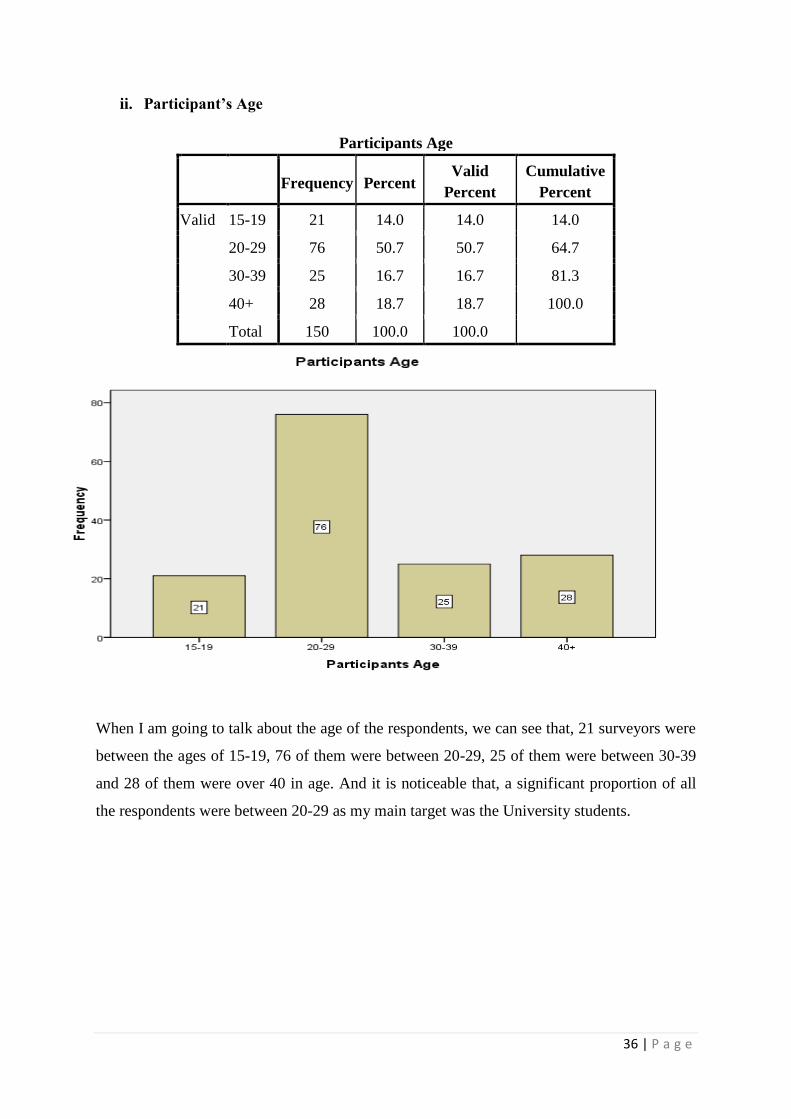
36 | P a g e
ii. Participant’s Age
Participants Age
Frequency Percent
Valid
Percent
Cumulative
Percent
Valid 15-19 21 14.0 14.0 14.0
20-29 76 50.7 50.7 64.7
30-39 25 16.7 16.7 81.3
40+ 28 18.7 18.7 100.0
Total 150 100.0 100.0
When I am going to talk about the age of the respondents, we can see that, 21 surveyors were
between the ages of 15-19, 76 of them were between 20-29, 25 of them were between 30-39
and 28 of them were over 40 in age. And it is noticeable that, a significant proportion of all
the respondents were between 20-29 as my main target was the University students.

37 | P a g e
iii. Participants Education Level
Participants education level
Frequency Percent
Valid
Percent
Cumulative
Percent
Valid Secondary level 6 4.0 4.0 4.0
Higher secondary
level
23 15.3 15.3 19.3
Undergraduate 77 51.3 51.3 70.7
Post graduate 28 18.7 18.7 89.3
Others 16 10.7 10.7 100.0
Total 150 100.0 100.0
When it comes to the term of the educational level of the respondents, it is found that, 6
respondents were in secondary level, 23 of them were in higher secondary level, 77 of them
were undergraduate, 28 of them were post graduate and respondents who found themselves in
other criteria were 16 in the number. Here also it is clear from the education level that, 20-29
age groups of people generally are in undergraduate level.

38 | P a g e
iv. Participants Occupation
Participants Occupation
Frequency Percent
Valid
Percent
Cumulative
Percent
Valid Private
employee
32 21.3 21.3 21.3
Govt employee 19 12.7 12.7 34.0
Student 79 52.7 52.7 86.7
Bussinessmen 14 9.3 9.3 96.0
Others 6 4.0 4.0 100.0
Total 150 100.0 100.0
From the table and the bar chart, we can see that, 32 peoples were doing job as private
employee, 19 of the respondents were government employee, and 79 of them were students
as they don‘t do any job yet, 14 of them were businessmen and 6 of the people were fall in
the categories other than the mentioned.

39 | P a g e
v. Participants or Family’s Monthly Income
Participants or family monthly income
Frequency Percent
Valid
Percent
Cumulative
Percent
Valid 10000-20000 18 12.0 12.0 12.0
20000--30000 32 21.3 21.3 33.3
30000-40000 37 24.7 24.7 58.0
40000-50000 39 26.0 26.0 84.0
50000+ 24 16.0 16.0 100.0
Total 150 100.0 100.0
From the graph, we can see that, 12% people fall In in the income level of between 10000-
20000, 21.33% peoples income is between 20000-30000, respondents of 24.67% fall
between 30000-40000 income range, 26% of hem fall between 40000-50000 income range
and the rest 16% peoples income is crossing 50000 taka mark.
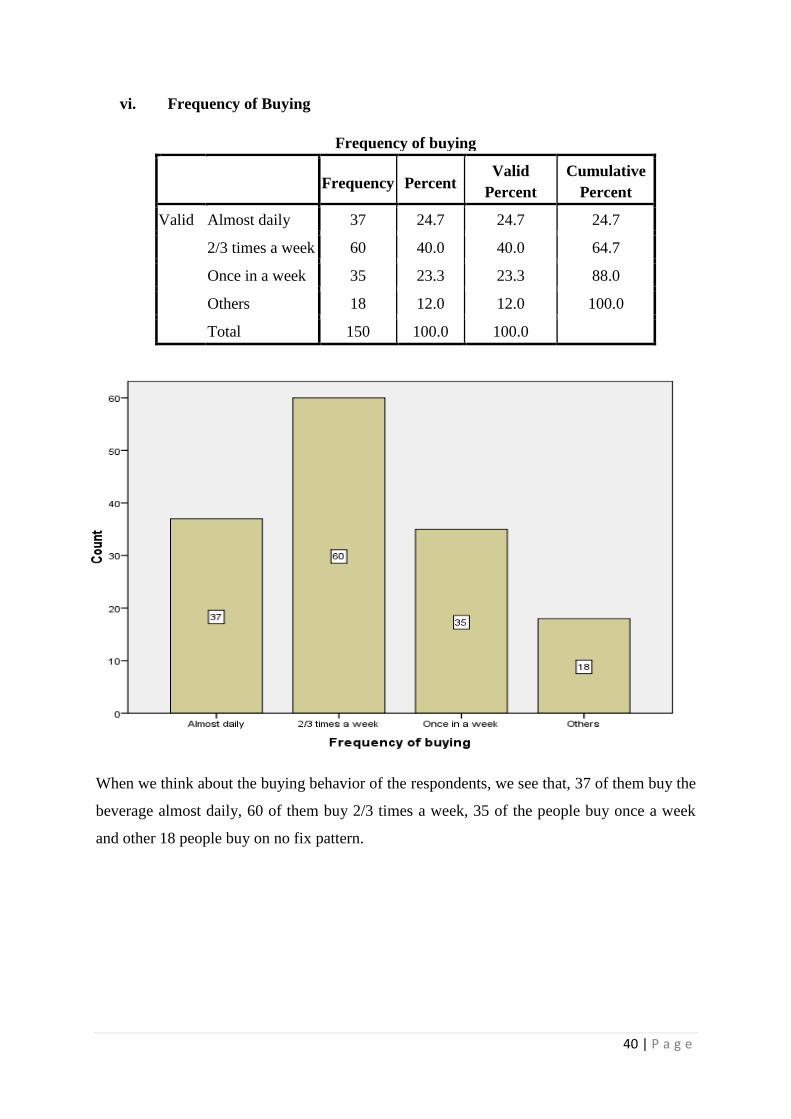
40 | P a g e
vi. Frequency of Buying
Frequency of buying
Frequency Percent
Valid
Percent
Cumulative
Percent
Valid Almost daily 37 24.7 24.7 24.7
2/3 times a week 60 40.0 40.0 64.7
Once in a week 35 23.3 23.3 88.0
Others 18 12.0 12.0 100.0
Total 150 100.0 100.0
When we think about the buying behavior of the respondents, we see that, 37 of them buy the
beverage almost daily, 60 of them buy 2/3 times a week, 35 of the people buy once a week
and other 18 people buy on no fix pattern.
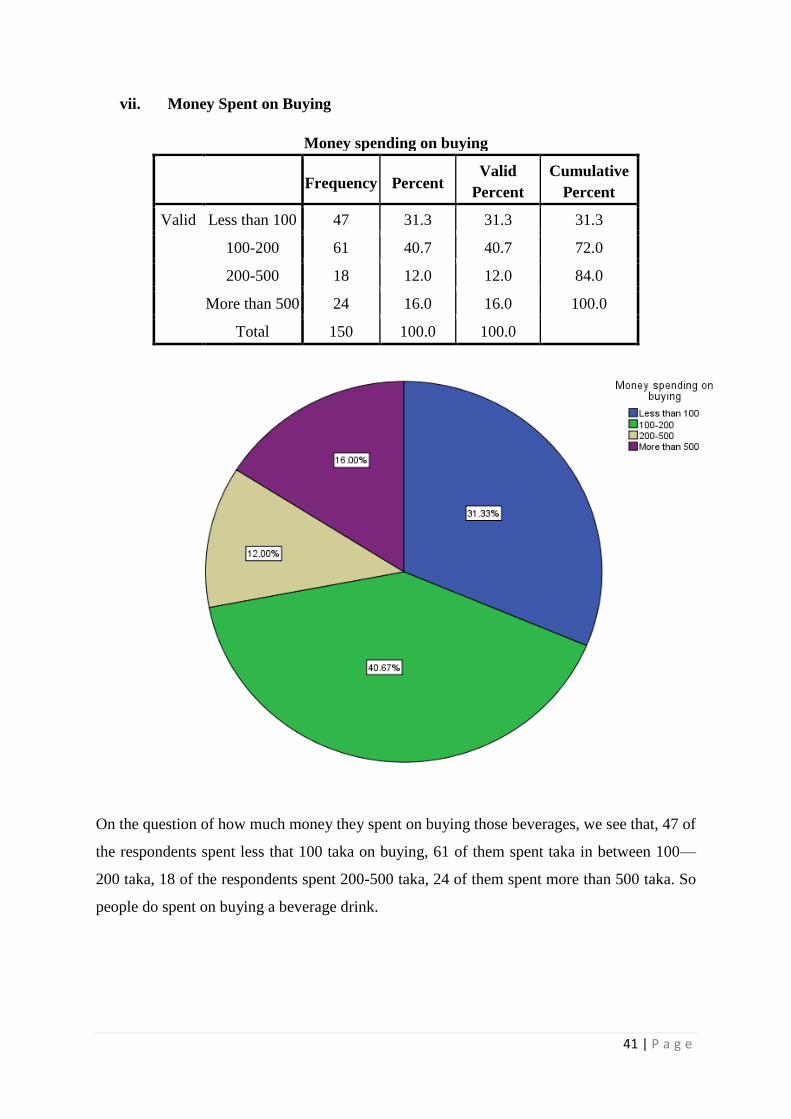
41 | P a g e
vii. Money Spent on Buying
Money spending on buying
Frequency Percent
Valid
Percent
Cumulative
Percent
Valid Less than 100 47 31.3 31.3 31.3
100-200 61 40.7 40.7 72.0
200-500 18 12.0 12.0 84.0
More than 500 24 16.0 16.0 100.0
Total 150 100.0 100.0
On the question of how much money they spent on buying those beverages, we see that, 47 of
the respondents spent less that 100 taka on buying, 61 of them spent taka in between 100—
200 taka, 18 of the respondents spent 200-500 taka, 24 of them spent more than 500 taka. So
people do spent on buying a beverage drink.

42 | P a g e
4.2 Factor Analysis
4.2.1. Reliability
Case Processing Summary
N %
Cases Valid 150 100.0
Excludeda 0 .0
Total 150 100.0
a. List wise deletion based on all variables in the
procedure.
Reliability is done to categorizing the factors to find out that, which factors are related to
what.
From my test of reliability, the value of the Cranach‘s Alpha shows the result of .751 which
is far more than the standard result of .60, so we can proceed with this reliability. So it
indicates that, the factors are quite a bit related to each other.
Reliability Statistics
Cronbach's
Alpha N of Items
.751 23

43 | P a g e
4.2.2. KMO and Bartlett’s Test
KMO and Bartlett's Test
Kaiser-Meyer-Olkin Measure of Sampling
Adequacy.
.627
Bartlett's Test of
Sphericity
Approx. Chi-Square 122.115
df 36
Sig. .000
From this KMO and Bartlett‘s test, we can see that, the value of the significant level that is
denoted by sig in the table is .000 which is far less than the value of .05 which is the measure
with which we compare. So the result from this KMO and Bartlett‘s test, we can say that, the
respondents are educated enough to answer the questionnaire carefully.
4.2.3. Communality
Communalities
Initial Extraction
Consumer perception 1.000 .465
Brand recall 1.000 .617
Brand feelings 1.000 .598
Advertisement 1.000 .709
TVC effect 1.000 .635
Shop Billboard 1.000 .669
Word of mouth 1.000 .665
Online advertisement 1.000 .648
Content marketing 1.000 .582
Extraction Method: Principal Component Analysis.
Here we can see that, in the communality box, one value that is been red marked which
indicates that, it is not that much of a good item to measure. And all the other values are more
than .50, so they are quite good for the analysis.

44 | P a g e
4.2.4. Total Variance Explained
Here we can see that, in the initial eigenvalue, total 4 factors have the value over 1. So these
are the factors to count for. And also in the Rotation sum square loading, the value in the
cumulative % is more than 60%, so it is perfectly all right.
Total Variance Explained
Com
pone
nt
Initial Eigenvalues
Extraction Sums of Squared
Loadings
Rotation Sums of Squared
Loadings
Total
% of
Variance
Cumulativ
e % Total
% of
Variance
Cumulati
ve % Total
% of
Variance
Cumulati
ve %
1 2.133 23.697 23.697 2.133 23.697 23.697 1.729 19.216 19.216
2 1.306 14.507 38.204 1.306 14.507 38.204 1.393 15.482 34.699
3 1.102 12.246 50.450 1.102 12.246 50.450 1.257 13.969 48.668
4 1.046 11.623 62.073 1.046 11.623 62.073 1.206 13.405 62.073
5 .895 9.949 72.023
6 .753 8.365 80.388
7 .690 7.666 88.054
8 .553 6.140 94.194
9 .523 5.806 100.000
Extraction Method: Principal Component Analysis.

45 | P a g e
4.2.5 Rotated Component Matrix
Earlier
Rotated Component Matrixa
Component
1 2 3 4 5 6 7 8
Consumer
perception
.707
Brand recall .657
Brand feelings .712
Brand image .766
Brand recognition .758
Advertisement .591
TVC effect .662
Banner .539
Newspaper ad .439
Campaign or event .404
Radio ad .677
Sales promotion .714
Discount pricing .693
Commission on sales .447 .457
Shop Billboard .454 .598
Word of mouth .681
Premium to
distributor
.640
Online
advertisement
Social network .428 .435
Website .461
E mail marketing .604
Display
advertisement
.780
Content marketing .482 .456
Extraction Method: Principal Component Analysis.
Rotation Method: Varimax with Kaiser Normalization.
a. Rotation converged in 24 iterations.
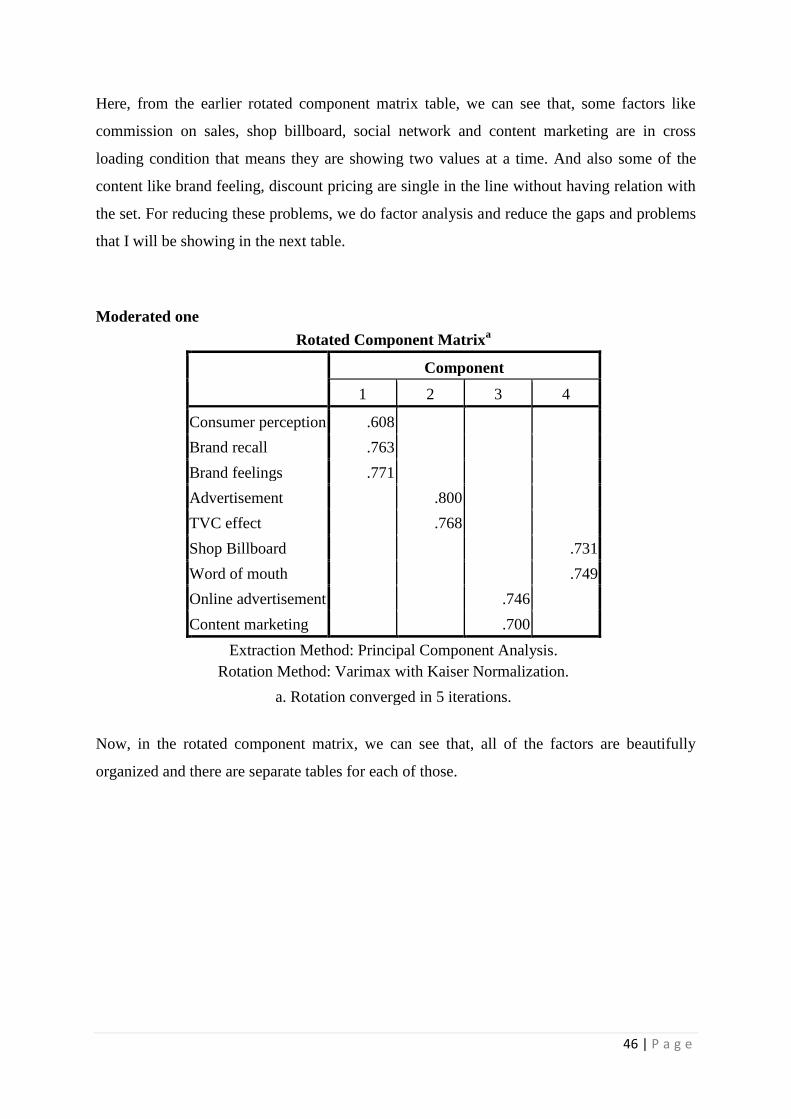
46 | P a g e
Here, from the earlier rotated component matrix table, we can see that, some factors like
commission on sales, shop billboard, social network and content marketing are in cross
loading condition that means they are showing two values at a time. And also some of the
content like brand feeling, discount pricing are single in the line without having relation with
the set. For reducing these problems, we do factor analysis and reduce the gaps and problems
that I will be showing in the next table.
Moderated one
Rotated Component Matrixa
Component
1 2 3 4
Consumer perception .608
Brand recall .763
Brand feelings .771
Advertisement .800
TVC effect .768
Shop Billboard .731
Word of mouth .749
Online advertisement .746
Content marketing .700
Extraction Method: Principal Component Analysis.
Rotation Method: Varimax with Kaiser Normalization.
a. Rotation converged in 5 iterations.
Now, in the rotated component matrix, we can see that, all of the factors are beautifully
organized and there are separate tables for each of those.

47 | P a g e
4.3 Regression Analysis
Regression analysis is done to find out effect of independent variable on dependent variable
and relative importance of each and every variable.
4.3.1. Model Summary
Here, we can see that, the R value is .267 which is more than .20 that is standard, So it
indicates that, In terms of consumer perception, the independent variables are important. So
these independent variables are showing 30% of total dependent variable each.
4.3.2. Anova Table
ANOVAb
Model
Sum of
Squares df
Mean
Square F Sig.
1 Regression 4.287 3 1.429 3.725 .013a
Residual 56.001 146 .384
Total 60.288 149
a. Predictors: (Constant), OA, SP, AD
b. Dependent Variable: CP
Here, we can see that, the significance level is .013 that is less than the .05 scale, so I can
move forward with my analysis. As with 95% confidence interval we get the value, so will
take this result. And here f value is significant in 3 df.
Model Summary
Model R R Square Adjusted R
Square
Std. Error of
the Estimate
1 .267a .071 .052 .61933
a. Predictors: (Constant), OA, SP, AD
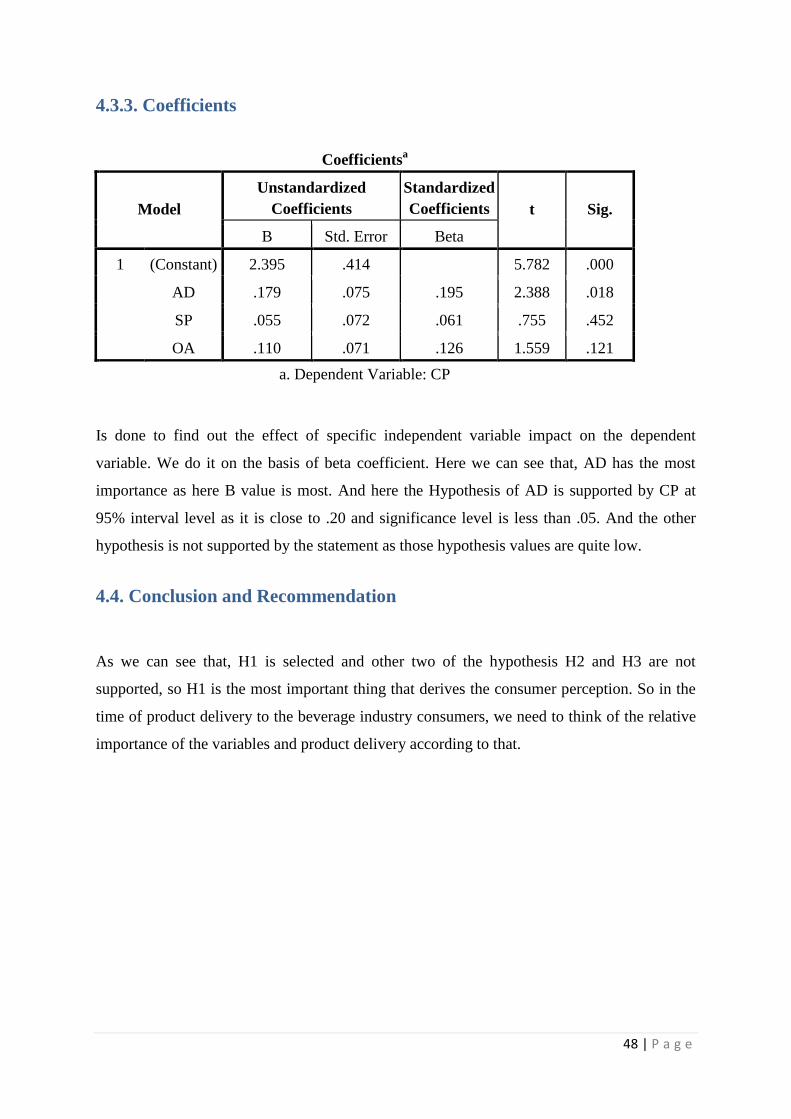
48 | P a g e
4.3.3. Coefficients
Coefficientsa
Model
Unstandardized
Coefficients
Standardized
Coefficients t Sig.
B Std. Error Beta
1 (Constant) 2.395 .414 5.782 .000
AD .179 .075 .195 2.388 .018
SP .055 .072 .061 .755 .452
OA .110 .071 .126 1.559 .121
a. Dependent Variable: CP
Is done to find out the effect of specific independent variable impact on the dependent
variable. We do it on the basis of beta coefficient. Here we can see that, AD has the most
importance as here B value is most. And here the Hypothesis of AD is supported by CP at
95% interval level as it is close to .20 and significance level is less than .05. And the other
hypothesis is not supported by the statement as those hypothesis values are quite low.
4.4. Conclusion and Recommendation
As we can see that, H1 is selected and other two of the hypothesis H2 and H3 are not
supported, so H1 is the most important thing that derives the consumer perception. So in the
time of product delivery to the beverage industry consumers, we need to think of the relative
importance of the variables and product delivery according to that.
49 | P a g e
4.5. Questionnaire
Factor affecting consumer perception:
Beverage industry in BD perspective
Questionnaire
Regard:
Md.Shultanuzzaman
ID: 2012-1-10-124
Dear respondent, I am the student of East West University from BBA department. I am
conducting a research to identify the ―Factor affecting consumer perception: Beverage
industry in BD perspective”. Please spare some time to answer the following questions. The
information provided by you is purely for academic research purposes and will be kept strictly
confident.

50 | P a g e
Part A
Demographic Variables:
1. Gender:
a. Male b. Female
2. Age:
A.15-19 b. 20-29 c. 30-39 d. 40+
3. Education:
a. Secondary level b. Higher Secondary level c. Undergraduate
d. Post Graduate e. Others
4. Occupation:
a. Private employee b. Government employee c. Student d. Businessmen
e. Others………… (Please specify)
5. Family/Monthly income(tk):
a. 10000-20000 b. 20000-30000 c. 30000-40000 d.40000-50000 e.50000+
6. How often do you take a Beverage?
a. Almost Daily b. 2/3 times a week c. Once in a week
d. Others…………..
7. How much money do you usually spend on a beverage?
a. less than 100 b. 100-200 c. 200-500
d. more than 500

51 | P a g e
Part B
Statements Strongly
Disagree
Disagr
ee
Neutral Agree Strongly
Agree
I think that favorable consumer perception acts as a
decider for beverage buyers
CP
Consumer can recall the brand if there is a good
consumer perception in my opinion
My brand feeling can be influenced by consumer
perception
Brand image of the beverages can be improved by good
consumer perception by me
I will be able to recognize the brand easily if there is
good perception of the beverage industry
I think Advertisement is the major source of
communication tools that influences consumer perception
AD
In my opinion, television commercial is the most
common source of advertisement makes the audience
bound to see the advertisement.
Banner is a transport based advertisement that catches
the customer‘s eye on road or some busy area.
Newspaper advertisement can pinpoint the beverage
brand in consumers mind as all customer group read this
on my opinion.
I think, Campaign or event helps catching attraction of
the potential beverage buyer.
Radio advertisement has long reach and its humorous
presentation increases consumer perception as per I think.
In deriving consumer perception towards beverage
industry, I think Sales promotion is another very good
marketing communication tools.
SP
I think, customers like Discount pricing more than any
other offer.
Commission on sales motivate seller to try and increase
Please put a tick mark () in the appropriate box regarding the respective factor ranging from
1-5 scale, where 1 stands for Strongly Disagree & 5 stands for Strongly Agree:

52 | P a g e
consumer perception in my opinion.
Shop billboard can be major marketing tools in
gathering tea stalls or other places.
I think, Word of Mouth can reduce misconception and
improve consumer perception.
Offering premium to distributor will increase the
chance of enjoying good perception of the customers
done by seller.
I think, Online advertisement is a modern and exciting
source of communication tools that has an influence on
consumer perception.
OA
Social network is the lower cost communication media
and the most common source of online advertisement that
can effect on a large consumer market of beverage, I
think.
Websites with a solid information base can increase
consumer perception by providing accurate information
of the market in my opinion.
I think, E mail Marketing can be a boring but effective
source of marketing tools giving specialized offer and
increasing perception.
I think, Awareness of the consumers will increase by
Display Advertisement.
Content Marketing will have an effect on Brand
Knowledge and consumer perception.
53 | P a g e
References
Brosekhan, A. Abdul, and C. Muthu Velayutham. "RAPID CHANGE IN
CONSUMER BUYING BEHAVIOUR-A BIG CHALLENGE FOR SUSTAINABLE
GROWTH OF TODAY‘S BUSINESS."
Li, Xun, and Rigoberto A. Lopez. "Do Brand Advertising Spillovers
Matter?."Agribusiness 31.2 (2015): 229-242.
Li, Xun. "Three Essays in the Economics of Food Marketing." (2014).
Islam, Nazrul. "A Multivariate Analysis of the Selection Factors of Carbonated Soft
Drinks In Bangladesh."
Nisar, Waqar. "Influences of Consumer Behavior: Research about Beverage Brands
of Pakistan." International Journal of Academic Research in Business and Social
Sciences 4.8 (2014): 137-146.
Niazi, Ghulam Shabbir Khan, et al. "Effective advertising and its influence on
consumer buying behavior." Information management and business review 4.3
(2012): 114-119.
Muehling, Darrel D., and Russell N. Laczniak. "Advertising's immediate and delayed
influence on brand attitudes: Considerations across message-involvement
levels." Journal of advertising 17.4 (1988): 23-34.
Ikenna Ofoegbu, Donald, and Etokakpan Mfonobong Udom. "The Impact of Sales
Promotion on Sales: A Case of Select Telecommunication Firms in Nigeria." IUP
Journal Of Marketing Management 12.2 (2013).
Iqbal, Nadeem, et al. "ROLE OF SALES PROMOTION ON SALES VOLUME IN
THE CONTEXT OF FAST MOVING CONSUMING GOODS (FMCG) INDUSTRY
IN DERA GHAZI KHAN."
Kardes, Frank R., and Joel H. Steckel. Consumer behavior and managerial decision
making. Reading, MA: Addison-Wesley, 1999.
Meo, Adeel, et al. "The Impact of Promotional Tools on Sales Promotion."Journal of
Public Administration and Governance 4.2 (2014): Pages-202.
Chaharsoughi, Shahriar Ansari, and Tahmores Hasangholipor Yasory. "Effect of sales
promotion on consumer behavior based on culture." African Journal of Business
Management 6.1 (2012): 98-102.
Ogutu, R. P., M. Ogutu, and L. Njanja. "The effect of internet advertising on attitude
towards internet advertising of university students in Kenya." (2014).

54 | P a g e
Jayakumar, Mr P. "Attitude of Consumer towards Internet Shopping in Chennai City."
Kumar, Prerna, and Mahendra S. Rawat. "A Study on Customer Perceptions towards
Online Promotions." EDITORIAL ADVISORY BOARD: 117.
Amaidas, Shayna, and Nigel Chiweshe. "Youth Consumer Behaviour: A Case of
Beauty Product Consumption." J Soc Sci 43.1 (2015): 1-8.
Oladepo, ONIGBINDE Isaac, and ODUNLAMI Samuel Abimbola. "THE
INFLUENCE OF BRAND IMAGE AND PROMOTIONAL MIX ON CONSUMER
BUYING
DECISION-A STUDY OF BEVERAGE CONSUMERS IN LAGOS STATE,
NIGERIA." British Journal of Marketing Studies 3.4 (2015): 97-109.
Yu, Shih-Yi. "Measuring Brand Value through Adoption and Use of Social Media: A
case of Taiwanese Global Brands." Xing Xiao Ping Lun 11.2 (2014): 175.
Wood, L., and D. Poltrack. "Measuring The Long-Term Effects Of Television
Advertising." Journal of Advertising Research (2015).
Bansal, Mohit, and Shubham Gupta. "Impact of Newspaper Advertisement on
Consumer Behavior." Global Journal of Finance and Management 6.7 (2014): 669-
674.
Utulu, Anthony U. "The Effects of Advertisement Messages: The Case of HIV and
AIDS Awareness Campaign in Nigeria." Journal of Biology, Agriculture and
Healthcare 1.1 (2011): 13-26.
Steenburgh, Thomas, and Michael Ahearne. "Motivating salespeople: what really
works." Harvard business review 90.7-8 (2011): 70-5.
Eze, Felix John, Justie Nnabuko, and Aniebiet Etuk. "An evaluation of e-word-of-
mouth communication on brand equity in Cross River State, Nigeria."