factors affecting soil phosphate distribution and reactions in cape forest soils
TRANSCRIPT

Scientific paper
Factors Affecting Soil Phosphate Distribution and Reactions inCape Forest Soils
T.W. Payn' and M.E. Clough
Saasveld Forestry Research Centre,Private Bag X6515
George 6530
SYNOPSIS
The amounts of various forms of phosphate in some Cape soils and the adsorption of phosphate by these soilswere investigated. The levels were low and only 2 % was in available form. The major fraction of phosphate inthe soil was organic phosphate. Aluminium phosphate and iron phosphate were the next largest fractions.Aluminium phosphate concentrations were related to soil organic carbon, and iron phosphate concentrationsto clay and silt content.
Adsorption of phosphate was low to moderate and was correlated to organic carbon, pH in sodium fluorideand fine silt content. In these soils, exchange sites associated with the fine silt fraction seem to be moreimportant to phosphate adsorption than those associated with the clay fraction. The amount of phosphatefertiliser calculated from buffering capacity was lower than the current recommended rate for most of the soilstested.
From these studies fixation of phosphate does not appear to be a major problem in plantation soils in theCape regions; loss of phosphate owing to leaching from coarse textured soils is likely to be a greater problem.Keywords: Soil chemistry, Phosphate, Phosphate adsorption, Phosphate compounds, Forestry
INTRODUCTION
Most of the pine plantations in the Cape are on verypoor soils derived from Table Mountain Group quartzites and sandstones with some smaller areas of shales.The soils are therefore of low inherent nutrient status.By far the most important nutrient shortage is of phosphate (Schutz, 1976). Pinus radiata suffers from a lackof this element, as does P. elliottii to a lesser extent.Much lower growth rates are found on phosphate deficient sites than on sites with adequate phosphate levels. Work on fertilisation of these two species hasshown excellent growth responses to phosphate,(Lange, 1974; Donald, Schutz, Lange and Morris,1984) - consequently the local forestry industry is beginning to rectify the low soil phosphate levels in newand existing stands oftrees.
Results from research field trials have allowed delimitation of responsive and non-responsive sites (Paynand Clough, 1988). This delimitation is based mainlyon soil physical properties such as effective rootingdepth and moisture regime. However, within the responsive sites there has been a noticeable variation inthe magnitude of response. The reasons for this arelikely to be varied; there may be physical limitations(for example drought) on the amount of response, orthere may be variations owing to effects of the soil onthe phosphate fertiliser itself.
24
The Cape has two potential problems with regard tophosphate addition: leaching of applied P on the coarsesandy soils of the Western Cape (Donald, pers.comm., 1987), and fixation or retention of appliedphosphate on heavier textured highly acid soils wherethe phosphate can become locked up in forms unavailable to the plant (Tan, 1982). This latter problem islikely to be most noticeable when phosphate is appliedat the time of planting where nutrients are needed toget the tree "away" rapidly, to out-compete surrounding vegetation for moisture and nutrients. Phosphatebeing removed rapidly from the soil solution by fixation effectively reduces the applied phosphate immediately available to the tree.
At this stage we have little idea of the forms andlevels of phosphate in our plantation soils - apart fromthe so-called "available" Bray 2 concentrations. Wealso have little information on the reaction of phosphate with the soil and the dominant processes affecting it. To fully understand why we get varied responses we need to understand the dynamics of the systemas regards the addition of phosphate; how much is
* Present address: School of Forestry, University ofCanterbury, Christchurch 1, NewZealand
South African Forestry Journal- No. 150, September 1989

fixed, how much is likely to be leached, and howavailable is the fixed phosphate to the plant in the shortand long term.
The aim of this paper is to describe levels and distribution of the various forms of phosphate in a rangeof plantation soils and to determine how added phosphate reacts with these soils.
MATERIALS AND METHODS
Sixteen topsoil (0-200 mm depth) samples were selected from soils collected during a number of sitesurveys of plantations in the Cape Region. Sampleswere selected to cover the range of clay and organic
ararcer: conceaL" HIZc7 base sarur.r-.a;f€7.L7 fG"U'.J7d';O .s0;.J so~p-
les in plantation soils in the Cape forest regions basedon information obtained from surveys of the Tsitsikamma Key Area, the Kruisfontein Key Area and theGrabouw Key Area.
These are areas chosen for intensive soil surveys asbeing representative of the regions as a whole (Grey,Jacobs, Robertson and Schafer, 1988).
The soils, classified according to the S.A. Binomialsystem (MacVicar et al., 1977), included Cartref, Oakleaf, Pinedene, Westleigh, Houwhoek and Vilafontesforms. All topsoils have been classified as orthic diagnostic horizons, which are horizons with no dominantorganic, humic, vertic or melanic character.
The <2 mm fine fraction of the air-dried sampleswas used for the study. General physical and chemicalanalysis using the standard methods of the SaasveldForestry Research Centre Laboratory included particlesize analysis by the pipette method (Coventry and Fett,1979) with dry sieving for the sand fractions. Organicmatter was removed prior to analysis and dispersionwas done with sodium hexametaphosphate solution.
Chemical analysis included pH measured in bothwater and IN KCI at a soil: solution ratio of 1:2,5.Concentration of basic cations was measured usingunbuffered 0,5N NH4CI extractant with a shaking timeof 30 minutes. The pH of this extractant is similar tothe average pH of the saturated soil solution of forestsoils. Exchangeable acidity and aluminium were determined by titration of a IN KCI extract with NaOH(Black, 1965). Organic carbon was determined by theWalkley Black method (Jackson, 1958). Availablephosphorus was determined by the amino-naphthol-sulphonic acid/molybdenum blue method (Jackson, 1958)on a Bray No.2 extraction which is a common measureof available phosphorus in plantation soils (Ballard,1974).
Potassium and sodium concentrations were determined by flame photometer and calcium by atomicabsorption spectroscopy. Magnesium was determinedcolorimetrically using a magnesium blue method(Technicon Autoanalyser methods, 1979).
In addition to this basic analysis more specific techniques were used to meet the aims of this study. Thephosphorus in the soil was fractionated into soluble,iron, aluminium, calcium, and occluded iron and alu-
Suid-Afrikaanse Bosboutydskrif- nr. 150, September 1989
minium forms according to the method of Chang andJackson (1956). The total phosphorus was determinedon a perchloric acid digest (Bray and Kurtz, 1945) andorganic phosphorus expressed as the difference between the total (perchloric) and the sum of the mineralfractions. Analyses were carried out in triplicate. Standard samples were included in each batch of samplesanalysed.
Analysis of iron and aluminium fractions was carriedout using the sequential extraction proposed by Driscoll, Van Bremen and Mulder (1985). Available ironand aluminium was extracted by shaking for four minues with IN KCI; this was followed by extraction for 16hours with O,IN sodium pyrophosphate adjusted to pH10, extraction for three hours with 0,2N ammonium
oxalate tottowca'; wL-th riaaf c;xcracCron JYrrn buffc~cd
citrate dithionate (McKeague and Day, 1966). Thesefractions correspond to exchangeable, organic, amorphous and crystalline forms of Fe and Al in the soil.Iron and aluminium concentrations in all extracts except KCI aluminium were determined by atomic absorption spectroscopy, the KCI extract was analysedcolorimetrically using the aluminon method (Black,1965). The pH in sodium fluoride, which is an indirectmeasure of amorphous aluminium, was measured at asoil: solution ratio of 1:50 (Fieldes and Perrott, 1966).
The reaction of the soil to added phosphate wasstudied using adsorption isotherms, constructed byequilibrating 1 g samples with a range of 0-25 mgle P,as KH2P04, for eight hours on a reciprocating shaker.The ambient temperature was 20°C ±1 "C. Phosphorus in the solution was determined colorimetrically bythe amino-naphthol-sulphonic acid/molybdenum bluemethod (Jackson, 1958), and the amount of phosphateadsorbed was calculated.
Statistical analysis involved correlation analysis usingthe SAS package (SAS Institute, 1988) to determinefactors affecting phosphate levels and reactions. Stepwise multiple regression analysis (STSC Inc., 1986) wasused to determine the best models for prediction ofphosphate characteristics, the significance level forentry into the model was set at P = 0,5 and the levelnecessary to retain a variable in the model was 0,15.
RESULTS AND DISCUSSION
Soil properties
The analytical results (Table 2) are representative ofthe range of conditions found in plantation soils in theCape. Topsoils are not normally very heavy textured,though silt contents are often high, especially in areassuch as the Tsitsikamma, where soil has formed insurficial fine sediments. Soils are generally acid: themean pH in water is 4,64. Nutrient levels are low; onmost sites the exchange complex is acid dominated andpodzolisation, caused by the high rainfall (up to 1 500mm/a) and acidic litterfall, is a major process (Hawker,1986). The Bray 2 phosphorus concentration is verylow compared to agricultural soils (mean = 1,76
25

TABLE 1. Summarised physicial and chemical data for the sixteen topsoils used in the study
Variable Minimum Maximum Mean Std. deviation
Coarse ° 13,0 4,4 3,7Sand Medium 2,0 26,0 11,5 7,8
Fine 3,0 28,0 12,4 7,4Very fine 1,0 10,0 5,0 2,8
Silt Coarse 11,0 50,0 31,5 10,4Fine 11,0 41,0 22,6 8,3
Clay 0,0 40,0 12,6 9,9
pH(H2O) 3,35 5,34 4,64 0,62
pH(KCI) 2,33 4,32 3,63 0,57
pH(NaF) 6,86 10,39 8,62 1,01
Organic carbon (% ) 0,43 6,88 2,59 1,48
Cameq/lOO g 0,004 3,61 0,81 1,01
Mgmeq/lOOg 0,008 2,01 0,61 0,57
Kmeq/100 g 0,023 0,314 0,10 0,08
Nameq/100 g 0,034 0,46 0,21 0,13
Almeq/lOOg 0,22 4,32 1,69 1,24
Exch. acidity meq/100 g 0,36 5,66 2,14 1,45
S Value meq/100 g 0,15 5,02 1,59 1,43
T Value meq/100 g 1,37 7,61 3,87 1,61
Base Saturation (%) 3,85 81,77 40,07 28,85
mg/kg) and this reflects the original state of most soilsin the region. (The forestry industry has only recentlystarted to add phosphate fertilisers to sites.)
The more detailed analysis of the phosphate contentof the samples shows that the available phosphate,
measured in the Bray 2 extract is approximately 2 % ofthe total phosphate content. The mean results of thefractionation according to Chang and Jackson (1956)and the total phosphate and Bray 2 levels are shown inTable 2.
TABLE 2. Summarised phosphate fractions for the sixteen topsoils used in the study
Phosphate fraction (mg/kg) Minimum Maximum Mean Std. deviation
Soluble 0,40 3,40 1,61 0,84Bray 2 0,00 4,70 1,76 1,20Aluminium 3,97 65,67 20,40 14,39Iron 4,87 21,13 9,41 4,25Calcium 1,30 4,23 2,49 0,96Occluded aluminium 0,00 8,70 4,02 2,00Occluded iron 5,77 33,13 12,68 6,86Total mineral 24,00 129,00 53,37 28,64Organic (perchloric) 0,00 182,40 49,48 48,00
Total 33,30 260,40 ·102,71 55,16
26 South African Forestry Journal- No. 150, September 1989
Relation of soil properties to phosphate fractions
We first used correlation analysis to examine the soilphysical and chemical properties affecting soil phosphate fractions. Particle size data showed significant (P<0,05) correlation with forms of iron phosphate.There was a negative correlation between medium andfine sand and iron phosphate and also a negative correlation with forms of iron phosphate. There was a negative correlation between medium and fine sand andiron phosphate and also a negative correlation between
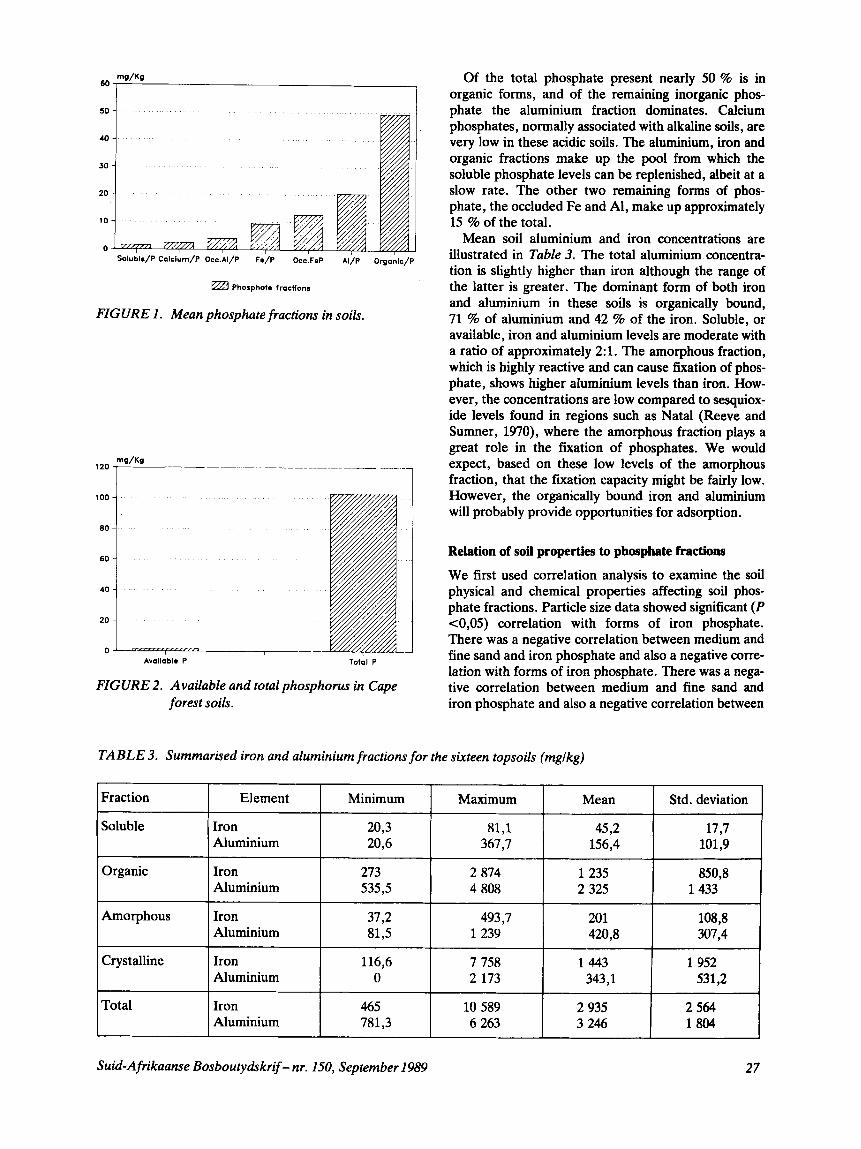
Of the total phosphate present nearly 50 % is inorganic forms, and of the remaining inorganic phosphate the aluminium fraction dominates. Calciumphosphates, normally associated with alkaline soils, arevery low in these acidic soils. The aluminium, iron andorganic fractions make up the pool from which thesoluble phosphate levels can be replenished, albeit at aslow rate. The other two remaining forms of phosphate, the occluded Fe and AI, make up approximately15 % of the total.
Mean soil aluminium and iron concentrations areillustrated in Table 3. The total aluminium concentration is slightly higher than iron although the range ofthe latter is greater. The dominant form of both ironand aluminium in these soils is organically bound,71 % of aluminium and 42 % of the iron. Soluble, oravailable, iron and aluminium levels are moderate witha ratio of approximately 2:1. The amorphous fraction,which is highly reactive and can cause fixation of phosphate, shows higher aluminium levels than iron. However, the concentrations are low compared to sesquioxide levels found in regions such as Natal (Reeve andSumner, 1970), where the amorphous fraction plays agreat role in the fixation of phosphates. We wouldexpect, based on these low levels of the amorphousfraction, that the fixation capacity might be fairly low.However, the organically bound iron and aluminiumwill probably provide opportunities for adsorption.
Total PAvailable P
,-~--~------~--------- ---.-
60 mg/Kg
~ Phosphate fractions
Soluble/P Calelum/P Oee.AI/P fe/P Oee.feP AI/P Organle/P
FIGURE 2. Available and total phosphorus in Capeforest soils.
120mg/Kg
100
80
60
40
20
0
FIGURE 1. Mean phosphate fractions in soils.
TABLE 3. Summarised iron and aluminiumfraetions for the sixteen topsoils (mg/kg)
Fraction Element Minimum Maximum Mean Std. deviation
Soluble Iron 20,3 81,1 45,2 17,7Aluminium 20,6 367,7 156,4 101,9
Organic Iron 273 2874 1235 850,8Aluminium 535,5 4808 2325 1433
Amorphous Iron 37,2 493,7 201 108,8Aluminium 81,5 1239 420,8 307,4
Crystalline Iron 116,6 7758 1443 1952Aluminium ° 2173 343,1 531,2
Total Iron 465 10589 2935 2564Aluminium 781,3 6263 3246 1804
Suid-Afrikaanse Bosboutydskrif-nr.150, September 1989 27

sand and fine sand and occluded iron phosphate (Table4). There were strong positive correlations betweenclay content and both iron and occluded iron phosphates, and also a strong positive correlation betweenfine silt and occluded iron phosphate. We can inferfrom this that most of the iron phosphate is associatedwith inorganic exchange sites and surfaces in thesesoils. The only other significant correlation was a negative one between very fine grained sand and soluble P.
A number of chemical factors were related to phosphate fractions. The correlation matrix of all significantelements is shown in Table 5. All correlations werepositive. Organic carbon was strongly correlated withboth aluminium and total mineral phosphate althoughproblems of measurement of strongly coloured extractsin two of the samples in the former fraction caused adecrease in the R2 value. It appears that the aluminiumphosphates are related more to the organic exchangesites than the inorganic sites dominated by the ironphosphates. Total mineral phosphate and aluminiumphosphate are also closely correlated with the exchangeable acidity and aluminium content of the soils. Theonly analysis value that correlates with organic phosphorus (determined by perchloric digest) is pH in sodium fluoride.
Iron and aluminium fractions are also correlatedpositively with phosphate fractions. The correlation
between inorganic aluminium fractions and aluminiumphosphates is non-significant. This could be becausemost of the aluminium phosphates are associated withthe organic exchange complex, for instance solublealuminium correlates significantly with organic carbon(R2 = 0,543 P = 0,0297) as does aluminium and totalmineral phosphates. Iron, by contrast, correlates wellwith iron phosphate fractions, supporting the importance of the inorganic soil components in determiningiron phosphate levels. Apparent correlations of aluminium fractions with iron phosphates and iron fractionswith aluminium phosphates are due mainly to thestrong intercorrelation of iron and aluminium in thevarious extracts, for example dithionate extractableiron and aluminium have a correlation coefficient of0,912, P = 0,000 1.
Prediction of phosphate levels from soil parameters
We modelled certain phosphate fractions using easilymeasured soil parameters. The availability of such models could save time in future analysis. Models basedon such data would allow us to approximate phosphatelevels at sites already sampled, but where phosphatefractions were not determined.
We attempted to model total, organic, total mineral,aluminium, iron and Bray 2 phosphorus levels. It was
TABLE 4. Correlation of some soil physical variables with phosporus fractions (significant at P <0,05)
Sand Silt Sand Silt ClayCoarse Medium Fine Very fine Coarse Fine
Soluble P - 0,635(0,010)
AlP - 0,641 0,599(0,024) (0,039)
Fe P - 0,658 - 0,515 0,551(0,007) (0,049) (0,033)
Occluded Fe P 0,558 0,754 - 0,561 0,753(0,030) (0,001) (0,029) (0,001)
TABLE 5. Correlation ofsoil chemical variables with phosphorus fractions (significant at P <0,05)
S Value TValue OrgC EA ExAI Na K Ca pH(NaF)
Soluble 0,560 0,538 0,502(0,037) (0,031) (0,047)
Bray2 0,735 0,706 0,735 0,641 0,568(O,ool) (0,004) (0,001) (0,011) (0,021)
AlP 0,613 0,513(0,025) (0,041)
Occluded FeP 0,669 0,575 0,676(0,008) (0,031) (0,004)
Total mineral 0,783 0,875 0,713 0,719P (0,000) (0,000) (0,001) (0,001)
Organic P 0,592(perchloric) (0,095)
28 South African Forestry Journal- No. 150, September 1989

possible to construct multiple regression models foreach of these dependent variables. They are listed inTable 6. The best model is for Bray 2 phosphorus,which contains organic carbon as the variable. Thismodel would be valid only on untreated soils. It islikely that predictive ability would decrease if soils hadbeen fertilised. The mean standard error of estimationfor this model is reasonable. The other models, whilestill significant, have fairly high mean standard errorsand should only be used to indicate approximate levelsin samples where phosphate fractionation was notdone.
Adsorption characteristics of soils
It is useful to have a measure of the buffering power ofthe soil, i.e. the resistance in the soil solution to changewhen phosphate is added or removed. The bufferingcharacteristics of the soils were investigated by constructing adsorption isotherms and fitting the Langmuirfunction to the data (Langmuir, 1918). The single surface Langmuir function was found to be adequate todescribe the data. The fit of the data by the functionwas very good in all cases, with a mean RZ value of0,952. Adsorption maximae (Xm) ranged from 119,7to 497,5 mg/kg, with a mean of 269 mg/kg. This couldbe classed as moderate to low compared with othersoils in South Africa (Reeve and Sumner, 1970; DuPlessis and Burger, 1966). The binding constant K,which is a measure of the bonding energy of the soil forphosphate and is equal to the reciprocal of the equilibrium concentration of half saturation (Olsen and Wa-
tanabe, 1957), ranges from a minimum of 0,0084 to amaximum of 0,582 6 with a mean of 0,11 me/g. Themaximum buffer capacity S was calculated from K X
Xm (Holford, 1979). The range of S was 12,33 to 2 899mllg with a mean of 442,9 which is similar to that ofsoils tested in New South Wales (Holford, 1979) andNew Zealand (Mead, 1981).
We modelled the three parameters using routine soilanalysis measurements. We used correlation analysisfollowed by stepwise regression analysis with the sameselection criteria as the previous modelling exercise forphosphorus levels. The models produced are shown inTable 7.
Better values of RZ could be attained. However,increases over the models presented were due to reinforcement caused by collinearity between variableswith a consequent loss in stability of predicted estimates and higher standard errors. All the models weresignificant, but their usefulness as predictors is questionable, especially for K and S. The mean standarderrors of prediction are high given the range of valuesof the variables.
As descriptive models, however, the equations areuseful. The partial regression coefficients can show therelative importance of the variables in the models (Stevenson, 1982). The fine silt fraction which appears inthe model for adsorption maximum suggests that exchange sites associated with this fraction are moreimportant in these soils than those associated with theclay fraction. The latter was removed from the modelowing to inter-correlation with fine silt. It had a lowersignificance value. On average, the fine silt content is
TABLE 6. Multiple Regression models constructed for prediction of soil phosphorus fractions
Model RZ P>F MSE n
Bray 2 P = 0,1256 + 0,569 (Organic carbon) 0,645 0,000 9 0,845 16
Aluminium P = 17,5 - 0,78 (Medium sand) + 7,55 (aluminium) 0,505 0,0296 13,403 16
Total mineral P = 25,92 + 0,84 (Clay) + 6,12 (Organic carbon) 0,425 0,0358 16,27 16
Organic P = -228,5 + 31,88 (pH NaF) 0,417 0,017 1 41,54 16
Total P = -149 + 29,25 (pH NaF) 0,306 0,06 49,16 16
TABLE 7. Multiple regression models for prediction ofphosphorus adsorption characteristics
Model RZ P>F MSE n
Xm = -433 + 6,16 (Fine silt) + 65,4 (pH NaF) 0,531 7 0,0154 48,83 16
K = 1,31 + 0,039 (V. fine sand) + 0,03 (Bray 2 P) 0,7987 0,000 8 0,040 4 16+ 0,136 (pH NaF)
S = -6889 + 198 (V. fine sand) + 182 (Bray 2 P) 0,7699 0,0016 223,7 16+ 700,4 (pH NaF)
Suid-Afrikaanse Bosboutydskrif-nr. 150, September 1989 29

CONCLUSIONS
REFERENCES
ACKNOWLEDGEMENTS
to occur in the coarse textured sandy soils with low clayand organic content where P can be leached from theprofile owing to insufficient exchange sites for retention. Of the Cape regions, the Western Cape is likelyto suffer most from leaching losses while the SouthernCape and Tsitsikamma will have fewer problems astheir soils are generally finer textured. However, thediscrepancy between optimum phosphate rates determined from field trial results and the lower levels predicted by the modelling exercise based on the ST values suggest that long-term leaching also occurs on thefiner textured soils, in conjunction with nutrient uptake by the crop and competing vegetation. Also, asthere is a high proportion of phosphate in the organicform, some of the applied phosphate may becomefixed in unavailable organic forms through biocycling.This would account for under-estimation of the phosphate requirements of the crop by buffering poweralone.
This work formed part of the silvicultural programmeof the South African Forestry Research Institute.
BALLARD, R., 1974. Use of soil testing for predicting phosphatefertilizer requirements of radiata pine at time of planting. N.Z.J.For. Sci. 4(1):27-37.
BLACK, C. (Ed.), 1965. Methods of soil analysis. Part 2. Am. Soc.Agron. Madison, USA: 985-994.
BRAY, R.H., and KURTZ, C.T., 1945. Determination of total,organic and available forms of phosphorus in soils. Soil Science59:39--45.
CHANG, S.C., and JACKSON, M.L., 1956. Fractionation of soilphosphorus. Soil Science 84:133-144.
COVENTRY, R.J., and FETT, D.E.R., 1979. A pipette and sievemethod of particle size analysis and some observations on itsefficacy. Divisional Report no. 38 CSIRO Australia: 26 p.
DONALD, D.G.M., LANGE, P.W., SCHUTZ, C.J., MORRIS,A.R., 1984. The application of fertilisers to pines in SouthernAfrica. IUFRO Symposium on Site and Productivity of Fastgrowing Plantations, Pietermaritzburg: 621-635.
DRISCOLL, C.T., VAN BREMEN, N., and MULDER, J., 1985.Aluminium chemistry in a forested spodosol (New Hampshire).Soil Sci. Soc. Am. J. 49(2): 437-444.
DU PLESSIS, S.F., and BURGER, R. du T., 1966. Phosphatefixation studies on two sandy soils of the Orange Free State. S.Afr. J. Agric. Sci. 9:117-126.
FIELDES, M., and PERROTT, K.W., 1966. The nature of A11ophane in soils. Part 3. Rapid field and laboratory test for a11ophane, N.Z.J. ofSci. 19:623-629.
GREY, D.C., JACOBS, E.O., ROBERTSON, T.A., andSCHAFER, G.N., 1988. An introduction to the TsitsikammaKey Area. SAFRI Centre Report S.87/3. 99 pp.
HOLFORD, I.C.R., 1979. Evaluation of soil phosphate bufferingindices. Aust. J. Soil Res. 17:495-504.
HAWKER, L.C., 1986. A mineralo-chemical study of podzols andpodzolised soil in a slope sequence near George, Southern Cape.M.Sc. thesis, University of South Africa. 125 p.
HELWIG, J.T., and COUNCIL, K.A., 1985. SAS Users Guide1985ed. SAS Int. Inc. Raleigh N.C., USA. 494 pp.
JACKSON, M.L., 1958. Soil chemical analysis. Constable and Co.Ltd., London. 498 pp.
LANGE, P.W., 1974. A critical review of fertiliser research in thesouthern Cape. Unpublished report. S.A. Forestry ResearchInstitute. 18 pp.
(1)Equation
Levels of phosphate in plantation soils, within therange of soil physical and chemical properties found inthe Cape, are low, with only a small percentage (2 %)of the phosphate in an immediately available form.However, the organic form of phosphate dominatesthe total and part of this may provide a reserve ofreadily mineralisable phosphate; only a small proportion is in the unavailable occluded mineral forms. Thisreserve of phosphate could go some way towards explaining the very varied growth found on soils withapparently very low «2 mglkg) levels of Bray 2 phosphorus.
Aluminium phosphates are related mainly to theorganic component of the soil and iron phosphates arepredominantly associated with the clay fractions. Thebuffering power of the soils for phosphate was variable, but was similar to that of soils tested elsewhere.
It was possible to model both phosphate levels andbuffering character using routine soil analytical data,though more samples should be used in the exercise torefine the models. Organic carbon was important in themodels for phosphate fractions and pH measured insodium fluoride was important for predicting bufferingcharacteristics.
The low adsorption maxima also indicate that it isunlikely that phosphorus fixation will cause severeproblems in plantation topsoils in the region whenphosphate is applied. (Desorption curves after incubation with added phosphate also showed low fixationcapacity in these soils (Payn and Clough, 1988.) Themain problem with soluble P application is more likely
higher than the clay percentage in this region, especially in the Tsitsikamma. In recognition of this, agricultural advisers use a measure of clay plus half silt, i.e.clay plus fine silt, when making recommendations (Robertson, T.A., pers. comm., 1987).
Ozanne and Shaw (1967) used the index ST as ameasure of buffering capacity. This calculates theamount of P sorbed at 0,3 mg/e' equilibrium concentration. From this value one can estimate the amount ofphosphate that should be added to the soil to give aconcentration of 0,3 mg/e in the soil solution.
Tiarks (1982) found that 0,22 mg/e phosphate in soilsolution was optimum for tree growth, so we calculatedST (0.22) or the amount of P sorbed at 0,22 mg/t',
KXmO,22ST(0,22) =
1 + 0,22K
Values of ST (0,22) ranged from 0,24 to 51,9 mg/kgwith a mean value of 8,28 mg/kg. This corresponds to amean application rate of 16,6 kg P per hectare (per 200mm depth). These values are lower than those foundby Tiarks (1982) who found a range of 30 to 120 mg/kgadsorbed. The application rate of 16,6 kg P per hectareis also lower than the recommended rate of 35 kg perhectare at time of planting based on field experimentation (Payn and Clough, 1988).
30 South African ForestryJournal- No. 150, September 1989

LANGMUIR, I., 1918. The adsorption of-gases on plane surfaces ofglass, mica and platinum. J. Amer. Chem. Soc. 40:1361-1403.
MACVICAR, C.N., DE VILLIERS, J.M., LOXTON, R.F., VERSTER, E., LAMBRECHfS, J.J.N., MERRYWEATHER,F.R., LE ROUX, J., VAN ROOYEN, T.H., and VON M.HARMSE, H.J., 1977. Soil classification. A binomial system forSouth Africa. Department of Agricultural Technical Services.Science Bulletin 390.
MCKEAGUE, J.A., and DAY, J.H., 1966. Dithionate and oxalateextractable Fe and Al as aids in differentiating various classes ofsoils. Can. J. Soil Sci. 46:13-27. .
MEAD, J.A., 1981. A comparison of the Langmuir, Freudlich andTempkin equations to describe phosphate adsorption propertiesof soils. Awt. J. Soil Res. 19:333-342.
OLSEN, S.R., and WATANABE, F.S., 1957. A method to determine a phosphorus adsorption maximum of soils as measured bythe Langmuir isotherm. Soil Science Society Proceedings, pp.144-149.
OZANNE, P.G., and SHAW, T.C., 1967. Phosphate sorption bysoils as a measure of the phosphate requirement for pasturegrowth. Awt. J. Agric. Res. 18:601-612.
Suid-Afrikaanse Bosboutydskrif-nr. 150, September 1989
PAYN, T.W., and CLOUGH, M.E., 1988. Differential fertilisationof acid forest soils. S.A. For. J. 147:16-23.
REEVE, N.G., and SUMNER, M.E., 1970. Effects of aluminiumtoxicity and phosphorus fixation on crop growth on oxisols inNatal. Soils Sci. Soc. Am. Proc. 34:236-267.
SCHUTZ, C.J., 1976. A review of fertiliser research on some of themore important conifers and eucalypts planted in substropicaland tropical countries, with special reference to South Africa.S.A. Dept. of Forestry. Bulletin 53. 89 p.
STEVENSON, F.J., 1982. Humus chemistry, genesis, composition,reactions. Wiley Interscience Publication, pp. 443.
SAS INSTITUTE, 1988. SASR system. SAS BASICS. SAS InstitutePublication, Cary, N. Carolina, USA.
STSC INC., 1986. Statgraphics: Statistical Graphics system.TAN, K.H., 1982. Principles of soil chemistry. Marcel Dekker, Inc.
p.267.TIARKS, A.E., 1982. Phosphorus sorption curves for evaluating
phosphorus requirements of loblolly pine (Pinus taeda). Communications in Soil Sci. Plant Anal. 13(8):619-631.
TECHNIKON AUTO-ANALYSER SYSTEMS, 1979. Methods ofanalysis.
31