factors affecting pev sales in california: 2010-2015
TRANSCRIPT

Factors Affecting PEV Sales in California: 2010-2015
J.R. DeShazo, Tamara Sheldon, Richard Carson, SamuelKrumholz
ARB Research Seminar: September 12, 2017 Sacramento, California

Overview of Topics
1. PEV sales in California: temporal & spatial 2. Factors predicting PEV Sales 3. Rebate uptake and new vehicle introductions 4. Effects of HOV-lane access on PEV sales 5. Demand for BEVs and PHEVs* 6. Effects of rebate policies on PEV sales 7. Correlation of gas prices with PEV sales
*The data set used and the findings of this project relate to state of the market and the CVRP program circa 2013 and are not 2representative of the current market or program.

Selected High-level Findings
• Growth has been rapid but spatially concentrated.
• Have not yet reached typical middle incomehybrid buyers.
• HOV-lane access has had the largest effect compared to other policies but varies spatially.
• Rebate policies have had positive influence on sales.
• Falling gas prices are negatively correlated with PEV sales.
3

UCLA Luskn St..hoo. ()/ l'uhh,;:. ,\tfoirs
Luskin Center FOR INNOVATION
Data Behind the Study
• PEV Sales only California 2010-2015 – Census tract, county, region – HIS, AFDC, ACS, State voting data
• HOV analysis based through 2014 • New Car Buyer Survey 2014 State-wide • Gas Prices and PEV Sales 2010-2015
4
UCLA _J~k1n S..-hlwl :),/ l'ubli,;: AffJ.irs
Luskin Center FOCI INNOVATION
Broader Context
5
■ ■
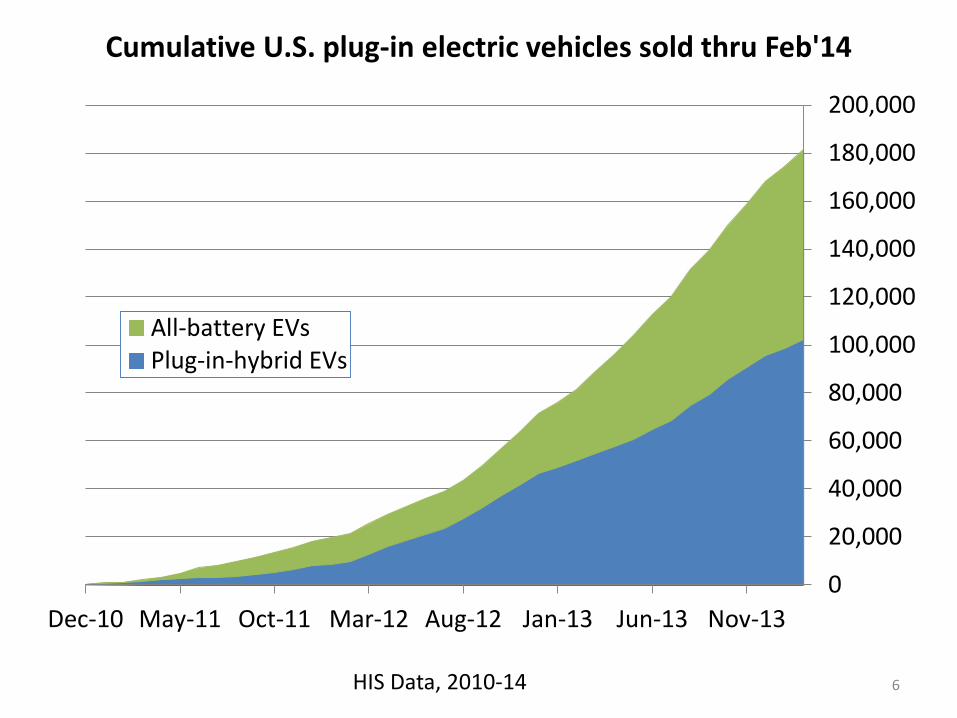
Cumulative U.S. plug-in electric vehicles sold thru Feb'14
All-battery EVs Plug-in-hybrid EVs
200,000
180,000
160,000
140,000
120,000
100,000
80,000
60,000
40,000
20,000
0 Dec-10 May-11 Oct-11 Mar-12 Aug-12 Jan-13 Jun-13 Nov-13
HIS Data, 2010-14 6

UCLA Luskn St..hoo. ()/ l'uhh,;:. ,\tfoirs
Luskin Center FOR INNOVATION
Takeaway: PEV sales have grown rapidly. California has experienced
77% annual growth rates from 2010-2015.
7

0%
10%
20%
30%
40%
50%
60%
70%
80%
90%
100% Percent of US cumulative plug-in vehicle sales thru Feb'14
All-battery EVs Plug-in-hybrid EVs
Dec-10 May-11 Oct-11 Mar-12 Aug-12 Jan-13 Jun-13 Nov-13
HIS Data, 2010-14 8
UCLA Luskn St..hoo. ()/ l'uhh,;:. ,\tfoirs
Luskin Center FOR INNOVATION
Takeaway: Battery Electric Vehicles and Plug-in Hybrid Vehicles
comprise roughly equal shares of the early market.
9

Table 3~1: Sales of P£V .M-0dels Released by Year and Body in wliforuia, 2010- 2014
Release Year Model Body Safes• Top 10 Ranking
liESlA FtOADSTER Luxury Coupe 156
2010 NISSAN LEAF Hatdlback 25,206 2 INliE RNATIONAL EST AR van 37 a-t EVROlfl VOLT Hatdlback 2.6,197 1 SMARTCAR FORTWO Coupe 2.,122 9
2011 AZURE TR'.ANSIT CONNECT van 5,9
MITSUBJSH I I-Ml EV Hatdlback .25:5 BMWACTN'E E Luxury Coupe 457 FORD FOCUS !ELECTRIC Hatchback 1,209 liES1A MODEL S Luxuiry Hatch back 15,521 4
2012 HONDA FIT EV Hatdlback 92 TOYOTA RAV4 EV SUV 2.,221 8 ASKER KARMA Luxury Sedan 270 TOYOTA P RIUS PLUG-IN Hatdlback 18,163 3 OiEVROlET SPARK Hatdlback 1,338 10 AATSOO Hatdlback 7,736 6
2013 FORD rC.JMAX EINE RGI Hatdlback 6,002 7 HONDAACCORDPLUG-tN Sedan 589 FORD FUSI ON EN ERGI Sedan 7,945 5 BMW 13 BEV PlU Hatdlback 896 MER CE DES-Bf N1Z B-OLASS B'CL Hatchback 56:5 KlA SOUl EV SUV 286 fADI LlAC EUR Luxury Coupe 302
2014 PORSo-t E PA!NAM ERA S HYB Luxuiry Sedan 202 M CLA.REIN P~ PLU Luxuiry Coupe 1:5 BMW 13 REI( HYB Hatdlback 1,040 PORSo-t E 918. SPY P LU Luxury Coupe 14 VOLkSWAGEN GOLF SPR PLU Hatdlback 219
Source~ IHS 2010-2014
10

UCLA Luskn St..hoo. ()/ l'uhh,;:. ,\tfoirs
Luskin Center FOR INNOVATION
Takeaway: Automakers have supplied over 28 PEV models within
the first five years.
11
UCLA Luskn St..hoo. ()/ l'uhh,;:. ,\tfoirs
Luskin Center FOR INNOVATION
Among higher-income groups, the rate of sales of PEVs is approaching
that of hybrids (HEVs)
12

Figure 3-3: PEV and HEV Sales as a Proportion of All California New Vehicle Sales {Dec 2010 -
May2015)
al CD 0
.c:. CD > ~ CD z -0 C 0 t:: 0 a. 0 ~
Q_
a, 0 0
4D 0
0
... 0 ci
N 0 0
0 0 0
PEV lfoJblid
2011 2012 2013 2014 2015
Source: /HS 2010-2015 13

Figure 3-6: PEV Monthly Sales in California by Tract SES Quartile: 3 Month Moving Average
(Dec 2010 - May 2015)
-a, cu «> ::,,.
£j C 0
~ > llJ 0...
C, C> .. ..,
C> C> C, ..,
C> C> .. ....
C> C, C, ....
C> C, .. C, C, C,
C, C, .. C,
~ SES 2nd~ 3rd~ lowesl
2014
Source: /HS 2010-2015 14
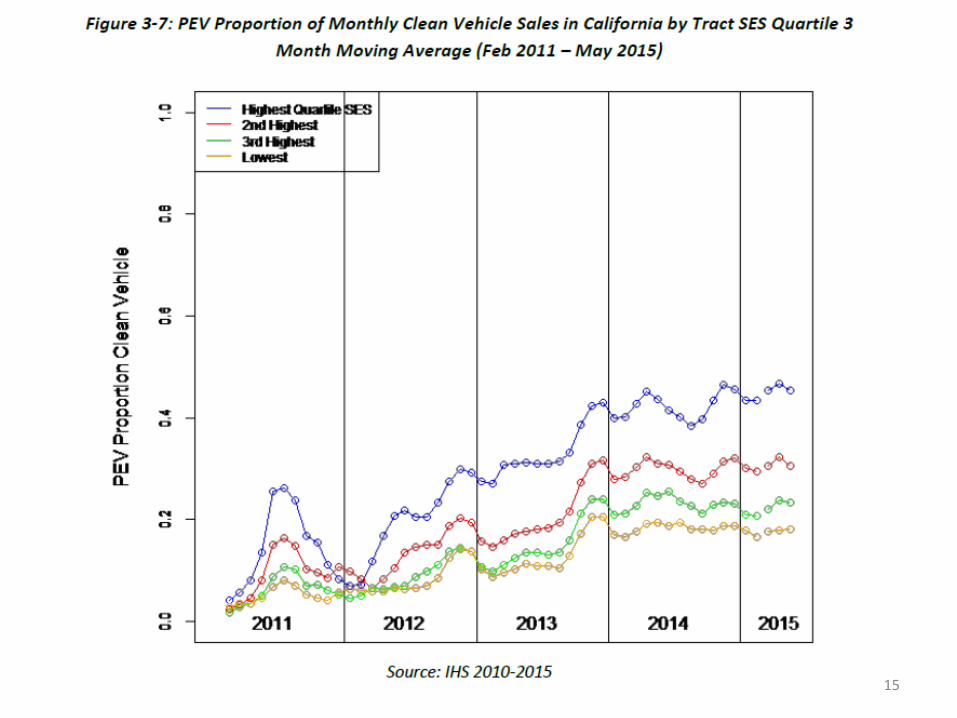
Figure 3•7: PEV Proportion of Monthly Clean Vehicle SaJes in California by Tract SES Quartile 3
Month Moving Average (Feb 2011 - May 2015)
CD 0 .c CD
> C a, CD
0 C 0 t: 0 0.. 0 ~
0...
> w 0...
a, C,
"' C,
-,:j
... C,
C! C,
- 1-igheslQuallle - 2nd~ - 3n1 ~ - Lowest
A
~ _.o
2012 2013 2014 2015
Source: /HS 2010-2015 15

UCLA Luskn St..hoo. ()/ l'uhh,;:. ,\tfoirs
Luskin Center FOR INNOVATION
Takeaway: Households in highest SES quartiles are purchasing PEVs at
rates comparable to the rates that the general population has
purchased hybrids.
16
UCLA Luskn St..hoo. ()/ l'uhh,;:. ,\tfoirs
Luskin Center FOR INNOVATION
PEV sales have been persistently spatially concentrated
17
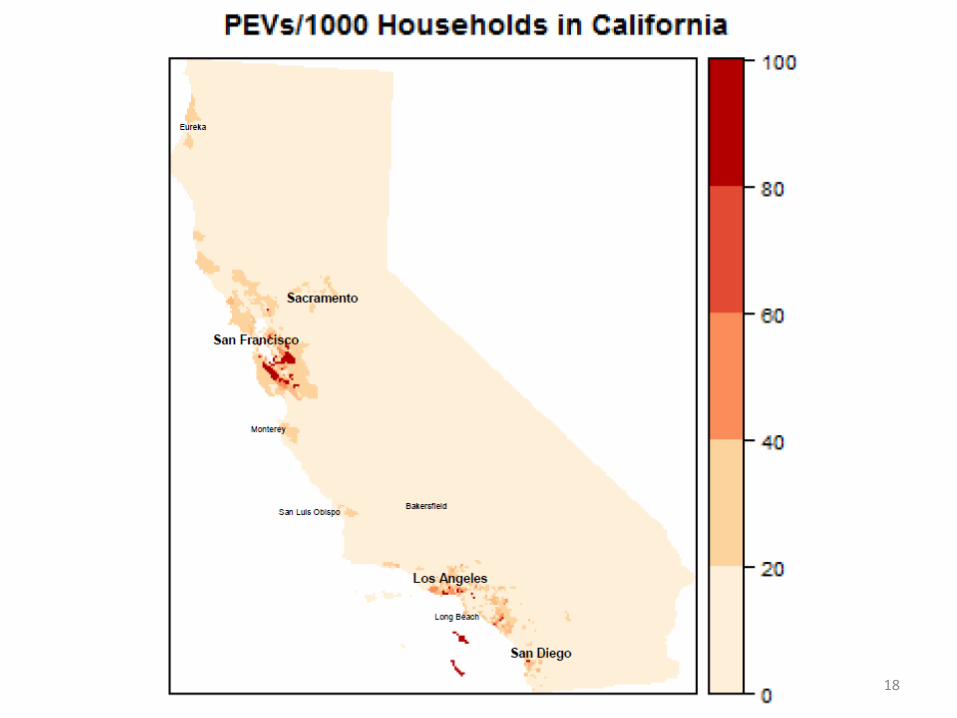
PEV·s/11000 Hous,e holds in ·C,alil ornia 100
Eureka
80
Sacramento
60
Mon.:erey
40
S 31 LUI& 0 01'.spo
, Los Angeles ... . . ....... .._ ·.
20
Long Bu en ~
Sa~, Diego
• ._ ________________________ ___. --~ 0 18

UCLA Luskn St..hoo. ()/ l'uhh,;:. ,\tfoirs
Luskin Center FOR INNOVATION
Takeaway: PEV purchases are concentrated in a few regions.
19
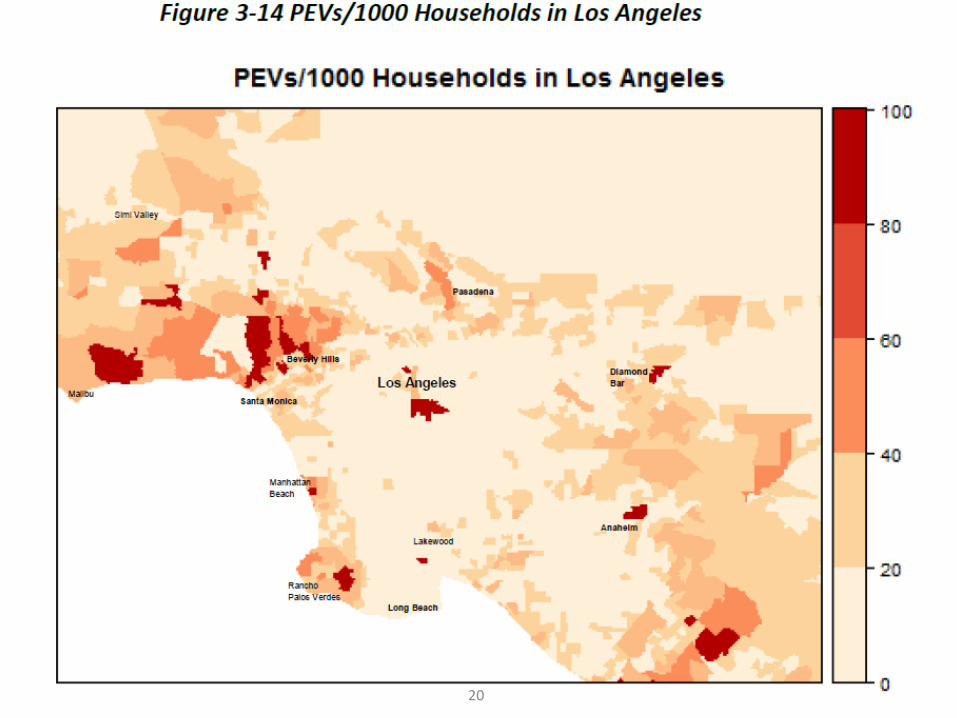
Figure 3-14 PEVs/1000 Households in Los Angeles
PE·Vs/1 00Qi Hous,eholds in IL10 ,s Angeles,
r _.,. ia I,- ·~~
srrlvaue:y
~ Pasaaena
~ ,~Hll8 ' .. al!~---... Los Angeles
Mau Santa Monica
~
• ... Mann~ • ..... t..,
Lale°-tNOOCI .. .. .. Rancno
.,~~ Pa106 Va-GK
Long Bea.en
Olamona ,..•• ..
• A.nanetrn
100
80
60
,.,, ·-n,
20
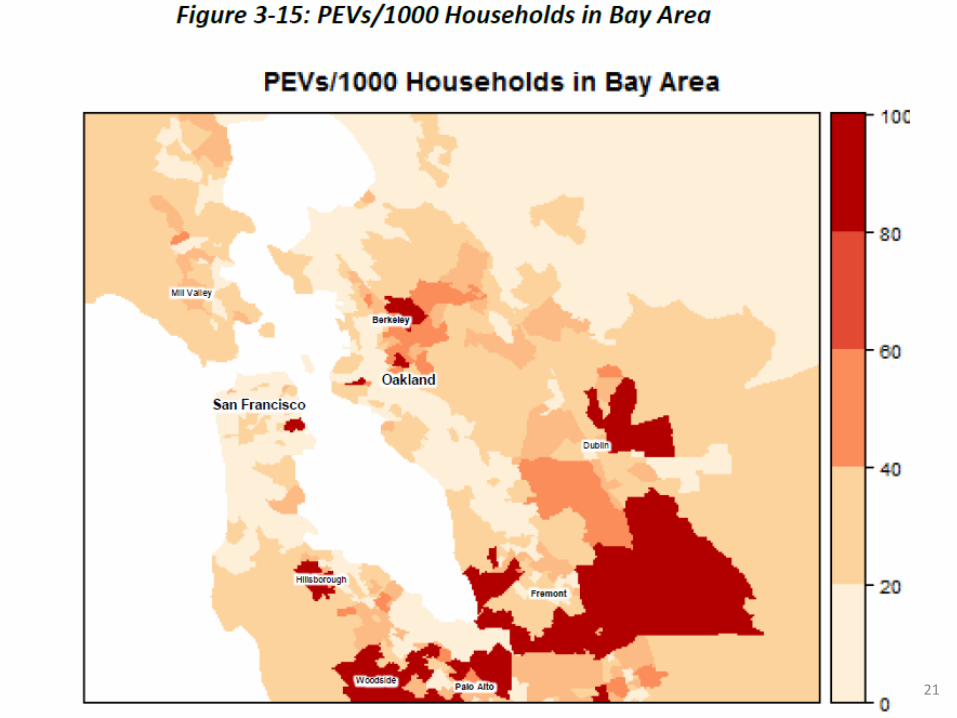
Figure 3-15: PEVs/1000 Households in Bay Area
PEVs/10001 Households, in Bay Area 10 (
80
MII V;t'.ef " -~ • ... 60 ....,.. Oakland
San Francisco ... '
~ 40
~ --Hll~Dorougn
"ft' 20
21

UCLA Luskn St..hoo. ()/ l'uhh,;:. ,\tfoirs
Luskin Center FOR INNOVATION
Takeaway: PEV adoption varies within metropolitan areas.
22
UCLA Luskn St..hoo. ()/ l'uhh,;:. ,\tfoirs
Luskin Center FOR INNOVATION
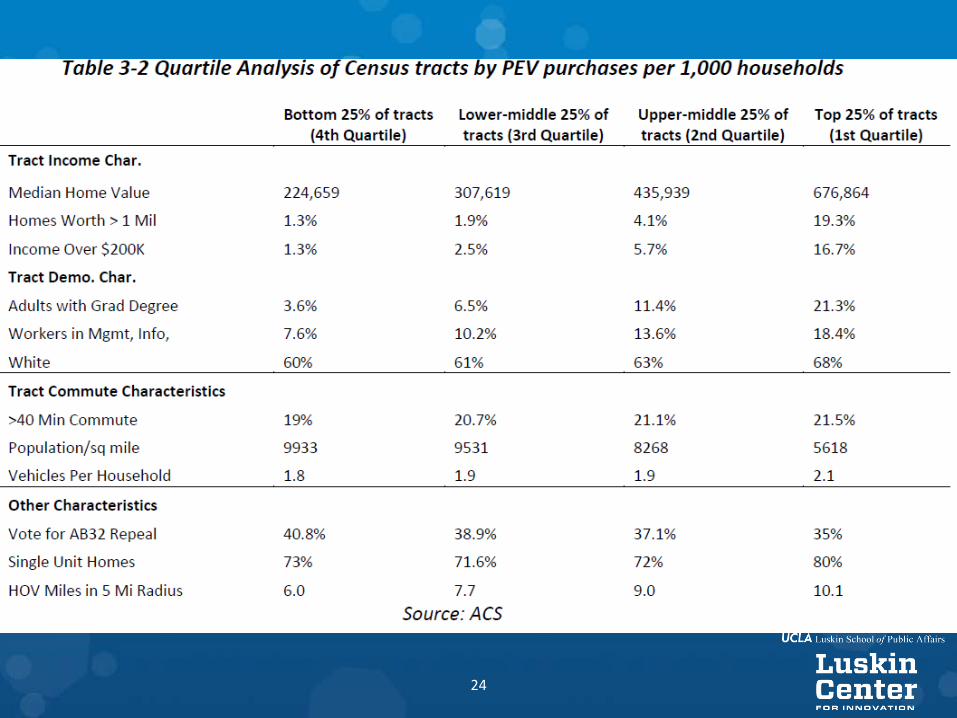
Household income and wealth are strongly and positively associated
with early PEV sales
23
Tract Income Char.
Median Home Value
Homes Worth > 1 Mil
Income Over $200K
Tract Demo. Char.
Adults wit h Grad Degree
Workers in Mgmt, Info,
White
Tract Commute Characteristics
>40 Min Commute
Population/sq mile
1/P.hid P.s PP.r HnusPholrl
Other Characteristics
Vot e for AB32 Repeal
Single Unit Homes
HOV Miles in ~ Mi Kadius
Bottom 25% of t racts (4th Quarti le)
224,659
1.3%
1.3%
3.6%
7.6%
60%
19%
9933
1.8
Lower-middle 25% of tracts {3rd Quartile)
307,619
1.9%
2.5%
6.5%
10.2%
61%
20.7%
9531
1.9
38.9%
71.6%
40.8%
73%
b.O I.I
Source: ACS
Upper-middle 25% of tracts (2nd Quarti le)
435,939
4.1%
5.7%
11.4%
13.6%
63%
21.1%
8268
1.9
37.1%
72%
9.0
Top 25% of tracts (1st Quarti le)
676,864
19.3%
16.7%
21.3%
18.4%
68%
21.5%
5618
J.1
35%
80%
10.1
24

UCLA Luskn St..hoo. ()/ l'uhh,;:. ,\tfoirs
Luskin Center FOR INNOVATION
Takeaways: Neighborhoods with higher incomes, wealth, education, and access to HOV lanes tend to be positively associated with PEV sales.
25

Table 4-1 : Abbreviated Regression Models Predicting New PEV Purchases per capita
(1) (2) (3) (4) (5) VARIABLES PEV/ 1000 HH PEV/1000 HH PEV/ 1000 HH PEV/1000 HH PEV/ 1000 HH
Percent Income Over $200k 12.04*** 9.414*** 8.214*** 6.733*** 7.129***
(0.170) (0.252) (0.277) (0.337) (0.325) Med ian Home Value 3 .361 *** 2.248*** 1.661 *** 0.171
(0.196) (0.206) (0.207) (0.247) Percent Adults with Masters
1.591 *** 1.498*** 1.516*** Degree
(0.212) (0.210) (0.197) Percent Income $150-$200k 1.513*** 1.422*** 1.462***
(0.162) (0.194) (0.184) Percent Homes Worth Over 1
1.743*** 2.344*** Mil($)
(0.275) (0.263) Med ian Rent 0 .896*** 0.521 ***
(0.149) (0.147)
Earn >$75k and Commute Alone 0 .367* 0.197 (0.205) (0.199)
HOV Miles in 5 Mile Radius 1.728*** (0.0899)
Percent Homes Worth $150--0.901 ***
$300k (0.107)
Percent Asian 0.945***
(0.116) Constant 11.84*** 11.84*** 11.84*** 11.84*** 11.84***
(0.0960) (0.0930) (0.0910) (0.0898) (0.0863) Obse rvations 7,855 7,855 7,855 7,855 7,855 R-squared 0.667 0 .687 0 .701 0 .709 0.731 Source: American Community Survey 2013-2015; IHS 2010-2015
Sta ndard e rrors in pa re nt heses ***p<0.01, **P<0.05, *p<0.1 26

Table 4-6: Characteristics of Tracts by Quartile of Used PEV Sales per capita
1st 2nd 3rd 4th Quart ile Quart ile Quartile Quartile
Tract Income Characteristics:
Median Home Value 333,701 436,355 444,437 522,180
Homes Worth > $1 Mil 0.041 0.075 0.074 0.106
Income Over $200K 0.039 0.07 0.072 0.108
Tract Demographic Characteristics:
Adu lts with Grad Degree 0.075 0.134 0.121 0.149
Workers in Mgmt, Info or Finance 0.104 0.142 0.136 0.149
White 0.612 0.69 0.64 0.652
Tract Commute Characteristics
>40 Min Commute 0.199 0.2 0.206 0.221
Population Density (population/sq. mile) 9423.458 8036.919 8411.439 6242.145
Vehicles Per Household 1.815 1.814 1.9 2.05
Other Characteristics:
Vote for AB32 Repeal 0.387 0.395 0.376 0.367
Single Unit Homes 0.733 0.67 0.704 0.8
HOV M iles in 5 Mi Rad ius 7.124 5.482 8.64 10.07
Source: American Comm unity Survey 2013-2015; IHS 2010-2015 27
UCLA Luskn St..hoo. ()/ l'uhh,;:. ,\tfoirs
Luskin Center FOR INNOVATION
Takeaways: Neighborhoods purchasing used PEVs tend to have higher income
and education but less so than neighborhoods purchasing new PEVs.
28

UCLA Luskn St..hoo. ()/ l'uhh,;:. ,\tfoirs
Luskin Center FOR INNOVATION
HOV Lane Access Policies Have
Boosted PEV Sales
29
UCLA Luskn St..hoo. ()/ l'uhh,;:. ,\tfoirs
Luskin Center FOR INNOVATION
Overview
What is the impact of HOV policies on PEV sales? ✤ First causal study ✤ Geographic marginal impacts ✤ We find access to 6, 20, and 100 miles of nearby HOV lanes leads to 1, 3, and 10 additional PEV registrations in a census tract
~25% of California PEV registrations during 2010-2013 were a result of the HOV lane policy
30
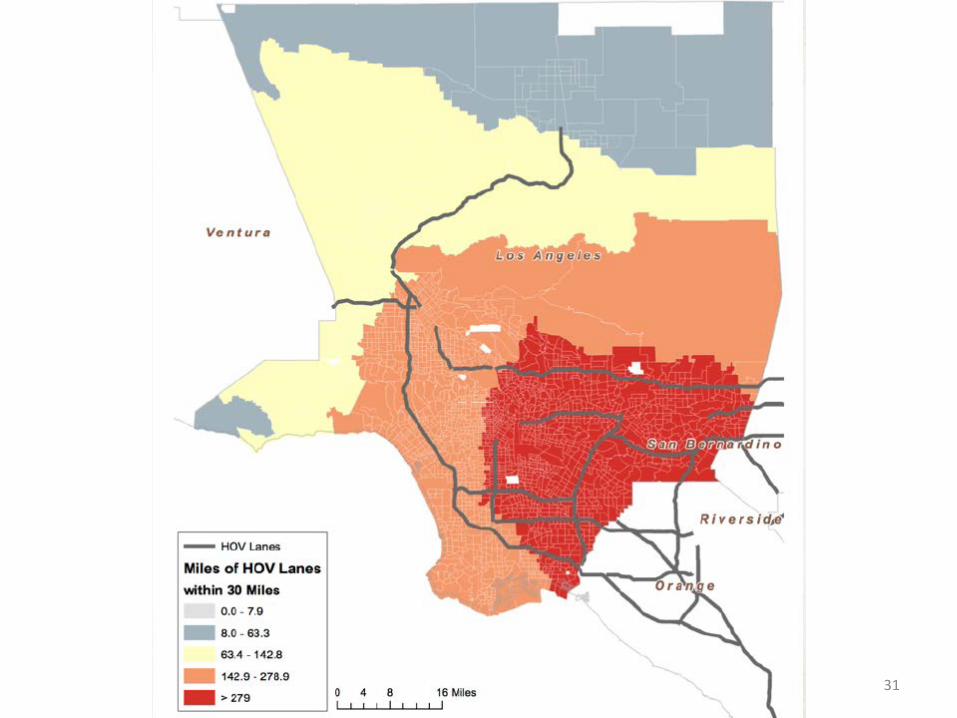
Ventura
- HOV lanes
Miles of HOV Lanes
within 30 Milos
0.0 - 7.9
- 8.0- 63.3
63.4 - 142.8
- 142.9 . 278.9
- >279 0 4 8 16Miles
' ' I I
31

UCLA Luskn St..hoo. ()/ l'uhh,;:. ,\tfoirs
Luskin Center FOR INNOVATION
Takeaway: Access to HOV lanes varies systematically with metro
areas.
32
@ SlniValey
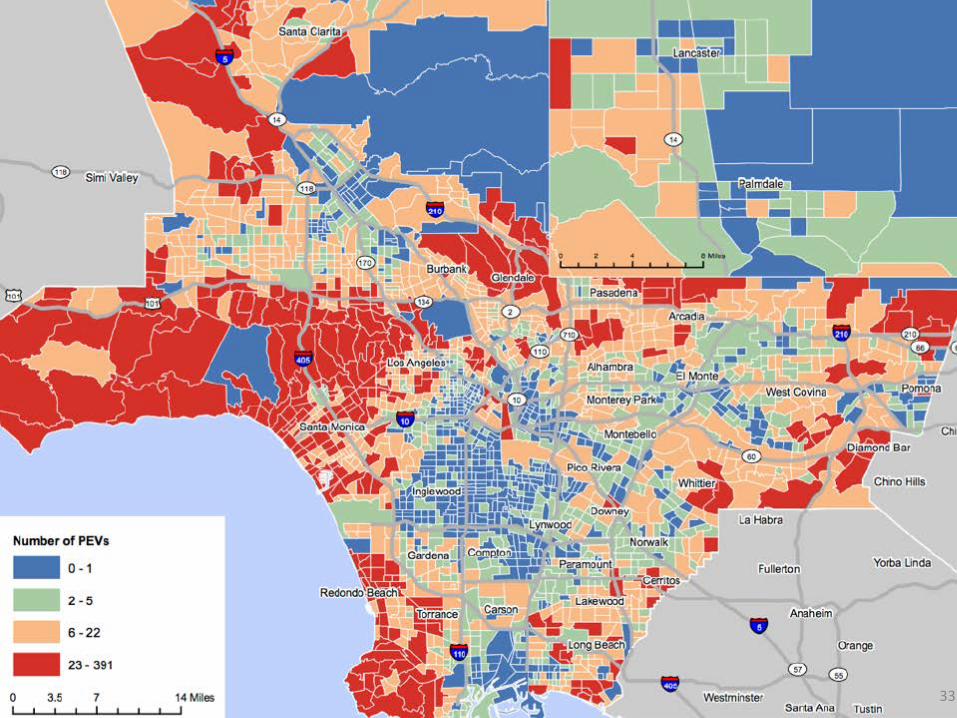
Number of PEVs
~ 0-1
2-5
6-22
~ 23 - 391
0 3.5 ~ I I I I I
14 Miles I
..... ■ I Lanciiteill .. ■
0
9
Fulerton
Ananem
Westmlnste• Sel'lll>Ana
Yotballnda
Orange
rusun 33

UCLA Luskn St..hoo. ()/ l'uhh,;:. ,\tfoirs
Luskin Center FOR INNOVATION
Takeaway: Neighborhood adoption of PEVs is not correlated with access
to HOV lanes.
34

18
16
~ 14 ru v, 12 > w 0.. 10 a, > ~ 8 ru -:::s 6 E ::s u 4
2
0
--Lower 95% Cl - Mea n Response - Upper 95% Cl
1 10 19 28 37 46 55 64 73 82 91 100
HOV Lanes within a 30-mile Radius of Census Tract
35
UCLA Luskn St..hoo. ()/ l'uhh,;:. ,\tfoirs
Luskin Center FOR INNOVATION
Takeaway: PEV adoption is higher in areas with greater HOV access.
36
UCLA Luskn St..hoo. ()/ l'uhh,;:. ,\tfoirs
Luskin Center FOR INNOVATION
New Car Buyer Market Holds Diverse Preferences for BEVs and PHEVs
37
UCLA Luskn St..hoo. ()/ l'uhh,;:. ,\tfoirs
Luskin Center FOR INNOVATION
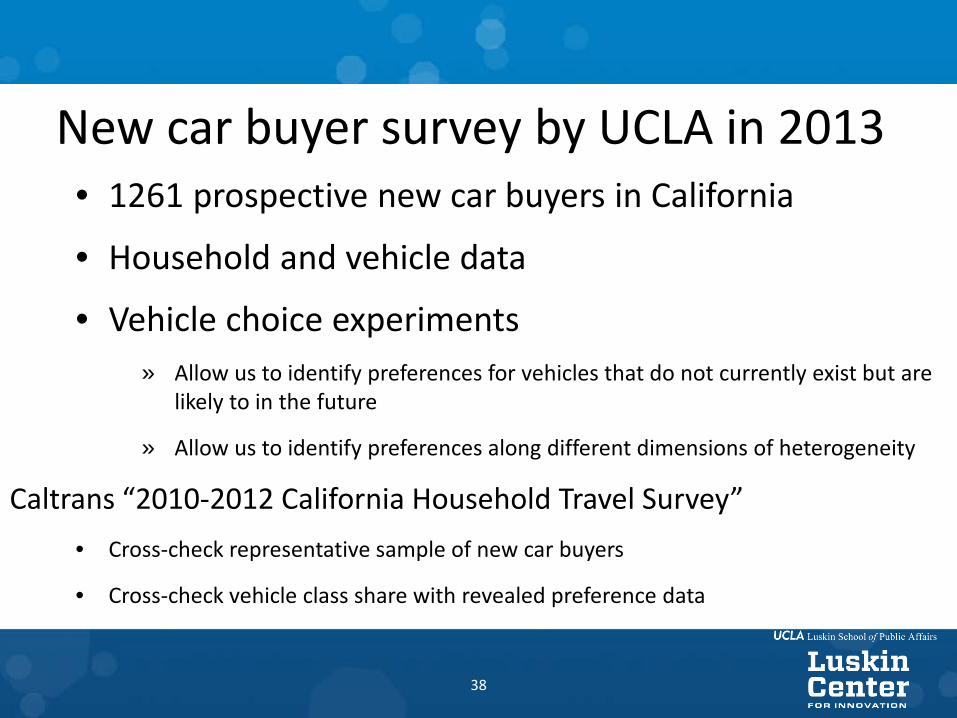
New car buyer survey by UCLA in 2013 • 1261 prospective new car buyers in California
• Household and vehicle data
• Vehicle choice experiments » Allow us to identify preferences for vehicles that do not currently exist but are
likely to in the future
» Allow us to identify preferences along different dimensions of heterogeneity
Caltrans “2010-2012 California Household Travel Survey” • Cross-check representative sample of new car buyers
• Cross-check vehicle class share with revealed preference data
38
State and Federal differentiated BEV and PHEV Rebates are critical factors in
the early market growth

UCLA Lu,J..n Sd1oc,l of I' Jbh,: :\:lall'i-
Luskin Center FOCI IN N OVATtON
Three major consumer segments for BEVs and PHEVs
32% express smallest disutility for BEVs while findingPHEVs comparable in utility to ICEs
42% of respondents express large disutility for BEVswhile finding PHEVs comparable in utility to ICEs.
26% express large disutility for both BEVs and PHEVs.
40

Takeaway: There are three distinct market segments. Two of these
segments require larger rebates for BEVs compared to PHEVs to induce
comparable sales of both.
41
UCLA Luskin S..:ho-;)l ••l l'ubli~ ,\ffJns
Luskin Center F'OQ INNOVATION
Rebate Policies Have Boosted PEV Sales
42

UCLA Luskin S..:ho-;)l ••l l'ubli~ ,\ffJns
Luskin Center F'OQ INNOVATION
Max Level of Incentives Across States, 2014 Maximum Possible Incentive Per Vehicle
$0
$1,000
$2,000
$3,000
$4,000
$5,000
$6,000
$7,000
$8,000
WV CO GA IL LA MD CA MA TX PA SC CA UT BEV BEV PHEV PHEV
43
Takeaway: State PEV rebates levels vary widely.

UCLA Luskin S..:ho-;)l ••l l'ubli~ ,\ffJns
Luskin Center F'OQ INNOVATION
Automakers and Dealers
Routinely use rebates, cash back, and discounts to sell vehicles and capture market share.
Some past deals available to consumers….
45

FIND YOUR TAG, GET $2,000 CUSTOMER CASH $1,000 DOWN PAYMENT ASSISTANCE $1,500 OPTION PACKAGE DISCOUNT
+ $2,000 PURCHASE BONUS CASH
$6,500 ~~It\5
ON SELECT 2015 VEHICLES IN STOCK WHEN YOU FINANCE THROUGH SELECT LENDERS
Get up to $3,000 Factory Cash Back on a New 2015 Avalon.
46

UCLA Luskn St..hoo. ()/ l'uhh,;:. ,\tfoirs
Luskin Center FOR INNOVATION
Research Questions for PEV market in 2014: How many additional PEV sales are associated
with the 2014 CVRP program?
How can better targeting of the 2014 CVRP program increase the cost effectiveness and improve equity outcomes?
47
UCLA Luskin S..:ho-;)l ••l l'ubli~ ,\ffJns
Luskin Center F'OQ INNOVATION
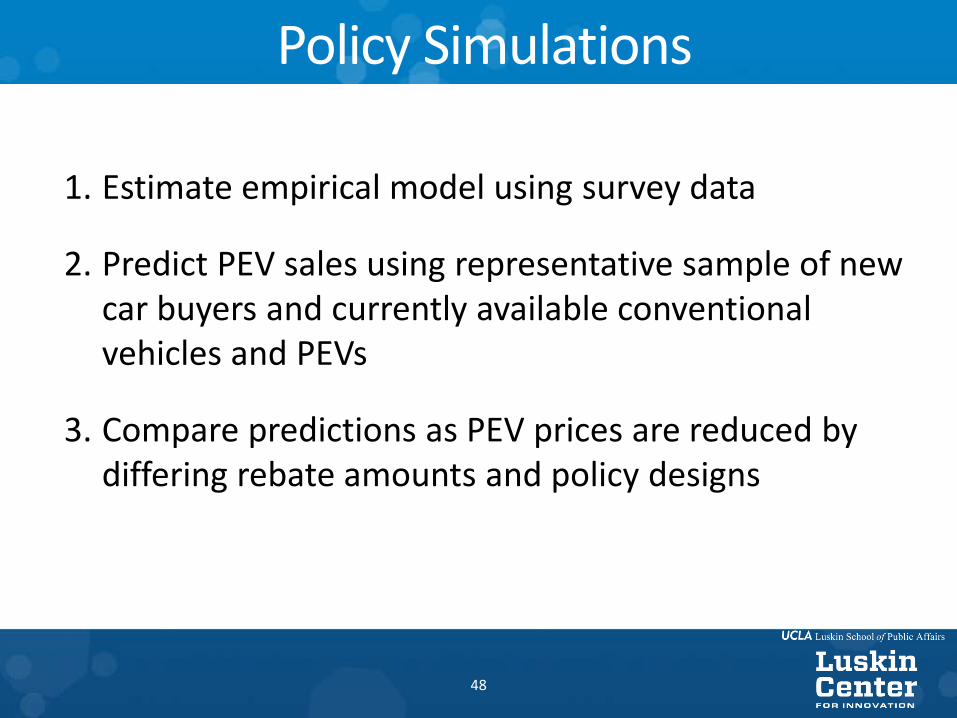
Policy Simulations
1. Estimate empirical model using survey data
2. Predict PEV sales using representative sample of new car buyers and currently available conventional vehicles and PEVs
3. Compare predictions as PEV prices are reduced by differing rebate amounts and policy designs
48

UCLA Luskin S..:ho-;)l ••l l'ubli~ ,\ffJns
Luskin Center F'OQ INNOVATION
CVRP Policy Comparison
1. Baseline (2013) policy
2. Price cap for vehicle eligibility
3. Income-tested policies
49

UCLA Luskin S..:ho-;)l ••l l'ubli~ ,\ffJns
Luskin Center F'OQ INNOVATION
Judging the Performance of Alternative CVRP Policies
Compare over 3-year policy period:
• Total additional PEVs purchased
• Cost per induced vehicle purchase
• Total program cost
• Equity: distribution of rebate funding across consumer income classes
(*Income defined for individuals not households.)
50

BEV PHEV Policy Income
Rebate Rebate
~ Under $25k $2,500 $1,500 0 c... $25-$50k $2,500 $1,500 0 :J d Ill
$50-$75k $2,500 $1,500 $75-$100k $2,500 $1,500
:J .... "' .... • . <n
$100-$175k $2,500 $1,500 $2,500 $1,500
Baseline BEVs Sold
mm 6,349
19,822 4,060
Baseline PHEVs Sold
6,203
18,667 16,981 35,735
3,371
Addt'I BEVs Addt'I Additional Total PEVs Sold PHEVs Sold PEVs Sold Sold
775 1,278 664 963 645 1,001 985 1,250 557 389
9,699 158,335
UCLA Luskin ~,hool ,,; l'ubli;: ,\tfaus
Luskin Center F'OQ INNOVATION
California Baseline Rebate Policy • Rebate is estimated to induce 9,699 PEV purchases
• Higher preference for PHEVs over BEVs
• Lower income classes have a lower preference for both PHEVs and BEVs
51

Policy
-~ 0 Cl. 0 ::::, cJ "' ::::, .... RI .... Vl
Policy
-~ 0 Cl. 0
a "' ::::, .... B!
Policy
-~ 0 Cl. 0
a "' ::::, .... fl Vl
Income BEV
Rebate PHEV
Rebate Baseline
BEVs Sold
Baseline PHEVs Sold
Under $25k ----$25-$50k 18,191
$50-$75k 10,313 18,667
$75-$100k 6,349 16,981 $100-$175k 19,822 35,735 Over$175k 4,060 3,371
Income I R::~e I PHEV Rebate I BEV Budget
Under $25k $8,431,349 $25-$50k $17,101,072 $50-$75k $27,442,629 $75-$100k $17,484,884
$100-$175k $52,018,618 Over$175k $11,541,233
Addt'I BEVs Addt'I Additional Total PEVs
Sold PHEVs Sold PEVs Sold Sold
775 1,278 664 963 645 1,001
9,699 158,335
985 1,250 557 389
PHEV Budget ITotal PEVs I Total Cost
Sold ($ Millions) $10,383,030 $29,202,579 $29,444,460
158,335 -$26,973,264
$55,478,170 $5,639,740
Additional Additional Total Cost- Addt'I Dollar Needed to Total Cost Total Cost• PEVs Sold PEVs Sold* Effectiveness Induce One Addt'I PEV* ($ Millions) ($ Millions)
Allocative Equity
9,699 N/A $30,017 N/A $291 N/A 42%
• C:nmn;irnci tn St;it w; Oun Pnlirv
California Baseline Rebate Policy • 42% of the value of the rebates is allocated to consumers making less than $75,000
52
UCLA Luskn St..hoo. ()/ l'uhh,;:. ,\tfoirs
Luskin Center FOR INNOVATION
Targeting of Rebates to Lower-Income Households Would Increase
Cost Effectiveness and Equity Outcomes
53

UCLA Luskn St..hoo. ()/ l'uhh,;:. ,\tfoirs
Luskin Center FOR INNOVATION
Principles for more cost effective rebates
Target consumers who otherwise would not have purchased PEVs. – Consumers have a lower preference for BEVs than
PHEVs so offer relatively more generous rebates for BEVs.
Target consumers who are more responsive to the rebates offered. – Lower income rather than higher income consumers.
54

Under$2Sk , $25-$50k
$S0-$7Sk $75-$100k $100-$175k
Policy I Income
QI
"' Under$25k
~ n,
QI in QI
·;;; ... E >"' u 0 u ~ .!: u
0 Ill) QI .f: c.. e-;;; >
c.. ..c ..c QI
, $25-$50k
$S0-$7Sk
$75-$100k
$100-$175k a: •
9,434
BEV Rebate
-265
(-3%)
* Compared to Status Quo Policy
I PHEV Rebate I
$22,743
6,065 18,191 10,313 18,667 6,349 16,981
19,822 35,735 4,060 3,371
BEV Budget
$34,009,626 $38,472,680 $21,681,786
-$7,274 (-24%)
$0 $0 $0
2,610 528 639
PHEV Budget
$215
$38,679,027 $62,401,798 $19,305,549
-$77 (-26%)
$0 $0 $0
9,434 158,090
I Total PEVs I Total Cost
Sold ($ Millions)
158,090 -100%
Income-Tested Rebate Levels • One of the most cost-effective policies and one of lowest total program costs
• 100% of rebates allocated to households with incomes less than $75,000
• Superior to baseline policy
55

UCLA Luskn St..hoo. ()/ l'uhh,;:. ,\tfoirs
Luskin Center FOR INNOVATION
Falling Gas Prices are Statistically Correlated with Falling PEV Sales
56
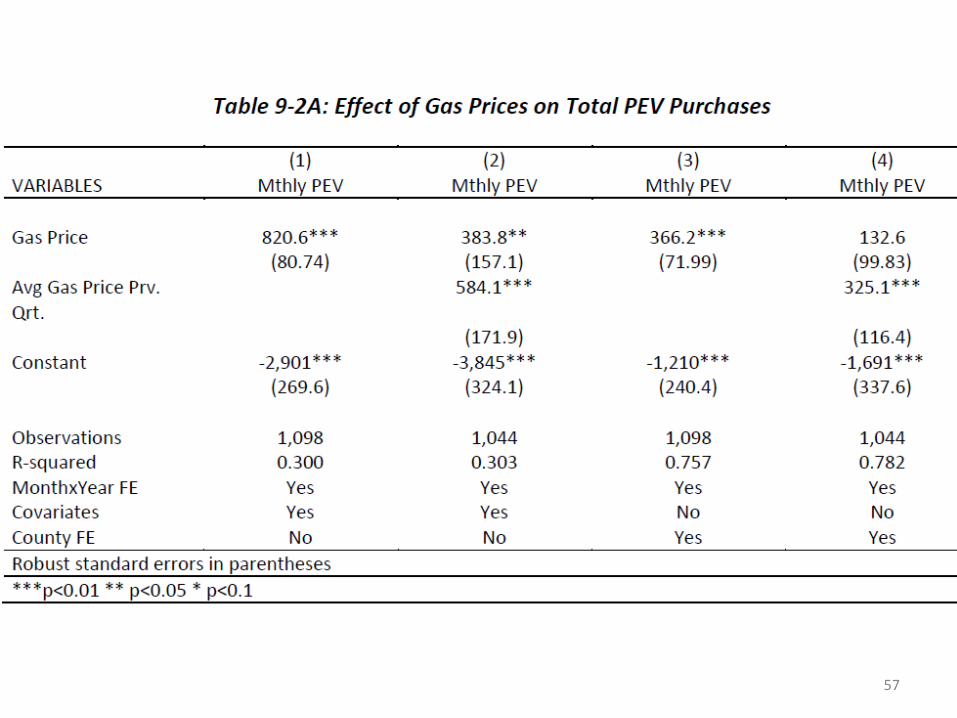
Table 9-2A: Effect of Gas Prices on Total PEV Purchases
(1) (2) (3) (4) VARIABLES Mthly PEV Mt hly PEV Mthly PEV Mthly PEV
Gas Price 820.6* * * 383.8* * 366.2* * * 132.6 {80.74) (157.1) {71.99) (99.83)
Avg Gas Price Prv. 584.1 * * * 325 .1 ** * Qrt .
(171.9) (116.4) Constant -2 901 * * * I -3 845* * * I -1 210* * * I -1 691 * * * I
(269.6) (324.1) (240.4) (337.6)
Observations 1,098 1,044 1,098 1,044 R-squared 0.300 0.303 0.757 0.782 Mont hxYear FE Yes Yes Yes Yes Covariates Yes Yes No No
County FE No No Yes Yes
Robust standa rd errors in parent heses
* * * p<0.01 * * p<0.05 * p<0.1
57
Takeaway: Higher gas prices are associated with higher PEV sales.
58

Gas Price
Lagged Qrt Gas Price
Model 1: County Fixed-
Fff P.r.t.~
Model 2: county Hxed [ ffect s (Log)
Model 3: NB Census- I ract
Table 9-6: Simulations of the effects of increasing gas prices on PEV sales
Month 1 Month 2 Month 3 Month 4 Month 5 Month 6
$3.00 $3.00 $3.00 $3.00 $4.00 $4.00
$3.00 $3.00 $3.00 $3.00 $3.00 $3.33
156 156 156 156 289 397
l~b l~b l~b l ~b lUb 113
156 156 156 156 196 187
Month 7
$4.00
$3.67
505
:219
178
1-'ct Change
Month 8 Month 8 to
Month 4
$4.00
$4.00
614 293%
llb 4~%
169 8%
UCLA I u~kin Scho-'.l l oj Puhli:: Att:tm
Luskin Center P"C:,R 1,,11,,ovP.TIOl\,I
59

Takeaway: Gas price increases are expected to increase PEV sales but
the magnitude is uncertain.
60
UCLA Luskn St..hoo. ()/ l'uhh,;:. ,\tfoirs
Luskin Center FOR INNOVATION
Concluding remarks
• Spatially purchase patterns follow new car buyer trends.
• Strong support for CVRP and EFMP Plus-Up Reforms.
• Need for fuller representation of PEVs in larger body type vehicles.
61