factors affecting measurement of raw edge …
TRANSCRIPT

Saimaa University of Applied Sciences Faculty of Technology, Imatra Degree Programme in Paper Technology
Yinusa, Adeola McSteven
FACTORS AFFECTING MEASUREMENT OF RAW
EDGE PENETRATION / EDGE-WICKING
TENDENCY
Thesis 2011

2
Abstract Yinusa, Adeola McSteven Factors Affecting Measurement of Raw Edge Penetration / Edge Wicking Tendency, 34 pages, 2 appendices Saimaa University of Applied Sciences Faculty of Technology, Imatra Degree Programme in Paper Technology Thesis 2011 Tutors: Ms Pirjo Jaakkola, Principal Lecturer, Saimaa University of Applied
Sciences Mrs Titta Lammi, Research Scientist, Stora Enso.
The primary goal of this thesis was to investigate and identify the significant factors affecting the measurement of raw edge penetration / edge wicking into raw board. In addition to this, an effort was made to analyse the variance of results with respect to different board samples, temperature, barrier materials, different examiners and test-life of coffee samples. This study was mainly executed at the laboratory of the Research Centre, Imatra (RCI). The work utilised water-bath as the main equipment and three board samples. The main tests were executed within the framework of Taguchi model for quality engineering which optimises the combinations, between the test parameters and their measurement levels, which guarantee reliable results. It was however inferred that sample area, covering, direction of cutting, liquid temperature, liquid age and test duration were the most significant contributors to edge wicking. Cutter efficiency, PE-coating of base board, difficulty of result reproducibility and long test-life (in hours) of coffee samples were additional findings. Based on the findings, it is therefore recommended that the optimal concentration and peak activity (with respect to age) of light-roasted coffee as well as different covering materials on 2PE base board sample be further analysed. Keywords: Raw Edge Penetration, Edge Wicking, Quality Engineering, Taguchi Matrix

3
Table of Contents
Terminology ........................................................................................................ 4 LITERATURE PART ........................................................................................... 6 1 Introduction ...................................................................................................... 6 2 Overview of Paperboard (Cup Stock) Production Process............................... 7 3 Theory of Liquid Penetration ............................................................................ 9
3.1 Wetting .................................................................................................... 12
3.2 Sizing ....................................................................................................... 13
3.3 Classification of Test Methods................................................................. 15 3.3.1 Sample Penetrated by the Test Liquid............................................... 16 3.3.2 Measurement of Liquid Absorption .................................................... 16 3.3.3 Surface Tests Related to Sizing ........................................................ 16
4 Edge Wicking / Raw Edge Penetration .......................................................... 17 4.1 Factors Affecting Edge Wicking ............................................................... 17
4.1.1The Porous Medium ........................................................................... 17 4.1.2 The Aqueous Medium ....................................................................... 18 4.1.3 The Environment ............................................................................... 18
4.2 Measurement ........................................................................................... 19
EXPERIMENTAL PART .................................................................................... 20 5 Objective of the Experimental Part ................................................................. 20 6 Materials and Method..................................................................................... 21
6.1 Materials .................................................................................................. 21
6.2 Method ..................................................................................................... 21
7 Results and Discussion .................................................................................. 24 7.1 Analysis of Investigated Factors .............................................................. 24
7.1.1 Sample Area ...................................................................................... 24 7.1.2 Curing of Sample ............................................................................... 25 7.1.3 Covering ............................................................................................ 25 7.1.4 Direction of Cutting ............................................................................ 25 7.1.5 Liquid Sample .................................................................................... 25 7.1.6 Liquid Temperature ........................................................................... 25 7.1.7 Liquid Age ......................................................................................... 26 7.1.8 Direction of Sample ........................................................................... 26 7.1.9 Test Duration ..................................................................................... 26 7.1.10 Auxiliary Factors .............................................................................. 26
7.2 Analysis of Variations .............................................................................. 27
7.2.1 Comparison of EWT Indices of Different Board Samples .................. 27 7.2.2 EWT Index as an Effect of Temperature ........................................... 28 7.2.3 EWT Index as an Effect of Barrier Material ....................................... 29 7.2.4 Comparison of EWT Indices from Different Examiners ..................... 29 7.2.5 Assessment of Test-life of Coffee ...................................................... 31
8 Conclusions ................................................................................................... 32 Figures .............................................................................................................. 33 Tables ............................................................................................................... 33 References........................................................................................................ 34

4
Appendices Appendix I Data from Main Effects Analysis Appendix II Data for Secondary Evaluation

5
Terminology
REP Raw Edge Penetration EWT Edge Wicking Tendency PE Polyethylene extrusion 1PE One side polyethylene extrusion coated 2PE Both sides polyethylene extrusion coated AKD Alkyl ketene dimer ASA Alkenyl succinic anhydride SBS Solid bleached sulphate board Operator 1 Author
6
LITERATURE PART
1 Introduction
This thesis work mainly set out to investigate and identify, among sample area;
curing of sample; covering; direction of cutting; liquid sample; liquid
temperature; liquid age; direction of sample and test duration, the most
significant elements contributing to edge-wicking in raw board sample in a
laboratory atmosphere (230C, 50% RH). In furtherance of seeking better
understanding of the wicking defect, comparative analysis of the results with
respect to different board sample, temperature, barrier material, examiner and
test-life of the coffee sample became imperative.
The need for this task is informed by the deterioration of coffee cups among
others, especially during end use. This deterioration specifically refers to the
penetration of coffee into the base-board through the raw edge which, unlike the
board surface, is unprotected by any barrier material. Being a popular
commodity in the consumer market, producers of cup stocks are challenged to
continuously improve the quality of their products to the satisfaction of their
customers.
This experiment based problem was treated using a statistical experiment plan
developed for quality engineering and popularly referred to as the ‘Taguchi
Method’. The method presents an orthogonal array (matrix) which significantly
reduces the required number of tests that guarantees reliable result.
This work is presented in two parts: literature and experimental parts. The
literature part provides an overview of the cup stock production process. It also
discusses the theory of liquid penetration as well as the concept of edge
wicking. The experimental part on the other hand introduces the methodology
behind the work and evaluates the results which establish the premises for
making conclusions and recommendations for further studies.
7
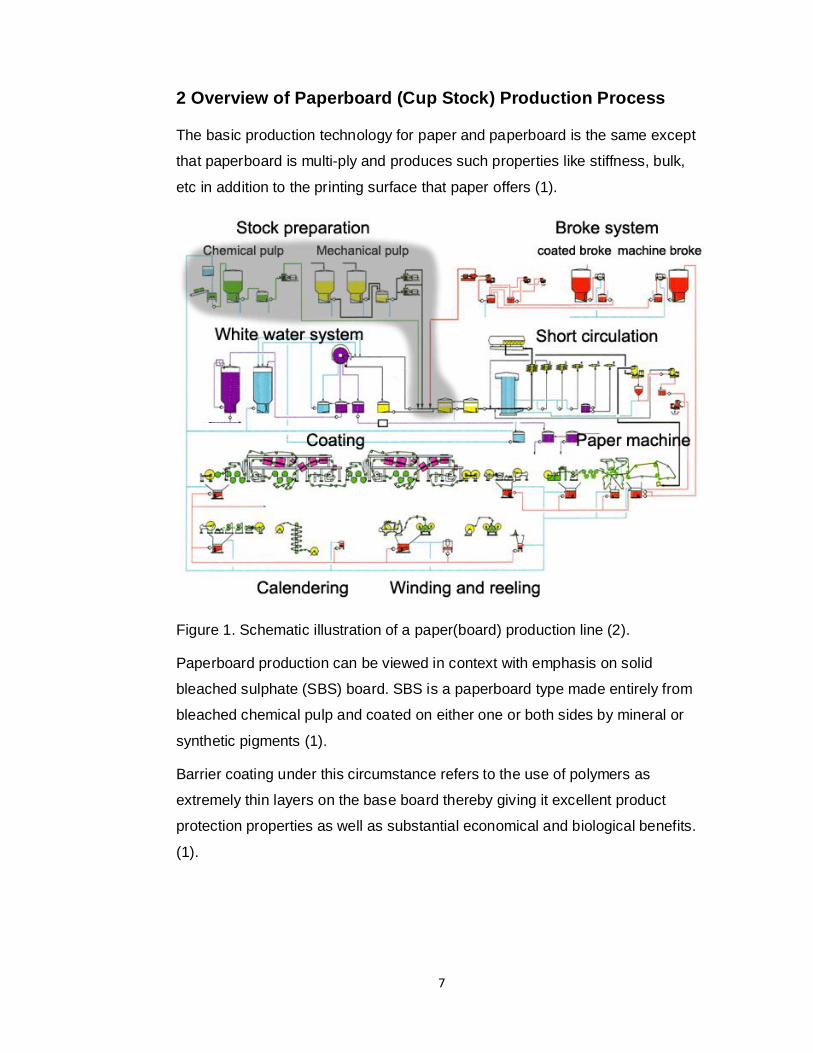
2 Overview of Paperboard (Cup Stock) Production Process
The basic production technology for paper and paperboard is the same except
that paperboard is multi-ply and produces such properties like stiffness, bulk,
etc in addition to the printing surface that paper offers (1).
Figure 1. Schematic illustration of a paper(board) production line (2).
Paperboard production can be viewed in context with emphasis on solid
bleached sulphate (SBS) board. SBS is a paperboard type made entirely from
bleached chemical pulp and coated on either one or both sides by mineral or
synthetic pigments (1).
Barrier coating under this circumstance refers to the use of polymers as
extremely thin layers on the base board thereby giving it excellent product
protection properties as well as substantial economical and biological benefits.
(1).

8
Hot liquid dispensing cups, for example coffee cups, are made from paperboard
which has been produced with chemistry that gives a relatively high liquid
repellence. The board in this circumstance is usually PE-coated on one side so
as to improve the board surface resistance to liquid take-up.
A somewhat general process of producing these cups is illustrated in figure 2
below.
Figure 2. Schematic representation of paper cups making process (3; 4).
The cup wall paper having been die-cut is transmitted to the mould where it is
shaped into conical structure. The wall is sealed in this mould before it
advances for bottom inclusion.
The bottom paper roll is conveyed to the bottom-punching section where the
cup bottom is cut out and advanced for combination with the shaped wall in the
bottom feeding section.
There is pre-heating of the components’ parts and specific bottom heating
operations preceding the cup bottom knurling to the cup cone body. The cup top
is then curled into circular shape and the finished cup is subjected to various
post production handling measures. (3; 4).

9
3 Theory of Liquid Penetration
The concept of liquid penetration may be streamlined and appreciated from the
perspective of the liquid, the porous material and the environment as the major
contributing factors.
The imbibitions of water and other liquids in a fibre web is a dynamic and
transient phenomenon characterized by non-uniform distribution of fluid, which
varies with time, in the spatial dimensions of the fibre web. (5, p. 76)
Four notable mechanisms of water transport in paper considered are (6; 7; 8; 9)
• Capillary transport of liquid in the pores
• Water transport through the fibres
• Surface diffusion in the pores
• Diffusion transport of vapour in the pores
Every paper product is by virtue of its end use expected to serve out some
degree of permeability (10, p. 285). Various paper grades therefore
demonstrate exclusive features in this capacity as shown in table 1.

10
Table 1. Permeability of different paper grades (10, p. 28)
Paper grade Basis weight (g/m2) Permeability (cm3/min)
Tea bag tissue 18 22 000
Foam laid paper 30 19 100
Oil filter 139 18 500
Toilet tissue 17 12 700
Vacuum dust bag 42 11 150 Crepe filter 85 5 100
Electric filter 127 4 800
Blotting paper 130 4 600
Impregnating paper 205 1 060
Cigarette tissue 25 930
Bond paper 76 350
Newsprint 53 290
Copy paper 80 210
Writing paper 88 175
Wrapping tissue 12 130
Cardboard 247 20
Glassine, base paper 41 2.1
Glassine 36 1.2
Art printing paper 115 1.0
Tracing paper 111 0.3
Depending on the hydrophobicity of paper, the irregular and unevenly
distributed pores, a water-based solution is either drawn into the paper network
by capillary action or restricted from penetrating.
On the assumption that paper is made up of cylindrical capillaries of constant
average radius, r; its net resistance to penetration (capillary pressure), ∆p is
given by the Laplace equation as (11, p. 3)
r
p θγ cos2=∆ (1)
where γ is the fluid surface tension.

11
The Hagen-Poiseuille law of laminar flow, applicable to ideal cylindrical
structure, holds that the flow rate, q, is proportional to the pressure drop
gradient, ∆p, along the cylinder (11, p. 3)
Lpr
dtdLq ∆
⋅==η8
2
(2)
where η is the fluid viscosity and L is the wetted length of the cylinder.
A combination of equations (1) and (2) yields the Lucas-Washburn equation
applicable in horizontal geometry with no influence of gravity and given as (11,
p. 4)
trLη
θγ2cos
= (3)
However, the deviations between the actual water penetration in paper and that
predicted by the Lucas-Washburn equation have been suggested to be as a
result of the following (8, p. 1):
• Air counter pressure
• Liquid transport through the vapour phase
• External pressure
• Expansion, swelling of the fibre network
• Dynamic nature of the capillary pressure
Another means of describing the flow in porous media from the perspective of a
linear, slow and steady-state system is given by Darcy´s law as (9, p. 4)
00 Lpk
LPKq ∆
⋅−=∆
−=η
(4)
where L0 is the length of the sample, K is the flow conductivity of the medium
and k is the permeability of the medium and inclusive of such structural and
geometrical properties as porosity, tortuosity and specific surface area.
12
The Kozeny-Carman equation in turn defines permeability, k, as a function of
the Kozeny constant, k’, which encompasses both shape and tortuosity factors
as (11, p. 4):
2
3
220
3
)1()1(' φφ
φφ
−∝
−=
Skk (5)
where S0 is the surface area of the channels per unit volume of the solid
material and φ is the porosity defined as a ratio of pore volume to total sheet
volume.
3.1 Wetting
The practical distinction between a surface wetted by water and another not
wetted is that the former allows spontaneous spread in a continuous film while
with the latter, small, separate droplets which form a contact angle at the air-
water-solid interface is witnessed. The formation of this contact angle is defined
in an approximate form by Young’s as a function of the interfacial (surface)
tension, γ , between the solid and liquid as (9, p. 152):
l
sls
γγγ
θ−
=cos (6)
where s, l and sl are solid, liquid and solid-liquid interfaces subscripts.
Wetting of paper expands the paper structure, in turn affecting the forced
edgewise liquid absorption, and paper made from different pulps expand to
different degrees (12, p. 345).
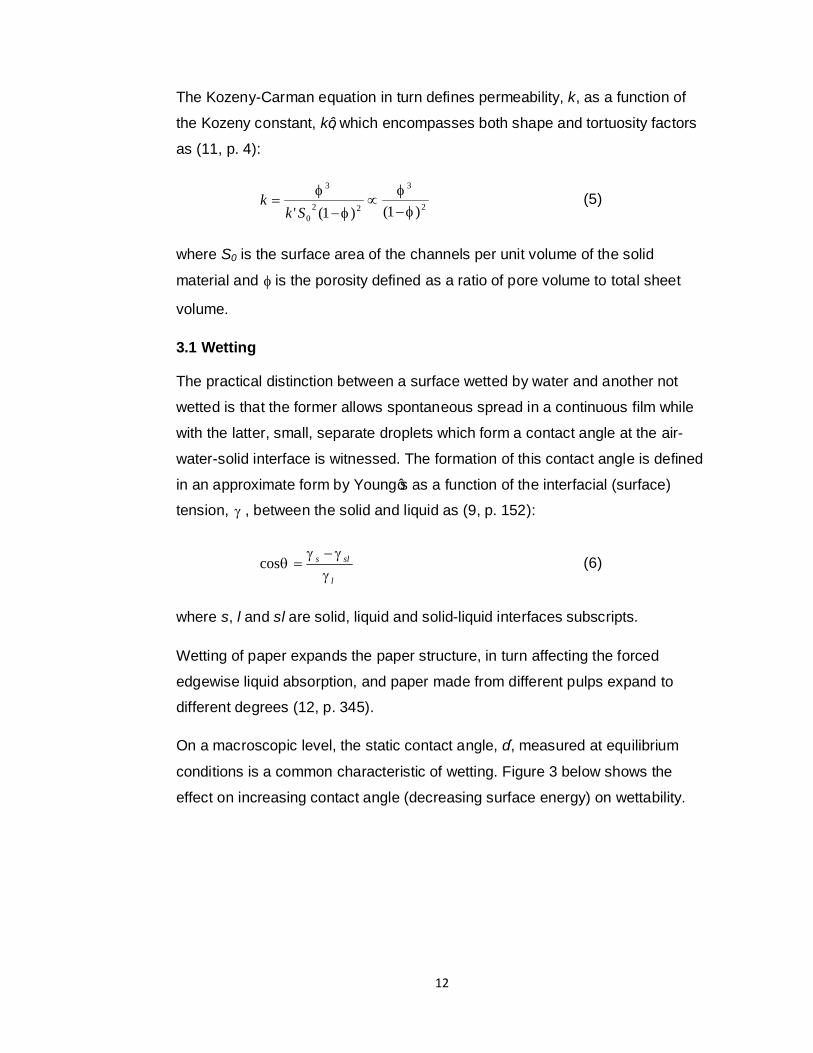
On a macroscopic level, the static contact angle, θ, measured at equilibrium
conditions is a common characteristic of wetting. Figure 3 below shows the
effect on increasing contact angle (decreasing surface energy) on wettability.
13
Figure 3. Effect of fibre surface energy on wetting (2). A decreasing free surface
energy (increasing contact angle, θ) signals a reduction in wetting tendency.
Chemically, wetting is an adhesion phenomenon between a liquid and a solid
surface and is capable of proceeding spontaneously on the strength of surface
tension, even if the contact angle, θ, is greater than 900 and external pressure is
zero, provided there are converging capillaries in the paper. (10, pp.295-296).
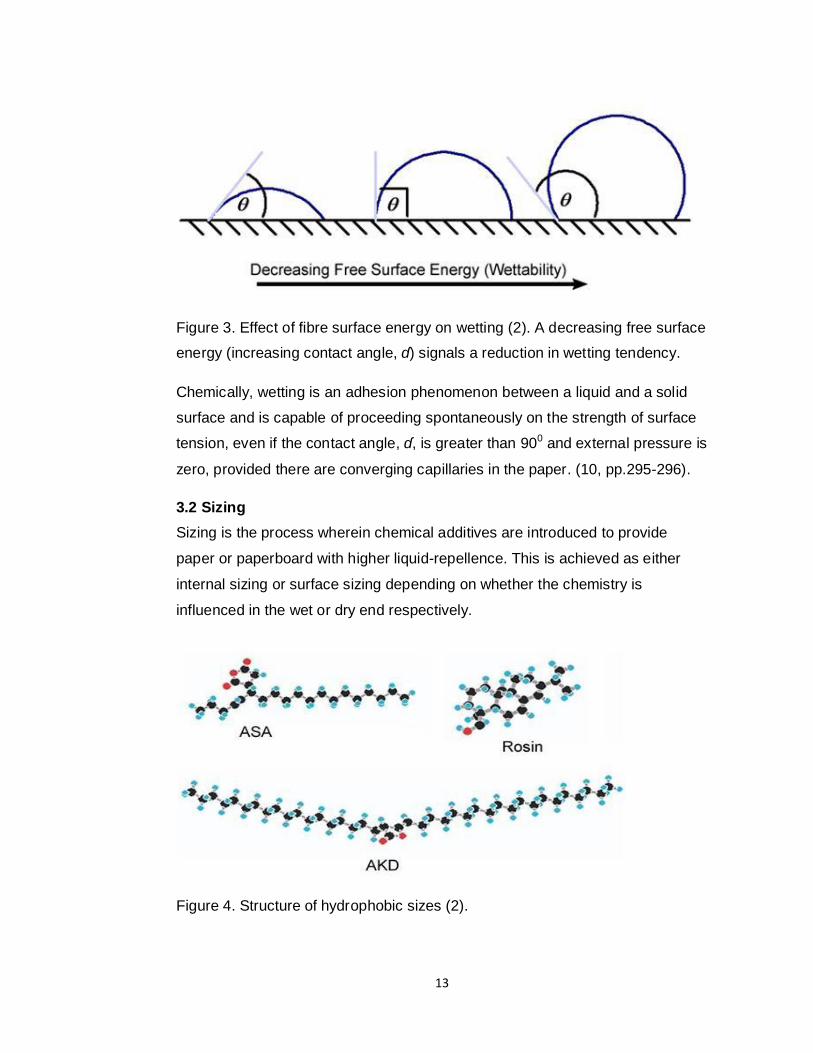
3.2 Sizing Sizing is the process wherein chemical additives are introduced to provide
paper or paperboard with higher liquid-repellence. This is achieved as either
internal sizing or surface sizing depending on whether the chemistry is
influenced in the wet or dry end respectively.
Figure 4. Structure of hydrophobic sizes (2).

14
The three most common internal sizing agents (figure 4) currently in use are
rosin systems (in acidic conditions), alkyl ketene dimers (AKD) and alkenyl
succinic anhydride (ASA) (both in the new trend of neutral sizing and indeed of
growing relevance and acceptance). Table 2 below compares neutral sizing to
rosin sizing techniques.
Table 2. Comparison of neutral sizing to rosin sizing (2)
Advantages
- cleaner water system (no alum)
- better strength properties
- higher filler content, CaCO3
- better archiving permanence
- less corrosion
- good protection against lactic acid
Disadvantages
- potential for slipping problems
- increase of bacterial growth
- slower curing with AKD
- more difficult to control sizing
- durability against hot liquids
- poor finish on machines
Sizing aims to reduce the pore size (radius) and also lower the free surface
energy of the paper. This activity is necessitated by the following reasons (9, p.
151):
• Control of aqueous phase penetration in converting operations
• Control of liquid absorption or wetting in a printing process
• Control of the serviceability of many grades of paper and board
Internal sizing although hinders liquid penetration into the bulk of the paper
structure, it does not prevent vapour penetration (4, pp. 19-21). For a sized
paper however, this absorption of water vapour could not initiate much sheet
expansion unless the flow resistance of the paper is subdued by liquid pressure
(11, p.1).
15
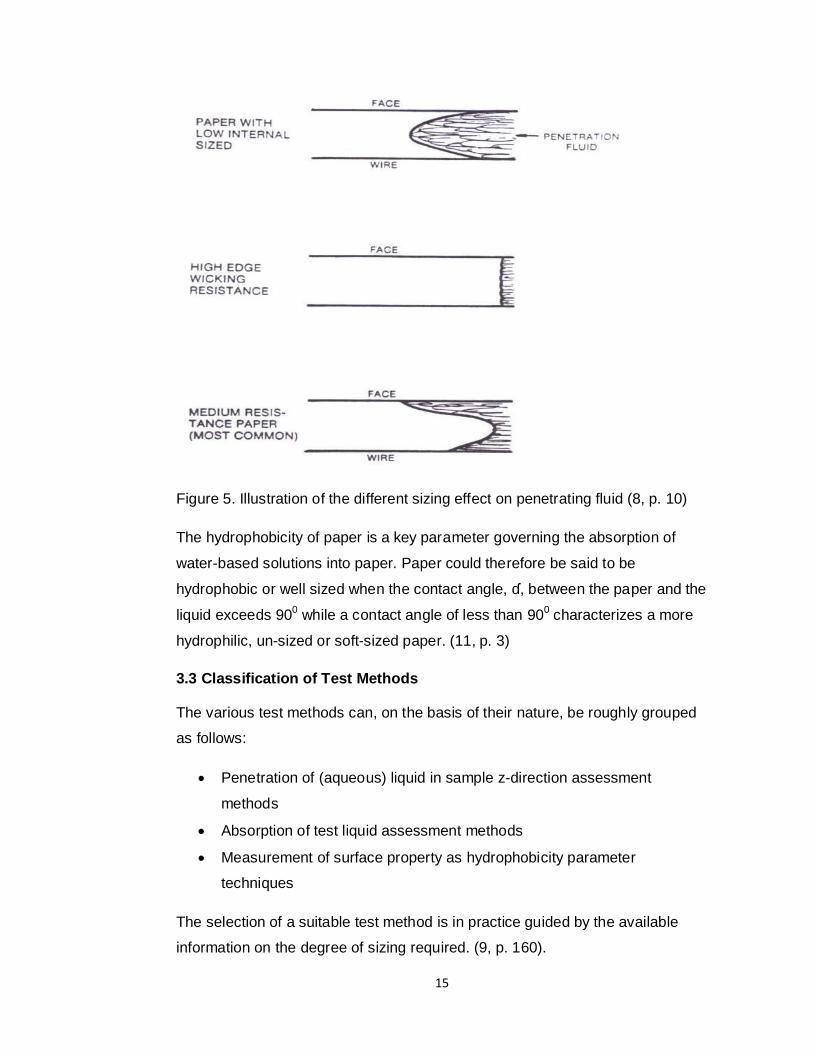
Figure 5. Illustration of the different sizing effect on penetrating fluid (8, p. 10)
The hydrophobicity of paper is a key parameter governing the absorption of
water-based solutions into paper. Paper could therefore be said to be
hydrophobic or well sized when the contact angle, θ, between the paper and the
liquid exceeds 900 while a contact angle of less than 900 characterizes a more
hydrophilic, un-sized or soft-sized paper. (11, p. 3)
3.3 Classification of Test Methods
The various test methods can, on the basis of their nature, be roughly grouped
as follows:
• Penetration of (aqueous) liquid in sample z-direction assessment
methods
• Absorption of test liquid assessment methods
• Measurement of surface property as hydrophobicity parameter
techniques
The selection of a suitable test method is in practice guided by the available
information on the degree of sizing required. (9, p. 160).

16
3.3.1 Sample Penetrated by the Test Liquid
This deals with methods involving penetration from top to bottom, namely:
• The Currier test, KBB test and NBS method – all based upon measuring
conductivity to detect the penetration of water
• The Hercules Size Test (HST) which involves optical recording of the
penetration of a coloured test liquid
On the other hand, there are methods based upon the movement of liquid from
the bottom of the sample toward the top and these include: (9, p. 160-162)
• Fluorescent Dye Size Test
• Dry Indicator Test
• Ink Flotation Test
• Ferric thiocyanate Test
• Lactic Acid (Penescope) Test
3.3.2 Measurement of Liquid Absorption
In this category where test liquid absorption is assessed are: (9, p. 162-163)
• Cobb Test
• Total Immersion Test; and
• Edge-wick (Klemm Capillary Rise) Test
3.3.3 Surface Tests Related to Sizing
Test methods which measure surface property as an index for hydrophobicity
include: (9, p. 163-164)
• Contact angle
• Drop test
• Curl test

17
4 Edge Wicking / Raw Edge Penetration
Edge wicking, or edge penetration, refers to the in-plane wetting of a paper
structure. This is generally observed on the exposed edge of extrusion coated
or other barrier layered products. (7, p. 7).
In context, edge wicking is of major interest because as a defect during the end-
use of the product, it might result in cosmetic discrepancy or undesired opening
at the sealing points (13, p. 1).
Edge wicking is of a very different nature from other water sorption tests with at
least five characteristic weak points, namely (6, p. 20):
• The unsized fibre lumens
• The unsized cut edges of the fibres
• Unsized fibre-fibre bonds
• Cutting defects, resulting in delaminating and exposure of unsized
regions
• Weak bonding between layers
4.1 Factors Affecting Edge Wicking
The numerous factors affecting edge wicking can be largely attributed to the
porous medium itself, the aqueous medium or the environment. Some of these
factors, however, sometimes have a combined effect from the afore-mentioned.
4.1.1The Porous Medium
From the perspective of the porous medium, the significant parameters include:
• The process chemistry of the paper(board) web including the degree of
sizing
• Temperature
• Moisture content
• The adhesion potential with the barrier material
18
4.1.2 The Aqueous Medium
The test liquid brings forth a number of factors whose influence on edge wicking
cannot be over-emphasized. Unlike pure water which would be an ideal liquid,
in practice, most test liquids demonstrate unique properties as a result of their
chemical composition. Notable amongst the influencing parameters of the test
liquids are:
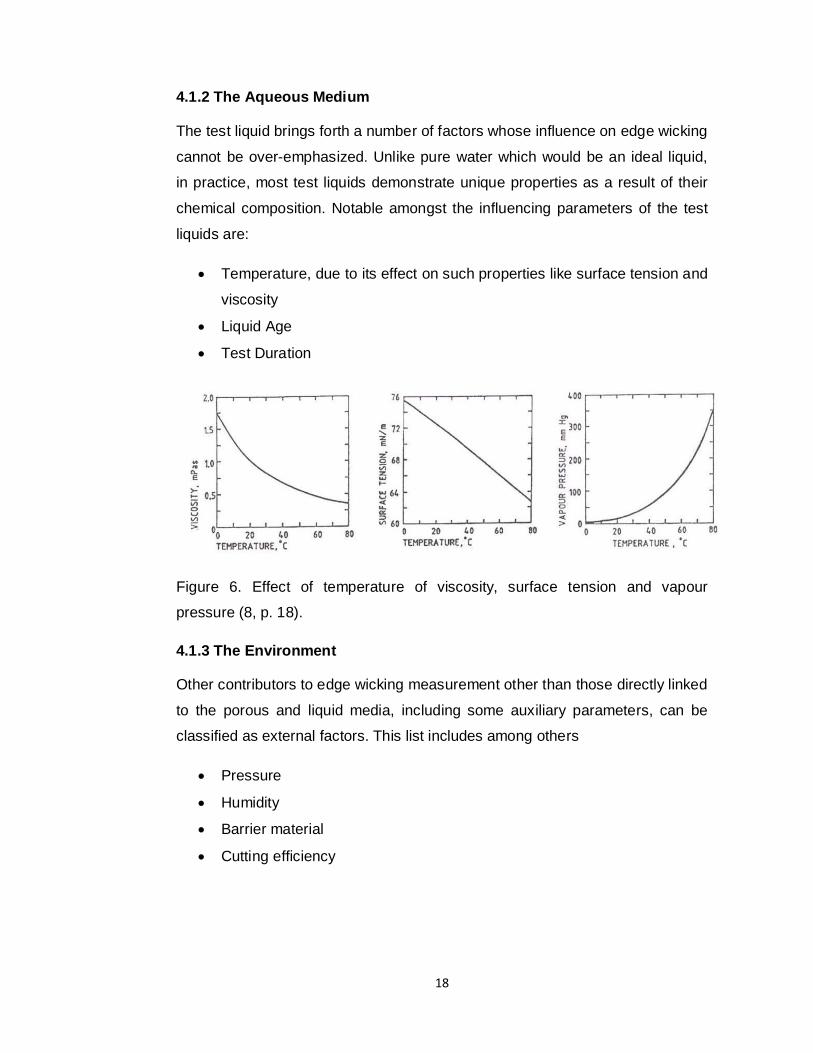
• Temperature, due to its effect on such properties like surface tension and
viscosity
• Liquid Age
• Test Duration
Figure 6. Effect of temperature of viscosity, surface tension and vapour
pressure (8, p. 18).
4.1.3 The Environment
Other contributors to edge wicking measurement other than those directly linked
to the porous and liquid media, including some auxiliary parameters, can be
classified as external factors. This list includes among others
• Pressure
• Humidity
• Barrier material
• Cutting efficiency

19
Figure 7. A comparison of pressurized and atmospheric edge wicking from the
perspective of calendering, wet pressing and beating in the same material (13,
p. 18).
4.2 Measurement
Edge wicking measurement techniques can be broadly viewed as either
undertaken in atmospheric or pressurized conditions.
In context, the edge wick result expressed as edge wick index, EW (kg/m2), is
calculated according to the formula (12, p.4)
ltWWEW
⋅−
= 12 (7)
where W1 and W2 are the weights (g) of the test piece before and after
exposure, t is the thickness (mm) of the sample and l is the perimeter (m) of the
exposed sample edge.

20
EXPERIMENTAL PART
5 Objective of the Experimental Part
The primary goal of this experimental task was to investigate and identify the
significant factors affecting the measurement of raw edge penetration / edge
wicking into raw board. The magnitude of each factor which constituted the test
parameters was to be identified under the test conditions as a means of
separating the important elements from the otherwise insignificant ones.
On a periphery, the work also sought to sketchily compare the edge wicking
indices of
• different boards samples under the same general test conditions,
• one board sample as a function of temperature,
• one board sample as a function of barrier medium,
• the same board sample as examined by different individuals under the
same general test conditions, and
• serial tests from one board sample in attempt to determine the feasible
strength / test-life of coffee sample.
21
6 Materials and Method
The experimental methodology adopted in this work is presented in this section.
It provides information on the materials used, as well as the test procedures.
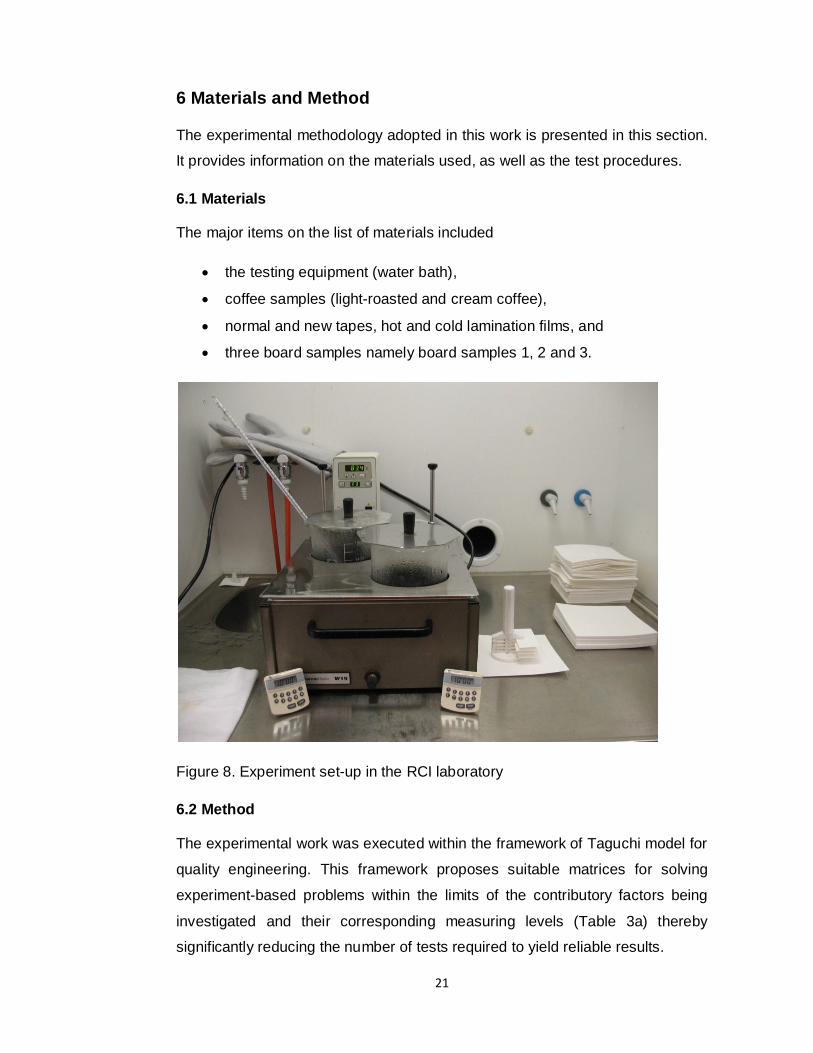
6.1 Materials
The major items on the list of materials included
• the testing equipment (water bath),
• coffee samples (light-roasted and cream coffee),
• normal and new tapes, hot and cold lamination films, and
• three board samples namely board samples 1, 2 and 3.
Figure 8. Experiment set-up in the RCI laboratory
6.2 Method
The experimental work was executed within the framework of Taguchi model for
quality engineering. This framework proposes suitable matrices for solving
experiment-based problems within the limits of the contributory factors being
investigated and their corresponding measuring levels (Table 3a) thereby
significantly reducing the number of tests required to yield reliable results.

22
Table 3a. Definition of the measuring levels for each investigated factor
Table 3b. An outline of the L-27 matrix corresponding to the test conditions

23
The tests were carried out under atmospheric condition. The utilisation of table
3b above would be better understood by randomly defining one item from the
27 tests IDs on table 3a. Taking as an example ID-27, the test sequence went
as follows:
• Firstly, a larger board sample was cut at 900 angle to the machine
direction (Direction of Cutting – Level 1).
• The board sample was then kept for 24 hours in each of the different
conditions of cold storage (60C, 62% RH), tropical climate (380C, 85%
RH) and laboratory atmosphere (230C, 50% RH) (Curing of Sample –
Level 3) after which its thickness was measured.
• The board was then covered by hot lamination (Covering–Level 2).
• This board sample was at this point cut to strip size 40 mm X 40 mm
(Sample Area – 3) and weighed as dry mass. In doing the cutting, the
cutter was properly cleaned so as to minimise cutting defects in the test
strip.
• The test strip was then immersed horizontally (Direction of Sample –
Level 1) in about four-hour old (Liquid Age – Level 2) cream coffee
sample (Liquid Sample – Level 2) that had been stabilised at 840C
(Liquid Temperature – Level 1) and the test was allowed to proceed for
10mins (Test Duration – Level 1).
• As promptly as the test duration lapsed, the strips were collected from
the liquid sample and gently mopped-off of the excess coffee sample
before weighing with each mass recorded as the corresponding wet
mass of the strip.
Two parallel measurements were made for each set of four strip collections and
the corresponding EWT index was calculated according to equation (7).
The details of this procedure applied to the fundamental aspect of this thesis
work and specifically with board sample 1 only. The secondary tasks however
as enumerated in section 5.1 were executed, with respect to table 3, at Level 1
for all factors with the exception of Sample Area in which only Level 2 was used
and also Liquid Sample and Liquid Temperature where Levels 1 and 2 were
utilised.
24
7 Results and Discussion
The results of the experiments were considered separately for the primary task
as scheduled by the L-27 matrix and variation analysis.
7.1 Analysis of Investigated Factors
The parameters that were directly examined in this work are discussed
independently of each other in this section. This was intended to allow
exhaustive and careful analysis of their various roles.
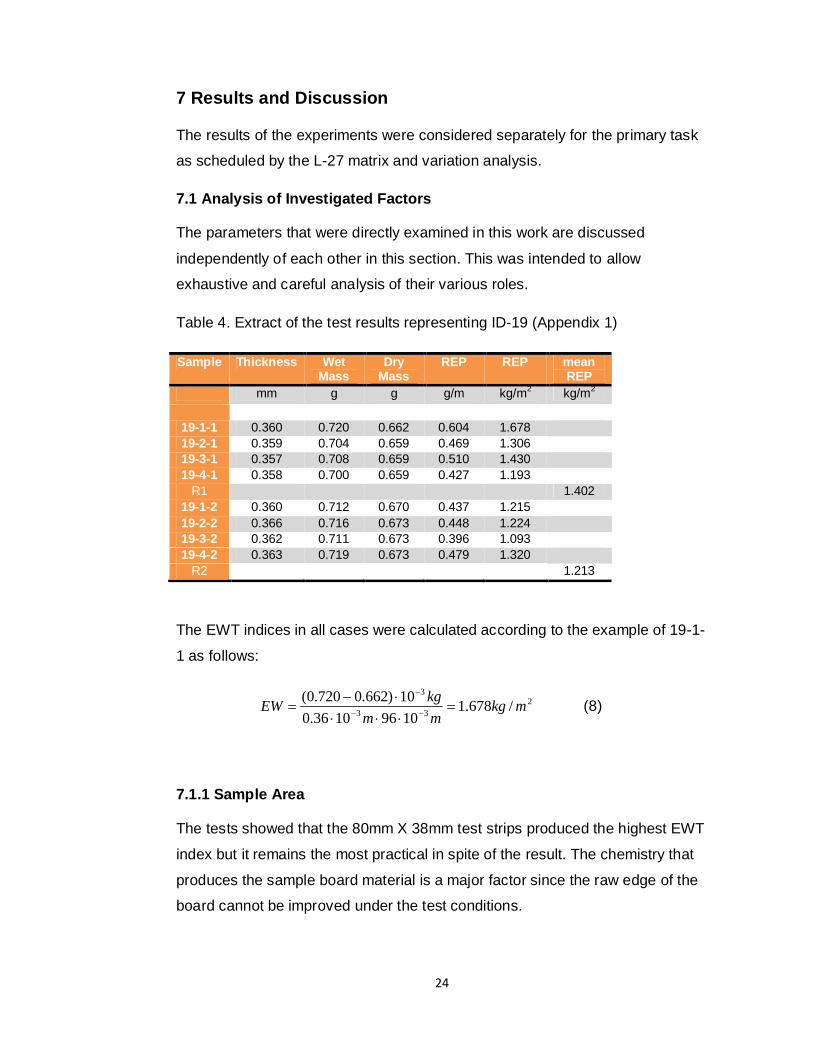
Table 4. Extract of the test results representing ID-19 (Appendix 1)
Sample Thickness Wet Mass
Dry Mass
REP REP mean REP
mm g g g/m kg/m2 kg/m2
19-1-1 0.360 0.720 0.662 0.604 1.678 19-2-1 0.359 0.704 0.659 0.469 1.306 19-3-1 0.357 0.708 0.659 0.510 1.430 19-4-1 0.358 0.700 0.659 0.427 1.193
R1 1.402 19-1-2 0.360 0.712 0.670 0.437 1.215 19-2-2 0.366 0.716 0.673 0.448 1.224 19-3-2 0.362 0.711 0.673 0.396 1.093 19-4-2 0.363 0.719 0.673 0.479 1.320
R2 1.213
The EWT indices in all cases were calculated according to the example of 19-1-
1 as follows:
233
3
/678.110961036.010)662.0720.0( mkg
mmkgEW =
⋅⋅⋅⋅−
= −−
−
(8)
7.1.1 Sample Area
The tests showed that the 80mm X 38mm test strips produced the highest EWT
index but it remains the most practical in spite of the result. The chemistry that
produces the sample board material is a major factor since the raw edge of the
board cannot be improved under the test conditions.

25
7.1.2 Curing of Sample
Although Level 2 (380C, 85%) gave the highest wicking index, all three
measurement levels of this factor appeared in a close range which suggested
that it did not significantly affect the measurement of edge-wicking as set out by
this work.
7.1.3 Covering
Making a good choice of barrier material for the base board was observed to be
a very important tool in curbing edge-wicking into the board. These tests
revealed that cold lamination was an outright failure as the laminating film
practically detaches from the board thereby allowing endless absorption of the
coffee sample. In effect, the results suggested that good binding of the covering
material to the base board was key in achieving lesser wicking.
7.1.4 Direction of Cutting
The alignment of the length of the test strip on the machine direction appeared
favoured by these tests as poor results were seen in the reverse case. This
could be traced to the fact that the dominance of long fibres within the base
board is in the machine direction and when cut perpendicularly in that direction,
it exposed those long fibres more readily thereby causing wicking (figure 9).
7.1.5 Liquid Sample
Despite the concentration edge of light-roasted coffee 2 over light-roasted
coffee 1, it yielded the lowest EWT index while the latter gave the worst result,
though in close range. This arouses the curiosity about the potency of the
coffee components at a yet-to-be identified concentration between these
margins.
7.1.6 Liquid Temperature
It was realised that the EWT index was generally increasing with temperature.
Greater wicking was established with increased temperature and this was in
agreement with literature which holds that important liquid characteristics such
as viscosity and surface tension reduce with increasing temperature thereby
aiding higher wicking.

26
7.1.7 Liquid Age
An assessment of the effect of coffee sample age on the EWT indices obtained
showed that the lowest result was obtained with as fresh coffee as possible and
an increasing trend continued towards four hours after which a decline was
recorded towards eight hours. This brings on the question of the peak activity
(with respect to age) of the coffee samples, too.
7.1.8 Direction of Sample
The orientation of the test strips into the coffee samples clearly showed
insignificance since the wicking encountered had to do with the perimeter of the
exposed edges and this is independent of immersion method in total immersion
cases.
7.1.9 Test Duration
Test duration like liquid temperature produced an increasing EWT index over
time. A direct correlation was established between the wicking result and the
test time. It demonstrated a tangible effect on the result as would be anticipated
by mere reasoning.
7.1.10 Auxiliary Factors
This class refers to other perceived contributing factors apart from those that
were directly examined. For instance, the cutting efficiency was found to be
highly relevant to the end result as demonstrated in figure 9 below.
27
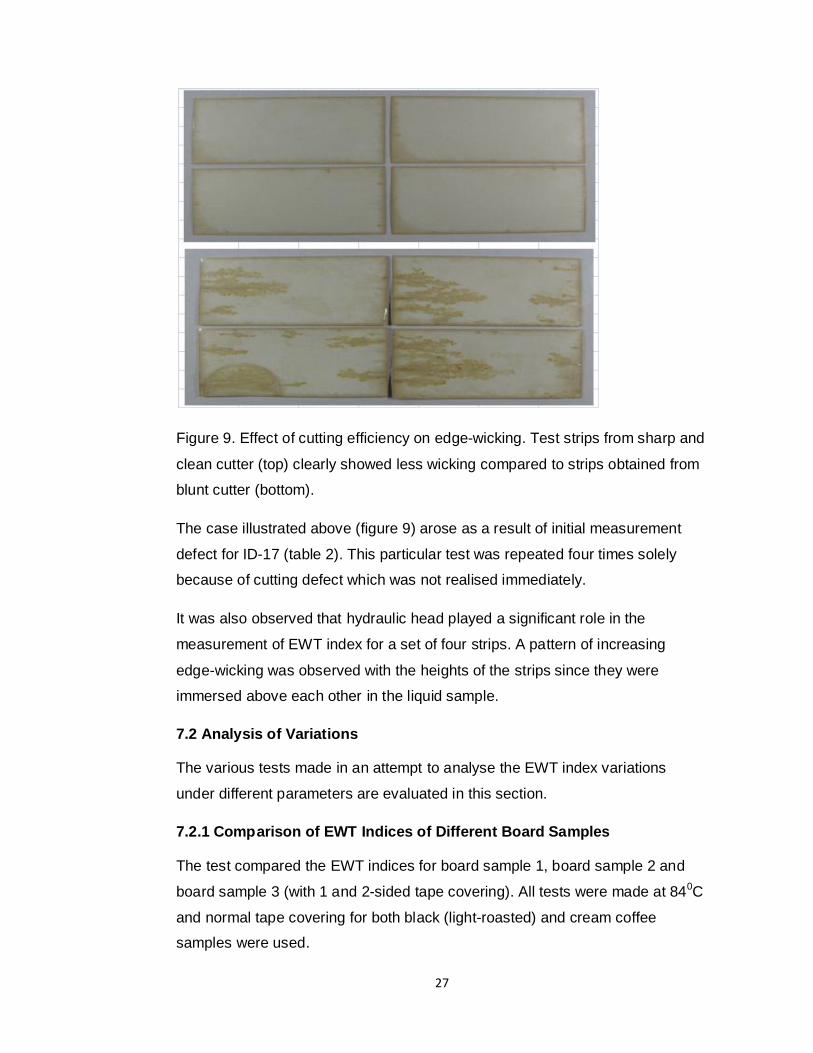
Figure 9. Effect of cutting efficiency on edge-wicking. Test strips from sharp and
clean cutter (top) clearly showed less wicking compared to strips obtained from
blunt cutter (bottom).
The case illustrated above (figure 9) arose as a result of initial measurement
defect for ID-17 (table 2). This particular test was repeated four times solely
because of cutting defect which was not realised immediately.
It was also observed that hydraulic head played a significant role in the
measurement of EWT index for a set of four strips. A pattern of increasing
edge-wicking was observed with the heights of the strips since they were
immersed above each other in the liquid sample.
7.2 Analysis of Variations
The various tests made in an attempt to analyse the EWT index variations
under different parameters are evaluated in this section.
7.2.1 Comparison of EWT Indices of Different Board Samples
The test compared the EWT indices for board sample 1, board sample 2 and
board sample 3 (with 1 and 2-sided tape covering). All tests were made at 840C
and normal tape covering for both black (light-roasted) and cream coffee
samples were used.

28
Figure 10. EWT index results for different board samples
The result portrayed board sample 2 with the highest wicking index while board
sample 3(2) had the least wicking. The result also reflected that board sample
3(2) consistently had lower results compared to board sample 3(1).
7.2.2 EWT Index as an Effect of Temperature
An attempt was made to assess the effect of temperature on wicking by
subjecting the same board material to the same test conditions with exception
of temperature. The two test temperatures were 840C and 930C.
Figure 11. Result of EWT index as an effect of temperature showing a generally
higher wicking at 930C.

29
7.2.3 EWT Index as an Effect of Barrier Material
In comparing the barrier material efficiency, the normal tape in use in the
laboratory and a new one were examined due to their practical relevance even
though hot lamination showed a comparative advantage over the normal tape.
Figure 12. Result of EWT index as an effect of barrier material.
This test showed a clear distinction between the results obtained from the
different tapes. The much lower wicking witnessed with the new tape could be
attributed to the strength of adhesion of the tape to the base board.
7.2.4 Comparison of EWT Indices from Different Examiners
This analysis was conducted in two phases: in RCI among 3 persons and Board
Mill between 2 people. While the test in RCI was conducted at 840C, the one
made in the Mill was done at 800C. Although on individual basis, the results
obtained were not widely deviated in the parallel measurements, it remained a
case of inconsistent figures.

30
Figure 13a. Result of EWT Indices from Different Examiners (RCI)
Figure 13b. Result of EWT Indices from Different Examiners (Mill)
An overview of these results showed difficulty of reproducibility of the same
result by all participating examiners. It is indicated that the Mill-executed tests
were characterised by higher EWT indices compared to those taken in RCI
laboratory.
Considering the test execution technique, the higher values obtained in the Mill
could be assumed to have arisen as a result of the closeness of the test strips
in the coffee samples. This is viewed from the perspective of possible liquid
entrapment that could aid forced absorption by the strips.

31
7.2.5 Assessment of Test-life of Coffee
In an attempt to investigate the practical strength of coffee samples, a series of
tests made revealed that the coffee sample remained indifferent as reflected by
the EWT indices obtained over four hours of testing. The same coffee samples,
having been left for about 24 hours in laboratory atmosphere (230C, 50% RH)
produced still wicking results of negligible difference. This therefore suggested
that the coffee samples might retain potency for several days.

32
8 Conclusions
This thesis work revealed that the following parameters contributed significantly
to the measurement of raw edge penetration / edge wicking in board sample 1:
• Sample area
• Covering
• Direction of cutting
• Liquid temperature
• Liquid age
• Test duration
Although it was discovered that board sample 3 gave the lowest result, a clear-
cut comparative analysis could not be made for the three board samples
because they were not exactly the same and with different matrices. It also
proved a daunting task for an examiner to reproduce the same result under the
same atmosphere.
The sharpness and cleanliness of the cutting blade was also found to be very
crucial to the test result. While the blade sharpness helped in obtaining
relatively smooth and even raw edges, frequent cleaning of the blade prevented
the transfer of adhesive from previous operations onto successive test strips.
In furtherance of this work, it is therefore recommended that the following be
undertaken:
• Determination of the optimal concentration of the light-roasted coffee.
• Determination of the peak activity (with respect to age) of the light-
roasted coffee.
• Determination of EWT index of the new tape and other practicable
covering materials on a 2PE base board sample.

33
Figures Figure 1. Schematic illustration of a paper(board) production line, p. 7 Figure 2. Schematic representation of paper cups making process, p. 8 Figure 3. Effect of fibre surface energy on wetting, p.13 Figure 4. Structure of hydrophobic sizes, p. 13 Figure 5. Illustration of the different sizing effect on penetrating fluid, p. 15 Figure 6. Effect of temperature on viscosity, surface tension and vapour pressure, p. 18 Figure 7. A comparison of pressurized and atmospheric edge wicking from the perspective of calendering, wet pressing and beaten in the same material, p. 19 Figure 8. Experiment set-up in the RCI laboratory, p. 21 Figure 9. Effect of cutting efficiency on edge-wicking, p. 27 Figure 10. EWT index results for different board samples, p. 28 Figure 11. Result of EWT index as an effect of temperature, p. 28 Figure 12. Result of EWT index as an effect of barrier material, p. 29 Figure 13a. Result of EWT Indices from Different Examiners (RCI), p. 30 Figure 13b. Result of EWT Indices from Different Examiners (Mill), p. 30 Figure 14. Graphical representation of the mean responses and the magnitude of their difference, appendix 1; 2(3) Figure 15. Graphical representation of the data in table 7, appendix 1; 3(3) Figure 16. Graphical representation of data in table 9, appendix 2; 2(6)
Tables
Table 1. Permeability of different paper grades, p. 10 Table 2. Comparison of neutral sizing to rosin sizing, p. 14 Table 3a. Definition of the measuring levels for each investigated factor, p. 22 Table 3b. An outline of the L-27 matrix corresponding to the test conditions, p. 22 Table 4. Extract of the test results representing ID-19, p. 24 Table 5. Tabular representation of main test results, appendix 1; 1(3) Table 6. Statistical analysis of main test results, appendix 1; 2(3) Table 7. Main effect analysis by s/n ratio for each measurement level, appendix 1; 3(3) Table 8. Test data for test-life of coffee samples, appendix 2; 1(6) Table 9. Analysis of data presented in table 8, appendix 2; 2(6) Table 10a. Test data for EWT indices from different examiners (RCI), appendix 2; 3(6) Table 10b. Test data for EWT indices from different examiners (Mill), appendix 2; 4(6). Table 11. Test data for EWT indices from different board samples, appendix 2; 5(6). Table 12. Test data for EWT indices as an effect of temperature, appendix 2; 6(6). Table 13. Test data for EWT indices as an effect of barrier material, appendix 2; 6(6).

34
References
1. Stora Enso, 2009. Paperboard Guide. http://www.storaenso.com/products/packaging/Documents/paperboard_guide.pdf Accessed on 11 October 2011.
2. Knowpap 12.0. Raw Materials: Fillers and Additives. Accessed on 18 September 2011.
3. Sony Industries. PAL Paper Cup Machinery. http://www.palcupmachine.com/process.htm Accessed on 7 October 2011.
4. Paper Cup Machine. http://www.cupmachine.net/paper-cup-machinery.htm Accessed on 7 October 2011.
5. Nguyen, H.V & Durso, D.F. 1983. Absorption of water by fibre webs: an illustration of diffusion transport. Tappi journal / Vol. 66, No. 12, pp.76-79.
6. Tufvesson, H. 2006. The Mechanisms of Edge Wicking in Retortable Paperboard. Licentiate Thesis. Royal Institute of Technology, Sweden. Degree Programme in Fibre and Polymer Technology.
7. Crouse, B.W & Warner, C.L. 1986. Mechanistic Aspects of Edge Wicking. Tappi Proceedings: 1986, Papermakers Conference, pp. 7-10.
8. Internal Report. 2007. Stora Enso, pp. 1-21.
9. Neimo, L. 1999. Papermaking Science and Technology, Book 4: Papermaking Chemistry, pp. 151-176.
10. Leskelä, M. and Simula, S. 1998. Papermaking Science and Technology, Book 16: Papermaking Physics, pp. 285-297.
11. Åvitsland, G.A. 2005. Edgewise liquid penetration in paper – Influence of surface chemistry and paper structure. Licentiate Thesis. Royal Institute of Technology, Sweden. Degree Programme in Fibre and Polymer Technology.
12. Åvitsland, G.A & Wågberg, L. 2005. Flow resistance of wet and dry sheets used for the preparation of liquid packaging board. Nordic pulp and paper research journal Vol. 20, No. 3/2005, p.345.
13. Internal Report. 2008. Stora Enso, pp. 1-18.