factors affecting inclusive insurance market …
TRANSCRIPT

1 [Date]
FACTORS AFFECTING INCLUSIVE INSURANCE MARKET DEVELOPMENT IN
AFRICA
Agyemang, Eric1
TABLE OF CONTENTS
ACKNOWLEDGEMENT .............................................................................................................. 2
ABBREVIATIONS ..................................................................................................................... 2
FIGURES AND TABLES .............................................................................................................. 2
Figures ......................................................................................................................................... 2
Tables .......................................................................................................................................... 2
EXECUTIVE SUMMARY ............................................................................................................ 3
1.1 INTRODUCTION .................................................................................................................... 4
1.2 Significance of the study. ...................................................................................................... 5
2. THEORETICAL BACKGROUND AND THE MODEL .......................................................... 5
2.1 Theoretical Background ........................................................................................................ 5
2.2 Hypothesis used for the study. .............................................................................................. 6
2.3. The Model ............................................................................................................................ 6
3 DATA, MODEL ESTIMATION RESULTS AND DISCUSSION ............................................ 8
3.1 Data ....................................................................................................................................... 8
3.2 MODEL ESTIMATION RESULTS AND DISCUSSION. ................................................ 10
3.2.1 Microinsurance Density ................................................................................................ 10
3.2.2 Insurance Penetration ................................................................................................... 12
4. CONCLUSION ......................................................................................................................... 13
REFERENCES ............................................................................................................................. 15
1Katie School of Insurance and Risk Management, Illinois State University, Normal, Illinois, USA.
e-mail: [email protected]; [email protected]

2 [Date]
ACKNOWLEDGEMENT
I would like to thank Dr Rajeev K. Goel, Professor of Economics, and Mr. James Jones, Executive
Director of the Katie school of Insurance and Risk Management both at Illinois State University,
USA for their useful comments.
ABBREVIATIONS
Gross National Income (GNI)
Gross Domestic Product (GDP)
Non-Governmental Organizations (NGO’s)
American International Group (AIG)
National Association of Insurance Commissioners (NAIC)
United States of America (USA)
International Telecommunication Union (ITU)
Ordinary Least Squares (OLS)
FIGURES AND TABLES
Figures
Figure 1: Factors Influencing Microinsurance Market Development in Africa with proxies used.
Tables
Table 1: Countries included in the study
Table 2: Variables used for the study and their sources
Table 3: Summary results for Microinsurance Density
Table 4: Summary Results for Insurance Penetration

3 [Date]
EXECUTIVE SUMMARY
Inclusive Insurance (aka as microinsurance) typically refers to insurance services offered primarily
to clients with low income and limited access to mainstream insurance services and other means
of effectively coping with risk. More precisely it is a means of protecting low-income people
against specific risks in exchange for a regular payment of premiums whose amount is proportional
to the likelihood and cost of the relevant risk .2 This paper uses the terms inclusive insurance and
microinsurance interchangeably. This study focuses on identifying the key factors affecting the
inclusive insurance market development using data covering 22 African countries for the years
2014 – 2018. Insurance penetration and microinsurance density are used as proxies for market
development of inclusive insurance. This paper can be viewed as a somewhat surprising refutation
of conventional wisdom of what factors support microinsurance development. Not surprisingly,
business freedom, and investment freedom are the institutional factors influencing microinsurance
development in Africa. GNI per capita was the economic factor that positively affect to market
development. Many institutional factors did not affect the inclusive insurance market development
as one would expect. Individual internet usage had a remarkably strong positive influence. A
surprising negative influence was found among factors such as inflation, mobile-phone
subscriptions, and rural population, and the inclusive insurance market development. Some
implications of these key finding are discussed. All of these somewhat confounding findings lead
to a final conclusion that further research is required to better understand inclusive insurance and
market development. Future research should consider adding Hofstede cultural dimensions, life
expectancy at birth, microinsurance growth rate, and corruption perception index, to the model.
2 https://microinsurancenetwork.org/microinsurance-and-risk

4 [Date]
KEY WORDS
Microinsurance Density, Market Development, Insurance penetration, Inclusive Insurance
1.1 INTRODUCTION
Inclusive Insurance (aka as microinsurance) typically refers to insurance services offered
primarily to clients with low income and limited access to mainstream insurance services and other
means of effectively coping with risk. Microinsurance activities started in early 1990s primarily as
a form of corporate social responsibility (CSR), as a charity, or a complement to existing
microcredit loan operations and services were delivered through a variety of institutional channels
including the Community Based Organizations, micro financial institutions, etc. (AIG, 2009).
Access to insurance products in developing countries remain low, between 3 and 7 percent
of the low and middle income in developing countries (Microinsurance Network 2020).
Considering the Africa continent in 2017, 15 million people were insured by microinsurance
products with a gross premium of US$ 420 million (Microinsurance Network, 2019).
Microinsurance policies are often written in simple languages with little or no exclusions.
Considering the weak insurance culture, microinsurance activities are subject to high risk and
vulnerability. A growing number of insurers are tapping into markets in developing countries
through microinsurance projects (Insurance Information Institute, 2020), making microinsurance
activities essentially increasing and as such making diverse research interest by researcher in recent
decades.

5 [Date]
This study focuses on identifying the key factors that affect microinsurance market
development using data for 22 countries in Africa at covers the period 2014-2018. The explanatory
variable include demographic factors, economic factors, and institutional factors collected for the
study.
1.2 Significance of the study.
The current study contributes to existing literature, and the development of microinsurance
in Africa highlighting the implications for policymakers wishing to scale up inclusive insurance
market development in Africa. This could help investors to ensure proper allocation of their
resources to minimize investment losses.
The remaining parts of this paper include the theoretical background and the model in section
2, followed by data, model estimation results and discussion in section 3, and ends with the
conclusion and references in session 4
2. THEORETICAL BACKGROUND AND THE MODEL
2.1 Theoretical Background
This work relates with a work done by Park, Borde & Choi (2002) who researched on
determinants of insurance pervasiveness via a cross-national analysis. The multilinear regression
model was used with the specifications of the model estimated using Ordinary Least Squares
(OLS). The independent variables used in this research were demographic factors, economic
factors, and institutional factors with insurance penetration and insurance density used as the
dependent variables. The cultural and sociopolitical variables and their significant influence on
insurance pervasiveness were further included in the analysis. Key findings from this work show

6 [Date]
that, masculine-feminine dimensions of the national culture, aggregate income, government
regulation, and the sociopolitical stability statistically significantly affect insurance penetration.
Another work that relates with the current study is that conducted by Elango & Jones (2011)
which also focused on drivers of insurance demand in emerging markets. They used the panel
regression model using demographic factors, economic factors, and institutional factors as
dependent variables with insurance density, and insurance growth rate as the dependent variables.
They found that demographic factors explained a greater variance relative to economic and
institutional variables for insurance density, while economic factors explained the greatest
variance in terms of insurance growth rates.
2.2 Hypothesis used for the study.
The hypothesis formulated for this study include:
• Hypothesis 1: Demographic factors positively influence microinsurance development.
• Hypothesis 2: Economic factors positively influence microinsurance development.
• Hypothesis 3: Institutional factors positively influence microinsurance development.
2.3. The Model
A multilinear regression model is adopted in determining the influence of key factors on
microinsurance market development (e.g. Park, Borde & Choi, 2002; Elango & Jones, 2011). The
proxies used for this study are insurance penetration, and microinsurance density3, Figure 1. Shows
the factor categories influencing microinsurance market development used in the model.
3 Microinsurance density is used to represent the degree of microinsurance demand or consumption, and insurance
penetration is used to represent the degree of insurance activities relative to the size of the economy of Africa.

7 [Date]
𝑀𝑖𝑐𝑟𝑜𝑖𝑛𝑠𝑢𝑟𝑎𝑛𝑐𝑒 𝑀𝑎𝑟𝑘𝑒𝑡 𝐷𝑒𝑣𝑒𝑙𝑜𝑝𝑚𝑒𝑛𝑡𝑖𝑡 = 𝛼𝑡 + 𝛽𝑗(σ 𝐹𝑎𝑐𝑡𝑜𝑟 𝐶𝑎𝑡𝑒𝑔𝑜𝑟𝑦𝜏𝑖𝑡𝜏 ) + 𝛾𝑖𝑡
Where 𝑖 = 1, 2, … …represent the countries considered; t = 1, 2…….. represents the time; 𝛽𝑗 where
j = 1, 2…… represent coefficients of factors; 𝜏 = 1, 2, 3 factor category considered; 𝛼𝑡 represents
the intercept; and 𝛾𝑖𝑡
represents the error term.
Figure 1. Factors Influencing Microinsurance Market Development in Africa with proxies used.
• Demographic Factors: These are distribution of individuals in a given society which are
measured in terms of population, age, sex, education, etc., which affect the buying patterns
within that society.
Institutional
Factors
Demographic
Factors
Economic
Factors
Microinsurance
Density
Insurance
Penetration
Microinsurance Market Development

8 [Date]
• Economic Factors: They cover the overall economic situation of a particular county. They
determine whether underlying demand profile could be sustained by the options.
• Institutional Factors: According to (North, 1981), they are human device constraints that
structure human behavior. Elango & Jones, 2011 explains institutional variables as a countries’
institutional structures that are the formal or informal mechanisms that governs human
behavior. They include the legal system in place to protect property rights of the people and
companies in the country.
3 DATA, MODEL ESTIMATION RESULTS AND DISCUSSION
3.1 Data
The data used for this study consists of 50 observations collected from 22 African countries for
the years 2014 to 2018. It was collected from the World map of Microinsurance data base, and a
range of public sources based on extent literature and data availability for African countries. The
countries from which the data were collected are shown in table 1 below.
Table 1: Countries included in the study.
Benin
Malawi
South Africa
Burkina Faso Morocco Tunisia
Botswana Mozambique Togo
Egypt Namibia Uganda
Ethiopia Niger Zambia
Ghana Nigeria Zimbabwe
Ivory Coast Rwanda
Kenya Senegal

9 [Date]
Table 2 below shows the variables, python code for the variable, and data sources for each variable
used for the study. All analysis were done using Python.
Table 2: Variables used for the study and their sources
VARIABLE
CATEGORY
VARIABLES
PYTHON CODE
SOURCES
DEMOGRAPHIC
Population Total PSIZE
World
Development
Indicators
%Population Poor PPOOR
% Population Living in Rural
Areas
PPLRA
Mobile-cellular telephone
subscriptions.
MTSUBS
% individual using internet PIUI ITU
ECONOMIC
GNI per Capita GNIPC
World
Development
Indicators
Inflation INFLAT
Real Interest Rate REALIR
Net Income Per Capita (Annual
% Growth)
NETIPC
GDP of Merchandised Trade GDPOMT
Microinsurance Penetration
(Premium Volume / GDP)
MICINSPEN World Map of
Microinsurance
Microinsurance Density (Total
Premium/ Total Population)
MICROIDENSITY
World Map of
Microinsurance
INSTITUTIONAL
Business Freedom BUSFRD
Heritage
Foundation
(various years)
Property Right PROPR
Investment Freedom INVESTFRE
Fragile State Index FRAGSTAT Fund for peace
Note: Number of observations = 50

10 [Date]
Data sources links:
• World Development Indicators: https://databank.worldbank.org/source/world-development
indicators
• World map of Microinsurance: http://worldmapofmicroinsurance.org/
• ITU: https://www.itu.int/en/ITUD/Statistics/Pages/stat/default.aspx
• Heritage Foundation (various years): http://www.heritage.org/index/explore
• Fund for peace: https://fundforpeace.org
3.2 MODEL ESTIMATION RESULTS AND DISCUSSION.
Tables 3 and Table 4 show the summary results of the analysis. All model assumptions4 are
checked and certified. These ensure that all estimated parameters and p-values are not misleading.
3.2.1 Microinsurance Density
Table 3 is the summary results of the OLS regression model for the microinsurance density used
as a measure of microinsurance demand or consumption in Africa. The key findings from the
analysis show that, population total, mobile-cellular telephone subscriptions, and percentage of
population living in rural areas are the demographic factors that are statistically significant at 10%,
5% and 1% level respectively, and negatively influencing microinsurance consumption. This
implies that a 1% increase in each of population total, mobile-cellular telephone subscriptions, and
percentage of population living in rural areas result to a fall in microinsurance demand of
respectively 1.0478%, 3.37%, 13.24%. These refute our first hypothesis posed earlier in this paper.
4 The assumption of Linearity, autocorrelation, heteroscedasticity, mean of the residuals approximately equal to zero and normality.

11 [Date]
Table 3: Summary results for microinsurance density used as the dependent variable
OLS Regression Results
=============================================================================
Dep. Variable: MICROIDENSITY R-squared: 0.594
Model: OLS Adj. R-squared: 0.415
Method: Least Squares F-statistic: 3.313
Prob(F-statistic):0.00186 Log-Likelihood: -103.60
Observations: 50 AIC: 239.2
Df Residuals: 34 BIC: 269.8
=============================================================================
coef std err t P>|t| [0.025 0.975]
-----------------------------------------------------------------------------
PSIZE -0.0105 0.022 -1.750 0.089* -0.023 0.006
PPOOR 0.0042 0.026 0.164 0.871 -0.048 0.056
MTSUBS -0.0337 0.013 -2.563 0.015** -0.060 -0.007
PPLRA -0.1324 0.042 -3.168 0.003*** -0.217 -0.047
PIUI -0.0762 0.050 -1.528 0.136 -0.178 0.025
NETIPC 0.0477 0.096 0.499 0.621 -0.147 0.242
INFLAT -0.1303 0.062 -2.092 0.044** -0.257 -0.004
REALIR -0.0941 0.062 -1.525 0.136 -0.220 0.031
GDPOMT 0.0253 0.024 1.059 0.297 -0.023 0.074
BUSFRD 0.0192 0.048 0.401 0.691 -0.078 0.117
const 20.9333 12.804 1.635 0.111 -5.088 46.955
=============================================================================
Omnibus: 0.081 Durbin-Watson: 1.944
Prob(Omnibus): 0.960 Jarque-Bera (JB): 0.277
=============================================================================
Note: 1. PROPR, INVESTFRE, GNIPC, FRAGSTAT are included but not reported because
they are statistically not significant.
2. * **p≤0.01, **p≤0.05, *p≤0.10
Further, inflation is the only economic factor that impacts microinsurance demand negatively
and is statistically significant at 5% level. This implies that, a 1% increase in inflation will result
to a fall in microinsurance demand by 13.03%, hence refuting our second hypotheses. This opposes
the earlier findings of Beck & Webb, 2003. None of the institutional variables statistically
significantly contribute to the model hence the third hypothesis is rejected. This model is
statistically significant with a p-value of 0.00186, and a pseudo R-squared of 0.594. This implies
that 59% of the microinsurance density is explained by the variability in the independent variables
of the model. All other variables do not contribute statistically significant to the model.
12 [Date]
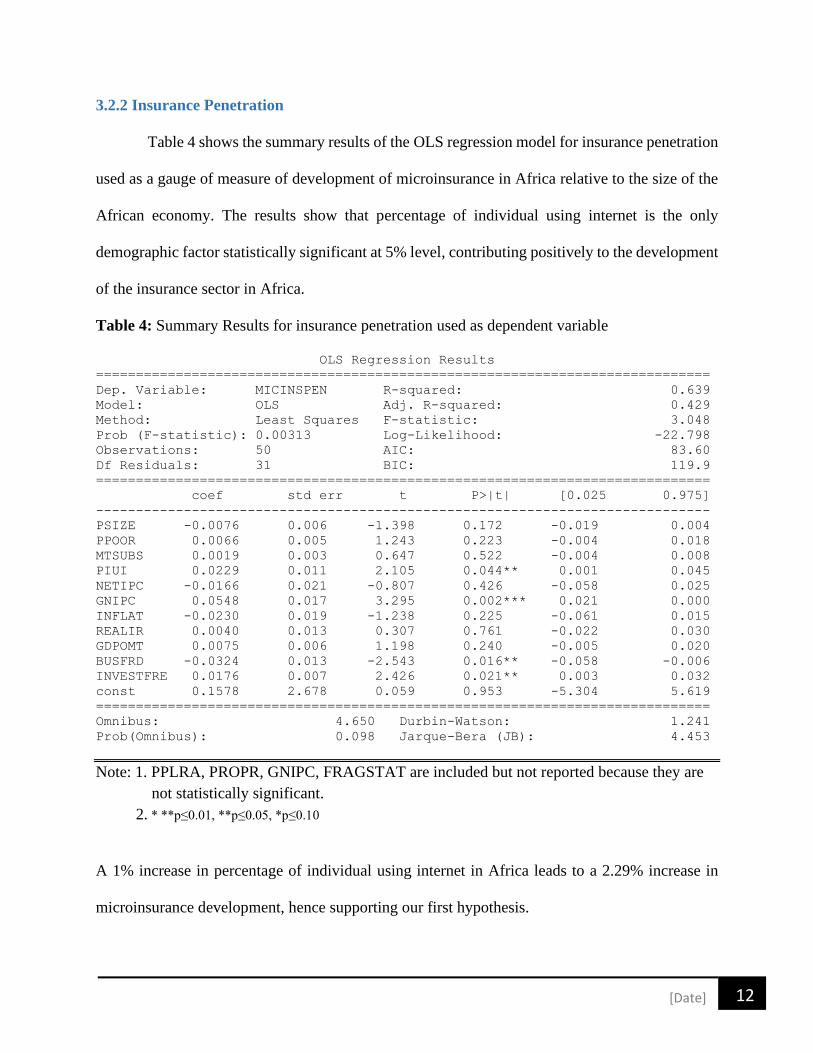
3.2.2 Insurance Penetration
Table 4 shows the summary results of the OLS regression model for insurance penetration
used as a gauge of measure of development of microinsurance in Africa relative to the size of the
African economy. The results show that percentage of individual using internet is the only
demographic factor statistically significant at 5% level, contributing positively to the development
of the insurance sector in Africa.
Table 4: Summary Results for insurance penetration used as dependent variable
OLS Regression Results
=============================================================================
Dep. Variable: MICINSPEN R-squared: 0.639
Model: OLS Adj. R-squared: 0.429
Method: Least Squares F-statistic: 3.048
Prob (F-statistic): 0.00313 Log-Likelihood: -22.798
Observations: 50 AIC: 83.60
Df Residuals: 31 BIC: 119.9
=============================================================================
coef std err t P>|t| [0.025 0.975]
-----------------------------------------------------------------------------
PSIZE -0.0076 0.006 -1.398 0.172 -0.019 0.004
PPOOR 0.0066 0.005 1.243 0.223 -0.004 0.018
MTSUBS 0.0019 0.003 0.647 0.522 -0.004 0.008
PIUI 0.0229 0.011 2.105 0.044** 0.001 0.045
NETIPC -0.0166 0.021 -0.807 0.426 -0.058 0.025
GNIPC 0.0548 0.017 3.295 0.002*** 0.021 0.000
INFLAT -0.0230 0.019 -1.238 0.225 -0.061 0.015
REALIR 0.0040 0.013 0.307 0.761 -0.022 0.030
GDPOMT 0.0075 0.006 1.198 0.240 -0.005 0.020
BUSFRD -0.0324 0.013 -2.543 0.016** -0.058 -0.006
INVESTFRE 0.0176 0.007 2.426 0.021** 0.003 0.032
const 0.1578 2.678 0.059 0.953 -5.304 5.619
=============================================================================
Omnibus: 4.650 Durbin-Watson: 1.241
Prob(Omnibus): 0.098 Jarque-Bera (JB): 4.453
Note: 1. PPLRA, PROPR, GNIPC, FRAGSTAT are included but not reported because they are
not statistically significant.
2. * **p≤0.01, **p≤0.05, *p≤0.10
A 1% increase in percentage of individual using internet in Africa leads to a 2.29% increase in
microinsurance development, hence supporting our first hypothesis.

13 [Date]
GNI per capita is the only economic variable that is statistically significant at 1% level, and
positively influence the development of microinsurance in Africa. This implies that, a 1% increase
in GNI per capita leads to a rise in microinsurance activities by 5.479%, hence supporting the
second hypothesis. Further, business freedom, and investment freedom are the institutional factors
that influence microinsurance development in Africa. At 5% level of significant, business freedom
negatively influences microinsurance development implying that, a 1% increase in business
freedom leads to a fall in microinsurance development by 3.24%. This refutes the third hypothesis.
Investment freedom on the other hand positively influence microinsurance development at 5%
level of significant. A 1% increase in investment freedom leads to a rise in microinsurance
activities in Africa by 1.76% supporting the third hypothesis. All other variables included in the
analysis but not presented are not significantly to the model. This model is statistically significant
with the p-value 0.00313, and pseudo R-squared of 63.9% implying that 63.9% if the insurance
penetration is explained by the variability of the independent variables of the model.
4. CONCLUSION
This paper examines the influence of demographic factors, economic factors, and
institutional factors on microinsurance market development using the proxies microinsurance
density, and insurance penetration. The key findings from this paper show that considering
microinsurance density, population total, mobile-cellular telephone subscriptions, and percentage
of population living in rural areas are the demographic factors that are statistically significant and
negatively influencing microinsurance demand in Africa. These refute our first hypothesis.
14 [Date]
Inflation is the economic factors that negatively impact microinsurance demand hence
refuting the second hypothesis. No institutional factor is statistically significantly to the model,
hence the third hypothesis is rejected.
Considering the insurance penetration, we find that percentage of individual using
internet is the only demographic factor contributing positively to insurance penetration in Africa.
This supported the first hypothesis. Also, GNI per capita is the economic factors contributing
positively to insurance penetration hence supporting the second hypothesis. Business freedom is
the institutional factors negatively influencing insurance penetration in Africa, hence refuting the
third hypothesis. Investment freedom on the other hand is also the institutional factor that
significantly influence positively on insurance penetration hence supporting the third hypothesis.
Future research should consider adding Hofstede cultural dimensions, life expectancy at
birth, microinsurance growth rate, and corruption perception index, to the model. Mining data
covering these variables and incorporating them into the model may lead to a more interesting
results.

15 [Date]
REFERENCES
AIG (2009, June 24). Microinsurance industry sees profits from the poor. Retrieved from
https://www.reuters.com/article/us-microinsurance-growth/microinsurance-industry-sees-profits
from-the-poor-idUSTRE55O00U20090625
Beck, T., & Webb, I. (2003). Economic, demographic and institutional determinants of life
insurance consumption across countries. World Bank Economic Review, 17(1), 51-88.
Elango, B., James Jones (2011). Drivers of insurance demand in emerging markets. Journal of
Service Science Research, 3(2), 185-204.
Insurance Information Institute (2019, July 23). Background on: Microinsurance and emerging
markets. Retrieve from https://www.iii.org/article/background-on-microinsurance-and-
emerging-markets
Landscape of Microinsurance (2020). Microinsurance Network. www.microinsurancenetwork.org
North, D. C. (1981). Structure and change in economic history. Norton.
NAIC (2020, December 2). The center for Insurance Policy and Research: Microinsurance.
Retrieved from https://content.naic.org/cipr_topics/topic_microinsurance.htm\
Park, H., Borde, S.F., & Choi, Y. (2002). Determinants of insurance pervasiveness: A cross-
national analysis. International Business Review, 11(1), 79-96.