factors affecting delay in early diagnosis and initiation of...
TRANSCRIPT

i
Factors affecting delay in early diagnosis and initiation of
treatment for tuberculosis in Vellore district-Tamil Nadu.
A dissertation submitted in partial fulfillment of the requirement
of
The Tamil Nadu Dr. M. G. R. Medical University
For the M. D. Branch XV (Community Medicine)
Examination to be held in April 2016

ii
CERTIFICATE
This is to certify that “Factors affecting delay in early diagnosis and initiation of
treatment for tuberculosis in Vellore district-Tamil Nadu” is a bonafide
work of Dr.Siddabathula Harika, in partial fulfillment of the requirements for the
M.D. Community Medicine examination (Branch XV) of the Tamil Nadu
DR M.G.R. Medical University to be held in 2016.
Dr. Siddabathula Harika
Post Graduate student,
M.D Community Medicine,
University Registration No: 201325055
Community Health Department,
Christian Medical College, Vellore
Tamil Nadu, India
Guide & Principal
Head of the Department
Dr. Jasmin Helan Dr. Alfred Job Daniel,
Professor Christian Medical College
Department of Community Health Vellore
Christian Medical College, Vellore.

iii
Originality certificate

iv
Acknowledgements
I am grateful to the Almighty God for His presence and everlasting love that gave me
an opportunity to see my dream being fulfilled.
I express my gratitude and sincere thanks to my mentor and guide Dr. Jasmin Helan
Prasad, without whose help and efforts I wouldn`t have been able to complete this
work. I thank her for taking all the efforts to teach and mould me in my academics.
I thank Dr. D.J.Christopher my co-investigator, for his timely help.
I thank Dr. Manjunath my co-investigator, who helped me in reaching to the
unreached areas in search of the subjects.
I express my thanks and regards to Dr. Divya Muliyil, for her gentle approach and
timely help in reviewing my literature.
I thank Dr. Kuryan George, Dr.Vinod Abraham for their valuable suggestions and
constant help in bringing out this study.
I thank Dr. Jacob John for his suggestions and comments for the betterment of the
study.

v
I express my sincere thanks to all my consultants Dr.Venkata Raghava, Dr. Shantidani
Minz, Dr. Anuradha Rose, Dr. Anu Mary Oommen for their reviews of my study and
timely help.
I thank Mr. Ravichandran, STLS officer for helping me trace the patients and carry
out my study on time.
I also thank Mr. Jesudasan for his support and encouragement.
I thank Mrs. Gifta, Mrs.Tabita for helping me in translation work.
I thank Mrs. Sumitra, Mrs. Mary, Ms. Salomi and other non-teaching staff of CHTC
for being there to help me.
This page would be incomplete if I don’t express my thanks to the health aides of
CHAD, the drivers who are always cheerfully willing to help in field work.
I thank Dr. Nancy Angeline, Dr. Carol, Dr. Reshma, Dr. Geeta and rest of my batch
mates who stayed with me and been a great support.
I thank the Institutional Review Board, Christian Medical College-Vellore for giving
me permission to carry out the study.
I dedicate my study to all my patients who helped me understand life better.

vi
Acronyms
AIDS Acquired immune deficiency syndrome
AOR Adjusted Odds Ratio
CHAD Community Health and Development
CMI Cell Mediated Immunity
CI Confidence Interval
DOTS Direct Observed Treatment Short course
HIV Human immune virus
NGO Non-Governmental Organization
NTP National Tuberculosis Program
RNTCP Revised National Tuberculosis Program
SD Standard Deviation
SPSS Statistical Package for Social Sciences
TB Tuberculosis
TU Tuberculosis Unit
W.H.O World Health Organization

vii
Table of contents
Title Sub Title Contents Page no.
1 Introduction 1
2 Justification 4
3 Objectives 7
4 Literature review 8
4.1 Pathogenesis of TB 8
4.2 Burden of Tuberculosis 13
4.3 Risk factors for transmission 16
4.4 TB and economic impact 17
4.5 Mortality from Tuberculosis in India 18
4.6 Knowledge and health seeking behavior on TB 19
4.7 Reasons for delay in diagnosis from various
studies
22
4.8 Stigma associated with TB 26
5 Methodology 28
5.1 Study setting 28
5.2 Study design 29
5.3 Study participants 29
5.4 Sampling technique 29
5.5 Sample size calculation 30
5.6 Data Collection 30
5.7 Study tool 32
5.8 Informed consent 33
5.9 Study variables 33
5.10 Data Analysis 34
6 Results 36
7 Discussion 69
8 Limitations 77
9 Conclusion of the study 78
10 Recommendations 79
11 Bibliography 81
12 Annexures 87
viii
List of figures
Serial no. Figure no. Contents Page no.
1 4.1 Picture TB bacilli 9
2 4.2 Droplet transmission of TB 10
3 4.3 Pathogenesis of Mycobacterium tuberculosis 11
3 4.4 Pathogenesis of Mycobacterium tuberculosis 12
4 4.5 Ghon`s complex 12
5 4.6 Different categories of delay 34
6 6.1 Distribution by age 36
7 6.2 Distribution by gender 36
8 6.3 Distribution by place of residence 37
9 6.4 Distribution by educational status 38
10 6.5 Distribution by marital status 39
11 6.6 Number of rooms 40
12 6.7 Reasons for choosing provider 49
13 6.8 Distance from home to DOTS 55
14 6.9 Perception of seriousness of TB 55

ix
Serial
no.
Table
no.
Contents Page
no.
1 6.1 Distribution of housing and no. of rooms 39
2 6.2 Distribution by occupation 42
3 6.3 Distribution by socioeconomic status 42
4 6.4 Distribution by monthly income 43
5 6.5 Distribution by number of tobacco smokers 44
6 6.6 Distribution by alcohol consumption 45
7 6.7 Symptoms experienced by study participants with TB before
diagnosed
46
8 6.8 Symptoms for which treatment is sought 46
9 6.9 Health seeking behavior with onset of illness 47
10 6.10 Health care facility from where patient first sought treatment 47
11 6.11 Health care provider who made initial diagnosis 48
12 6.12 Expenditure related to TB care 48
13 6.13 Actions/investigations done in health facility 49
14 6.14 Reason for not going to CHAD/CMC/PHC/GH/GVMCH 50
15 6.15 Time delay in diagnosis 50
16 6.16 Reasons by participants with TB for delay in reaching health
centre
51
17 6.17 Reasons for delay in seeking care in other people in
community who has similar complaints
51
18 6.18 Patient delay 52
19 6.19 Health system delay 52
20 6.20 Treatment delay 53
21 6.21 Delay in those who are transferred out 53
22 6.22 Centre delay 53
23 6.23 Total delay 54
24 6.24 Summary of delay 54
25 6.25 Knowledge of symptoms among participants with TB 56
26 6.26 Knowledge of transmission of TB 56

x
Serial
no.
Table
no.
Contents Page
no.
27 6.27 Knowledge on perception and cure of TB 57
28 6.28 Knowledge of treatment and duration 58
29 6.29 Knowledge regarding repeat sputum testing after initiation of
treatment
58
30 6.30 Knowledge regarding timing of repeat sputum testing 59
31 6.31 Knowledge among study participants with TB regarding
susceptible individuals for TB
59
32 6.32 Knowledge among participants with TB and general
community
60
33 6.33 Stigma in study population 61
34 6.34 Stigma among participants with TB in study population 62
35 6.35 Stigma among general participants in community 62
36 6.36 Knowledge among study population 63
37 6.37 Community perception of stigma related to TB 64
38 6.38 Multivariate regression model for perception of stigma in
community
65
39 6.39 Patient perception of stigma related to TB 66
40 6.40 Factors affecting delay in diagnosis and initiation treatment
among participants with TB
67
41 6.41 Multivariate regression model for delay 68
42 6.42 Median diagnostic delay in comparison with other studies 69

ABSTRACT
TITLE OF THE STUDY: Factors affecting delay in early diagnosis and initiation of
treatment for tuberculosis in Vellore district-Tamil Nadu.
DEPARTMENT: Community Health And Development
NAME OF THE CANDIDATE: Dr. Siddabathula Harika
DEGREE AND SUBJECT: MD; Community Medicine
NAME OF THE GUIDE: Dr. Jasmin Helan
Objectives: Tuberculosis is the leading killer, affecting adults in the developing countries.
Estimates suggest that an untreated, smear positive patient can infect, on an average10
contacts annually and more than 20 during the course of the disease. A delay in TB
diagnosis may lead to more advanced disease state at presentation. Late-stage
presentation may contribute to a poor response to treatment, resulting in more severe
morbidity while increasing the risk of transmission. It is important to identify the
causes of such delays to efficiently take measures to achieve target of case detection
and elimination.
Methods:
The present study is a cross sectional study. The main objectives of this study were to
find the average delay in diagnosis/treatment in TB and to identify the determinants of
delay in treatment seeking including perceived stigma. The study is done among the
newly diagnosed sputum positive tuberculosis patients who were registered in the
Tuberculosis Unit run by the Community Health Department of Christian Medical
College, Vellore. After obtaining informed consent, study participants were

interviewed by the investigator using a structured questionnaire. To study the level of
perceived stigma related to Tuberculosis, 100 people from rural area were
interviewed. Data was entered using Epidata and analysis was done using SPSS.
Results with conclusions:
We included 95 patients with TB and 100 from general population to know stigma in
community. The mean total delay from the onset of disease to initiation of treatment
was 104.8 days. The patient delay, health system delay, centre delay and treatment
delay were 38.5, 99.3, 60.8 and 2 days respectively. The median total delay, patient
delay, health system delay, centre delay and treatment delay were 91, 20, 90, 16, and 2
days respectively.
Participants with TB were found to have more perception of stigma
(p=<0.001.OR=7.19). Among the general population, participants with good
knowledge had more perception of stigma (OR=2.40, P=0.003). Other factors that
were independently associated with delay were low SES (P=0.03, OR=2.77) and more
number of health centres visited (p=<0.001, OR= 5.682).
In order to minimize the level of perceived stigma related to TB and to improve early
health seeking, awareness should be created in the general population regarding the
transmission of TB. Awareness need to be created on complications of not treating
early and the high cure rate with early treatment and the type of health facility where
screening can be done.

From this study it is imperative that the local medical practitioners should be
motivated to screen for Tuberculosis at the first onset of symptoms. Frequent
continuing medical education sessions may improve case finding and minimize the
delay. As most people choose to go to private practitioners for the chest symptom,
more diagnostic facility to test sputum should be made available.

1
Introduction
Tuberculosis is a widespread disease. The disease is fatal in many cases as it is caused
by different strains of Mycobacterium tuberculosis. Tuberculosis bacilli attacks lungs,
however other parts of the body are not exempted. The disease is contagious and
spreads through the air. Tuberculosis spreads through contact with the person who is
infected, as they cough or sneeze. Most of them are asymptomatic, also called as
latent TB infection(1). In 90% of cases the tuberculosis bacilli attacks lungs. When
lungs are affected the symptoms includes prolonged cough with sputum production,
25% of the people may remain asymptomatic. A vaccine against TB is available
nearly for a century. Effective treatment for TB is available nearly for 60 years. Yet
the disease is close to its highest levels ever seen. It remains a potentially fatal disease
still.
Every year 6 million people die of HIV/AIDS, TB and malaria. Among all these
deaths tuberculosis attributes to 2 million deaths. TB is a pandemic; half of all
reported cases are in 6 Asian countries – Bangladesh, China, India, Indonesia,
Philippines and Pakistan. But a highest rate of per capita cases are from African
countries i.e. it includes one-fourth of all the TB case. Tuberculosis is the leading
killer, affecting adults in the developing countries. It was the seventh most leading
cause of morbidity in 1990. The trend is expected to continue till 2020.In 2001; 1.86
billion persons were infected with tuberculosis according to WHO estimates. Statistics
shows that each year 8.74 million people may get infected with tuberculosis and of
these nearly 2 million die of the disease(2).

2
As per the statistics it comes to light that someone somewhere gets affected and dies
of TB every 10 seconds. Hence in 1993, TB is declared as global emergency by the
WHO. According to the estimates it showed that 37 million people were saved
between 2000 to 2013 with effective diagnosis and treatment. However in 2013, it was
estimated that those affected with TB attributed to 9 million and among those who
died of the disease were 1.5million; of which 360,000 were HIV-positive.
India has the highest burden of TB. Global incidence of TB is 9 million cases, out of
which 2.1 million cases of TB incidence is reported in India according to WHO
estimates in 2013.
The estimated figure for prevalence is 2.6 million as per 2013 WHO statistics(3).TB
was declared as a notifiable disease in 2012, which means with immediate effect all
private doctors, caregivers and clinics who involved in treating a TB patient should
report every case of TB to the government(4). India and China alone contributes to 35
% of cases reported in 2013. According to Global tuberculosis report-2014 published
by WHO, 6.1 million TB cases were reported in 2013.Of the reported, 5.7 million
people were newly diagnosed and 0.4 million were already on treatment(3). The
reasons proposed for rampant increase in disease within the developing world are
population explosion, inadequate coverage by control programs, poor cure rates,
interaction of HIV with TB(5).as 90% of the infection is symptomatic ,some develop
infection before their immune system could get activated. The infection usually
progresses within weeks. 25% of the populations stay as carriers or asymptomatic to
the infection, of which those who develop latent infection with no treatment comes to

3
5-10%. It affects those whose immune system is weak. People who are at high risk for
developing TB fall into two categories
a. Persons recently infected with TB.
b. Persons with conditions that weaken the immune system which facilitate the
growth of the TB bacteria(6).
The efforts to combat TB were severely affected for stigma being one of the
reason(7). There is vast literature available to understand available to understand the
factors related or affecting delay in the health seeking behaviour which reflects on
early diagnosis and initiation of the treatment in TB patients(8). Apart from socio
economic status, knowledge about TB, smoking and other personal characteristics;
psychosocial factors also play an important role in the diagnosis of TB(9). The psycho
social factors include stigma in the case TB, which may cause rejection, shame,
blame, exclusion from those of healthy individuals(10). There is a great evidence from
various studies which suggest that stigma associated with TB could be a reason in
delay in seeking health care in TB patients(11).one of the factor highlighted from
other studies was many of the patients had the fear that their disease would be labelled
as related to AIDS(12). The present study may unfold the scenario in the rural part of
Tamil Nadu, Vellore which aids to understand various reasons of delay including
stigma in early diagnosis of TB and further initiation of treatment in newly diagnosed
sputum positive patients.
4
Justification
Tuberculosis (TB) is a public health threat globally. The disease causing
organism is ubiquitous and is widespread. According to WHO report, an
estimated9.0 million people had TB disease in 2013 and 1.5 million people deaths
due to TB were reported(13).
The World Health Organization’s (WHO’s) under Direct Observed Therapy-Short
course (DOTS) strategy; to increase TB success emphasizes on passive case
finding. This leaves onus on the patient to approach health facility, making the
patient vulnerable to delay in seeking care for their symptoms. This delay may
further increase transmission of TB in the community. TB transmission most often
occurs between the onset of cough and also after a few weeks after the initiation
of treatment. According to estimates an untreated, smear positive patient can
infect, on an average of 10 contacts annually and more than 20 during the course
of the disease(14).
Notoriously the delay may cause the disease to progress to an advanced stage at
presentation. With increased bacillary and presentation after a longer period of
delay may contribute to poor response to treatment. This further result in increase
in morbidity and also will increase the risk of transmission. The proportion of
contacts found to be infected at the time of diagnosis of a smear-positive index
case is around 30%–40% (15).

5
The increase in severe morbidity of an undiagnosed or late diagnosed TB signifies
the importance to identify various causes of delay. This aids in taking active
measure to achieve target of case detection and elimination. Recent studies done
in high-burden TB countries reveals that improving case finding may save 10
times as many lives saved by as DOTS alone(16).
Though there are numerous factors which contribute to delay either due to system
or by the patient, in order to improve case finding under RNTCP; it is important to
identify and address these factors. Patient’s demographic profile, social economic
status, and accessibility of the healthcare facilities, availability of competent staff
and diagnostic equipment determine passive case finding(17).
These similar factors are identified to be the reasons for delay in many countries.
Such delay may occur at the level of the patient (patient delay) or at the level of
the health system (system delay) (5-8).
Poverty is one major reason for not seeking proper treatment among both men and
women (10). However, decision to go for treatment outside home had been a
limiting factor for women compared to men (6). Out-of-pocket expenditure on
multiple consultations with local practitioners before diagnosis, lack of money for
transport also contributes to delay in proper diagnosis (11).
Stigma, attached to TB, as shown in many studies seems to be a main reason for
patient delay. Study in Pakistan showed that majority (85%) of patients felt
ashamed to disclose the disease (6). TB and HIV co-infection has also affected the
stigma (12). A multi-country study showed that stigma attached to TB is much

6
more in India than other countries (13). Though there are many studies available
from different countries, there is no study from this area assessing the delay, out-
of-pocket expenditure prior to diagnosis and the level of perceived stigma.
Various studies have demonstrated increased level of perceived stigma among
people with tuberculosis. There is lack of information on community’s perception
towards stigma related to TB. This study attempts to address these issues (13).
.

7
3. Aims and objectives:
3.1 Aim:
The aim of this study is to find out the factors affecting delay in early diagnosis and
initiation of treatment for tuberculosis among newly diagnosed sputum positive
tuberculosis patients registering in CHAD Tuberculosis Unit (TU) during the period
from November 2014 to May 2015.
3.2 Objectives:
1) To study the delay in diagnosis and initiation of treatment in
tuberculosis
2) To study the determinants of delay in diagnosis and initiation of
treatment in tuberculosis
3) To compare the knowledge and perceived stigma towards tuberculosis
among people with tuberculosis and among the people without
tuberculosis.

8
4. Literature review
Tuberculosis is a major global health problem. It is caused by Mycobacterium
tuberculosis. It is second leading cause of death worldwide; among the infectious
diseases after human immune deficiency virus (HIV). Human beings are its natural
reservoir of host. Due to its ability to establish latent infection, it spread to one third of
the population worldwide. According to the WHO report of 2013 is estimated that
new TB cases accounts to 9 million and TB deaths up to1.5 million(13).
4.1Pathogenesis of tuberculosis
4.1.1 Microbiology:
M.tuberculosis belongs to the genus Mycobacterium. Tuberculosis (TB) is defined as
a disease caused by members of the M.tuberculosis complex. It includes the tubercle
bacillus (M. tuberculosis), M. bovis, M. africanum, M. microti, M. canetti, M. caprae,
and M. pinnipedii(18).
TB affects lungs in 85% of cases. Other sites include lymph nodes, genitourinary tract,
bones and joints, intestine, skin.
4.1.2Characteristics of Mycobacterium tuberculosis:
As shown in the figure 4.1, it is a rod shaped bacteria of 0.2 to 0.5 microns (6).

9
It`s cell wall is composed of mycolic acid which stains it acid fast; an acid fast bacilli.
It resists acid or alcohol for decolourisation. It is an aerobic bacteria and motile, which
multiplies slowly. It has the capacity to remain dormant for decades (6).
Figure 4.1- TB bacilli
4.1.3 NATURAL HISTORY OF THE DISEASE
The aerosol droplets containing Mycobacterium tuberculosis when inhaled causes
deposition in the lungs and leads to one of the possible outcomes. The outcomes may
include either immediate clearance of the organism or primary disease (immediate
onset of active disease), latent infection, reactivation disease (onset of active disease
many years following a period of latent infection) (19).
Source: internet www.cdc.org

10
4.1.4 Primary disease:
Approximately 5 t0 10% of the individuals of all the exposed will develop active
disease. Among these half of them will develop TB in first two to three years
following infection.
The droplets size (5 to 10 microns) is small enough to reach alveoli; the tubercle
bacilli are carried in these small droplets to reach the lung. When it comes to
multiplication of tubercle bacilli the innate immune system stands as a failure to
eliminate the infection. The bacilli proliferate in the alveolar macrophages and further
migrate from lungs to other tissue.
Figure 4.2-droplet transmission of TB
Source: internet www.cdc.org

11
In the lungs the macrophages produce cytokines and chemokines. These cytokines and
chemokines attract phagocytic cells, monocytes, alveolar macrophages, neutrophils.
This antigen antibody complex eventually form a nodular granulomatous structure
called tubercle
Figure 4.3 pathogenesis of Mycobacterium tuberculosis
The tubercle enlarges and bacilli drain into local lymph nodes causing
lymphadenopathy. This lymphadenopathy is the characteristic manifestation of
primary TB. The lesion thus caused by multiplication of bacilli and further spread to
lymphatic system causing lymph node enlargement is called Ghon`s complex.
Source: internet www.cdc.org

12
Figure 4.4-Pathogenesis of Mycobacterium tuberculosis
Among those exposed to infective individuals, in nearly 90%, bacilli continue to
proliferate for a period of 2 to 10 weeks following infection until an effective cell
mediated immune (CMI) response develops. Progressive destruction of the lung
occurs due to poor CMI response.
Figure 4.5-Ghon`s complex
Source: internet www.cdc.org
Source: internet www.CDC.org
wwwww.cdc.org
13
If untreated, death ensues in up to 80 % of the cases and the survivors may develop
chronic disease or recover. Complete spontaneous eradication of bacilli is rare(20).
4.1.5 Reactivation disease:
Proliferation of the latent bacteria causes reactivation TB. It occurs in 5 to 10 % of
cases during their life time (12).
Immunosuppressive conditions associated with reactivation TB include HIV infection
and AIDS, end-stage renal disease, diabetes mellitus, malignant lymphoma,
corticosteroid use, inhibitors of TNF-alpha and its receptor, diminution in cell-
mediated immunity associated with age, Cigarette smoking(21)(22)(23).
4.2Burden of TB:
4.2.1 Global scenario:
Deaths due to TB shows 1.5 million, majority of the deaths (1.1million) were HIV-
negative people and the rest were (0.4 million) HIV –positive people. In 1990 it was
the seventh most leading cause of morbidity. The trend is expected to continue till
2020.In 2001; 1.86 billion persons were infected with tuberculosis according to WHO
estimates. statistics shows that each year 8.74 million people may get infected with
tuberculosis and of these nearly 2 million die of the disease(24).

14
As per the statistics it comes to light that someone somewhere gets affected and dies
of TB every 10 seconds. Hence in 1993, TB is declared as global emergency by the
WHO. With effective diagnosis and treatment, 37 million people were saved during
the years 2000- 2013. Reportedly estimated that over 9 million people were affected
by TB and 1.5million died from disease of which 360,000 were HIV-positive
(1).Global prevalence of TB infection 32% (year 1999).DOTS (Directly observed
treatment short course) strategy was established worldwide as a key intervention to
achieve tuberculosis control worldwide in 1995. The targets of this strategy globally
are to achieve 70% case detection and 85% cure rates by 2005(25).
4.2.2 Indian scenario:
The estimated figure for prevalence is 2.6 million as per 2013 WHO statistics(3). TB
was declared as a notifiable disease in 2012 May, which means with immediate effect
all private doctors, caregivers and clinics who involved in treating a TB patient should
report every case of TB to the government(4). India and China alone contributed to 35
% of cases reported in 2013. According to Global tuberculosis report-2014 published
by WHO, 6.1 million TB cases were reported in 2013.Of the reported, 5.7 million
people were newly diagnosed and 0.4 million were already on treatment(3).
Prevalence of TB per lakh population has reduced from 465 in the year 1990 to 230 in
2012(12).
Mortality per lakh population has reduced from 38 in year 1990 to 22 in 2012 in those
with TB. In absolute numbers, morality due to TB has reduced from 3.3 lakhs to 2.7
lakhs annually2012 (26).

15
DOTS program has successfully treated 84% of the registered smear positive cases but
could detect only 28% of the estimated tuberculosis cases in the world(27). The key
elements of the TB control program are early diagnosis and prompt effective therapy.
Delay in diagnosis will eventually result in increased infectivity of the community. It
is estimated that an untreated patient of smear positive tuberculosis has the potential to
infection an average 10 contacts annually and over 20 during the natural history of the
disease until death(14).
Smear positive cases have high infectivity. In many countries the ministries of health
has increased the DOTS coverage since 1990`s.However this increased coverage is
not coupled with effective parallel case detection. Coverage is however crucial, but
not the only factor for timely access to health services. Studies show that access to
treatment is hindered by many factors influencing delay in the treatment in TB
patients. Several factors influence delay in diagnosis and start of treatment, which
includes individual perception of disease, distance between patient’s residence and
health services and expertise of the health personnel (5, 6, and 8).
Delay in diagnosis may lead to more extensive disease and high mortality. Delay
consequently adds to period of high infectivity in the community (14).
With the advent of RNTCP Program, early diagnosis and prompt effective therapy is
at its speed and the treatment centers are decentralized to stick to the policy at its best
(14).
Currently detection of TB is done by passive case finding where the patient
approaches the health facility. At the health facility with high clinical suspicion and

16
laboratory confirmation the disease is diagnosed. This major step requires expertise
and competency of the health care personnel at the clinical assessment as well as the
type of diagnostics available and skills of the laboratory personnel. In this complex
continuum, anything can go wrong at any part of the chain that is involved in
diagnosing the patient, and the disease remains undetected. This further adds to delay
in initiation of treatment and leads to further progression and transmission of the
disease with high infectivity and flared up transmission. Consequently increasing the
morbidity and mortality as well as transmission(28).
4.3 Risk factors for transmission:
The people who are at risk to contract the infection include close contacts with TB,
those living in crowded conditions, conditions like HIV which weaken the immune
system, conditions where people require treatment with immunosuppressant like
corticosteroids, chemotherapy, or tumor necrosis factor (TNF) inhibitors, those that is
young or old-because their immune system tends to be weaker than those of healthy
adults (29).
Also in poor health or poor diet-such as drug misuse, alcohol misuse, or homelessness
and inhabitants or immigrants who have spent time in country with high levels of
TB(29).
The density of population, size of family, crowded localities or living condition, poor
ventilation favour higher rate of infection and more disease(30).

17
Indiscriminate coughing and spitting by those with the disease will increase the
bacterial load and pose a threat of vicious cycle in the family. Covering mouth and
while coughing is an effective method as well as good ventilation may reduce the risk
of transmission of the disease. Untreated or partially family member is the source of
infection in many cases(30).
TB is serious obstacle to sustainable development. TB and poverty are interrelated.
Burden of the disease on the family increases the expenses for treatment as they
approach multiple health facilities before the diagnosis, though the DOTS are free of
cost. Thereby push a family into debts and exacerbating the existing poverty. It
decreases a person’s work capacity, forming a vicious circle.80% of the patients are in
economically productive age group(15-44years), the economic and social cost to them
is huge(17).
4.4 TB and its economic impact:
TB costs Rs. 12000 crore annually to India. Approximately 300,000 school drop outs
due to parents TB are other non-disease costs of TB. The cost to patient as he
approaches different health facilities before reaching the diagnosis and successful
treatment averages US$ 100-150, more than half of income of daily wage laborer. On
an average 3 month of work time is lost if an adult has TB; resulting in loss of 20-30%
of annual household income. If a patient dies from disease an average of 15 years of
income is lost(3).

18
4.4.1 Indirect cost to society:
US$3 billion per year, direct cost US$ 300 million. 100 million productive workdays
per year are lost due to illness alone. India loses more than 13 billion productive days
due to TB deaths. More than 100000 women are rejected by their families on account
of TB.
The patient with TB, with sputum smears positive acts as a reservoir as well as source
of infection for tuberculosis. Disease burden of bacillary cases in India is over 3.8
million and every year we detect 1 million smear positive cases(30).
4.5 Mortality from tuberculosis in India:
With advent of DOTS, mortality rate has declined to 23 per 100000 in 2010 from a
rate of 42 per 100000 in 1990, thus reducing the mortality rate by 55%. However in
sputum positive cases mortality has decreased 7-fold (from 29% to 4%) (17).
TB patient with HIV infection have more chances of deaths (14% against less than 4%
in HIV negative TB cases and development of multi drug resistant TB.
Under RNTCP diagnosis and treatment of TB is free of cost. Under RNTCP diagnosis
and treatment of TB is free of cost.(31) DOTS increased coverage in several health
facilities in several countries since 1990s, however there are still gaps in the diagnosis
as well as initiation of treatment.
Multiple factors were identified to contribute to the delay in both diagnosis as well as
initiation of TB treatment. The individual perception of the disease, socio economic

19
level, stigma, lack of awareness of the disease, severity of the disease, distance
between the nearest health facility and the patient`s residence are few of the listed
factors for delay as shown by various studies. There are challenges involved in
identifying the factors involved. Delay may occur at any level, the delay for a patient
to reach a health facility is called patient delay, and delay in diagnosis of TB at the
health facility is health system delay. Delay in case finding is studied in many
countries, in low prevalence countries delay is either attributed to disintegration of the
previous TB infrastructure for TB control or the disease is not suspected of TB (19-
22).
Longer delays were noticed in high prevalent countries. This delay was either due to
patients in approaching health care or physicians delay in diagnosis. Reported
determinants of delay include being part of specific patient groups (i.e. women, rural
versus urban residents, nationality, etc.) (20), either availability of the health providers
or accessibility to health services (20-21).
These studies show the association between delay and an increased economic burden
and also mortality attributed to tuberculosis. In order improve quality of RNTCP
country-specific determinants of delay must be studied and addressed.
4.6 Knowledge and health seeking behaviour on tuberculosis:
In a cross-sectional study done in the Ilala District hospital, Tanzania on consecutive
patients with pulmonary tuberculosis (TB) symptoms and who attended the clinic for
medication; health seeking behaviour of the infected was affected. Over half of the
patients (54.3%) said that they openly speak about illness to others, but 36.3% said

20
that their family and friends became less friendly. Others were discriminated even
after starting DOTS. This further delays the control of disease(32).
The commonest contact was another family member. People with poor recall ability
masked the history of TB contacts and lack of knowledge of TB status is noticed
among study population. (32).
Risk of infection is high among the close contacts(33). The close contacts usually
were family members. The transmission of TB generally occurs indoor, where droplet
nuclei stay in the air for a long time (4). In a study in Bangkok, Thailand, the
prevalence of TB among households contact was 47.08% (34). This confirms the
existence of knowledge that TB transmission is associated with environmental factors
(32, 33).
A WHO study was done on seven countries of the eastern Mediterranean region on the
health seeking behaviour of patients and health system response. The study was
conducted during the period of 2003-2004. Among the countries which were included,
in Pakistan the study was conducted in DOTS centers. In Iraq it was conducted in
respiratory and chest diseases institute and 3 other tuberculosis centers. In Somalia a
convenient sample was chosen from accessible centers of DOTS. In other countries
nation-wide cross sectional studies were conducted(35).
The age group of the study population is taken as 15 years and above. All newly
diagnosed smear positive cases are included in the study with estimated incidence for
tuberculosis least reliable sample size calculated was 5053 patients; data collected

21
using clustered random sampling technique. A positive history of previous exposure
to a tuberculosis patient was recorded in 12%–20% of patients in Syrian Arab
Republic, Egypt and Yemen, in more than one-third of patients in the Islamic
Republic of Iran, almost half of the patients in Somalia. In 93.4% of patients in
Pakistan, the main symptom that prompted the patients to seek health care was cough
with or without fever(35).
Social isolation and stigmatization were overall manifest in each gender’s perception
about tuberculosis as an illness. In Iraq, the degree of stigma was high (89.8%) for
most tuberculosis patients(38).The main source of information about tuberculosis was
friends/relatives (44.6%) as well as other tuberculosis patients (51.9%)(35).
In Pakistan, self-medication (50%), only 25 visited health care provider. However,
when the symptoms did not subside then the number increased to 239 patients. On
repetition of the symptoms next choice of preference was (33.5%) a traditional healer.
During the third time when the symptoms did not subside, but a higher percentage
(66.1%) also consulted a health care provider.
Most patients incurred heavy expenditures before the diagnosis of tuberculosis was
made. The median expenditure incurred was US$ 17.1 with a mean of US$ 18.6
(±14.62). In Pakistan (96.3% of cases) visited private clinic with the advent of
symptoms.

22
4.7 Reasons for delay in diagnosis from various studies:
The mean duration of delay between the onset of symptoms and treatment ranged
from 46 days in Iraq to 127 in the Islamic Republic of Iran.
Patient delay in the Syrian Arab Republic was significantly associated with inadequate
knowledge (AOR-1.07; 95% CI 1.01–1.14), seeking health care from a traditional
healer, (AOR 5.66; 95% CI 3.02–10.62), and seeking care from more than one health
care provider (AOR 1.20; 95% CI 1.02–1.40).In Yemen the significant risk factors for
patient delay were: female sex (AOR 2.03; 95% CI1.1–3.6) and inadequate knowledge
regarding the disease (AOR 1.1; 95% CI 1.04–1.2) for each unit of poor knowledge.
The fatalistic attitude of patients i.e. (60.5%) patients felt that the illness would cure
itself. Financial issues (16%) played a crucial role in delay in patients. Other reasons
were economic constraint, fear of diagnosis and social isolation (stigma) and
perceived poor quality of health services or inadequate staff attitude.
4.7.1 Risk factors of health system delay
The WHO study on seven countries of the eastern Mediterranean region also revealed
that older age positive history of chronic pulmonary disease and seeking initial care
from the private sector were risk factors for health system delay(AOR 1.001; 95% CI
1.003–1.007, AOR1.3; 95% CI 1.2–1.5andAOR 1.2; 95% CI 1.1–1.3
respectively)(32).

23
In Tanzania, a longer health care system delay was seen when patients, especially in
rural areas, consulted traditional healers (36).In Gambia, patients who initially
consulted health care providers had a shorter delay compared to patients who initially
consulted alternate healers (37).In Nepal longer patient delay in women was
contributed to by consultation with traditional healers and more frequent visits to
health care providers before final consultation with the NTP (38).
A significant difference was seen in initiation of treatment after diagnosis between
private health care providers and tuberculosis centers. When a patient was diagnosed
by a tuberculosis centre a median of 2 days and mean of 33 days was seen between
diagnosis and initiation of treatment. However when private practitioners diagnosed a
case of tuberculosis they took a very long time to initiate treatment (median 10 days;
mean 98 days) (32).
Lower income or the long distance to reach the health care providers prompted the
patients to either try self-medication (50%) or consult a pharmacy (42.2%) as the first
action after symptoms in Pakistan (32).
In Egypt the significant factors were: being illiterate (2.76 fold increased risk); time to
reach health facility >1/2 hour and>1 hour (1.73 and 1.75 fold increased risk
compared to those ≤1/2 hours); high crowding index (1.2 fold); and more than one
health care provider before diagnosis (2.55 fold increased risk)(32).In most of the

24
health centers patients were not satisfied with the health care facilities and consulted
the alternate methods of treatment providers including homeopaths (32)
The significant risk factors for patient delay that were frequently reported from the
studied countries were living in suburbs and rural areas, inadequate knowledge
regarding tuberculosis, a high degree of stigma, inadequate satisfaction with care,
seeking health care from a non-specialized individual at onset of symptoms, and
seeking care from more than one health care provider.
A study from India showed that tuberculosis patients on an average visited 2.5 doctors
before reaching the NTP (39).The delay reported from Pakistan was comparable to the
rates reported from Viet Nam, i.e. a mean of 69.3 days and median of 44.1 (40).
The mean duration between the onset of symptoms and treatment was 46 days in Iraq,
57 in Egypt, 59.2 in Yemen, 79.5 in Somalia, 80.4 in Syrian Arab Republic, 100 in
Pakistan, and 127 in Islamic Republic of Iran. Various mean delay durations were
reported from different endemic countries: 60 days from India, 87.5 days from
Malaysia, and a median delay of 99 days from Nepal (35-37).
Socio demographic characteristics proved to be significant predictors of delay in
almost all countries. Age above 35 years was associated with a 1.01–1.7 fold
increased risk per year in Syrian Arab Republic, Islamic Republic of Iran and Iraq.
Female gender was associated with an increased risk for delay in Yemen but was

25
protective in Egypt, prompting patients to seek timely health care. Illiteracy and
overcrowding were also significant risk factors in Egypt and Iraq, respectively.
Residence proved to be a significant risk factor for delay in Iraq, Somalia, and
Pakistan where living in suburban areas was associated with a 3, 2.2 and 2.5-fold
increased risk for delay in treatment, respectively, compared to urban areas(32).
The study done in health facilities in four districts in South India to investigate risk
factors for patient and health system delays among new smear-positive tuberculosis
patients contain health facilities that served urban, semi-urban and rural populations.
At each of the selected health facilities, all new smear-positive pulmonary tuberculosis
patients aged 15 years diagnosed during the preceding month and subsequently
undergoing treatment were considered eligible for the study. Cases diagnosed only on
the basis of X-ray and those with previous history of treatment were excluded.
Among 531 participants, the median patient delay was 20 days, health system delay
was 23 days and total delay was 60 days. Among the 29% of patients who delayed
seeking care for 1 month, 40% attributed their delay due to lack of awareness about
TB. Men delayed seeking care than women (P 0.07). In multivariate analysis, if the
patient had initially consulted a government provider (adjusted odds ratio [AOR] 2.2,
p value 0.001) the delay was more. Residency at a distance 2 km from a health facility
(AOR1.6, P 0.04), and was an alcoholic (AOR 1.6, P 0.04) also caused more than.
Health system delay was 7 days among 69% of patients (36).

26
First consultation with a private provider (AOR 4.0, P 0.001), a shorter duration of
cough (AOR 2.6, P 0.001), alcoholism (P 0.04) and patient’s residence 2 km from a
health facility (AOR 1.8, P 0.02). The total delay resulted largely from a long patient
delay when government providers were consulted first and a long health system delay
when private providers were consulted first.
Public awareness about chest symptoms and the availability of free diagnostic services
should be increased. Government and private physicians should be educated to be
aware about the possibility of tuberculosis when examining out-patients.
Effective referrals for smear microscopy should be developed between private and
public providers(39).
In conclusion, patient delay is mainly dependent upon the health-seeking behaviour of
tuberculosis patients which is mainly determined by their socio demographic
characteristics, place of first consultation and degree of stigma felt and knowledge
regarding the disease (32).
4.8 Stigma associated with TB:
In the study done in Zambia TB is reported as a contagious disease in 57% of
respondents (36). Of the total respondents 75.6% knew that TB is curable (38).
Many of them wanted to live in isolation (self-discrimination) which may be due to
fear of transmitting TB, and avoiding gossip and potential discrimination. This
attributes to 42.9% of men and 36.9% of women and they strongly agreed with this
idea (41).

27
A study from Dharan, India also depicted that stigma and treatment outcome and
delay in seeking care were associated (42).
High degree of stigma was protective (AOR = 0.64 (0.51–0.82)), in that the high
degree of stigma attached to tuberculosis by some patients is presumed to have
motivated them to seek health care earlier than others (32).
In Pakistan, 37.9% 0f the patients in the study evidently showed that fear of diagnosis
is one of the reasons for delay in reaching TB clinics. Stigma attached to the disease is
expressed a fear of social isolation if diagnosed with tuberculosis by 18.1% of patients
disease. One of the co-authors from the previous study done in Pakistan also
documented that stigma has a major role in determining the health-seeking behaviour
of patients(43),(44).
The efforts to combat TB were severely affected for stigma being one of the
reason(7). There is vast literature available to understand available to understand the
factors related or affecting delay in the health seeking behaviour which reflects on
early diagnosis and initiation of the treatment in TB patients(8). Apart from socio
economic status, knowledge about TB, smoking and other personal characteristics;
psychosocial factors also play an important role in the diagnosis of TB(9). The psycho
social factors include stigma in the case TB, which may cause rejection, shame,
blame, exclusion from those of healthy individuals(10). There is a great evidence from
various studies which suggest that stigma associated with TB could be a reason in
delay in seeking health care in TB patients(11).one of the factor highlighted from
other studies was many of the patients had the fear that their disease would be labelled
as related to AIDS (12).

28
4. Methodology:
5.1 study setting
Community Health Department and Development Hospital (CHAD):
The Department of Community Health, Christian Medical College, Vellore, India, has
been working in Kaniyambadi and Anaicut Blocks and urban parts of Vellore for the
past 50 years. The Community Health and Development (CHAD) Program is run by the
Department of Community Health. Along with the government health services, it
provides primary health care including maternal and child health services, screening
and treatment for communicable and non-communicable diseases. CHAD program
along with government runs RNTCP program as a Tuberculosis Unit, Tribal health
program and school health program. CHAD program runs mobile clinics offering
preventive and curative services in each village every month in Kaniyambadi block,
parts of Vellore urban and Tribal area (Jawadhi Hills). These areas have grass root
workers at the village level that identifies people with medical problems and also
function as DOTS providers. Patients who cannot be treated are referred to the base
hospital which offers secondary care services. If tertiary care is needed, patients are
further referred to the Christian Medical College and Hospital, where specialty care
and advanced laboratory services are available.
CHAD Hospital is situated at the outskirts of Vellore town. It is a 135 bedded
secondary care hospital and primary referral centre for its distinct outreach activity in
29
the rural block of Kaniyambadi. CHAD as a Non-governmental Organisation (NGO)
runs TB unit under public private mix scheme in RNTCP. CHAD TB unit caters to
Kaniyambadi block, Anaicut block, Alangayam block and a part of urban. In 2003
CHAD was recognized as a nodal centre for south zone for the RNTCP. The TB unit
of CHAD coordinates the TB activities nearly 15 peripheral centres including Vellore
Government Medical College, Narayani Hospital and primary health centres serving
6,50,00 population.
5.2 Study design:
The present study was a cross-sectional study to understand the factors related to
delay in diagnosis and initiation of treatment in newly diagnosed sputum positive
tuberculosis patients.
5.3 Study participants:
All new sputum positive patients enrolled in various health facilities under CHAD-TU
who were diagnosed during November 2014 to May 2015 were included in the study.
Temporary residents were excluded from the study.
For the community study among general population, people above 18 years from
Kaniyambadi block were included. Only permanent residences were selected.
5.4 Sampling technique:
As the number of new sputum patients registered every month is around 40 in this TU,
all participants who were above 18 years of age and willing to be visited by the
investigator within 4 weeks of staring treatment were selected.

30
To study the community’s perspective stigma towards TB, 10 villages were randomly
selected from Kaniyambai block and from each of these 10 villages, 10 people were
randomly selected (two stage sampling). Total of 100 people from general population
were interviewed after getting consent. None of the selected participant refused to
participate in this study.
5.5 Sample size calculation:
A multi-centric study by WHO showed that the median time delay was between 44
days to 97 days in different countries. The mean delay in Pakistan was 100.7 days (SD
34.2) (6). Using the formula N=4SD2/d
2, (with the SD of 34.2 and a d of 7 days), the
estimated desired sample size was 95.
For objective 3, to assess perception of stigma among general population, assuming
that 50% will have adequate knowledge on TB, 100 people were included.
5.6 Data collection:
During the study period, 128 patients were registered under the CHAD TU. The
details of the study participants were obtained from the TB registers as well as by
visiting the government health centres that were under the CHAD-TU. All these
patients were contacted through telephone or through the DOTS provider/STS and
obtained their oral permission to visit them. Those who gave permission were visited
at their residence or at the health centres or any place of their convenience.
The investigator could meet only 97 people as 3 people died within the first 2 weeks
and others could not be approached within 4 weeks of starting treatment. As 2 people

31
did not give consent, only 95 were interviewed. The time limit to interview the
participants with TB was taken as 4 weeks in order to minimize the recall bias. The
following is the flow chart depicting the method of data collection:
All new patients with pulmonary TB registering between November 2014 to May 2015 data is obtained from TB registers (128)
Eligible participant were contacted through phone/DOTS provider/STS officer for permission to meet (97)
Eligible participants were met at the clinic/ House /place of convenience within 2 weeks of diagnosis (97)
Informed consent was taken and included into the study (95, 2 refused)
Directly interviewed using structured questionnaire
Data entered using Epi-data and analysis was done using SPSS
During the data collection 3 patients were reported to be dead and 28 people
could not be contacted within 4 weeks of treatment.

32
For objective 3, to study the community’s perception regarding stigma
towards TB and their awareness:
Study area: Kaniyambadi block
Randomly selected 10 villages
Randomly selected 10 people from each village
Informed consent obtained
Interviewed using structured questionnaire
Data entry and analysis
5.7 Study tools:
A structured questionnaire was used to collect information. The questionnaire was
translated into Tamil (the local language) and back translated into English and pilot
tested.
The questionnaire had the following section: socio-demographic details, personal
habits like alcohol and smoking, monthly income and debt due to medical treatment,
knowledge on symptoms, modes of transmission, method of diagnosis, treatment
(duration and follow up) and cure. Participants with TB had another section with
questions on their treatment seeking pattern for symptoms suggestive of TB, time gap
between the onset of symptom to seeking medical help to diagnosis and initiation of
treatment.

33
Validated TB Stigma Scales developed by Van Rie et al., (2008) was used to measure
stigma related to TB. Variables measuring stigma were coded a 4-point Likert scale
with the following levels: ‘0’ as strongly disagree, ‘1’ as disagree, ‘2’ as agree, and ‘3’
as strongly agree.
5.8 Informed consent:
After getting oral consent, the investigator visited the participants and an information
sheet (in Tamil) was given to them explaining the purpose of the study, voluntary
nature of participation and confidentiality of the concerns and the disease. Participant
was verbally explained in their own language and further queries were clarified. Then
written consent was taken with their willingness to participate in the present study.
The health status of the participants with TB was checked and they were encouraged
to be take regular treatment.
5.9 Study variables
The main outcome variables were delay in diagnosis and treatment, knowledge on
tuberculosis (symptoms, modes of transmission, treatment and follow up) and
perceived stigma related to TB.
Delay is the main outcome. Delay can be divided into 2 components – patient delay
and health system delay. It can also be divided into diagnostic delay and treatment
delay.

34
Figure 4.6 Different categories of delay; and their contribution to total delay
Stigma: As measured by the validated scale which was developed by Van Rie et al. in
2008. This scale used a 4-point Likert scale with the codes of ‘0’ for strongly disagree,
‘1’ for disagree, ‘2’ for agree, and ‘3’ for strongly agree. Higher scores were related to
higher stigma. This scale has 2 components –The perception of people living with TB
about how community perceive or feel about Tuberculosis (Community Tuberculosis
Stigma Perception with11 items), the perception of people living with TB about how
Patients perceive or feel about TB (Patients’ Stigma Perception with 12 items).
Determinants of delay and stigma: Socio-demographic variables like age, gender,
education, occupation, type of house, type of family and economic status of the
family.
5.10 Data management and analysis:
Data collected was entered in epidata 3.1 and analysis was done using SPSS 16.
Descriptive statistics of the socio-demographic variables was done.

35
Mean and median delay in days (patient delay and health system delay) was
calculated. Using appropriate standards, study group was dichotomized into people
with delay and without delay with a cut off of 30 days.
Various determinants of delay were re-coded into binary variables and chi-square and
p-value was calculated. Univariate and multivariate analysis was done to see the
association between the determinants and the delay.
Knowledge and stigma was given scores and total score was computed. Mean scores
was calculated. Knowledge and stigma scores were dichotomized as people with
adequate knowledge/ inadequate knowledge and people who have perceived
stigma/no stigma.
Association between knowledge and delay, perceived stigma and delay was studied
using chi-square tests and regression analysis.
Knowledge between people with TB and without TB was compared using difference
in means and by chi-square test (between dichotomized groups). Similarly, perceived
stigma between people with TB and without TB was compared using difference in
means and by chi-square test (between dichotomized groups).

36
6. Results
The study population consisted of both men and women of 18 years and above age
group. The study aimed at assessing the factors related to delay in diagnosis and delay
in initiation of treatment in a newly diagnosed sputum positive patient.
The total number of patients who were interviewed for the study was 95. Among the
general population 100 people from Kaniyambadi village were interviewed to assess
the stigma related to tuberculosis (TB).
6.1 SOCIO DEMOGRAPHIC CHARACTERISTICS:
6.1.1 Age and gender distribution of the patients and general population:
The total number of newly sputum positive TB patients who gave consent was 95. Of
these 52.6% (52) of the patients belong to age group 36-60 years of age group, 26.3%
(25) were of 18-35 years age group and 21.6% (20) were more than 60 years of age
(Figure 6.1).
Figure 6.1Distribution by age
25
50
20 23
38 39
0
10
20
30
40
50
60
Upto 35years
36 - 60 years above 60yeas
stu
dy
par
tici
pan
ts
age in years
Participants with TB
Participants fromcommunity
26.3% 23%
52.6%
38%
21.6%
39%

37
Among the general population 39% belonged to age group of 60 years and above,
38% belong to 36-60 years and 54% of those interviewed were women (Figure 6.1).
Majority of the study participants were men; 74.7% among participants with Tb and
71.5% in the general community (Figure 6.2).
Figure 6.2Distribution by gender
Among the participants with TB, 94.7% (90) were from rural area and only 5 patient’s
i.e. 5.3% were from urban area (Figure 6.3). All the study participants among general
population are from rural area (Kaniyambadi block)
Figure 6.3 Distribution by place of residence among participants with TB
46, 46%
54, 54%
general population N=100
MALE
FEMALE71, 75%
24, 25%
participants with TB n=95
males
females
90, 95%
5, 5%
PARTICIPANTS WITH TB
RURAL
URBAN

38
6.2 Distribution of educational status of the study population:
Among the study patients 34.8% (33) had education up to high school, where as
almost equal proportion of 35.8% (34) were illiterate, only 9.5% (9) of them had
education up to college and above (Figure 6.4).
Among general participants only 37% were educated up to high school and 5% has up
to college (Figure 6.4).
Figure 6.4 Distribution by educational status of the study population
6.3 Distribution of the study population according to marital status
Among the interviewed 81.1% of the participants with TB and 96% among general
population were currently married (Figure 6.5).
34
13
33
6 9
22
14
37
22
0 0
5
10
15
20
25
30
35
40
no education up to primary high school highersecondary
school
college
participants with TB
general population
35.8%
22%
13% 14%
34.8%
37%
6.4%
22%
5%

39
Figure 6.5 Distribution of the study population according to marital status
6.4 Distribution according to the type of house and number of rooms
The proportion of the patients who live in terraced houses was 43.2% (41) as
compared to 11.6% (11) who lived in huts (Table 6.1). Only one of the patients
interviewed was homeless. Among the general population 60% of them lived in
terraced houses.
Table 6.1 Distribution by housing and number of rooms in the house
HOUSING Categories Participants with TB
(n=95)
General population
(N=100)
N % N& %
Type of
house
Hut 11 11.6 4
Thatched 25 26.3 18
Tiled 17 17.9 18
Terraced 41 43.2 60
Homeless 1 1.1 0
96, 96%
4, 4%
general community
ummarried
currentlymarried
17, 18%
77, 81%
1, 1%
participants with TB N=95
unmarried
currentlymarried
widowed

40
With respect to number of rooms 41% (49) were living in more than 2 roomed houses
as compared to 25.3% (24) living in one roomed houses. 58% among general
population were living in more than 2 roomed houses (Figure 6.6).
Figure 6.6 Number of rooms in participants’ house
6.5 Distribution of the study group by occupation, socio economic status
Unskilled and daily wage labourers constituted 29.5% (28) among participants with
TB and 14% among general community. The people with regular salaried jobs were
23.1% (22) and 7% respectively among people with TB and others. Unemployed
people were 15.8% (15) and 14% among people with TB and others. Among Only
7.4% (7) were house wives alone. Majority of those interviewed among general
population were house wives of 35% (Table 6.2).
24, 22%
35, 33%
49, 45%
participants with TB
one room
2 rooms
>2 rooms
10, 23%
32, 74%
1.4, 3%
General community
One room
2 rooms
>2 rooms

41
Table: 6.2 Distribution of the study group by occupation
Occupation prior to
illness
Participants
with TB
(n=95)
Participants from
community
(n=100)
N % N & %
House wife alone 7 7.4 35
Unemployed 15 15.8 14
Unskilled daily wage 28 29.5 16
Farming/business/mason 14 14.7 18
Salaried 22 23.1 7
Retired 5 5.3 10
Students 4 4.2 0
6.6 Distribution of study population by socio economic status:
Socio economic status is calculated by Modified Kuppuswamy socio economic scale
2012. Majority (66.3%) of the participants with TB (63) belonged to upper lower class
and only 5.3% were from lower class. Similarly 49% of general population
interviewed belongs to upper lower class (Table 6.3).
Table 6.3 Distribution of the study group by socio economic status
Socioeconomic
status
Participants with
TB (n=95)
Participants from
community (n=100)
N % N & %
Lower 5 5.3 7
Upper lower 63 66.3 49
Lower middle 23 24.2 32
Upper middle 4 4.2 12

42
6.6 Distribution of the participants by monthly income:
As given in Table 6.4, current income of the participant with TB per month is 2776
(95% CI 1974-3598) whereas prior to illness it was 4445 (95% CI 3525-5364).
Current family income per month is 5039 (95% CI 4202-5876) but prior to illness it
was Rs.6650 (95% CI 5678-7622). Among the participants without TB monthly
income was Rs.3682 (95% CI 2660-4704).
Table 6.4 Distribution of the participants by monthly income:
Monthly income categories Mean 95%CI
Income of participants with TB Prior to illness 4445 3525-5364
Current income 2776 1974-3598
Family income of participants with
TB
Prior to illness 6650 5678-7622
Current income 5039 4202-5876
Income of participants without TB Current income 3682 2660 – 4704
6.2 Personal habits:
6.2.1 Distribution of study participants by tobacco smoking:
The proportion of the participants with TB who were current smoking was 45.3% (43)
as compared to 9% in the general population (Table 6.5). Among the smoker’s i.e.
current smokers as well as ex-smokers 38.8% of them consumes 11-20
cigarettes/beedi per day. Duration of smoking as told by the patients was 15-29 years
in 32.7% of the smokers and more than 30 years above on 30.7% of them. In the
general population majority of them (84%) were never smokers.
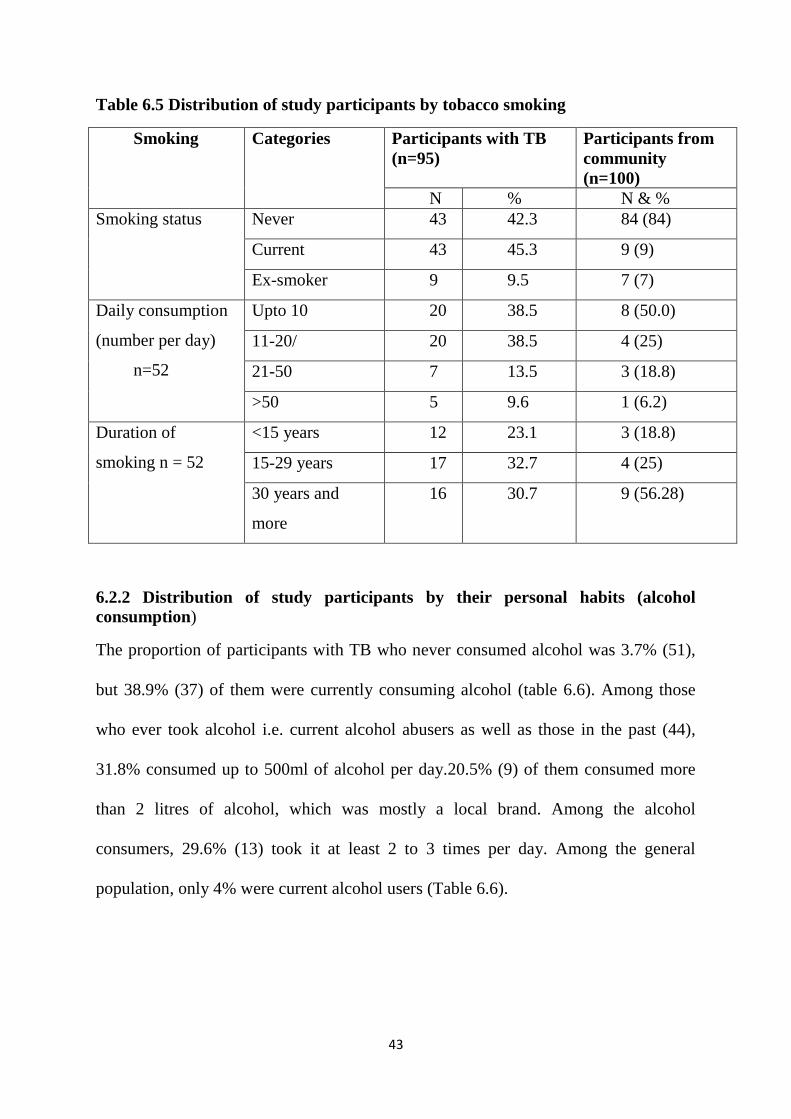
43
Table 6.5 Distribution of study participants by tobacco smoking
Smoking Categories Participants with TB
(n=95)
Participants from
community
(n=100)
N % N & %
Smoking status Never 43 42.3 84 (84)
Current 43 45.3 9 (9)
Ex-smoker 9 9.5 7 (7)
Daily consumption
(number per day)
n=52
Upto 10 20 38.5 8 (50.0)
11-20/ 20 38.5 4 (25)
21-50 7 13.5 3 (18.8)
>50 5 9.6 1 (6.2)
Duration of
smoking n = 52
<15 years 12 23.1 3 (18.8)
15-29 years 17 32.7 4 (25)
30 years and
more
16 30.7 9 (56.28)
6.2.2 Distribution of study participants by their personal habits (alcohol
consumption)
The proportion of participants with TB who never consumed alcohol was 3.7% (51),
but 38.9% (37) of them were currently consuming alcohol (table 6.6). Among those
who ever took alcohol i.e. current alcohol abusers as well as those in the past (44),
31.8% consumed up to 500ml of alcohol per day.20.5% (9) of them consumed more
than 2 litres of alcohol, which was mostly a local brand. Among the alcohol
consumers, 29.6% (13) took it at least 2 to 3 times per day. Among the general
population, only 4% were current alcohol users (Table 6.6).

44
Table 6.6 Distribution of study participants by their alcohol consumption
Alcohol consumption
Participants TB General
population
N % N % %
Alcohol intake Never 51 53.7 89
Current 37 38.9 4
Past 7 7.4 7
Daily
consumption
Upto 500 ml 14 31.8 6 (54.6)
501 - 1000 ml 13 29.6 3 (27.3)
>1001 - 2000
ml
8 18.1 2 (18.2)
>2000 ml 9 20.5
Frequency of
alcohol intake per
week
Upto 2 times 12 27.3 6 (54.6)
3-6 time 13 29.6 1 (9.1)
Daily 19 43.1 4 (36.4)
In the general population 89% of the interviewees never consumed alcohol, only 11 of
them gives history of alcohol abuse either in the past or at the present. Among these
11, 54.6% i.e.6 of them were consuming up to 500ml per day with frequency of 2 to 3
times per week.
6.3 History of TB among the study participants
Among the 95 patients interviewed 4.2% gave previous history of treatment for TB
and 16.8% gave family history of TB in the general population 3% had previous
history of TB and 3% gave family history of TB.
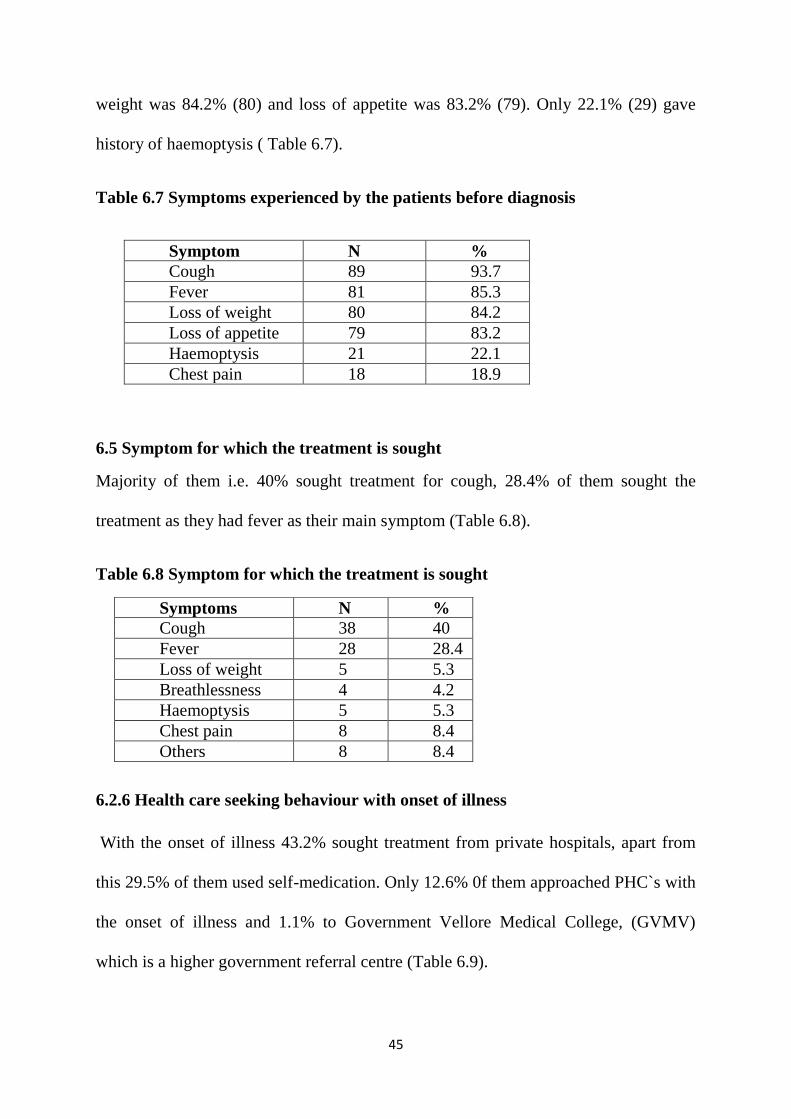
6.4 Symptoms experienced by the patients before they were diagnosed
Among the newly diagnosed sputum positive patients 93.7% (89) had cough as the
symptom, 85.3% (81) also had fever. The proportion of patients who had loss of
45
weight was 84.2% (80) and loss of appetite was 83.2% (79). Only 22.1% (29) gave
history of haemoptysis ( Table 6.7).
Table 6.7 Symptoms experienced by the patients before diagnosis
Symptom N %
Cough 89 93.7
Fever 81 85.3
Loss of weight 80 84.2
Loss of appetite 79 83.2
Haemoptysis 21 22.1
Chest pain 18 18.9
6.5 Symptom for which the treatment is sought
Majority of them i.e. 40% sought treatment for cough, 28.4% of them sought the
treatment as they had fever as their main symptom (Table 6.8).
Table 6.8 Symptom for which the treatment is sought
6.2.6 Health care seeking behaviour with onset of illness
With the onset of illness 43.2% sought treatment from private hospitals, apart from
this 29.5% of them used self-medication. Only 12.6% 0f them approached PHC`s with
the onset of illness and 1.1% to Government Vellore Medical College, (GVMV)
which is a higher government referral centre (Table 6.9).
Symptoms N %
Cough 38 40
Fever 28 28.4
Loss of weight 5 5.3
Breathlessness 4 4.2
Haemoptysis 5 5.3
Chest pain 8 8.4
Others 8 8.4

46
Table 6.9 Health care seeking behaviour with onset of illness
6.2.7 Health care facility from where patient first sought treatment
Private hospital is the first approached health facility by 64.2% of the patients, though
20% of them visited PHC`s for the treatment (Table 6.10).
Table 6.10 Health care facility from where patient first sought treatment
6.5.1 Health care providers who made initial diagnosis:
The initial diagnosis of TB was made by GVMC for a proportion of 35.8% and 32.6%
of the patients were diagnosed in CHAD (Table 6.11).
Health facilities N %
Self- medication 28 29.5
Traditional
medicine
1 1.1
Chemist shop 7 7.4
PHC 12 12.6
GH/CHC 2 2.1
GVMC 1 1.1
CHAD 3 3.2
CMCH 0 0
Private hospital 41 43.2
Health facility N %
Primary Health Centre 19 20
Government Hospital /Community Health
Centre
3 3.2
Government Vellore Medical College 3 3.2
CHAD hospital 8 8.4
CMC Hospital 1 1.1
Private hospital 61 64.2

47
Table 6.11 Health care providers who made initial diagnosis:
6.5.2 Expenditure related to TB care:
Money spent on approaching health providers for treatment (both direct and in direct
costs) was counted. Total cost before diagnosis spent by 38.9% of them was up to
Rs.500; only 2 of them spent money of more than Rs.50, 000 before diagnosis (Table
6.12).
Table 6.12 Expenditure related to TB care
Total cost before diagnosis (in
RS.).
No %
Upto 500 37 38.9
501-1000 13 13.7
1001-5000 25 26
5001-10000 7 7.4
10001-50000 13 13.8
>50000 2 2.1
6.5.3 Debts due to medical expenses (Rs.)
Out of the interviewed, 58.9% of them did not have any debts due to medical
expenses, but 21.1% of them had debts in the range of Rs. 10001 to 50000.
Health facilities N %
Primary Health Centre 5 5.3
Government Hospital /Community Health
Centre
11 11.6
Government Vellore Medical College 34 35.8
CHAD hospital 31 32.6
CMC Hospital 4 4.2
Private hospital 10 10.5

48
6.5.4 Reasons for choosing the particular provider
Of the interviewed 62.1% said that they choose the particular provider as it was
accessible for them; 31% of them has chosen as they had confidence in the particular
provider of their choice (Figure 6.7).
Figure 6.7 Reasons for choosing the particular provider:
6.5.5 Action/investigations done in the health facility:
Sputum examination is done in 98.9% of the patients interviewed, blood tests were
done in 96.8% of them where as 88.4% of them also had chest x-rays taken
(Table 6.13)
Table 6.13 Action/investigations done in the health facility:
Investigation N %
Sputum test 94 98.9
Blood test 92 96.8
X-ray 84 88.4
59, 63%
30, 32%
1, 1% 2, 2%
2, 2%
Reasons for choosing health provider
accessible
confidence
availability
free

49
6.5.6 Reasons for not going to CHAD/CMC/GVMC/PHC which are microscopic
centres)
The proportion of patient`s who thought it is not necessary to go to these centres
attributed to 47.4% where as 27.4% of them couldn’t go as they have no money.
Among those who 16 (16.8%) gave others as the reason; 9 of them have immediately
approached their regular health provider and waited to be cured of the sickness until
they were diagnosed of TB.
6.14 Reasons for not going to CHAD/CMC/GVMC/PHC:
Reasons N=95 %
Thought not necessary 45 47.4
Too far 2 2.1
Long waiting time/ too
busy 3 3.2
Previous bad experience 3 3.2
No money 26 27.4
Others 16 16.8
6.5.7 Time delay in diagnosis (number of days)
The proportion of patients who experienced a delay of 91-180 days was 26.3% and
24.2% of them experienced a delay of 31-90 days in diagnosis of the disease (Table
6.15).
Among those who had delayed 67.4% responded that they considered it as delay.
Table 6.15 Time delay in diagnosis (number of days)
Time delay in diagnosis Days N %
No delay/<2weeks 10 10.5
15-30 23 24.2
31-90 30 31.6
91-180 25 26.3
>180 7 7.4

50
6.5.8 Reasons by patients for delay
Among the 64(67.4%) who considered it as delay, 53.1% responded that they delayed
hoping that symptoms would subside. The proportion of patients who delayed due to
economic constraints was 17.2% (11), only 7.8% delayed due to fear of diagnosis
(Table 6.16).
Table 6.16 Reasons by Participants with TB for delay in reaching health centre
Reasons (n=64) N %
Fear of diagnosis 5 7.8
hoped that symptom will subside 34 53.1
Fear of social isolation 1 1.6
Economic constraints 11 17.2
unsatisfied staff attitude 2 3.1
Poor quality of health services 4 6.3
Others 7 10.9
6.5.9 Reasons for delay in seeking care in other people in the community who has
similar complaints
When asked about the reasons as perceived by the patient among those who had the
similar complaints in the community, 51.6% said that they do not have money was the
reason for their delay. 28.4% of them said they did not approach as they felt it was not
necessary to seek health care (Table 6.17).
Table 6.17 Reasons for delay in seeking care in other people in the community
who has similar complaints
Reasons N %
Not necessary 27 28.4
Too busy 6 6.3
Bad experience 4 4.2
No money 49 51.6
Don't know 9 9.5

51
6.5.10 Mean patient delay
The time taken by the patient to approach health facility for treatment with the onset
of symptom is taken as patient delay. The mean patient delay was 38.5 days with
range of 2 days to 540 days with 95% CI of 25.3-51.6 (Table 6.18).
Table 6.18 patient delay
Type of delay Mean 95%CI Median min Max
Patient delay in reaching health
facility for diagnosis 38.5 25.3-51.6 20 2 540
6.5.11 Mean health system delay
The time taken from the onset of symptoms to diagnosis of the disease is health
system delay. In the present study the mean health system delay in diagnosing was
99.3 days (95% CI 79.5-119.1) and range from 3 to 547 days (Table 6.19).
Table 6.19 Health system delay
Type of delay Mean 95%CI Median min Max
Health system delay in
diagnosing 99.3 79.5-
119.1
90 3 547
6.5.12 Mean treatment delay
The delay in starting the treatment once the diagnosis is made is considered as
treatment delay. The mean treatment delay was 2 days in the present study (95% CI
2.1-3.6) with a maximum delay of 28 days (Table 6.20). This was because one patient
couldn`t accept the fact that he was attacked with TB; in denial he changed the doctors
and only when the symptoms worsened he started the treatment.

52
Table 6.20 Treatment delay
Type of delay Mean 95%CI Median Min Max
Treatment delay (after diagnosis
to initiating treatment) 2 2.1-3.6 2 0 28
6.5.13 Delay in initiation of treatment on those who are transferred out
The mean delay in initiation of treatment in patients who were transferred out was 4.5
days with a maximum delay of 60 days with 95% CI of 1.9-7.1(Table 6.21).
Table 6.21 Delay in initiation of treatment on those who are transferred out
Type of delay Mean 95%CI Median min Max
Among the patients who have been
referred out, delay in initiating
treatment
4.5 1.9-7.1 2 0 60
6.5.14 Mean Centre delay
The delay in diagnosis after the visit to the first health care provider was centre delay
(first health centre to final health centre). The mean centre delay was 60.8 days (Table
6.22) with maximum delay of 358 days (95% CI 42.3-78.8).
Table6.22 Centre of delay
Type of delay Mean 95%CI Median min Max
Centre delay 60.8 42.3-78.8 16 0
358
6.5.15 Mean Total delay
The total delay from the onset of symptoms to initiation of treatment in a patient with
new sputum positive TB is calculated in the present study. The mean total delay was
104.8 days (95% CI 84.4-125.2) with a range from 5 to 549 days (Table 6.23).

53
Table 6.23 Total delay
Type of delay Mean 95%CI Median min Max
Total delay 104.8 84.4-
125.2
91 5
549
Summary table of different delay:
The different levels of delays are listed below in Table 6.24. The maximum delay is
after seeking treatment to diagnosis of TB and the next is the patient delay.
Table 6.24 Delay
Type of delay Mean 95%CI Median min Max
Patient delay in reaching health
facility for diagnosis
38.5 25.3-51.6 20 2 540
Centre delay 60.8 42.3-78.8 16 0 358
Health system delay in diagnosing 99.3 79.5-
119.1
90 3 547
Treatment delay (after diagnosis to
initiating treatment)
2 2.1-3.6 2 0 28
Among the patients who have been
referred out, delay in initiating
treatment
4.5 1.9-7.1 2 0 60
Total delay 104.8 84.4-
125.2
91 5
549
6.5.15 Distance from home to DOTS
The proportion of people who said that the distance to DOTS centre 1.1 km to 3 km
was 42.1% where as 34.7% patients said the distance to DOTS centre was up to 1 km
(Figure 6.8). Mean distance is 2.9 km (95% CI 2.2 to 3.6) and median is 2 km`s.

54
Figure 6.8 Distances from Home to DOTS Centre
6.5.16 Perception of the patients as they had symptoms of TB
The proportion of the patients who suspected that the symptoms could be because of
TB attributes to 22.1% (21). The proportion of patients who heard about TB in their
life was 35.8% (34).
6.5.17 Perception of seriousness of the illness by patients:
Among the patients 50.5% of them feel that it is very serious to oneself, 35.8% feels
that it is somewhat serious (Figure 6.9). The proportion of who considers TB as very
serious in the community is 54.7% and 32.6% considers it as somewhat serious to the
community.
Figure 6.9 Perception of seriousness of TB according to patient and community
33, 35%
40, 42%
13, 14%
9, 9%
distribution by distance to DOTS centre (km)
up to 1 km
1.1 to 3
3.1 to 5
>5
48, 50% 34, 36%
11, 12% 2, 2%
patient perspective
very serious
somewhatserious
not thatserious
not sure
52, 55% 31, 33%
9, 9%
3, 3%
community perspective
very serious
some whatserious
not thatserious

55
6.6 KNOWLEDGE
6.6.1 Knowledge of the symptoms of TB among the patients:
Majority of participants with TB know the symptoms. The proportions of the patients
who know cough more than 2 weeks and weight loss as symptom of TB is 89.5%.
Among the patients 77.9% know loss of appetite as the symptom of TB. 80%of them
know evening rise of temperature as symptom of TB. Only 43.2% of them say
haemoptysis is a symptom of TB (Table 6.26). Majority of participants without TB
knew that cough and loss of weight are symptoms of TB.
6.25 Knowledge of the symptoms of TB among the patients:
6.6.2 Knowledge of transmission of TB:
The proportion of people who said that TB is transmitted by cough and sneeze is
71.6%, 54.7% said that it is transmitted by sharing utensils. Those who said
transmission was by touch accounts to 29.5% and 26.3% said it was transmitted by
sitting next to someone with TB. Among the general population, knowledge is very
high, 98% knew that the transmission is through air (Table 6.26).
Symptoms Participants with TB Participants
without TB
N % No & %
Cough >2 weeks 85 89.5 71
Hemoptysis 41 43.2 62
Weight loss 85 89.5 97
Loss of appetite 74 77.9 66
Fever at evening/night 76 80 46
Chest pain 50 52.6 50

56
Table 6.26Knowledge of transmission of TB
6.6.3 Knowledge on prevention and cure of TB:
The proportion of people who said that TB can be prevented by covering while
sneezing or coughing was 80%, 74.7% said it could be prevented with good nutrition.
Among the general population, 99% knew that covering while coughing/sneezing
prevents transmission of TB.
Table 6.27 Knowledge on prevention and cure of TB
96.8% of the participants with TB and 100% of general population m opined that TB
can be cured.
Mode of transmission Participants with
TB
Participants without
TB
N % No & %
Cough/sneeze 68 71.6 98
Touch 28 29.5 23
Sitting next to someone
with TB
25 26.3 17
Sharing utensils 52 54.7 22
Hereditary 13 13.7 0
Contagious 18 18.9 77
Mode of Prevention Participants with
TB
Participants
without TB
N % No & %
Covering while
coughing/sneezing
76 80 99
Avoid sharing meals 61 64.2 56
Good ventilation 57 60 54
Good nutrition 71 74.7 95

57
6.6.4 Knowledge of treatment and duration of treatment
Among the patients 93.7% said that TB d with regular can be treated with regular
medicines, 71.6% said that TB can be cured by proper nutrition (Table 6.28).
The proportion of patients who said duration of the treatment for TB is 6 months was
77.9% and 14.7% of them are not aware of the duration of treatment.
Table 6.28 Knowledge of treatment and duration of treatment
6.6.6 Knowledge regarding repeat sputum testing after initiation of sputum
Only 63.2% of the newly sputum positive TB patients were regarding the sputum
testing after initiation of treatment, of those who were aware 50% feel that sputum
needs to be checked only once (Table 6.29).
Table 6.29 Knowledge regarding repeat sputum testing after initiation of sputum
Treatment Variable N %
Regular medicines 86 93.7
Proper nutrition 68 71.6
Duration of treatment < 6 months 6 6.4
6 months 74 77.9
7 to 9 months 1 1.1
Not known 14 14.7
Regarding sputum
testing (among patients
only)
Variable N %
Aware that sputum should
be checked
Yes 60 63.2
No of times Once 30 50
Twice 19 31.7
Three times 2 3.3
Not sure 9 15

58
6.9.4 Knowledge of timing of repeat sputum sample
Among the 60 patients who were aware of repeat sputum examination 51.7% said that
it should be repeated after 2 months and 21.7% of them said that they were not sure.
6.30 Knowledge of timing of repeat sputum testing
Knowledge on timing of testing sputum (follow up) was not much; only 51.7% knew
that it should be tested at 2 months. Their knowledge on sputum testing at 6 months is
very poor (Table 6.30)
6.7 Knowledge among participants regarding susceptibility to TB
6.7.1 Knowledge among study participants with TB regarding the susceptible
individuals for TB
88.4% of the study participants with TB said that anyone can get TB, 30.5 said that
people who consume alcohol are highly susceptible to get TB. Among the general
population, 95% knew that anyone can get TB.
Table 6.31 Awareness among participants with TB regarding susceptible
individuals for TB
Timing of repeat
sputum testing
N %
1 month 9 15
2 months 31 51.7
3 months 5 8.3
6 months 2 3.3
Not sure 13 21.7
Who can get tuberculosis Participants with TB Participants without TB
N % No & %
Any one 84 88.4 95
People with HIV 10 10.5 2
People with DM 15 15.8 5
People with Alcoholism 29 30.5 10

59
6.7.2 Knowledge scores among participants with TB patients and general
community:
Mean knowledge score among people with Tuberculosis was 16.2; SD=3.1 (15.6-
16.9). Mean knowledge score among general community was 16.34; SD=2.4 (15.8-
16.2).
Poor knowledge was given a score of below 17, average knowledge was given a score
of 17-19 and good knowledge was given a score 20 and above.
Among the study participants with TB, 35.8% had poor knowledge and 37.9% had
average knowledge. Only 26.3% of them had good knowledge.
Among the study population in the general 44% had average knowledge regarding the
disease and only 22% had good knowledge as compared to rest of the population
(table 6.32).
Table 6.32 Knowledge among TB patients and general community
TB patients
N %
General
community
N %
Poor 17 34 35.8 34 34
Average 17-19 36 37.9 44 44
Good >/20 25 26.3 22 22
6.8 Perception of Stigma
A validated questionnaire with the 11 items on perception of people living with TB
about how community perceive or feel about Tuberculosis (Community Tuberculosis
Stigma Perception -11 items) and 12 items on the perception of people living with TB

60
about how Patients (Person) perceive or feel about TB (Patients’ Stigma Perception -
12 items) was administered to the people with TB and people without TB.
After the analysis, the stigma in the community was scored. For the community
perception of stigma among the TB patients the mean score was 1.96 with an SD 0.5
and in the general population mean score 1.7 and 0.4 as SD. The percentage mean
score was 65.4 with 16.7 among TB patients; in the general population it was 59.9 and
the standard deviation was 12.8 (Table 6.33). For the patient perception of stigma
among the TB patients the mean score was 1.8 with an SD 0.4 and in the general
population mean score 1.8 and 0.3 as SD. The percentage mean score was 59.24 with
14.5 among TB patients; in the general population it was 59.8 and the standard
deviation was 9.7.
Table6.33 Stigma in the study population
TB patients
MEAN SD
General
community
MEAN SD
Community perspectives toward
tuberculosis - Mean score
1.96
0.5
1.7 0.4
Community perspective towards
tuberculosis-%mean score
65.4 16.7 59.9 12.8
Patient perspectives toward tuberculosis –
Mean score
1.8 0.4 1.8 0.3
Patient perspective toward tuberculosis -
%mean score
59.24 14.5 59.8 9.7
Stigma was further classified as mild, moderate and severe. A score of less than 1.75
was considered as mild stigma, 1.75-1.99 was considered as moderate stigma and a
score of more than or equal to 2 was classified into severe stigma.

61
Among participants with TB, nearly 50% had severe level of stigma (patient
perspective) and 35.8% had moderate level. In the general community, 57% had
moderate and 12% had severe level of perceived stigma (patient perspective).
Table: 6.34 Stigma in patient perspective categorized
Level of stigma Score TB patients
N %
General
community
N %
Mild <1.75 14 14.7 31 31
Moderate 1.75-1.99 34 35.8 57 57
Severe >/2 47 49.5 12 12
The level of stigma (community perspective) according to patient was severe in 33.7%
and moderate in 30.5% where as in the general community, 45% severe and 33%
moderate (Table 6.35).
Table: 6.35 stigma in community perspective categorized
Level of
stigma
score TB patients General
community
N % N %
Mild <1.75 34 35 22 22
Moderate 1.75-1.99 29 30.5 33 33
Severe >/2 32 33.7 45 45
6.9 Measurement of associations:
In the present study, the association between knowledge and various factors was
carried out on all the 195 participants (patients + general community) who were
interviewed. Odds of exposure to various factors such as age, gender, education,
occupation, socio economic status (SES), residential status, h/o TB (past and family),
drinking and smoking; for knowledge were calculated by univariate analysis and 95%
confidence interval was estimated. Age, gender did not show any significant

62
association with knowledge (Table 6.36). Those with lower education chose to do
unskilled jobs or stay unemployed and eventually reflect in lower socioeconomic
strata; and show chance of low knowledge which was not statistically significant.
6.9.1 Knowledge in study population
Table 6.36 Knowledge (n=195) in study population
Variable Categories Knowledge p-value Unadjusted
OR & 95%CI
Adjusted
OR &
95%CI Low (%) High (%)
Age Upto 35 21(43.8) 27(56.2) 0.137 0.6
(0.31-1.15)
0.698
(0.32-1.52) > 35 years 83(56.5) 64(43.5)
Sex Female 40(51.3) 38(48.7) 0.663 0.87
(0.491-1.54)
0.711
(0.32-1.58) Male 64(54.7) 53(45.3)
Education Upto 5 50(60.2) 33(39.8) 0.111 1.627
(0.916-2.89)
1.655
(0.79-3.46) >5th
class 54(48.2) 58(51.8)
Occupation Nil/Unskilled 43(58.9) 30(41.1) 0.239 1.433
(0.798-2.576)
1.219
(0.61-2.43) Others 61(50.0) 61(50.0)
SES Low 66(53.2) 58(46.8) 1.000 1.012
(0.564-1.816)
1.370
(0.69-2.72) Middle 38(53.5) 33(46.5)
Residence Urban 2(40.0) 3(30.0) 0.666 0.575
(0.094-3.52)
0.49
(0.07-3.33) Rural 102(53.7) 88(46.3)
Smoking Ever 35(51.5) 33(48.5) 0.764 0.89
(0.494-1.60)
0.564
(0.22-1.47) Never 69(54.3) 58(45.7)
Alcohol Ever 29(52.7) 26(47.3) 0.967 1.000
(0.517-1.80)
1.07
(0.43-2.69) Never 75(53.6) 65(46.4)
TB Present 5(71.4) 2(28.6) 0.452 2.247
(0.425-11.8)
0.741
(0.43-2.72) Absent 99(52.7) 89(47.3)
Family
history of TB
Present 10(52.6) 9(47.4) 0.949 0.969
(0.376-2.501)
0.74
(0.25-2.20) Absent 94(53.4) 82(46.6)
6.9.2 Perception of stigma:
Stigma is one of the hindrances for the control of tuberculosis. On univariate analysis
of community perception of stigma among 195 study participants (patients + general)
with various factors such as age, sex, marital status, education and other factors as
shown in the table 6.37. It was found that perception of stigma was more among men.

63
In the same way ever smokers and people with TB perceive more stigma as compared
to others.
Table 6.37 Community perception of stigma related to TB (N=195)
Variable Categories Stigma p-value Unadjusted OR &
95%CI High Low
Age Upto 35 12(25.0) 36(75.0) 0.469 1.410
(0.673-2.954) > 35 years 47(32.0) 100(68.0)
Sex Female 15(19.2) 63(80.8) 0.007* 2.532
(1.29-4.98) Male 44(37.6) 73(62.4)
Education Upto 5 29(34.9) 54(65.1) 0.270 0.681
(0.37-1.26) >5
th class 30(26.8) 82(73.2)
Occupation Nil/Unskilled 22(30.1) 51(69.9) 1.000 1.009
(0.537-1.898) Others 37(30.3) 85(69.7)
SES Low 45(36.3) 79(63.7 0.016* 2.319
(1.164-4.623) Middle 14(19.7) 57(80.3)
Residence Urban 1(20.0) 4(80.0) 1.000 1.758
(0.192-16.06) Rural 58(30.5) 132(69.5)
Smoking Ever 32(47.1) 36(36) <0.001* 0.304
(0.160-0.575) Never 27(21.3) 100(78.7)
Alcohol Ever 24(43.6) 31(56.4) 0.015 0.431
(0.223-0.830) Never 35(25.0) 105(75.0)
Marital status Unmarried 11(52.4) 10(47.6) 0.025 2.88
(1.152-7.236) Ever married 48(27.6) 126(72.4)
Family history
of TB
Present 5(26.3) 14(73.7) 0.798 1.239
(0.425-3.614) Absent 54(30.7) 122(69.3)
Knowledge Low/Average 25(24) 79(76.0) 0.060 1.885
(1.015-3.499) High 34(37.4) 57(62.6)
Presence of
TB
Present 12(12.0) 88(88.0) <0.001 * 0.139
(0.067-0.288) Absent 47(49.5) 48(50.0)
* Statistically significant
6.9.3 Multivariate analysis for perception of stigma:
A multivariate analysis is performed on the variables which showed statistically
significant in univariate analysis. The variable includes sex (p value 0.007, OR=2.532

64
& 95% CI1.29-4.98); SES (p value 0.016, OR=2.319 & 95% CI 1.164-4.623);
smoking (p value <0.001, OR=0.304 & 95% CI 0.160-0.575); alcohol (p value 0.015,
OR=.431 & 95% CI 0223-0.830); marital status ( p value 0.025, OR 2.88 & 95% CI
1.152-7.236); presence of TB (p value <0.001, OR 0.139 95% CI 0.067-0.288). On
adjusting for the above mentioned variables as shown in the table 6.38, only people
with TB were found to have more perception of stigma, which was statistically
significant.
Table:6.38 Logistic regression model for factors associated with community
perception
Variables Categories Perception of stigma P value OR
95% CI
AOR
95% CI High Low
Sex Female 15(19.2) 63(80.8) 0.406 2.532
(1.29-4.98)
0.663
(0.252-1.745) Male 44(37.6) 73(62.4)
SES Low 45(36.3) 79(63.7) 0.104 2.319
(1.164-4.623)
0.531
(0.247-1.140) Middle 14(19.7) 57(80.3)
Smoking Ever 32(47.1) 36(36) 0.152 0.304
(0.160-0.575)
2.293
(0.738-7.125) Never 27(21.3) 100(78.7)
Alcohol Ever 24(43.6) 31(56.4) 0.348 0.431
(0.223-0.830)
0.590
(0.196-1.777) Never 35(25.0) 105(75.0)
Marital
status
Unmarried 11(52.4) 10(47.6) 0.150 2.88
(1.152-7.236)
2.201
(0.75-6.45) Ever married 48(27.6) 126(72.4)
Patients with
TB/ general
community
Patient with TB 12(12.0) 88(88.0) <0.001* 0.139
(0.067-0.288)
0.199
(0.088-0.451) General
community
47(49.5) 48(50.0)
* Statistically significant
6.9.4 Perception of stigma in study participants with TB:
The perception of stigma among 195 participants is studied with the help of 12 point
stigma scale – a validated tool from van Rie et al study. In the univariate analysis as
well as after adjusting for odds with various factors as shown in the table people with

65
good knowledge has more perception of stigma which is statistically significant
(Table 6.39). It could probably be explained as they know the symptoms of TB they
have many associated fears with it.
Table:6.39 Perception of stigma in study participants with TB
Variable Categories Stigma p-value Unadjusted OR
& 95%CI High Low
Age Upto 35 14(29.2) 34(70.8) 0.125
1.821
(0.902-3.67) > 35 years 63(42.9) 84(57.1)
Sex Female 29(37.2) 49(62.8) 0.655 1.715
(0.652-2.118) Male 48(41.0) 69(59.0)
Education Upto 5 38(45.8) 45(54.2) 0.139 0.633
(0.354-1.31) >5th
class 39(34.8) 73(65.2)
Occupation Nil/Unskilled 31(42.5) 42(57.5) 0.547 0.820
(0.454-1.48) Others 46(37.7) 76(62.3)
SES Low 54(43.5) 70(56.5) 0.132 1.610
(0.874-2.965) Middle 23(32.4) 48(67.6)
Residence Urban 1(20.0) 4(80.0) 0.650 2.667
(0.292-24.3) Rural 76(40.0) 114(60.0)
Smoking Ever 28(41.2) 40(38.8) 0.760 0.897
(0.492-1.636) Never 49(38.6) 78(61.4)
Alcohol Ever 23(41.8) 32(58.2) 0.745 0.874
(0.463-1.64) Never 54(38.6) 86(61.4)
Marital status Unmarried 9(42.9) 12(57.1) 0.815 1.169
(0.468-2.923) Married 68(39.1) 106(60.9)
Family
history of TB
Present 6(31.6) 13(68.4) 0.622 1.465
(0.532-4.035) Absent 71(40.3) 105(59.7)
Knowledge Low/Average 31(29.8) 73(70.2) 0.003* 2.40
(1.33-4.33) High 46(50.5) 45(49.5)
TB Present 3(42.9) 4(57.1) 1.000 0.865
(0.19-3.78) Absent 74(39.4) 114(60.6)
* Statistically significant
6.9.5 Factors affecting delay in study participants with TB
Delay with a cut off taken as 30 days is categorised to delay of < 30 days and delay of
> 30 days. To measure the association with various factors as shown in the table both
univariate and multivariate analysis was performed. The determinants of delay include

66
socio-demographic variables like age, gender, education, occupation, type of house,
type of family and economic status of the family.
Table: 6.40 Factors affecting delay in diagnosis and initiation of treatment in TB
patients
* Statistically significant
Variable Categories Delay p-value Unadjusted
OR &
95%CI > 30
days(%)
<30
days(%)
Age Upto 35 14(56) 11(44) 0.257 1.714
(0.672-4.376) > 35 years 48(68.6) 22(31.4)
Sex Female 14(58.3) 10(41.7) 0.410 1.49
(0.576-3.86) Male 48(57.6) 23(32.4)
Education Upto 5 31(66.0) 16(34.0) 1.000 0.941
(0.404-2.19) >5th
class 31(64.6) 17(35.4)
Occupation Nil/Unskilled 32(74.4) 11(25.6) 0.088 0.469
(1.104-6.987) Others 30(57.7) 22(42.3)
SES Low 49(72.1) 19(27.9) 0.034* 2.77
(1.922-42.56) Middle 13(48.1) 14(51.9)
Residence Urban 3(60.0) 2(40.0) 0.800 1.269
(0.201-7.99) Rural 59(65.6) 31(34.4)
Smoking Ever 36(69.2) 16(30.8) 0.372 0.680
(0.291-1.59) Never 26(60.5) 17(39.5)
Alcohol Ever 31(70.5) 13(29.5) 0.324 0.650
(0.276-1.532) Never 31(60.8) 20(39.2)
Family history of TB Present 9(56.2) 7(43.8) 0.409 1.585
(0.531-4.732) Absent 53(67.1) 26(32.9)
Knowledge Low/Average 38(71.7) 15(28.3) 0.193 0.526
(0.224-1.237) High 24(57.1) 18(42.9)
Stigma- community Low/Average 28(58.3) 20(41.7) 0.197 1.868
(0.791-4.410) High 34(72.3) 13(27.7)
Stigma – patient Low/Average 39(61.9) 24(38.1) 0.371 1.573
0.625-3.959 High 23(71.9) 9(28.1)
Distance to health
centre
Upto 1 Km 22(66.7) 11(33.3) 1.000 0.909
(0.373-2.217) >1 Km 40(64.5) 22(35.5)
Debt due to medical
expenses
Present 32(82.1) 7(17.9) 0.005* 0.252
(0.095-0.667) Absent 30(53.6) 26(43.4)
No. health facilities
visited
>2 centres 40(83.3) 8(16.7) <0.001* 5.682
(2.195-14.7) Upto 2 centres 22(46.8) 25(53.2)
Health seeking
behavior
Self/chemist 21(58.3) 15(41.7) 0.278 0.615
(0.259-1.458) Health centre 41(69.5) 18(30.5)
Health facility Private 43(70.5) 18(29.5) 0.181
0.530
(0.222-1.269) TB centre 19(55.9) 15(44.1)
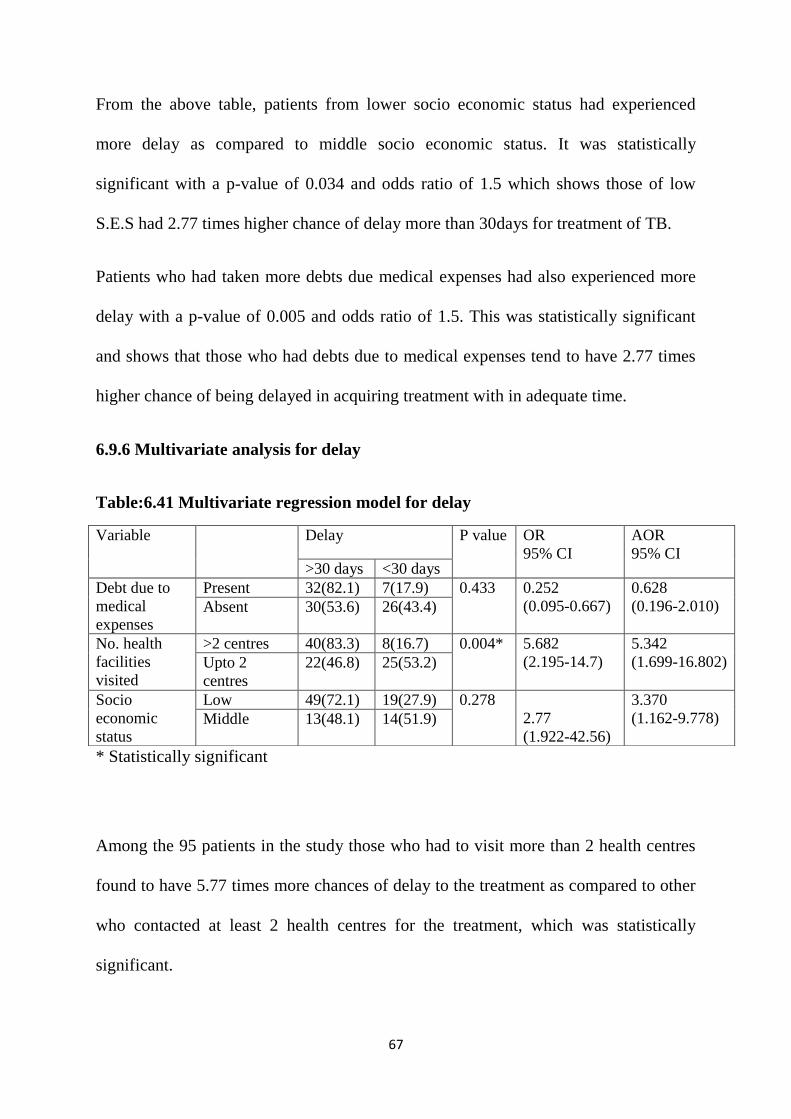
67
From the above table, patients from lower socio economic status had experienced
more delay as compared to middle socio economic status. It was statistically
significant with a p-value of 0.034 and odds ratio of 1.5 which shows those of low
S.E.S had 2.77 times higher chance of delay more than 30days for treatment of TB.
Patients who had taken more debts due medical expenses had also experienced more
delay with a p-value of 0.005 and odds ratio of 1.5. This was statistically significant
and shows that those who had debts due to medical expenses tend to have 2.77 times
higher chance of being delayed in acquiring treatment with in adequate time.
6.9.6 Multivariate analysis for delay
Table:6.41 Multivariate regression model for delay
* Statistically significant
Among the 95 patients in the study those who had to visit more than 2 health centres
found to have 5.77 times more chances of delay to the treatment as compared to other
who contacted at least 2 health centres for the treatment, which was statistically
significant.
Variable Delay P value OR
95% CI
AOR
95% CI >30 days <30 days
Debt due to
medical
expenses
Present 32(82.1) 7(17.9) 0.433 0.252
(0.095-0.667)
0.628
(0.196-2.010) Absent 30(53.6) 26(43.4)
No. health
facilities
visited
>2 centres 40(83.3) 8(16.7) 0.004* 5.682
(2.195-14.7)
5.342
(1.699-16.802) Upto 2
centres
22(46.8) 25(53.2)
Socio
economic
status
Low 49(72.1) 19(27.9) 0.278
2.77
(1.922-42.56)
3.370
(1.162-9.778) Middle 13(48.1) 14(51.9)

68
On adjusting for various other factors as shown in the table, people with low S.E.S,
who had debts due to medical expenses and those who had to visit more than 2 health
centres were found to statistically significant.
This could be explained as patients from lower economic status due to poverty had
often visited local doctors, waited with the anticipation that symptoms would get
better with the available treatment. But this eventually prolonged the duration and
severity of symptoms and led to more debts as they lost their daily wages due to
sickness. The present study gives a significant result that poverty is still the main
reason for this vicious circle of the disease

69
7. Discussion
Tuberculosis is a preventable as well as curable disease. Since the disease is
contagious; it stands as a global health problem. The disease is highly wide
spread(45).Under W.H.O initiative with DOTS, to increase success of TB treatment it
emphasizes on passive case finding. Since the passive case finding depends on their
willful appearance before the health facility which indirectly reflects on their health
seeking behaviour. In a scenario like this there are high chances of delay in seeking
health care with onset of symptoms(14).
The delay in approaching a health care provider with initiation of symptoms will
increase the bacillary load and pose a threat to increased transmission of the disease.
Each of the infected patients with smear positivity are highly infective and has the
potential to infect 10 other people in their life time(8).Prolonged delay can lead to
increased infectivity in the community and severe morbidity(46).
Hence the present study aimed at identifying the causes of delay. This is important in
case detection and further elimination of the disease. If case finding is improved, it
may save lives 10 times as DOTS alone(16).
The present study is a cross sectional study done to analyze the factors affecting the
delay in diagnosis and initiation of treatment in newly diagnosed sputum positive
pulmonary tuberculosis who registered under CHAD-TU during the period of
November 2014 to May 2015.One of the major risk factor for delay, as perceived from
various studies is stigma(35).The level stigma in the community as well as in the
patient group is analyzed.

70
In the present study among the 95 patients those who had to visit more than 2 health
centers were found to have 5.77 times more chances of delay to the treatment as
compared to other who contacted at least 2 health centers for the treatment, which was
statistically significant. Low SES and debts due to medical expenses were found to
have significant association with delay in diagnosis of treatment (univariate analysis).
Several studies show that repeated visits to health centers or same health centre at the
same level is the main problem for delay in diagnosis or initiation of treatment(9).
This is a vicious circle that causing delay, in Burkina Faso since specialized services
were poor many of the patients had repeated consultations at the same level of health
care(47). In Ghana the health personnel were under trained; hence proved to be reason
for delay and was correlated with failure to do sputum microscopy (r=0.99) (48). In a
study done in Malaysia only 11% of the patients were diagnosed in the initial and 45%
of them in the third consultation(49). In another study done in Malaysia sputum
microscopy, chest X-ray were underutilized and indicating low awareness of private
practitioners(50). A similar report was found in New Zealand study thought the
patient had classical symptoms at least no sputum microscopy was not performed(51).
The mean delay in the present study in reaching the health facility is 38.5 days and
median is 20 days which is similar as compared to studies done in similar settings in
Pakistan and United States. The total delay till diagnosis (median 90 days) is also
similar as compared to studies in Malaysia, Pakistan and the US.

71
TABLE:6.42 MEDIAN DIAGNOSTIC DELAY IN COMPARISION WITH OTHER
STUDIES
Country Year First author DDPAT DDHC Tot DD Reference
PRESENT STUDY 20 16 90
Tanzania 2000 Wandwalo 15 120 136 (36)
United
kingdom
2003 Lewis 63 36 126 (52)
Burkina Faso 2006 Ouedraogo * * 120 (51)
Ghana 1998 Lawn 28 56 120 (53)
Pakistan 2006 WHO 9 87 91 (54)
Malaysia 1994 Hooi 15 35 90 (49)
United States 2005 Golub 32 26 89 (55)
DDPAT-Patient delay (time from first onset of symptoms to first visit to health
centre/provider
DD HCP-health care provider delay (Diagnostic Delay by the Health Care Providers):
Time taken from first visit to a HC till the making of a proper diagnosis
DD Total (Total Diagnostic Delay): Time from onset of symptoms till proper
diagnosis
*unavailable

72
7.1 Socio demographic profile characteristics:
Majority of the patients interviewed were men, predominantly (90%) from rural area.
Inclusion criteria being those of more than 18 years of age, 25.3% of them belong to
age group of 18 to 35 years 48.4% of them falls to 35 to 60 years age group with rest
of them belonging to above 60 years of age.
Higher proportion of the subjects have nil or education up to primary school only. Of
the study population majority were unemployed; of which 29.5% are unskilled daily
wage labourers; 94.7% hail from rural background.
In the general population 44% of them were above 60 years; 54% female and entire
study population was from rural background.
7.2 Personal characteristics:
Smoking is predominantly abused by 54.9% of them (current and past smokers); most
of them are current smokers. They were smokers for more than 30 years and been
smoking at least 11 to 10 cigarettes/beedis per day. Most of them smoked beedis as
they were of low price.
A proportion of 46.3% of them were alcohol abusers, among those who abused
alcohol 20.5% of them consumed more than 2000ml of alcohol per day. Due to heavy
consumption of alcohol, there were patients who found to have defaulted in the later
months. There were 2 deaths which later came to notice with a similar issue.
Patients had multiple symptoms as they showed up in the health facilities. Cough
(93.7%), fever (85.3%), loss of weight (84.2%) and loss of appetite (83.2%),

73
haemoptysis (22.1) and chest pain (18.9%) were the symptoms as mentioned by them.
But only 40% of them sought treatment as they had cough and 28.4% for fever. In a
study done in central India 94% of the patients complained of cough more than 2
weeks(56).
A large proportion of them sought health centers with the onset of symptoms of which
43.2% approached private hospitals and rest to various government health facilities
such as PHC (12.6%) with the onset of symptoms. The similar finding was found in a
study done in central India where private providers were visited more often than
government health centers (63.5% vs. 31.2%; P < 0.001) (17). In a study done in ten
districts of Tigray region, Ethiopia; showed that 54% of the patients received help
from formal health providers(57).
The time taken for the patient to approach health facility with the onset of symptoms
is taken as patient delay. The mean patient delay was 38.5 days. Most of them
thought it was not necessary (50%) to approach health centre early and tried self-
medication (29.4%). Even in a study done in Bahir Dar city, Ethiopia they found
multiple reasons attributing to delay (mean delay 21 days) such as (90%) thought that
symptoms would disappear and in others it was due to financial problem (28.4%)(58).
Among the patients group one person (1.1%) tried and waited using `Sidda` medicine
as he himself was Sidda provider. In a study done in Ethiopia 1.2% approached
traditional healers(59). This shows there is a group which still waits on traditional
medicine for the cure of TB. Association between patients delay and non-formal
health providers was statistically significant and it increased health system delay in an

74
Ethiopian study (25) One of the patient in the study group delayed as he was
misdiagnosed with typhoid in the initial centre, later was told to have
dengue/chickungunya for his consistent symptom of fever and only was diagnosed
when he finally reached a higher centre (GVMCH). In this patient the delay was
almost 3 years duration. In a study done in Gambia TB is often misdiagnosed as
malaria of viral infection(60).
Health care facility where patient first sought treatment for TB was private hospital
(64.2%).The initial diagnosis of TB was made by GVMC (Government Medical
College-Vellore) for a proportion of 35.8% and 32.6% of the patients were diagnosed
in CHAD.
Out of the interviewed 58.9% of them did not have any debts due to medical expenses,
but 21.1% of them had debts in the range of Rs.10001 to 50000. Money spent on
approaching health providers for treatment with both direct and indirect costs was
counted. Total cost before diagnosis spent by 38.9% of them was up to Rs.500; only 2
of them spent money of more than Rs.50, 000 before diagnosis. In the present study
patients who had taken more debts due medical expenses had also experienced more
delay with a p-value of 0.005 and odds ratio of 1.5. This was statistically significant
and shows that those who had debts due to medical expenses tend to have 2.77 times
higher chance of being delayed in acquiring treatment with in adequate time.
Accessibility was the reason in 62.1% of them; while 31% of them chose as they had
more confidence in that particular provider.

75
Sputum examination was done in 98.9%, blood tests were done in 96.8% of them
where as 88.4% of them also had chest x-rays taken. This shows that almost all
facilities they approached had the required laboratory tests available to diagnose the
disease adequately. But the only gap was that there was delay in approaching the right
facility. In the present study the mean diagnostic delay or treatment delay was 2 days.
The proportion of 47.4% patient`s thought it was not necessary to go to these centers
where as 27.4% of them couldn’t go as they have no money. But 9 of them have
immediately approached their regular health provider and waited to be cured of the
sickness until they were diagnosed of TB. The proportion of patients who experienced
a delay of 91-180 days was 26.3%.
A delay of 31-90 days in diagnosis of the disease was experienced by 24.2% of them.
Among those who had delayed; a proportion of 67.4% responded that they consider it
as delay. The proportion of people who were 1.1 km to 3 km away from DOTS centre
(facility) were 42.1% ; where as those that were 1 km away were 34.7%.Mean
distance from home to DOTS center is 2.9 km (95% CI 2.2 to 3.6) and median is 2
km.
The time taken from the first onset of symptoms to till it was diagnosed is health
system delay, and the mean health system delay was 99.3 days.
In the present study, age, gender did not show any significant association with
knowledge. Those with lower education chose to do unskilled jobs or stay
unemployed and eventually reflect in lower socioeconomic strata; and show chance of
low knowledge which was not statistically significant.

76
Stigma is one of the hindrances for the control of tuberculosis. On univariate analysis
of community perception of stigma among 195 study participants (patients + general)
with various factors such as age, sex, marital status, education and other factors as
shown in the table below. It was found that perception of stigma was more among
men. In the same way ever smokers and people with TB perceive more stigma as
compared to others. But after adjusting for various factors as shown in the table only
people with TB were found to have more perception of stigma, which was statistically
significant. It could probably be explained as they know the symptoms of TB they
have many associated fears with it.
Patients from lower economic status due to poverty had often visited local doctors,
waited with the anticipation that symptoms would get better with the available
treatment. But this eventually prolonged the duration and severity of symptoms and
led to more debts as they lost their daily wages due to sickness. The present study
gives a significant result that poverty is still the main reason for this vicious circle of
the disease.

77
7. Limitations
1. Recall bias could be a possibility; though care was taken to visit patients within 2
weeks of recruitment.
2. Most of the patients were very sick and tired of the illness, in few of them their
responses were influenced by the care giver as they couldn`t recollect.
3. In the general population people in few villages were completely unaware of the
disease and not seen any patient in their village, they all answered as no stigma. Hence
perception of stigma and knowledge of the disease are directly related.
4. Due to the nature of the cross sectional study design underreporting or over
reporting of patient delay is unavoidable.
5. This hospital-based study cannot provide information on individuals who were
never treated in hospital and who may die untreated in the community.

78
9. Conclusions
The present study aimed at identifying the factors affecting delay in diagnosis and
delay in initiation of treatment in a newly diagnosed sputum positive patient.
We included 95 patients with TB and 100 from general population to know stigma in
community. The mean total delay, patient delay, health system delay, centre delay and
treatment delay were 104.8, 38.5, 99.3, 60.8 and 2 days respectively. The median
total delay, patient delay, health system delay, centre delay and treatment delay were
91, 20, 90,16,2 days respectively.
This study shows that health care providers do not suspect TB in first contact, and
investigate for TB and miss on the symptoms. Poor knowledge on TB and stigma
related to TB also contribute to the delay, awareness creation to the general population
regarding the treatability and complete cure if diagnosed and treated early is important
to prevent delay in diagnosis.
People with TB were found to have more perception of stigma. People with good
knowledge had more perception of stigma in the community. Other factors that
independently associated with delay were low SES and number of health centers
visited.

79
10. Recommendations
The main reason for delay in diagnosis which is identified through the present study is
number of health facilities consulted before the diagnosis. This shows that the health
care providers do not suspect TB at the first visit and treat them without investigating
for TB. Hence, patients visit multiple providers and loose time before diagnosis. As
per RNTCP, sputum testing is the main strategy for diagnosis. However, this study
showed that most people had X-ray before diagnosis. Due to inappropriate treatment
either due to lack of facilities or expertise causes doctor shopping. Hence, regular
Continued Medical Education programs may improve health personnel’s’ ability to
diagnose TB earlier.
Poor knowledge on TB and stigma related to TB also contribute to the delay. Hence,
awareness creation to the general population regarding the treatability and complete
cure if diagnosed and treated early is important to prevent delay in diagnosis.
People from low socio economic strata are at risk of developing TB and this study
reveals that SES is a significant factor for delay in diagnosis. People from low socio
economic status are forced to attend local health providers for treatment due to
financial problems and would eventually delay diagnosis. Hence, along with creating
awareness, screening programs for active case finding may be arranged at the
community level.

80
Finally, health workers should be made aware of the symptoms and also the adverse
effects if left untreated, so that they will be able to encourage the patients to choose
right health facility.

81
11. Bibliography
1. Centre for Disease Control | TB | Fact Sheets - Latent TB Infection vs. TB
Disease [Internet]. [Cited 2015 Oct 7]. Available from:
http://www.cdc.gov/tb/publications/factsheets/general/LTBIandActiveTB.htmDO
A:28/8/2015
2. Roy D, Chauhan LS. Epidemiology of tuberculosis. Tuberculosis Control in
India. 2005;.DOA:28/8/2015
3. Global tuberculosis control : surveillance, planning, financing : WHO report
2014. (2014). Available from:
www.who.int/tb/publications/global_report/en/DOA:28/8/2015
4. Pandey, kundan. WHO TB REPORT. 2014 Oct 22; Available from:
www.downtoearth.orgDOA:20/7/2015
5. Tocque K, Bellis MA, Beeching NJ, Syed Q, Remmington T, Davies PD. A case-
control study of lifestyle risk factors associated with tuberculosis in Liverpool,
North-West England. Eur Respir J. 2001 Dec; 18(6):959–64.
6. Centre for Disease Control | TB | Basic TB Facts | Risk Factors [Internet]. [Cited
2015 Aug 25]. Available from:
http://www.cdc.gov/tb/topic/basics/risk.htmDOA20/7/2015
7. Coreil J, Lauzardo M, Yiliang Z. Stigma and Tuberculosis in Haitian
Populations: A cross-national study of the impact of stigma on patient experience
and clinical outcomes in Haiti and the United States, 2003-2008: Version 1
[Internet]. 2012 May [cited 2015 Aug 29]. Available from:
http://www.icpsr.umich.edu/RCMD/studies/30521/version/DOA:20/8/2015
8. Van Rie et alTuberculosis and AIDS stigma among patients who delay seeking
care for TB symptoms Int J Tuberculosis Lung Diseases. 2010 February ; 14(2):
181–87
9. Storla DG, Yimer S, Bjune GA. A systematic review of delay in the diagnosis
and treatment of tuberculosis. BMC Public Health. 2008 Jan 14; 8:15.
10. Stigma interventions and research for international health. | POPLINE.org
[Internet]. [Cited 2015 Oct 3]. Available from:
http://www.popline.org/node/167683
11. Long NH, Johansson E, Diwan VK, Winkvist.A A. Fear and social isolation as
consequences of tuberculosis in Vietnam: a gender analysis. Health Policy Amst
Neth. 2001 Oct;58(1):69–81.

82
12. Ngamvithayapong J, Winkvist.A..A, Diwan V. High AIDS awareness may cause
tuberculosis patient delay: results from an HIV epidemic area, Thailand. AIDS
London Engl. 2000 Jul 7;14(10):1413–9.
13. Global tuberculosis report 2014. Geneva: World Health Organization; 2014.
DOA:26/8/2015
14. Styblo K. Epidemiology of tuberculosis. 2nd edition. The Hague, Royal
Netherlands Tuberculosis Association, 1991.
15. M’ikanatha NM, Lynfield R, Beneden CAV, Valk H de. Infectious Disease
Surveillance. John Wiley & Sons; 2013. 1281 p.
16. WHO. Stop TB Partnership, WHO. Patients charter for tuberculosis care.
[Internet]. [cited 2015 Sep 28]. Available from:
http://www.stoptb.org/events/world_tb_day/2006/events.asp28/9/2015
17. Nimbarte, Wagh V, Deepak S
health_seeking_behaviour_among_pulmonary_tuberculosis_patients_in_rural_pa
rt_of_central_india. [Internet]. [cited 2015 Aug 26].
18. van Soolingen D, Hoogenboezem T, de Haas PE, Raymond A, Gaby et al. A
novel pathogenic taxon of the Mycobacterium tuberculosis complex, Canett:
characterization of an exceptional isolate from Africa. Int J Syst Bacteriol 1997;
47:1236.
19. Comstock GW. Epidemiology of tuberculosis. Am Rev Respir Dis 1982; 125:8. -
Google Search [Internet]. [Cited 2015 Sep 18].
20. Barnes, HL, Barnes, IR. The duration of life in pulmonary tuberculosis with
cavity. Am Rev Tuberculosis 1928; 18:412.
21. Bates MN, Khalakdina A, Pai M, Khalakdina, Chang, Lessa, Smith. Risk of
tuberculosis from exposure to tobacco smoke: a systematic review and meta-
analysis. Arch Intern Med 2007; 167:335. DOA:28/9/2015
22. Horsburgh CR, Rubin EJ. Clinical practice. Latent tuberculosis infection in the
United States. N Engl J Med. 2011 Apr 14;364(15):1441–8. DOA 28/9/2015
23. Smith GS, Van Den Eden SK, Baxter R, Shan J, Van Rie A, Herring AH, et al.
Cigarette smoking and pulmonary tuberculosis in northern California. J
Epidemiology Community Health. 2015 Jun;69(6):568–73.
24. Tuberculosis Control in India.pdf [Internet]. [Cited 2015 Aug 23]. Available
from: http://tbcindia.nic.in/pdfs/Tuberculosis%20Control%20in%20India.pdf
DOA:28/9/2015
25. wondu Teshome Total Delay in Treatment among Smear Positive Pulmonary
Tuberculosis Patients in Five Primary Health Centers, Southern Ethiopia: A

83
Cross Sectional Study [Internet]. [cited 2015 Aug 26]. Available from:
http://www.plosone.org/article/fetchObject.action?uri=info:doi/10.1371/journal.p
one.DOA:28/5/2015
26. Directorate of General Health Services. RNTCP annual status report T.B India
[Internet]. Central T.B division; 2014. Available from: ww.tbcindia.nic.in
27. WHO TB REPORT 2003 [Internet]. Global Tuberculosis Control Surviellance,
Planning, Financing; 2003. Available from: WHO/CDC/2003.36 DOA:29/8/2015
28. Gunner bjune, Solomon, Yimer. Diagnostic and treatment delay among
pulmonary tuberculosis patients in Ethiopia: a cross sectional study. Bmc Infect
Dis [Internet]. 2005 Dec 12;5. Available from:
www.biomedcentral.comDOA:28/9/2015
29. Choices NHS. Tuberculosis (TB) - Causes - NHS Choices. 2015 Jan 19 [cited
2015 Aug 25]; Available from:
http://www.nhs.uk/Conditions/Tuberculosis/Pages/Causes.DOA:28/9/2015
30. Sunderlal pankaj, Adarsh. Epidemiology of communicable diseases and related
nutritional problems. In: Textbook of community medicine. 4th ed. Satishkumar
jain; 2014. p. 781.
31. Directorate of Health Services Central T. division. stop T.B ,fight poverty.
2002;(international journal on tuberculosis and lung disease):867.
DOA:29/8/2015
32. Kabalimu LI, S.Kaseleela. Knowledge and healthcare seeking behaviour of
pulmonary tuberculosis patients attending Ilala District Hospital, Tanzania.
www.bioline.org [Internet]. 2007 [cited 2015 Aug 30]; Available from:
http://www.bioline.org.brDOA:28/9/2015
33. CDC | TB | Infection Control and Prevention [Internet]. [cited 2015 Sep 18].
Available from: http://www.cdc.gov/tb/topic/infectioncontrol/29/8/2015
34. Tornee et al. The association between environmental factors and tuberculosis
infection among household contacts. Southeast Asian J Trop Med.
2005;14(tropical medicine public health):221–4.
35. Diagnosis and treatment delay in tuberculosis and in in depth analysis: who 2005
[Internet]. [Cited 2015 Aug 23]. Available from:
http://applications.emro.who.intDOA:28/8/2015
36. Gudmund, Madland, Martin U, Donald A , ID Rusen and Deudatus K.
Wandwalo ER et al. Delay in tuberculosis case-finding and treatment in Mwanza,
Tanzania. The International Journal of Tuberculosis and Lung Disease, 2000,
4:133–138. 2000 ;(11):133–8.

84
37. Saifodine A, Gudo PS, Sidat M, Black J. Patient and health system delay among
patients with pulmonary tuberculosis in Beira city, Mozambique. BMC Public
Health. 2013 Jun 7; 13:559.
38. Sreeramareddy CT, Panduru KV, Menten J, Van den Ende J. Time delays in
diagnosis of pulmonary tuberculosis: a systematic review of literature. BMC
Infect Dis. 2009 Jun 11; 9:91. DOA:23/7/2015
39. R. Rajeshwari et al. Factors associated with patient and health system delays in
the diagnosis of tuberculosis in south India. International Journal Tuberculosis
Lung Dis 6(9):789–795. 2002
40. Saqib MA, Awan IN, Rizvi SK, Shahzad MI, Mirza ZS, Tahseen S, et al. Delay
in diagnosis of tuberculosis in Rawalpindi, Pakistan. BMC Res Notes. 2011 May
26; 4:165.
41. Baral SC, Karki DK, Newell JN. Causes of stigma and discrimination associated
with tuberculosis in Nepal: a qualitative study. BMC Public Health. 2007 Aug
16; 7:211. DOA: 28/7/2015
42. Arshad A, Salam RA, Lassi ZS, Das JK, Naqvi I, Bhutta ZA. Community based
interventions for the prevention and control of tuberculosis. Infect Dis Poverty.
2014 Aug 1; 3:27.
43. Hoa NP, Diwan VK, Co NV, Thorson AEK. Knowledge about tuberculosis and
its treatment among new pulmonary TB patients in the north and central regions
of Vietnam. International Journal Tuberculosis Lung Disease 2004
May;8(5):603–8. DOA25/8/2015
44. Mulenga C, Mwakazanga D, Vereecken K, Khondowe S, Kapata N, Shamputa
IC, et al. Management of pulmonary tuberculosis patients in an urban setting in
Zambia: a patient’s perspective. BMC Public Health. 2010 Dec 7; 10:756.
DOA:28/8/2015
45. WHO | Global tuberculosis report 2014 [Internet]. WHO. [Cited 2015 Sep 28].
Available from:
http://www.who.int/tb/publications/global_report/DOA:28/8/2015
46. Rouillon A, Perdrizet S, Parrot R. Transmission of tubercle bacilli: The effects of
chemotherapy. Tubercle. 1976 Dec;57(4):275–99.
47. Tesena N, Chuin N, Supannawong P, Buphatrakul K. Delay in case finding in
6th zonal tuberculosis center. Thai journal for Tuberculosis Chest Disease.; 1991.
; 12:187–194
48. Altet Gómez MN, Alcaide Megías J, Canela Soler J, Milá Augé C, Jiménez
Fuentes MA, de Souza Galvao ML, et al. [Pulmonary symptomatic tuberculosis’
diagnostic delay study]. 2003 Apr; 39(4):146–52.

85
49. Hooi LN: Case-finding for pulmonary tuberculosis in Penang. Med J Malaysia
1994, 49(3):223-230 [Internet]. [Cited 2015 Sep 30]. Available from:
http://www.e-mjm.org/1994
50. Liam CK, Tang BG. Delay in the diagnosis and treatment of pulmonary
tuberculosis in patients attending a university teaching hospital. International
Journal for Tuberculosis Lung Disease1997 Aug; 1(4):326–32.
51. Masjedi MR, Cheragvandi A, Hadian M, Velayati AA. Reasons for delay in the
management of patients with pulmonary tuberculosis. East Mediterr Health J Rev
Santé Mediterranean Orient Al-Majallah Al-Ṣiḥḥīyah Li-Sharq Al-Mutawassiṭ.
2002 May;8(2-3):324–9.
52. Lewis KE, Stephens C, Shahidi MM, Packe G. Delay in starting treatment for
tuberculosis in east London. Community Disease Public Health PHLS. 2003
Jun;6(2):133–8.
53. Lawn SD, Afful B, Acheampong JW. Pulmonary tuberculosis: diagnostic delay
in Ghanaian adults. International Journal Tuberculosis Lung Disease 1998 Aug;
2(8):635–40.
54. Segagni Lusignani L, Quaglio G, Atzori A, Nsuka J, Grainger R, Da Conceiçao
Palma M, et al. Factors associated with patient and health care system delay in
diagnosis for tuberculosis in the province of Luanda, Angola. BMC Infect Dis.
2013 Apr 8; 13:168.DOA:26/8/2015
55. Golub JE, Bur S, Cronin WA, Gange S, Baruch N, Comstock GW, et al. Delayed
tuberculosis diagnosis and tuberculosis transmission. International Journal
Tuberculosis Lung Disease Off Journal International Union Tuberculosis Lung
Dis. 2006 Jan; 10(1):24–30.
56. Sanjay B Nimbarte VW. Health seeking behaviour among pulmonary
tuberculosis patients in rural part of central India. {Internet}DOA:28/9/2015
57. Asefa A, Teshome W. Total Delay in Treatment among Smear Positive
Pulmonary Tuberculosis Patients in Five Primary Health Centers, Southern
Ethiopia: A Cross Sectional Study. PLoSONE [Internet]. 2014 Jul 21 [cited 2015
Sep 21]; 9(7). Available from:
http://www.ncbi.nlm.nih.gov/pmc/articles/PMC4105549/doa:28/8/2015
58. Gebeyehu E, Azage M, Abeje G, Gebeyehu E, Azage M, Abeje G. Factors
Associated with Patients Delay in Tuberculosis Treatment in Bahir Dar City
Administration, Northwest Ethiopia,. Bio Medical Research International Bio
Medical Research 2014 May 20; 2014, 2014:e701429.
59. Asefa A, Teshome W. Total Delay in Treatment among Smear Positive
Pulmonary Tuberculosis Patients in Five Primary Health Centers, Southern
Ethiopia: A Cross Sectional Study. PLoS ONE [Internet]. 2014 Jul 21 [cited

86
2015 Sep 15];9(7). Available from:
http://www.ncbi.nlm.nih.gov/pmc/articles/PMC4105549/DOA:30/7/2015
60. Lienhardt C, Rowley J, Manneh K, Lahai G, Needham D, Milligan P, et al.
Factors affecting time delay to treatment in a tuberculosis control program in a
sub-Saharan African country: the experience of The Gambia. International
Journal Tuberculosis Lung Dis. 2001 Mar 1;5(3):233–9.DOA:30/7/2015

87
12. Annexures
Annexure 1
Patient information sheet
(Applicable for the participants >=18 years of age)
The following information is provided to inform you about this research project and
your participation in it. Please read this form carefully and please feel free to ask any
questions you may have about the study or the information given below. You will be
given an opportunity to ask questions, and your questions will be answered. Also, you
will be given a copy of this information sheet.
Your participation in this research study is voluntary. You are also free to withdraw
from this study at any time after it starts.
Purpose of the study:
Tuberculosis s is a curable disease but it spreads rapidly. If diagnosed and treated on
time the chain of transmission can be stopped. This study is to find out the various
difficulties involved in seeking medical help in time and receiving treatment on time.
Methods to be followed
We will ask you questions to know when the actual disease process started in you and
when you first sought medical help. These questions help to identify various issues
involved in delay in seeking medical help.
Approximate duration of study
Five months (December 2014 to April 2015)
Expected cost
We will not incur any cost due to your participation in the study
Descriptions of the discomforts, inconveniences, and/or risk factors that can be
reasonably expected as a result of participation in the study:

88
The questions that we ask you may not cause any discomfort to you as these are
focussed only to understand the issues involved in delay in finding out the problem
and getting treated for it. To avoid any inconvenience, I will meet in the place of your
convenience either at DOTS clinic or your home.
Unforeseeable risks
There are no such risks involved as adequate measures are taken to meet you on your
convenient time and convenient place.
Compensation in view of study related injury
We do not expect any injury related to this and hence will not be compensating you
monetarily
Anticipated benefits from this study:
The main purpose of the study is to find various issues involved in delay in the
diagnosis of TB, in spite of government`s active interventions in reaching out to help.
As we interview you we will be able to identify required information. This study and
the interview we conduct is as much as a mutual exchange of knowledge where your
awareness about TB will increase.By participation in the study, participants’
awareness and knowledge about disease transmission and treatment will improve.
Compliance to treatment will also improve and efforts to reduce their perception on
stigma can be done. Any associated illness or noncompliance of the participant can be
taken care of by the team at base hospital with the consent of the participant where
free treatment can be given.
After the focus group discussions, the community’s awareness can be identified and
knowledge can be imparted
Compensation for participation:
We will not give money to answer questions or be a part of this study.
Circumstances under which the principal investigator may withdraw you from the
study participation:
If you wish not to answer questions or do not want us to contact or meet regarding this
particular study we can withdraw you from this study. If you withdraw, this will not
stop us from providing medical care for you or your family.
What happens if you choose to withdraw from the study participation?
89
The information you give us will not be used by us. All collected information will be
destroyed.
Confidentiality:
All efforts, within reason, will be made to keep your personal information in the
research record confidential. It will not be shared with anyone else.
Privacy
Your identity will not be revealed to anyone else; however summary data of the study
may be shared with Institutional Review Board of Christian medical college and used
for publication for scientific purpose.
Contact information:
If you have any questions about this research study or possibly, please feel free to
contact:
Dr.Harika 09159152270 or Dr.Manjunath o9894262107 or Dr.Jasmine
9442382466

90
Annexure 2
Consent form
Study title: To study barriers in early diagnosis and initiation of treatment in people
with tuberculosis in Southern India.
Date:
Study number:
Name of the study participant:
Father/mother/husband/partner`s name:
Age:
Village:
I have read information sheet / i have been informed by the investigator that
this study is carried out to find out the barriers in delay of early diagnosis and
thereafter initiation of treatment in people affected with the rural
tuberculosis. I have understood that the result of the study is to increase the
awareness among the community. Also to identify the reasons in delay of
treatment, this is very essential to reduce the transmission of disease to
achieve a healthy community.
I understand that my participation in this study is purely voluntary. My
unwillingness to participate or decision to withdraw will not affect my (family)
current or future care with any of the programme the investigators institution.
I understand that my privacy will be maintained and all information given by
me will be kept confidential and be used for the purpose of the study only.
However summary results for this study may be shared with for publication
purposes.

91
I understand that the investigator and the other researchers will not need my
permission to look at my study information both in the current study and any
further research that may be conducted in relation to it. I agree to this access.
However, i understand that my identity will not be revealed in any
investigation released to third party investigator or if this study is published.
I confirm that i have read (or have read to me in my own language )and
understood the information sheet for the above study and have had the
opportunity to ask questions.
I agree the investigators contacting me over the phone and meeting me
personally to know the details related to my illness
Signature / thumb impression of the participant: ----------------------------------------
Signature of the witnesses:-1. ---------------------------------2. ----------------------------
Signature of the investigator: -----------------------------------------------------------------
If you have any questions about this research study, please contact
Dr.Harika: o9159152270
My advisors:
Dr.Manjunath:09894262107
Dr.Jasmine:09442382466

92
Annexure 3

93

94

95

96

97

98

99

100

101
Annexure 4

102

103

104
Annexure 5
Questionnaire
General Questionnaire:
1. Date of interview: 2. Study number:
3. Village name: 4. T.B registers no.
5. Name of the respondent
6. Age 7. Sex: 1. Male 2. Female
8. Number of household members 9. Number of rooms in the house
10. Education of the respondent: 11. Education of spouse/father:
12. Occupationof the respondent prior to illness:
13. Daily wage/salary prior to illness:
14. Occupation of the respondent currently:
15. Daily wage/salary currently:
16. Occupation (spouse/father):
17. Family income-pm (prior to illness):
18. Family income (current)-pm:
19. Type of house: 1. Hut 2. Thatched 3. Tiled 4. Terraced
20. Total debt due to medical expense
21. Residence: 1. Rural 2. Urban 3. Urban slum 4. Homeless
22. Marital status: 1. Single 2. Married 3. Divorced/separated 4. Widowed
23. History of smoking: 1. Never 2. Past smoking 3. Current smoking
24. If 2 or 3 to Q No 23, number cigarettes smoked/day:
25. Duration of smoking: years-------, months----------
26. History of alcohol use: 1. Never 2. Past user 3. Current user
27. If 2 or 3 to Q No 26, How frequently ……………..
28. If 2 or 3 to Q No 26, How much per week ……..
29. Previous history of treatment for TB: 1. No 2. Yes (give details)
30. Family history of TB: 1. No 2. Yes (Give details)
31. Other chronic illness: 1. none 2. HIV 2. Diabetes 4. COPD 5.
Bronchial asthma 6. Other (give details)

105
Treatment seeking behavior:
32. Did you have any of the following symptoms? If yes, write the date of onset
Code No Symptom Date of onset Duration in days
1 Cough
2 Fever
3 Loss of weight
4 Loss of appetite
5 Haemoptysis
6 Chest pain
7 Others (specify)
33. Which of the above symptom made you seek health care?
34. Health seekingafter onset of symptoms, but before initial diagnosis and cost of
consultation:
Place code
(in the order
of sequence)
Date Outcome of
treatment
Reasons for
choosing
Total
medical
expenditure
Code:
Place of treatment Outcome Reasons
Code
No
Health care provider Code
No
Outcome Cod
e No
Reasons
0 None 0 NA 0 NA
1 Self-medication 1 No improvement 1 Accessible
2 Traditional medicine 2 Slight improvement 2 Confidence in getting cured
3 Pharmacist/chemist
shop
3 Worsened 3 Services available any time
4 PHC 4 Cured, but recurred 4 Referred by private health
service
5 Private Doctor 5 5 Free services
6 GH/CHC 6 Recommended by someone
7 GVMC 7 Other
8 CHAD
9 CMCH
10 Other

106
35. Reasons for non-consultation of health facility (PHC/GH/CHC/GVMC/CHAD/CMC)
with the onset of symptoms
1) Thought ‘as not necessary’ 2) Too far
3) Too busy health facility/long waiting time 4) Bad experience
5) No money 6) others (specify)
36. How long did it take from the time you first feel sick and the time you went to health
facility?
37. Do you consider this time as a delay? 1. No 2. Yes
38. If yes to Q No 37, according to you, what are the causes of delay in your health seeking
behavior?
1 Fear of what would be found on diagnosis 5 Unsatisfying staff attitude
2 Hopped their symptoms would go away on
their own
6 Poor quality of health
services
3 Fear of social isolation 7 Others (specify)
4 Economic constraints
39. In the centre where you have been diagnosed, what did they do? (multiple options can
be ticked)
1) Gave medicines and review
2) Sputum testing
3) Blood testing
4) X-ray
5) Other (specify)
40. Date of testing sputum: 41. Date of diagnosis:
42. Date of initiation of treatment:
43. If you have been transferred from some other place to this centre, after how many
days you have been started on regular treatment?
44. Distance from your house to the nearest health facility?
45. Some people do not seek health care when they have the same condition as you have.
What do you think, the causes would be?
1) Think it is unnecessary 2) Too far
3) Too busy health facility/long waiting time 4) Bad experience
5) No money 6) Others (specify)
46. How many days you could not go to work due to your illness (from the time of onset
of symptom till starting treatment)
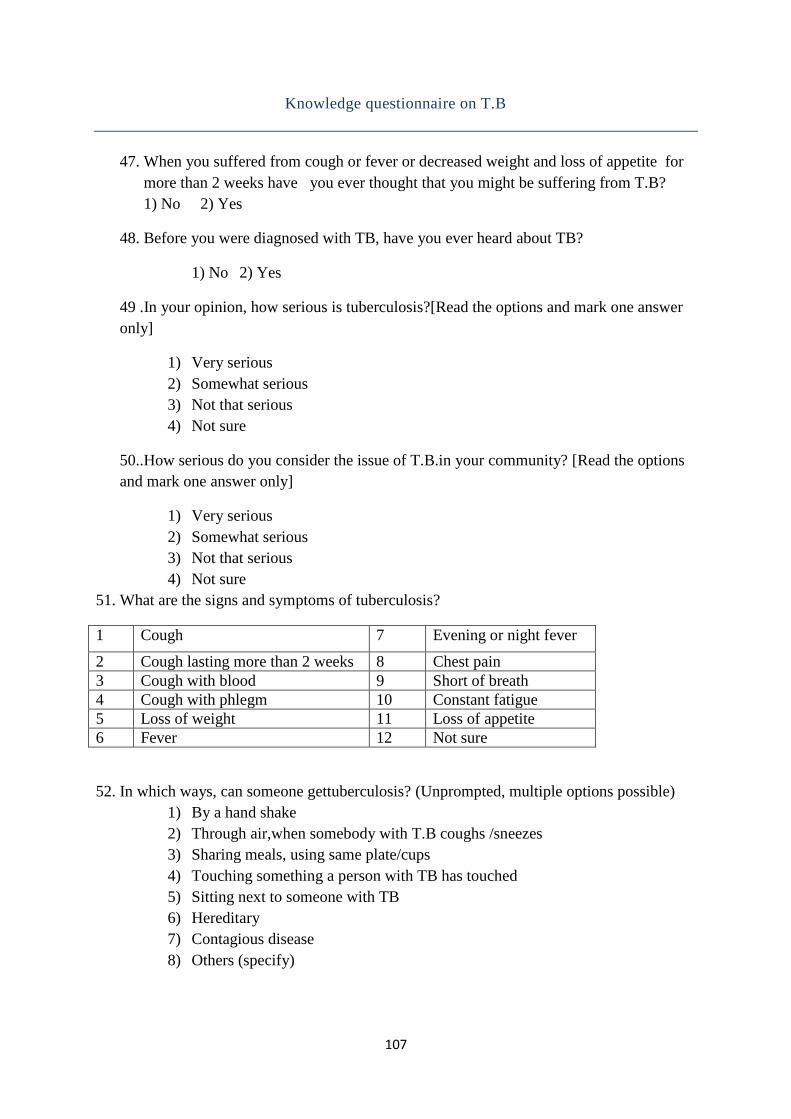
107
Knowledge questionnaire on T.B
47. When you suffered from cough or fever or decreased weight and loss of appetite for
more than 2 weeks have you ever thought that you might be suffering from T.B?
1) No 2) Yes
48. Before you were diagnosed with TB, have you ever heard about TB?
1) No 2) Yes
49 .In your opinion, how serious is tuberculosis?[Read the options and mark one answer
only]
1) Very serious
2) Somewhat serious
3) Not that serious
4) Not sure
50..How serious do you consider the issue of T.B.in your community? [Read the options
and mark one answer only]
1) Very serious
2) Somewhat serious
3) Not that serious
4) Not sure
51. What are the signs and symptoms of tuberculosis?
1 Cough 7 Evening or night fever
2 Cough lasting more than 2 weeks 8 Chest pain
3 Cough with blood 9 Short of breath
4 Cough with phlegm 10 Constant fatigue
5 Loss of weight 11 Loss of appetite
6 Fever 12 Not sure
52. In which ways, can someone gettuberculosis? (Unprompted, multiple options possible)
1) By a hand shake
2) Through air,when somebody with T.B coughs /sneezes
3) Sharing meals, using same plate/cups
4) Touching something a person with TB has touched
5) Sitting next to someone with TB
6) Hereditary
7) Contagious disease
8) Others (specify)

108
53. How can a person prevent from getting this disease? (Unprompted, multiple options
possible)
1) Avoiding hand shakes
2) Covering your mouth or nose while coughing
3) Avoid sharing meals
4) Washing your hands after touching something in public places
5) Opening the windows,having good ventilation
6) Having good nutrition
7) Praying
8) Others
9) Do not know
54. In your opinion who can get tuberculosis? (Unprompted, multiple options possible)
1) Anyone 2)Poor people
3) Homeless people 4) Alcoholics
5) People with HIV/AIDS 6) People with diabetes
7) Others 8) Don’t know
55. Can TB be cured? 1.No 2. Yes 3. Don’t know
56. How can a person suffering from TB be cured? (Unprompted, multiple options possible)
1) Herbs medicines
2) Praying
3) Resting at home without taking any medicine
4) Taking Medicationregularly as prescribed by a doctor or a health center
5) Tuberculosis medication administered/ supervised by DOTS provider
6) Taking proper diet
7) Others
8) Don’t know
57. What is the approximate duration of treatment?
58. Are you expected to check your sputum sometimes after starting treatment?
1) No 2) Yes 3) Don’t know
59. If yes to Q No 58, how many times?
60. If yes to Q No 58, how many months after starting treatment?

109
QUESTIONNAIRE ON TUBERCULOSIS RELATED STIGMA
A. Community perspective towards tuberculosis (from person with TB)
Strongly
disagree
Disagree Agree Strongly
agree 1 Some people may not want to eat or drink with friends who have
T.B
2 Some people feel uncomfortable about being near those with T.B 3 If a person has T.B, some community members will behave
differently towards that person for the rest of his/her life
4 Some people do not want those with TB playing with their children 5 Some people keep their distance from people with TB 6 Some people think that those with TB are disgusting 7 Some people do not to talk with others about TB 8 Some people are afraid of those with TB 9 Some people try not to touch others with TB 10 Some people may not want to eat or drink with relatives who have
TB
11 Some people not to have those with TB live in their community
B. Patient perspectives towards tuberculosis (from person with TB)
Strongly
disagree
Disagree Agree Strongly
agree
1 Some people who have TB feel hurt of how others react to
knowing they have TB
2 Some people who have TB lose friends when they share with them
they have TB
3 Some people who have TB feel alone
4 Some people who have TB keep their distance from others to avoid
spreading TB germs
5 Some people who have TB are afraid to tell those outside their
family that they have TB
6 Some people who have TB are afraid of going to TB clinics
because other people may see them there
7 Some people who have TB are afraid to tell others that they have
TB because others may think that they also have AIDS
8 Some people who have TB feel guilty because their family has the
burden of caring for them
9 Some people who have TB Some people who have TB will choose
carefully who they tell about having TB
10 Some people who have TB feel guilty for getting TB because of
their smoking, drinking, or other careless behavior s
11 Some people who have TB are worried about having AIDS
12 Some people who have TB are afraid to tell their family that they
have TB
How can stigma affect a person with TB in a negative way? (Write literally)

110
Community’s perception:
A. Community perspective towards tuberculosis (from community member)
Strongly
disagree
Disagree Agree Strongly
agree 1 Some people may not want to eat or drink with friends who have
T.B
2 Some people feel uncomfortable about being near those with T.B 3 If a person has T.B, some community members will behave
differently towards that person for the rest of his/her life
4 Some people do not want those with TB playing with their children 5 Some people keep their distance from people with TB 6 Some people think that those with TB are disgusting 7 Some people do not to talk with others about TB 8 Some people are afraid of those with TB 9 Some people try not to touch others with TB 10 Some people may not want to eat or drink with relatives who have
TB
11 Some people not to have those with TB live in their community
B. Patient perspectives towards tuberculosis (from community member)
Strongly
disagree
Disagree Agree Strongly
agree
1 Some people who have TB feel hurt of how others react to
knowing they have TB
2 Some people who have TB lose friends when they share with them
they have TB
3 Some people who have TB feel alone
4 Some people who have TB keep their distance from others to avoid
spreading TB germs
5 Some people who have TB are afraid to tell those outside their
family that they have TB
6 Some people who have TB are afraid of going to TB clinics
because other people may see them there
7 Some people who have TB are afraid to tell others that they have
TB because others may think that they also have AIDS
8 Some people who have TB feel guilty because their family has the
burden of caring for them
9 Some people who have TB Some people who have TB will choose
carefully who they tell about having TB
10 Some people who have TB feel guilty for getting TB because of
their smoking, drinking, or other careless behaviors
11 Some people who have TB are worried about having AIDS
12 Some people who have TB are afraid to tell their family that they
have TB
How can stigma affect a person with TB in a negative way? (Write literally)

111
Annexure 6

112