factor scalesamputation, conditions
TRANSCRIPT

ED 034 327
Arif'Ll07.
^/Tmi7.7
TNSTT-UTTOrqr011S AGF3CY
P79 DA-FNOTE
FDps PRTCEnESCT?TPTOPS
PPSTPACT
DOCUMENT RESUME
EC 004 261
cillg2r, Jerome; And Othersstnlis in 7"eaction to Disal-dlity. XTT: Structure ofAttitudes toward the Physically Disabled; DisabilityFactor ScalesAmputation, Flindness, CosmeticConditions.7.ew York Univ., N.Y. School of Education.Department of Health, education, and Welfare,WasIlington, D.C. Social and Rehabilitation Service.l'ov 671990.
Enr-S Price MF-0.50 HC -S5. 55
Amputees, *Attitudes, Attitude Tests, Blind,Demography, *Exceptional Child Research, FactorAnalysis, Internal Scaling, Item Analysis, NegativeAttitudes, *Dhysically Handicapped, Stereotypes,
Test Construction
To describe and to develop instruments to measure
attitudes toward amputees, the blind, and those with cosmeticconditions, three groups of subjects responded to one of three large
pools of items tapping attitudes toward the three disabilityconditions. Three new groups of about 500 subjects of diversedemographic characteristics were given one of three revised andreduced questionnaires. mhe returns were factor analyzed and scales
were derived from the resulting factors. The seven virtuallyidentical factors which emerged from the amputation and blindnessanalysis were interaction strain, rejection of intimacy, generalizedrejection, authoritarian virtuousness, inferred emotional
consequences, distressed identification, and imputed functional
limitations. The cosmetic conditions item set contained two factorswhich were identical (interaction strain, rejection of intimacy) ; two
which were analogous (reluctant aversion and superficial empathy) ;
and two unique dimensions (qualified aversion and proximateoffensiveness) . A review of related research, and data on each item
of the scales are included. (IE)
kiJEROME SILLER
LINDA T. FERGUSON
,1...
NNEW YORK UNIVERSITY
'A(
I
STUDIES IN REACTIONS TO DISABILITY
SID
.N.
XII: STRUCTURE OF ATTITUDES
TOWARD THE PHYSICALLY DISABLED
Disability Factor Scales Amputation,Blindness, Cosmetic Conditions
DONALD H. VANN
BERT HOLLAND
SCHOOL OF EDUCATION NOVEMBER 1967
r\J STUDIES IN REACTIONS TO DISABILITYI4-%.
re\C)CD
"I XII: STRUCTURE OF ATTITUDES
TOWARD THE PHYSICALLY DISABLED
Disability Factor Scales
Amputation, Blindness, Cosmetic Conditions
JEROME S1LLERLINDA FERGUSONDONALD H. VANN
BERT HOLLAND
NEW YORK UNIVERSITYSCHOOL OF EDUCATIONWASHINGTON SQUARE
NEW YORK, NEW YORK 10003
NOVEMBER 1967
ACKNOWLEDGEMENTS
Dr. Jacob Cohen was statistical consultant. We are indebted to both Dr.Cohen and Dr. Philip R. Merrifield for their helpful comments on the manu-scripts and to Mrs. Patricia Shelton for the invaluable assistance she providedthroughout the project.
U.S. DEPARTMENT OF HEALTH, EDUCATION & WELFARE
OFFICE OF EDUCATION
THIS DOCUMENT HAS BEEN REPRODUCED EXACTLY AS RECEIVED FROM THE
PERSON OR ORGANIZATION ORIGINATING IT. POINTS OF VIEW OR OPINIONS
STATED DO NOT NECESSARILY REPRESENT OFFICIAL OFFICE OF EDUCATION
POSITION OR POLICY.
This investigation was supported, in part, by Research Grant No. RD-1276-Pfrom the Division of Research and DemonstratiOn Grants, Social and Re-habilitation Service, Department of Health, Education, and Welfare,Washington, D.C., 20201.
Supplementary assistance was provided by the Association for the Aid ofCrippled Children, New York, N.Y.

TABLE OF CONTENTS
Page
Chapter 1 INTRODUCTION 1
Measures of Attitudes toward the Physically Disabled 2
Chapter 2 DEVELOPMENT OF THE DISABILITY FACTOR SCALES 5
Rationale 5
Preliminary Stage 6
Final Developmental Stage 9
Chapter 3 DIMENSIONS OF ATTITUDES 17
Amputation 17
Blindness 21
Cosmetic ConditionsellLJ
Chapter 4 THE DISABILITY FACTOR SCALES 27
Establishment of Factor Scores 27
Administration and Scoring 28
Psychometric Characteristics of the Disability
Factor Scales 30
Chapter 5 RELATIONSHIPS AMONG SCALES 39
Interrelationships of Scales within Questionnaires 39
Interrelationships of Scales across Questionnaires 42
Relationships among Identically Labelled Scales 42
Quasi-Second-Order Relationships among Scales 45
Chapter 6 RELATIONSHIP OF SCALE SCORES TO DEMOGRAPHIC
VARIABLES52
Demographic Variables as Predictors ofScale Scores 53
Chapter 7 THEORETICAL IMPLICATIONS 57
The Nature of Components of Attitudes toward Specific
Disabilities 57
The Generality of Attitudinal Components across
Disabilities 58
The Relationships among Attitudinal Components 58
The Consistency of Attitudes of Individuals within
and across Disability Types 59
The Role of Demographic Variables in Determining
Reactions to Disabled Persons 60
Chapter 8 SUMMARY AND IMPLICATIONS62
Summary62
Findings63
Implications67
References71
Appendix A FACTOR LOADING, MEAN, AND STANDARD DEVIATION
OF EACH ITEM OF THE DISABILITY FACTOR SCALES
ARRANGED BY SCALE 74
Appendix B
Appendix C
MEANS AND STANDARD DEVIATIONS OF SCALE SCORES
OF SUBGROUPS 89
ORDERED FACTOR ANALYSIS OF AMPUTATION, BLIND-
NESS, AND COSMETIC CONDITIONS ITEMS 90
Chapter 1
INTRODUCTION
The purpose of this report is to describe salient dimensions of attitudes
toward the physically disabled (as exemplified by amputees, the blind, and
those with cosmetic conditions) from the vantage point of the nondisabled.1
The term "attitude" is used in this monograph in its most general sense,
encompassing expressions of cognitive, conative and affective tendencies. Our
primary concern is with the substantive issues involved in reactions toward the
physically disabled rather than with attitude theory per se. As an integral part
of this work a set of scales (The Disability Factor Scales or DFS), which have
the requisite reliability and sensitivity to permit accurate and precise
measurement of experimental effects, was developed to measure these
dimensions. The DFS presently consists of the DFS-A (amputation), the
DFS-B (blindness), and the DFS-C (cosmetic conditions). A full description of
their development and their psychometric properties is given below.
The major theoretical issues of the dimensionality of this attitude domain
and the consistency of attitudes across disabilities were studied. More
particularly, the issues of interest were: (1) the nature of components of
attitudes toward specific disabilities; (2) the generality of attitudinal
components across disabilities; (3) the relationships among attitudinal
components; (4) the consistency of attitudes of individuals across disabilities;
and (5) the role of demographic variables in reactions to the disabled.
This report begins with a review of the most pertinent work in the area,
and then presents the rationale and the procedures involved in developing the
Disability Factor Scales. The specific factors or dimensions of attitudes are
described. Next, the relationships among the scales, and between the scales
and certain demographic variables are examined,, following which the
theoretical issues mentioned above are considered. Finally there are a
summary of the report, a statement of recommendations for the use of the
DFS, and a discussion of some of the implications of the present results for
the field of rehabilitation.
lAlthough development to date has concerned the measurement of the
nondisabled's attitudes toward these groups, the scales can readily be adapted
to the measurement of attitudes of people with disabilities toward themselves
and other handicapped persons.
1

MEASURES OF ATTITUDES TOWARD THE PHYSICALLY DISABLED
The development of the DFS represents an attempt to add conceptualclarification to, and improve scaling in, this area. Common failings of earlier
instruments include insufficient validation and standardization, low reliability,
overspecificity (most deal with blindess), inadequate sensitivity, and the
assumption of unidimensionality of underlying attitudes.
Previous Scales
With few exceptions, e.g., Cowen, Underberg, and Verillo (1958), Yuker,
Block, and Younng (1966), and Whiteman and Lukoff (1963, 1964a, 1964b,
1965), measures of attitudes toward the disabled have had relatively trivial
psychometric development, and reports of their employment by other thantheir own developers have been rare, if not nonexistent. Ordinarily, wherestudies of attitudes toward the disabled are reported, makeshift instruments
used only for that particular investigation have been the rule.
Blindness, of all disability types, has received the bulk of attention.
Cowen et al. (1958) provide a good example of a disability-specific scale.
Using items from earlier scales by Steingisser (1954) and Fitting (1954), they
developed a 30-item Attitude to Blindness Scale for which a single total score
is obtained.The most widely employed instrument in the area of disability is the
Attitude Toward Disabled Persons Scale (ATDP) developed by Yuker and his
associates around 1959, with fuller information reported in a 1966
publication. The original ATDP is a 20-item, Likert-type scale for which a
total summated score is obtained. Items refer to "disability" in its generalized
sense, e.g., "disabled children." Considerable data on the psychometric
properties of the ATDP, its factorial structure for various populations, and its
correlates among numerous personological, demographic, and response set
indices have been reported by various researchers (e.g., Arnholter, 1962; Bell,
1962; Chesler, 1965; Genskow & Maglione, 1965; Si ller, 1963b, 1965, 1966b;
Siller & Chipman, 1963, 1964b; Siller, Chipman, Ferguson, and Vann, 1967).
Two new forms of the ATDP, expanding the number of items in each to 30,
recently have been developed by Yuker, et al. (1966) but most of the
obtained data is on the earlier form. The improvement in reliability over that
of the original 20-item form has not been substantial, and the value of the
new scales as alternate forms is limited by their median intercorrelation of
.67.In an assessment of this area, Siller (1966b) observed that no correlation
between personality variables and disability attitude measures greater than .60
(Tabin, 1965) has been reported. In fact, reported correlations are mostly
trivial, if not actually zero. Siller and his associates, using the ATDP, two
experimental scales of their own, and various nondisability measures,
2
invariably found the disability material clustering apart from the othermaterial. In effect, a strong relationship between a measure of disabilityattitude and one or more nondisability indices is yet to be demonstrated.
The question arises as to whether the low degree of association between
disability attitude and other variables is due to the absence of suchrelationships or to the insensitivity of the measures. Si ller (1966b), pursuingthe latter possibility as the more likely, suggests that methodological problemsof measuring disability attitudes are related to two theoretical issues. The firstmethodological difficulty is that the general term "disability," when employed
in an instrument, raises too many referents for the respondent; e.g., is
amputation or blindness or a cardiac condition being referred to? Thisprocedural problem reflects the theoretical issue of the extent to which thepublic's reactions are general across disabilities and the extent to which theyare specific to a particular disability. The second theoretical issue pertains tothe dimensionality of attitude structure in this domain. Both the Attitude toBlindness Scale and the ATDP, by employing only a single summative score,
treat this domain of attitudes as one-dimensional. The work of Whiteman and
Lukoff (1963, 1964a, 1964b, 1965), Siller (1963a, 1963b), Si ller andChipman (1964a, 1964b), Siller, Chipman, Ferguson, and Vann (1967)supports the contention of multidimensionality. Si ller et al., (1967) throughinterviews identified a number of specific aspects of attitude that influencereaction to the handicapped.
Two series of studies using the factor-analytic model have particularrelevance to the question of dimensionality of attitudes and to the DFS.Cohen and Struening (1962) have reported on the development of theOpinions about Mental Illness Scale (OMI). Utilizing large numbers ofpersonnel in various mental hospitals, Cohen and Struening developed theOMI, an instrument of 51 items which measures five dimensions of attitudetoward mental illness. The item format is that of a sentence stating something
about mental illness (e.g., "Most patients in mental hospitals don't care howthey look"). The respondent replies to these statements along a six-point
continuum ranging from "strongly agree" to "strongly disagree." Thedimensions of the OMI are called Authoritarianism, Benevolence, Mental
Hygiene Ideology, Social Restrictiveness, and Interpersonal Etiology. As theseauthors indicate, "... the fact that items can be organized on a single
dimension does not mean that they are best so organized." The present study
in many respects used the Cohen and Struening work as a methodological
model.Most directly relevant to the content of the DFS is the work of
Whiteman and Lukoff (1963, 1964a, 1964b, 1965). These authors haveapplied a components approach to the study of attitudes toward blindness.
The basic methodology was to administer several questionnaires dealing withblindness to 58 college students and to 65 social-work students. In thedevelopment of each questionnaire a number of dimensions are postulated,

and the items were specifically constructed to tap these dimensions. Item
format was diversified in an attempt to minimize response set and to lend
support to clusters or factors cutting across indices referring to common
content but differing in mode of presentation. The questionnaire taken by the
social-work students had to be abridged due to limitations in time available
for administration. The data of each sample were treated separately.
Intercorrelations among indices were factor-analyzed and rotated orthogonally.
For the more extended questionnaire, five factors were identified.
These are concerned (a) with the degree to which the respondents
have a negative view of the emotional life and general adequacy of
blind people, (b) with the degree to which the respondents see blind
people as socially competent, (c) with the degree to which blindness
is perceived as potentially threatening or uniquely frustrating, (d)
with tendencies to be protective of blind people, and finally (e) with
the readiness for personal interaction with blind people. (Whiteman &
Lukoff, 1964b, p. 352).
Four of these factors were found in the group receiving the abridged
questionnaire.Whiteman and Lukoff have provided valuable initial structuring of
disability attitude dimensions and have suggested a number of potentially
useful instruments of measurement. However, at present, the variety and
complexity of the tasks to which the subject must respond, and the level of
vocabulary employed, severely limit the practical utility of their indices. Due
to the restricted number of subjects and the highly specialized nature of these
persons, generalization of results cannot be made readily. Subsequent use of
their instruments with a housing sample and with high school students
(Whiteman & Lukoff, 1963) showed both the value and limitations of their
material as basic measuring devices.
4

Chapter 2
DEVELOPMENT OF THE DISABILITY FACTOR SCALES
Rationale
Factor-analytic techniques of scale construction represent a logical choice
of method for the researcher who suspects that all attitude domain ismultidimensional. This procedure provides a direct answer to the question of
dimensionality of attitude structure in a given area, and the nature of thecomponent attitudes is suggested by interpretation of the resulting factors.
Furthermore, factor analysis yields highly reliable scales with a minimumnumber of items. These advantages are offset, in the view of some, by such
problems as the large number of subjects required to achieve stable structure,
the statistical technicalities of the method, and the subjectivity of
interpretation of the resulting factorial dimensions. However, since it was
believed that we could satisfactorily deal with these problems, factor analysis
was our method of choice.The question of the consistency of attitudes across disabilities generates a
more specific problem with regard to the actual construction of items for such
scales, viz., whether to word them in terms of "disability" as a general class
(as does the ATDP) or in terms of specific sorts of disability, such as
"blindness." Practical experience with instruments worded in terms of"disability" revealed that subjects perceive it as an ambiguous referent, the
vagueness of which arouses antagonism and frustration. Additionally, subjects
visualize different disabilities, thereby inevitably increasing the measurement
error variance for such items. Consequently, the strategy became one of
developing selected disability-specific scales wilich would serve to plot thestructure of attitudes within and across disabilities.2
To obtain a strategic variety among the disability-specific scales, the
disability universe was sampled by selecting three types representing key
2Scales that would provide valid measures of attitudes toward disability in
general would, of course, be of great overall utility. Data obtained in thepresent study indicate that it would be feasible to establish a General Form of
the DFS. The one questionnaire would contain items referring to differentconditions, thus measuring dimensions of attitudes toward disability in
general, but based on reactions to specific conditions, rather than to the vague
referent "disability."
5

positions on two pertinent continua: functional and cosmetic impairment.Items within each questionnaire were written to refer to one specificdisability. The types selected were amputation (middle range on both cosmeticand functional impairment); blindness (highly functional, low cosmeticimpairment); and cosmetic conditions (low functional, high cosmeticimpairment). Si ller (1963a) and Siller et al. (1967) have obtained considerabledata identifying amputation as being in a number of respects midway alongthese dimensions, while blindness is reacted to overwhelmingly as a functionalcondition.
The specific design of the DFS was determined by the desirability ofhaving instruments that were inclusive, economic, and convenient forexperimental purposes. After a number of alternatives were considered, aself-report, objectively-scored format, using a vocabulary that is compre-hensible from the adolescent age level on, was chosen.
PRELIMINARY STAGE
In order to identify salient dimensions of this attitude domain, acomprehensive schema of dimensions of potential relevance was developed(Siller, 1965b). Four broad categories of reactions were conceptualized:assumed attributes of individuals with a particular disability; personal reactionsof the respondent to such disabled individuals; normative assumptions aboutreactions of other non-disabled individuals (e.g., most people are repelled bythe blind); and policy orientations (a.g., advocacy of special treatment for thedisabled). Within this general framework, a large number of specific dimensionswere suggested by the senior author's clinical and research experience in thisarea and by extensive review of relevant literature in the fields of psychologyand sociology.3 The aim was to make the variety of dimensions as exhaustiveas possible at this initial stage, so that a wide range of potentially significantvariables would be given adequate representation. Reduction of the number ofdimensions then would be the result of a posteriori empirical proceduresrather than a priori neglect.
Construction of the Initial Item Pool
A large pool of Likert-type items, with six choices, were written to tapeach of the dimensions. "Control" features were built into the items so thatsuch aspects as severity and type of disability were an essential part of theitem, as were such factors as age and sex of the disabled. Items pertaining toauthoritarianism and perception of one's own health were included in the
3Kenneth J. Weingarten made a significant contribution to this phase of thework.
6
amputation and blindness questionnaires in order to tap dimensions
occasionally considered in the literature (Cowen et al., 1958; Jabin, 1965).
Since it was recognized that most disabilities involve cosmetic implications of
varying degrees, a special inquiry into this area seemed worthwhile.
Consequently, an independent measure of aesthetic sensitivity and aversion
was designed so that added insight into the cosmetic aspects of disability
might be gained. This scale was athrunistered as a separate section of the
questionnaire on cosmetic conditions. The initial composition of the three
questionnaires was as follows:Amputation 212 items consisting of 173 amputation-specific, 9
personal health, 18 authoritarianism, and 12 other items. The ATDP and
Siller's Feeling Check List (FCL) and Social Distance Scale of Disability (SDS)
were administered as additional units in the questionnaire. A separate pretest
of responses to open-ended questions (Si ller 1965b) indicated that most
respondents, rather than having highly individualistic conceptions, share a
general "image" of an amputee as male, without any corrective device, and
with a "limb" or even "limbs" missing. In another pretest,4 the stimulus "arm
amputee" was used in a series of questions answered by a group of persons
who also rated similar "leg" items. No difference in negativity was elicited.
Furthermore, subjects also stated that they did not respond differentially to
various types of amputation. Thus, it seemed unnecessary, in general, to
structure items in terms of site and extent of amputation or use of a
prosthetic device. The term amputee apparently elicits (among subjects) a
sufficiently clear, and sufficiently comparable, image to be used as the core
stimulus in most instances.Blindness 212 items consisting of 173 blindness-specific, 9 personal
health, 18 authoritarianism, and 12 other items. The ATDP, FCL, and SDS
were also included. With the exception of substituting blindness for
amputation, rewording items for appropriate phrasing, and adding some items
specifically pertinent to blindness, the amputation and blindness question-
naires were constructed to be as identical as possible. The objective of this
procedure was to reduce the influence of instrument factors when making
across-questionnaire comparisons, recognizing that correlations may be inflated
as a consequence.Cosmetic Conditions 71 items were distributed among such conditions
as acne, scars, obesity, ugliness, body odor, cross-eyedness, bad breath,
4The pretest involved comparisons of subjects' ratings of two versions of the
same questionnaire. In one version, the referent was "amputee," while the
second version differed in that the amputation was specified (e.g., a person
missing an arm or leg). Internal analysis of the specific version demonstrated
that there were no significant differences between responses to "arms" versus
"legs."
7
twitches, and buck teeth. A few other items covered heart condition,blindness, deafness, and amputation so that some functional aspects could be
included as possible orienting variables. Fifty additional items from ourexperimental scale of Aesthetic Sensitivity and Aversion were included as a
block in the questionnaire. A major reason for the much smaller number of
items in the cosmetic condition set, as compared to amputation and blindness,
was the limited number of applicable dimensions. Wording of items could
follow that of the other questionnaires only to a limited extent.
All questionnaires contained demographic questions on age, education,
sex, race, marital status and religious background. Information on degree of
contact with amputees or the blind was obtained on the relevant
questionnaires.
First Reduction by Factor Analysis
Amputation The set of items, written to tap the a priori dimensions and
the other kinds of material, was administered to 87 college undergraduates.
The resulting matrix .i.-f item intercorrelations was then factor-analyzed and
rotated to an orthogonal structure. Inspection of several varimax rotations
revealed that the original dimensions could be reduced to about tenmeaningful factors. (Interestingly enough, despite the inherent instability ofthe factor structure due to the large number of items and small number of
subjects, subsequent analyses on larger populations and reduced item setsindicated that even this primitive level of analysis resulted in meaningful
findings.)The effects of the personal health, authoritarian and other nondisability
type items, as well as the ATDP, FCL, and SDS were assessed. In brief, the
nondisability material, with but a few exceptions, did not correlate
sufficiently with diability items to warrant inclusion in the next form of the
questionnaire. The ATDP, FCL, and SDS did have primary loadings with the
disability items, but not to the extent that their further use was justified. The
factor loadings also provided a basis for eliminating ambiguous or
non-discriminating items. A number of new and rewritten items were included
for the purpose of adding support to those factors which neededreinforcement. On these empirical bases, the item set was reduced from 212
to 145.Data also were available regarding the effect of the controls written into
the items. It was apparent that the elaborate precautions taken to vary age,
sex, etc., of the persons referred to in the items were unnecessary. That is, no
factor could be interpreted as a "child" or "woman" or "social status"
complex. The principle of grouping seemed based on psychological rather than
sociological grounds.
Analysis of the relationship of demographic variables to individual items
(t-tests) revealed that contact with the disabled and sex of the respondent
8
yielded a number of statistically significant differences. In general, women and
those who had extended contact with the disabled appeared more favorable.
These items were retained for the next pretest.
Blindness Administrative and interpretive handling of the blindness
material directly paralleled amputation procedure. Data on 91 Hunter College
students were collected, factor-anilyzed, and orthogonally rotated. Several
varimax rotations were inspected, and item reduction was conducted
employing information from seven and eight factor solutions. The item set
was reduced to 145 (including revised and new items). To a considerable
extent, the observations made in regard to the amputation questionnaire apply
here as well. The specific differences are of minor import compared to the
similarities.Cosmetic Conditions The 71 items on cosmetic conditions were placed
in a questionnaire following 50 items on Aesthetic Sensitivity and Aversion.
This material was administered to varied undergraduate groups (N = 111).
When the entire questionnaire was factor-analyzed, it was found that the items
dealing with cosmetic conditions loaded apart from those dealing with
aesthetic issues, with almost no overlap. A report of the analysis of the
nondisability questions will be made elsewhere. The 71 cosmetic condition
items were then refactored exclusive of the aesthetic items. A six-factor
varimax rotational solution provided the guidelines for dropping and adding
items so that the dimensional structure of the instrument would be further
clarified. A set of 84 items resulted.
FINAL DEVELOPMENTAL STAGE
The new questionnaires consisted of the 145 item sets on amputation and
blindness, and 84 items on cosmetic impairments. Our goals in administering
these new questionnaires were to improve on the clarity and stability of the
previously obtained factorial structure, to reduce further the size of the
instruments, and to provide a definitive basis for the selection of items for the
final scales which would comprise the DFS.
Final Developmental Samples(Amputation, N = 483; Blindness, N = 477; Cosmetic Conditions, N = 520)
The revised questionnaires were presented to new and larger groups of
subjects. The major objective in recruiting subjects was to obtain populations
large and varied enough to yield valid and fruitful statistical findings. With the
thought that demographic diversity might increase the heterogeneity of
attitudes toward disability, an effort was made to obtain subjects of diverse
ages, socio-economic and education levels, and racial and religious origins. It
was possible to identify within the subject pool certain subgroups large
enough to allow the calculation of separate reliable descriptive statistics.
Despite the relatively large number of subjects, the findings cannot be
considered representative of the population at large. Generalizations to other
9
populations, and the establishment of norms, must await more systematicsampling based on principles of randomization and stratification.
Most of those who participated in this stage of the project were residentsof the New York metropolitan area; 93 were students of physical therapy atthe University of Maryland. Administration for high school aild collegestudents generally occurred in a group setting (i.e., a classroom), whereasother respondents usually answered the questionnaires individually. In all,there were 1,014 different respondents to the three questionnaires, and 233 ofthese (the Repeat Group) answered all three, so that a total of 1,480completed questionnaires were collected.
Tables 1 and 2 contain descriptive data on the sex, age, and education ofrespondents to each questionnaire. The ages of the respondents ranged from14 to over 50 with the mean and standard deviation on each questionnairefalling around 25 years and 11 years respectively. Educational level, measuredin terms of the number of completed years of schooling, varied from less than6 to 17 (the latter indicating at least some attendance at graduate school) andthe means and standard deviations for the three groups are equal to about 12.5and 2.0 years respectively. There was an over-all preponderance of femalesover males (with ratios of about 3 to 2) in each of the three groups. Inaddition, each person who answered the amputation or the blindnessquestionnaires was asked to indicate whether he was ever well acquaintedwith someone suffering the relevant disability. As is noted in Table 5, 35%and 29%, respectively, answered this question affirmatively. (Due to thevariety of disabilities covered in the cosmetic conditions questionnaire, theitem on familiarity was excluded.)
Data on the Repeat Group of 233 were collected so that, when the actualscales from the three questionnaires were developed, the interrelationshipsamong them could be studied. It was desirable to have a repeat group whosecharacteristics were similar to those of the total Developmental Samples. Itwas not possible, however, to obtain responses to all three questionnaires fromthe same high school population.
Tables 3 and 4 show the characteristics of the Repeat Group in terms ofsex, age, and education. An assay of the degree to which the Repeat Groupresembles the three Developmental Samples must be made indirectly sincedirect comparisons of the group means would be confounded by theirpart-whole relationship. Instead, then, characteristics of those subjects whowere not included in the Repeat Group (Remainder Group) for eachquestionnaire are compared with characteristics of the Repeat Group. Table 5contains the data on these various comparisons.
It can be seen that the Repeats and the Remainders do not differsignificantly (t-tests of proportions) in respect to sex-ratios or contact. It maybe concluded, then, that the Repeat Group also does not differ significantlyfrom the Developmental Samples in these respects. On the other hand theRepeat Group, due to the omission of high-school-age-subjects, does differ
10
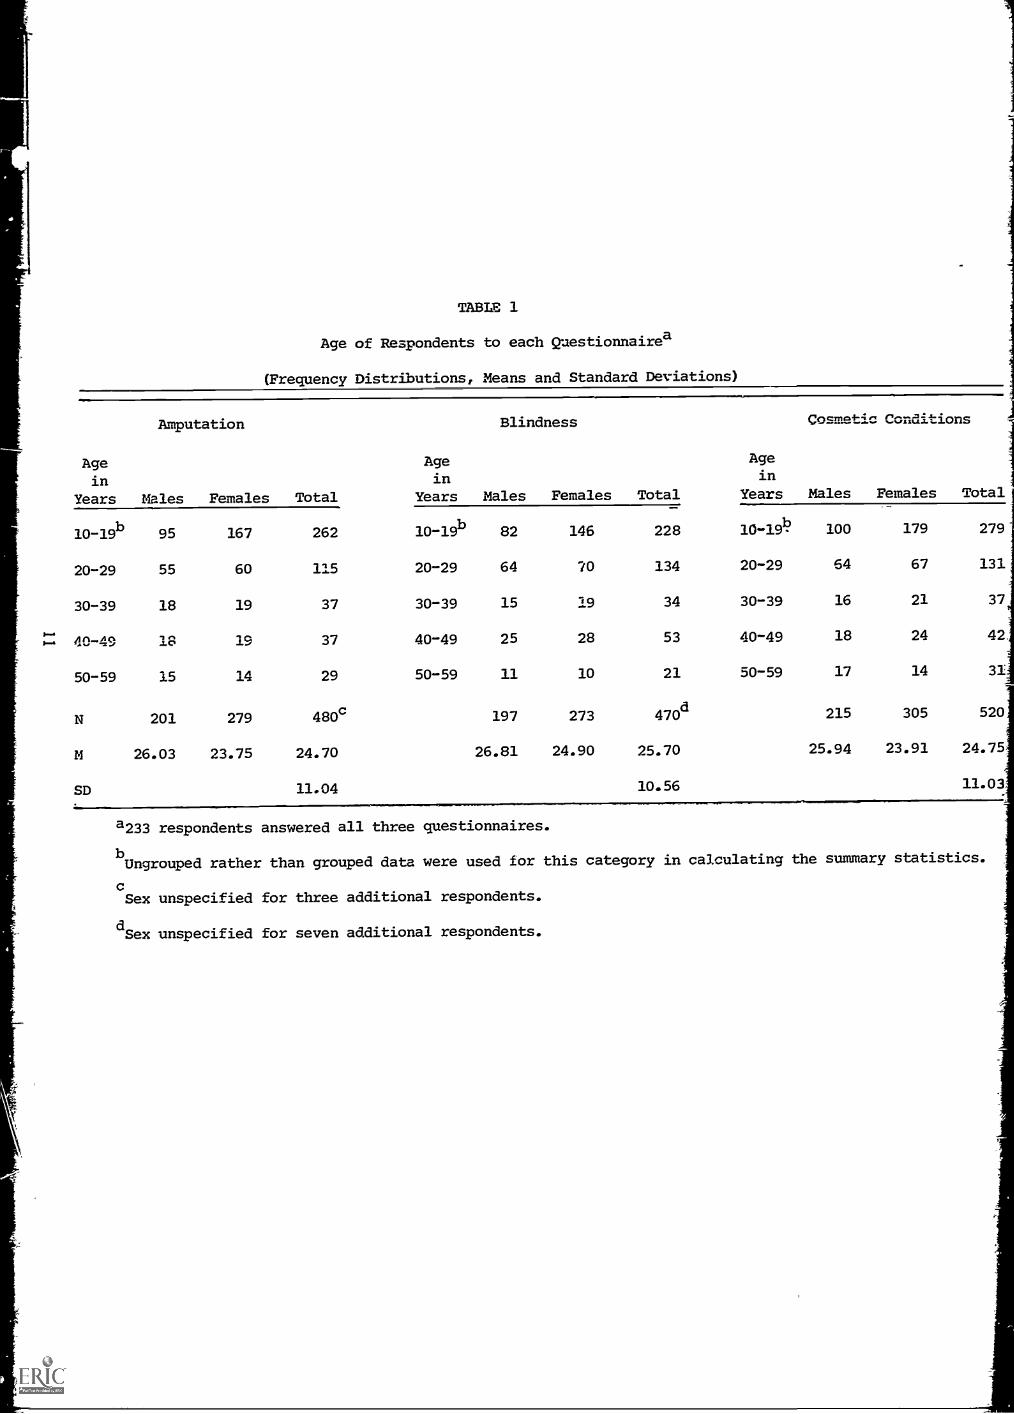
TABLE 1
Age of Respondents to each Questionnairea
(Frequency Distributions, Means and Standard Deviations)
Amputation Blindness Cosmetic Conditions
Agein
Years Males Females Total
Agein
Years Males Females Total
Agein
Years Males Females Total
10-19b 95 167 262 10-19
b82 146 228 ld-19- 100 179 279
20-29 55 60 115 20-29 64 70 134 20-29 64 67 131
30-39 18 19 37 30-39 15 19 34 30-39 16 21 37
40-'49es
-LO 19 37 40-49 25 28 53 40-49 18 24 42,
50-59 15 14 29 50-59 11 10 21 50-59 17 14 31
N 201 279 480c 197 273 470d 215 305 520
M 26.03 23.75 24.70 26.81 24.90 25.70 25.94 23.91 24.75
SD 11.04 10.56 11.03
a233 respondents answered all three questionnaires.
bUngrouped rather than grouped data were used for this category in calculating the summary statistics.
Sex unspecified
dSex unspecified
for three additional respondents.
for seven additional respondents.
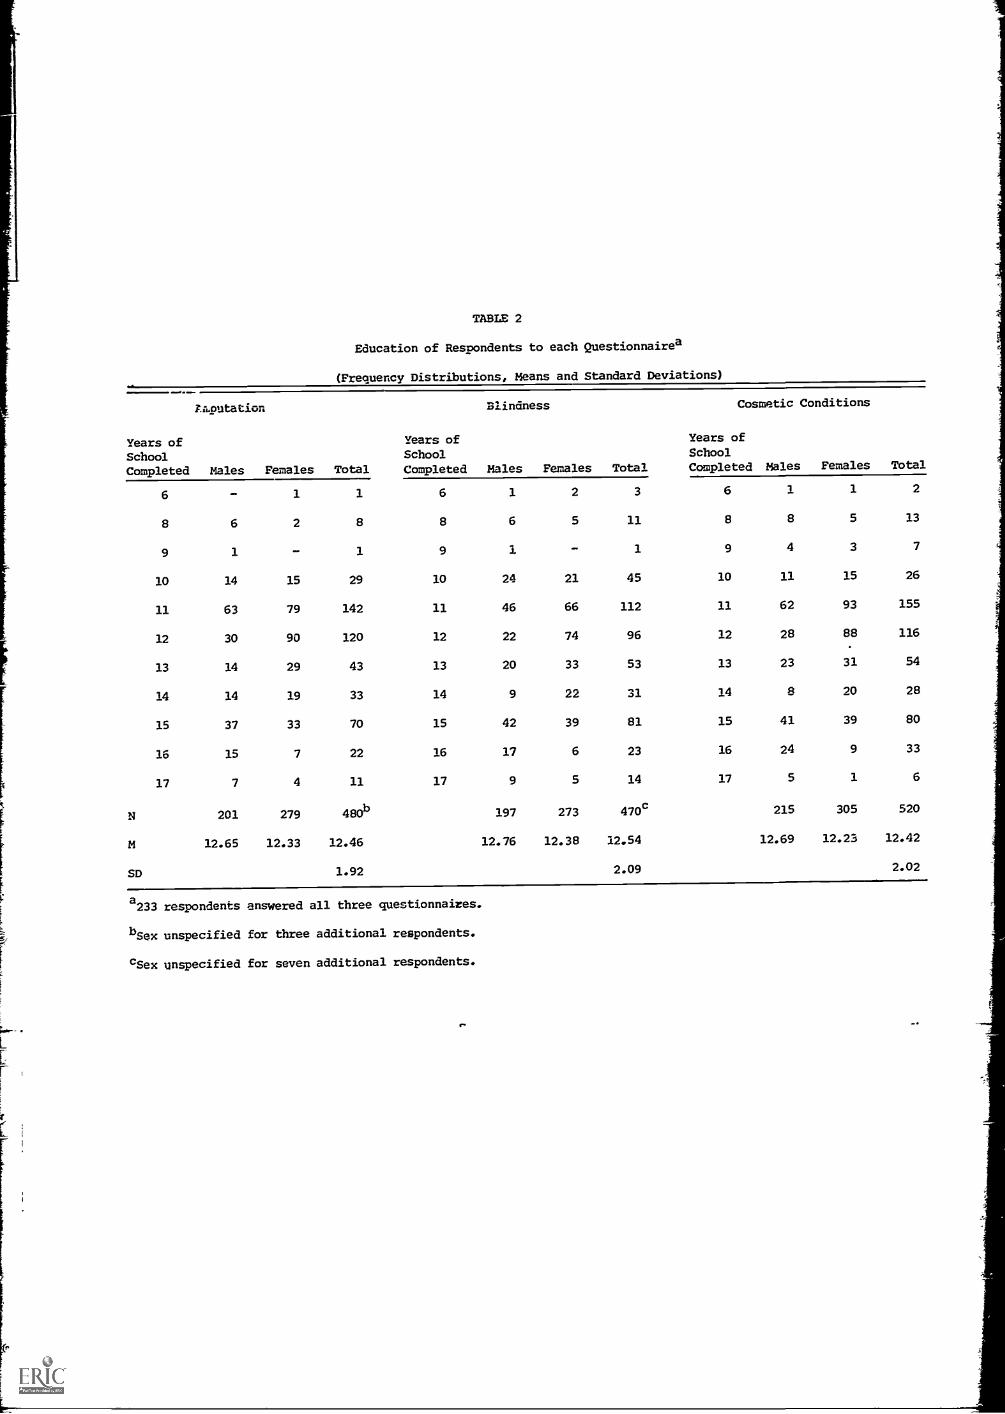
TABLE 2
Education of Respondents to each Questionnairea
(Frequency Distributions, Means and Standard Deviations)
Fruoutation Blindness Cosmetic Conditions
Years of Years of Years of
School School School
Completed Males Females Total Completed Males Females Total Completed Males Females Total
6 - 1 1 6 1 2 3 6 1 1 2
N
M
SD
8 6 2 8 8 6 5 11 8 8 5 13
9 1 - 1 9 1 - 1 9 4 3 7
10 14 15 29 10 24 21 45 10 11 15 26
11 63 79 142 11 46 66 112 11 62 93 155
12 30 90 120 12 22 74 96 12 28 88 116
13 14 29 43 13 20 33 53 13 23 31 54
14 14 19 33 14 9 22 31 14 8 20 28
15 37 33 70 15 42 39 81 15 41 39 80
16 15 7 22 16 17 6 23 16 24 9 33
17 7 4 11 17 9 5 14 17 5 1 6
b201 279 480 197 273 470c 215 305 520
12.65 12.33 12.46 12.76 12.38 12.54 12.69 12.23 12.42
1.92 2.09 2.02
a233 respondents answered all three questionnaires.
bSex unspecified for three additional respondents.
cSex unspecified for seven additional respondents.
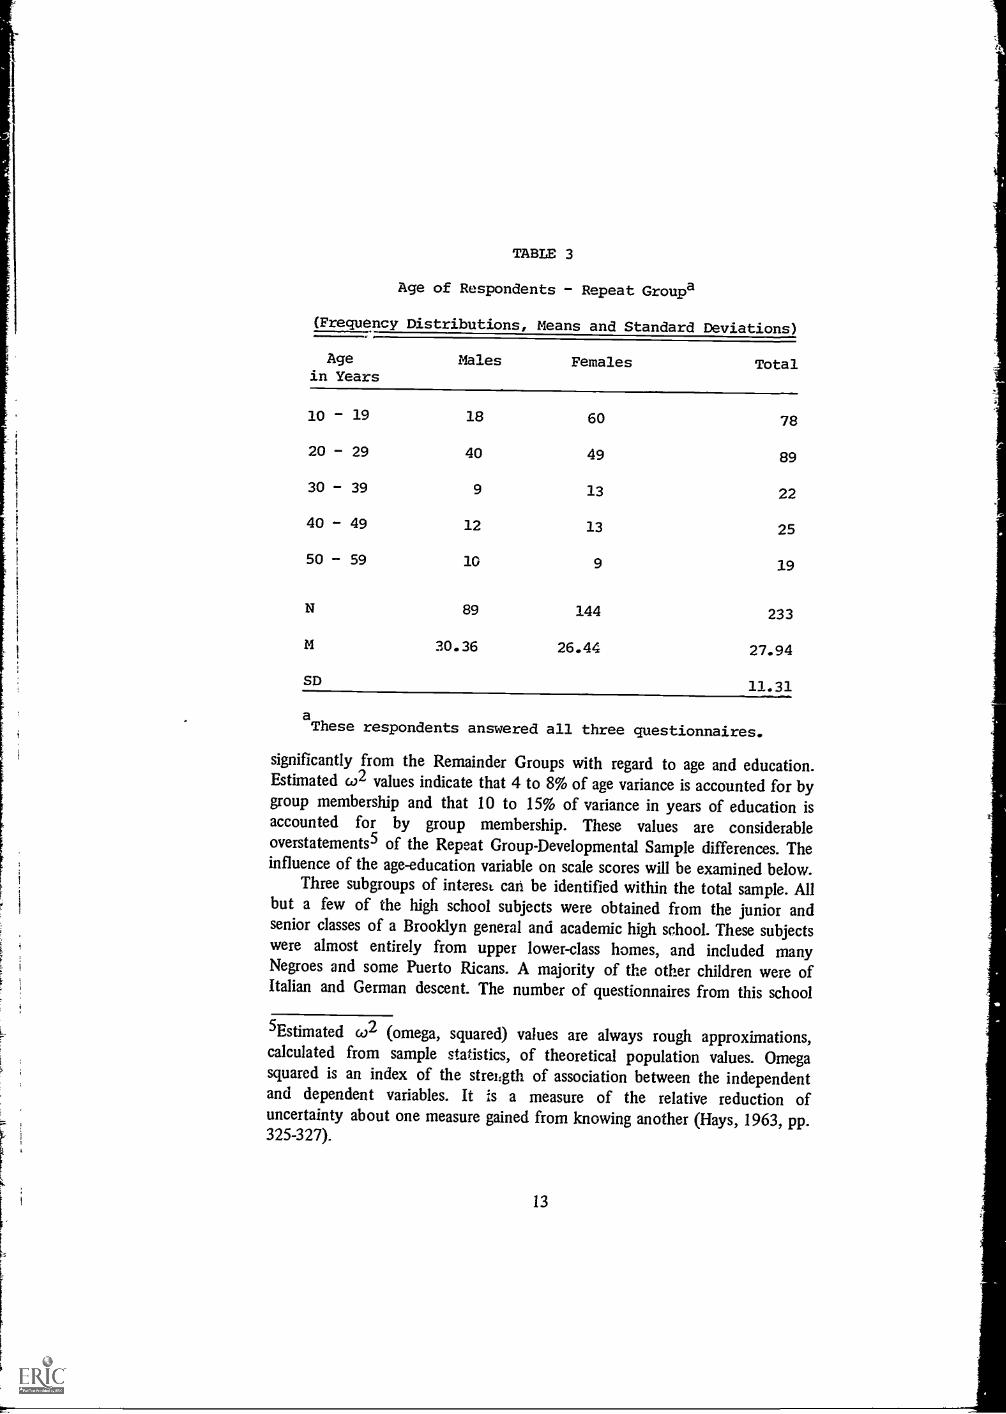
TABLE 3
Age of Respondents - Repeat Groupa
(Frequency Distributions, Means and Standard Deviations)
Agein Years
Males Females Total
10 19 18 60 78
20 - 29 40 49 89
30 - 39 9 13 22
40 - 49 12 13 25
50 - 59 10 9 19
N 89 144 233
M 30.36 26.44 27.94
SD 11.31
aThese respondents answered all three questionnaires.
significantly from the Remainder Groups with regard to age and education.Estimated w2 values indicate that 4 to 8% of age variance is accounted for bygroup membership and that 10 to 15% of variance in years of education isaccounted for by group membership. These values are considerableoverstatements5 of the Repeat Group-Developmental Sample differences. Theinfluence of the age-education variable on scale scores will be examined below.
Three subgroups of interest cari be identified within the total sample. Allbut a few of the high school subjects were obtained from the junior andsenior classes of a Brooklyn general and academic high school. These subjectswere almost entirely from upper lower-class homes, and included manyNegroes and some Puerto Ricans. A majority of the other children were ofItalian and German descent. The number of questionnaires from this school
5Estimated w2 (omega, squared) values are always rough approximations,calculated from sample statistics, of theoretical population values. Omegasquared is an index of the streLgth of association between the independentand dependent variables. It is a measure of the relative reduction ofuncertainty about one measure gained from knowing another (Hays, 1963, pp.325-327).
13

TABLE 4
Education of Respondents - Repeat Group`
(Frequency Distributions, Means and Standard Deviations)
Years ofSchool
CompletedMales Females Total
6
a 4
9 1
10 2
11 5
12 14
13 13
14 4
15 32
16 11
17 3
N 89
M 13.66
SD
1
2
4
2
63
24
15
26
6
1
144
12.95
1
6
1
6
7
77
37
19
58
17
4
233
13.22
1.91
aThese respondents answered all three questionnaires.
were amputation - 150, blindness - 139, and cosmetic conditions 171, withapproximately the same proportions (2 to 3) of males to females. The 93physical therapy majors, of whom all but 15 were freshmen and sophomores,responded to all three questionnaires. There was among them an overwhelmingpredominance of females to males (77 to16) and almost all were between 18and 20 years of age. Forty other persons were psychology majors enrolled intwo psychometrics courses at the City College of the City University of NewYork, and took all three questionnaires. The group was predominantly male(29 to 11). In the discussion of results below,. the responses of thesesubgroups will be reported and examined.
14
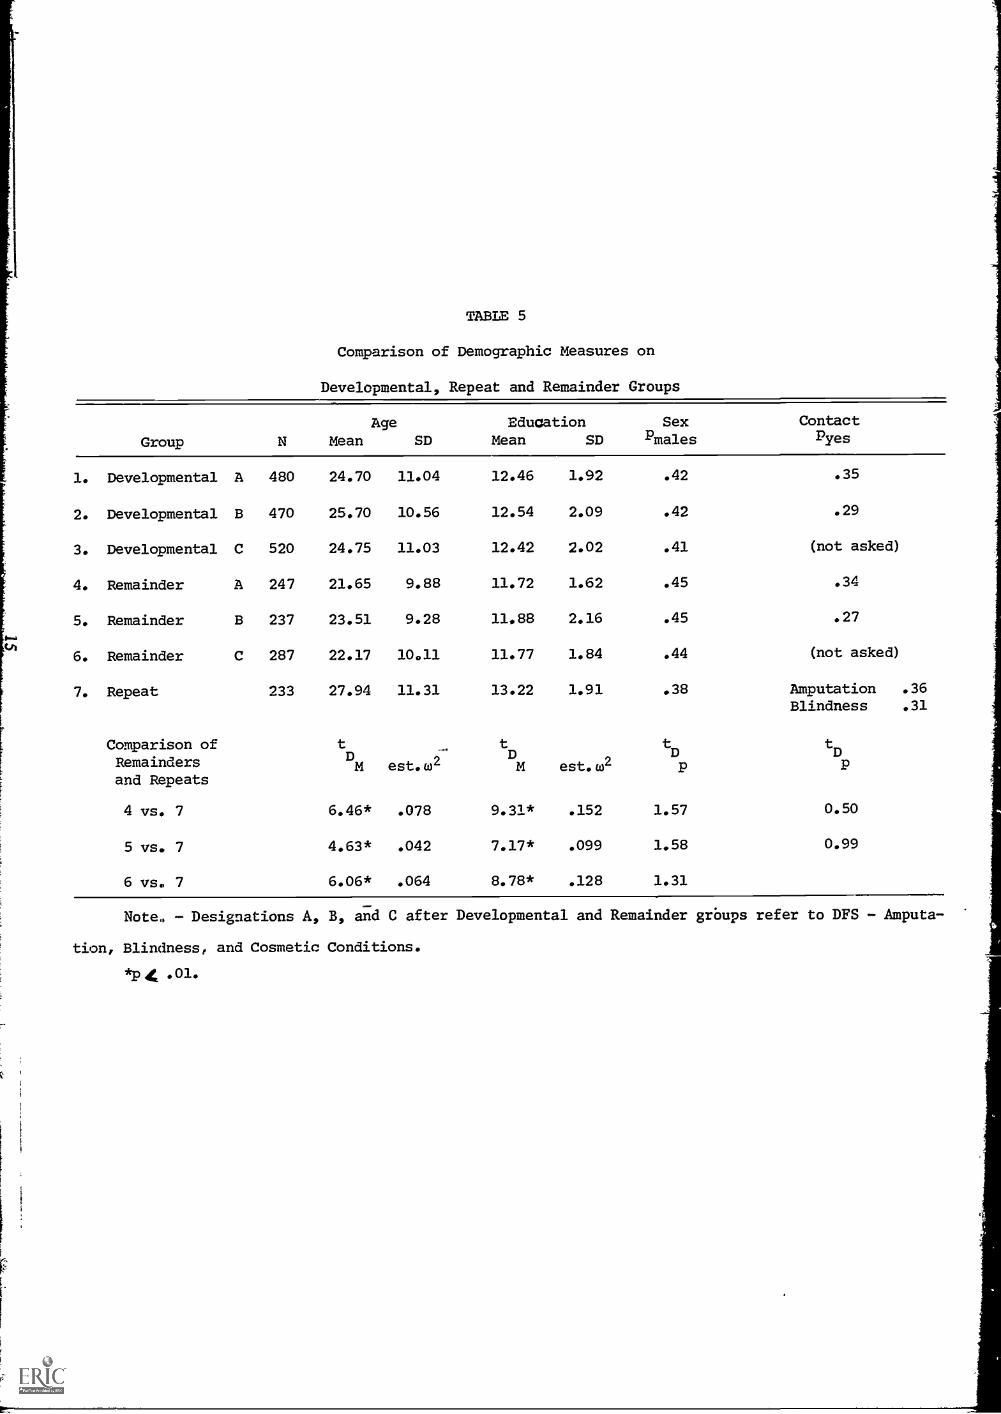
TABLE 5
Comparison of Demographic Measures on
Developmental, Repeat and Remainder Groups
Group NAge
Mean SDEducation
Mean SDSexmales
ContactAyes
1. Developmental A 480 24.70 11.04 12.46 1.92 .42 .35
2. Developmental B 470 25.70 10.56 12.54 2.09 .42 .29
3. Developmental C 520 24.75 11.03 12.42 2.02 .41 (not asked)
4. Remainder A 247 21.65 9.88 11.72 1.62 .45 .34
5. Remainder B 237 23.51 9.28 11,88 2.16 .45 .27
6. Remainder C 287 22.17 10,11 11.77 1.84 .44 (not asked)
7. Repeat 233 27.94 11.31 13.22 1.91 .38 Amputation .36
Blindness .31
Comparison ofRemaindersand Repeats
tDM est.w2
tDM est.w2
tDp
tDp
4 vs. 7 6.46* .078 9.31* .152 1.57 0.50
5 vs. 7 4.63* .042 7.17* .099 1.58 0.99
6 vs. 7 6.06* .064 8.78* .128 1.31
Note. - Designations A, B, and C after Developmental and Remainder grOups refer to DFS - Amputa-
tion, Blindness, and Cosmetic Conditions.
*p 4C .01.
Extraction ofFactors6
Principal components factors were extracted from the matrix ofproduct-moment correlations between items on each questionnaire. For each
questionnaire, two rotations to an orthogonal, simple structure solution by the
normal varimax method (Kaiser, 1958) were inspected (Amputation - 7 and 9
factors; Blindness - 7 and 9 factors; Cosmetic Conditions - 6 and 8 factors).
Five of the DFS-A factors selected were from the seven-factor solution and
two were from the nine-factor rotation. The two amputation factors from the
nine-factor solution carried the same meaning as their seven-factor
counterparts, but were more clearly defined. Data from both rotations were
also assessed in the case of the DFS-B, but all seven factors in this case were
drawn from the nine-factor solution. Of the two remaining factors, the first
was discarded because it failed to account for a substantial proportion of the
common variance. The second, although accounting for 9% of the common
variance, proved difficult to interpret, contained items with high secondaryloadings on numerous other factors and, as a scale, was estimated as having a
relatively low internal consistency reliability. In the case of the DFS-C, all six
factors of one rotation were accepted.The results indicated that although the specific names of factors in certain
instances might differ from those given in the previous factor analysis, a high
degree of factorial similarity was maintained.
6The correlation matrix and the unrotated orthogonal factor solutions for
each of the three questionnaires will be deposited with NAPS. For all or parts
of this material, order NAPS Document 00435 from ASIS National Auxiliary
Publications Service, c/o CCM Information Sciences, Inc., 22 West 34th Street,
New York, New York 10001; remitting $2.00 for microfiche or $6.00 for
photocopies. The rotated matrices are in Appendix C.
The initial factor analyses were performed by Dr. Richard Nisbett.
16

Chapter 3
DIMENSIONS OF ATTITUDES
The factorial results are interpreted as representing salient dimensions of
attitudes toward the disabled. A description of each of these factors follows.
They are presented in terliiS of endorsement of the item content and do not
necessarily reflect the typical responses of the developmental samples.
Considerable effort was devoted to assigning meaningful names to the factors
in the hope that useful experiment hypotheses might be suggested thereby.
AMPUTATION
The following seven factors were obtained in the study of attitudes
toward amputation: Interaction Strain, Rejection of Intimacy, Generalized
P.Gjection, Authoritarian Virtuousness, Inferred Emotional Consequences,
i)istressed Identification, and Imputed Functional Limitations.
IA Interaction Strain
The predominant tone of this factor, which accounted for 23% of the
estimated common variance of the questionnaire, is one of distinct uneasiness
in the presence of an amputee in a wide variety of social situations. This is
mirrored most directly and succinctly in the highest loading item, "I feel
uneasy when I come near an amputee." Many items additionally involve
uncertainty about how to deal with the disabled (e.g., "I would feel nervous
with an amputee because a lot of the time I wouldn't know the right thing to
do"). Conversation is felt to be inhibited and leading to tension, as reflected
in items such as "I would he afraid of saying the wrong thing in talking to an
amputee." Association with an amputee is felt to be embarrassing "in public"
and, on a more specific level, disruptive to one's other friendships. While most
of the items here refer to the respondent's own reaction, there is also an
expectation that other non-amputees experience similar discomfort.
A second important group of items in this factor refer to the arousal of
disgust or revulsionas, for example, "When I see an amputee 1 get a sickish
feeling in my stomach." The juxtaposition of these two types of items leads
to the hypothesis that the issue of how to deal with an amputee is not simply
a matter of ignorance or uncertainty. Rather, emotional aversion may inhibit
spontaneous interaction, thus contributing to the experience of strain and to
the need for more explicit behavioral guidelines. Whether the need to know
17

the "correct" things to do is, in addition, a defensive reaction against revealing
one's feelings of revulsion to the amputee, remains a question for empirical
verification.This factor contains a relatively high degree of self-reference. It expresses
essentially negative reactions without in any way blaming the amputee, isneutral with regard to desire for or rejection of contact, and does notadvocat' any general policies regarding amputees.
2A Rejection of Intimacy
The dominant theme of this factor, which accounted for 14% of the
estimated common variance, is the rejection of close, particularly familial,relationships with amputees. An unwillingness to date, fall in love with, or
marry an amputee is expressed, and the idea of having an amputee child is
strongly rejected: "I would rather not have any children than have a childwho is an amputee." Marriage to an amputee is seen as limiting the formation
of new friendships, and amputees are characterized as great burdens on their
families.A number of items in this factor (e.g., "I would rather be dead than lose
both arms") reflect a greater degree of deep personal involvement than is
present in most of the other factors. The basis for rejection of intimate
relationships with amputees might, then, be seen as the strong rejection of
amputation in the self, and by extension in those with whom one mostclosely identifies.
Unlike the previous scale, which emerged from a seven-factor rotational
solution, this 14-item scale was derived wholly from a nine-factor solution.
3A Generalized Rejection
The content of this factor (which accounted for 24% of the estimated
common variance) is distinctly "anti-amputee"; it contains negative descrip-
tions of the amputee, unpleasant personal reactions, and policy items
advocating unfavorable treatment. Segregation of the amputee from others is a
prominant theme, with the high loading item being, "Amputees ought to be
kept apart from the normal community." Disturbance in empathic relations is
emphasized, as epitomized in the item, "Amputees and normal people can't
really understand each other." It is felt that amputees have "bad characters,"
and "may have done something to deserve" their impairment. Aversivereactions are expressed, e.g., "There is something frightening about the way
amputees look," and reluctance to interact in intimate (close friends) orformal (on-the-job) situations is clear.
4A Authoritarian Virtuousness
This factor, which accounted for 21% of the estimated common variance,
is defined by a large number of ostensibly pro-amputee items and by a few
18
items from the California F-scale. It is the only factor of the amputationquestionnaire with a large group of items which seem positive in tone. These
are of three general sorts: the first type portray the amputee as having specialgifts and exceptional personality characteristics "Because of their disability,
amputees are probably closer to the really important things in life"; thesecond type advocate special tolerance of amputees and suggest special
treatment "People should be especially tolerant of amputees"; the thirdinvolve self-reference and describe the respondent as extra favorable toward
amputees "I would go out of my way to be friendly with an amputee," and
"I am more sympathetic than most toward amputees."It is illuminating to compare the positively-toned items which cluster in
this factor with the pro-amputee items of other factors of this questionnaire.The latter have an essentially egalitarian quality: "Amputees are pretty muchlike everybody else after you get to know them," and "I would date anamputee as readily as anyone else," etc. In contrast, the items loading on thisfactor are overfavorable, presenting the amputee as someone special, meriting
preferential treatment.The simultaneous loading of items endowing amputees with exceptional
qualities and others pleading for tolerance and special treatment for thembecause of their shcrtcomings gives this factor a double-edged character. When
a similar factor emerged in an earlier study of the ATDP (Si ller & Chipman,19641)) it included items which more clearly imputed inferior status toamputees. This earlier factor was labelled Benevolent Superiority. Theimplication of inferiority is, however, less apparent in the present factor.
Rather there is an explicit quality of conscious rectitude, particularly in the
third type of item mentioned above, which accounts for the use of the termVirtuousness in the factor name.
The first half of the factor name related to the clustering, with equally
high loadings, of several F-scale items, making it clear that the themes ofspecial benevolence and of respect for authority are intimately associated in
this factor. This association is somewhat unusual. The type of disability itemsincluded are not inconsistent with the general image of authoritarian-basedattitudes, being rather sweeping and generalized, with apparently moralistic
implications. However, the expressed attitudes toward the "unfit" arebenevolent rather than, as might have been anticipated, hostile and punitive.We have speculated that the issue of perceived responsibility for a deviation is
important in determining the direction of Authoritarian attitudes. It is
expected that persons high on Authoritarianism would express hostilitytoward those who deliberately choose to be different, or whose "weakness" or"badness" is believed to be under conscious control (criminals, Communists)
but would express sympathetic, tolerant, charitable attitudes toward thoseperceived as "suffering unfortunates" whose impairment has been visited uponthem. (Prejudice toward certain groups might seem to fall outside this kind ofanalysis since, obviously, one is not responsible for being a Negro, for
19

example, or a Jew. However, usually personality and intellectual deficienciesattributed to the "out-group" are incorporated within the belief systemsupporting the prejudice, i.e., not dark skin per se in the Negro, but laziness,sensuality, etc., or greediness in the Jew. invoking the concept of personalresponsibility might serve to clarify some of the differential reactions to variedoutgroups.)
To summarize, the disability items loading on this factor describe theamputee as having special gifts and desirable personal traits, advocate a generalpolicy of favorable treatment and tolerant understanding, and picture therespondent himself as especially warm and sympathetic toward the disabled.The over-all impression is of a "do-gooder" orientation, involving a ratherundifferentiated, positive, benevolent approach whose origins would appear tobe in a wider moralistic system and are consistent with a "charitable"self-image maintained by the respondent. (This factor resembles in manyaspects the Benevolence factor obtained by Cohen and Struening, 1962, in thedevelopment of the OMI.)
5A Inferred Emotional Consequences
This factor accounted for 10% of the estimated common variance. Itconsists almost entirely of statements intensely hostile to the amputee. Theitems consistently refer to the amputee's character and emotionality; neitherthe respondent's personal reaction nor advocacy of general policy areincluded. Maladjustment and ill-temper are perceived to be very frequentlyassociated with amputation. Self-consciousness, irritability, and hyper-sensitivity are generally attributed to amputees. The following items aretypical: "Amputees feel sorry for themselves...," "Most amputees arebitter...," "Amputees are often angry at the world...," "Amputees who seemoutwardly adjusted are often inwardly unhappy." This factor is distinguishedfrom Generalized Rejection in that the latter contains much self-reference,strongly advocates segregation, and is less intensely negative in its descriptionof the amputee.
6A Distressed Identification
This factor (accounting for 4% of the estimated common variance)
involves highly personalized reactions to disability; the items are exclusively ofthe self-reference type with the amputee frequently named as the stimulus
which activates anxiety about the respondent's own vulnerability. Unelicited
specific anxiety is expressed, as in the item "I am sometimes afraid I will losea limb," as well as an induced uneasiness, as in "Seeing an amputee makes meworry about unpleasant things that might happen to me." An element ofactive identification is conveyed in the item "When I see an amputee, I tryto imagine what it is like' to lose a limb."
20
The emotionally .toned personal involvement would appear to be as
intense in this factor as it is in Rejection of Intimacy, but the notable
diffsience between the two is that Distressed Identification does not include
reference to a tendency to reject the amputee.There seems to be some relationship between this factor, with its
emphasis on the respondent's concern about physical loss, and the concept of
castraiion anxiety. Although there are only four items with principal loadings
in this factor, when scored as a scale it shows a sufficiently high reliability
(.80) which, in addition to a generally low correlation with scales derived
from the other factors of the Amputation questionnaire, suggests that it is a
meaningful and fairly independent factor_ Research into its possible
association with the concept of castration anxiety may prove to be fruitful
and enlightening.The nine-factor rotational solution provided the basis for this scale.
7A Imputed Functional Limitations
This factor (which accounted for 8% of the estimated common variance)
focuses quite specifically on whether the amputee can function adequately
and effectively in a number of typical and crucial situations. Comparisons
with the capabilities of nondisabled appear in a number of items. In contrast
to the preceding factors, item content is primarily "factual" and objective in
tone, having only minimal reference to the personal reactions of the
respondent. The image conveyed is of the amputee as functionally limited,
dependent upon others for assistance, and having difficulty providing financial
support for himself and his family. Prosthetic devices are seen as not fully
compensating for the loss of a limb. Although this factor appears to be
"Objective," data presented later (Tables 13 and 16) show that maintenance
of this attitude probably reflects a strong affective reaction. This, in turn,
suggests that imputation of functional limitations is used as a means of
rationalizing aversive feelings.
BLINDNESS
Virtually the same seven factors that characterized attitudes toward
amputation have also been found to be the basis of attitudes toward the
blind: Interaction Strain, Rejection of Intimacy, Generalized Rejection,
Authoritarian Virtuousness, Inferred Emotional Consequences, Distressed
Identification, Imputed Functional Limitations.
IB Interaction Strain
Twelve per cent of the estimated common variance was accounted for by
this factor. Its predominant tone closely resembles that of the same-named
21
A

factor of the amputation questionnaire; both emphasize the experience of
uneasiness, discomfort and embarrassment when interacting with the disabled.
There is a stronger emphasis on avoiding social contact in the blindness factor
and a somewhat weaker emphasis on aversive feelings. The shared content,
however, is striking and it is clear that these factors of the two questionnaires
primarily tap a personal feeling of tension and strain in a wide variety of
social encounters.
2B Rejection of Intimacy
The dominant theme of this factor is very close to that of the parallel
factor derived from the questionnaire on amputation. It is one of rejection of
intimate, particularly familial, relationships with blind people; there is an
unwillingness to date, fall in love with or marry a blind person, and there is a
strong assertion that "I would rather not have any children than have a child
who is blind."The sense of personal involvement and self-reference is strong in this
factor. Even more clearly than in the case of the factor derived from the
amputation questionnaire, the rejection of blindness in extensions of the self
implies concern about the self.
This factor accounted for 7% of the estimated shared variance.
3B Generalized Rejection
This factor accounted for the largest single share of the estimated
common variance (23%). As in the comparable amputation factor, a
generalized negative orientation is evident. The blind are characterized
unfavorably as "mean and nasty," "unpredictable," and "irritable," eliciting
such aversive reactions as revulsion. Disturbance in empathic relations is
heavily emphasized, and segregation is advocated: in both the amputation and
blindness analyses, the top loading item was "Blind people (or Amputees)
ought to be kept apart from the normal community."
4B Authoritarian Virtuousness
This factor accounted for 17% of the estimated shared variance. As in the
case with the Authoritarian Virtuousness amputee factor, this one, too, is
ostensibly "pro-disabled," projecting an image of the blind as having special
gifts and desirable personal characteristics. Blindness is seen as "improving a
person's character," and blind people are described as "probably closer to the
really important things of life." The self-reference elements characterize the
respondent as particularly warm, sympathetic, and ready to befriend the blind,
and a general policy of tolerance is advocated. The Authoritarian (F-type)
items included in the questionnaire loaded on this factor, as they did in the
analysis of the amputation questionnaire.
22

5B Inferred Emotional Consequences
This factor, which accounted for 9% of the estimated common variance,
closely resembles the same-named factor derived from the amputationquestionnaire, focusing almost exclusively on the psychological characteristics
of the disabled. The blind are pictured quite unfavorably as maladjusted,self-pitying, hypersensitive, angry, and using their disability to exploit others.
They are perceived as humiliatingly dependent, but tending to do dangerous
things rather than accept help. The general motif of this factor seems to bethat psychological warping is a frequent consequence of blindness.
6B Distressed Identification
This factor (accounting for 8% of the common variance) emergessomewhat mote strongly from the blindness questionnaire than fromamputation, although the highest loading items are identical. The primaryemphasis in both is that the disabled person serves as a stimulus activating
strong anxiety about one's own vulnerability. In addition, however, a quality
emerges from the blindness questionnaire which implies that the blind arouse
curiosity, pity and "a sickish feeling" in the stomach of the beholder. The
hypothesis concerning the relationship of Distressed Identification to
castration anxiety, advanced in discussing this same factor on amputation,
seems applicable here as well.
7B Imputed Functional Limitations
This factor, accounting for 11% of the estimated shared variance, focuses
quite specifically on the ability of the blind person to function in his
environment. While the same-named factor from amputation deals with thistheme too, the blindness factor contains many more references to particular
occupations. The amputation factor stresses over-all functional limitations,
physical dependency, and difficulties in earning money, while the blindness
factor, although it contains such items, specifically depicts the blind as unable
to do a good job as a lawyer, politician, doctor, grover, mother, and President.
Thus, while the dimension of Imputed Functional Limitations is common to
both questionnaires, there seems to be a more sharply defined image of the
functional limitations of the blind than of amputees. As with the factor on
amputation, subsequent data (Tables 13 and 16) demonstrate that theunderlying attitude is aversive.
COSMETIC CONDITIONS
In the construction of item pools for the amputation and blindness
questionnaires, identical item stems were used whenever possible. However,
23
only a limited correspondence between those items and the ones used forCosmetic Conditions could be achieved, since certain types were neitherappropriate nor relevant, e.g., items concerned with functional capability.Therefore, although parallelism was maintained wherever possible, a substantialnumber of items were either modified significantly or dropped entirely.
Despite the heterogeneity of the disability conditions mentioned in thecosmetic questionnaire and the differences in the wording of items, some ofthe factorial dimensions identified for blindness and amputation were foundhere also. Two factors, Interaction Strain and Rejection of Intimacy, weresufficiently similar in content (and scales based on them correlated highlyenough with scales based on these factors on the other questionnaires) to benamed identically.
Two other factors of the cosmetic conditions questionnaire were roughlyanalogous to factors educed from the amputation and blindness items, butthey were sufficiently different to warrant different titles. These cosmeticfactors, Reluctant Aversion and Superficial Empathy, generally correspond toGeneralized Rejection and Authoritarian Virtuousness from the other twoquestionnaires. The remaining factors (Qualified Aversion and ProximateOffensiveness) are unique to the cosmetic items. Table 13 illustrates therelationships between the scales that were developed from these factors.
1C Interaction Strain
This factor accounted for 21% of the estimated common variance of theitems. As in the blindness and amputation questionnaires, a major portion ofthis factor relates to feelings of uneasiness and constraint in interactions withthe disfigured. Sample items are "I think I would be upset at the idea ofspending an evening with someone whose face was badly scarred" and "Iwould feel very uncomfortable if a person with severe facial scars talked tome about his appearance." The element of emotional aversion is also present,as it was on the corresponding amputation factor, but not as strongly. Themesof embarrassment in public and of disruption of one's other friendships as aconsequence of association with the disfigured, occur on this as they did onthe comparable factors referring to the other disabilities. Almost all the itemsrefer to the respondent's reaction; there are very few describing the disabledor advocating general policy.
Items referring to amputation and blindness which appeared in this andthe other questionnaires, which showed primary loadings on the InteractionStrain factors of their original questionnaires had primary loadings on thepresent factor as well.
2C Rejection of Intimacy
This factor accounted for the largest share of the estimated commonvariance (28%). As with the comparable factors on blindness and amputation,
24
it focuses on the rejection of intimate, particularly familial, contacts with thedisabled or disfigured. Such relationships are rejected for the self, for membersof one's family, and for close friends. Respondents agreeing with the items do
not want amputees, blind people, ugly people, those with heart conditions orwith severe scarring to be involved in their lives in any permanent, important,or intimate way. Typical items are: "I would be upset if a child of mine weredating someone I considered very ugly"; "Even if I fell in love with a person I
thought was very ugly, I don't think I would actually be willing to getmarried"; "I would rather have no children than have a child who was veryugly"; "I wouldn't let myself fall in love with an amputee."
3C Reluctant Aversion
This factor, which accounted for 13% of the estimated shared variance, is
similar to the Generalized Rejection factors of amputation and blindness, in
that aversion is expressed, and segregation desired; e.g., "Ugly people are bestoff staying among themselves." However, items specifically asserting adisturbance of empathy between disabled and nondisabled are not included in
this factor, and an element of "apology" for the aversive reaction isprominent: e.g., "I must admit that I tend to connect bad skin with anunpleasant personality"; "I am sometimes ashamed of the way I feel aboutpeople who have strong body odor." It is possible that a recognition of thediscrepancy between negative feelings and socially acceptable behavior orrational beliefs accounts for the reluctant tone of these items. Whether this"apology" implies a more basic built is a matter for empirical investigation.
4C Superficial Empathy
This factor accounted for the smallest part of the estimated commonvariance (10%). The items loading on it focus primarily on the psychologicalcharacteristics of those afflicted with obvious cosmetic impairments. Unlike
the other factors, the affective implications are unclear: i.e., the direction offeeling cannot be inferred readily from the content. Both positive and negative
traits are attributed: for example, "Really ugly-looking people are often angry
at the world," and "People who are physically unattractive often developunusually nice personalities." Some empathy, or a desire for empathy, isexpressed in several of the items, e.g., "I think it would be a valuableexperience to be really ugly for a short period of time"; and a few of theself-reference statements express a positive orientation, as "I am moresympathetic than most toward overweight people."
The issue of ambivalent feelings and what it means to endow individuals
with special characteristics is relevant for this factor as it was for the twoAuthoritarian Virtuousness factors on amputation and blindness. The termSuperficial Empathy was employed to indicate the uncertainty of the ultimatemeaning of a high score on this factor.
25
5C Qualified Aversion
This factor, which accounted for 15% of the estimated common variance,
does not correspond to any factor identified for amputation or blindness.
Qualified expression of emotional aversion is its distinguishing characteristic.
This qualification is manifest in the presence of modifiers such as,
"somehow," "I have some feeling" and "in general." In contrast to Reluctant
Aversion, these items rarely sound apologetic.
The types of cosmetic impairment which load here are generally of a class
which is assumed controllable, i.e., dandruff, acne, overweight. A typical item
is "I feel somewhat disgusted when I come near a very overweight person."
6C Proximate Offensiveness
The most salient content of this factor (13% of the estimated shared
variance) is moral indignation in the context of close physical contact. As in
5C, the majority of items deal with cosmetic impairments which are assumed
to be controllable and to which are attached strong social stigma, e.g.,
pimples, body odor, bad breath. As with Qualified Aversion, there is a quality
of disgust expressed. In addition, however, there is a note of moralistic
disapproval: e.g., "People with body odor don't have enough respect for the
feelings of others"; "There is no excuse for bad breath." Subsequent
investigation is likely to indicate that these categories of cosmetic impairment,
e.g., halitosis, body odor, etc. are seen more as evidence of "poor habits" than
as physical conditions.
26
Chapter 4
THE DISABILITY FACTOR SCALES
The Disability Factor Scales for Amputation, Blindness and Cosmetic
Conditions were derived directly from the dimensions of attitudes described in
Chapter 3. Just as each factor was interpreted as representing a dimension of
attitude toward the disabled, the items comprising that factor were assumed
to be measures of that dimension. The logic of scale refinement thus was
based upon psychometric utility.
ESTABLISHMENT OF FACTOR SCALES
An estimate of the reliability of each factor scale was made using all of
the items loading on that factor and, then, with successive omissions of
low-loading items. An approximation formula derived by Dr. Jacob Cohen
(personal communication) was employed for this purpose
1' 2 =xx (n 1)(n + 2Ea.
].a. ) '
2n Ea.1 a.
n n
with n = number of items and D a.a. = E E a.a.1 1 '
1=1 j=i+1
or the sum of all the different cross-products of the factor loadings of the
items in the scale. Using this estimate, items were dropped which did not add
materially to the reliability of that factor. Most of the items omitted were
from the first few factors, since these were quite large. In some instances,
items were included in scales on the basis of their secondary rather than
primary factor loadings. This was done when the item contributed more to
the scale reliability of the factor on which it had a secondary loading than to
the one on which it had a primary loading. In general, such a situation
occurred when the primary loading was on a factor which contained many
items and the secondary loading was comparatively high on a smaller factor.
27

Each item was assigned to and scored in only one factor scale. The standard
deviations of the individual items were .cite similar, so it was not necessary
to standardize item scores. Items were not differentially weighted, as Trites
and Sells (1955) have indicated that weighting items as a function of their
factor loadings has little advantage over the simpler unit weights.
The Disability Factor Scales consist of that set of items from each factor
which survived the reduction process. Each scale carries the same name as the
factor from which it was derived. The items were reduced from 145 to 101
for the Amputation questionnaire, from 145 to 105 for Blindness, and from
84 to 80 for Cosmetic Conditions.All subsequent description and statistics are based upon these scales. The
populations upon which the figures are based were the Developmental Samples
presented in Chapter 2.
ADMINISTRATION AND SCORING
The three questionnaires of the Disability Factor Scales are printed in
four-page bboklets which can be administered individually or in a group
setting. Each item may be answered along the following scale: strongly agree,
agree, not sure but probably agree, not sure but probably disagree, disagree,
strongly disagree.?The DFS-A and DFS-B generally take up to 20 minutes for
administration, while the DFS-C takes up to 15 minutes. However, there is no
time limit.Several options are available for scoring the DFS. They can be scored by
means of plastic scoring keys or by means of a computer program which has
been developed. Both are available from the senior author. They cans also be
scored by hand bi this is not recominended.8
7Agreement with the items is scored 1-3 and disagreement 4-6; thus, a low
score indicates a greater amount, and a high score a lesser amount, of the
quality denoted by the factor names. For most factors, this means that a low
score suggests a more negative attitude than does a high score. The exceptions
are factors 4A, 4B, 4C, for which a low score is interpreted as
"overfavorability," and 6A and 6B, where a low score reflects distressed
identification with the disabled.
8Conversion of raw scores to sten scores: the Developmental Sample for each
questionnaire was used as a basic referent group from which sten scores
(Canfield, 1951) were computed. Sten scores are linear transformations in
which the new means becomes 4.5, the standard deviation 2, and scores range
from 0-9. The formula for the conversion is sten 4. + 4.5. Sten
conversion tables for each DFS questionnaire are available upon request. Use
of sten scores would facilitate comparisons of relative standings across scales
for individuals or groups.
28
PSYCHOMETRIC CHARACTERISTICS OF THEDISABILITY FACTOR SCALES
Summary data on each scale for the Developmental Samples are containedin Table 6. For each item of the three questionnaires, the mean, standarddeviation and primary factor loading are listed by scab, in Appendix A.
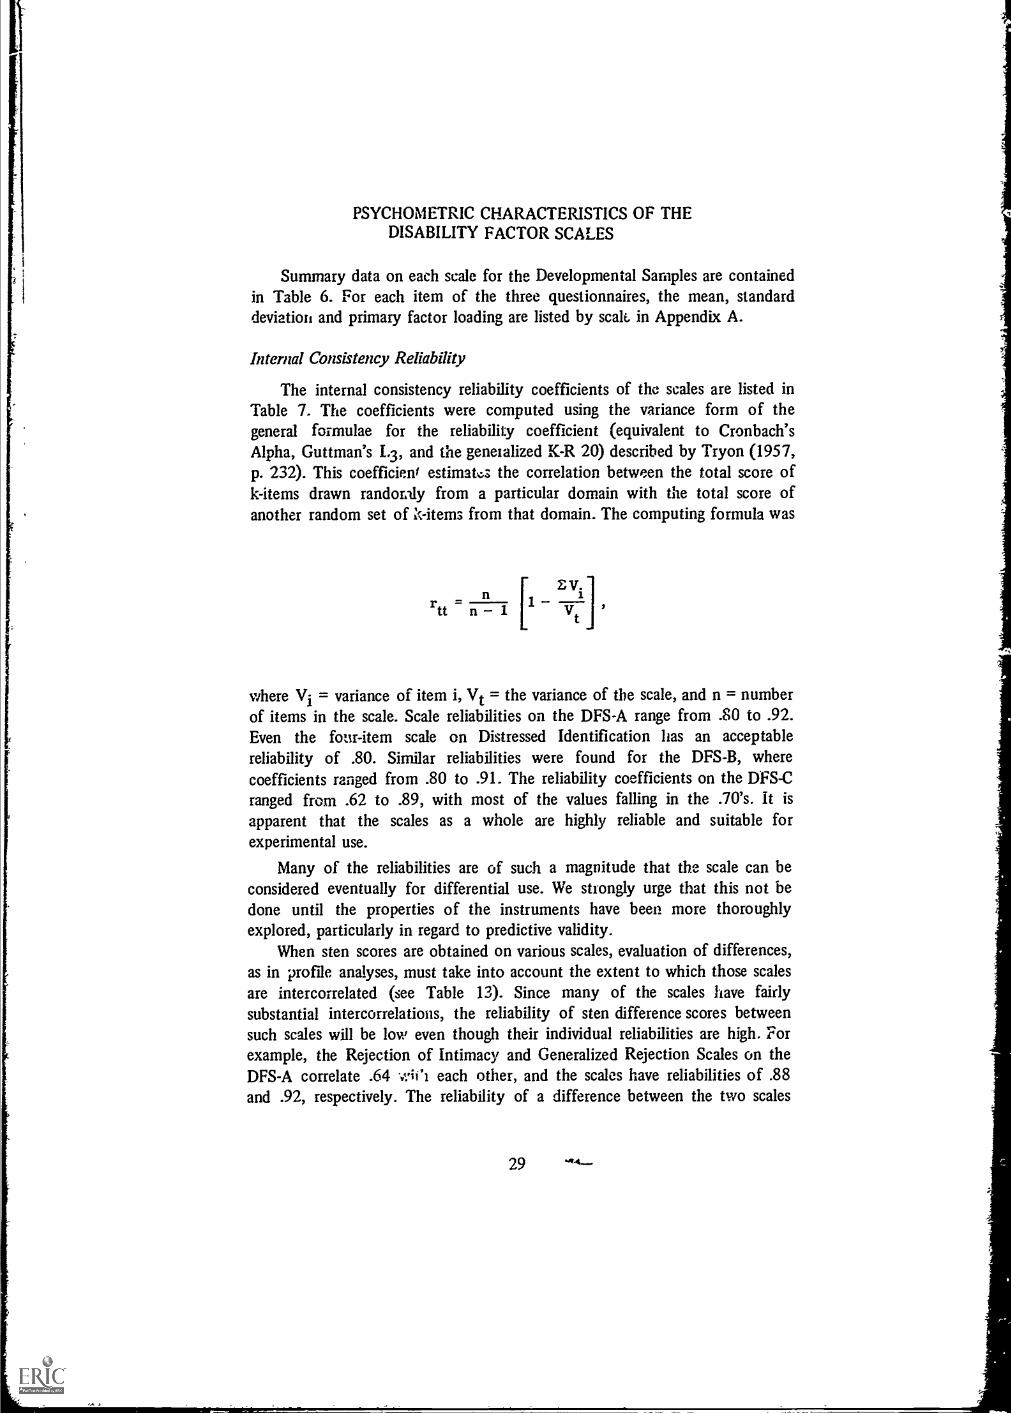
Internal Consistency Reliability
The internal consistency reliability coefficients of the scales are listed inTable 7. The coefficients were computed using the variance form of thegeneral formulae for the reliability coefficient (equivalent to Cronbach'sAlpha, Guttman's 1.3, and the generalized K-R 20) described by Tryon (1957,p. 232). This coefficient estimat, the correlation between the total score ofk-items drawn randoudy from a particular domain with the total score ofanother random set of c -items from that domain. The computing formula was
nr =tt n 1
E V.
V 't
where Vi = variance of item i, Vt = the variance of the scale, and n = numberof items in the scale. Scale reliabilities on the DFS-A range from .80 to .92.Even the four-item scale on Distressed Identification has an acceptablereliability of .80. Similar reliabilities were found for the DFS-B, wherecoefficients ranged from .80 to .91. The reliability coefficients on the DFS-Cranged from .62 to .89, with most of the values falling in the .70's. It isapparent that the scales as a whole are highly reliable and suitable forexperimental use.
Many of the reliabilities are of such a magnitude that the scale can beconsidered eventually for differential use. We strongly urge that this not bedone until the properties of the instruments have been more thoroughlyexplored, particularly in regard to predictive validity.
When sten scores are obtained on various scales, evaluation of differences,as in profile analyses, must take into account the extent to which those scalesare intercorrelated (see Table 13). Since many of the scales have fairlysubstantial intercorrelations, the reliability of sten difference scores betweensuch scales will be low even though their individual reliabilities are high. Forexample, the Rejection of Intimacy and Generalized Rejection Scales on theDFS-A correlate .64 v.ii'l each other, and the scales have reliabilities of .88and .92, respectively. The reliability of a difference between the two scales
29

TABLE 6
Number of Items, Mean Score, Standard Deviation, and
Standard Error of Measurement for each Scale'
Scales
No. ofItems M SD cm
Amputation(N = 483)
1A Interaction Strain 19 77.95 14.20 4.26
2A Rejection of Intimacy 14 55.59 11.08 3.83
3A Generalized Rejection 23 112.99 13.74 3.89
4A Authoritarian Virtuousness 18 61.72 13.22 4.57
5A Inferred Emotional Consequences 11 46.08 7.42 2.97
6A Distressed Identification 4 14.58 4.58 2.05
7A Imputed Functional Limitations 12 47.20 8.21 3.58
Blindness(N = 477)
1B Interaction Strain 15 67.54 10.26 3.55
2B Rejection of Intimacy 12 49.03 9.40 3.76
3B Generalized Rejection 23 112.04 13.35 4.00
4B Authoritarian Virtuousness 17 56.08 12.86 4.64
5B Inferred Emotional Consequences 15 62.15 8.97 3.70
6B Distressed Identification 10 38.71 8.39 3.66
7B Imputed Functional Limitations 13 48.96 9.42 4.21
Cosmetic Conditions(N = 520)
1C Interaction Strain 17 65.72 11.96 4.78
2C Rejection of Intimacy 18 75.47 13.95 4.63
3C Reluctant Aversion 13 59.30 7.44 3.94
4C Superficial Empathy 12 39.67 6.83 4.21
5C Qualified Aversion 10 41.49 7.32 3.51
6C Proximate Offensiveness 10 32.95 7.56 3.86
30
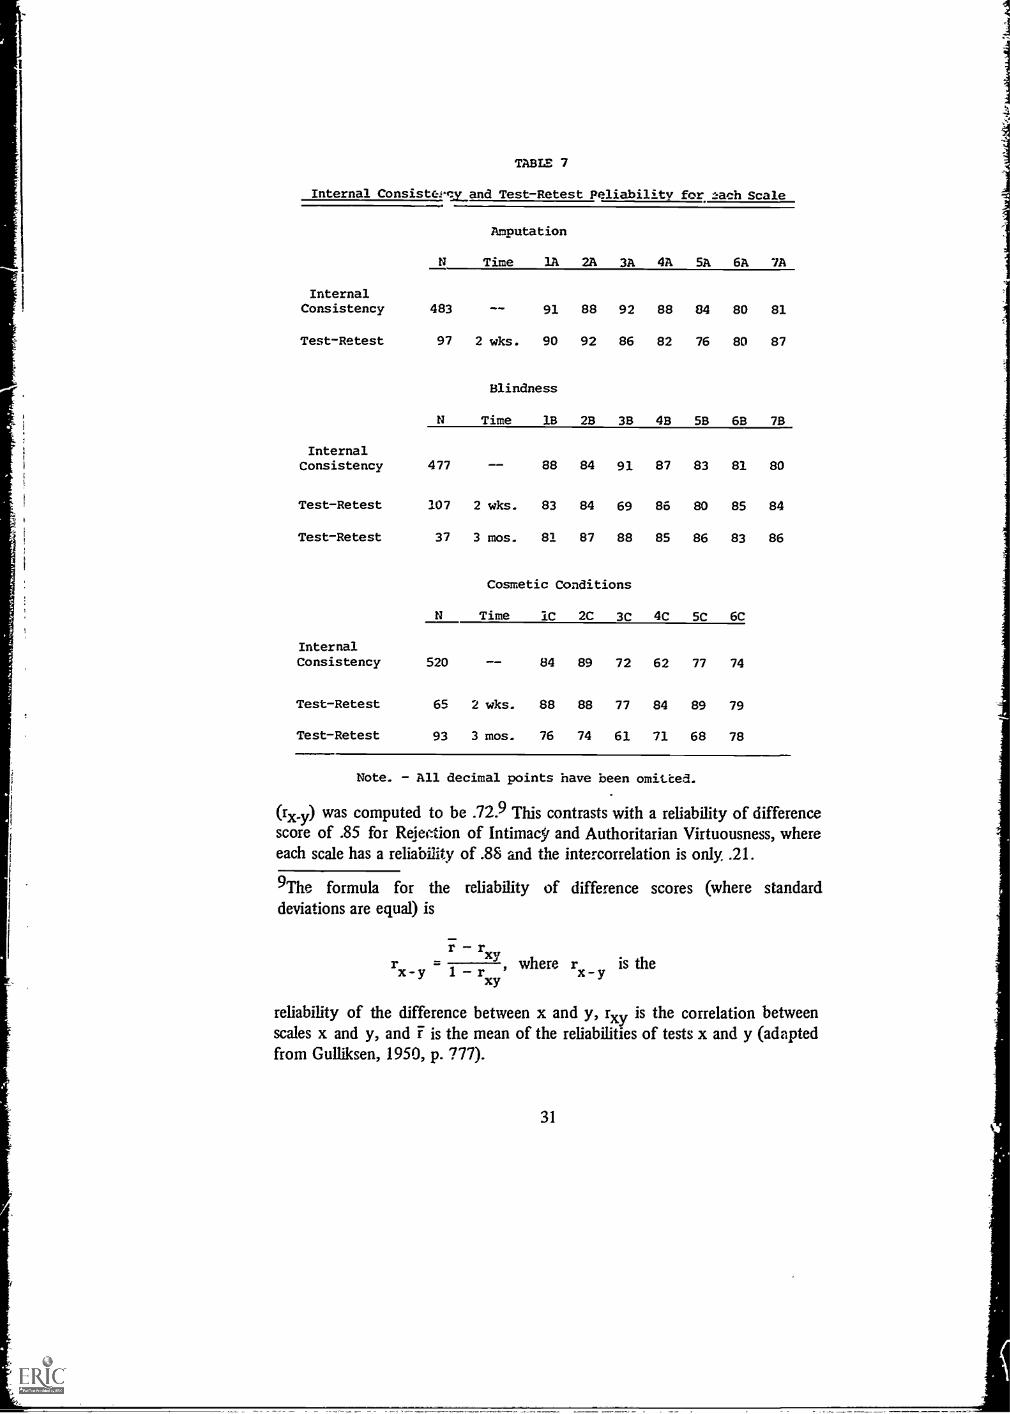
TABLE 7
Internal ConsistePcv and Test-Retest Peliability for -.ach Scale
Amputation
Internal
N Time lA 2A 3A 4A 5A 6A 7A
Consistency 483 91 88 92 88 84 80 81
Test-Retest 97 2 wks. 90 92 86 82 76 80 87
Blindness
N Time 18 2B 3B 4B 5B 6B 78
InternalConsistency 477 88 84 91 87 83 81 80
Test-Retest 107 2 wks. 83 84 69 86 80 85 84
Test-Retest 37 3 mos. 81 87 88 85 86 83 86
Cosmetic Conditions
N Time 1C 2C 3C 4C 5C 6C
InternalConsistency 520 84 89 72 62 77 74
Test-Retest 65 2 wks. 88 88 77 84 89 79
Test-Retest 93 3 mos. 76 74 61 71 68 78
Note. All decimal points have been omitted.
(rx_y) was computed to be .72.9 This contrasts with a reliability of differencescore of .85 for Rejection of Intimacy and Authoritarian Virtuousness, whereeach scale has a reliability of .88 and the intercorrelation is only, .21.
9The formula for the reliability of difference scores (where standarddeviations are equal) is
r r
r _ Xy, where r is thex-y 1 r x-yxy
reliability of the difference between x and y, rxy is the correlation betweenscales x and y, and I is the mean of the reliabilities of tests x and y (adaptedfrom Gulliksen, 1950, p. 777).
31
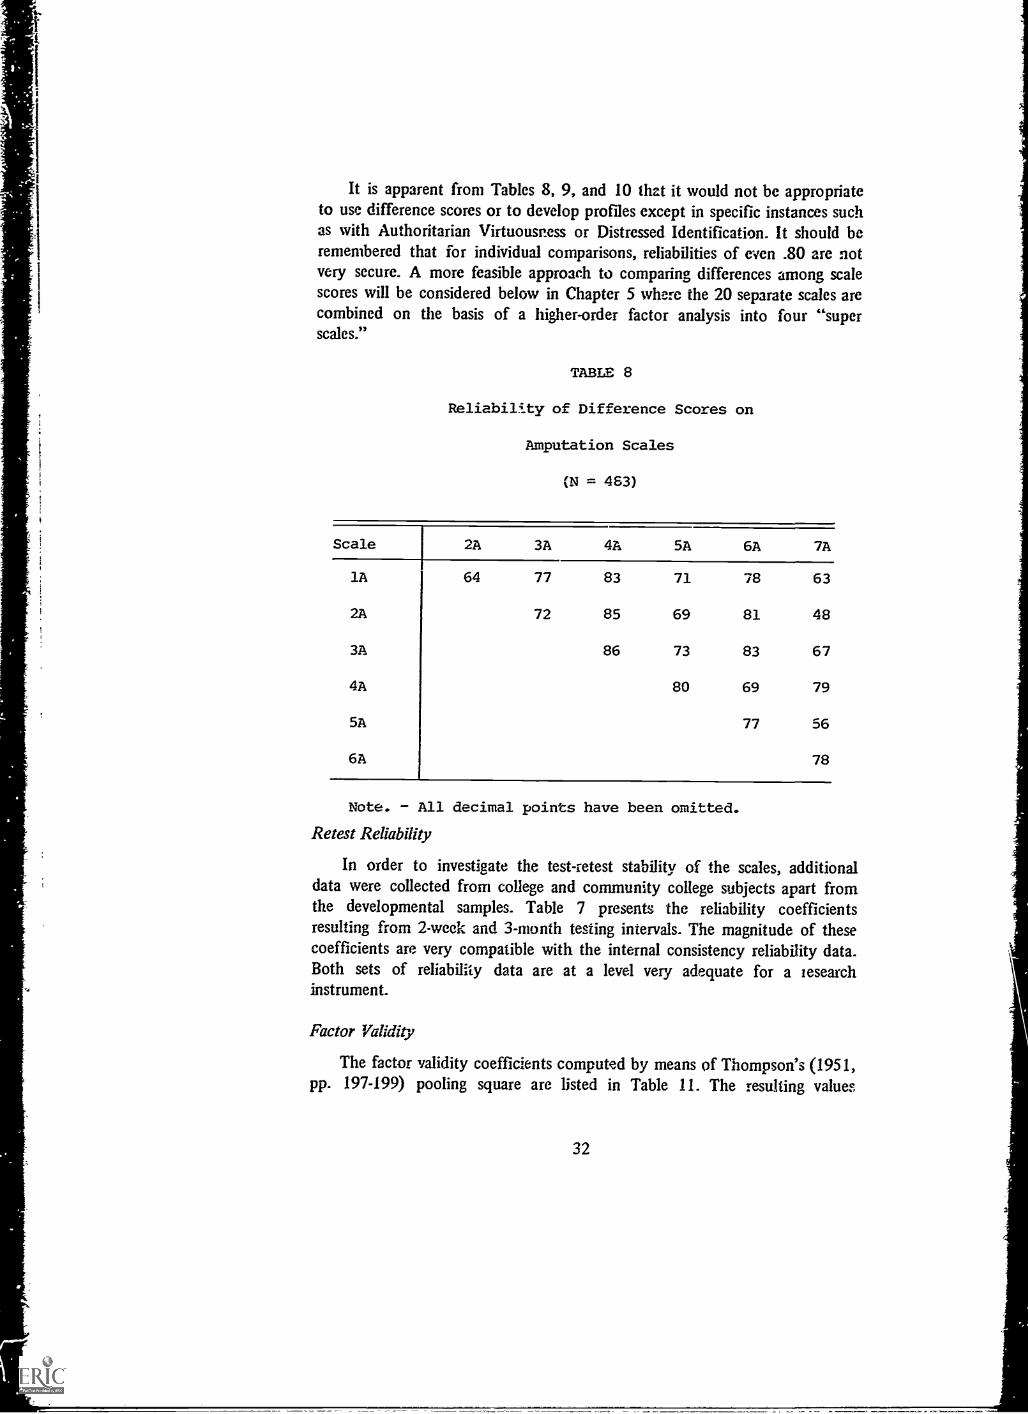
It is apparent from Tables 8, 9, and 10 that it would not be appropriateto use difference scores or to develop profiles except in specific instances suchas with Authoritarian Virtuousness or Distressed Identification. It should beremembered that for individual comparisons, reliabilities of even .80 are notvery secure. A more feasible approach to comparing differences among scalescores will be considered below in Chapter 5 where the 20 separate scales arecombined on the basis of a higher-order factor analysis into four "superscales."
TABLE 8
Reliability of Difference Scores on
Amputation Scales
(N = 463)
Scale I 2A 3A 4A 521 6A 7A
lA 64 77 83 71 78 63
2A 72 85 69 81 48
3A 86 73 83 67
4A 80 69 79
521 77 56
6A 78
Note. All decimal points have been omitted.
Retest Reliability
In order to investigate the test-retest stability of the scales, additionaldata were collected from college and community college subjects apart fromthe developmental samples. Table 7 presents the reliability coefficientsresulting from 2-week and 3-month testing intervals. The magnitude of thesecoefficients are very compatible with the internal consistency reliability data.Both sets of reliability data are at a level very adequate for a researchinstrument.
Factor Validity
The factor validity coefficients computed by means of Thompson's (1951,pp. 197-199) pooling square are listed in Table 11. The resulting values
32
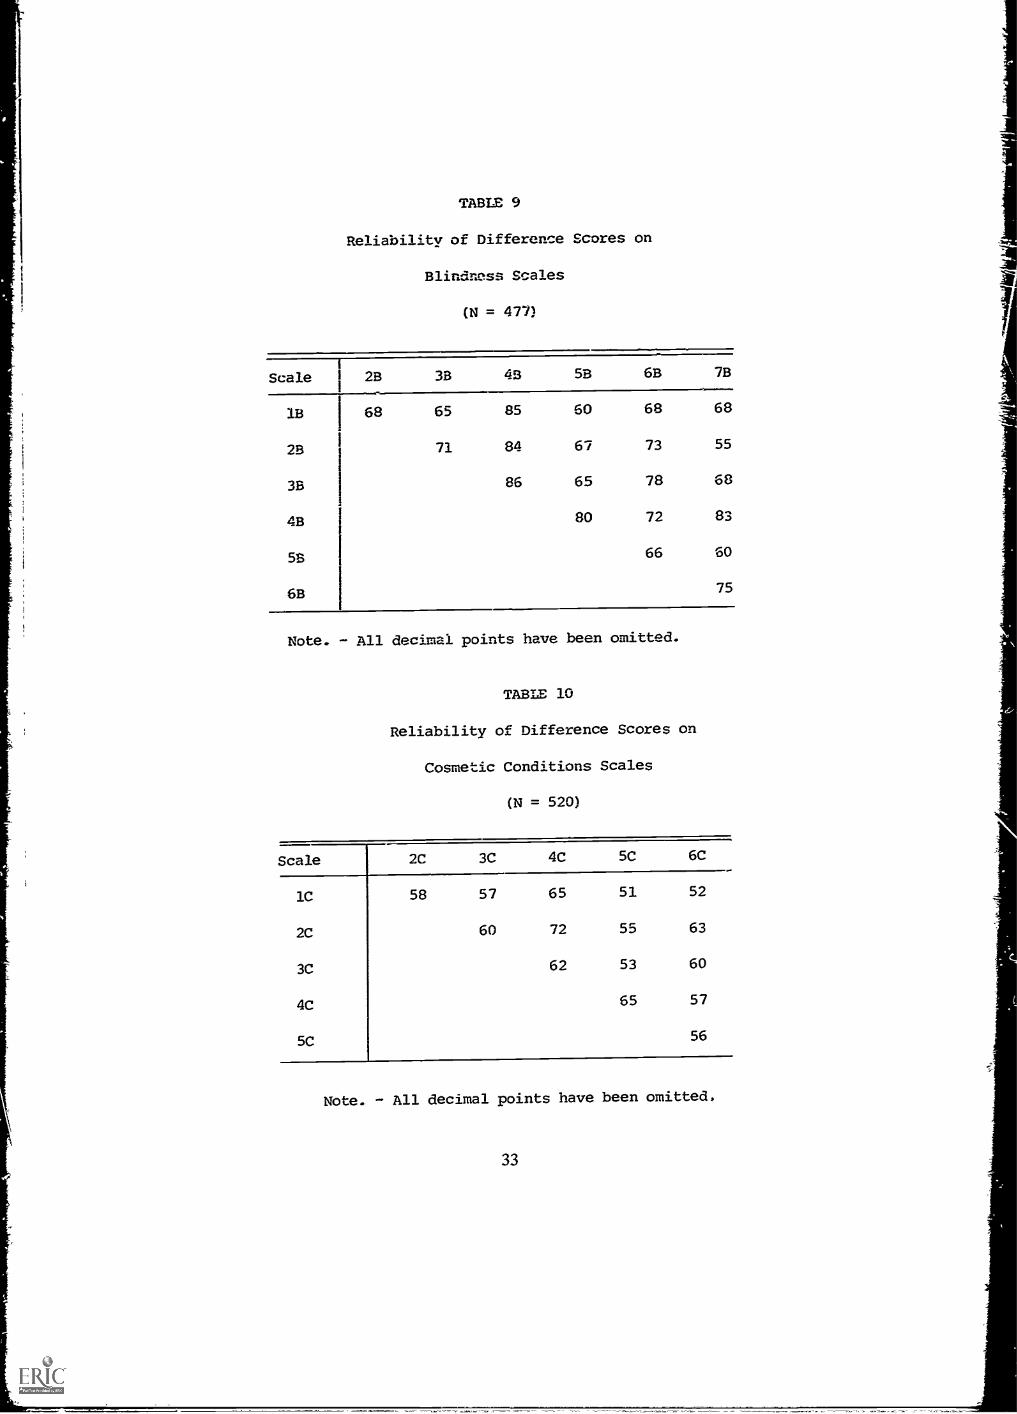
TABLE 9
Reliability of Difference Scores on
Blindness Scales
(N = 477)
Scale 28 33 43 58 6B 7B
13 68 65 85 60 68 68
28 71 84 67 73 55
33 86 65 78 68
4B 80 72 83
5B 66 60
6B 75
Note. All decimal points have been omitted.
TABLE 10
Reliability of Difference Scores on
Cosmetic Conditions Scales
(N = 520)
Scale 2C 3C 4C 5C 6C
1C
2C
3C
4C
5C
58 57
60
65
72
62
51
55
53
65
52
63
60
57
56
Note. - All decimal points have been omitted.
33

represent the correlation between the sum of a set of item scores and the
factor they share in common. These coefficients range from .64 to .93, and
for purposes of group comparisons are all quite satisfactory.
TABLE 11
Factor Validities for Disability Factor Scales
Amputation(N = 483)
Blindness(N = 477)
Cosmetic Conditions(N = 520)
Scale
FactorValidity Scale
FactorValidity Scale
FactorValidity
lA 82 113 71 1C 76
2A 74 2B 70 2C 83
3A 86 3B 84 3C 73
4A 92 4B 93 4C 78
5A 74 5B 66 5C 73
GA 74 6B 77 6C 75
7A 64 7B 72
Note. - All decimal points have been omitted.
Construct Validity
The major validational support for the various DFS instruments consists
of evidence bearing on their construct validity. The initial concern of any
factor-analytic study is the extent to which the resulting factors are
descriptive of the underlying domain. In this study, the original. input of items
was written with the intention of maximizing the inclusion of important basic
attitudinal dimensions. Further, the recurrence of factors over the successive
analyses (in the face of a variety of factorial procedures) suggests that a stable
and meaningful structure is being tapped. The duplication of the final factors
on the amputation and blindness questionnaires and the degree of overlap
with the DFS-C give additional support to the status of the factors as viable
constructs. Siller, et al. (1967), through content analysis of interviews,
identified a set of categories underlying reactions to the disabled. The degree
of correspondence between these categories and those represented in the DFS
is impressive. Certain of the categories are identical: i.e., Imputed Functional
Limitations of the DFS is equivalent to the interview-derived Functional
34
Limitations; Interaction Strain is the same as Strain in Social Interaction. With
but a few exceptions, the other interview categories are represented either as
distinct factors or as elements in more inclusive factors. The high degree of
congruence between the categories based upon interviews and those of theDFS further attests to the psychological meaningfulness of the latter.
The set of factors obtained by Whiteman and Lukoff (1964) in studying
sighted people's attitudes toward blindness, despite the small number andspecialized nature of the subjects upon which they were based, also emerged
in our own analyses either as individual factors or as important components of
a factor. That this occurred, even though Whiteman and Lukoff started with
initial instruments very different from ours, attests to both the inclusivenessand appropriateness of the factorial dimensions from which the DFS were
derived.Two external sources are also relevant to an assessment of the construct
validity of the DFS: the correlations of the DFS with demographic variables:,reviously shown to bear some relationship to attitudes toward the disabled,
and correlations between the DFS and the Attitude Toward Disabled Persons
Scale.Demographic Variables (1) Sex: Many previous studies have
demonstrated that females tend to have more favorable attitudes toward the
disabled than do males (e.g., Jabin, 1965; Si ller & Chipman, 1964b; Yuker et
al., 1966). Data on the DFS are consistent with this finding: females scored
higher on 12 of the 13 scales for which sex was shown to be a significant
variable. Only on Superficial Empathy (4C) was the direction reversed, with
males obtaining a higher mean.(2) Age-Education: An earlier study (Slier & Chipman, 1964b) noted that
high school students tend to be less favorable toward the disabled than areother age-education groups, such as junior high school or college students.This was true on the DFS as well: high school students obtained the lowest
mean score on 10 of the 16 scales which were significantly affected by the
Age-Education variable.(3) Contact: Degree of contact with the disabled was determined for the
amputation and blindness questionnaires (extensive vs. minimal or no contact).
In line with previous observations (Jabin, 1965; Siller & Chipman, 1964b)
those with extensive contact had more favorable attitudes than those with
little contact. Eleven of the 14 scales were significantly related to degree of
contact; respondents with extensive contact showed more favorable attitudes
on all of these scales.1°DFS ATDP Correlations Correlations between each of the 20 scales and
the ATDP were obtained for 65 physical therapy students and 22
10lnspection of the data indicated that this finding was not an artifact of the
inclusion of the physical therapy group.
35

undergraduate psychology majors (see Table 12).11 The patterns for bothgroups were identical: all the scales on the DFS-A and B, exceptAuthoritarian Virtuousness and Distressed Identification, correlated signifi-cantly with the ATDP. For the most part, for the larger group, these weremoderate correlations in the range of .30 to .45. On the DFS-C, onlyRejection of Intimacy and Interaction Strain were significantly correlated withthe ATDP. The presence of positive correlations between the ATDP andcertain of the Factor Scales supports the interpretation of these scales asmeasures of disability attitude. It has been suggested ( Siller, 1966b) that theATDP is essentially a rough measure of an affect dimension. The results ofzero-order and multiple correlations between the DFS and the ATDP arediscussed in Chapter 7 in terms of their meaning for the composition of bothinstruments.
Additional evidence bearing on the construct validity of the DFS wasavailable from the 40 undergraduate psychology majors taking a course inpsychometrics. Considering the relative homogeneity and specialized nature ofthis group, the findings must be considered as merely suggestive. Thesestudents were given all three DFS questionnaires along with various otherscales during the semester. The scales included the Kuder Preference Record,California Test of Mental Maturity, Henmon-Nelson Intelligence Test,Thurstone Interest Schedule, A-S Reaction Study, Allport-Vernon-LindzeyStudy of Values; and 22 of these students also took Siller's Disability SocialDistance Scale and Feeling Check List, as well as the ATDP as discussedabove. One indication of construct validity would be that tests believed to beirrelevant to the construct under examination would prove to be uncorrelatedwith it. This in fact occurred. Aside from the three disability instruments(ATDP, Social Distance Scale and Feeling Check List), the only measure thatshowed a substantial relationship with the DFS was the Ascendance score ofthe A-S Reaction Study. Fourteen of the 20 scales had significant negativecorrelations with this A-S score. That is, high ascendancy was related tounfavorable attitude. If ascendancy has a hostile component, as well it might,then this finding becomes explicable in the light of findings regarding therelationship of hostility to attitude toward the disabled (Jabin, 1965; Si ller etal., 1967).
Concurrent Validity
Concurrent validity information was obtained from the group of PhysicalTherapy students. It would be expected that such persons, having elected towork with the disabled, would have more favorable attitudes than the generalpopulation, and thus would obtain higher scale scores. This was indeed the
11The standard deviations of these groups (see Appendix B) do not suggestthat the correlations are appreciably attenuated by homogeneity.
36

TABLE 12
Correlations between Disability Factot Scales
and Attitude Towards Disabled Persons Scale
for Physical Therapy and Psychology Majors
Disability Factor ScalesPhysical Therapy
(N = 65)Psychology(N = 22)
IA Interaction Strain 31** 58**
2A Rejection of Intimacy 36** 63**
3A Generalized Rejection 33** 52*
4A Authoritarian Virtuousness 19 25
5A Inferred Emotfonal Consequences 40** 59*
6A Distressed Identification 06 24
7A Imputed Functional Limitations 29* 69**
1 Interaction Strain 29* 47*
2B Rejection of Intimacy 42 ** 48*
3B Generalized Rejection 40** 43*
4B Authoritarian Virtuousness 18 --01
5B Inferred Emotional Consequences 32** 45*
6B Distressed Identification 18 25
7B Imputed Functional Limitations 35** 60**
1C Interaction Strain 32** 56**
2C Rejection of Intimacy 40** 49*
3C Reluctant Aversion 05 32
4C Superficial Empathy 22 19
SC Qualified Aversion 19 41
6C Proximate Offensiveness 17 34
Note. All decimal points have been omitted.
*p < .05. For N = 65, r = .24; for N = 22, r = .42.
**p < .01. For N = 65, r = .31; for N = 22, r = .54.
37
case. On 17 of the 20 scales, the 93 physical therapy students had
significantly higher means than did the remainder of the Developmental
Samples.In summary, data from the DFS are consistent with previous findings in
regard to the relationships of sex, age-education and contact to attitudes
toward the disabled. Twelve of the 20 factor scales show moderate positive
correlations with a previously used instrument, the ATDP, while being
essentially independent of a host of measures of interests, values and
intelligence. There also is extensive congruence between the scales and a set of
interview-derived categories of attitude. Further, those who chose to work
with disabled persons obtained higher scores than did the general population
of respondents.The identification of discriminable dimensions of attitude in the disability
domain necessitates equivalent discriminations within criterion measures. It
can be expected that in the process of refining criterion measures to validate
the individual factor scales, conceptual clarification of some of the problems
of the attitudes toward the disabled will result.
Further research will be directed toward experimental manipulation of
variables (and conditions) in order to determine the behavioral correlates of
the individual scales, and to add to the assessment of their validity.
... 38
Chapter 5
RELATIONSHIPS AMONG SCALES
Although orthogonal rotational procedures were used for the factoranalyses of the items, the scale scores have varying degrees of intercorrelation.Had all of the items in a factor matrix been scored on all of the dimensions
with the appropriate regression weights, orthogonality would have beenpreserved. However, once the item clusters had been identified via orthogonaltechniques it no longer seemed useful to continue to locate the items on theorthogonal reference axes. By using the top loading items to form scales, and
by scoring items on only one scale each, orthogonality was precluded: rather,scales which reflect the actual clusterings of the items were produced.
The scale intercorrelation coefficients, while high in many instances, fall
appreciably short of the ceiling estimated by their internal consistencyreliability values. Put another way, these scale intercorrelations are not so high
as to persuade one that they are basically measuring the identical
phenomenon. In fact, enough reliable specific variance remains to justify theopposite assertion, as is shown by the reliabilities of difference scores inTables 8-10. From the magnitude of these reliabilities it can be concluded thatthese scales are tapping relatively distinct phenomena.
Table 13 is a master matrix of the scale intercorrelations within and
across questionnaires. Entries above the diagonal of the table show theintercorrelations between scales witlain each of the three questionnaires, and
are based on the development samples. The data below the diagonal presentthe same information on the Repeat Group; in addition, across-questionnaire
intercorrelations for this group are given.
1INTERRELATIONSHIPS OF SCALES WITHIN QUESTIONNAIRES
There are two 7 x 7 matrices for DFS-A and B respectively, and a 6 x 6matrix for DFS-C. The figures are based on the entire development sample
which completed each instrument. Pearson product-moment coefficients ofcorrelation range from .03 to .71, with the majority at the higher end of therange. Certain scales are highly intercorrelated, while Distressed Identification,Authoritarian Virtuousness and Superficial Empathy are relatively independent
of the other scales.
39

CD
TABLE 13
Intercorrelations of Scales within and between Questionnaires
(Developmental Samples and Repeat Group)
Amputation Blindness Cosmetic Conditions
Disability Factor Scale lA 2A 3A 4A 5A 6A 7A 1B 2B 3B 4B 5B 6B 7B 1C 2C 3C 4C 5C
Amputation Developmental SamplesDevelopmental E.Imples (above the diagonal):
lA Interaction Strain 71 63 39 57 34 62Amputation N = 483
2A Rejection of Intimacy 73 64 21 55 17 70Blindness N = 477
3A Generalized Rejection 66 69 28 56 17 59Cosmetic Conditions N = 520
4A Authoritarian Virtuousness 37 31 35 31 48 26Repeat Group (below the diagonal): N = 233
5A Inferred Emotional Consequences 62 61 59 36 22 60
6A Distressed Identification 30 21 23 41 20 16
7A Imputed Functional Limitations 67 76 65 22 68 18
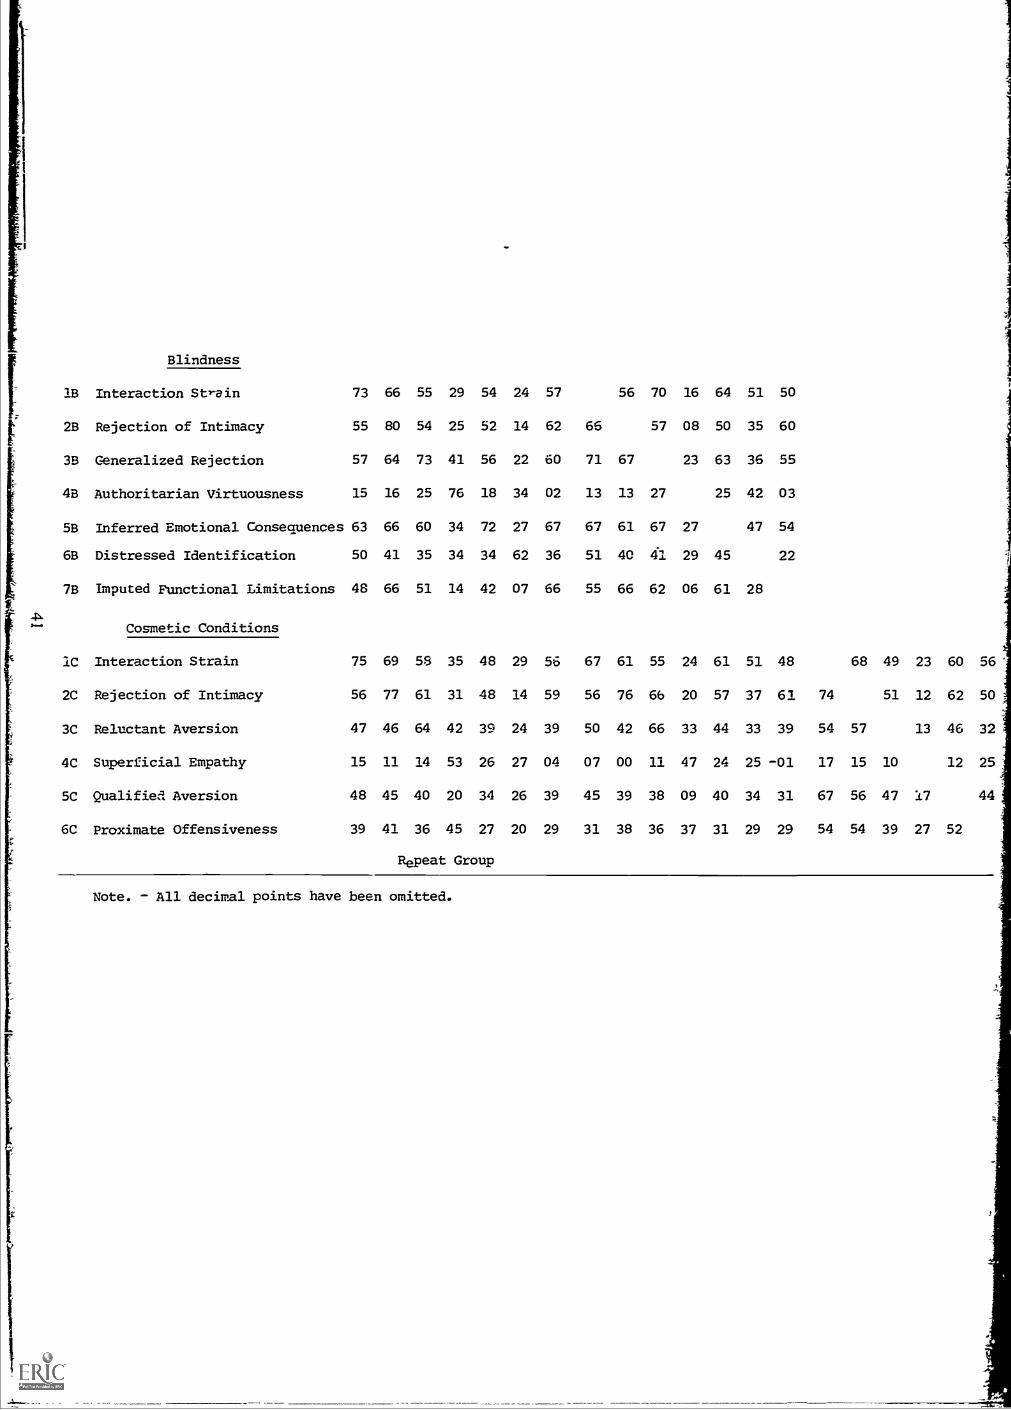
Blindness
lB Interaction Strain 73 66 55 29 54 24 57 56 70 16 64 51 50
2B Rejection of Intimacy 55 80 54 25 52 14 62 66 57 08 50 35 60
3B Generalized Rejection 57 64 73 41 56 22 60 71 67 23 63 36 55
43 Authoritarian Virtuousness 15 16 25 76 18 34 02 13 13 27 25 42 03
5B Inferred Emotional Consequences 63 66 60 34 72 27 67 67 61 67 27 47 54
6B Distressed Identification 50 41 35 34 34 62 36 51 40 41 29 45 22
7B Imputed Functional Limitations 48 66 51 14 42 07 66 55 66 62 06 61 28
Cosmetic Conditions
IC Interaction Strain 75 69 58 35 48 29 56 67 61 55 24 61 51 48 68 49 23 60 56'
2C Rejection of Intimacy 56 77 61 31 48 14 59 56 76 66 20 57 37 61 74 51 12 62 50
3C Reluctant Aversion 47 46 64 42 39 24 39 50 42 66 33 44 33 39 54 57 13 46 32
4C Superficial Empathy 15 11 14 53 26 27 04 07 00 11 47 24 25 -01 17 15 10 12 25
5C Qualified Aversion 48 45 40 20 34 26 39 45 39 38 09 40 34 31 67 56 47 17 44
6C Proximate Offensiveness 39 41 36 45 27 20 29 31 38 36 37 31 29 29 54 54 39 27 52
Repeat Group
Note. - All decimal points have been omitted.

INTERRELATIONSHIPS OF SCALES ACROSS QUESTIONNAIRES
Special provision had been made during the data collection phase of the
study to have a number of subjects take all three questionnaires so that thecorrelations among the 20 scales might be examined. This "Repeat Group,"described in Chapter 2, was quite substantial in size (N = 233). Comparison ofthe data from the Repeat Group to that of the total Developmental Sample
for each questionnaire showed that the data from the two are sufficientlysimilar, in terms of absolute values and of interscale patterns, to permitconsideration of all the data within a common frame of reference.
Tables 14 and 15 summarize the relationships of special interest amongthese scales. Scales with identical labels contain many items with the samestems, generally preserve the item order in terms of their factor loadings, and
show substantial correlation across questionnaires. In comparison, the
above-mentioned relationships are less strong among scales considered merely
analogous (i.e., 3A and B with C, and 4A and B with C); however, thecorrelations are still impressive.
In Table 14 identically labelled and analogously considered scales arearranged by their titles to illustrate their relationships to each other.
Entries in Table 15 are the coefficients of correlation between parallel
scales (i.e., scales listed on the same line in Table 14) and have beenabstracted from Table 13. An examination of these patterns should furtherexplicate the labelling process discussed earlier (Chapter 3) when the factors
were interpreted.
RELATIONSHIPS AMONG IDENTICALLY LABELLED SCALES
The correlations between the pairs of those scales which have identical
names on the three questionnaires (triads 1A, 1B, and 1C and 2A, 2B, and
2C) are the highest ones associated with these scales in the 20 x 20 Repeat
matrix. Scales 1C and 2C are the only scales of DFS-C with names identical to
those of DFS-A and B.When the seven identically designated scales of the Amputation and
Blindness questionnaires are considered (e.g., lA with 1B, 5A with 5B, etc.),the above assertion holds true for six of the seven pairs along this matrixdiagonal. (The single exception is the correlation between 7A and 7B which
was exceeded by one other coefficient, viz., that between 7A and 2A.) The
six coefficients in this diagonal are quite high when compared to the
correlations between the first two cosmetic scales and their identically named
amputation and blindness counterparts. Attenuation in strength of association
is to be expected here since the DFS-C is less similar to DFS-A and DFS-B in
terms of content than the latter questionnaires are to one another.Furthermore, the cosmetic scales have relatively lower reliabilities than the
42

TABLE 14
Concordance of Scales across Questionnaires
DFS-Amputation DFS-Blindness
1A Interaction Strain 1B Interaction Strain lc
2A Rejection of Intimacy 2B Rejection of Intimacy 2C
3A Generalized Rejection 3B Generalized Rejection 3C
4A Authoritarian Virtuousness 4B Authoritarian Virtuousness 4C
5A Inferred Emotional Conse-quences
53 Inferred Emotional Conse-quencet
6A Distressed Identification 6B Distressed Identification
7A Imputed Functional 7B Imputed Functional
Limitations Limitations
DFS-Cosmetic Conditions
Interaction Strain
Rejection of Intimacy
Reluctant Aversion
Superficial Empathy
5C Qualified Aversion
6C Proximate Offensivenes

TABLE 15
Intercorrelations between Identically and
Analogously Named Scales based on Repeat Group
(N = 233)
Scales r r rAB BC AC
1 73 67 75
2 80 76 77
3 73 66 64
4 76 47 53
5 72
6 62
7 66
Note. - All decimal points have been omitted.
others and, consequently, their maximum possible correlations will also be
more restricted. This is particularly true in the case of scale 4C, Superficial
Empathy, where the rtt = .62.
Relationships among Analogous Scales
Pairs 3A with 3B and 4A with 4B are two of the seven pairs of
amputation and blindness scales referred to in the section on identically
labelled scales. Because cosmetic scales 3C and 4C show a correspondence to
3A and B and 4A and B respectively, the former are called analogues of the
latter. In regard to the actual magnitudes of their correlation coefficients, the
DFS-C mem,,ers of each triad are the more weakly associated ones fur the
reasons previously mentioned. What is more to the point, however, is that
despite the generally lower cosmetic intraquestionnaire and interquestionnaire
coefficients these two scales (like the cosmetic scales in the two identically
labelled triads) have their highest correlations with their amputation and
blindness analogues or counterparts.
44
Effects of Identical Item Stems
As noted earlier (p. 44), pairs of scales with identical names and thoseconsidered analogous contain a number of items with the same or very similar
seems (e.g., for scale 1A, "I feel uneasy when I come near an amputee" andfor scale 1B, "I feel uneasy when I come near a blind person"). The degree towhich overlapping item stems per se contribute to the correlation between theaforementioned scales was investigated. Whereve. identical (or very similar)item stems occurred between two scales one was dropped while the other wasretained. Care was taken to maximize the internal consistency reliability of
these new scales. The abbreviated scales were rescored and intercorrelated. The
magnitude of the correlation coefficients remained essentially unchanged. This
indicates that the across-questionnaire correlations between scales which tapthe same dimensions are a function of the content of those scales rather than
an artifact of item stem identity or similarity.
QUASI-SECOND-ORDER RELATIONSHIPS AMONG SCALES
The substantial correlations among many of the scales (see discussion p.
39) indicated that a higher order factor analysis would be justified.Technically, the term "second-order" refers to factors derived from oblique(correlated) rather than orthogonal (independent) rotational procedures. The
term "quasi" win be used to indicate that these higher-order factors wereobtained from scales derived from orthogonal rotation. It is likely that thesame number and kinds of factors would have been obtained had obliquerotation been used to establish the basic scales (Nunnally, 1967). Assumingthis similarity in outcome on the initial factor level, it would follow that very
little practical difference in the higher order factor structure would haveresulted from using oblique procedures initially.
The 20 x 20 matrix of scale correlations, based on the Repeat Group, wasitself factor-analyzed by a principal components procedure in order to identify
the "underlying" structure in a minimum of meaningful dimensions.
Examination of several varimax solutions led to the acceptance of afour-factor rotation as the most satisfactory approximation of this goal. Table
16 contains the results of this factorial solution.The effect of the factor analysis was to "pull out" a major affective
element for the amputatio7.) and the blindness area combined, and for thecosmetic area by itself (albeit with some high secondary loadings on theformer). The remaining two factors clearly consisted of the previouslyestablished Distressed Identification and Authoritarian Virtuousness-Superficial
Empathy clusters.
45

TABLE 16
Rotated Quasi-Second-Order Factors of Repeat Group Scale Scores
(N = 233)
Varimax Factors
ScaleNet
AffectAuthoritarianVirtuousness
DistressedIdentification
CosmeticAversion
2
7A 83 -03 lA 71
2A 80 05 13 36 78
5B 77 20 25 12 71
3B 76 25 05 26 70
2B 73 00 04 38 69
7B 72 -04 -03 24 58
5A 72 21 20 05 60
3A 71 22 08 27 64
1B 69 03 31 30 66
lA 66 08 39 32 70
3C 46 30 06 44 49
4A 22 86 14 15 84
4B 06 83 08 12 71
4C 01 57 21 06 37
6B 29 19 70 21 66
6A 08 30 66 09 55
1C 50 09 32 66 80
5C 28 04 25 64 55
2C 61 11 -02 64 79
6C 19 32 07 62 53
Ea? 6.57 2.31 1.58 2.62 13.08
CommonVariance .50 .18 .12 .20 1.00
Note. - All decimal points are omitted from the factor loadings.
46

ft
t
,
Description of Quasi-Second-Order Factors
Factor I - Net AffectEleven scales (IA, 2A, 3A, 5A, 7A, 1B, 2B, 3B,5B, 7B, and 3C) had primary loadings on this factor which accounted fc,r 50%of the estimated common variance of the scales. While this factor undoubtedlyencompasses both cognitive and conative attitudinal components, its mostsalient characteristic is its affective component. The scale content indicatesthat the affect dimension is a broad one and is not limited to a pro-con orhostile-friendly dimension, and that anxiety, annoyance, disgust, etc., enterinto it. Nevertheless, it may be characterized in terms of a netfavorable-unfavorable continuum. As such, this factor would be similar tomost existing disability measures, like the ATDP, that appear to be tappingthe net affect dimension (Si ller & Chipman, 1964b). (See Chapter 7.)
Some of the factor's cognitive components, i.e., the perceptions, beliefs,expectations held in regard to these disabilities, revolve around' therespondents' judgments of the disabled person's ability to master hisenvironment. Others refer to meanness of character and emotionalmaladjustment as attributes of people with such handicaps. Conativecomponents involve the rejection of intimate relations, e.g., in familialsituations, as an accompanying "policy orientation" toward those withphysical impairment.
Factor II Authoritarian Virtuousness12Scales 4A, 4B, and 4C werethe ones with highest loadings on this factor; it carried 18% of the estimatedcommon variance. Earlier discussions (see Authoritarian Virtuousness inChapter 3) indicated that some kind of authoritarian constellation emergedduring each of the successive stages of refinement of the DFS. it is notsurprising, therefore, to find that this constellation factored out separatelyagain. Its successive appearances lead to increasing confidence in its potencyand validly. It is also worth noting that all three questionnaires arerepresented among its component scales.
While there is less similarity in item content, for obvious reasons, betweenSuperficial Empathy (4C) and the two Authoritarian Virtuousness scales, theitems of all three have a patronizing quality. A review of the descriptions ofthe three constituent scale factors will explicate the meaning of this"second-order" factor.
Factor III Distressed IdentificationThe two scales with primaryloadings on this factor were 6A and 6B, the Distressed Identification scales ofthe amputation and blindness questionnaires. This factor accounted for 12%
12In the text where first-order and "second-order" factors or scales might beconfused, the former will be followed by a parenthesis containing thequestionnaire initial and the scale number. For example, AuthoritarianVirtuousness would refer the "second-order" factor while AuthoritarianVirtuousness (4A) refers to the first-order amputation scale.
47

of the estimated common variance, and the discussions of the individual scalesoffered in the previous sections should be referred to. It is interesting to notethat the three Interaction Strain scales (1A, 1B, and 1C) were the only otherscales to have secondary loadings over .30 on this factor. The phenomenon ofdistressed identification appears to play a role in producing the difficultiesconnected with interacting with the disabled as measured by InteractionStrain.
Factor IV Cosmetic Aversion The four scales (1C, 2C, 5C, and 6C)with principal loadings on this factor all come from the DFS-C. This is thesecond most powerful factor from the stanupoint I the number (four) ofscales loading on it and the percentage (20) of estimated common variance forwhich it accounted. Three of the four scales have top-loading items personallyaversive in nature, and the fourth (Interaction Strain) contains hostile andrejecting items as well, albeit with lesser loadings. Scales 1C and 2C have veryhigh secondary loadings on the first factor (.50 and .61 respectively).Conversely, five of the eleven scales on Factor I have loadings of .30 orgreater on this factor. Obviously, there is a highly complementary relationshipbetween Factors I and IV with affect as a common theme. One could expectthat if a third-order factoring were performed these two would coalesce.
Establishment of Quasi-Second-Order Factor Scales
The "second-order" factors were treated as scales by summing the scoreson those individual scales loading highest on a particular factor. Summarystatistics for the resulting four "super-scales" are entered in Table 17. Eachcombination of first-order scales provides some gain in internal consistencyreliability over the individual scales of which it is made up (Tryon's varianceform of the general formulae for the reliability coefficient; Tryon, 1957).
Table 18 contains a matrix of the product-moment correlationcoefficients among the four super-scales, and it also indicates the reliabilitiesof difference scores between the scales.
Five of the six intercorrelations of these "second-order" scales result incoefficients of moderate size; the sixth, between Net Affect and CosmeticAversion, is greater. All have p-values well below .01. Since both the NetAffect and the Cosmetic Aversion scales have very high reliability coefficients,there still are substantial amounts of reliable specific, as well as common,variance reinaining. Therefore these two super-scales could, with equaljustification, be treated either separately or together depending upon thecircumstances.
The magnitude of the coefficients of reliability of difference scoresindicate that if used with discretion all four super-scales could provide usefulinformation for profile analysis.
48
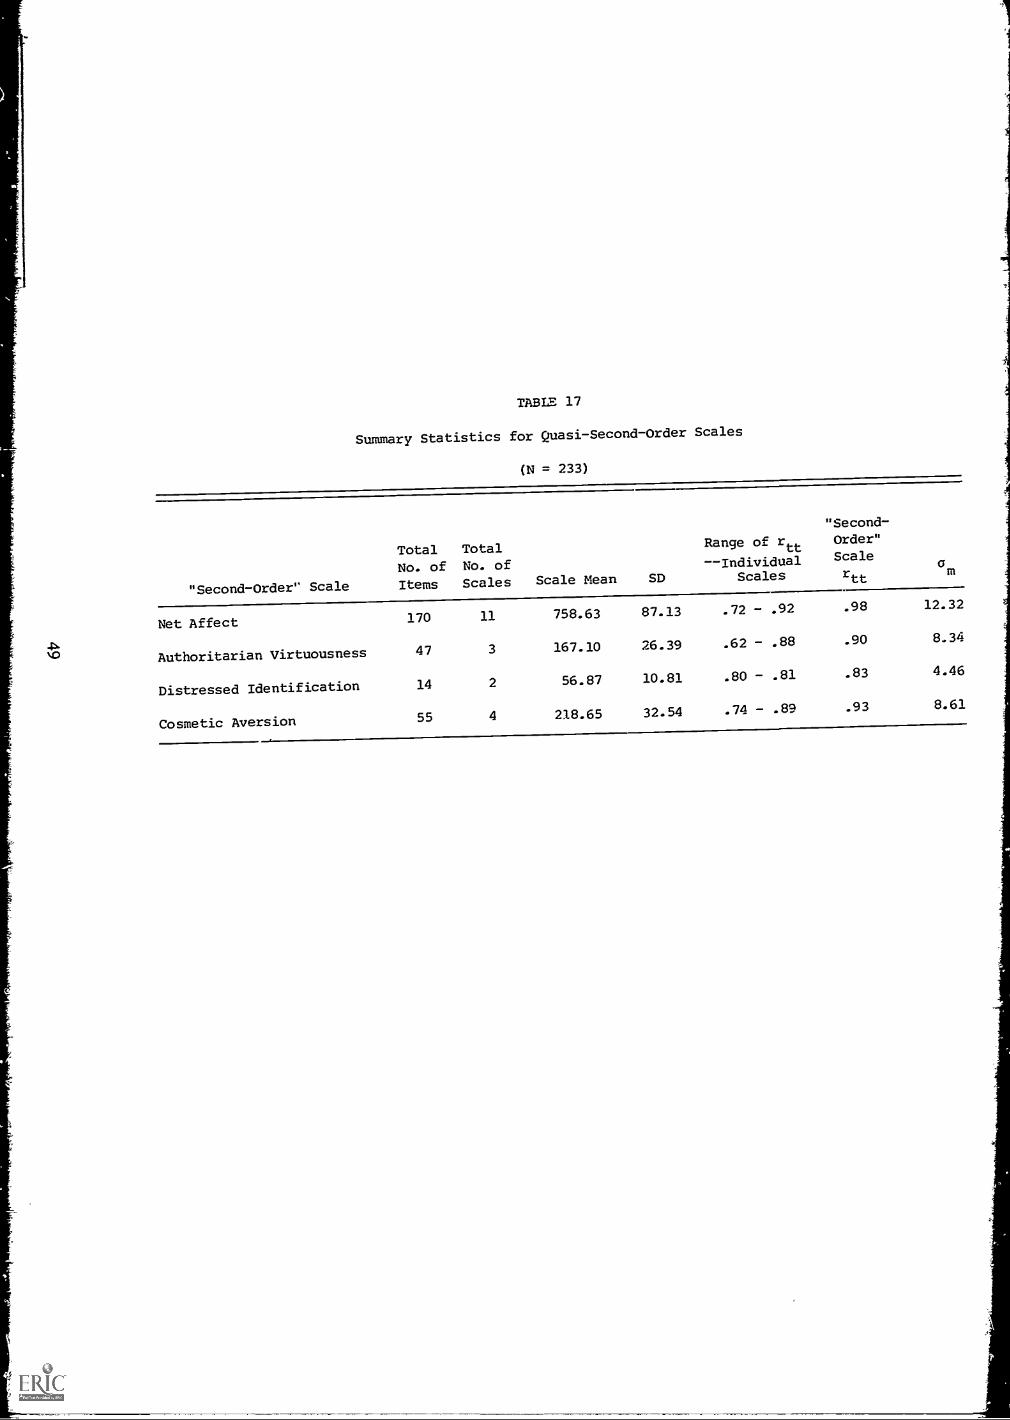
TABLE 17
Summary Statistics for Quasi-Second-Order Scales
(N = 233)
"Second-Order" Scale
"Second-
Total TotalRange of rtt Order"
No. of No. of --Individual Scale
Items Scales Scale Mean SD Scales rttam
Net Affect 170 11 758.63 87.13 .72 - .92 .98 12.32
Authoritarian Virtuousness 47 3 167.10 26.39 .62 - .88 .90 8.34
Distressed Identification 14 2 56.87 10.81 .80 - .81 .83 4.46
Cosmetic Aversion 55 4 218.65 32.54 .74 - .89 .93 8.61

Implications of the "Second-Order" Scales
For the researcher whose interest in estimating a group's attitude towarddisability lies in higher levels of generalization, these "second-order" scalesshould prove highly useful. They are likely to have value in tapping over-allfeelings not only toward the disability types directly referred to in thequestionnaires, but also toward disability in general. Should researchrequirements dictate a finer degree of discrimination than the gross continuaprovided by these scale combinations, the separate use of the first-order scalescores would be appropriate.
Obviously, for some of the "second-order" factors, such as Net Affect,combined scores using fewer than all three questionnaires would be feasible.
However, before variants of this kind are employed, it would be best toexplore the properties of the entire set of questionnaires. From the results
shown in Table 16, there would be justification for using the sums of the rawscores obtained on the relevant scales of the amputation or blindnessquestionnaires alone (following the procedure for super-scale I). The reliabilityof a simple summed score of those five scales on amputation which have thcirmajor loadings on Factor I was .96. The same reliability coefficient of .96 wasfound for the summed scores of the five scales of the blindness questionnairewhich loaded on that factor. When the ten amputation and blindness scales onFactor I were combined summatively, the reliability coefficient was .98.
TABLE 18
Intercorrelations and Reliability of Difference Scores
among Quasi-Second-Order Scales
(N = 233)
"Second-Order" ScaleAuthoritarian Distressed
Net Affect Virtuousness Identification
Authoritarian Virtuousness
Distressed Identification
Cosmetic Aversion
31
46
77
(91)
(82)
(80)
40
34
(77)
(87) 43 (79)
Note. - All correlations are significant well beyond the .001 level.
All decimal points have been omitted. Numbers in parentheses are relia-
bility of differences scores.
50
0.111,11,4 .0".1...
Three Net Affect scores were computed using ill 11 scales for one, the
five on amputation for the second, and the five on blindness for the third.
These were correlated with ATDP scores of 89 psychology and physical
therapy undergraduates. The respective correlation coefficients were .54, .56,
and .50. Net Affect Amputation correlated .83 with Net Affect Blindness. The
part-whole correlations of Net Affect Amputation and Net Affect Blindness to
the 11-scale Net Affect score were .95 and .96 respectively. A good degree of
interchangeability seems possible.
51

Chapter 6
RELATIONSHIPS OF SCALE SCORES TO DEMOGRAPHIC VARIABLES
The basic reference groups (the Developmental Samples) from which the
data were gathered consisted of the 483, 477, and 520 persons who responded
to the amputation, blindness, and cosmetic conditions pre-scale questionnair::,
respectively. Demographic data covering age, education, and sex were obtained
from all of these sabjects. Respondents to the amputation and blindness
questionnaires also provided information on whether they had had much
contact with that particular type of disabled person. Within each of the three
Developmental. Samples various subgroups were identified, and analyses of
Heir scale scores are presented below and in previous sections of this report.
Appendix B contains the means and standard deviations of each scale for
these various groups.An examination of the relationships of age, sex, education, and contact to
scale scores was made by dividing the Developmental Sample for each
questionnaire on the basis of sex and of age and education. This sorting
provided the basis for a 2 x 3 analysis of variance where scale score cell
entries were grouped by Sex a Id by Age-Education (age < 20, education < 12
years; age > 20, education < 12 years; some college regardless of age).
Contact had to be analyzed separately; thus its interaction with other variables
could not be assessed. The results of these statistical tests are listed in Table
19. Estimated w2 values are entered so that for those comparisons which
produced significant F-values the strength of association can be readily seen.
Sex Differences
Four of the amputation scales, five from blindness, and four of the
cosmetic scales had F-values significant beyond the .05 level. Mean scores for
females were higher on 12 of the 13 scales for which sex is a significant
variable. The one exception was Superficial Empathy from DFS-C. However,
examination of the estimated w2's indicates the triviality of the relationships
between sex and scale scores. The degree of relationship is so small that
separate sex norms are not warranted. (Also see Table 20.)
Age and Education
Table 19 shows that scores obtained on 16 of the 20 scales aresignificantly related to age and education. Inspection of Table 20 shows that
education, more than age, is the primary contributor to these results.
52
2
Exceptions are Rejection of Intimacy on all three questionnaires and ImputedFunctional Limitations on DFS-B where age correlates significantly whileeducation does not. Those with no college education are invariably moreaversively inclined, with the effect usually due to the contribution of the highschool, rather than to the adult noncollege, group. The role of education ismost pronounced on the two Authoritarian Virtuousness scales.
Interaction of Sex and Age-Education
The four interactions which had significant F-values were all trivial,according to their estimated co2's.
Contact
Eleven of the fourteen comparisons were statistically significant. Butagain, the strength of association was low, although for all, those with morecontact obtained more favorable scores.
DEMOGRAPHIC VARIABLES AS PREDICTORS OF SCALE SCORES
The contributions of the demographic variables to the variance of thescale scores was more directly examined by treating them as independentvariables. The four variables associated with DFS-A and DFS-B and the threerelevant to DFS-C were combined in multiple prediction equations, and R'swere obtained with each factor scale as the dependent (predicted) variable.Table 20 presents the zero-order product-moment and multiple correlationsfor each scale.
The zero-order correlations confirm the conclusions drawn from the prioranalysis of the estimated w2 values. No substantial relationships between scalescores and demographic data are to be found in this study, barring those ofthe previously mentioned Authoritarian Virtuousness scales (4A and 4B).These scales yielded zero-order correlations with education of .51 and .48.
In general, the demographic variables do not seem to be of anysubstantial further import when their joint effects are assessed in the form ofmultiple R's with each scale. In the instance of the two AuthoritarianVirtuousness scales, using all of the demographic variables leaves the multipleR's unchanged (.51 and .48 respectively) from the zero-order correlation witheducation alone. These coefficients mean that education accounts for 26% and23% of the variances of scales 4A and 4B respectively. So far as the wmainingscales are concerned, the next highest R's are associated with scales 1A, 3B,and 6B; in each case the value of R is .39, meaning that only 15.2% of thevariance of the scale scores is accounted for by the demographic variables.
In all, these findings indicate that there is no need to develop separatenorms based on the demographic variables used in this study.
I\ 53

CA
TABLE 19
Estimated w2 Values Associated with Significant F Values
Derived from Analysis of Variance of Scale Scores by Demographic Variables
Scale
Demographic Variable
Age and Sex x Age &
Sex Educationa EducationContact
Amputation (N=483)
1A Interaction Strain.02(**)
b .03(**).05(**)
2A Rejection of Intimacy.02(**) .01(*)
.04(**)
3A Generalized Rejection.02(**) .05(**) .02(**)
.01(**)
4A Authoritarian Virtuousness.14(**)
5A Inferred Emotional Consequences
.01(*)
6A Distressed Identification.06(**)
7A Imputed Functional Limitations .03(**).02(**)

Blindness (N=477)
1B Interaction Strain .06(**) .01(X) .O1( *) .03(**)
2B Rejection of Intimacy .01(*) .02(**) .06(**)
3B Generalized Rejection .04(**) .07(**) .01(*) .02(**)
4B Authoritarian Virtuousness .16(**)
5B Inferred Emotional Consequences .04(**) J01(*)
6B Distressed Identification .09(**) .04(**)
7B Imputed Functional Limitations .04(**) .03(**) .05(**)
Cosmetic COnditions (N=520)
trltit
1C Interaction Strain .01(*) .01(**) .01(*)
2C Rejection of Intimacy .03(**) .08(**)
3C Reluctant Aversion .02(**) .07(**)
4C Superficial Empathy .01(*) .04(**)
5C Qualified Aversion
6C Proximate Offensiveness .09(**)
aThe population was divided into the following three groups: Age<20 and education < 12 years;
age > 20 and education S 12 years; and education > 12 years.
bNumbers are 632 values; (*) indicates F value p L. .05, (**) indicates F value p.c. .01.
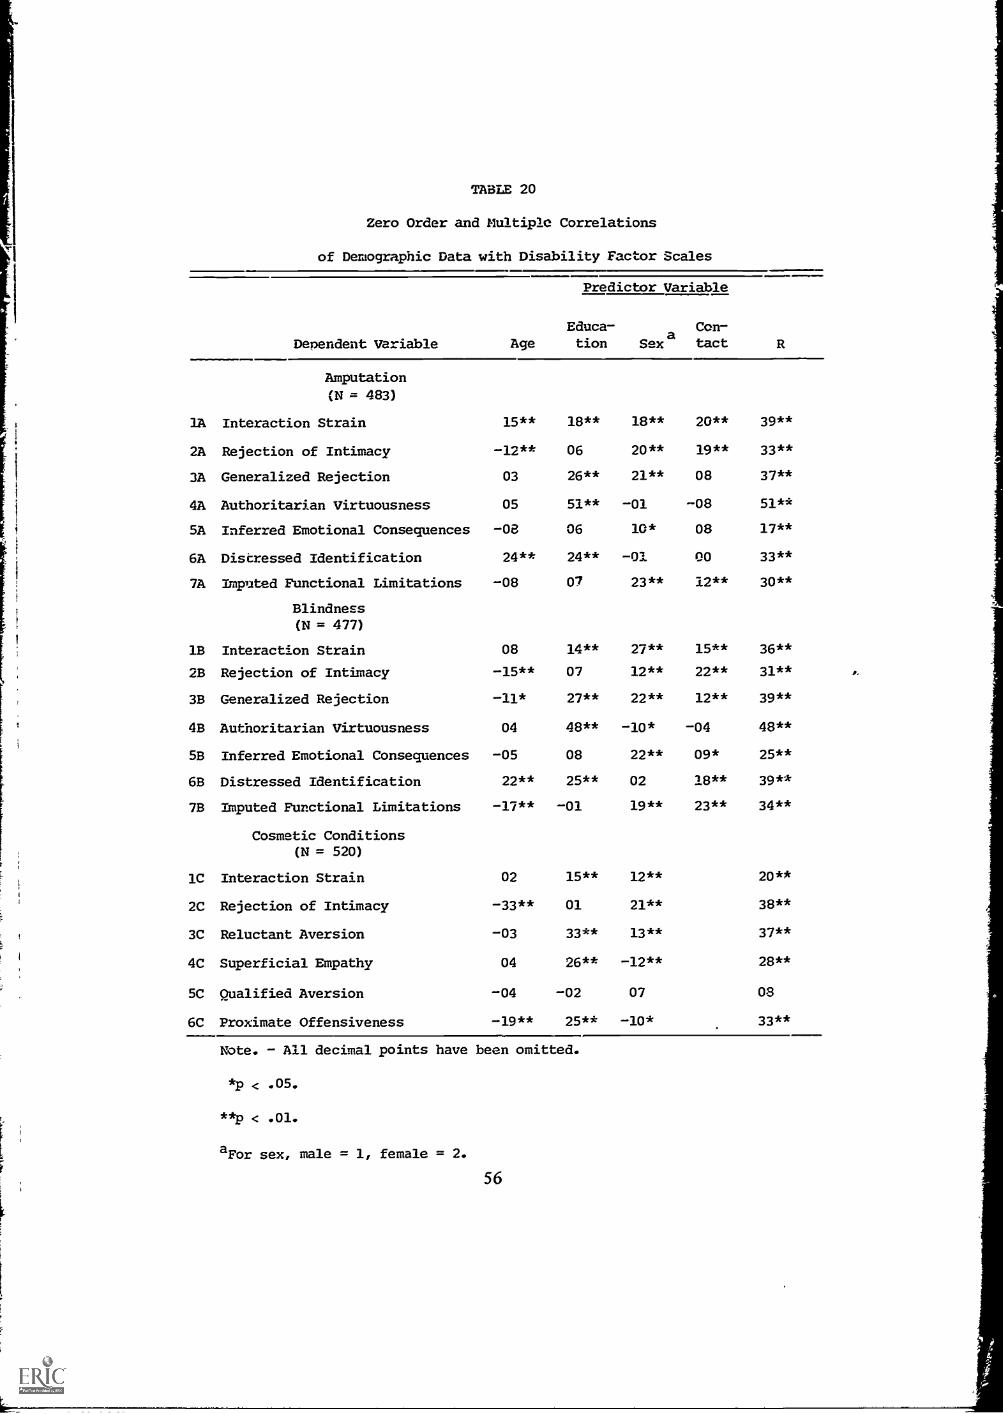
TABLE 20
Zero Order and Multiple Correlations
of Demographic Data with Disability Factor Scales
Predictor Variable
Dependent Variable AgeAgeEduca-tion
Cona
tact
Amputation
(N = 483)
lA Interaction Strain 15** 18** 18** 20** 39**
2A Rejection of Intimacy -12** 06 20** 19** 33**
3A Generalized Rejection 03 26** 21** 08 37**
4A Authoritarian Virtuousness 05 51** -01 -08 51**
5A Inferred Emotional Consequences -08 06 10* 08 17**
6A Distressed Identification 24** 24** -01 00 33**
7A Imputed Functional Limitations -08 07 23** 12** 30**
Blindness(N = 477)
18 Interaction Strain 08 14** 27** 15** 36**
2B Rejection of Intimacy -15** 07 12** 22** 31**
3B Generalized Rejection -11* 27** 22** 12** 39**
4B Authoritarian Virtuousness 04 48** -10* -04 48**
5B Inferred Emotional Consequences -05 08 22** 09* 25**
6B Distressed Identification 22** 25** 02 18** 39**
7B Imputed Functional Limitations -17** -01 19** 23** 34**
Cosmetic Conditions(N = 520)
1C Interaction Strain 02 15** 12** 20**
2C Rejection of Intimacy -33** 01 21** 38**
3C Reluctant Aversion -03 33** 13** 37**
4C Superficial Empathy 04 26** -12** 28**
5C Qualified Aversion -04 -02 07 OS
6C Proximate Offensiveness -19** 25** -10* 33**
Note. - All decimal points have been omitted.
*p < .05.
**p < .01.
aFor sex, male = 1, female = 2.
56
Chapter 7
THEORETICAL IMPLICATIONS
The preceding chapters have been devoted to a presentation of theprocedures involved in developing the Disability Factor Scales and to adiscussion of the psychometric characteristics of these instruments. However,the process of producing these scales has also shed considerable light onseveral important theoretical issues regarding the properties and the structureof the whole domain of attitudes toward disability. Five of these issues werelisted in Chapter 1, and some relevant findings will be discussed here briefly.
THE NATURE OF THE COMPONENTS OF ATTITUDES TOWARDSPECIFIC DISABILITIES
Findings relevant to this problem emerged from the factor analyses ofitems. The derivation of seven amputee, seven blindness, and six cosmeticconditions factors of good stability indicates that a multidimensional, ratherthan unidimensional, space is involved. The nature of each obtained dimensionhas been indicated, and although the specific name given to each factor maybe modified in the light of further information, psychologically importantcategories have been identified. The self-report nature of the stimulus materialsharply limits the extent to which dimensions involving more unconsciousprocesses could be represented. Thus, it would be difficult in such aninstrument to elicit sham; mortification and guilt, which have been identifiedin interviews (Si ller et al., 1967). Nevertheless, the Distressed Identificationfactors clearly imply aspects of castration anxiety, while the operation of stillother dynamically determined processes is readily suggested by other factors.We believe that the major salient dimensions of attitudes in this area havebeen identified for those working within the self-report framework. Theinclusiveness of the DFS dimensions can readily be tested by means of amultiple regression equation in which the various factor scales are used jointlyto predict any index of attitude toward disability.
The immediate conclusion from the three DFS questionnaires is that aunidimensional measure in this area will describe only part of the attitudinaldomain. If a unidimensional measure is desired the discussion of the NetAffect factor in the preceding chapter and that below on "The Relationshipsamong Attitudinal Components" should be reviewed.
57

THE GENERALITY OF ATTITUDINAL COMPONENTSACROSS DISABILITIES
The principal data on this point was reflected in Table 14 which showsthat it was possible to match all seven scales on amputation with those ofblindness, and with two of the cosmetic scales. Two other scales on theDFS-C were found to be analogous to scales on the other questionnaires. Thetwo remaining dimensions of the cosmetic questionnaire, Qualified Aversionand Proximate Offensiveness, reflected aspects of cosmesis without functionalimplications. The items dealing with functional conditions that were includedin the early item pool as orienting variables were completely absent from thefactors which evolved.
It appears, therefore, that while there are components of attitude whichcut across disability types, others are unique to a specific kind of impairment.Even for those sea/es that cut across disabilities, there is reliable variancewhich is specific to the condition reflected in the particular questionnaire.
The data give support to conceptualization of the attitude domain ashaving widely general as well as important disability-specific dimensions.
THE RELATIONSHIPS AMONG ATTITUDINAL COMPONENTS
The quasi-second-order factors provide a sound basis for conceptualizingthe relationships among the scales in hierarchical terms. The four-way divisionof the 20 factor scales into Net Affect, Authoritarian Virtuousness, DistressedIdentification and Cosmetic Aversion "second-order" factors reflects anunderlying organization which efficiently summarizes the distribution of thecommon variance of the first-order scales. Although the Net Affect andCosmetic Aversion "second-order" scales undoubtedly could be collapsed intoone "third-order" factor, the Distressed Identification and AuthoritarianVirtuousness super-scales do not lend themselves to further reduction.
As indicated above (Chapter 5), the hierarchical organization of scalespermits a flexible utilization of the DFS; the use of either first-order or"second-order" measures can be determined by the needs of a particularstudy.
It is our belief that most existing scales in the disability domain arediffuse and unreliable measures of the net affect dimension. A test of thisassertion was made with a group of 89 persons (physical therapy andpsychology undergraduates) who took the three DFS questionnaires as well asthe ATDP. The correlations between first-order scales of the DFS and theATDP indicated that significant correlations resulted only with those scalesbelonging to either the Net Affect or Cosmetic Aversion "second-order"factors. Correlating the ATDP with the four second-order factor scales resultedin the following coefficients: Net Affect r = .54, Authoritarian Virtuousness r
58
= -.12, Distressed Identification r = .11, and Cosmetic Aversion r = .34.Computation of multiple R's, using the four "second-order" scales as
predictors of ATDP scores, resulted in a coefficient of .60 which is not muchhigher (although p < .05) than the .54 correlation between the ATDP and Net
Affect alone. In size, the correlations are precisely in line with theexpectations that the Authoritarian Virtuousness and Distressed Identificationscales would be relatively independent of the ATDP and that the Net Affectand Cosmetic Aversion scales would correlate moderately with it. The ATDPmight then be characterized as drawing its major reliable variance from theaffect dimension. The DFS has an advantage over the ATDP even as a measureof disability-related affect as it provides greater specificity through theseparate first-order factor scales and uniformly higher reliabilities of both thefirst- and "second-order" scales.
THE CONSISTENCY OF ATTITUDES OF INDIVIDUALSWITHIN AND ACROSS DISABILITY TYPES
The Repeat Group of 233 persons who took all three questionnairesprovided information on this question. Inspection of Table 13 shows that withrare exceptions, the intercorrelations of scale scores are significant well
beyond the .01 level. Thus, not only is a person whos is favorable along onedimension of attitude within a questionnaire likely to be favorable on otherdimensions, but a similar trend is present even on the scales of the otherquestionnaires. To a considerable extent, this relationship is highest on theidentical or analogous scales (see Tables 13 and 15). That is, despite thetendency of scales within a disability type to correlate most highly with oneanother, for this sample the basic dimensions of attitudes across disability
types serve as the more potent forces. For example, the Interaction Strainscales of the three questionnaires intercorrelated more highly with each otherthan they did with others within their respective questionnaires.
Whiteman and Lukoff (1962) found that a fair prediction could be madefrom one attitudinal component regarding "physical handicap" to the sameattitudinal component regarding "blindness." On the other hand, in contrastto our data, they also found " .. . if one attempts to predict from anattitudinal component regarding physical handicap to a different attitudinalcomponent dealing with blindness, prediction falters." Whiteman and Lukoff,again unlike us, found that the relationship between components, even thoughwithin a given disability (blindness or physical handicap), is poor.
The discrepancies between the two studies might be accounted for inseveral ways. Whiteman and Lukoff used various kinds of item format fromwhich indices measuring the attitudinal components were derived. A numberof the comparisons aoparently were based on single items, thereby limiting thereliability of the data. The present study, anticipating the possibility of
59
instrument factors influencing the results, adhered to a single type of itemformat. Some of the lack of relationship between components in theWhiteman and Lukoff study might therefore be due to instrument specificityand lower reliability of their measures. The use of one item format in ourstudy might have had the effect of maximizing whatever relationships didexist.
Another avenue of reconciliation of differences between the two studies isoffered by the results of the quasi-second-order factor analysis. The extent ofrelationship between components of attitude might be determined by whetheror not components within one of the "second-order" factors were beingcompared.
Since the present data are based upon a larger and more varied initialsample and the scales are of higher reliability, it would seem that the findingsof this study better reflect the actual relationships among and betweenattitudinal components than do those of Whiteman and Lukoff.
THE ROLE OF DEMOGRAPHIC VARIABLES IN DETERMININGREACTIONS TO DISABLED PERSONS
Analyses of the influence of demographic variables upon scale scores werepresented in Chapters 4 and 6. The relations of the scale scores to sex, age,education, and contact with the disabled were examined singly and in severalcombinations. Despite certain exceptions (such as the association betweeneducational level and Authoritarian Virtuousness on both the amputation andblindness questionnaires as shown in Table 20), the lack of appreciablerelationship between scale scores and these demographic factors is noteworthy.In fact, when the demographic variables were combined in a multipleregression equation, the resulting multiple R's with scale scores were far fromimpressive.
It is important to note that although contact with the disabled, sex of therespondent and the like are often reported as significant variables in this area,the strength of the relationship usually is not made explicit. The present studyand previous ones (Si ller & Chipman, 1964b; Si ller et al., 1967) clearlydemonstrate that although a difference in attitude strength may be statisticallysignificant (by t- or F-tests) the accompanying correlation or strength ofassociation is frequently found to be trivial. There are some investigators whohave, however, obtained results which do indicate the relevance of certaindemographic variables to the disability domain. As one example, Richardsonand his associates have gathered considerable data on "preferenee-rankings" ofpictures depicting various kinds of disabilities from subjects of differentbackgrounds. While strong cultural uniformities were obtained employing theusual demographic variables (Richardson et al., 1961), certain highly specificcultural subgroups did show ranking patterns different from those of the
60
general population (Goodman et al., 1963). It is quite possible that suchselective ethnically-related variables or occupational choice, etc., mightinfluence scores on the DFS in ways that need to be studied in the future.
With regard to the consistency of the correlational structure of the DFS
across groups, the pattern of relationships among scales appears to be quite
stable. Two matrices of correlation coefficients of scale scores for two quitedisparate groups of repondents, the high school and the physical therapystudents, were compared. Although these two groups are quite discrepant in
terms of their mean scores, and although there are many clear demographicdifferences (age, sex ratio, educational status, involvement with the disabled,
racial and socioeconomic composition, etc.), the values of parallel correlation
coefficients are more remarkable for their similarity than for their differences.
To conclude, only education, among the demographic variables examined
in the present undertaking, appears to have any consistent relationship to scale
scores; and even this is limited in extent and degree.
61

Chapter 8
SUMMARY AND IMPLICATIONS
Summary
Purpose
The purpose of this study was to describe salient dimensions of attitudes
toward the physically disabled and to develop a set of instruments to measure
these dimensions. The planned multidimensional set of scales was intended to
have the requisite reliability and sensitivity to permit accurate measurement of
experimental effects.Particular issues of theoretical interest were examined: (1) the nature of
the components of attitudes toward specific disabii:ties; (2) the generality of
attitudinal components across disabilities; (3) the relationships among
components; (4) the consistency of attitudes of individuals across disabilities;
and (5) the role of demographic variables in reactions to the disabled.
Methodology
The factor-analytic technique of scale construction was chosen as the
primary method throughout the study. Using this procedure, it is possible to
derive highly reliable scales with a minimum of items. Furthermore, it
provides a direct answer to the question of dimensionality of attitude
structure in a given area, and the nature of the component attitudes is
suggested by interpretation of the resulting factors.The disability universe was sampled by selection of three disability types
amputation, blindness, and cosmetic conditions representing key positions
on two pertinent continua: functional and cosmetic impairment. A
questionnaire for each disability type was developed.Preliminary StageThree separate groups responded to one of three large
pools of items tapping attitudes toward the three disability conditions and
certain nondisability areas (e.g., Authoritarianism, Personal Health). Their
answers were factor-analyzed, the factors rotated to an orthogonal structure,
and the total number of items reduced by eliminating the lowest loading ones.
Final Developmental Samples (Amputation, N=483; Blindness, N=477;
Cosmetic Conditions, N=520)Each of three new groups of subjects of diverse
demographic characteristics was given one of the three revised and reduced
questionnaires. Among these samples there were 233 subjects who responded
to all three disability questionnaires. The returns were factor-analyzed for a
62

final time and scales were derived from the resulting factors through elaboratepsychometric procedures. The resulting Disability Factor Scales questionnaires(DFS) contain seven scales for amputation (DFS-A), seven for blindness(DFS-I3), and six for cosmetic conditions (DFS-C). These Likert-type items areobjectively scored, and expressed in language comprehensible at an
eighth-grade level of education.
FINDINGS
Dimensions of Attitudes
It is evident that the disability attitude domain is multidimensional innature. Unidimensional approaches can at best describe only limited aspects ofreactions in this area, the most potent being an affective dimension ofpleasantness-unpleasantness. The seven factors which emerged from theamputation and blindness analyses are virtually identical. The cosmeticconditions item set contains two factors which are identical with two fromamputation and blindness, two which are analogous, and two which areunique dimensions. A brief description of each factor follows. The disabilitytypes for which they were identified appear in parentheses.
Interaction Strain (Amputation, Blindness, Cosmetic Conditions)Thepredominant tone of this factor is one of distinct uneasiness in the presenceof a disabled or disfigured person in a wide variety of social situations.Uncertainty about how to deal with the disabled, fear of saying or doing thewrong thing, and concern about social embarrassment are reflected. A secondimportant theme refers to the arousal of disgust or revulsion. An hypothesis isoffered relating the experience of emotional aversion to the general feeling oftension and constraint in interaction.
Rejection of Intimacy (Amputation, Blindness, Cosmetic Conditions)Thedominant theme of this factor is the rejection of close, particularly familial,relationships with the disabled or cosmetically impaired. An unwillingness todate, fall in love with, or marry such an individual is expressed in the itemcontent, and the idea of having an impaired child is strongly rejected. Marriageto a disabled individual is often seen as limiting the formation of newfriendships and they are frequently characterized as great burdens on theirfamilies.
Generalized Rejection (Amputation, Elindness)Expressing a generalizednegative orientation, this factor contains derogatory descriptions of thedisabled, unpleasant personal reactions, and policy items advocatingunfavorable treatment. Disturbance in empathic relations is emphasized, andreluctance to interact in intimate or formal situations is clear. Segregation isspeCifically advocated.
63
Reluctant Aversion (Cosmetic Conditions only)This factor, althoughtitled differently, is analogous to the Generalized Rejection factors ofAmputation and Blindness. Aversion is expressed, and segregation desired.However, disruption of empathy is not included, and an "apology" for theaversive reaction is notable.
Authoritarian Virtuousness (Amputation, Blindness)This factor is
comprised of both authoritarian and ostensibly "pro-disabled" items. Thedisability items describe the handicapped person as having special gifts anddesirable personal traits, advocate a general policy of favorable treatment and
tolerance, and picture the respondent himself as especially warm and
sympathetic toward the disabled. While the items are superficially positive in
tone, it is likely that advocacy of "tolerance" in this context carries the
imputation of inferior status.An hypothesis accounting for the high loading of several .authoritarian
items on this ostensibly favorable factor is offered.Superficial Empathy (Cosmetic Conditions only)This factor is considered
analogous to Authoritarian Virtuousness in that cosmetically impaired
individuals are endowed with special characteristics, a number of which are
positive. A general positive orientation of the respondent appears, andempathy, or desire for empathy, is expressed. However, unlike the
Authoritarian Virtuousness factors, some negative traits are imputed as well.
Inferred Emotional Consequences (Amputation, Blindness)The itemcontent in this factor consists almost entirely of intensely hostile statementsreferring to the disabled person's character and emotions. Maladjustment and
ill-temper are seen as frequent consequences with self-consciousness,
irritability, and hypersensitivity generally attributed to amputees or the blind.
Bitterness and self-pity are also inferred.Distressed Identification (Amputation, Blindness)This factor involves
highly personalized reactions to disability. The emphasis is on the disabled
person as a stimulus which activates anxiety about one's own vulnerability. An
element of active identification is implied as well. An hypothesis concerning
the relationship of Distressed Identification to castration anxiety is offered.
Imputed Functional Limitations (Amputation, Blindess)This factor
focuses quite specifically on the ability of the disabled person to function in
his environment. The amputation factor stresses over-all functional limitations,
physical dependency and restricted earning capacity. The blindness factor,although it contains such general items, specifically depicts the blind as unable
to be a good lawyer, doctor, etc. Thus, while the imputation of functionallimitations is common to both, there seems to be a more sharply definedimage of the blind.
Qualified Aversion (Cosmetic Conditions only)This factor does notcorrespond to any identified for Amputation and Blindess. Qualified
expression of emotional aversion is the distinguishing quality of the itemcontent. The types of cosmetic impairment included are generally of thevariety assumed to be controllable.
64
Proximate Offensiveness (Cosmetic Conditions only)This factor, like theone described immediately above, contains items tapping reactions of dis-gust about close physical contact. Similarly, the types of cosmetic con-ditions are judged to be controllable. In this factor, however, there is anassociated sense of moral indignation and an attribution of stigma to thecosmetically impaired.
The Disability Factor ScalesAmputation, Blindness,Cosmetic Conditions (DFS-A, B, and C)
The scales were derived, as described above, from the 20 factors and areinterpreted as measures of these basic dimensions. The DFS-A has seven scalestotalling 101 items, DFS-B, the same seven totalling 105 items, and DFS-C,six scales totalling 80 items. The reliabilities of these first-order scales aregenerally high. The internal consistency reliability coefficients for DFS-Aranged from .80 to .92; for DFS-B, from .80 to .91; and for DFS-C, from .62to .89. Test-retest reliability for the scales in all three questionnaires was morethan sufficient. Major validational support at present is of the construct type.Factor validities are satisfactory, the lowest of the 20 scales being .66, thehighest .93. There is evidence from a number of sources that the factorialresults are descriptive of the attitude domain. The direction and magnitude ofthe relationship of the DFS scores to demographic variables is consistent withprevious findings with other disability-attitude measures. Additional constructvalidation is to be found in the correlations between DFS and the ATDPwhich, as expected, were virtually all moderate and positive. Furthermore, alarge number of tests which theoretically should have no relationship todisability attitude in fact proved uncorrelated with the DFS. Some concurrentvalidity was established for the DFS by showing that it significantlydifferentiated 93 physical therapy students from the more heterogeneousdevelopmental samples on 17 of the 20 scales.
Relationships Among Scales
Although orthogonal factor-analytic procedures were used in developingthe DFS, the resulting scales are for several reasons not completelyindependent statistically. The generally moderate intercorrelations indicatethat both common and scale-specific variance are present. The inter-correlations of the scales within questionnaires range from .03 to .71 (basedon N's of approximately 500). The lowest coefficients are associated with theDistressed Identification, Authoritarian Virtuousness, and Superficial Empathyscales which are thus shown to be relatively independent from the otherscales. The intercorrelations among all 20 scales corroborated the pattern ofrelationships indicated by the content of the factors: DFS-A and B containseven parallel scales, and DFS-C has two parallel, two analogous, and twospecific dimensions. Where attitude components show consistency across
65

t
disabilities (and thus where it is possible to measure individual standings on
identical or analogous scales), the tendency is to respond in consistent ways
toward different conditions. Thus, not only is the component structure
comparable, but individuals who have the more favorable attitudes toward one
type of disability also tend to have more favorable attitudes toward other
types.
Quasi-Second-Order Analyses
A factor analysis of the intercorrelations among the 20 scales led to the
identification of four "second-order" factors which most satisfactorily
accounted for the common variance of the scales. Factor I, Net Affect,
contained primary loadings of 11 of the 20 scales, and accounted for 50% of
the estimated common variance. It appears to reflect a dimension of
favorable-unfavorable response involving primarily emotional, but also some
cognitive and conative, components and it seems to be the psychological
factor which is tapped by other scales (e.g., ATDF) used in this area.
Factor II, Authoritarian Virtuousness, contains primary loadings of the two
Authoritarian Virtuousness scales of DFS-A and B and of their analogue on
DFS-C, Superficial Empathy. As with the three scales themselves, this factor
reflects an admixture of positive orientation with a patronizing superiority.
Factor III is called Distressed Identification and consists of the two
same-named scales from DFS-A and B. Its appearance reflects the consistency
previously noted between these scales and testifies to the independent
significance of this disability component.Factor IV, labelled Cosmetic Aversion, contains the four remaining scales
of the DFS-C which tap hostile, negative, rejecting attitudes very much like
those involved in Factor I. It seems likely that it is the nature of the types of
disabilities being reacted to that accounts for the separation of Factor IV
from Factor I, and that they obviously would merge in a third-order
factoring."Second-order" scales (super-ordinate scales) composed of those first-
order scales which factored together were examined for their psychometric
characteristics. Re liabilities ranging from .83 to .98 were generated, suggesting
that such super-ordinate scales could prove useful.
The contributions of the four demographic variables to the variance of
the DFS-A and B scale scores, and the contribution of the three demographic
variables to the scale scores of the cosmetic questionnaire, were assessed via
multiple regression, analysis of variance and estimated w2. Many of the scales
did differentiate between demographic categories in the expected direction.
Females and those with more contact tended to be relatively favorable, and
subcullege groupsparticularly high school studentstended to be more
aversive. However, the strengths of these relationships were almost invariably
trivial. Nor were the demographic variables of any further import when their
66

effects were assessed jointly in the form of multiple R's with each scale. Inall, these data militate against the development of specialized norms basedupon the demographic variables used in this study. However, comparativestudies of restricted groups, e.g., personnel in the health professions, are likelyto generate separate norms.
IMPLICATIONS
The major implications stem from the identification of salient dimensionsof attitude toward the disabled and the development of scales to measurethese dimensions.
Use of the Disability Factor Scales
The essential function of the DFS is to serve as measures of the basic setof components of attitudes obtained in this study. Experimenters can usethese scales to make finer, more reliable and psychologically more meaningfuldiscriminations than have been possible with instruments thus far available.When research requirements allow for something less than the finediscriminations afforded by the separate use of the first-order scales,"second-order" combinations are appropriate. The superordinate scales are alsolikely to have value in tapping over-all feelings toward disabilities in general.The high reliability of the individual scales and the variety of usefulcombinations of these scales provide the user with a valuable flexibility. Thebroad theoretical framework which guided the development of the DFSfacilitates its use for the exploration of important theoretical issues, not onlywithin the domain of disability, but in other areas as well.
Subsequent work elucidating the meanings and correlates of the variousfactor scales is necessary. In the process of validating the scales the constructsunderlying the DFS will become clearer, and a network of meaning can bedeveloped so that attitudes toward the disabled can be integrated with suchconstructs as self-concept, prejudice, and the like.
The evidence for consistent relationships between personality structureand response to persons with afflictions is weak but persistent. The feeblenessof the obtained correspondences has been due, in part at least, to thelimitations of previous disability attitude measures. Studies of this nature arelikely to be more fruitful when the DFS is employed because of its advantagesover older instruments. Consequently, efforts should be renewed to detail thevarious aspects of interdependence between .these two classes of data (e.g.,between guile and Reluctant Aversion, or self-concern and Rejection ofIntimacy).
In addition, since component attitudes have been identified and described,it becomes possible to trace the genesis or development of these components
67
over time. Such studies could form the basis for broader studies of thedevelopment of values and beliefs, which would assist in efforts to modify and
improve attitudes held toward the disabled.Users of the DFS are cautioned against employing the instruments for
purposes other than research. The scales should not be used for clinical orselection procedures until specific studies of validity have been conducted.Ultimately, one might expect that the DFS will be of value as a screening orselection tool. For example, a person with strong feelings of "ProximateOffensiveness" may be found not to work well with persons with cosmeticconditions, but he may be more successful with mental retardates, the brain
damaged, or those without apparent responsibility for their state.The advantages of determining the distinctive characteristics of specialized
groups, such as health personnel or teachers, are obvious. Comparisons can bemade between the responses to the DFS of "effective" vs. "ineffective"personnel, or between student groups of physical therapists and nurses and
groups of experienced, effective workers. Longitudinal studies could beconducted which would follow trainees from the inception to the completionof training and, then, into actual work experience; and relationships toultimate level of job success could be determined.
The DFS can also be used to evaluate short-term change of attitudes.Each questionnaire has been constructed so that the first and second halvesconstitute parallel forms of the test. Although the statistical properties ofthese halves are still to be determined, the potential for the use of the DFS tostudy attitude-change is present.
Extension of the use of the DFS to measure attitudes of the disabledtoward themselves would be desirable. Comparisons between the handicappedand the nonhandicapped in terms of mean scale scores, profiles, and factorial
structure of the components are recommended. It also would be of interest tocompare the attitudes of the handicapped toward their own and toward otherdisability types.
Attitudes toward additional types of affliction could readily be
investigated by substituting disability referents not as yet covered by the
present DFS. The data indicate that "proved" item stems are likely to beinterchangeable for other conditions such as deafness, etc. Thus, the DFS canserve as a source of item stems, the originals of which have been consistentlyidentified with stable components.
Another extension of the DFS could be to establish a General Form(DFS-G). The one questionnaire would contain items alluding to differentconditions, thus leading to measures of components of attitudes toward
disability in general, but based on reactions to specific disabilities rather thanto the generic term "disability." Until a DFS-G is developed, research workersmay well consider using the A, B, and C forms or particular scales as estimates
of general attitudes.
68

Although initial data indicate factorial invariance of the DFS over
populations, more extensive data in this respect need to be obtained for larger
and more varied, as well as more specialized, groups.
Structure of Attitudes
I. The use of multidimensional measures in this area is strongly
recommended since unidimensional approaches describe only limited aspects
of reactions, probably an affective dimension of pleasantness-unpleasantness.
Additional aspects, such as fear of consequences of association, imputation of
functional, emotional and characterological qualities, and distressed affect
through identification, must be considered as well.
2. The recurrence of many attitude components across a number of
disabilities suggests that a limited set of dimensions can describe much of the
attitude domain for a host of disabilities. The set of dimensions obtained in
the present study can serve as an initial taxonomy. Research in other areas of
disability might fruitfully use these dimensions as a starting point, since it is
likely that at least some of them will be applicable.
3. Certain components seem to be relevant to one or a small number of
disabilities but can be very important for these. For most thorough
understanding and best prediction, disability-specific scales are recommended.
4. Certain attitudinal components, e.g., Inferred Emotional Conse-
quences, emerge as aspects of reactions to such dissimilar conditions as
amputation and blindness, but are not relevant to cosmetic impairment. This
suggests that categorization of disabilities on the basis of public conceptions
and reactions would differ from the usual functional-oriented groupings. Thus,
a classification of disabilities in terms of those aspects which are really salient
to the public is recommended and would be particularly useful in formulating
programs concerned with modification of attitudes.
5. Some components, namely those on the interpersonal level, are, in all
likelihood, more susceptible to modificati'm than are others which are more
intrapsychically determined. Experimental efforts directed toward identifying
those components most readily modifiable is recommended.
6. The finding that there tends to be a consistency in an individual's
attitudes across disabilities suggests the following hypothesis: modification of
attitudinal components for one disability may induce similar changes in
attitude toward other disabilities.7. The psychological dimensions and associated scales can be applied
with confidence to populations that differ on a variety of demographic
characteristics such as sex, age, and education. Preliminary data indicate that
the factor structure is the same regardless of these demographic distinctions,
and that the types of attitudes found in various segments of the population
will be essentially the same, although intensity of attitudes may vary among
certain special groups.
69

8. Our data suggest that more aversive reactions are common amongadolescents. The affective saliency of disability to them should make them achoice group for study. The particular strength of their distressed feelings
raises interesting developmental questions as well (e.g., the relationships among
puberty-libido, increasing social awareness, concomitant insecurity, andnegative affect).
9. Various issues regarding the dynamic properties of the factor scalesremain for future elaboration and verification. In the case of InteractionStrain it would be worthwhile determining whether the stresses subjectsexperience lead to aversion (as they seem to indicate), or whether (as wesuspect) the aversion is the more basic response, while the strain represents arationalization of these feelings of revulsion. Another challenging question
concerns the possibility that rejecting amputation, blindness, etc., in thosewith whom one is most closely identified (as with Rejection of Intimacy)really represents a rejection of such conditions in one's self. The relationshipof castration anxiety, and/or general anxiety to the Distressed Identificationscales, is an important task for future demonstration. It would also bevaluable to be able to reconcile the apparent favorableness of items in
Authoritarian Virtuousness and Superficial Empathy with the positive
correlations of these scales with other aversive scales.10. Inferred personal responsibility seems to be an important mediating
variable in the dynamics of disability attitude. Thus, for example, very
authoritarian persons are likely to be highly punitive or exaggeratedlybenevolent, depending on whether or not they perceive the victim to havepersonal responsibility for his condition. Investigation of this hypothesis canbe undertaken using the Authoritarian Virtuousness (DFS-A, B) scales, and the
Superficial Empathy scale (C) as attitude measures. The ProximateOffensiveness and Qualified Aversion scales, both of which tap reactions ofdisgust and of belief that certain disabilities are subject to personal control,also lend themselves to research in this area.
11. Information about the components of attitude should be utilized forconstructing a curriculum for a workshop designed to familiarize counselors,therapists, nurses, and other health-related professionals with the various ways
in which the nondisabled react to the disabled, and with how these reactionsmight effectively be handled. These professionals could then apply thefindings in direct work with the disabled. Such a curriculum could either bethe basis of a work shop itself or part of a larger program of "HumanRelations" or "Interaction Training."
12. Rehabilitation personnel need to be alerted to the strong tendency for
persons to use supposed functional limitations of the handicapped ascamouflage for feelings of strong aversion.
13. The handicapped are often recipients of untoward personal evaluations
in a manner similar to the stereotyping of other stigmatized groups.Techniques to handle this situation should be developed.
70

REFERENCES
Arnholter, Ethelwyne G. Attitudes toward the disabled. American Psychol-
ogist, 1962, 17, 338. (Abstract)Bell, A. H. Attitudes of selected rehabilitation workers and other hospital
employees toward the physically disabled. Psychological Reports, 1962,10, 183-186.
Canfield, A. A. The "Sten" scalea modified C-scale. Educational andPsychological Measurement, 1951, 11, 295-297.
Chesler, M. A. Ethnocentrism and attitudes toward the physically disabled.Journal of Personality and Social Psychology, 1965, 2(6), 877-882.
Cohen, J., & Struening, E. L. Opinions about mental illness in the personnel
of two large mental hospitals. Journal of Abnormal and SocialPsychology, 1962, 64, 349-360.
Cowen, E.L., Underberg, Rita P., & Verillo, R. T. The development andtesting of an attitudes to blindness scale. Journal of Social Psychology,
1958, 48, 297-304.Davis, F. Deviance disavowal: The management of strained interaction by the
visibly handicapped. Social Problems, 1961, 9, 121-132.
Fitting, E. A. Evaluation of adjustment to blindness. New York: AmericanFoundation for the Blind, 1954.
Genskow, J. K., & Maglione, F. D. Familiarity, dogmatism, and reportedstudent attitudes toward the disabled. Journal of Social Psychology, 1965,
67, 329-341.Goffman, E. Stigma: Notes on the management of spoiled identity.
Englewood Cliffs, N. J.: Prentice-Hall 1963.Goodman, N., Dornbusch, S. M., Richardson, S. A., & Hastrof, A. H. Varient
reactions to physical disabilities. American Sociological Review, 1963,
28(3), 419435.Gulliksen, H. Theory of mental tests. New York: John Wiley & Sons, 1950.
Hays, W. L. Statistics for psychologists. New York: Holt, Rinehart & Winston,
1963.Jabin, Norma. Attitudes toward the physically disabled as related to selected
personality variables. Unpublished doctoral dissertation, New YorkUniversity, 1965.
Kaiser, H. F. The varimax criterion for analytic rotation in factor analysis.Psychometrika, 1958, 23, 187-200.
Meyerson, L. (Ed.). Journal of Social Issues, 1948, 4, 4.Nunnally, J. Psychometric Theory. New York: McGraw-Hill, 1967.
71
Richardson, S. A., Goodman, N., Hastrof, A. H., & Dombusch, S. M. Cultural
uniformity in reaction to physical disabilities. American Sociological
Review, 1961, 26, 241-247.Si ller, J. Reactions to physical disability by the disabled and the nondisabled.
American Psychologist, 1959, 14, 351. (Abstract) Also reprinted in:
Research Bulletin, 1964, No. 7, 27-36. American Foundation for the
Blind.Siller, J. Personality determinants of reaction to the physically handicapped.
American Psychologist, 1962, 17, 338. (Abstract) Also reprinted in:
Research Bulletin, 1964, No. 7, 37-52. American Foundation for the
Blind.Si Iler, J. Toward factorial indices of reactions to the disabled. Proposal
submitted to the Vocational Rehabilitation Administration, February,
1963. (a)Siller, .1. Reaction to physical disability. Rehabilitation Counseling Bulletin,
1963, 7(1), 12-16. (b)Siller, J. Ego factors in reaction to the physically disabled. In C. Esco
Obermann (Ed.). Proceedings of the 12th Annual Work Shop of the
Association of Rehabilitation Centers, Chicago, December, 1963.
Washington, D. C.: U. S. Vocational Rehabilitation Administration, 1965,
15-17. (a)Si ller, J. Toward factorial indices of reactions to the disabled. Progress Report
submitted to the Association for the Aid of Crippled Children, March,
1965. (b)Siller, J. Conceptual and methodological issues in the study of attitudes
toward disability. Paper presented at the American Personnel and
Guidance Association Annual Convention, April, 1966. (a)
Siller, J. Components of attitudes toward the disabled: Theory and
experimental schema. American Psychologist, 1966, 21, 616. (Abstract)
(b).Si ller, J., & Chipman, A. Response set paralysis: Implications for measurement
and control. Journal of Consulting Psychology, 1963, 27, 432-438.
Siller, J., & Chipman, A. Perceptions of physical disability by the nondisabled.
American Psychologist, 1964, 19, 564. (Abstract) (a).
Siller, J., & Chipman, A. Factorial structure and correlates of the Attitudes
Toward Disabled Persons Scale. Educational and Psychological Measure-
ment, 1964, 24(4), 831-840. (b).
Siller, J., Chipman, A., Ferguson, L., & Vann, D. H. Attitudes of thenondisabled toward the physically disabled. Studies in Reactions to
Disability: XI. New York University, May, 1967.
Steingisser, Edith. The influence of set upon attitudes toward the blind as
related to self-concept. Unpublished M. A. thesis, University of New
Hampshire, 1954.Thomson, G. The factorial analysis of human ability. (Fifth Ed.) New York:
Houghton Mifflin, 1951.
72
Trites, D. K., & Sells, S. B. A note on alternative methods for estimatingfactor scores. Journal of Applied Psychology, 1955, 39, 455456.
Tryon, R. C. Reliability and behavior domain validity. Psychological Bulletin,1957, 54, 229-249.
Whiteman, M., & Lukoff, I.F. Public attitudes toward blindness. New Outlook
for the Blind, 1962, 56 No. 5.Whiteman, M., & Lukoff, I.F. Attitudes and blindness: Components, correlates
and effects. Final Report on Grant No. 835a submitted to the VocationalRehabilitation Administration, 1963.
Whiteman, M., & Lukoff, I. F. Attitudes toward blindness in two collegegroups. Journal of Social Psychology, 1964, 63, 179-191. (a).
Whiteman, M., & Lukoff, I. F. A factorial study of sighted people's attitudestoward blindness. Journal of Social Psychology, 1964, 64, 339-353. (b).
Whiteman, M., & Lukoff, I.F. Attitudes toward blindness and other physicalhandicaps. Journal of Social Psychology, 1965, 66, 135-145.
Yuker, H. E., Block, J. R., & Campbell, W. J. A scale to measure attitudetowards disabled person: Albertson, New York: Human ResourcesFoundation, Division of Abilities, Inc., 1960.
Yuker, H. E., Block, J. R., & Younng, Janet H. The measurement of attitudestoward disabled persons. Albertson, New York: Human Resources Center,1966.
73
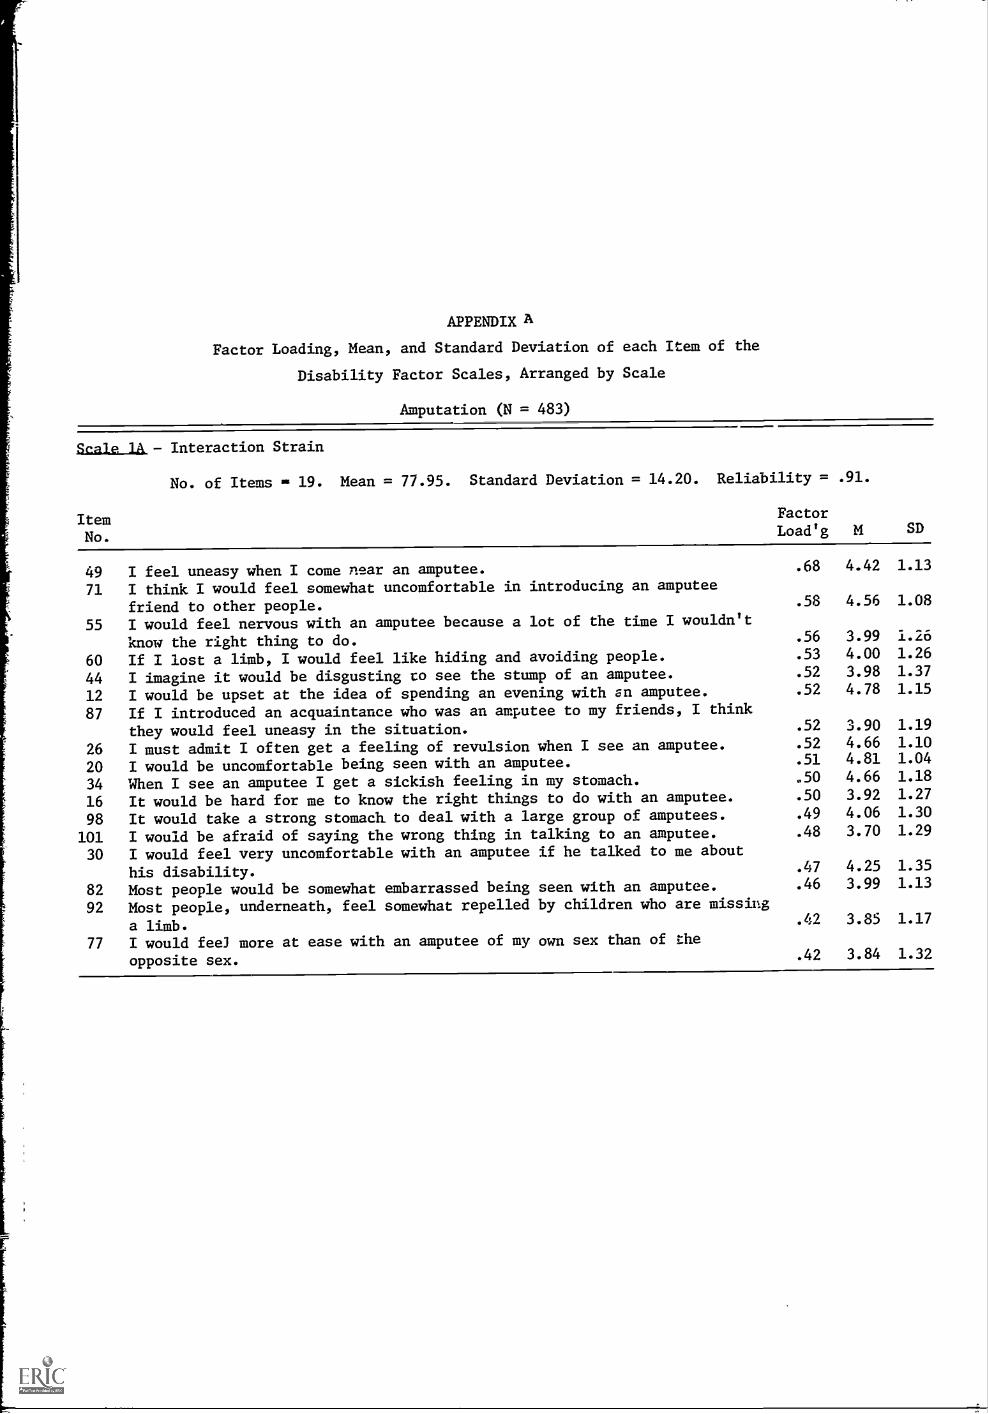
APPENDIX A
Factor Loading, Mean, and Standard Deviation of each Item of the
Disability Factor Scales, Arranged by Scale
Amputation (N = 483)
Scale lA - Interaction Strain
No. of Items = 19. Mean = 77.95. Standard Deviation = 14.20. Reliability = .91.
ItemNo.
49 I feel uneasy when I come near an amputee.
71 I think I would feel somewhat uncomfortable in introducing an amputee
friend to other people.
55 I would feel nervous with an amputee because a lot of the time I wouldn't
know the right thing to do.
60 If I lost a limb, I would feel like hiding and avoiding people.
44 I imagine it would be disgusting to see the stump of an amputee.
12 I would be upset at the idea of spending an evening with an amputee.
87 If I introduced an acquaintance who was an amputee to my friends, I think
they would feel uneasy in the situation.
26 I must admit I often get a feeling of revulsion when I see an amputee.
20 I would be uncomfortable being seen with an amputee.
34 When I see an amputee I get a sickish feeling in my stomach.
16 It would be hard for me to know the right things to do with an amputee.
98 It would take a strong stomach to deal with a large group of amputees.
101 I would be afraid of saying the wrong thing in talking to an amputee.
30 I would feel very uncomfortable with an amputee if he talked to me about
his disability.82 Most people would be somewhat embarrassed being seen with an amputee.
92 Most people, underneath, feel somewhat repelled by children who are missing
a limb.
77 I would fee] more at ease with an amputee of my own sex than of the
opposite sex.
FactorLoad'g M SD
.68 4.42 1.13
.58 4.56 1.08
.56 3.99 1.26
.53 4.00 1.26
.52 3.98 1.37
.52 4.78 1.15
.52 3.90 1.19
.52 4.66 1.10
.51 4.81 1.04
.50 4.66 1.18
.50 3.92 1.27
.49 4.06 1.30
.48 3.70 1.29
.47 4.25 1.35
.46 3.99 1.13
.42 3.85 1.17
.42 3.84 1.32
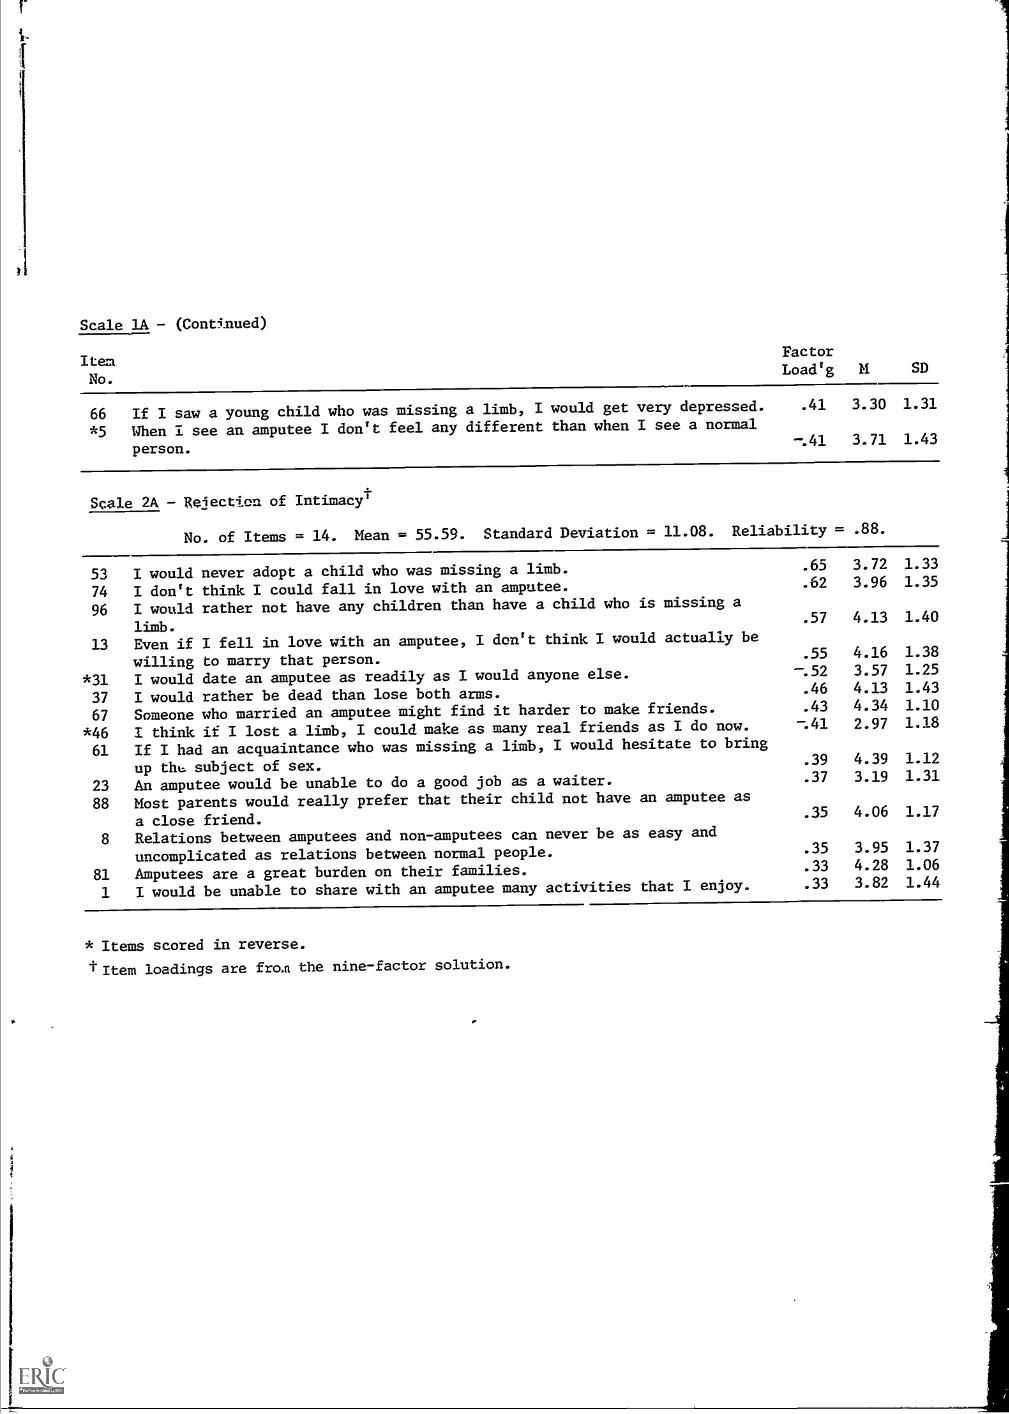
Scale lA - (Continued)
ItemNo.
FactorLoad'g M SD
66 If I saw a young child who was missing a limb, I would get very depressed. .41 3.30 1.31
*5 When I see an amputee I don't feel any different than when I see a normal
person.-. 41 3.71 1.43
Scale 2A Rejection of IntimacyT
No. of Items = 14. Mean = 55.59. Standard Deviation = 11.08. Reliability = .88.
53 I would never adopt a child who was missing a limb. .65 3.72 1.33
74 I don't think I could fall in love with an amputee. .62 3.96 1.35
96 I would rather not have any children than have a child who is missing a
limb..57 4.13 1.40
13 Even if I fell in love with an amputee, I don't think I would actually be
willing to marry that person. .55 4.16 1.38
*31 I would date an amputee as readily as I would anyone else. -.52 3.57 1.25
37 I would rather be dead than lose both arms. .46 4.13 1.43
67 Someone who married an amputee might find it harder to make friends. .43 4.34 1.10
*46 I think if I lost a limb, I could make as many real friends as I do now. -.41 2.97 1.18
61 If I had an acquaintance who was missing a limb, I would hesitate to bring
up du, subject of sex..39 4.39 1.12
23 An amputee would be unable to do a good job as a waiter. .37 3.19 1.31
88 Most parents would really prefer that their child not have an amputee as
a close friend..35 4.06 1.17
8 Relations between amputees and non-amputees can never be as easy and
uncomplicated as relations between normal people. .35 3.95 1.37
81 Amputees are a great burden on their families. .33 4.28 1.06
1 I would be unable to share with an amputee many activities that I enjoy. .33 3.82 1.44
* Items scored in reverse.
I. Item loadings are frort the nine-factor solution.

Scale 3A - Generalized Rejection
No. of Items = 23. Mean = 112.99. Standard Deviation = 13.74. Reliability = .92.
ItemNo.
72 Amputees ought to be kept apart from the normal community.58 I think that there should be laws against marriage between two amputees.25 Amputees are best off staying among themselves.
*45 I would be willing to hire an amputee for any job that did not specificallyrequire the use of the missing limb.
99 There must be something the matter with someone who marries an amputee.50 It is probably silly, but I can't help connecting amputation with bad
character.85 My first reaction to amputees is disgust.94 Whether or not I would stay friendly with a person would depend a lot on how
my other friends felt.35 I would feel that because an amputee can't do a lot of things that I can do,
he would never really know me.21 I feel that an amputee must have done something to deserve losing his limb.*80 Amputees are pretty much like everybody else after you get to know them.89 A person who has the misfortune of being an amputee should not have to work
for a living.*3 I would be willing to have an amputee as a close friend.*29 Amputees would prefer to be treated like anyone else.68 Amputees and normal people can't really understand each other.17 There is something frightening about the way amputees look.
*41 I would be willing to take a job where my employer was an amputee.*39 Amputees are just as intelligent as normal people.11 A person with an artificial arm can't eat without being messy.7 I would not be willing to take a job if I had to work with a co-worker who
was an amputee.54 I would never vote for an amputee for President.76 Amputees probably can't understand how normal people feel about a lot of
experiences.63 Artificial limbs may help amputees look more normal, but don't really help
them do more things.
FactorLoad'g M SD
.67 5.35 .81
.62 5.30 .92
.60 5.07 1.04
-.60 2.07 1.05.59 5.02 .91
.57 5.16 .95
.56 5.01 .94
.54 4.79 1.03
.52 4.63 1.06
.50 5.41 1.02-.50 2.09 .35
.49 4.74 1.09-.48 2.30 1.00-.48 2.02 .92.47 4.70 .97
.47 4.64 1.11-.46 2.03 .89
-.46 1.79 .95
.44 4.89 1.03
.44 5.05 1.04
.43 4.69 1.21
.43 4.29 1.20
.42 4.55 1.16
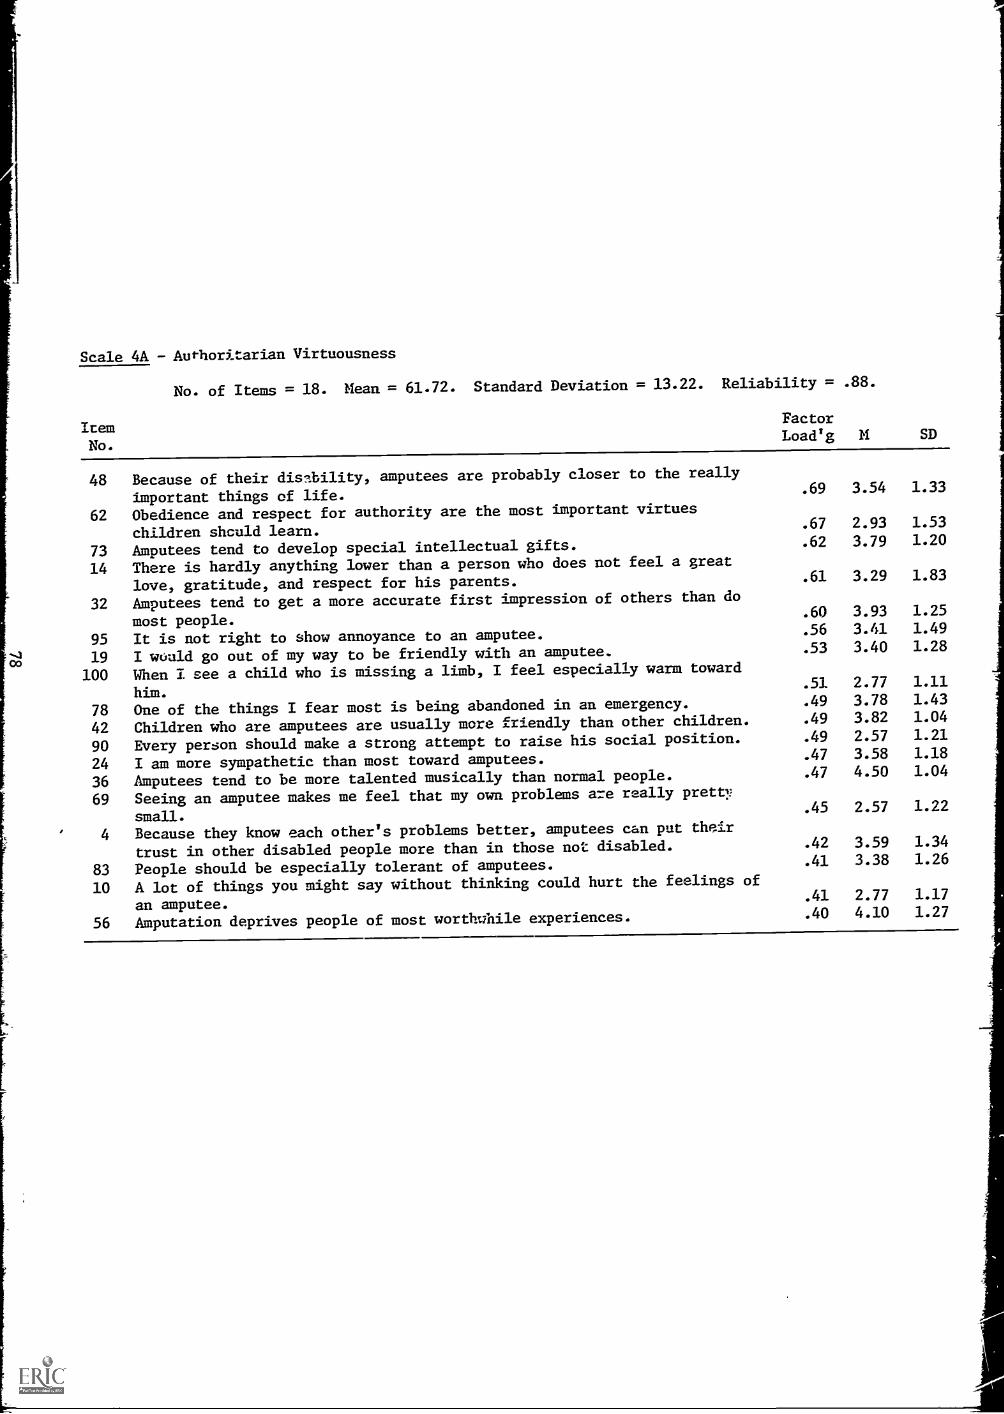
Scale 4A - Authoritarian Virtuousness
ItemNo.
No. of Items = 18. Mean = 61.72. Standard Deviation = 13.22. Reliability = .88.
FactorLoad'g Pi SD
48 Because of their disability, amputees are probably closer to the really
important things of life. .69 3.54 1.33
62 Obedience and respect for authority are the most important virtues
children shculd learn..67 2.93 1.53
73 Amputees tend to develop special intellectual gifts. .62 3.79 1.20
14 There is hardly anything lower than a person who does not feel a great
love, gratitude, and respect for his parents. .61 3.29 1.83
32 Amputees tend to get a more accurate first impression of others than do
most people..60 3.93 1.25
95 It is not right to show annoyance to an amputee. .56 3.41 1.49
19 I wuuld go out of my way to be friendly with an amputee. .53 3.40 1.28
100 When i see a child who is missing a limb, I feel especially warm toward
him..51 2.77 1.11
78 One of the things I fear most is being abandoned in an emergency. .49 3.78 1.43
42 Children who are amputees are usually more friendly than other children. .49 3.82 1.04
90 Every person should make a strong attempt to raise his social position. .49 2.57 1.21
24 I am more sympathetic than most toward amputees. .47 3.58 1.18
36 Amputees tend to be more talented musically than normal people. .47 4.50 1.04
69 Seeing an amputee makes me feel that my own problems are really pretty
small..45 2.57 1.22
4 Because they know each other's problems better, amputees can put their
trust in other disabled people more than in those not disabled. .42 3.59 1.34
83 People should be especially tolerant of amputees. .41 3.38 1.26
10 A lot of things you might say without thinking could hurt the feelings of
an amputee..41 2.77 1.17
56 Amputation deprives people of most worthwhile experiences. .40 4.10 1.27
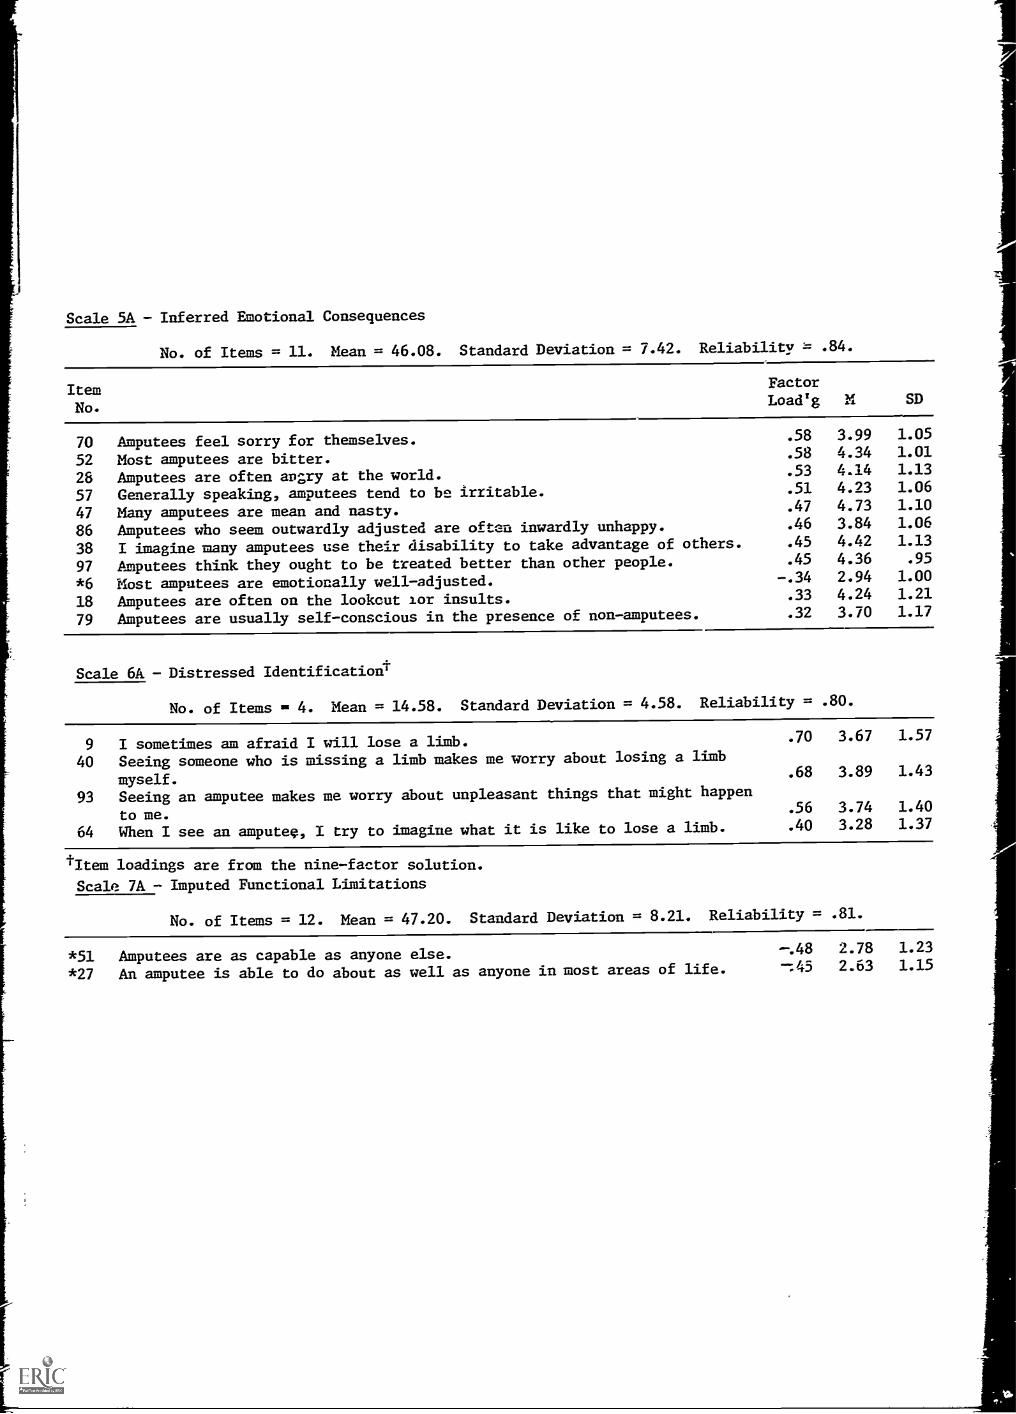
Scale 5A Inferred Emotional Consequences
No. of Items = 11. Mean = 46.08. Standard Deviation = 7.42. Reliability = .84.
ItemNo.
FactorLoadTg M SD
70 Amputees feel sorry for themselves. .58 3.99 1.05
52 Most amputees are bitter. .58 4.34 1.01
28 Amputees are often angry at the world. .53 4.14 1.13
57 Generally speaking, amputees tend to be irritable. .51 4.23 1.06
47 Many amputees are mean and nasty. .47 4.73 1.10
86 Amputees who seem outwardly adjusted are often inwardly unhappy. .46 3.84 1.06
38 I imagine many amputees use their disability to take advantage of others. .45 4.42 1.13
97 Amputees think they ought to be treated better than other people. .45 4.36 .95
*6 Most amputees are emotionally well-adjusted. -.34 2.94 1.00
18 Amputees are often on the lookout for insults. .33 4.24 1.21
79 Amputees are usually self-conscious in the presence of non-amputees. .32 3.70 1.17
Scale 6A Distressed Identificationt
No. of Items = 4. Mean = 14.58. Standard Deviation = 4.58. Reliability = .80.
9 I sometimes am afraid I will lose a limb. .70 3.67 1.57
40 Seeing someone who is missing a limb makes me worry about losing a limb
myself. .68 3.89 1.43
93 Seeing an amputee makes me worry about unpleasant things that might happen
to me. .56 3.74 1.40
64 When I see an amputee, I try to imagine what it is like to lose a limb. .40 3.28 1.37
tItem loadings are from the nine-factor solution.
Scale 7A - Imputed Functional Limitations
No. of Items = 12. Mean = 47.20. Standard Deviation = 8.21. Reliability = .81.
*51 Amputees are as capable as anyone else. --.48 2.78 1.23
*27 An amputee is able to do about as well as anyone in most areas of life. -;45 2.63 1.15

Scale 7A - (Continued)
ItemNo.
FactorLoad'g M SD
*33 Most amputees can function almost perfectly with artificial limbs. -.40 2.72 1.07
43 Amputees must be very afraid of being abandoned in an emergency. .39 3.55 1.27
75 A man missing a limb would find it very difficult to support a family. .38 3.84 1.20
91 Amputees need help with many daily activities. .36 3.77 1.11
*2 A child missing a limb can function with the use of an artificial limb just
as well as normal children. --.36 3.39 1.30
*65 Amputees should have to work and support themselves as other people do. --.36 2.50 .96
15 The presence of an amputee in a group limits the kinds of things the group
can do. .34 3.57 1.31
22 If I had an acquaintance who was an amputee, I would hesitate to bring up
the subject of sports. .32 4.24 1.29
84 An amputee would feel uncomfortable in a discussion of physical appearance. .30 3.49 1.13
59 I think amputees probably earn less than normal people. .25 3.75 1.31
Blindness (N = 477)
Scale 1B - Interaction Strain
No. of Items = 15. Mean = 67.54. Standard Deviation = 10.26. Reliability =
11 I think I would feel somewhat uncomfortable introducing a blind friend to
other people. .62 4.82 1.07
66 I would probably be nervous with a blind person. .54 4.43 1.17
75 I feel uneasy when I come near a blind person. .51 4.52 1.10
25 I would be uncomfortable being seen with a blind person. .48 4.96 .95
50 I would be upset at the idea of spending an evening with a blind person. .48 4.90 .99
62 If I introduced a blind acquaintance to my friends, I think they would feel
uneasy in the situation. .47 4.04 1.21
88 Most people would be somewhat embarrassed being seen with a blind person. .44 3.95 1.19
99 Someone who married a blind person might find it harder to make friends. .42 4.39 1.14

Scale 1B - (Continued)
ItemFactor
No.Load'g M SD
34 I would prefer to avoid contact with the blind.
41 Most parents would really prefer that their child not have a blind child
as a close friend.
1 I would feel very uncomfortable with a blind person if he talked to me
about his blindness.
103 I think I would prepare myself to meet a really different sort of person if
I were told I was going to meet someone who was blind.
94 There is something frightening about the way blind people look.
84 I would be uncomfortable about offering help to a blind person because he
might resent it.
18 Many people would think that there was something wrong with someone who had
a blind person as a close friend.
.41 4.95 .94
.38 4.00 1.23
.36 4.52 1.32
.36 4.20 1.17
.36 4.66 1.07
.33 4.32 1.15
.32 4.91 1.11
Scale 2B - Rejection of Intimacy
No. of Items = 12. Mean = 49.03. Standard Deviation = 9.40. Reliability = .84.
*101 I think if I became blind, I could make a pretty good adjustment. -.50 3.27 1.15
17 I would never adopt a child who was blind. .46 3.69 1.41
74 I don't think I could fall in love with a blind person. .45 4.09 1.29
72 I would rather not have any children than have a child who is blind. .44 4.16 1.39
*9 I would have no objection to having my body used for scientific research
after I die.-.43 3.62 1.62
*32 I would date a blind person as readily as I would anyone else. -Al 3.70 1.34
*86 I think if I were blind, I could make as many real friends as I do now. --.40 3.10 1.26
*38 I would be willing to have a blind person as a close friend. -.39 2.38 1.03
31 I would rather be dead than blind..38 4.92 1.14
54 Even if I fell in love with a blind person, I don't think I would actually
be willing to marry that person..35 4.16 1.27
65 Generally speaking, I think blind children should be kept out of schools
for normal children..32 4.39 1.37
*20 If it could help a blind child see, I would leave my eyes to him in my will. -.31 2.30 1.26
1
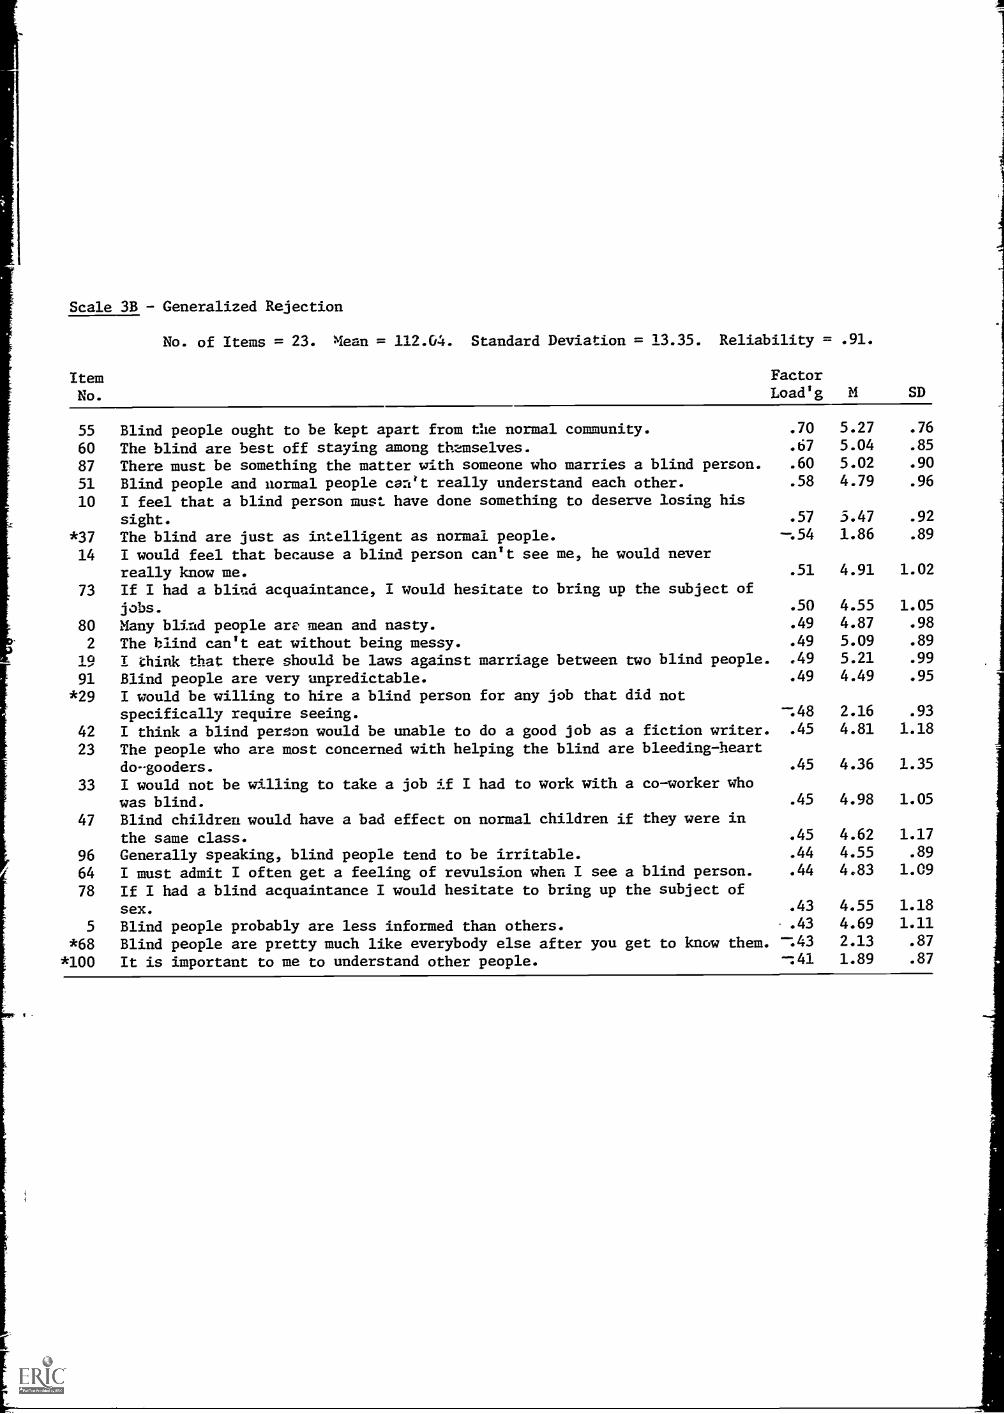
Scale 3B - Generalized Rejection
ItemNo.
No. of Items = 23. Mean = 112.04. Standard Deviation = 13.35. Reliability = .91.
FactorLoad'g M SD
55
60
87
51
10
Blind people ought to be kept apart from the normal community.The blind are best off staying among themselves.There must be something the matter with someone who marries a blind person.Blind people and normal people can't really understand each other.I feel that a blind person must have done something to deserve losing hissight.
.70
.67
.60
.58
.57
5.275.045.024.79
5.47
.76
.85
.90
.96
.92
*37 The blind are just as intelligent as normal people. --.54 1.86 .89
14 I would feel that because a blind person can't see me, he would neverreally know me. .51 4.91 1.02
73 If I had a blind acquaintance, I would hesitate to bring up the subject ofjobs. .50 4.55 1.05
80 Many blind people are mean and nasty. .49 4.87 .98
2 The blind can't eat without being messy. .49 5.09 .89
19 I think that there should be laws against marriage between two blind people. .49 5.21 .99
91 Blind people are very unpredictable. .49 4.49 .95
*29 I would be willing to hire a blind person for any job that did notspecifically require seeing. -.48 2.16 .93
42 I think a blind person would be unable to do a good job as a fiction writer. .45 4.81 1.18
23 The people who are most concerned with helping the blind are bleeding-heartdogooders. .45 4.36 1.35
33 I would not be willing to take a job if I had to work with a co-worker whowas blind. .45 4.98 1.05
47 Blind children would have a bad effect on normal children if they were inthe same class. .45 4.62 1.17
96 Generally speaking, blind people tend to be irritable. .44 4.55 .89
64 I must admit I often get a feeling of revulsion when I see a blind person. .44 4.83 1.09
78 If I had a blind acquaintance I would hesitate to bring up the subject ofsex. .43 4.55 1.18
5 Blind people probably are less informed than others. .43 4.69 1.11
*68 Blind people are pretty much like everybody else after you get to know them. -.43 2.13 .87
*100 It is important to me to understand other people. -:41 1.89 .87

Scale 4B - Authoritarian Virtuousness
No. of Items = 17. Mean = 56.08. Standard Deviation = 12.86. Reliability = .87.
FactorLoad'g M SDItem
No.
98 Because of their disability, blind people are probably closer to the really
important things of life..69 3.14 1.32
71 Obedience and respect for authority are the most important virtues children
should learn..65 2.94 1.57
3 There is hardly anything lower than a person who does not feel a great love,
gratitude, and respect for his parents..65 3.32 1.78
82 The blind have unusually good memories..62 2.97 1.11
35 Blind people tend to get a more accurate first impression of others than do
most people..60 3.25 1.31
7 I would go out of my way to be friendly with a blind person. .59 3.14 1.37
105 I feel I owe it to a blind person to be nice, because I've been luckier. .55 3.40 1.40
53 When I see a blind child, I feel especially warm toward him. .53 2.61 1.09
13 Blindness tends to improve a person's character. .52 3.91 1.23
92 It is not right to show annoyance to a blind person. .49 3.38 1.48
85 One of the things I fear most is being abandoned in an emergency. .47 3.69 1.43
21 Blind people tend to be more talented musically than normal people. .46 3.78 1.30
57 Blind people are unusually neat in appearance..46 3.25 1.17
48 Because they know each other's problems better, the blind can put their trust
in other disabled people more than in those not disabled. .45 3.77 1.31
30 Blind children are usually more friendly than other children. .44 3.80 1.10
63 Blind people tend to develop special abilities. .43 2.26 .87
43 I am more sympathetic than most toward blind people. .43 3.46 1.21
Scale 5B - Inferred Emotional Consequences
No. of Items = 15. Mean = 62.15. Standard Deviation = 8.97. Reliability = .83.
76 The blind feel sorry for themselves..54 4.32 1.02
6 The blind are often angry at the world..52 4.43 .96
70 Most blind people are bitter..51 4.56 .97
26 I imagine many blind people use their blindness to take advantage of others. .42 4.63 1.04

Scale 5B - (Continued)
ItemNo.
FactorLoad'g M SD
95 The blind think they ought to be treated better than other people. .41 4.63 .91
79 Blind people are a great burden on their families. .38 4.15 1.09
83 Most people, inside, are somewhat repelled by the blind. .37 3.94 1.10
89 Blind people who seem outwardly adjusted are often inwardly unhappy. .35 3.81 1.12
*22 Most blind people are emotionally well-adjusted. -.34 2.89 1.11
52 Many blind people do dangerous things because they won't accept help. .34 3.92 1.20
16 Blind people are often on the lookout for insults. .33 4.59 1.05
36 Blind children probably think they are not as good as normal children. .31 3.68 1.17
46 The blind have a whole set of feelings which cannot be understood by most
other people. .26 3.64 1.25
59 Most small children probably are afraid of blind people. .23 3.R0 1.9n
101a It must be humiliating to have to depend on others as much as blind people
do. .21 3.94 1.19
Scale 6B Distressed Identification
No. of Items = 10. Mean = 38.71. Standard Deviation = 8.39. Reliability = .81.
97 Seeing a blind person makes me worry about unpleasant things that might
happen to me.
40 Seeing someone who is blind makes me worry about becoming blind myself.
24 I sometimes am afraid I will become blind.
58 When I see a blind person, I try to imagine what it is like to be blind.
77 I very often feel nervous when I meet a new person.
45 I would be afraid of,saying the wrong thing in talking to a blind person.
12 When I see a blind person I get a sickish feeling in my stomach.
61 My first reaction in meeting a blind person is a feeling of pity.
28 When I see a blind person in the street, I am tempted to stare.
69 If I were blind, I think I would feel like hiding and avoiding people.
.70 3.81 1.35
.69 3.78 1.49
.66 3.76 1.52
.45 2.98 1.36
.39 3.72 1.45
.38 3.82 1.36
.37 4.84 1.22
.36 3.56 1.36
.34 4.05 1.39
.32 4.35 1.20
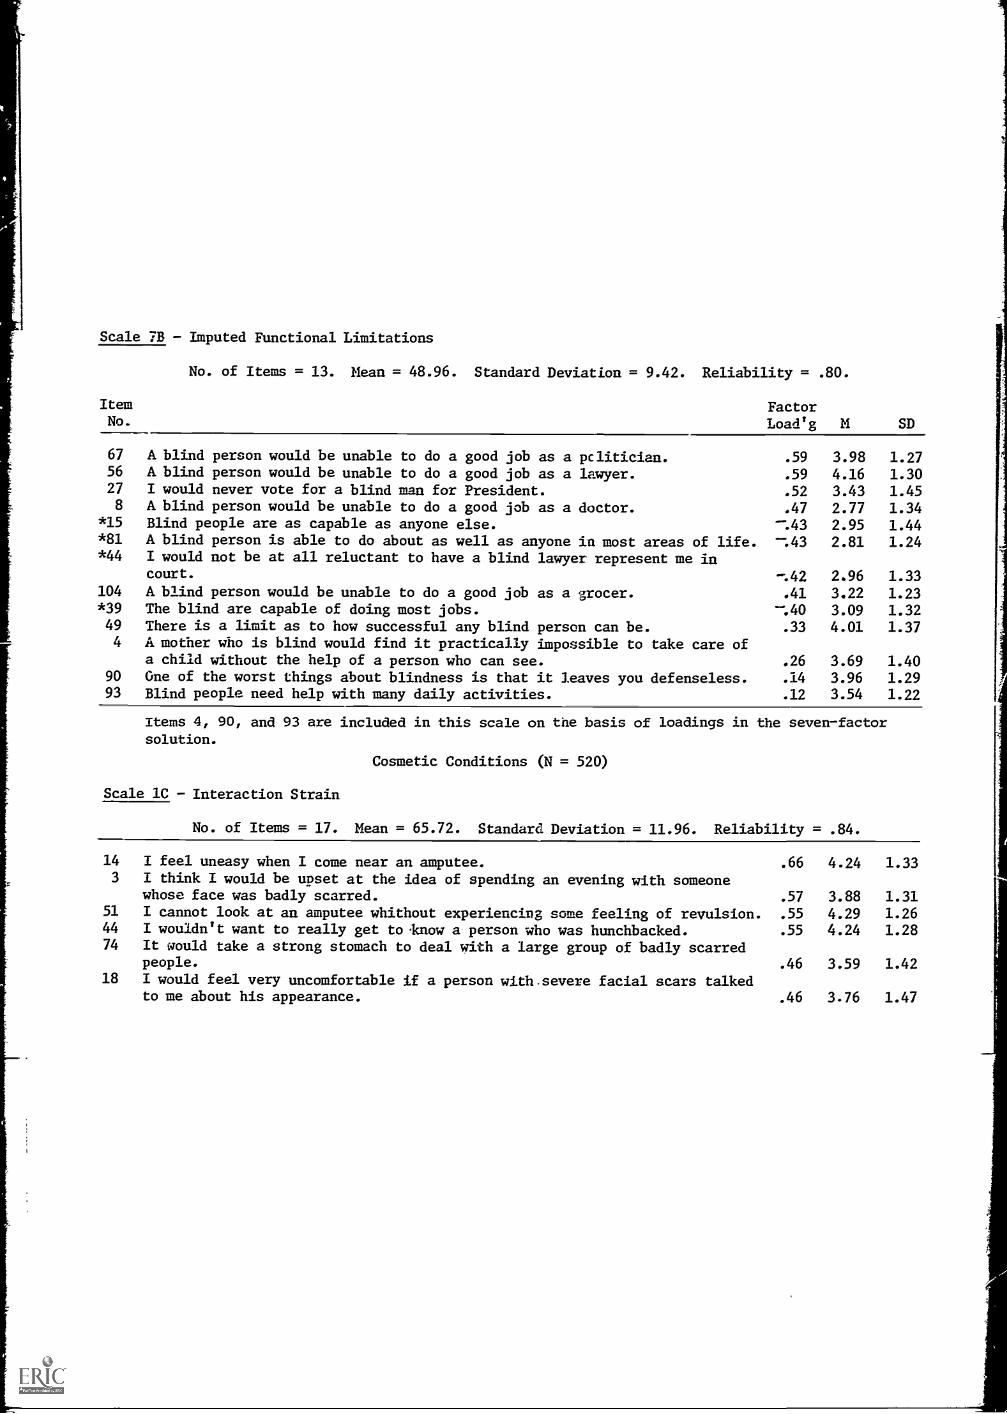
Scale 7B Imputed Functional Limitations
ItemNo.
No. of Items = 13. Mean = 48.96. Standard Deviation = 9.42. Reliability = .80.
67 A blind person would be unable to do a good job as a pclitician.56 A blind person would be unable to do a good job as a lawyer.27 I would never vote for a blind man for President.8 A blind person would be unable to do a good job as a doctor.
*15 Blind people are as capable as anyone else.*81 A blind person is able to do about as well as anyone in most areas of life.*44 I would not be at all reluctant to have a blind lawyer represent me in
court.
104 A blind person would be unable to do a good job as a grocer.*39 The blind are capable of doing most jobs.49 There is a limit as to how successful any blind person can be.4 A mother who is blind would find it practically impossible to take care of
a child without the help of a person who can see.90 Gne of the worst things about blindness is that it leaves you defenseless.93 Blind people need help with many daily activities.
FactorLoad'g M SD
.59 3.98 1.27
.59 4.16 1.30
.52 3.43 1.45
.47 2.77 1.34.43 2.95 1.44-.43 2.81 1.24
--.42 2.96 1.33
.41 3.22 1.23-;40 3.09 1.32.33 4.01 1.37
.26 3.69 1.40
.14 3.96 1.29
.12 3.54 1.22
Items 4, 90, and 93 are included in this scale on the basis of loadings in the seven-factorsolution.
Cosmetic Conditions (N = 520)
Scale 1C Interaction Strain
No. of Items = 17. Mean = 65.72. Standard Deviation = 11.96. Reliability = .84.
14 I feel uneasy when I come near an amputee. .66 4.24 1.333 I think I would be upset at the idea of spending an evening with someone
whose face was badly scarred. .57 3.88 1.3151 I cannot look at an amputee whithout experiencing some feeling of revulsion. .55 4.29 1.2644 I wouldn't want to really get toknow a person who was hunchbacked. .55 4.24 1.2874 It would take a strong stomach to deal with a large group of badly scarred
people. .46 3.59 1.4218 I would feel very uncomfortable if a person with severe facial scars talked
to me about his appearance. .46 3.76 1.47

Scale 1C - (Continued)
ItemNo.
68 If I introduced an acquaintance with severe facial scars to my friends,I think they would feel uneasy in the situation.
78 If I got badly burned on my face, I think I would feel like hiding andavoiding people.
34 I would be upset at the idea of spending an evening with a blind person.*56 I think if I got badly scarred I could make a pretty good adjustment.
9 I would feel somewhat uncomfortable being seen with a person who had anoticeable twitch.
60 I am somewhat disturbed by cross-eyed people.63 People who are quite ugly tend to be resentful of others.
*47 I would be willing to marry a person whose body was scarred.*38 I would date a person who had acne as readily as I would anyone else.24 I would feel more at ease with an ugly person of my own sex than of the
opposite sex.6 Small children are probably afraid of very ugly people.
Scale 2C - Rejection of Intimacy
FactorLoad'g M
.40 3.69
.38 3.18-.38 4.78-.38 3.23
.35 4.13-.34 4.29.32 3.77
-.31 3.18-.29 3.61
-.29 3.61.27 3.32
No. of Items = 18. Mean = 75.47. Standard Deviation = 13.95. Reliability = .89.
SD
1.26
1.411.111.24
1.221.201.321.241.33
1.371.42
73 Even if I fell in love with a blind person, I don't think I'd actually bewilling to marry that person. .63 4.15 1.40
5 Even if I fell in love with someone who had a bad heart condition, I don'tthink I would actually be willing to marry that person. .63 4.61 1.30
66 I would be upset if a child of mine were dating someone I considered veryugly. .62 4.06 1.36
27 I would rather have no children than have a child who was blind. .61 4.08 1.6137 I would be very unhappy if a friend of mine thought of marrying a blind
person. .57 4.63 1.1049 Even if I fell in love with a person I thought was very ugly, I don't think
I would actually be willing to get married. .55 4.33 1.31
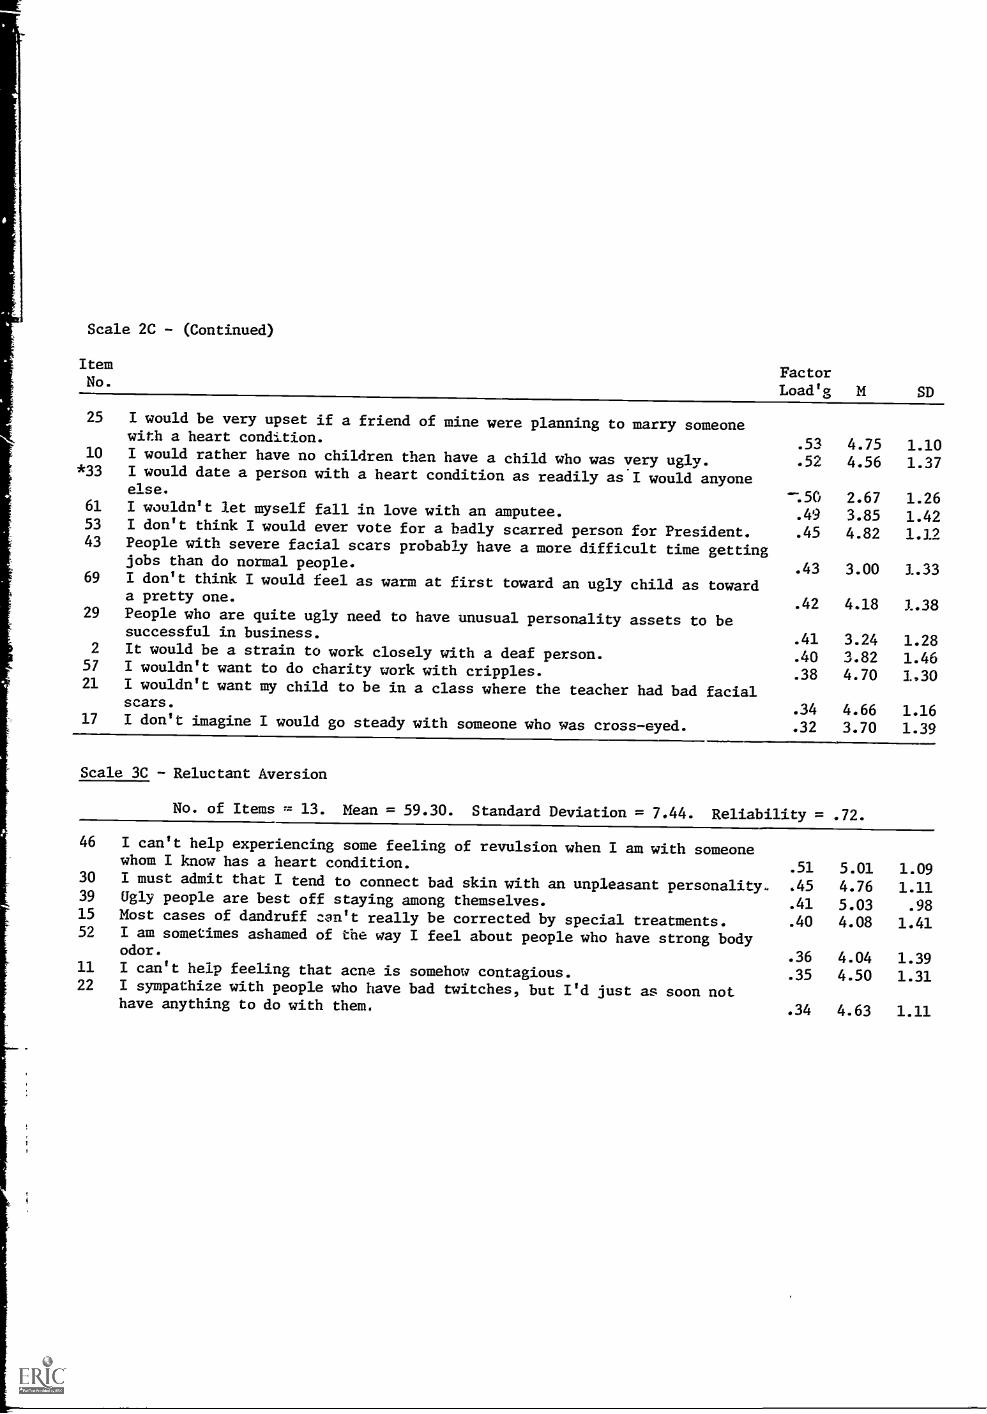
Scale 2C - (Continued)
ItemNo.
FactorLoad'g M SD
25 I would be very upset if a friend of mine were planning to marry someonewith a heart condition.
.53 4.75 1.1010 I would rather have no children than have a child who was very ugly. .52 4.56 1.37*33 I would date a person with a heart condition as readily as I would anyone
else.-.50 2.67 1.26
61 I wouldn't let myself fall in love with an amputee. .49 3.85 1.4253 I don't think I would ever vote for a badly scarred person for President. .45 4.82 1.1243 People with severe facial scars probably have a more difficult time getting
jobs than do normal people..43 3.00 1.33
69 I don't think I would feel as warm at first toward an ugly child as towarda pretty one.
.42 4.18 1.3829 People who are quite ugly need to have unusual personality assets to be
successful in business..41 3.24 1.28
2 It would be a strain to work closely with a deaf person. .40 3.82 1.4657 I wouldn't want to do charity work with cripples. .38 4.70 1,3021 I wouldn't want my child to be in a class where the teacher had bad facial
scars..34 4.66 1.16
17 I don't imagine I would go steady with someone who was cross-eyed. .32 3.70 1.39
Scale 3C - Reluctant Aversion
No. of Items = 13. Mean = 59.30. Standard Deviation = 7.44. Reliability = .72.
46 I can't help experiencing some feeling of revulsion when I am with someonewhom I know has a heart condition. .51 5.01 1.09
30 I must admit that I tend to connect bad skin with an unpleasant personality. .45 4.76 1.1139 Ugly people are best off staying among themselves. .41 5.03 .9815 Most cases of dandruff can't really be corrected by special treatments. .40 4.08 1.4152 I am sometimes ashamed of the way I feel about people who have strong body
odor..36 4.04 1.39
11 I can't help feeling that acne is somehow contagious. .35 4.50 1.3122 I sympathize with people who have bad twitches, but I'd just as soon not
have anything to do with them. .34 4.63 1.11
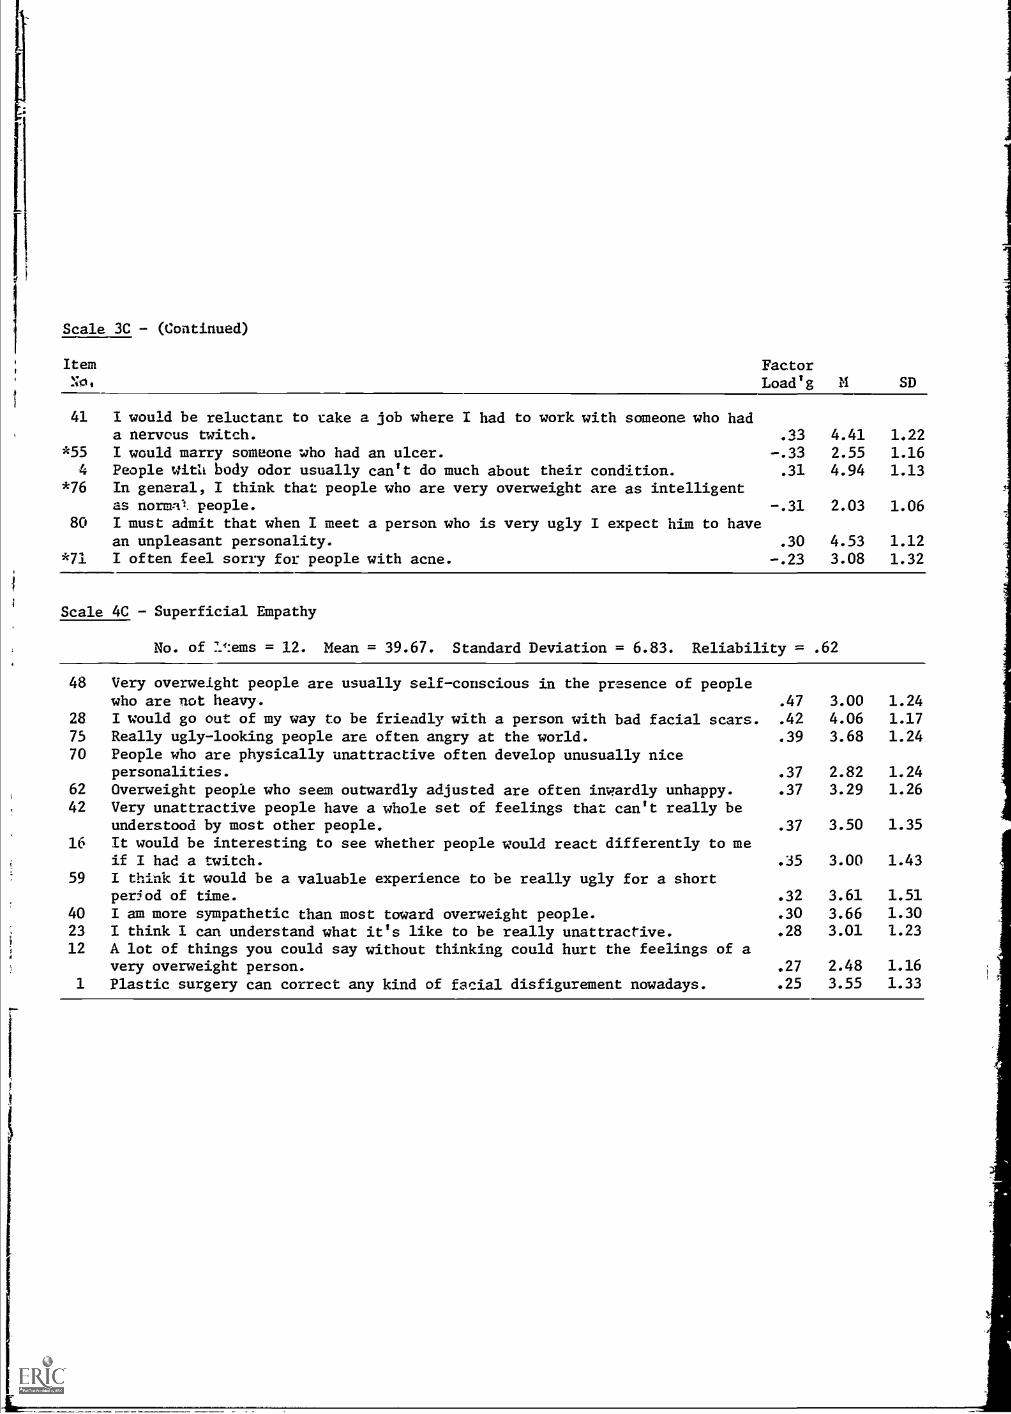
Scale 3C - (Continued)
Item FactorLoadig M SD
41 I would be reluctant to take a job where I had to work with someone who hada nervous twitch.
*55 I would marry someone who had an ulcer.4 People With body odor usually can't do much about their condition.
*76 In general, I think that people who are very overweight are as intelligentas normal. people.
80 I must admit that when I meet a person who is very ugly I expect him to havean unpleasant personality.
*71 I often feel sorry for people with acne.
.33 4.41 1.22
-.33 2.55 1.16.31 4.94 1.13
-.31 2.03 1.06
.30 4.53 1.12
-.23 3.08 1.32
Scale 4C Superficial Empathy
No. of 14:ems = 12. Mean = 39.67. Standard Deviation = 6.83. Reliability = .62
48 Very overweight people are usually self-conscious in the presence of peoplewho are not heavy. .47 3.00 1.24
28 I would go out of my way to be friendly with a person with bad facial scars. .42 4.06 1.17
75 Really ugly-looking people are often angry at the world. .39 3.68 1.2470 People who are physically unattractive often develop unusually nice
personalities. .37 2.82 1.2462 Overweight people who seem outwardly adjusted are often inwardly unhappy. .37 3.29 1.26
42 Very unattractive people have a whole set of feelings that can't really beunderstood by most other people. .37 3.50 1.35
16 It would be interesting to see whether people would react differently to meif I had a twitch. .35 3.00 1.43
59 I think it would be a valuable experience to be really ugly for a shortperiod of time. .32 3.61 1.51
40 I am more sympathetic than most toward overweight people. .30 3.66 1.3023 I think I can understand what it's like to be really unattractive. .28 3.01 1.23
12 A lot of things you could say without thinking could hurt the feelings of avery overweight person. .27 2.48 1.16
1 Plastic surgery can correct any kind of facial disfigurement nowadays. .25 3.55 1.33
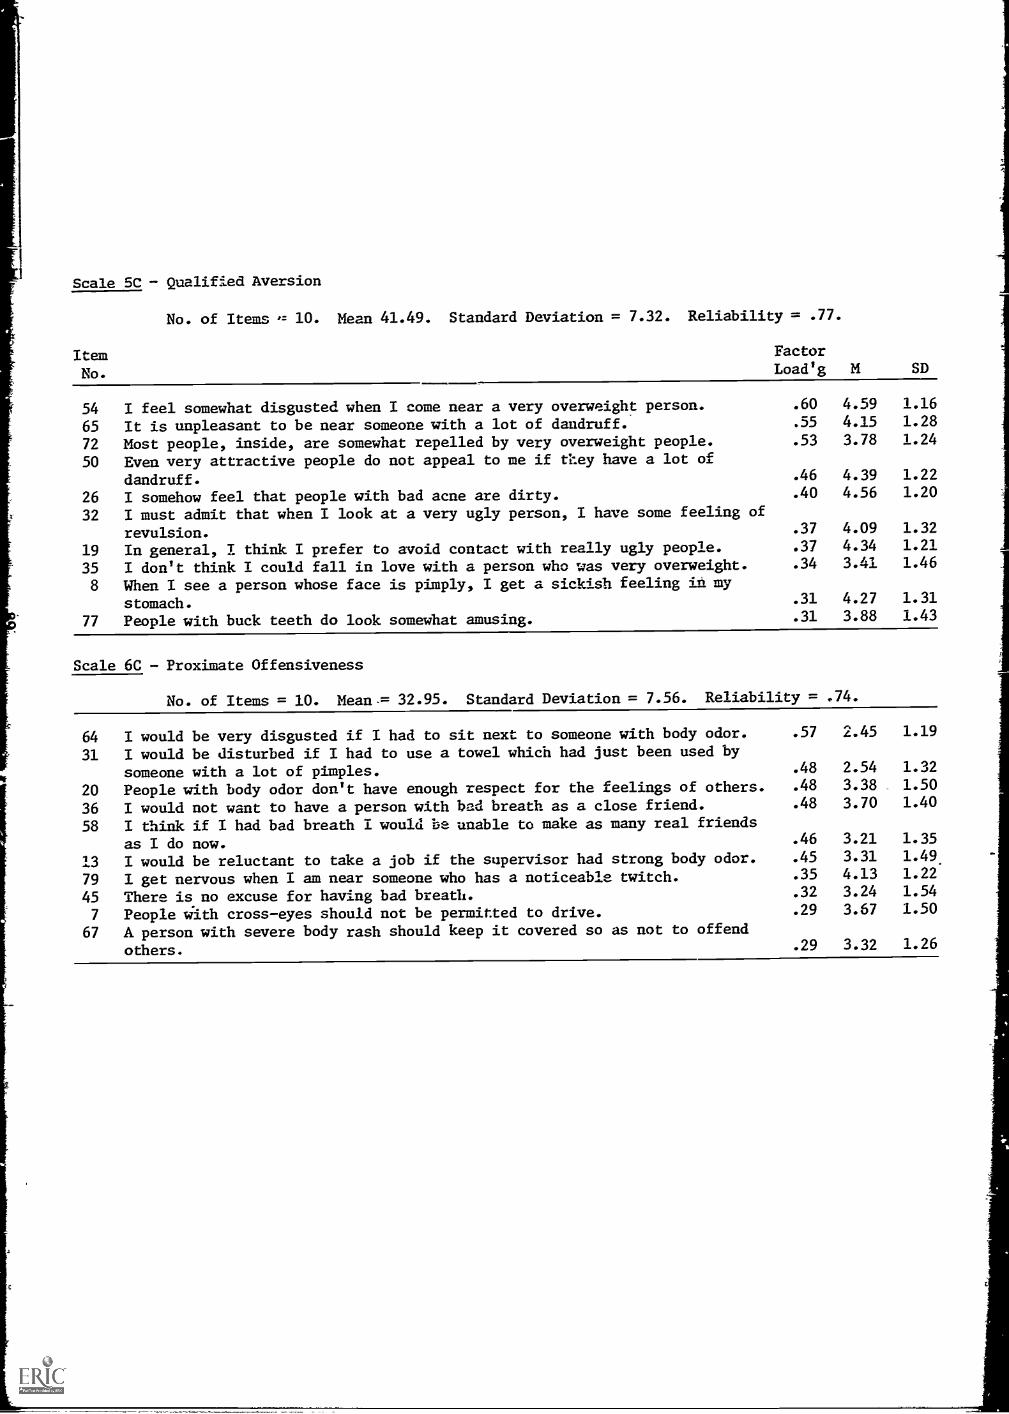
Scale SC - Qualified Aversion
ItemNo.
No. of Items 10. Mean 41.49. Standard Deviation = 7.32. Reliability = .77.
FactorLoad'g M
54 I feel somewhat disgusted when I come near a very overweight person. .60 4.59
65 It is unpleasant to be near someone with a lot of dandruff. .55 4.15
72 Most people, inside, are somewhat repelled by very overweight people. .53 3.78
50 Even very attractive people do not appeal to me if they have a lot of
dandruff. .46 4.39
26 I somehow feel that people with bad acne are dirty. .40 4.56
32 I must admit that when I look at a very ugly person, I have some feeling of
revulsion. .37 4.09
19 In general, I think I prefer to avoid contact with really ugly people. .37 4.34
35 I don't think I could fall in love with a person who was very overweight. .34 3.41
8 When I see a person whose face is pimply, I get a sickish feeling in my
stomach. .31 4.27
77 People with buck teeth do look somewhat amusing. .31 3.88
Scale 6C - Proximate Offensiveness
No. of Items = 10. Mean= 32.95. Standard Deviation = 7.56. Reliability = .74.
SD
1.161.281.24
1.221.20
1.321.211.46
1.311.43
64 I would be very disgusted if I had to sit next to someone with body odor. .57 2.45 1.19
31 I would be disturbed if I had to use a towel which had just been used by
someone with a lot of pimples. .48 2.54 1.32
20 People with body odor don't have enough respect for the feelings of others. .48 3.38 1.50
36 I would not want to have a person with had breath as a close friend. .48 3.70 1.40
58 I think if I had bad breath I would be unable to make as many real friends
as I do now. .46 3.21 1.35
13 I would be reluctant to take a job if the supervisor had strong body odor. .45 3.31 1.49.
79 I get nervous when I am near someone who has a noticeable twitch. .35 4.13 1.22
45 There is no excuse for having bad breath. .32 3.24 1.54
7 People with cross-eyes should not be permitted to drive. .29 3.67 1.50
67 A person with severe body rash should keep it covered so as not to offend
others. .29 3.32 1.26

APPENDIX Ba
Means and Standard Deviations of Scale Scores of Subgroups
Scale
DevelopmentSample
M cr.,.,J
RepeatGroup
M SD
High SchoolStudents
M SD
Physical TherapyStudents
M SD
PsychologyStudents
If SD
Amputation N = 483 N = 233 N = 154 N = 93 N = 401A 77.95 14.20 82.21 13.37 71.38 14.27 87.28 10.16 76.85 12.742A 55.59 11.08 57.04 11.05 54.05 11.66 62.70 9.15 54.08 10.123A 112.99 13.74 116.32 11.15 106.01 16.40 121.17 8.62 116.75 9.274A 61.72 13.22 66.40 11.89 51.97 10.55 66.47 9.67 74.68 8.885A 46.08 7.42 47.41 6.82 44.49 8.00 50.92 5.23 45.20 6.366A 14.58 4.58 15.76 4.18 12.44 4.40 15.41 4.05 16.22 4.167A 47.20 8.21 48.82 8.53 43.18 7.86 53.19 6.72 45.55 7.98
Blindness N = 477 N = 233 N = 140 N = 93 N = 401B 67.54 10.26 69.21 9.92 64.16 10.90 72.67 8.38 64.60 11.262B 49.03 9.40 49.85 9.74 48.01 9.42 54.34 8.92 48.80 8.573B 112.04 13.35 114.29 12.46 107.99 14.85 119.16 11.27 115.38 10.054B 56.08 12.86 59.71 12.02 46.41 9.30 58.82 10.22 69.15 8.185B 62.15 8.97 63.32 9.17 60.29 8.99 67.15 8.29 60.65 9.136B 38.71 8.39 41.11 7.72 33.01 7.31 41.75 7.37 40.30 7.357B 48.96 9.42 48.89 9.82 49.86 8.55 52.69 9.32 47.28 8.70
CosmeticConditions N = 520 N = 233 N = 163 N = 93 N = 40
1C 65.72 11.96 68.79 10.96 62.34 11.97 72.06 9.43 67.28 10.592C 75.47 13.95 75.30 13.27 77.69 14.41 81.82 11.15 76.50 10.643C 59.30 7.44 61.27 5.93 56.01 8.28 62.81 4.91 62.18 5.114C 39.67 6.83 40.99 6.39 36.98 6.77 40.47 6.13 44.28 4.615C 41.49 7.32 41.06 7.11 42.34 7.21 41.36 7.08 41.45 6.636C 32.95 7.56 33.50 7.11 31.75 7.46 34.96 6.11 37.95 6.01
aFor most factors, a low score suggests a more negative attitude than does a high score. The exceptions are 4A,4B and 4C for which a low score is interpreted as "overfavorability," and 6A and 6B where a low score reflectsdistressed identification with the disabled.
bPhysical Therapy Students and Psychology Students are part of the Repeat Group, and the Repeat and High SchoolGroups are part of the Development Sample.

APPENDIX C
FACTOR ANALYSIS OF 145 IMPUTATION ITEISS AND 4 DEMOGRAPHIC VARIABLES. 7 FACTOR ROTATION (VARIHAX). N = 483DES 1 (IA) 2 (4A) 3 (3A) 4 (7A) S (5A) 6 7Items Nos.49 :--1376832- 1:17121334- 0.1116 -0.1411 0.0166-71 -0.5797 0.0069 0.3559 0.0254 0.0832 -0.1960 0.029555 b34 -0.3bU5 .21A53 -1.1.193L 0.10/9 -0.0902 -0.141260 0.5306 -0.1138 0.0781 0.0314 0.1181 -0.1983 - 0.2424-44 g1175249 =0:0321 0.1427- --=M-.2788 - 6.107112 r0.5164 -0.0435 0.4462 -0.0782 -0.0358 -0.1575 0.17178/ i-D+515T -0.03-69-117077_26 f-0.5159 -0.1143 0.3319 -0.0483 0.0156 -0.0370 - 0.056820 .0.5119 u.UU99 0.414C -0.013Z/ -0.0080 -0.0866 0.111u-34 -0.5014 -0.0126 0.2624 -0.1897 -0.0051 -0.0581 0.061016 7-7:513113 11:31112' U.11bb -0.1821 Ri:0884-98 -0.4936 -0.1575 0.2397 -0.1405 0.1483 -0.2220 -0.0974
-0.169 U -0.0031r =u.i8Tr---- 0:7961-0.4039 U 1227" 0.3629101 -0.4764 -0.4636 0.0849 -0.1407 0.1488 -0.0852 -0.210130 -0./13 U.LL91 -U.0993 0.0931 -0.15/1 -0.110382 -0.4627 -0.1426 0.1543 0.0397 0.2719 0.0498 0.146292 --0.1092 -0-a578- -="0:6484-=6:4247' u. 43577 -0.4153 -0.1221 0.0503 -0.0563 0.1035 -0.1623 -0.0763
5 --0:4UBT 0:13155--13:7926-=W0672- -0:0535- ----=D:01"96-66 0.4057 -0.2655 -0.0531 -0.1171 0.0399 -0.1964 -0.1474
0.3906 -0.0434 U.4446 - 0.1074 0.2805 -u.41353-----7571717--0.3986 -0.2744 0.2775 0.0382 0.2273 -0.1010 -0.0981= D:3945 U.Ut, -070-409------072266 0.1519Fr- - u.1205-
46 0.3937 0.0081 -0.2429 0.3948 - 0.3064 0.003822 F0:3923.--=0;7623- .ZU3I -6.772371 ---0.0829 -0.0836 0.0411)
- 0.3891 -0.1940 0.3464 -0.1080 0.0138 -0.2330 -0.174884 707.76517' U.3 91- 0.0401 0..010 0.16/1 - 0.1d94 -0.1111
-0.3791 -0.1431 -0.0042 0.0132 0.2405 0.0787 0.0226=wr3utr -0.C51b -0.0313- U.1 9r 0.0432. 0.0105
-0.3711 0.0387 0.1944 -0.0385 0.2074 -0.2132 0.1835=7:11554--17:13510 -0.0894- -0.00E4-0.3589 -0.2839 0.0909 -0.2451 0.1364 -0.1185 -0.1072-0.3511 -0. 0 U. . 30 0.0716 -0.1496-0.3500 -0.1341 -0.1364 -0.0014 0.2068 -0.1715 -0.0145ru.34f4- -0.0615 -0.2442 -072622- -----6:6378 =0:1865 -0.0529-0.3222 -0.3042 -0.1788 -0.0183 0.1671 0.0046 -0.09950.3057 1. 1 1 1.1 46 - 0.1644 0.2710 -0.2368
-0.2944 -0.1885 0.2458 -0.2116 0.1177 -0.2476 0.1678=Tr:76-6-2- -0.1233 0.2335 -0.2586 -0.0566 -0.1715 0.1134-0.2653 -0.2503 0.1132 -0.0886 0.2533 -0.1252 -0.0867.13774135 063T 0:15573- -0.0247-
48 0.0779 - 0.6922 0.0565 0.0728 0.0582 0.0975 -0.080062 ="0-.T753 0.0016 -0.022Z- - 0.1894 -0.1583 -0.012Y73 ,0.0837 -0.6223 0.1674 0.0584 0.1015 0.1395 -0.068414 =1.17UUT5 -0.601 0.1/80 0.0351 -0.1283 -0.0406 -0.01673295
-0.1069i
-0.6015 0.1312 0.0343 0.1342 0.1201 0.0108-o.r159 -0.5516 0.0762 -0.1183 -0.0061 -0.0851 - 0:0151-0.0801 -0.5372 0.2155 0.0152 -0.1445 -0.0936 - 0.1513
19 -0.0176 -0.5335 -0.0580 0.0700 0.0122 0.1058 -0.1)12T100 -0.0016 -0.5057 -0.2174 0.0180 0.0023 0.0824 -0.0011
94/ 93
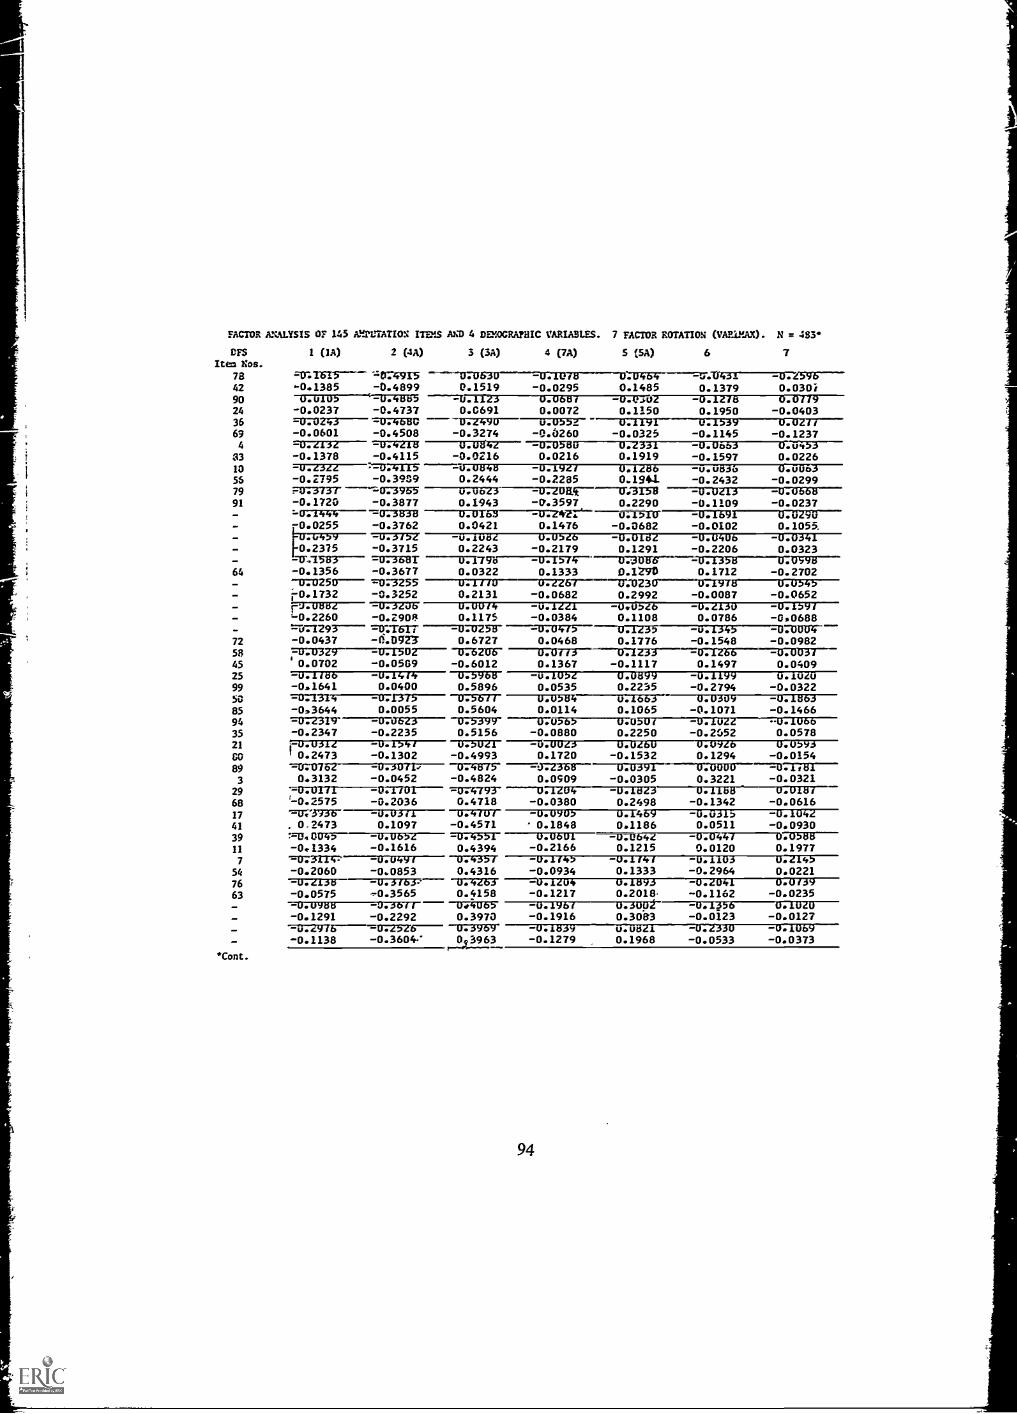
FACTOR ANALYSIS OF 145 AMPUTATION ITEMS AND 4 DEMOGRAPHIC VARIASLES. 7 FACTOR ROTATION (VAEUIAX). N = 483
DFS 1 (1A) 2 (4A) 3 (3A) 4 (7A) 5 (5A) 6 7It Nos.
78 -0:1f431 -0.G59b1:17.16im -874915 0.d631, -U.L0/13 D.U46442 -0.1385 -0.4899 0.1519 -0.0295 0.1485 0.1379 0.030190 u.u1o5 c=074-1385 U.Ubbi -0.eauz -U.i218 0.0/7924 -0.0237 -0.4737 0.0691 0.0072 0.1150 0.1950 -0.040336 0.0243 10746-50 0.1490 0.052 0.1191 0.1539 0.041169 -0.0601 -0.4508 -0.3274 -0.0260 -0.0325 -0.1145 -0.12374 -U.1131 -0.4tid-1371184-2--=177.058u 0.2331 -U.Uo63 0:u45333 -0.1378 -0.4115 -0.0216 0.0216 0.1919 -0.1597 0.022610 7=374715-0.1311 -0.0t148 -U.1911 0.1286 -U.U5J0 0.uuo355 -0.2795 - 0.399 0.2444 -0.2285 0.1941 -0.2432 -0.029979 ..3731 ----=073955 U.o613 -0.4011C--17:3138 -0.0t1.3 -0.0bOb91 -0.1720 -0.3877 0.1943 -0.3597 0.2290 -0.1109 -0.0237
-0.1444 -073830-07.1716-5-0-24- 7. 0.1510r00.0255 -0.3762 0.0421 0.1476 -0.0682 -0.0102 0.1055.=177UV5V---- -0.3 -11.108[ U.U5Gb -0.0101 -U.0406. -0.0341[0.2375 -0.3715 0.2243 -0.2179 0.1291 -0.2206 0.0323
-0.1,74--1373013-6-=07338-7.7:1583 =07368F U.179864 -0.1356 -0.3677 0.0322 0.1333 0.1290 0.1712 -0.2702
-0:0250---- =073255 U.ittO .1161 0:0230 11:4918 U.0,45=0.1732I
-0.3252 0.2131 -0.0682 0.2992 -0.0087 -0.0652ri.odd/ -U.31Ub U.UU14 -u.i.CL1 -Or .16 -0.L130 -0.15910.2260 -0.2908 0.1175 -0.0384 0.1108 0.0786 -0,0688
="0:T617-=137172513- =0.13475-- U.iG3 -u.1345 -U700114--
72 -0.0437 -6.D975 0.6727 0.0468 0.1776 -0.1548 -0.098258 =17:173Z9 -17:1302-07621:05- ----070113 0.1233--1T.1761-=tr.-01M-45 0.0702 -0.0589 -0.6012 0.1367 -0.1117 0.1497 0.040925 u.ltdb U.5966 U.Ubi9 0.102099 -0.1641 0.0400 0.5896 0.0535 0.2235 -0.2794 -0.032258 U.U504 U.161,3 U.0309 -0.1.63= 0:2314 51 U.)blf85 -0 3644 0.0055 0.5604 0.0114 0.1065 -0.1071 -0.146694 mTIrmir-----7=a7UbL3 0.5399 u.U5b> 0.0,11/ -0.11,1/ -U.J.U6b35 -0.2347 -0.2235 0.5156 -0.0880 0.2250 -0.2552 0.057821 U.U311 -U.1541 0.51.111 ----=6.01113 u.u1ou U.1,41b 0.1,593
CO I 0.2473 -0.1302 -0.4993 0.1720 -0.1532 0.1294 -0.015489 =M:072, 0.5 U.41315 -U.13b15 U.U391 U ZIUUO ---=0.1f613 0.3132 -0.0452 -0.4824 0.0909 -0.0305 0.3221 -0.0321
29 =v7017r-----=tra7u1---- =1774793 -----0.1[04 -0.1813 U.1Loo U.U18168 '-0.2575 -0.2036 0.4718 -0.0380 0.2498 -0.1342 -0.061617 -u.0.5c1 0.4101 -u.O905 U.1469 -0.0315 -0.104141 0.2473 0.1097 -0.4571 0.1848 0.1186 0.0511 -0.093039 793.01745- --U.Ub51 -U.4551 U.06U1 -11Due,41 -0.04-47------0.058d11 -0.1334 -0.1616 0.4394 -0.2166 0.1215 0.0120 0.19777 ='0:311A7 -0.041 U.4351 -U.1141 -U.1103 0.1145
54 -0.2060 -0.0853 0.4316 -0.0934 0.1333 -0.2964 0.022176 -U.11313 -U.31b3- 0.4163 - .1 U4 -t. t463 -0.0575 ,0.3565 0.4158 -0.1217 0.2018, -0.1162 -0.0235
-0.09dd -0.3611 044065 -u.ivor u.3up -0.1.256 U.1.010-0.1291 -0.2292 0.3970 -0.1916 0.3083 -0.0123 -0.0127-U.4V10 H:700Z>Z6---- U.3969 -0.1839 u.unG1 -0.1330 -0.1069-0.1138 0 3963 -0.1279 0.1968 -0.0533 -0.0373
'Cont.
94
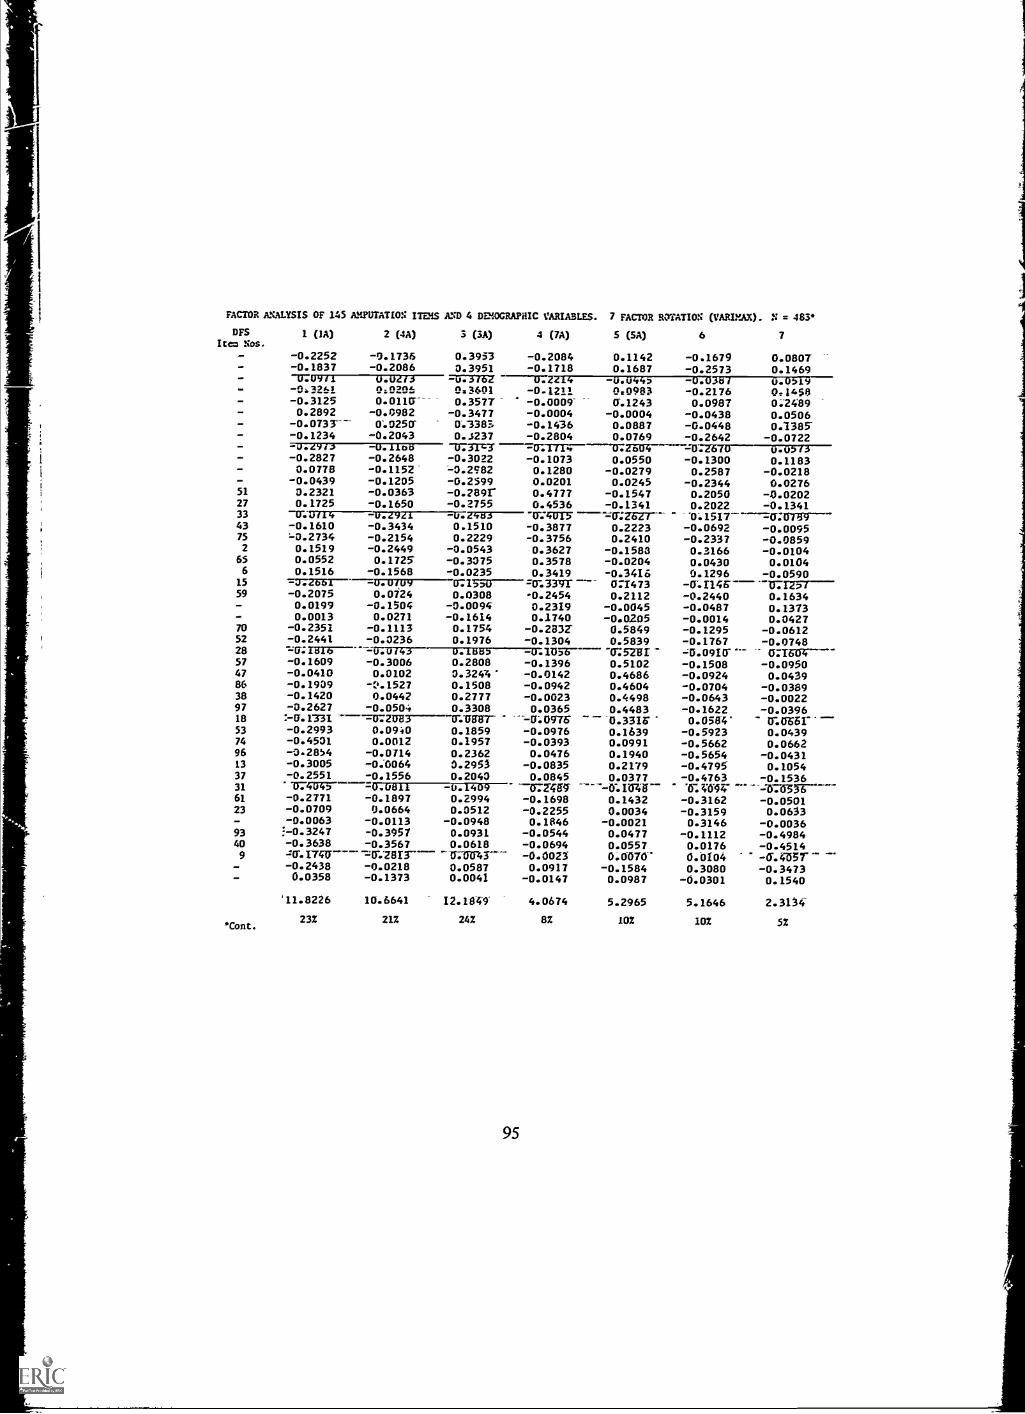
FACTOR ANALYSIS OF 145 AMPUTATION ITEMS AND 4 DEMOGRAPHIC VARIAB LES. 7 FACTOR ROTATION (VARIMAX). N = 483*
DFS 1 (IA) 2 (4A) 3 (3A) 4 (7A) S (SA) 6 7Item Nos.
-0.2252 -0.1736 0.3953 -0.2084 0.1142 -0.1679 0.0807-0.1837 -0.2086 0.3951 -0.1718 0.1687 -0.2573 0.1469-17709(1_e 1,42
u.uzis0:0206
-u.$161045601
4-0-1211
- 7
0409853117-17/713519--
-0.2176 041454-0.3125 0.0116 0.3577 -0.0009 0.1243 0.0987 0:24890.2892 -0.0982 -0.3477 -0.0004 -0.0004 -0.0438 0.0506
-0.0733 0.0256 0.3385 -0.1436 0.0887 -0.0448 0.1385-0.1234 -0.2043 0.5237 -0.2804 0.0769 -0.2642 -0.0722-J.C913 -u.iLou -1473T97 --I:Lot/4 =0.16/0 0.05/3-0.2827 -0.2648 -0.3022 -0.1073 0.0550 -0.1300 0.11830.0778 -0.1152 -0.2982 0.1280 -0.0279 0.2587 -0.0218
-0.0439 -0.1205 -0.2599 0.0201 0.0245 -0.2344 0.027651 0.2321 -0.0363 -0.289r 0.4777 -0.1547 0.2050 -0.020227 0.1725 -0.1650 -0.2755 0.4536 -0.1341 0.2022 -0.134133 -17'.4.13729zi u.46 17.401-5 0.1517 -17.618943 -0.1610 -0.3434 0.1510 -0.3877 0.2223 -0.0692 -0.009575 -0.2734 -0.2154 0.2229 -0.3756 0.2410 -0.2337 -0.08592 0.1519 -0.2449 -0.0543 0.3627 -0.1583 0.3166 -0.010465 0.0552 0.1725 -0.3075 0.3578 -0.0204 0.0430 0.01046
150.1516 -0.1568 -0.0235 0.3419 -0.3416 0.1296
-u.rics----0.0590
=7:2E5T-- ---RT.-1771117-137.17yi; -0:339T 0:147359 -0.2075 0.0724 0.0308 -0.2454 0.2112 -0.2440 0.1634
0.0199 -0.1504 -0.0094 0.2319 -0.0045 -0.0487 0.13730.0013 0.0271 -0.1614 0.1740 -0.0205 -0.0014 0.0427
70 -0.2351 -0.1113 0.1754 -0.2831 0.5849 -0.1295 -0.061252 -0.2441 -0.0236 0.1976 -0.1304 0.5839 -0.1767 -0.074828 -0.0/43 0.1.ubo-----=1G1D5S-- 0:5ZUI -0.0910" 6:760457 -0.1609 -0.3006 0.2808 -0.1396 0.5102 -0.1508 -0.095047 -0.0410 0.0102 0.3244' -0.0142 0.4686 -0.0924 0.043986 -0.1939 -0.1527 0.1508 -0.0942 0.4604 -0.0704 -0.038938 -0.1420 0.0442 0.2777 -0.0023 0.4498 -0.0643 -0.002297 -0.2627 -0.050-4 0.3308 0.0365 0.4483 -0.1622 -0.039618 -0.0976 0.3516 0.0564 1310661-:-0.1331 21783 0.080753 -0.2993 0.0940 0.1859 -0.0976 0.1639 - 0.5923 0.043974 -0.4501 0.0012 0.1957 -0.0393 0.0991 -0.5662 0.066296 -3-2854 -0.0714 0.2362 0.0476 0.1940 -0.5654 -0.043113 -0.3005 -0.0064 0.2953 -0.0835 0.2179 -0.4795 0.105437 -0.2551 -0.1556 0.2040 0.0845 0.0377 -0.4763
-0:4.0424-
-0.153631 774045 -0.0811 -0.1409 -072469-61 -0.2771 -0.1897 0.2994 -0.1698 0.1432 -0.3162 -0.050123 -0.0709 0.0664 0.0512 -0.2255 0.0034 -0.3159 0.0653
-0.0063 -0.0113 -0.0948 0.1846 -0.0021 0.3146 -0.003693 i-0.3247 -0.3957 0.0931 -0.0544 0.0477 -0.1112 -0.498440 -0.3638 -0.3567 0.0618 -0.0694 0.0557 0.0176 -0.45149 -:6.1746- -'0".2813--- -11:111143--- -0.0023 0.0070' 0.0104 -6.057_-
- 0.2438 -0.0218 0.0587 0.0917 -0.1584 0.3080 - 0.34730.0358 -0.1373 0.0041 -0.0147 0.0987 -0.0301 0.1540
'11.8226 10.6641 12.1849 4.0614 5.2965 5.1646 2.3154-
232 21Z 242 8Z 102 102 52*Cont.
95

FACTOR ANALYSIS OF 145 AMPUTATION ITEMS AND 4 DEMOGRAPHIC VARIABLES. 9 FACTOR ROTATION (VARIMAX). N = 483
DFS1 2 3 4 (2A) 5 6 7 q 9 (6A)
Item Nos.
72 =0.6872- - 0.1001 -0:6570 -0.1561 co. Mr 0.0204 -0.105'9 0.0093 0.0040
58 -0.6192 -0.1619 0.0399 - 0.l'36 0.1064 -0.0596 0.0150 0.0405 0.0530
99 -0.6080 0.0300 -0.1606 -0.2863 0.1710 -0.0303 -0.0863 0.0226 - 0.0051
45 0.5939 -0.0535 0.0402 0.1758 -0.1248 -0.1170 -0.0737 0.0546 -0.0216
85 -0.61395 0.0142 -6:3873" -0.1113 6:33748 -0.0026 0.0008 =43743 imricr--
50 -0.5869 -0.1315 -0.1547 0.0251 0.1248 0.0206 -0.0765 0.0314 0.1301
25 -0.5841 ---=6713-7-4-=1--0.31-2 - 0.1318- 0."11 -2 -0.76-4n O. fifir2 -0.0084 -0.0736
94 -0.5478 -0.0592 -0.1986 -0.1422 0.3029 0.0040 -0.0080 0.0793 0.0975
35 -=0.779131----=M229/ -0.1655 -0.2664 0.4046 0.0161 0...,968 0.1113 0.0198
21 -0.4980 -0.1627 -0.0153 0.0912 0.0535 -0.0183 0.1327 -0.0118 -0.0319
80 0.4941 ---=0G1489 0.4093 0.1(9( -0.1132 -0.1091 -0.1501 017623Z67r2C0-17 -0.4862 -0.0251 -0.3985 -0.0609 0.1512 0.0491 0.1115 -0.0440 0.0573
89 - 0.4818 -6729'69-=671137 -0.0229 0.0211 0.3192 -0.o2FE -0.036 0.0420
29 0.4806 -0.1614 -0.0171 0.1150 -0.2062 -0.0785 -0.0327 0.0946 0.0362
3 0.4724 -0.0418 0.2287 0.3806 - 0.0338 -0.0213 -0.1546 0.0098 -0.0171
68 -0.4611 -0.2006 -0.1956 -0.2348 0.1886 0.1073 -0.0022 0.1985 0.1320
20 -0.4566 0.0120 ="6:3-960 -0.2088 -0.0151 0.093 0.2832 0.1623 -0.0088
39 0.4556 -0.0631 - 0.0040 -0.0368 - 0.0694 -0.0840 -0.0273 0.0188 -0.0188
41 0.4258 0.1104-----0.T00 r-----emat------0.1022 -0.1667 -0.2512 -0.0683 0.02-54
54 -0.4183 -0.0908 -0.1436 -0.3636 0.1037 0.0914 0.0444 0.0680 0.0017
76 =b7,74.777 7 -0.3827 -0.2050 -0.2487 0.1647 0.1149 0.0488 0.0455 -0.1108
11 -0.4049 -0.1714 -0.0530 -0.0525 0.2030 0.0841 0.3389 -0.0093 -0.0416
63 -0.4e3r -0.3599 -0.0563 -0.1578 6.1135 o.i672 -0.0204 0.0545 0.0052
- -0.3984 -0.3599 -0.1526 -0.0531 0.2026 0.1121 0.0283 -0.0652 -0.0245
- -0.3944 ---=.67253B -0. oo -0. o 0.0 0 0. 0 0 0.0150 -0.0202 0.0212
- -0.3895 -0.2283 -0.1368 -0.0473 0.3319 0.1476 0.0915 -0.0229 0.0214
- -0.3861 -0.3/67 -0.0804 -0.1829 0.3177 0.1430 0.1093 0.0132 -0.0035
- -0.3710 -0.1767 -0.1689 -0.2480 0.1178 0.1758 0.1543 0.0523 -0.0456
- -0.3646 -0.2193 -0.0977 -0.3375 0. 0.0 O. 0.0553 -o.o
- 0.3536 0.0221 0.0704 0.0522 -0.0135 -0.3163 -0.0393 -0.1268 -0.0123
- 6733W -0.1064 0.-2477 0.0075 0.0095 -0.0056 -0.1106 -0.0685 -0.0753
- -0.3368 0.0023 -0.2056 -0.0177 0.1174 -0.0219 0.2485 0.2688 -0.1056
- -0.3304 0.0158 -0.1858 -0.3180 10.1408 -0.0117 0.3030 0.0601 0.0713
- -0.3250 -0.2022 -0.1844 -0.2521 0.0804 0.2550 -0.0103 -0.1825 -0.1234
- -0.3110 0.0 0.00 - 0.09.1 0.1483 0.0417 0.2436 0.0004 0.0033
- 0.3034 -0.2588 -0.2891 -0.1322 0.0982 -0.0428 0.1549 -0.0939 -0.0813
- 0.2911 -0.1086 0.0483 0.2740 -0.0387 -0.0792 -0.0561 0.0758 o.o5713-- 0.2571 -0.1214 -0.0432 -0.2108 0.0322 -0.0945 -0.0226 -0.0806 0.0031
48 -=5715672- ---=-676839 -0.1391 0.0925 -0.0125 0.0568 -0.1358 0.1199 0.0256
62 0.0069 -0.6754 0.0630 -0.0923 -0.1614 -0.0127 0.0106 -0.1909 0.0148
73 -0.1590 -0.6145 -0.0836 0.0929 0.0505 0.0519 -0.0418 0.1785 0.1469
14 -0.1872 -0.6073 -0.0662 0.0434 -0.0886 -0.0956 0.0565 -0.2135 -0.0133
32 -0.1116 -0.5913 -0.0886 0.0689 0.1089 0.0171 0.0356 0.1?,21 0.1140
95 -0.0665 -0.5521 -0.1332 -0.0815 0.0148 0.0774 0.0761 -0.0928 0.0307-075131--
- -0.2268 4-0.5343 -0.0003 -0.0228 -0.1687 0.0551 -0.1328 -0.1475
19 0.0629 -0.5281 -0.0340 0.1077 0.0135 -0.0604 0.0238 0.01157 0.1150
100 0.2090 -0.4991 -0.0628 0.1315 0.0567 -0.1104 0.0584 -0.1680 0.0375
90 0.1164 -0.4939 0.0039 -0.0988 - 0.0282 -0.1029 -0.0011 -0.0363 -0.0268
42 -0.1274 -0.4846 -0.0851 0.0537 0.1388 0.0602 0.1104 0.1898 0.1510
36 -0.2415 -0.4698 -0.0233 0.1238 0.0921 0.0135 0.04371 0.1446 0.0319
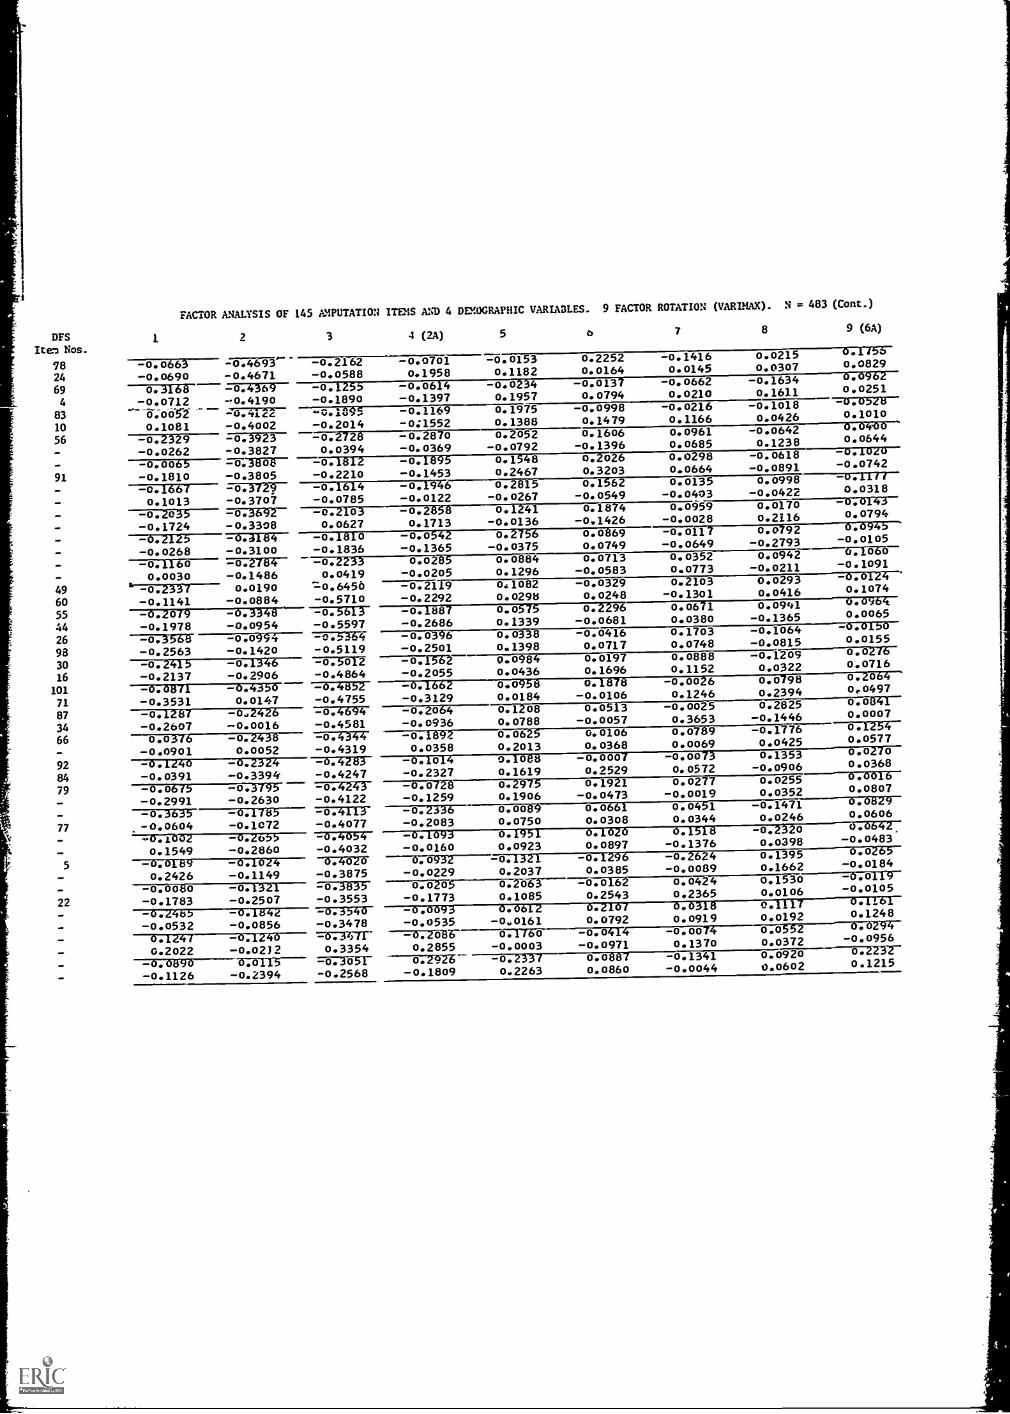
DFSIt Nos.
FACTOR ANALYSIS OF 145 AMPUTATION ITEMS AND 4 DV.OGRAPHIC VARIADLES.
1 2 3 4 (2A) 5
9 FACTOR ROTATION (VARLMAX). N = 483 (Cont.)
t, 7 8 9 (6A)
78 -0.0663 - o.4693- -0.2162 -0.0701 -0.0153 0.2252 -0.1416 0.0215 0.1756
24 -0.0690 -0.4671 -0.0588 0.1958 0.1182 0.0164 0.0145 0.0307 0.0829
69 0.3168 -0.4369 -0.1255 -0.0614 -0.0234 -0.0137 -0.0662 -0.1634 0.0962
4 -0.0712 -0.4190 -0.1890 -0.1397 0.1957 0.0794 0.0210 0.1611 0.0251
83 -?-1.005-2' -137rtrIT- -0.1895 -0.1169 0.1975 -0.0998 -0.0216 -0.1018 -0.0528
10 0.1081 -0.4002 -0.2014 -0;1552 0.1388 0.1479 0.1166 0.0426 0.1010
56 -0.2329 -0.3923 -0.2728 -0.2870 0.2052 0.1606 0.0961 -0.0642 0.04.00
- -0.0262 -0.3827 0.0394 -0.0369 -0.0792 -0.1396 0.0685 0.1238 0.0644
- -0.0065 -0.3808 -0.1812 -0.1895 0.1548 0.2026 0.0298 -0.0618 -0.1020
91 -0.1810 -0.3805 -0.2210 -0.1453 0.2467 0.3203 0.0664 -0.0891 -0.0742
- -0.1667 -0.3729. -0.1614 -0.1946 0.2815 0.1562 0.0135 0.0998 -0.1111
- 0.1013 -0.3707 -0.0785 -0.0122 -0.0267 -0.0549 -0.0403 -0.0422 0.0318
- -0.2035 -0.3692 -0.2103 -0.2858 0.1241 0.1874 0.0959 0.0170 -0.0143
-0.1724 -0.3308 0.0627 0.1713 -0.0136 -0.1426 -0.0028 0.2116 0.0794
- -0.2125 - 0.3184 -0.1810 -0.0542 0.2756 0.0869 -0.0117 0.0792 0.0945
- -0.0268 -0.3100 -0.1836 -0.1365 -0.0375 0.0749 -0.0649 -0.2793 -0.0105
- -0.1160 -7672713-4- -0.2233 0.0285 0.0884 0.0713 0.0352 0.0942 0.1060
- 0.0030 -0.1486 0.0419 -0.0205 0.1296 -0.0583 0.0773 -0.0211 -0.1091
49 -0.2337 0.0190 -0.6450 -0.2119 041082 -0.0329 0.2103 0.0293 -0.0124
60 -0.1141 -0.0884 -0.5710 -0.2292 0.0298 0.0248 -0.1301 0.0416 0.1074
55 --672570--=r6733-411- -0.5613 -0.1887 0.0575 0.2296 0.0671 0.0941 0.0964
44 -0.1978 -0.0954 -0.5597 -0.2686 0.1339 -0.0681 0.0380 -0.1365 0.0065
26 -0.3-568 -0.0994 -A.5164 -0.0396 0.0338 -0.0416 0.1703 -0.1064 -0.0150
98 -0.2563 -0.1420 -0.5119 -0.2501 0.1398 0.0717 0.0748 -0.0815 0.0155
300.0984 0.0197 0.0888 -0.1-217976276--
-0.2415 -0.1346 -0.5012 -0.1562
16 -0.2137 -0.2906 -0.4864 -0.2055 0.0436 0.1696 0.1152 0.0322 0.0716
101 -0.08(1 -0.4350 -0.4852 -0.1662 0.0958 0.1878 -0.0026 0.0798 0.2064
71 -0.3531 0.0147 -0.4755 -0.3129 0.0184 -0.0106 0.1246 0.2394 0e0497
87 -0.1287 -0.2426 -0.4694 -0.2064 0.1208 0.0513 -0.0025 0.2825 0.0841
34 - 0.2607 -0.0016 -0.4581 -0.0936 0.0788 -0.0057 0.3653 -0.1446 0.0007
66 0.0316 -0.2438 -0.4344 -0.1892 0.0625 0.0106 0.0789 -0.1776 0.1254
- -0.0901 0.0052 -0.4319 0.0358 0.2013 0.0368 0.0069 0.0425 0.0577
92 -0.1240 -0.2324 -0.4283 -0.1014 0.10e8 -0.0007 -0.0073 0.1353 0.0270
84 -0.0391 -0.3394 -0.4247 -0.2327 0.1619 0.2529 0.0572 -0.0906 0.0368
79 -0.06(5 -0.3795 -0.4243 -0.0728 0.2975 0.1921 0.0277 0.0255 0.0016
- -0.2991 -0.2630 -0.4122 -0.1259 0.1906 -0.0473 -0.0019 0.0352 0.0807
-0.0661 0.0451 -0.1471 0.0829
-0.3635 -0.1785 -0.4113 -0.2336 0.0089
77 .-600604 -0.1072 -0.4077 -0.2083 0.0750 0.0308 0.0344 0.0246 0.0606
- ,--137176,02 -0.2055 -0.4054 -0.1093 0.1951 0.162-0 0.1518 -0.2320 0.0642.
- 0.1549 -0.2860 -0.4032 -0.0160 0.0923 0.0897 -0.1376 0.0398 -0.0483
5 -0.0189 -0.1024 0.4020 ----W70932 -0.1321 -0.1296 -0.2624 0.1395 0.0265
- 0.2426 -0.1149 -0.3875 -0.0229 0.2037 0.0385 -0.0089 0.1662 -0.0184
-
-0.0119-0.0080 -0.1321 -0.3835 0.0205 0.2063 -0.0162 0.0424 0.153o
22 -0.1783 -0.2507 -0.3553 -0.1773 0.1085 0.2543 0.2365 0.0106 -0.0105
- -0.24b5 -0.1844 -0.3540 -0.0093 0.0612 0.2107 0.03118 0.1-117 0.1161
- -0.0532 -0.0856 -0.3478 -0.0535 -0.0161 0.0792 0.0919 0.0192 0.1248
0.124( -0.1240 -0.3411 -0.208-6- 0.1(60 -0.0414 -0.0074 0.0552 0.0294
- 0.2022 -0.0212 0.3354 0.2855 -0.0003 -0.0971 0.1370 0.0372 -0.0956
- -0.0890 0.0115 -0.3051 0.2926 -0.2337 0.0887 -0.1341 0.0920 0.2232
- -0.1126 -0.2394 -0.2568 -0.1809 0.2263 0.0860 -0.0044 0.0602 0.1215
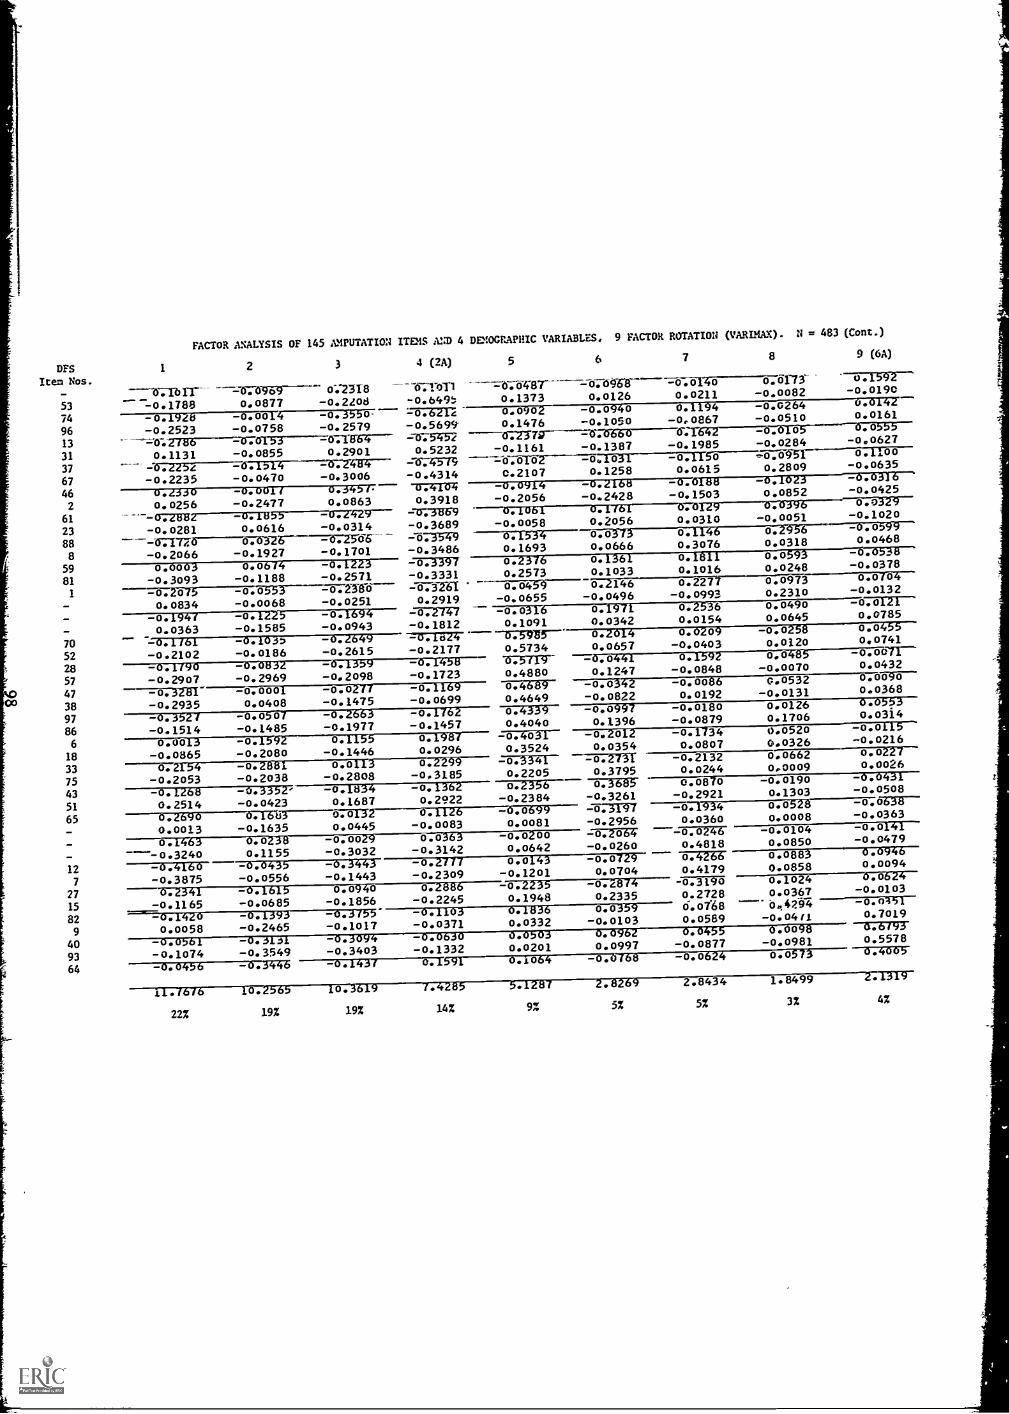
FACTOR ANALYSIS OF 145 AMPUTATION ITEMS AND 4 DEMOGRAPHIC VARIABLES, 9 FACTOR ROTATION (VARIMAX). N = 483 (Cont.)
DFS 1 2 3 4 (2A) 5 6 7 8 9 (6A)
Item Nos.---6:16171--
6:1°11 ---=b.04"87-=W70909 0:2318 -o.01613 -076T40 0.0173 0.1592
53 - 0.1788 0.0877 -0.2208 0.1373 0.0126 0.0211 0.0082 -0.0190
74 -0.1928 -0.0014 -0.3550 -0.62f 0.0902 -0.0940 0.1194 0.0264 0.0142
96 -0.2523 -0.0758 -0.2579 -0.5699. 0.1476 -0.1050 -0.0867 -0.0510 0.0161
13 -0.2786------=U70163 5452 0.2379615-6:1-642 -o.b1-65 0.0555
31 0.1131 -0.0855 0.2901 0.5232 -0.1161 -0.1387 -0.1985 -0.0284 -0.0627
37
- o.o951 o.Iloo-0.2251 - 0.1,14 =6:4579 -0:0702 -0.1031 -o.115o
67 -0.2235 -0.0470 -0.3006 -0.4314 0.2107 0.1258 0.0615 0.2809 -0.0635
46 0.430 -0.0011 0.345 0.4104 -0.0914 -0.2168 --0051813----7-Vra52357571-6--2 0.0256 -0.2477 0.0863 0.3918 -0.2056 -0.2428 -0.1503 0.0852 -0.0425
61 ---072882 - 0.1855 -0;2-4219- - 0.38b9 .o.o329
23 -0.0281 0.0616 -0.0314 -0.3689 - 0.0058 0.2056 0.0310 -0.0051 -0.1020
88 0.6326 -0.2506 -0.3549 0.1534 0.6373 o.1146 0.2956 -0.0599
8 -0.2066 -0.1927 -0.1701 -0.3486 0.1693 0.0666 0.3076 0.0318 0.0468
59 0.0003 0.0674 -0.1223 -0.339( 0.2376 0.1361 0.1811 0.0593 - 0.0538
81 -0.3093 -0.1188 -0.2571 -0.3331 0.2573 0.1033 0.1016 0.0248 -0.0378
1 -0.2075 -0.2550 0.0459 0.2146 0.2277 0.0973 0.0 o
0.0834 -0.0068 -0.0251 0.2919 -0.0655 - 0.0496 -0.0993 0.2310 -0.0132
-co. -0. -0. .:157Y747 -0.0316 0.1971 0.2536 0.0490 -0.01-21
0.0363 -0.1585 -0.0943 -0.1812 0.1091 0.0342 0.0154 0.0645 0.0785
70 -0.1161 -0.1037 -0.2649 -0.Lo24 -575-935 0.2014 0.0209 -0.0258 0.0455
52 -0.2102 - 0.0186 -0.2615 -0.2177 0.5734 0.0657 -0.0403 0.0120 0.0741
28 -0.1/90 -0.0832 -0.1359 -0. I458 0.511-9- -076441. 0.1592 0.0485 -0.007=
57 002907 -0.2969 -o.2o98 -0.1723 0.4880 0.1247 -0.0848 - 0.0070 0.0432
47 -0.3281 -0.000 -0.0 -0. 0.4689 -7=673-342 -003086 0.0532 0.0W--
38 -0.2935 0.0408 -0.1475 -0.0699 0.4649 -0.0822 0.0192 -0.0131 0.0368
97 -0.3527 - 0.0507 -0.2663 -0.1762 0.4339 -0.0997 -0.0180 0..0126 0.0553
86 -0.1514 -0.1485 -0.1977 -0.1457 0.4040 0.1396 -0.0879 0.1706 0.0314
6 0.0013 -0.1592 0.1155 0.1917-- -0.4031 -0.2012 -0.1734 0.0520 -0.0115
18
33
-0.0865 -0.2080-0.2881
-0.14460.0113
0.02960.2299
0.3524 0.0354 0.0807 0.0326 -0.0226--15Z0
0.2154-0.3341 - 0.2731 -0.2132 0,0662 2127--
75 -0.2053 -0.2038 -0.2808 -0.3185 0.2205 0.3795 0.0244 0..0009 0.0026
43 -0.1268 -0.3352' 0.1834 -0.1362- 0.2356 0.3685 0.0870 -0.0190 -0.0431
51 0.2514 -0.0423 0.1687 0.2922 '43.2384 -0.3261 -0.2921 0.1303 -0.0508
65 o. 83 0.0132 0.1126 -0.0699 -0.3197 -0;13N7-----0052-8------=5:0638
0.0013 -0.1635 0.0445 -0.0083 0.0081 -0.2956 0.0360 0.0008 -0.0363
0.1463 0.0238 -003029 0.0363 000200 -0.2064 -0.0246 -0.0104 -0.0141
-----0.3240 0.1155 -0.3032 -0.3142 0.0642 -0.0260 0.4818 0.0850 -0.0479
12 -0.4160 -0.0435 -0.3443 .C:102/77 0.0143 -0.0729 0.4266 0.0885 0.0946
7 -0.3875 -0.0556 -0.1443 -0.2309 -0.1201 0.0704 0.4179 0.0858 0.0094
270 .0 0 co. -0.2235 -0.2874 45731 O 0.1024 6.0624
15 -0.1165 -0.0685 -0.1856 -0.2245 0.1948 0.2335 0.2728 0.0367 -0.0103
82 - 0.1420 -0.1393 -0.3155 -0.1103 0.1836 0.0359 6.0768 042§4 -0.0151
9 0.0058 -0.2465 -0.1017 -0.0371 0.0332 - 0.0103 0.0589 0.04/1 0.7019
40 -0.0561 -0.3131 -0.5094 - 0.0630 0.003 0.0962 0.045 0.0098 0.6/93
93 -0.1074 -0.3549 -0.3403 -0.1332 0.0201 0.0997 -0.0877 -0.0981 0.5578
64 -0.0456 -0.3446 -0.1437 0.1591 0.1064 -0.0/68 -0.0624 0.0573 0.4005
11.7676 10.2565 10.3619 7.4285 5.1287 2.8269 2.8434 1.8499 2-:1319
222 19% 19% 14% 9% 5% 5% 32 42

DFSIt Hos .
556087
5110
37
14
73
802
19
2591
29
4223
3347
9664
6878
5
3334
100__
-94-
--20_
--__
9871
3 *-0:-.20-u----"0-:6450
82
35
7
FACTOR ANALYSIS OF 145
1 (38) 2 (4B)
-0.7029 0.0207
BLINDNESS ITS AND 4 DMGRAPHIC VARIABLES.
3 (78) 4 (68) S (58)
- 0.0169 0.0043 -0.0307-0.1471 0.0333 -0.1168-0.1416 0.0045 -0.1374
9 FACTOR ROTATION (VARIMAX).
6 (18) 7 (2B)
-0.1094 0.0459-0.1092 0.1886-0.1226 0.1953
N = 471
-0.1509-0.0373- 0.1551
9
-0.00440.04140.06671=0.6684 07078-9
.-0.5976 0.0227-0.5811 0.1149-0.5745 0.0934
0.01630.0724
-0.0110-0.1436
0.005'6-0.0353
-0.1254-0.08080.1749
-0.0529
-0.2521-0.10160.0197
-0.1996
0.1372.-0.1477-0.0-653-0.0260
-0.08890.0002-0.0700-C.C618
0.16140.01251.10.2547(40.544/ 0.102-0
-0.5087 0.0528FIT:W96 -0-.1413101-0.4939 0.0039
0.1716-0.1509=1171311-0.0253-0.1184-0.0959
07033-60.09630.03130.0014
-0.05Z70.0005
-0.0926-0.22210.0165-0.0455-0.0349-0.2076
-0.2022-0.0875-0.05250.0333
0.13440.0821
-0.0851-0.C173
-0.C797-0.1066-0.0839-0.1410
0.3f540.09900.23630.0769
:-0.4939 --T7.011.9:-0.4908 0.0198FIL4899 -0.0349-0.4858 0.2564
-0.1950-0.0186
-0.1622
-0.4782-0.1566
0.13220.0863
-0.C248-0.0856'
-0.06680.182't
0.4154 0.133721-0.4514 061007 -0.1001
-0.0161-0.0021
0.0774-0.1850
-0.2477-0.1666
-C.15550.1252'
b.00940.1562
-s, 0.3064-0.4481 0.0198
-0.0465-0.0946
-0.1686-0.0782
-0.1306-0.0851
-0.0765-0.0535
0.07970.1459
0.C802-0.0013
U.16)90.0242
=0744.69- 0.2165----7=071074 ----0w157-0.4420 0.1153 -0.0748 -0.0141-0743711---- -13:17913---=0:13725735-61/0.4329 0.2343 0.1705 0.0155
-0.2359-0.3619
-0.1293-0.1391
0.13040.1878
-0.1534-0.1669
b.26560.2293
-0.13500.1444
-0.30550.1162
-0.0726-0.1843
-0.20580.0480
0.1049-0.0600
,-0.431Z 0.2195-0.4278 0.1893"0'. 4270' -0=27--0:T8-5-6--0.4252 -0.18470; 4075 -070757-
-0.4035 -0.1637
-0.1652-0.2426
-0.0724-0.0275
-0.0647-0.1825
-0.2358-0.0903
0.2120-0.0751
-0.10810.0537
0.18400.2642
-0.1489'0...00-75-0.0448
0.0878-0.1156
0.0371-0.0544
0.2287-0.4129
-0.35360.1791
-0.0230'-0.1239
-0.0t310.1293
-0.0401-0.2412
0.0323-0.1557
0.0456-0.2694
-0.09470.1434
C.0441-C.2853 0.0341
914 0.24430.3943 0.1107
-0.11310.0597
-0.1907 -0.22660.1282 0.0302
-0.12500.1511-0.35680.0723
-C.0853-0.0162
-0.1403-0.0129
0.12150.1215-0.0201
070-21-9--0.0152-07311-41- Cr.T337----=0.
0.3751 -0.04881-=0:370-- uzr4-54---
0.3684 0.3478
10 320.2568
-0.7071.2----7=67207 50.1043 0.0658
0.1301-0.1662
-0.1522-0.0703
-o.run0.0354
-0.1594-0.0147
-0.0979-0.0566
-0.3167-0.0760
0.13900.0140
-0.1538-0.1032
0.18550.0761
=7)535- 0.0190-0.3267 0.0589
0.0572-0.0200
-0.0362-0.0317
0.0863-0.1981
0.0263-0.2337
-0.31360.0584
-0.0587-0.0170
-0.0570-0.0007
-=Dazsir- 0:1-0/-0.2738 0.2020
-0.0920-0.2604
---=0714010.0880
-0.1917-0.1008
.08840.1146
-0.2843-0.11830.02990.0735
-0.2180-0.0458-0.24330.0641
0.15250.13350.2242
-0.1347
0.1459,-0.06110.0416-0.C311
o.22610.26400.06790.13277=V.4114 0.1843-
0.1835 0.13380.1136 0.69150.0635 0.6508
0.0165-0.0168
-0.0719-0.1339
0.00940.1107
-0.07210.1541
0.C3040.C870
0.01000.0677C.1084
-0.0633
-0.03790.11000.1412-0.0101
-0.0128 0.617007.0705----- 07595-9-0.1127 0.5877
-0.03600.0212
-0.10550.0061
0.0849-0.0893
0.0414-0.0646
-0.0172-0.C128
0.07300.0028
-0.0604-0.0859
-0.6285-0.0129
-0.03570.0603
0.0603-0.1114
0.0230-0.0592
-0.08850.0227
105
53
13
92
-
H070677-----Tr.55050.0969 0.5283
-0.16790.0014
-0.1525-0.1866
-0.1252-0.0904-0.0261-0.0069
-0.00200.1118
-0.1348-0.0380
0.07740.0306-0.07290.1864
-0.01060.03061
-0.0885-C.C806
0.19340.0917
-0.0935.-0.2560=0;138T4- -0";5201
-0.1013 0.49160:2590.---W47-0--
076684-0.1319
0.0957-0.0723
0.1119 -0.1460 0.2705 -0.0272 0.0583 0.1629

DFSItem Nos.
85 1-0.0449 0.4704 -0.089721 0.04854 60-8-- 0.073b57 -0.0573 0.4590 0.160948 -0.1530 0.4501 -0.007430 -0.1566 0.4358 0.072263 0.3243 0.4285 -0.042743 0.0257 0.4265. -0.1228- -0.0045 0.3737-- -0.3177
0.2910 0.3578 0.2577- 0.0677 0.3469 0.0124- 0.0104 0.3464 0.1928=70-.760 --0.5351-- - 0.11820.0285 0.3149 -0.0565
0.3037 -7=0.13360.2996 -0.00510.2844 -0.01260.2715 -0.09030.2443 -0.13820.0730 -0.5889
. 1 -----676898 -031670.0787 0.1335 0.5509
- 0.1041 -0.0033 -0.51830.0630 -0.0314 -0.4661
FACTOR ANALYSIS OF 145 BLINDNESS ITEMS AND 4 DEMOGRAPHIC VARIABLES. 9 FACTOR ROTATION (VARIMAX). N = 477 (Cont.)
1 (3B) 2 (4B) 3 (7B)
2-2
5-9
6-7
56
32
27
8
74
54
15
81
44104
39
49
- 0.0844
-0.2376
-0.1810 0.0503 ----=0.4536I-.
CDCD -0.2929 0.0782 -0.4406
97
4024
5877
45
12
61
28
76
6
70
26
95
79
83
89
0.2094 0.2631 0.42950.3077 0.301_9 0.42920.1932 0.0450 0.4191
- 0.0199 0.0063 -0.41230.27D7) -1572-5-a-- 0.4042
1-0.1396 0.1189 -0.32801- G1f0297- -0.1722 -0.3238- 0.0051 0.1477 -0.2908=0740636 0.2728 -0.02250.1477. 0.2197 0400130.0019 0.1625 0.0401
1 0.1052 0.3091 0.0635f-0.0208 0.0975 0.0949-0.0714 0.3573 -0.0742L0.2181 -0.0337 -0.0495- 0.0862 0.1790 -0.1991
44 -0.1142- 0.2657 0.0682 -0.1492-0.1071 0.0098 -0.0940-0.3992 0.0284 -0.00700.2134 -0.0448 -0.0673-0.4056 0.0012 -0.02880.2940 -0.1076 -0.2628
1-g.180.1355 -0.07279--0.1178 -0.1119
- .
4 (6B) S (SB) 6 (1B) 7 (2B) 9
-0.3159 -0.0119 -0.0819 0.1C75 0.C335 0.1490
-0.0604 -0.0589 -0.0989 -0.0159 0.0556 1T:0527
0.0364 0.0889 -0.0476 -0.12E3 -0.0711 -0.0343
-0.0883 -0.1752 -0.0983 0.961.4 -0.0257 J.LLL4
0.0431 -0.0115 -0.0752 -040657 -0.1383 0.0371
0.0508 -0.0433 -0.0449 0.0158 -0.C138-0.0845 -0.0506 0.0690 0.0090 -0.C867 0.1112
0.0309 -0.1449 -0.0537 0.0948 -0.216e-0.0677 0.2016 0.0497 -0.1552 0.C580 -0.0905
-0.1472 0.0659 -0.0724 0.0E71 0.0220 0.11/2
0.034: 0.3363 -0.0578 -0.0464 0.0166 -0.0684
-0.0811 -0.1563 -0.1428 -0.0034 0.0487-0.0955 -0.1416 -0.1510 0.C648 0.0325 0.2d94
-0.06762 -0.1804 -0.1932 0.2116 -C.0629 0.2564
-0.2223 -0.1320 -0.1529 0.0215 0.1268 0.0589
-0.0938 -0.0514 -0.2272 -0.C247 -66.1141 0.0(32
-0.0934 -0.2307 -0.2318 0.0785 -0.1762 0.1082---0;11-37---0.0892 -0.1579 -0.1760 0.C935 -0.244C
0.0170 -0.0126 -0.0725 -0.0556 -0.0434 0.0347
0.0424 ----070885----0.0888 -0.0201 -0.0537 -0.01500.0974 0.0556 0.1561 -0.4133 0.1161 -0.0358
-0.0356 -0.0545 -0.0926 0.1524 -0.0920 0.01d/
0.0326 -0.0701 -0.0956 -0.0336 0.0526 0.1296
0.0185 -0.0282 -0.1032 0.-4456 -0.3042 -0 0167
-0.0158 -0.0231 -0.0237 0.3488 -0.3249 -0.0382 1
-0.0836 0.2907 0.1087 -0.0636 -C.1013 -0-4119-10
-0.0904 0.2366 0.0116 -0.1968 0.0793 -0.1315
0.1341 0.0951 0.1062 -0.0578 -0.0667 -0.0469
0.0507 -0.0205 -0.1032 0.1273 -0.1642 0.1890
-0.0384 0.1947 0.0069 -0.1397 -C.0161 -0.1944
-0.0240 -0.1723 -0.1350 0.0174 -0.0960 0.1865
0.1030 -0.2926 -0.0221 0.C810 -0.13051 0.2772'
-0.1306 -0.1714 -0.1135 0.1018 0.0021 0.2793
-0.7040 -0.0800 -0.0908 0.1054 -0.1315' 0.0314
-0.6864 -0.0297 -0.1584 0.1121 -C.1135 0.1343-6.0088-0.6599 0.0311 -0.0574 0.0626 -0.0e25
-0.4482 -0.0909 -0.0017 -0.0660 0.0096 -0.0424---tr:09o7-0.3885 -0.0754 -0.2838 -0.0424 0.0749
-0.3839 -0.0287 -0.3424 0.1781 0.C14C 0.2430
-0.3663 -0.0902 -0.1385 0.0434 -0.3552-------07757----0.3589 -0.2255 -0.1201 0.2222 -0.1343 0.1248
--=Maz313--0.3393 -0.1343 -0.2308 0.0645 0.027-0.1623 -0.5360 -0.0530 0.1398 - 0.0260 0.1870
-0.1006. -0.5209 -0.1010 -0.0204 -0.054 0.1502
-0.0604 -0.5101 -0.1130 0.0478 -0.1604 0.1432
0.0156 -0.4232 -0.1351 -0.0535 -0.C638 -0.0166
-0.025 -0.4121 -0.0975 0.2017 -0.0124 0.0594
-----0:2753-0.0913 -0.3760 -0.2039 0.1348 -0.1497-0.1394- 0.1654
-0.3723 -0.3114 0.08010.2345
-0.2051 0.0470
-c.Z1-74 M0766----0.3506 -0.1844
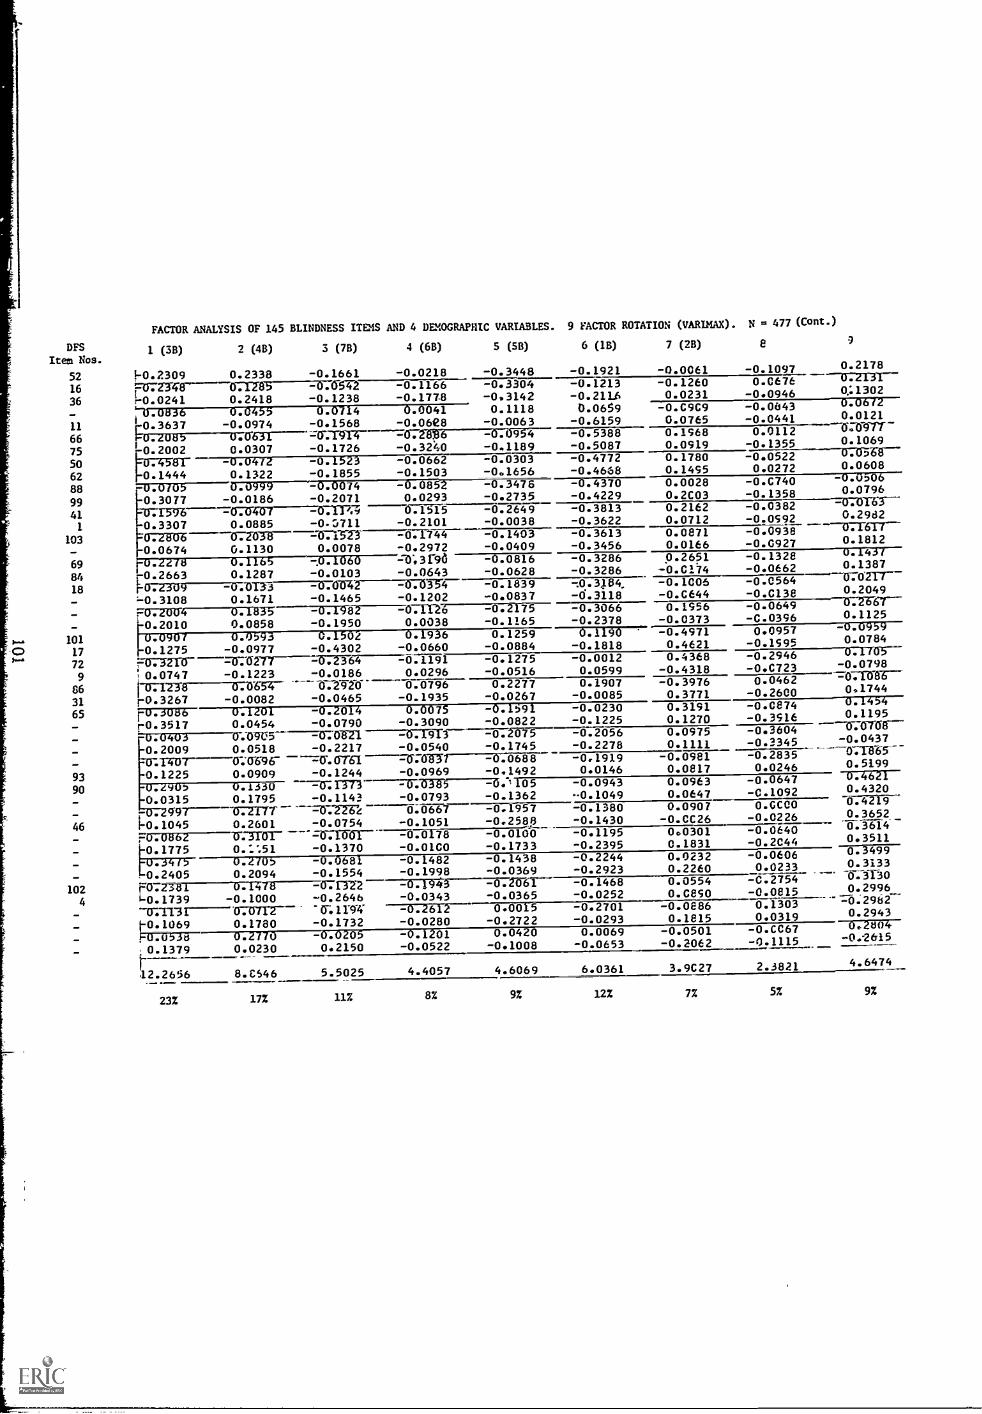
DFSItem Nos.
5216
36
11
6675506288
99411
103
6-9
84
18
10- 1
17
72
98631
65
9390
4-6
1024
FACTOR ANALYSIS OF 145 BLINDNESS ITD1S AND 4 DEMOGRAP}ItC VARIABLES. 9 FACTOR ROTATION (VARIMAX). N = 477 (Cont.)
1 (38) 2 (48) 3 (7B) 4 (68)
4.2309 0.2338 -0.1661 -0.0218=072-348 071-2-8-5-0-572 -0.1166r-0.0241 0.2418"0.0636 0.0455r0.3637 -0.0974i-U.1065 0.6631-0.2002 0.0307074-5111-
0
-0.0472.1444 0.1322
-0.1238 -0.17780.0714 0.0041-0.1568 -0.06e8-0:1914 -6728136-0.1726 -0.320-0.1523 -0.0662-0.1855 -0.1503
-U.Oru5 Ir.," -1.#074 -
E.13
0.3077 -0.0186 -0.2071 0.0293-7:,16----0.0-407 -0.11,:; 671-51-5-0
0.3307 0.0885 -0.:',711 -0.2101-0.41306 672033-- --0713-21 -0.1744- 0.0674 0.1130 0.0078 -0.2972=0;7275 0711-63---707 060 =0:31-96
-0.2663 0.1287 -0.0103 -0.0643r 07230-9---7-0- .0T33 - 0.06742 -0.0.53-4
- 0.3108 0.1671 -0.1465 -0.1202
-0.2004 0.183, -0.1982 -0.11260.2010
0.1275 -0.0977
0.0858 -0.1950
-0.4302 -0.0660
0.0038
0.0901 0.0593 0.1502 0.1936
=075210- =0 0277 -0.2364 -0.1191
0.0747 -0.1223 -0.0186 0.029607173-8 070654- 0.2920 0.0796
40.3267 -0.0082 -0.0465 -0.1935-0.3066r0.3517
# # 8
-O. i1.1175
0.0454 -0.0790 -0.30900.0403 0.09UD ---=0;021 -0.191S-0.2009 0.0518 -0.2217 -0.0540
. T4 OT----0-. 0-696- "= O . 07-61 ----=0-.00310.1225 0.0909 -0.1244 -0.0969
. 91 .1330 0:1171----775:61650.0315 0.1795 -0.1143 -0.0793
r 9'9l 0.2177 -0.2262 0.0667
1-0.1045 0.2601 -0.0754 -0.1051F0701T62------073151- - 0.100T -0.01780.1775 0.1.:51 -0.1370 -0.0100
0.1705 -0.0681 -0.14820.2405 0.2094 -0.1554 -0.1998
r0.2381 0.1475-----=071322 -0.1943$-0.1739 -0.1000 -0.2646 -0.0343-Tall 0.0712 6-.1M -0.26120(5-373--)" 0.1780 -0.1732 -0.0280
. 0.2770 -0.0205 -0.1201
0.1379 0.0230 0.2150 -0.0522
12.2656 8.C546 5.5025. _23% 17% 11%
4.4057
8%
5 (SO) 6 (111) 7 (28) 8 9
-0.3448 -0.1921 -0.0061 -0.1097 0.2178
-0.3304 -0.1213 -0.1260 0.0676 0.2131
-0.3142 -0.211.6 0.0231 -0.0946 0:1302
0.1118 0.0659 -0.C9C9 -0.0643 0.0672
-0.0063 -0.6159 0.0765 -0.0441 0.0121_
-0.5388 0.1968 0.0112
-0.1189 -0.5087 0.0919 -0.1355-0.0303 -0.4772 0.1780 -0.0522 0.668
-0.1656 -0.4638 0.1495 0.0272 0.0608
-0.3476 -0.4370 0.0028 -0.C740 -0.0506
-0.2735 -0.4229 0.2CO3 -0.1358 0.0796
-0.2649 -0.3813 0.2162 -0.0382
-0.0038 -0.3622 0.0712 -0.0592 0.29d2
-0.1403 -0.3613 0.0871 -0.0938 -0:T617--0.0409 -0.3456 0.0166 -0.0927 0.1812
-0.0816 -0.3286 0.2651 -0.1328 0.1431
-0.0628 -0.3286 -0.0274 -0.0662 0.1387
-0.1839 -0.1006 -0.0564-0.0837-0.2175
-0.3118-0.3066
-0.C644 -0.0138 0.2049
0.1956 -0.0649 0.2667--
-0.1165 -0.2378 -0.0373 -0.0396 0.1125
0.1259 0.1190 -0.4971 0.0957 -0.0959
-0.0884 -0.1818 0.4621 -0.1595 0.0784
-0.1275 -0.0012 0.4368 -0.2946 0.1105
-0.0516 0.0599 -0.4318 -0.0723 -0.0798
0.2277 0.1907 -0.3976 0.0462
-0.0267 -0.0085 0.3771 -0.2600 0.1744
-I. 591 -0.0230 0.3191 -0.0874 0.1454
-0.0822 -0.1225 0.1270 -0.3916 0.1195
-0.26T-5--- -0.2056 0.0975 -0.3604-0.1745 -0.2278 0.1111 -0.3345 -0.0437
-0.0688 -0.1919 -0.0981 -0.2835
-0.1492 0.0146 0.0817 0.0246 0.5199
-6.1105 -0.0943 0.0963 -0.0647 0.4621
-0.1362 -0.1049 0.0647 -C.1092 0.4320
-0.1957 -0.1380 0.0907 0.000O 0.4219
-0.2589 -0.1430 -0.CC26 -0.0226 0.3652
-0.0100 -0.1195 0.0301 -0.0640 0.3614
-0.1733 -0.2395 0.1831 -0.2044 0.3511
-0.1438 -0.2244 0.0232 -0.0606 0.3499
-0.0369 -0.2923 0.2260 0.0233 0.3133-6.3130-0.2064 -0.1468 0.0554 -0.2754
-0.0365 -0.0252 0.0850 -0.0815 0.2996
0.001-5 -0.2701 - 0.0886 0.1303 -0.2962--
-0.2722 -0.0293 0.1815 0.0319 0.2943
0.0420 0.0069 -0.0501 -0.0067 0.2604
-0.1008 -0.0653 -0.2062 -0.1115 -0.2615
4.6069 6.0361 3.9C27 2.3821 4.6474
9% 12% 7% 5% 9%
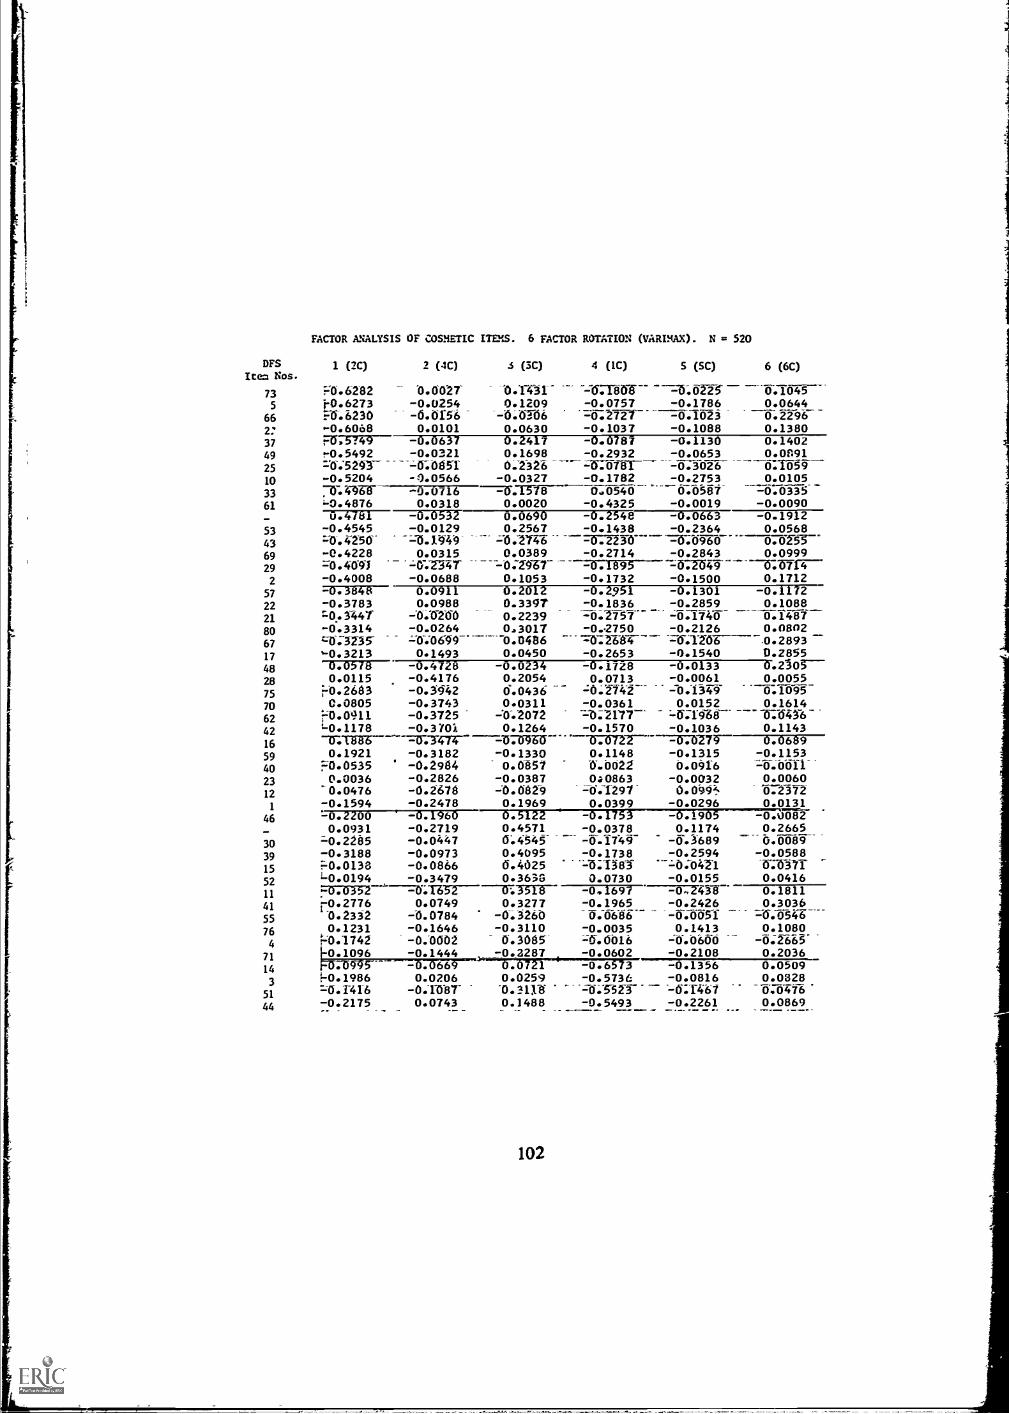
DFSItem Nos.
735
662:
37
49
25
10
33
61
53
4369
29
2
57
22
21
8067
17
4828
75
70
62
42
16
59
40
23
12
1
46
30
39
15
52
11
41
55
76
4
71
14
3
51
44
FACTOR ANALYSIS OF COSMETIC ITEMS. 6 FACTOR
1 (2C) 2 (4C) .5 (3C)
:4).6282 0.0027 0.1'431t-0.6273 -0.0254 0.1209PS.6230 -6.0156 -6.0166-0.6068 0.0101 0.0630
ROTATION (VARIMAX) . N = 520
4 (1C) S (SC) 6 (6C)
13.1045-0.0757 -0.1786 0.0644-6:272/- -0.1023 0.2296 7-0.1037 -0.1088 0.1380
F0.5249-0.5492=0.520-0.5204
-0.0637-0.0321-0:0851- ).0566
0.24170.16980.232-6
-0.0327
-0.0787 -0.1130 0.1402-0.2932 -0.0653 0.00.91=6:0761- -0.3026 0:059-0.1782 -0.2753 0.01050.0540 0.0587 -0.0335-0.4325 -0.0019 -0.0090-0.4876
-0.07160.0318
--=W.15780.0020
0.47151-0.4545:43.4-250
-0.4228=0.4093-0.4008
-0.0532-0.0129
0.0315-0:234T-0.0688
0.06900.2567
0.0389-0:24670.1053
-0.254e -0.0663 -0.1912-0.1438 -0.2364 0.0568-0.2230 -=0X960- 676-153--0.2714 -0.2843 0.0999-0.1895 -0.2049-0.1732 -0.1500 0.1712
-0.3848-0.3783
-0.3314c0:3235'0.3213
0.09110.0988
-0.0200-0.0264
0.1493
0.20120.33970.22390.30170.04860.0450
-0.02340.20540.04360.0311
-0.20720.1264
-'0769Wia-0.13300.6857
-0.0387-0.08290.1969
-0.2951 -0.1301 -0.1172-0.1836 -0.2859 0.1088=70;2Y51-- 0.1487-0.-2750 -0.2126 0.0802
-:70-0."253Z-- -70.2893---0.2653 -0.1540 D.2855-0.1728 -0.0133 0.2305-0.0713 -0.0061 0.0055_
0.05780.0115
i-0.26850.0805
L.0.0911i-0.1178
-0.4728-0.4176-0.5942-0.3743-0.3725-0.3701
-0.3182-0.2984-0.2826-0.2678-0.2478
-0.2742 =0.1549-0.0361 0.0152 0.1614
--a:1468- 1:64S-60.1570 -0.1036 0.1143
-0:18860.1921
L0.05350.00360.0476
-0.1594
o. o707- -7=1EXTP7 0.06890.1148 -0.1315 -0.1153"6.0022 0.0916 =&6611.--0a0863 -0.0032 0.0060
=0.1-297 0.099 0.23720.0399 -0.0296 0.0121
.19 -0.0082-0.0378 0.1174 0.2665
-0.22000.0931
=0.2285-0.31887=0.0133,-0.0194
-0.1960-0.2719-0.0447-0.0973-0.0866-0.3479
0.0749-6.0784-0.1646-0.0002-0.1444
0.45710:45450.40956.40250.3633
---a35180.3277
-0;3260-0.31100.3085-
- 0.2287
-6.1749 -6,3689 0.0089-0.1738 -0.2594 -0.0588
---=0:042"1 070-71-0.0730 -0.0155 0.0416-0.1697 -0,.2438 0.1811-0.1965 -0.2426 0.3036
=6 546-0.0035 0.1413 0.1080--;6:601.6
-0.0602 -0.2108 0.2036
-0.0352-0.27760.23320.1231
L-0.1742.11.1096
=0.19866.1416
-0.2175
0.0206-o.nwr0.0743
0.0259
0.1488
-0.6 3 -0.1356 0.0509-0.5736 -0.0816 0.0328
0.0476-0.5493 -0.2261 0.0869
102
STUDIES IN REACTIONS TO DISABILITY
I. Reactions to Physical Disability by the Disabled and Nondisabled.
II. Personality Determinants of Reactions to the Physically Handicapped.
III. Factorial Structure and Correlates of the Attitude Towards Disabled
Persons Scale.
IV. Response Set Paralysis.
V. Reactions to Physical Disability.
VI. Ego Factors in Reactions to the Physically Disabled.
VII. Perceptions of Physically Disabled by the Nondisabled.
VIII. Personality Determinants of Reactions to the Physically Handicapped II.
IX. Conceptual and Methodological Issues in the Study of Attitudes Toward
Disability.
X. Components of Attitudes Toward the Disabled.
XI. Attitudes of the Nondisabled Toward the Physically Disabled.
XII. Structure of Attitudes Toward the Physically Disabled: The Disability
Factor Scales Amputation, Blindness, Cosmetic Conditions.
Copies of these studies are available without charge from the following address:
Jerome Si ller, Ph.D.Press Annex Bldg., Room 7126 Washington PlaceNew York UniversityNew York, New York 10003
104
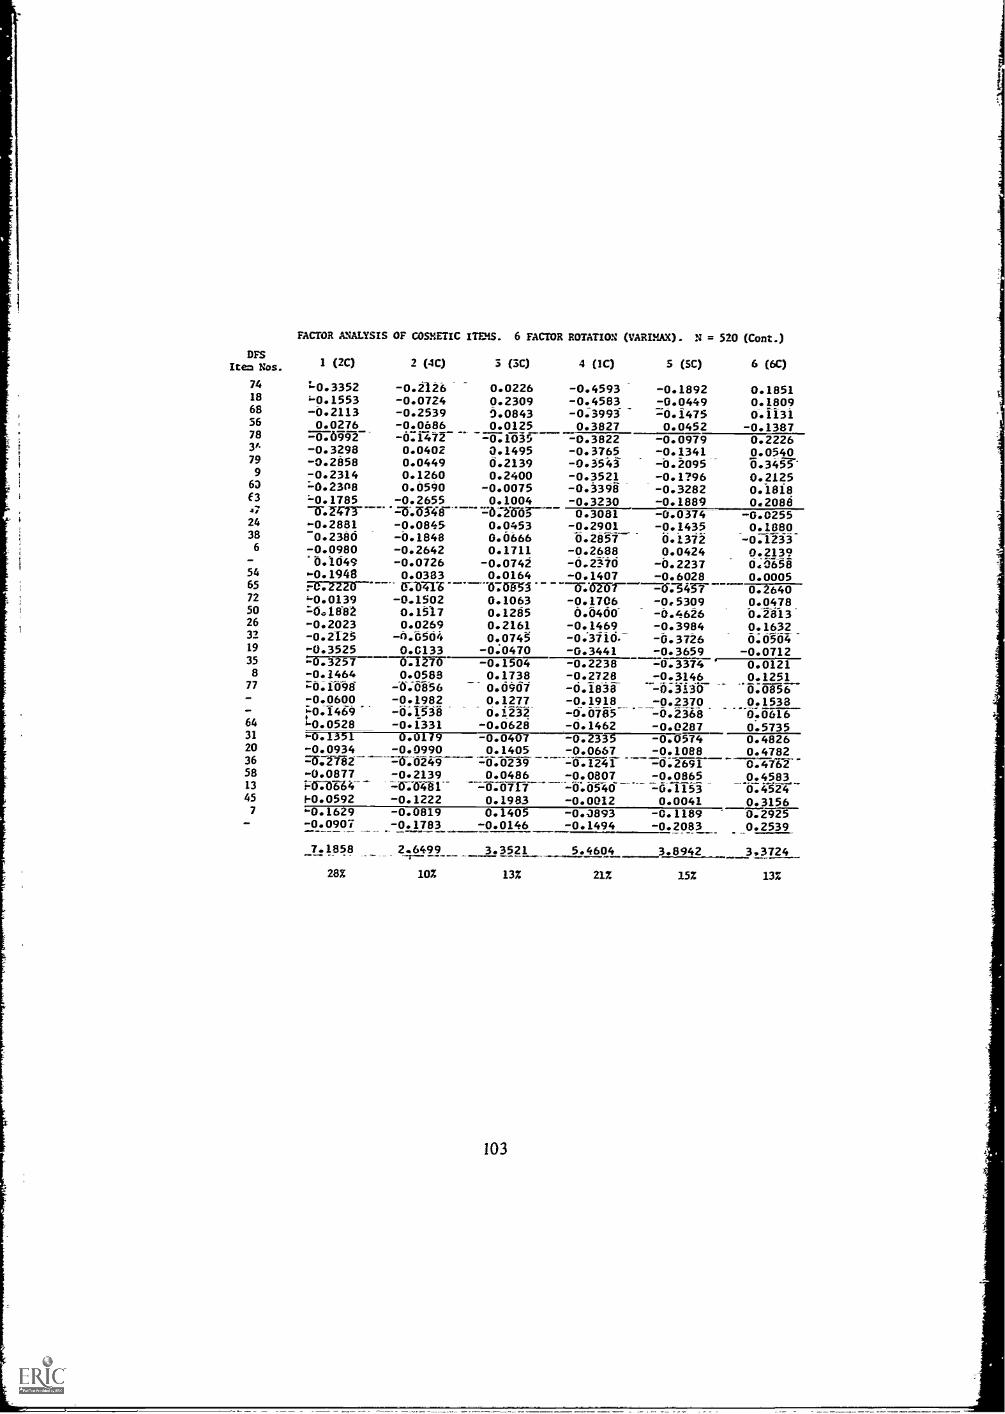
DFSItem Nos.
FACTOR ANALYSIS OF COSMETIC ITEMS. 6 FACTOR ROTATION (VARIMAX). N = 520 (Cont.)
1 (2C) 2 (4C) 3 cm 4 (IC) 5 (SC) 6 (6C)
74 L0.3352 -0.2126 0.0226 -0.4593 -0.1892 0.185118 1-0.1553 -0.0724 0.2309 -0.4583 -0.0449 0.180968 -0.2113 -0.2539 9.0843 -0.3993-- -0.1475 0.113156 0.0276_ -0.0686 0.0125 0.3827 0.0452 -0.138778 -0.1472 -0.1035 -0.3822 -0.0979 0.222634 -0.3298 0.0402 0.1495 -0.3765 -0.1341 0.054079 -0.2858 0.0449 0.2139 -0.3546 -0.2095 0.3455"9 -0.2314 0.1260 0.2400 -0.3521 -0.1?96 0.2125
63 =0.2308 0.0590 -0.0075 0.3398 -0.3282 0.1818(3 0.178 - 0.2655 0.1004 -0.3230 -0.1889 0.208847 -Zr.-24-71- -76".Z5S46-- 0.3081 -0.0374 -0.025524
38-0.2881-0.2386
-0.0845-0.1848
0.04530.0666
-0.2901 -0.1435 0.18806.2631--- 6.'1312 -0.1233
6 -0.0980 -0.2642 0.1711 -0.2688 0.0424 0.2139.0.1049 -0.0726 -0.0742 0.2370 -0.2237 0;6656
54 .-0.1948 0.0383 0.0164 -0.1407 -0.6028 0.000565 C5:)74T6---- 0.2220 -67543-r 0. 64072 0.0139 -0.1502 0.1063 -0.5309 0.047850 10.18132 0.1517 0.1285 6.0400 0.4626 0:281326 -0.2023 0.0269 0.2161 -0.1469 -0.3984 0.163232 -0.2125 -6.6564 0.0745 0.3710. 0.3726 0.050419 -0.3525 0.6133 -0.0470 -0.3441 -0.3659 -0.071235 =67Y257- -0.1504 -0.2238 -0.3374 0.01218
77-0.1464;---0.1696
0.0588=6.6656
0.17380.0907
-0.2728 -0.3146 0.12510.1838 -6:SiAii- 6:0656-
-0.0600 -0.1982 0.1277 -0.1918 -0.2370 0.1538:7-0;146-9 -6.1536 0.1232 -0.0785 -0.2368 0.0616
64 -0.1331 -0.0628 -0.1462 -0.0287 0.573531 0.135 0.0179 -0.0407 -0.2335 -0.0574 0.482620 -0.0934 -0.0990 0.1405 -0.0667 -04088 0.478236 1-642782 -0.0239 -0.1241 -0.2691 0.476258 -0.0877 -0.2139 0.0486 -0.0807 -0.0865 0.458313 4:0461 --6:65-46" -;-6.1B5 -6:- 452445 1-0.0592 -0.1222 0.1983 - 0.0012 0.0041 0.31567 0.1629 -0.0819 0.1405 -0.9893 -0.1189 0.2925
-0.0907 -0.1783 -0.0146 -0.1494 -0.2083 0.2539
7.1858 21y.c99 3.3521 5.4604 3.8942 3.3724
28% 10% 13%
103
21% 15% 132