factor investing in china: abundant opportunity, but
TRANSCRIPT
1
In briefTo avoid overfitting a model based on historical data, it is important to understand how policy affects market behavior. We describe important regulatory changes in the Chinese A-shares market over the past decades, analyze the impactof these changes on market efficiency and investigate therelevance of past data – and what it all means for factorinvesting strategies.
Factor investing in China: abundant opportunity, but beware of structural breaks By Alexander Tavernaro and Andrew Tong
2
Factor investing has a relatively short history in China. But the abundance of alpha opportunities in the Asian powerhouse has been well noted by academics and practitioners alike. The breadth and depth of China’s A-shares market, significant cross-sectional stock dispersion, high liquidity and competitive transaction costs make it an attractive universe for alpha-oriented quants. What really sets the market apart, however, is the unique development of its regulatory landscape over the past three decades, which has significantly influenced factor behavior.
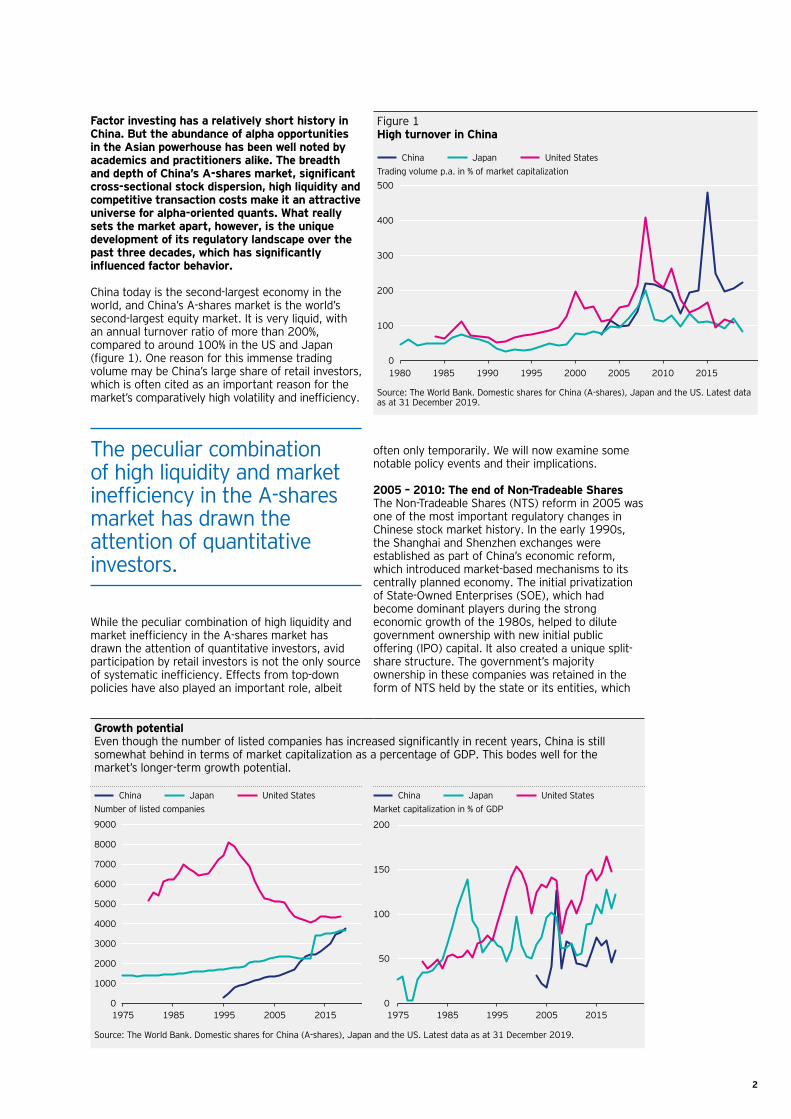
China today is the second-largest economy in the world, and China’s A-shares market is the world’s second-largest equity market. It is very liquid, with an annual turnover ratio of more than 200%, compared to around 100% in the US and Japan (figure 1). One reason for this immense trading volume may be China’s large share of retail investors, which is often cited as an important reason for the market’s comparatively high volatility and inefficiency.
often only temporarily. We will now examine some notable policy events and their implications.
2005 – 2010: The end of Non-Tradeable SharesThe Non-Tradeable Shares (NTS) reform in 2005 was one of the most important regulatory changes in Chinese stock market history. In the early 1990s, the Shanghai and Shenzhen exchanges were established as part of China’s economic reform, which introduced market-based mechanisms to its centrally planned economy. The initial privatization of State-Owned Enterprises (SOE), which had become dominant players during the strong economic growth of the 1980s, helped to dilute government ownership with new initial public offering (IPO) capital. It also created a unique split-share structure. The government’s majority ownership in these companies was retained in the form of NTS held by the state or its entities, which
Figure 1High turnover in China
China Japan United StatesTrading volume p.a. in % of market capitalization
0
100
200
300
400
500
1980 1985 1990 1995 2000 2005 2010 2015
China Japan United States
Source: The World Bank. Domestic shares for China (A-shares), Japan and the US. Latest data as at 31 December 2019.
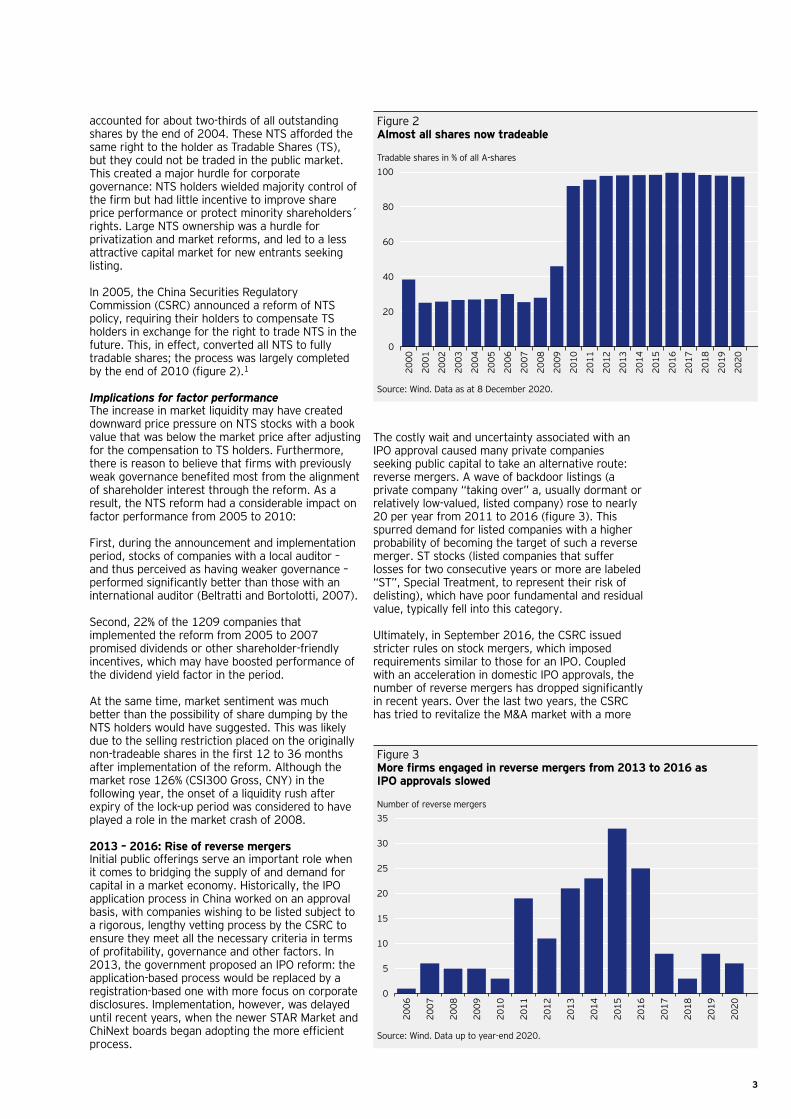
Growth potentialEven though the number of listed companies has increased significantly in recent years, China is still somewhat behind in terms of market capitalization as a percentage of GDP. This bodes well for the market’s longer-term growth potential.
China Japan United StatesNumber of listed companies
China Japan United StatesMarket capitalization in % of GDP
0
1000
2000
3000
4000
5000
6000
7000
8000
9000
1975 1985 1995 2005 2015
China Japan United States
0
50
100
150
200
1975 1985 1995 2005 2015
China Japan United States
Source: The World Bank. Domestic shares for China (A-shares), Japan and the US. Latest data as at 31 December 2019.
The peculiar combination of high liquidity and market inefficiency in the A-shares market has drawn the attention of quantitative investors.
While the peculiar combination of high liquidity and market inefficiency in the A-shares market has drawn the attention of quantitative investors, avid participation by retail investors is not the only source of systematic inefficiency. Effects from top-down policies have also played an important role, albeit
3
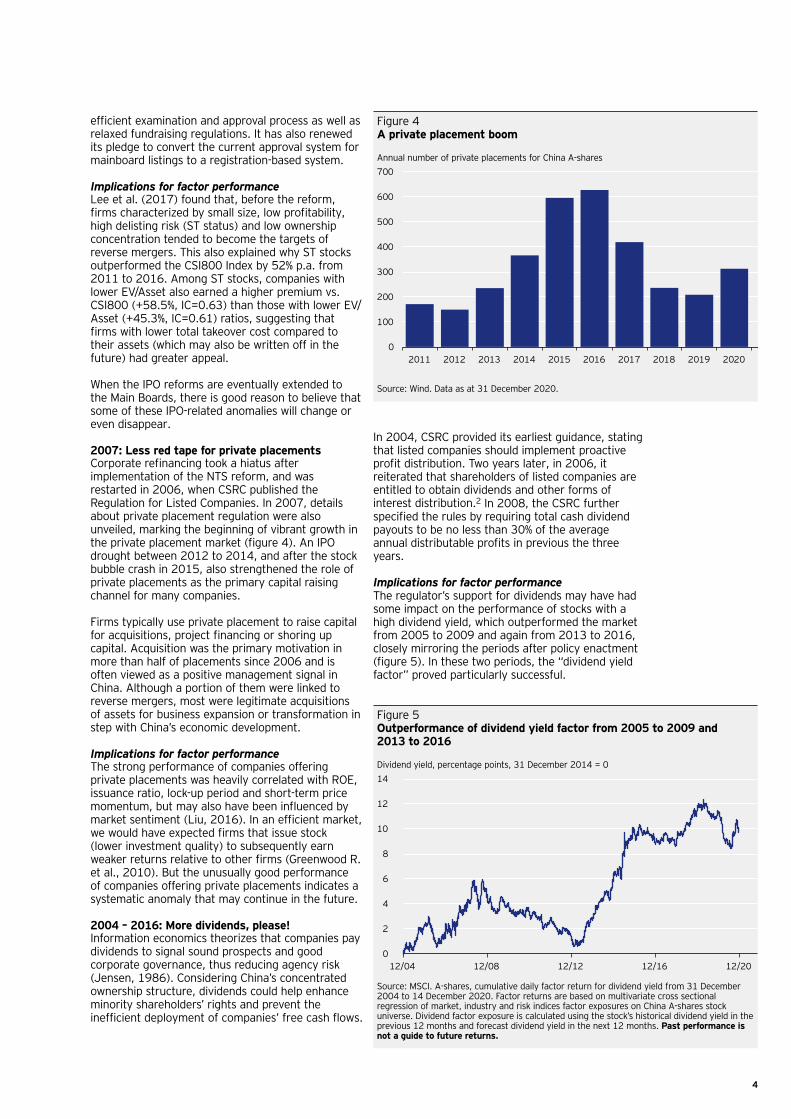
accounted for about two-thirds of all outstanding shares by the end of 2004. These NTS afforded the same right to the holder as Tradable Shares (TS), but they could not be traded in the public market. This created a major hurdle for corporate governance: NTS holders wielded majority control of the firm but had little incentive to improve share price performance or protect minority shareholders´ rights. Large NTS ownership was a hurdle for privatization and market reforms, and led to a less attractive capital market for new entrants seeking listing.
In 2005, the China Securities Regulatory Commission (CSRC) announced a reform of NTS policy, requiring their holders to compensate TS holders in exchange for the right to trade NTS in the future. This, in effect, converted all NTS to fully tradable shares; the process was largely completed by the end of 2010 (figure 2).1
Implications for factor performanceThe increase in market liquidity may have created downward price pressure on NTS stocks with a book value that was below the market price after adjusting for the compensation to TS holders. Furthermore, there is reason to believe that firms with previously weak governance benefited most from the alignment of shareholder interest through the reform. As a result, the NTS reform had a considerable impact on factor performance from 2005 to 2010:
First, during the announcement and implementation period, stocks of companies with a local auditor – and thus perceived as having weaker governance – performed significantly better than those with an international auditor (Beltratti and Bortolotti, 2007).
Second, 22% of the 1209 companies that implemented the reform from 2005 to 2007 promised dividends or other shareholder-friendly incentives, which may have boosted performance of the dividend yield factor in the period.
At the same time, market sentiment was much better than the possibility of share dumping by the NTS holders would have suggested. This was likely due to the selling restriction placed on the originally non-tradeable shares in the first 12 to 36 months after implementation of the reform. Although the market rose 126% (CSI300 Gross, CNY) in the following year, the onset of a liquidity rush after expiry of the lock-up period was considered to have played a role in the market crash of 2008.
2013 – 2016: Rise of reverse mergersInitial public offerings serve an important role when it comes to bridging the supply of and demand for capital in a market economy. Historically, the IPO application process in China worked on an approval basis, with companies wishing to be listed subject to a rigorous, lengthy vetting process by the CSRC to ensure they meet all the necessary criteria in terms of profitability, governance and other factors. In 2013, the government proposed an IPO reform: the application-based process would be replaced by a registration-based one with more focus on corporate disclosures. Implementation, however, was delayed until recent years, when the newer STAR Market and ChiNext boards began adopting the more efficient process.
Figure 2Almost all shares now tradeable
Tradable shares in % of all A-shares
0
20
40
60
80
100
2000
2001
2002
2003
2004
2005
2006
2007
2008
2009
2010
2011
2012
2013
2014
2015
2016
2017
2018
2019
2020
tradable sharesSource: Wind. Data as at 8 December 2020.
The costly wait and uncertainty associated with an IPO approval caused many private companies seeking public capital to take an alternative route: reverse mergers. A wave of backdoor listings (a private company “taking over” a, usually dormant or relatively low-valued, listed company) rose to nearly 20 per year from 2011 to 2016 (figure 3). This spurred demand for listed companies with a higher probability of becoming the target of such a reverse merger. ST stocks (listed companies that suffer losses for two consecutive years or more are labeled “ST”, Special Treatment, to represent their risk of delisting), which have poor fundamental and residual value, typically fell into this category.
Ultimately, in September 2016, the CSRC issued stricter rules on stock mergers, which imposed requirements similar to those for an IPO. Coupled with an acceleration in domestic IPO approvals, the number of reverse mergers has dropped significantly in recent years. Over the last two years, the CSRC has tried to revitalize the M&A market with a more
Figure 3More firms engaged in reverse mergers from 2013 to 2016 as IPO approvals slowed
Number of reverse mergers
0
5
10
15
20
25
30
35
2006
2007
2008
2009
2010
2011
2012
2013
2014
2015
2016
2017
2018
2019
2020
#of reverse managerSource: Wind. Data up to year-end 2020.
4
efficient examination and approval process as well as relaxed fundraising regulations. It has also renewed its pledge to convert the current approval system for mainboard listings to a registration-based system.
Implications for factor performance Lee et al. (2017) found that, before the reform, firms characterized by small size, low profitability, high delisting risk (ST status) and low ownership concentration tended to become the targets of reverse mergers. This also explained why ST stocks outperformed the CSI800 Index by 52% p.a. from 2011 to 2016. Among ST stocks, companies with lower EV/Asset also earned a higher premium vs. CSI800 (+58.5%, IC=0.63) than those with lower EV/Asset (+45.3%, IC=0.61) ratios, suggesting that firms with lower total takeover cost compared to their assets (which may also be written off in the future) had greater appeal.
When the IPO reforms are eventually extended to the Main Boards, there is good reason to believe that some of these IPO-related anomalies will change or even disappear.
2007: Less red tape for private placements Corporate refinancing took a hiatus after implementation of the NTS reform, and was restarted in 2006, when CSRC published the Regulation for Listed Companies. In 2007, details about private placement regulation were also unveiled, marking the beginning of vibrant growth in the private placement market (figure 4). An IPO drought between 2012 to 2014, and after the stock bubble crash in 2015, also strengthened the role of private placements as the primary capital raising channel for many companies.
Firms typically use private placement to raise capital for acquisitions, project financing or shoring up capital. Acquisition was the primary motivation in more than half of placements since 2006 and is often viewed as a positive management signal in China. Although a portion of them were linked to reverse mergers, most were legitimate acquisitions of assets for business expansion or transformation in step with China’s economic development.
Implications for factor performanceThe strong performance of companies offering private placements was heavily correlated with ROE, issuance ratio, lock-up period and short-term price momentum, but may also have been influenced by market sentiment (Liu, 2016). In an efficient market, we would have expected firms that issue stock (lower investment quality) to subsequently earn weaker returns relative to other firms (Greenwood R. et al., 2010). But the unusually good performance of companies offering private placements indicates a systematic anomaly that may continue in the future.
2004 – 2016: More dividends, please!Information economics theorizes that companies pay dividends to signal sound prospects and good corporate governance, thus reducing agency risk (Jensen, 1986). Considering China’s concentrated ownership structure, dividends could help enhance minority shareholders’ rights and prevent the inefficient deployment of companies’ free cash flows.
In 2004, CSRC provided its earliest guidance, stating that listed companies should implement proactive profit distribution. Two years later, in 2006, it reiterated that shareholders of listed companies are entitled to obtain dividends and other forms of interest distribution.2 In 2008, the CSRC further specified the rules by requiring total cash dividend payouts to be no less than 30% of the average annual distributable profits in previous the three years.
Implications for factor performanceThe regulator’s support for dividends may have had some impact on the performance of stocks with a high dividend yield, which outperformed the market from 2005 to 2009 and again from 2013 to 2016, closely mirroring the periods after policy enactment (figure 5). In these two periods, the “dividend yield factor” proved particularly successful.
Figure 4A private placement boom
Annual number of private placements for China A-shares
0
100
200
300
400
500
600
700
2011 2012 2013 2014 2015 2016 2017 2018 2019 2020
#of private placementSource: Wind. Data as at 31 December 2020.
Figure 5Outperformance of dividend yield factor from 2005 to 2009 and 2013 to 2016
Dividend yield, percentage points, 31 December 2014 = 0
0
2
4
6
8
10
12
14
12/04 12/08 12/12 12/16 12/20
Dividend Yield
Source: MSCI. A-shares, cumulative daily factor return for dividend yield from 31 December 2004 to 14 December 2020. Factor returns are based on multivariate cross sectional regression of market, industry and risk indices factor exposures on China A-shares stock universe. Dividend factor exposure is calculated using the stock’s historical dividend yield in the previous 12 months and forecast dividend yield in the next 12 months. Past performance is not a guide to future returns.
5
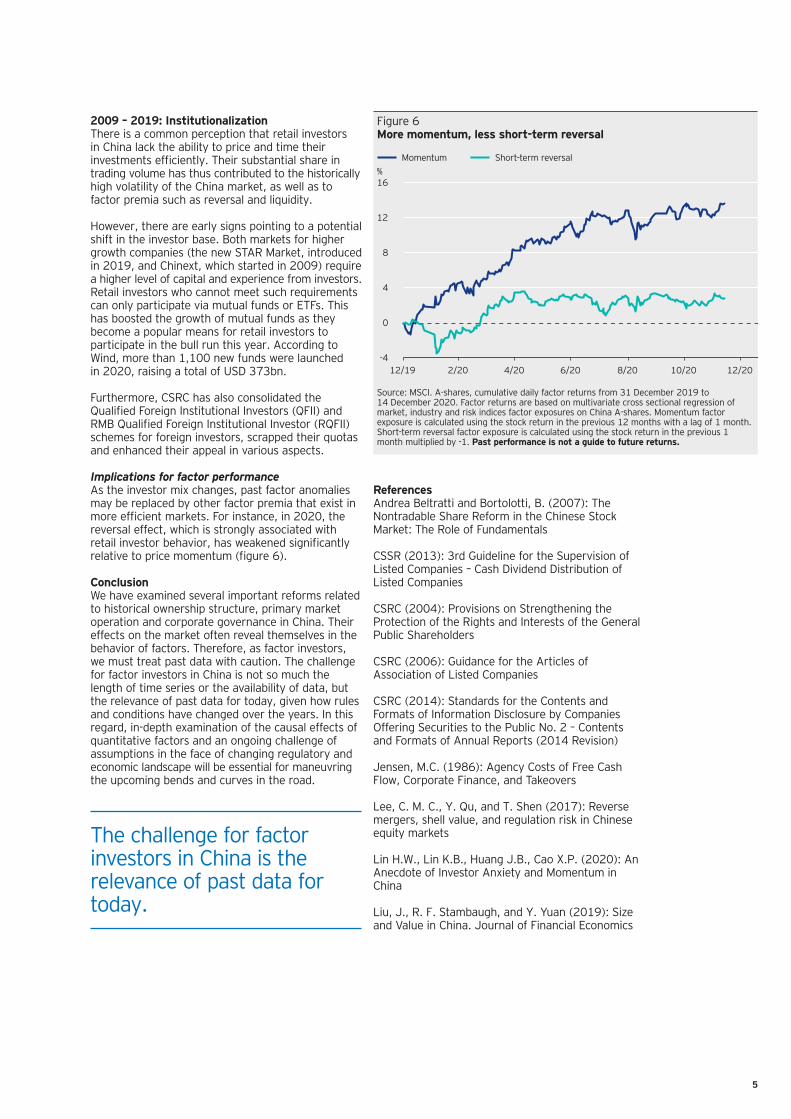
2009 – 2019: Institutionalization There is a common perception that retail investors in China lack the ability to price and time their investments efficiently. Their substantial share in trading volume has thus contributed to the historically high volatility of the China market, as well as to factor premia such as reversal and liquidity.
However, there are early signs pointing to a potential shift in the investor base. Both markets for higher growth companies (the new STAR Market, introduced in 2019, and Chinext, which started in 2009) require a higher level of capital and experience from investors. Retail investors who cannot meet such requirements can only participate via mutual funds or ETFs. This has boosted the growth of mutual funds as they become a popular means for retail investors to participate in the bull run this year. According to Wind, more than 1,100 new funds were launched in 2020, raising a total of USD 373bn.
Furthermore, CSRC has also consolidated the Qualified Foreign Institutional Investors (QFII) and RMB Qualified Foreign Institutional Investor (RQFII) schemes for foreign investors, scrapped their quotas and enhanced their appeal in various aspects.
Implications for factor performanceAs the investor mix changes, past factor anomalies may be replaced by other factor premia that exist in more efficient markets. For instance, in 2020, the reversal effect, which is strongly associated with retail investor behavior, has weakened significantly relative to price momentum (figure 6).
ConclusionWe have examined several important reforms related to historical ownership structure, primary market operation and corporate governance in China. Their effects on the market often reveal themselves in the behavior of factors. Therefore, as factor investors, we must treat past data with caution. The challenge for factor investors in China is not so much the length of time series or the availability of data, but the relevance of past data for today, given how rules and conditions have changed over the years. In this regard, in-depth examination of the causal effects of quantitative factors and an ongoing challenge of assumptions in the face of changing regulatory and economic landscape will be essential for maneuvring the upcoming bends and curves in the road.
ReferencesAndrea Beltratti and Bortolotti, B. (2007): The Nontradable Share Reform in the Chinese Stock Market: The Role of Fundamentals
CSSR (2013): 3rd Guideline for the Supervision of Listed Companies – Cash Dividend Distribution of Listed Companies
CSRC (2004): Provisions on Strengthening the Protection of the Rights and Interests of the General Public Shareholders
CSRC (2006): Guidance for the Articles of Association of Listed Companies
CSRC (2014): Standards for the Contents and Formats of Information Disclosure by Companies Offering Securities to the Public No. 2 – Contents and Formats of Annual Reports (2014 Revision)
Jensen, M.C. (1986): Agency Costs of Free Cash Flow, Corporate Finance, and Takeovers
Lee, C. M. C., Y. Qu, and T. Shen (2017): Reverse mergers, shell value, and regulation risk in Chinese equity markets
Lin H.W., Lin K.B., Huang J.B., Cao X.P. (2020): An Anecdote of Investor Anxiety and Momentum in China
Liu, J., R. F. Stambaugh, and Y. Yuan (2019): Size and Value in China. Journal of Financial Economics
Figure 6More momentum, less short-term reversal
Momentum Short-term reversal%
-4
0
4
8
12
16
12/19 2/20 4/20 6/20 8/20 10/20 12/20
Momentum Short-term Reversal
Source: MSCI. A-shares, cumulative daily factor returns from 31 December 2019 to 14 December 2020. Factor returns are based on multivariate cross sectional regression of market, industry and risk indices factor exposures on China A-shares. Momentum factor exposure is calculated using the stock return in the previous 12 months with a lag of 1 month. Short-term reversal factor exposure is calculated using the stock return in the previous 1 month multiplied by -1. Past performance is not a guide to future returns.
The challenge for factor investors in China is the relevance of past data for today.

6
About the authors
Alexander Tavernaro, CFA, CAIASenior Portfolio ManagerInvesco Quantitative StrategiesAlexander is a Senior Portfolio Manager for Invesco´s Quantitative Strategies team. In this function, he is responsible for multiple global and regional equity portfolios.
Andrew TongSenior Portfolio ManagerInvesco China A Investments, Invesco Quantitative StrategiesAndrew Tong is the co-manager of Invesco’s China A-Shares Quant strategies and has long-standing experience in factor modeling and portfolio construction.
Notes1 To ensure an equitable outcome, the exact compensation terms were to be negotiated
between the shareholders of each firm, requiring a resolution approved by at least two-thirds of the TS holders and two-thirds of all shareholders. The premium paid to the TS holders eventually averaged to about 30%.
2 CSRC (2204, CSRC (2006)).
About riskThe value of investments and any income will fluctuate (this may partly be the result of exchange rate fluctuations) and investors may not get back the full amount invested. When investing in less developed countries, you should be prepared to accept significantly large fluctuations in value. Investment in certain securities listed in China can involve significant regulatory constraints that may affect liquidity and/or investment performance.
Important information
This document has been prepared only for those persons to whom Invesco has provided it for informational purposes only. This document is not an offering of a financial product and is not intended for and should not be distributed to retail clients who are resident in jurisdiction where its distribution is not authorized or is unlawful.. Circulation, disclosure, or dissemination of all or any part of this document to any person without the consent of Invesco is prohibited.
This document may contain statements that are not purely historical in nature but are "forward-looking statements," which are based on certain assumptions of future events. Forward-looking statements are based on information available on the date hereof, and Invesco does not assume any duty to update any forward-looking statement. Actual events may differ from those assumed. There can be no assurance that forward-looking statements, including any projected returns, will materialize or that actual market conditions and/or performance results will not be materially different or worse than those presented.
The information in this document has been prepared without taking into account any investor’s investment objectives, financial situation or particular needs. Before acting on the information the investor should consider its appropriateness having regard to their investment objectives, financial situation and needs.
You should note that this information:
• may contain references to amounts which are not in local currencies;
• may contain financial information which is not prepared in accordance with the laws or practices of your country of residence;
• may not address risks associated with investment in foreign currency denominated investments; and
• does not address local tax issues.
All material presented is compiled from sources believed to be reliable and current, but accuracy cannot be guaranteed. Investment involves risk. Please review all financial material carefully before investing. The opinions expressed are based on current market conditions and are subject to change without notice. These opinions may differ from those of other Invesco investment professionals.
The distribution and offering of this document in certain jurisdictions may be restricted by law. Persons into whose possession this marketing material may come are required to inform themselves about and to comply with any relevant restrictions. This does not constitute an offer or solicitation by anyone in any jurisdiction in which such an offer is not authorised or to any person to whom it is unlawful to make such an offer or solicitation.