fact sheet coatings, merchant shipping - emissieregistratie · antifoulants in marine coatings,...
TRANSCRIPT

i Coatings, Shipping & Fisheries
Emission estimates for diffuse sources Netherlands Emission Inventory
Antifoulants in marine coatings,
merchant shipping and fisheries
Version dated June 2008
NETHERLANDS NATIONAL WATER BOARD - WATER UNIT in cooperation with DELTARES and TNO

ii Coatings, Shipping & Fisheries
. . . . . . . . . . . . . . . . . . . . . . . . . . . . . . . . . . . . . . . . . . . . . . . . . . . . . . . . . . . . . . . . . . . . . . . . . . . . . . . . . . . . . . . .

iii Coatings, Shipping & Fisheries
Table of Contents
. . . . . . . . . . . . . . . . . . . . . . . . . . . . . . . . . . . . . . . . . . . . . . . . . . . . . . . . . . . . . . . . . . . . . . . . . . . . . . . . . . . . . . . .
1 Introduction and scope 1–1
2 Description of emission source 2–1
2.1 Causes 2–1
3 Explanation of calculation method 3–1
3.1 Activity rates and emission factor 3–1
3.2 Wet surface area 3–1
3.2.1 Calculation of surface areas based on volume 3–3
3.3 Leaching rates 3–5
4 Activity rates 4–1
4.1 Assessment using statistical data 4–1
4.2 Time series, present-2027 4–2
4.3 Annual data setting 4–3
5 Nature of the emission source 5–1
6 Emission factors 6–1
6.1 Emission factors sailing 6–1
6.2 Emission factors in ports 6–1
6.3 Application percentages 6–2
6.4 Time series, 1990-present 6–5
6.5 Annual data setting 6–5
7 Emissions calculated 7–1
7.1 Emission values 2006 7–1
7.2 Emissions 1990-2006 7–2
7.3 Emissions forecast, 2009-2027 7–4
7.4 Comments and changes in regard to previous version 7–5
7.5 Difference in values 7–6
8 Accuracy and indicated subjects for improvement 8–1
8.1 Most significant areas for improvement 8–1
9 Spatial allocation 9–1
9.1 Seagoing vessels and fishing vessels on NCP 9–1
9.2 Seagoing vessels in Dutch territory 9–3
9.3 Fishing vessels in ports 9–4
10 References 10–1

1–1 Coatings, Shipping & Fisheries
1 Introduction and scope
. . . . . . . . . . . . . . . . . . . . . . . . . . . . . . . . . . . . . . . . . . . . . . . . . . . . . . . . . . . . . . . . . . . . . . . . . . . . . . .
Biocidal antifoulants in marine ship coatings applied on the exterior of
seagoing merchant vessels and fishing vessels are a source
emissions.Coatings are designed to inhibit organisms attaching and
growing on the exterior surface of the ships hull, and to that end, most
coatings release biocides continuously.
In the National Emission Inventory, this emission is assigned to the
governmental target sector “Transport”. The emissions in question are
Tributyltin, copper and co-biocides (also known as "boosters"). These
co-biocides are components such as diuron and irgarol, which reinforce
the anti-fouling effect of the coating.
This report is based on a previous quantification of emissions of
coatings in shipping and fisheries for the Dutch section of the
Continental Shelf (NCP) and in ports conducted for the Traffic and
Transport Advisory Service (AVV) under the EMS (Emission Inventory
and Monitoring for the Shipping Sector). The quantification in this
report can be considered to be an update of two EMS protocols:
- EMS protocol for Emissions by Shipping and Fisheries: Leaching
of coatings on the NCP (Meijerink, 2003a)
- EMS protocol for Emissions by Shipping and Fisheries: Leaching
of coatings in ports (Meijerink, 2003b)
Here, the quantification of emissions for NCP (Netherlands continental
shelf) and ports is integrated into a single report. The method of
quantification of the two types of emissions is different, however, and
consequently this distinction will be referenced frequently throughout
this report.
This quantification implements a number of recommendations for
improvement of emissions assessment from the protocols listed above,
and also incorporates a few new insights. The most significant changes
in reference to the protocols are:
- Calculation of the Wet Surface Area (WSA) is improved, with a
WSA computed for each individual ship in Dutch waters, taking
partial loading of the ship into account;
- A traffic and transport database based on the Lloyds traffic file
has been created for the NCP, which, in combination of the
WSA per ship, was used to compute the total average WSA
present in Dutch waters;
- Emission factors of the coatings are revised to distinguish
between emissions at sail and emissions at berth;
- Along with historical development in emissions, this report
provides a forecast of emissions up to the year 2027
- The emissions are spatially allocated by body of water identified
in the Water Framework Directive (Water Framework Directive
1–2 Coatings, Shipping & Fisheries
areas). This protocol describes the method for spatial allocation,
but the result of the spatial allocation is provided as a separate
database.
2–1 Coatings, Shipping & Fisheries
2 Description of emission source
. . . . . . . . . . . . . . . . . . . . . . . . . . . . . . . . . . . . . . . . . . . . . . . . . . . . . . . . . . . . . . . . . . . . . . . . . . . . . . .
2.1 Causes
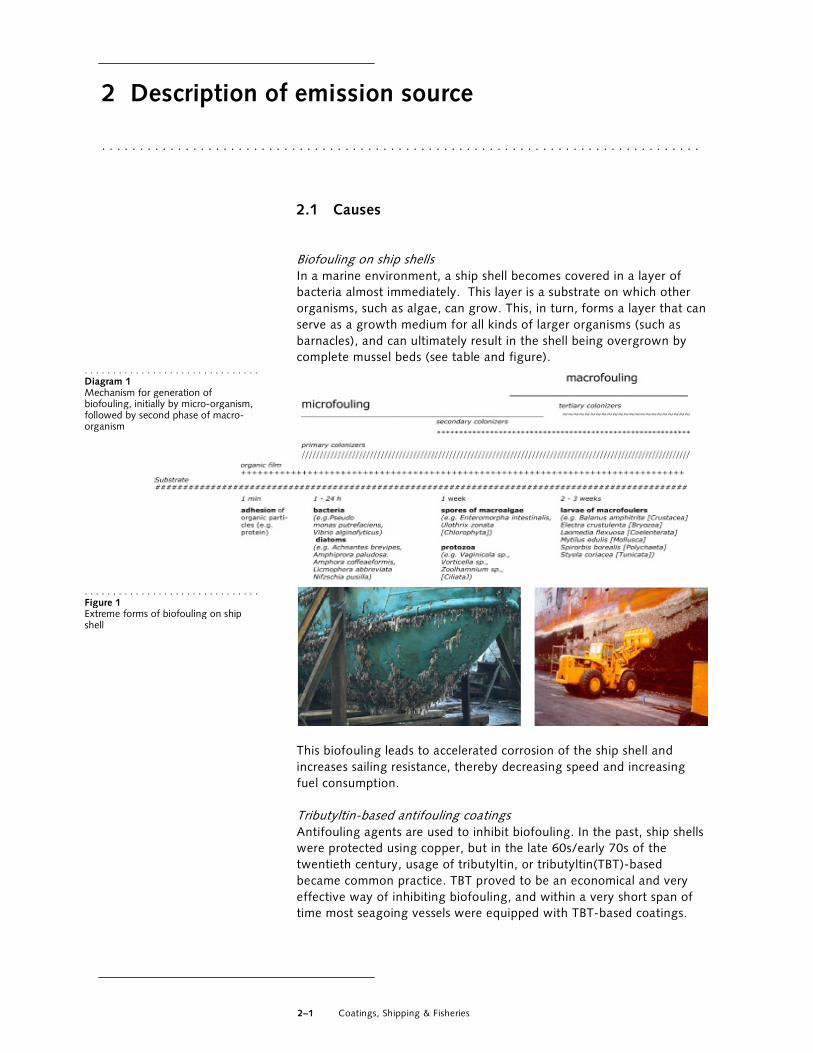
Biofouling on ship shells In a marine environment, a ship shell becomes covered in a layer of
bacteria almost immediately. This layer is a substrate on which other
organisms, such as algae, can grow. This, in turn, forms a layer that can
serve as a growth medium for all kinds of larger organisms (such as
barnacles), and can ultimately result in the shell being overgrown by
complete mussel beds (see table and figure).
This biofouling leads to accelerated corrosion of the ship shell and
increases sailing resistance, thereby decreasing speed and increasing
fuel consumption.
Tributyltin-based antifouling coatings Antifouling agents are used to inhibit biofouling. In the past, ship shells
were protected using copper, but in the late 60s/early 70s of the
twentieth century, usage of tributyltin, or tributyltin(TBT)-based
became common practice. TBT proved to be an economical and very
effective way of inhibiting biofouling, and within a very short span of
time most seagoing vessels were equipped with TBT-based coatings.
. . . . . . . . . . . . . . . . . . . . . . . . . . . . . . . Diagram 1 Mechanism for generation of biofouling, initially by micro-organism, followed by second phase of macro-organism
. . . . . . . . . . . . . . . . . . . . . . . . . . . . . . . Figure 1 Extreme forms of biofouling on ship shell

2–2 Coatings, Shipping & Fisheries
TBT combines good antifouling properties with the benefits of excellent
coating properties, because it can be copolymerised with acrylic-based
paints. Under the influence of seawater, the paint hydrolyzes (dissolves)
very slowly, gradually releasing the TBT in the process. This
characteristic is referred to as "self-polishing," and by building more or
fewer hydrophilic/hydrophobic groups into the acrylic structure, the
speed of release of the TBT can be precisely regulated. TBT-based
coatings have proven to retain sufficient activity over the five years
between prescribed maintenance.
In the nineties of the previous century, however, it became clear that
TBT had unexpected environmental side effects, and more and more
regions began banning TBT. In 2001, a convention was signed by the
IMO (International Maritime Organisation) banning new application of
TBT effectively from 2003, and banning the sailing of ships with TBT-
based coatings from 2008 on. This convention had yet (as of this
writing, 2007) to be ratified by many of the participating member
states, including the Netherlands.
At the European level, EU regulation 782/2003 is now in force, banning
the use of TBT-based coating on any ship flying the flag of any EU
member state.
The Dutch fisheries sector has signed a covenant agreeing that no TBT-
based coating will be used as from 2000 and that as from 2003, no
TBT-based coating may be found in the active top layer.
Cu-based antifouling coatings After the ban on TBT-based paint was announced, the paint industry
began developing potential alternatives, most based on Cu2O as active
component, in some cases supplemented with ZnO and "co-biocides"
such as diuron, irgarol, dichlofluanide and chlorothalonil.
Developing a TBT-free coating was non-trivial. It proved to be difficult
to produce a coating that had both good anti-fouling properties (active
and regular discharge of active components) as well as the properties of
good paint (good adhesion, mechanically strong, resistible to
alternating exposure to sunlight and seawater). Consequently, vendors
developed different solutions, as a result of which it is difficult to
generalise "TBT-free, copper-based coatings."
Diuron and Irgarol were initially the most commonly used co-biocides,
mainly due to cost considerations, but these components prove to be
slowly degradable in the aquatic environment. As a result, products
with diuron and irgarol are no longer permitted by many countries, and
many coating manufacturers no longer supply these products. The
regulations and approval policy on co-biocides is, however, extremely
fragmented (even within the EU, there are significant differences) and
for this reason it is difficult to provide a summary.
Other developments: non-stick coatings One promising new development is the non-stick coating. These are
very slick coatings, often based on siloxans, and are to some degree
comparable with the non-stick layer found on some frying pans. These
coatings are so slick that biofouling has difficulty adhering to the ship's

2–3 Coatings, Shipping & Fisheries
shell, and at sailing speeds the movement of the water washes the
biofouling off of the shell. Initial experiences recently gained with non-
stick coatings are promising, particularly for fast-moving ships like
container ships and passenger ships. These coatings are now found in
the product ranges of most successful coating suppliers, and their
implementation appears to be successful.

3–1 Coatings, Shipping & Fisheries
3 Explanation of calculation method
. . . . . . . . . . . . . . . . . . . . . . . . . . . . . . . . . . . . . . . . . . . . . . . . . . . . . . . . . . . . . . . . . . . . . . . . . . . . . . .
3.1 Activity rates and emission factor
This chapter addresses the method of calculation used to arrive at the
emission assessment. Emissions are ultimately calculated as the product
of an activity rate and an emission factor.
emission = activity rate * emission factor
The activity rate is the wet surface area (WSA) (in m2) on average
present in Dutch waters at any given time. The emission factor is the
leaching rate of TBT, Cu and co-biocides, expressed here in µg cm-2
day-1.
In the calculations, the activity rate for different years was estimated
taking into account the trend in wet surface area and application rates
of the various technologies/coating types.
ARx,c = ARy x APPx,c x TRENDxy
Where:
ARx,c = activity rate of coating type (c) in year (x)
ARy = total of activity rates in base year (y)
APPx,c = application fraction of coating type (c) in year (x)
TRENDxy = trend factor of AR in year x in relation to base
year (y)
The calculation system used is addressed in general terms in the
"method" section. Chapters 5, 6 and 7 cover the activity rates, the
emission factors and the emissions.
3.2 Wet surface area
If the dimensions of the ship are known, the wet surface area can be
calculated by any of several different methods:
• The Denny-Mumford equation (Man-Diesel, 2002; Kuiper,
2003a,b) was derived by Mumford at the end of the 19th
century using tests of ship models in Denny's experimental
(1750 m3) water tank in Scotland. In Denny-Mumford, the wet
surface area is calculated from the length, depth and a block
coefficient (the ratio of the actual volume of the hull and the
product of length x width x depth)
• The Komsi comparison (Koivisto, 2003; OECD, 2005) based on
observations of actual ships in Finland

3–2 Coatings, Shipping & Fisheries
• The Holtrop-Mennen equation (Holtrop, 1977) is the most
recent method for determining the wet surface area. This
formula is based on the same type of measurements as Denny-
Mumford, factoring in additional insights from hydrological
theory. The Holtrop-Mennen coefficients are obtained through
regression analysis of MARIN model tests
• The ratio from Van Hattum et al. (2002) is more of a first order
approach to the wet surface area, based on a simplified ship
model.
In this study, the methods are compared for the group of Bulk Carriers
in the Lloyds register. The results of the comparison are shown in the
figure below. The volume of all ship's enclosed spaces is expressed in
GT (gross tonnage) to the power of two-thirds.
Bulkers: GT^2/3 vs. oppervlak
0
5000
10000
15000
20000
25000
30000
35000
0 500 1000 1500 2000 2500 3000 3500
grootte^2/3 (GT)
op
perv
lak (
m2)
Denny Mumford
Van Hattum
Komsi
Holtrop-Mennen
Average surface % of Holtrop
Mennen
Denny-Mumford 9072 98%
Van Hattum 7735 84%
Komsi 9250 100%
Holtrop-Mennen 9223 100%
For bulk carriers, the results using Denny-Mumford, Holtrop-Mennen
and Komsi are very similar. The Van Hattum model produces different
results. Because Holtrop-Mennen seems to be the most theoretically
sound, the most recent and in keeping with Komsi and Denny-
Mumford, this model is recommended.
Holtrop-Mennen calculates the wet surface area as follows:
WSA = L(2D+W) x sqrt(CM) x (0.530+0.632CB-0.360(CM-0.5)-
0.00135L/D)
Where:
. . . . . . . . . . . . . . . . . . . . . . . . . . . . . . . Figure 2 Comparison of the results of different methods of establishing wet surface area for the group Bulk Carriers
. . . . . . . . . . . . . . . . . . . . . . . . . . . . . . . Table 1 Comparison of the results of different methods of establishing wet surface area for the group Bulk Carriers .
. . . . . . . . . . . . . . . . . . . . . . . . . . . . . . .
Equation 1
The Holtrop-Mennen comparison

3–3 Coatings, Shipping & Fisheries
WSAmax : wet surface area at design draught
D : design draught of the ship
L : length of the ship measured between midship perpendiculars
W : width of ship at widest point
CM : surface area coefficient of the largest rib: the transverse
section measured at the widest rib of the ship divided by the
surface area defined by W x D at the largest rib
CB : the block coefficient of the ship: volume of the ship divided by
the block defined by L x W x D
Values for CM and CB for the various vessel types are shown in table 2.
Vessel type CB CM
Barge 0,9 0,98
Bulk carrier 0.85 0.98
Tanker 0.85 0.98
General cargo 0.75 0.95
Container ship 0.7 0.95
Ferry 0.7 0.95
3.2.1 Calculation of surface areas based on volume
The current standard of ship measurement is gross tonnage (GT1).
A ship twice as long is generally also approximately twice as wide and
twice as deep. The relationship between volume and vessel length is
therefore a third exponent. The relationship between surfaces and
length is a second exponent. Consequently a relationship between
surface and vessel volume to the power of two-thirds may be expected:
WSAmax ~ Volume2/3
Where WSAmax is the wet surface area at design draught.
Upon further elaboration, this is also shown to apply for most vessel
types across a very wide range of vessel sizes. The wet surface can
therefore be expressed as a function of ship size in GT:
WSAmax = C GT2/3
The value of the constant C differs from vessel type to vessel type.
Table 3 presents an overview of the results.
1 Ship size is often expressed in gross tonnage (GT). This gross tonnage is calculated as K * V,
where V is the gross volume of the ship and K is a correction factor, calculated as 0.2 +
0.0210logV .
. . . . . . . . . . . . . . . . . . . . . . . . . . . . . . . Table 2 Coefficients for use in Holtrop-Mennen equation
. . . . . . . . . . . . . . . . . . . . . . . . . . . . . . ..
Equation 2 Determination of wet surface area based on vessel size

3–4 Coatings, Shipping & Fisheries
type no. Vessel types (Sampson description
2006)
surface area
1 Tankers (single and double-walled) WSAmax = 9,62
GT2/3
2 Chemical tankers (single and double-
walled)
LPG tankers
WSAmax = 9,35
GT2/3
2a LNG tankers WSAmax = 7,47
GT2/3
3 Bulk carriers WSAmax = 9,70
GT2/3
4 Container ships WSAmax = 8,57
GT2/3
5 General dry cargo WSAmax = 8,76
GT2/3
6 Passenger ships and ferryboats WSAmax = 5,20
GT2/3
6a Unitised Ro-ro WSAmax = 6,60
GT2/3
7 Reefers WSAmax = 10,2
GT2/3
8, 9, 0 Other; supply ships; non-commercial
ships
WSAmax = 8,40
GT2/3
Fishing vessels WSAmax = 8,63
GT2/3
3.2.2 Correction for incomplete draught
The wet surface areas above are wet areas when fully loaded, which
also puts the ship at design draught. If draught is not full, actual wet
area can be calculated from the actual wet area and the percentage
draught (%T)2:
2 Derivative; the average ratio of maximum draught (Tmax) and vessel
width (B) is 1:2.6. The maximum wet area can initially be estimated as
WSAmax = constant * (2Tmax + )B = constant * (2Tmax + 2.6Tmax) =
constant * 4.6Tmax. Tmax = WSAmax/(constant * 4.6)
In the same way, the actual wet surface area (WSA) is equal to
constant * (2Tmax * %T + B) = constant * (2Tmax * %T + 2.6Tmax) =
constant * Tmax (2%T +2.6).
Combining the two comparisons results in WSA = WSAmax (2 * %T
+2.6)/4.6
. . . . . . . . . . . . . . . . . . . . . . . . . . . . . . . Table 3 Calculation of wet surface areas when fully loaded, for each vessel type

3–5 Coatings, Shipping & Fisheries
WSA = WSAmax (2 * %T +2,6)/4,6
Estimates of relative draught for the various ship types upon arrival and
departure are obtained from MARIN (Van der Tak, 2006).
3.3 Leaching rates
The emission factor is the leach rate of the coating. In this
quantification, three types of coating are distinguished:
- TBT-based coatings, very common up to 2003. TBT-based
coating also contains large amounts of copper, so a Copper
leaching rate is also defined for this coating. As a rule, TBT-
based coatings contain no additional biocides.
- Cu-based coating. In this study, this term is reserved for TBT-
free coatings with Copper as their primary active anti-fouling
component. Because Copper alone is not sufficiently active,
these coatings generally have co-biocides added.
- Non-stick coating: an ultra-slick coating onto which organisms
cannot stick. Any growth that does occur is washed away when
sailing. This is a recent development that proves to be effective
with fast-moving ships.
In recent years, there has been a great deal of attention to the actual
leaching rates of active components in the coating. A list of these rates
is found in table 4.
. . . . . . . . . . . . . . . . . . . . . . . . . . . . . . .
Equation 3
Correction for incomplete draught

3–6 Coatings, Shipping & Fisheries
Component Leach rate
µg/cm2/day
Type of measurement Reference
TBT 0.5 – 2.1 flume and rotary test
system
Thomas et al., 2003
1.5 – 4 ASTM test system Fisher et al., 1997
2.5 model Marina Johnson en Luttik,
1994
0.1 – 5 model Harbor Willingham en
Jacobson, 1996
1.3 – 3.0 model ships > 25m Lindgren et al.,
1998
4 model Stronkhorst, 1996
Cu 18 – 21 flume and rotary test
system
Thomas et al., 2003
25 – 40 ASTM test system Johnson en Luttik,
1994
49 ± 17 ASTM Round robin;
mean ± SD of 5 labs
Finnie, 2006
4 – 6 a modified ASTM test Berg et al., 1995
1-20 not specified Hare, 1993
8 – 25 model ships > 12m Lindgren et al.,
1998
37 – 101 model ships > 25m Lindgren et al.,
1998
3.0-6.4 b In-situ leaching rates for
naval ships
Finnie, 2006
Irgarol 2.6
5.0
flume test system
ISO test system
Thomas, 2001
2 – 16 model marina Ciba, 1995
5 model marina Scarlett et al., 1997
Sea-Nine 211 3.0
2.9
flume test system
ISO test system
Thomas, 2001
1 (0.1 – 5) model harbor Willingham en
Jacobson, 1996
2.5 field and model study Scarlett et al., 1997
Zinc pyrithione 3.3 ISO test system Thomas, 2001
Diuron 0.8
3.3
flume test system
ISO test system
Thomas, 2001
Dichlofluanid 0.6
1.7
flume test system
ISO test system
Thomas, 2001
TCMS pyridine 0.6
3.8
flume test system
ISO test system
Thomas, 2001
(a) after 21 days. For the first 21 days, leach rates of 7 – 61 µg/cm2/day were observed.
(b) summary of leach rate on actual ships, determined using dome method on 5 ships
with an in-service period from shipyard of < 300-758 days, in various studies.
The measurement methods used to obtain these results are not in all
cases directly comparable. Additionally, not all measurement methods
are equally representative of leaching in practice, which makes it
difficult to derive emission factors. One of the most difficult aspects is
that the leaching of a coating is initially very high before diminishing to
a level 5-10 times lower over the course of 1-2 years. Many
. . . . . . . . . . . . . . . . . . . . . . . . . . . . . . . Table 4 Leaching rates of various types of anti-fouling coating, from the literature.

3–7 Coatings, Shipping & Fisheries
measurements in the literature (including the "flume and rotary"3 tests,
standardised by ASTM and ISO) only analyse the initial leaching of a
freshly applied coating, and so are not representative.
Along with these ASTM/ISO measurements, several more long-term
leaching experiments were conducted, in which the leaching of coating
was tracked for several years. This kind of experiments is often
conducted in a port, in actual seawater. An example of such a test is
shown in figure 3, in which a number of different coatings were applied
to a cylinder in the port of San Diego (Valkirs et al., 2003). The cylinder
was rotated and kept still for alternating periods. Initially high emissions
of 16-56 µg Cu cm-2 day-1 quickly dropped off sharply to values of 7-20
µg Cu cm-2 day-1 and then, more gradually, to lower values of 5-10 µg
Cu cm-2 day-1. After a dynamic period, Copper leaching was observed
to be higher than after a static period.
There are also a number of in situ measurements of ship coatings
available from a number of years after application. Finally, there are
mass balance calculations available: an estimate of leaching based on
the amount of coating applied and the composition and lifetime of the
coating.
Looking across the entire range, the results for Copper in particular vary
widely.
- ASTM/IPO flume and rotary tests show high leaching rates, on
the order of 20-50 µg Cu cm-2 day-1
- More long-term tests and mass balance calculations show
leaching rates on the order of 8-15 µg Cu cm-2 day-1
- In situ tests produce leaching rates on the order of 3-6.5 µg Cu
cm-2 day-1
The considerations above ultimately result in the emission factors
shown in Chapter 6.
3.3.1 Co-biocides in Copper-based paint
3 Generally performed by applying a coating to a cylinder and then rotating it in artificial
seawater.
. . . . . . . . . . . . . . . . . . . . . . . . . . . . . . . Figure 3 Development of Cu leaching of various coatings under alternating dynamic and static conditions (Valkirs, 2003).

3–8 Coatings, Shipping & Fisheries
There is no directly useable information available to estimate the
incidence of various anti-fouling products on ships in Dutch waters.
Information on the market share of a specific product is company-
confidential, and paint manufacturers only report this to the institutions
charged with approval of the specific product in their country.
In the Netherlands, there are currently (as of this writing, 2007) 18
different paint products approved, with, in addition to copper (I) oxide,
a further 4 other active ingredients (pesticide database CTGB,
www.ctgb.nl):
Dichlofluanide
Irgarol
Zinc pyrithion
Zineb
There are significant differences in approved products across different
European countries (Readman, 2006), with notable shifts over time in
each country. The web site of associated paint manufacturers and
producers of TBT substitutes (www.antifoulingpaint.com) includes an
overview of the approval requirements for a number of major countries
and areas. There are no specific data on the production of antifouling
paints at the European or worldwide level available via sector
organisations such as CEPE. The annual reports of CEPE
(www.cepe.org) only offer aggregate data of the total of marine
coatings available. Likewise, port authorities have no information on
the various types of products used on ships calling in their ports.
At the worldwide level, five companies account for roughly 90% of the
market for anti-fouling agents (Morrison, 2005): International Paint
/Akzo-Nobel (UK), Jotun (Norway), Hempel (Denmark), SigmaKalon
(Netherlands), and Chugoku (Japan). All five discontinued the supply of
paints containing organotin in the period between 1999 and 2003. In
1999, CEPE issued a report with a list of 26 substances in use as and
potential candidates for active components in antifouling paints (CEPE,
1999). In practice, there are some 10-15 agents most commonly used
by paint manufacturers in the various coatings. The web site
www.antifoulingpaint.com lists the following active agents in addition
to copper(l)oxide:
zinc and copper pyrithione (Arch Chemicals Inc.; trade names: ZPT,
CuPT, Omadine)
dichlofluanide and tolylfluanide (Bayer Chemicals),
irgarol (Ciba),
Sea-Nine 211 (Rohm & Haas).
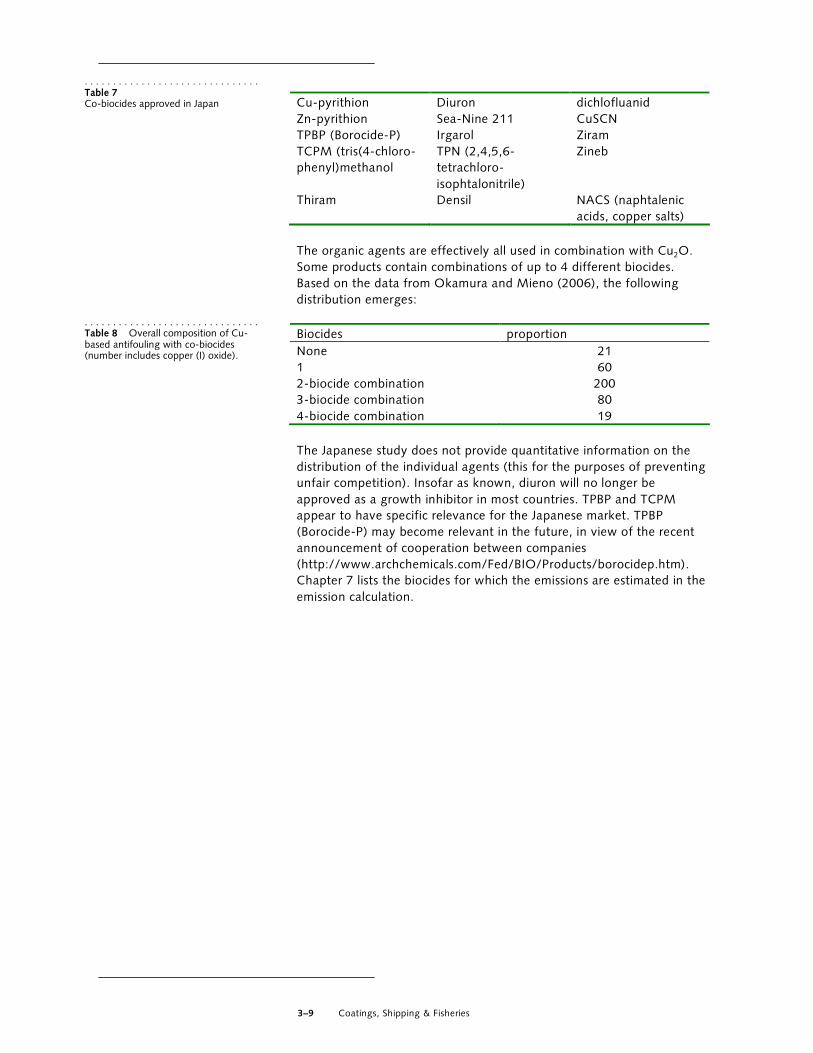
A recent survey by Okamuro and Mieno (2006) provides an overview
of the level of application of antifouling systems in Japan, which ratified
the IMO convention in 2003. The Japanese Association of Paint
Manufacturers (JAPM) has produced a list of 15 agents approved for
use in Japan (in addition to copper (I) oxide) and found in
approximately 380 different paint products:
. . . . . . . . . . . . . . . . . . . . . . . . . . . . . . . Table 5 Co-biocides approved in the Netherlands
. . . . . . . . . . . . . . . . . . . . . . . . . . . . . . . Table 6 Most commonly used co-biocides worldwide, according to CEPE
3–9 Coatings, Shipping & Fisheries
Cu-pyrithion Diuron dichlofluanid
Zn-pyrithion Sea-Nine 211 CuSCN
TPBP (Borocide-P) Irgarol Ziram
TCPM (tris(4-chloro-
phenyl)methanol
TPN (2,4,5,6-
tetrachloro-
isophtalonitrile)
Zineb
Thiram Densil NACS (naphtalenic
acids, copper salts)
The organic agents are effectively all used in combination with Cu2O.
Some products contain combinations of up to 4 different biocides.
Based on the data from Okamura and Mieno (2006), the following
distribution emerges:
Biocides proportion
None 21
1 60
2-biocide combination 200
3-biocide combination 80
4-biocide combination 19
The Japanese study does not provide quantitative information on the
distribution of the individual agents (this for the purposes of preventing
unfair competition). Insofar as known, diuron will no longer be
approved as a growth inhibitor in most countries. TPBP and TCPM
appear to have specific relevance for the Japanese market. TPBP
(Borocide-P) may become relevant in the future, in view of the recent
announcement of cooperation between companies
(http://www.archchemicals.com/Fed/BIO/Products/borocidep.htm).
Chapter 7 lists the biocides for which the emissions are estimated in the
emission calculation.
. . . . . . . . . . . . . . . . . . . . . . . . . . . . . . . Table 7 Co-biocides approved in Japan
. . . . . . . . . . . . . . . . . . . . . . . . . . . . . . . Table 8 Overall composition of Cu-based antifouling with co-biocides (number includes copper (I) oxide).
4–1 Coatings, Shipping & Fisheries
4 Activity rates
. . . . . . . . . . . . . . . . . . . . . . . . . . . . . . . . . . . . . . . . . . . . . . . . . . . . . . . . . . . . . . . . . . . . . . . . . . . . . . .
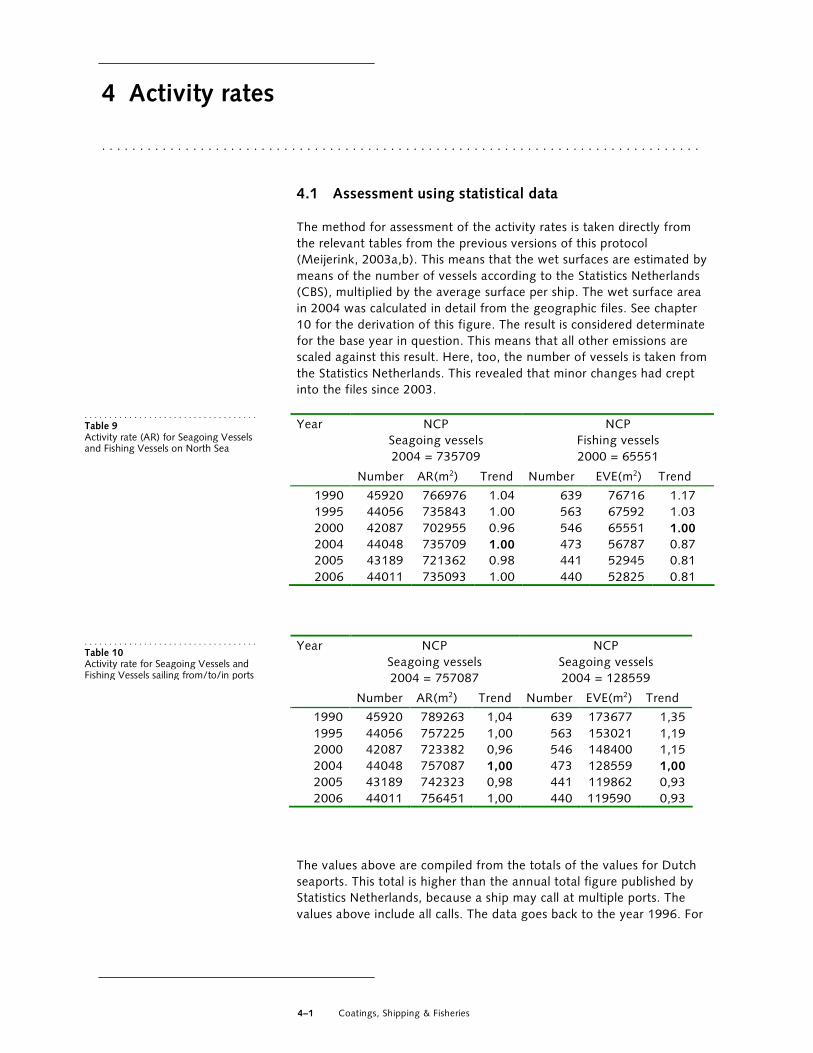
4.1 Assessment using statistical data
The method for assessment of the activity rates is taken directly from
the relevant tables from the previous versions of this protocol
(Meijerink, 2003a,b). This means that the wet surfaces are estimated by
means of the number of vessels according to the Statistics Netherlands
(CBS), multiplied by the average surface per ship. The wet surface area
in 2004 was calculated in detail from the geographic files. See chapter
10 for the derivation of this figure. The result is considered determinate
for the base year in question. This means that all other emissions are
scaled against this result. Here, too, the number of vessels is taken from
the Statistics Netherlands. This revealed that minor changes had crept
into the files since 2003.
NCP
Seagoing vessels
2004 = 735709
NCP
Fishing vessels
2000 = 65551
Year
Number AR(m2) Trend Number EVE(m2) Trend
1990 45920 766976 1.04 639 76716 1.17
1995 44056 735843 1.00 563 67592 1.03
2000 42087 702955 0.96 546 65551 1.00
2004 44048 735709 1.00 473 56787 0.87
2005 43189 721362 0.98 441 52945 0.81
2006 44011 735093 1.00 440 52825 0.81
NCP
Seagoing vessels
2004 = 757087
NCP
Seagoing vessels
2004 = 128559
Year
Number AR(m2) Trend Number EVE(m2) Trend
1990 45920 789263 1,04 639 173677 1,35
1995 44056 757225 1,00 563 153021 1,19
2000 42087 723382 0,96 546 148400 1,15
2004 44048 757087 1,00 473 128559 1,00
2005 43189 742323 0,98 441 119862 0,93
2006 44011 756451 1,00 440 119590 0,93
The values above are compiled from the totals of the values for Dutch
seaports. This total is higher than the annual total figure published by
Statistics Netherlands, because a ship may call at multiple ports. The
values above include all calls. The data goes back to the year 1996. For
. . . . . . . . . . . . . . . . . . . . . . . . . . . . . . . . . . .
Table 9 Activity rate (AR) for Seagoing Vessels and Fishing Vessels on North Sea
. . . . . . . . . . . . . . . . . . . . . . . . . . . . . . . . . . .
Table 10 Activity rate for Seagoing Vessels and Fishing Vessels sailing from/to/in ports

4–2 Coatings, Shipping & Fisheries
years prior to 1996, the Statistics Netherlands does not publish online
statistics, so these values are estimates. The following ports are included: Amsterdam, Delfzijl en Eemshaven,
Dordrecht, Harlingen, IJmuiden, Klundert, Moerdijk, Rotterdam,
Scheveningen, Terneuzen, Vlaardingen, Vlissingen, Zevenbergen and
Zaanstad.
4.2 Time series, present-2027
The trend in the activity rate (wet surface area) is dependent on two
factors: - trends in ship activities - trends in ship size
Ship activities A forecast for trends in ship movements can be based on CPB
scenarios. Their scenario document Welvaart en leefomgeving (CPB et
al., 2006) outlines a trend in the quantity of goods stored in the ports.
The trend in ship movement (in tonne-km) is assumed to be directly
related to this stored quantity of goods.
The Global Economy scenario is selected, which entails the assumption
that during the period from 2002 to 2040, shipping activities will more
than double (2% growth per year).
In the same period, the fisheries sector is expected to shrink 50% (2%
per year until 2040).
Trend in vessel size Trends in vessel size are important for tracking the development of
leaching from antifouling. Growth in average vessel size means a
decrease in total wet surface (at equal total tonnage), because larger
ships have relatively less surface area than smaller ships. The
development of vessel size per vessel type is based on trends in average
vessel size over the past 20 years. Looking at these trends reveals that
for a number of vessel types, there has been no growth in this period,
while others have grown by 20-30%.
- Vessel types that have seen no significant growth are: Tankers
for chemicals and oil products, bulk carriers, reefers and
miscellaneous, non-merchant. For these vessel types, no growth
will be assumed for the coming 20 years.
- Vessel types that have seen growth are: oil tankers, OBO,
container ships, general dry cargo ships, ferryboats, passenger
ships/ro-ros and fishing vessels. For these vessel types, a 20%
growth in vessel size will be assumed for the coming twenty
years.
Trends in wet surface area Combination of the growth in vessel activities and average vessel size
results in the index values as compared to 2004 shown in the table

4–3 Coatings, Shipping & Fisheries
below. The result of growth in average vessel size is that ultimately, the
growth in WSA will be curtailed somewhat. This is because larger ships
have slightly less surface area per unit of cargo capacity than smaller
ships.
Year Index figure WSA
vessels with no
significant vessel
growth1
Index figure WSA
vessels with
significant vessel
growth2
Index figure WSA
fishing vessels
2004 100 100 100
2009 110 107 88
2015 124 116 76
2021 139 125 65
2027 156 135 56 1) Tankers for chemicals and oil products, bulk carriers, reefers and
miscellaneous, non-merchant. 2) Oil tankers, OBO, container ships, general dry cargo ships, ferryboats,
passenger ships/ro-ros and fishing vessels.
4.3 Annual data setting
Source for annual updating of data
Data on the number of calling ships and the size of the fishery fleet are
updated annually against actual data from Statistics Netherlands.
The emissions calculated can be easily updated based on recent annual
values of the number of calls of seagoing and fishing vessels. These
values are published annually by Statistics Netherlands.
Description of data supply pathway
The data can be obtained from Statistics Netherlands in two ways. The
first is with the assistance of Statistics Netherlands help desk, which is
available to take questions on any published values by phone and e-
mail. The second method is to use Statistics Netherlands's StatLine
database, which can be accessed via the internet. The data required are
found under the main group Bedrijfsleven ("Industry") by selecting the sub-groups Verkeer, vervoer en communicatie ("Traffic, transport and communication" and then Personen- en goererenvervoer ("Passenger and goods transport"). Under this group, select zeevaart ("sea transport") and then zeevaart, kwartaalcijfers ("sea transport, quarterly values"). To obtain the correct values, under the Periodes ("Periods") tab select the annual totals from 1996 through 2006, and under the
Belangrijkste Nederlandse havens ("Biggest Dutch ports") tab, select all
individual seaports. Do not select Nederland totaal (All Netherlands)
under the "Biggest Dutch ports" tab. All Netherlands does not include
double calls in port.
For the fishery fleet, select the main group Bedrijfsleven ("Industry") and then the group Landbouw en visserij ("Agriculture and fisheries").
Then select Visserij ("Fisheries"). Under this group, select Zee- en kustvisserij ("Sea and coastal fisheries"). To obtain the correct values, under the tab Onderwerpen ("Subjects"), select Vloot ("Fleet") and
. . . . . . . . . . . . . . . . . . . . . . . . . . . . . . . Table 11 Activity rates for the years 2004 through 2007

4–4 Coatings, Shipping & Fisheries
then Aantal schepen ("Number of ships"). All types must be selected.
Under the Periodes ("Periods") tab, select the desired years. Use of this database and the help desk is free. StatLine does not include
any values for sea transport and traffic from before 1996. Older values
may be requested from the information desk.
Sources for updating of data for spatial allocation
If the spatial allocation must be updated, two data sources are required:
1. For the Dutch shipping lanes and ports, the database for
calculation of atmospheric emissions must be used.
2. To update spatial distribution data on the NCP, the MARIN
traffic and transport database must be used.
Both of these functions will most likely require specialist assistance.
For the calculation of the wet surface area on the NCP, the traffic and
transport database from the risk model SAMSON is the source for
periodic updating against actual values.
Calculation of the wet surface area of the ships relies on the data from
the SAMSON traffic and transport database. The basic data for the
traffic and transport database over the year 2004 were derived from
Lloyds. Regarding high cost, these basic data will only be purchased
periodically. Updating of the Lloyds database does not result in major
changes in wet surface area. MARIN converts the Lloyds data into a
traffic and transport database. In the future, this database will be based
on AIS data (whether or not this data will still have to be acquired from
Lloyds is uncertain). The traffic and transport database is available from
MARIN or the Traffic and Transport Advisory Service AVV (E. Bolt). Up
to now, the Lloyds database has been used to create a new traffic and
transport database approximately once in four years.

5–1 Coatings, Shipping & Fisheries
5 Nature of the emission source
. . . . . . . . . . . . . . . . . . . . . . . . . . . . . . . . . . . . . . . . . . . . . . . . . . . . . . . . . . . . . . . . . . . . . . . . . . . . . . .
The emission source, the coating, has the spatial character of a diffuse
source. As a whole, the emission source can be essentially considered a
line source along the seaways on the NCP, with strength proportional
to the annual wet surface area travelling those routes annually. The
fisheries sector is an additional diffuse source.

6–1 Coatings, Shipping & Fisheries
6 Emission factors
. . . . . . . . . . . . . . . . . . . . . . . . . . . . . . . . . . . . . . . . . . . . . . . . . . . . . . . . . . . . . . . . . . . . . . . . . . . . . . .
6.1 Emission factors sailing
As described in chapter 2.4, the results of ASTM/IPO flume and rotary
tests are not representative of average leaching in practice. The results
of more long-term tests, mass balance calculations and in situ tests, on
the other hand, do appear to be representative. Consequently, the
following emission factors will be adhered to in this study.
Type of coating/component Leaching rate in µg Cu cm-2 day-1
TBT-based coating
- TBT 4
- Cu 7
Cu-based coating
- Cu 10
- co-biocides 1,5
non-stick coating
- none -
After consultation with Dutch paint manufacturers and members of the
Antifouling Working Group of the European Paint Makers Association
(CEPE-AFWG), the proposal was made to initially assume the following
agents, and failing quantitative information, apply a proportionate
distribution as fraction of the co-biocides. This group of 9 components
does not include diuron. According to information obtained, diuron is
primarily applied as co-biocide for use on pleasure craft.
Zinc pyrithion/Copper
pyrithion
Seanine Tolylfluanide
Dichlofluanide Irgarol Zineb
Copper thiocyanate Dichlofluanide
There is no information on the present market share of the various
types of paint.
6.2 Emission factors in ports
While at berth, the leaching of active components is less than when at
sail, because the substance transfer and the self-polishing mechanism
of the paint is activated by passing water. The decrease of the leaching
over time, however, depends on the duration of berth, and is accrued
in the first 10 days (Yebra et al., 2006). This is because micro-
organisms appear to build up a biofilm on the ship's shell while at
. . . . . . . . . . . . . . . . . . . . . . . . . . . . . . . Table 12 Leach rate conclusions. Emission factors as applied in this study
. . . . . . . . . . . . . . . . . . . . . . . . . . . . . . . Table 13 Conclusion: co-biocides assumed in this study.

6–2 Coatings, Shipping & Fisheries
berth. Additionally, the decrease of the leaching while at berth depends
strongly on the coating applied. For self-polishing coatings, for
example, the effect will be greater than for coatings based on another
active mechanism.
There are no real measurement data available on which to base an
estimate of the decrease in leaching when moored in port. During static
periods of a month, a decrease of over 50% from dynamic periods is
sometimes observed (Valkirs et al., 2003). Using simulation and model
studies, Kiil et al. (2002, 2003) arrive at the same difference of
approximately 50% for Cu and TBT, and report a significant lag effect
on a time scale of several days.
Most larger ships, however, are at berth for much shorter periods,
which makes a 50% decrease seem to be a rather high estimate. For
this reason, this study assumes a decrease of 25%. This means that
emission factors for mooring in port are estimated at 75%4 of emissions
at sail.
6.3 Application percentages
Application of coating types is changing constantly, driven by changes
in regulations, increasing environmental consciousness among paint
manufacturers and shipowners and technological innovation in
coatings. An estimate of the application of the three types of coatings
over time is shown in figures 4, 5 and 6.
In 1998, an estimated 70% of the coating used was TBT-based
(Meijerink, 2003; DNV, 1998). According to the industry (Van Hattum),
at that time 85% of ships were equipped with TBT-based coating, with
a slight decline in the pre-2003 period.
In the period of 1998-2003, application of TBT-based coatings was
already an issue of discussion, as a result of which some shipping
companies were already switching over to Cu-based coatings.
Greenpeace (2000) reports that in 2000, investigation at the ports of
Antwerp, Rotterdam and Hamburg revealed that of 6 major shipping
companies, two were entirely TBT-free, two were partially TBT-free and
two still had TBT in general use (one of these being Maersk). In spring
of 2000, Maersk announced that it was switching to TBT-free coatings,
and as of 2006 claimed to be entirely TBT-free (Maersk, 2006).
The worldwide ban on TBT-based coatings came into effect in 2003.
Although this ban has not, as of this writing (2007), been ratified
worldwide, for the paint manufacturing sector this was reason enough
to proactively develop alternatives and take TBT-based coatings out of
production. As a result, from 2001-2003 there was almost no further
production of TBT-based antifouling coatings, and after that time
existing stocks were most likely exhausted. The lifetime of TBT-based
4 The industry claims that the decrease in leaching is potentially greater, although they also
lack any quantitative information in this area.

6–3 Coatings, Shipping & Fisheries
coatings is approximately 3-5 years, so full phase-out of TBT-based
antifouling on ship shells can be expected by the 2008-2010 period.
Initial reports of successful trials with non-stick coatings, in particular
on fast-moving ships, began appearing around 2005. At this point, so
much confidence in this type of paint has been generated that high-
profile ships such as the “Emma Maersk” (world's largest container
ship) are using it. Another indication of the success of non-stick
coatings is that the “APL Jeddah” is certified for sailing with Hempasil
with a maintenance interval of 10 years. Non-stick coatings are also
being given a boost by the rise in fuel costs: although this coating is
somewhat more expensive than Copper-based coatings, its good anti-
fouling properties mean savings on fuel, earning back the higher cost
fairly quickly. Non-stick coatings seem to become a success story.
Consequently, we assume that in 2020, 95% of all fast-moving ships
and 15% of all other ships (40% of the total fleet) will be equipped
with non-stick coatings.
s n e l v a r e n d e s c h e p e n
0 %
1 0 %
2 0 %
3 0 %
4 0 %
5 0 %
6 0 %
7 0 %
8 0 %
9 0 %
1 0 0 %
1 9 9 01 9 9 6
1 9 9 82 0 0 0
2 0 0 22 0 0 4
2 0 0 62 0 0 8
2 0 1 02 0 1 2
2 0 1 42 0 1 6
2 0 1 82 0 2 0
2 0 2 22 0 2 4
t i j d
toe
pa
ss
ing
sp
erc
en
tag
e
a n d e r s / n o n - s t ic k
C u - h o u d e n d
T B T - h o u d e n d
l a n g z a a m v a r e n d e s c h e p e n
0 %
1 0 %
2 0 %
3 0 %
4 0 %
5 0 %
6 0 %
7 0 %
8 0 %
9 0 %
1 0 0 %
1 9 9 01 9 9 6
1 9 9 82 0 0 0
2 0 0 22 0 0 4
2 0 0 62 0 0 8
2 0 1 02 0 1 2
2 0 1 42 0 1 6
2 0 1 82 0 2 0
2 0 2 22 0 2 4
t i j d
toe
pa
ss
ing
sp
erc
en
tag
e
a n d e r s / n o n - s t ic k
C u - h o u d e n d
T B T - h o u d e n d
In the fisheries sector, the switch to TBT-free paints was probably made
faster. The Dutch fisheries sector signed a covenant agreeing that no
TBT-based coating would be used as from 2000 and that as from 2003,
no TBT-based coating would be permitted in the active top layer (O&C,
2000). However, compliance with this commitment was not monitored
. . . . . . . . . . . . . . . . . . . . . . . . . . . . . . . Figure 4 Development of application of various antifouling coatings for fast-moving ships and forecast for future developments.
. . . . . . . . . . . . . . . . . . . . . . . . . . . . . . . Figure 5 Development of application of various antifouling coatings for slow-moving ships and forecast for future developments.

6–4 Coatings, Shipping & Fisheries
(Meijerink, 2003a,b), so no quantitative data on implementation are
known. Consequently, Meijerink assumes a limited effect for 2001 and
2002. In view of the relatively short maintenance interval for fishing
vessels and the difficulty of obtaining TBT-based paint, a sharp drop in
the use of TBT on fishing vessels after 2003 is assumed.

6–5 Coatings, Shipping & Fisheries
v i s s e r i j s c h e p e n
0 %
1 0 %
2 0 %
3 0 %
4 0 %
5 0 %
6 0 %
7 0 %
8 0 %
9 0 %
1 0 0 %
1 9 9 01 9 9 6
1 9 9 82 0 0 0
2 0 0 22 0 0 4
2 0 0 62 0 0 8
2 0 1 02 0 1 2
2 0 1 42 0 1 6
2 0 1 82 0 2 0
2 0 2 22 0 2 4
t i j d
toe
pa
ss
ing
sp
erc
en
tag
e
a n d e r s / n o n - s t ic k
C u - h o u d e n d
T B T - h o u d e n d
6.4 Time series, 1990-present
For the time being, no research into the trend in emission factors is
required. The main issue is the degree of use of materials, which has
been sufficiently addressed in the preceding section.
6.5 Annual data setting
The application percentages as indicated above may be used
provisionally. A new inventory of developments in the shares of the
various coating types and corresponding emission factors every five
years is recommended.
. . . . . . . . . . . . . . . . . . . . . . . . . . . . . . .
. . . . Figure 6 Development of application of various antifouling coatings for fishing vessels and forecast for future developments.

7–1 Coatings, Shipping & Fisheries
7 Emissions calculated
. . . . . . . . . . . . . . . . . . . . . . . . . . . . . . . . . . . . . . . . . . . . . . . . . . . . . . . . . . . . . . . . . . . . . . . . . . . . . . .
7.1 Emission values 2006
Emissions for 2006 for the ships in the spatial distribution database are
shown in tables 14 and 15.
Name of substance
Sailing on NCP Sailing from/to/in ports
Moored in ports Final total
Copper 22796 4704 14060 41560
Tributylin compounds 3327 684 2066 6077
Dichlofluanide 365 75 224 664
Irgarol 365 75 224 664
Tolylfluanide 365 75 224 664
Copper thiocyanate 365 75 224 664
Seanine-211 (kathon) 365 75 224 664
Zineb 365 75 224 664
Zinc pyrithion 365 75 224 664
Name of substance Sailing on NCP Moored in ports
Final total
Copper 1587 3113 4700
Tributylin compounds 0 0 0
Dichlofluanide 34 67 101
Irgarol 34 67 101
Tolylfluanide 34 67 101
Copper thiocyanate 34 67 101
Seanine-211 (kathon) 34 67 101
Zineb 34 67 101
Zinc pyrithion 34 67 101
. . . . . . . . . . . . . . . . . . . . . . . . . . . . . . .
. . . . Table 14 Emissions by coatings of seagoing vessels in 2006 (kg/year)
. . . . . . . . . . . . . . . . . . . . . . . . . . . . . . . .
. . . Table 15 Emissions by coatings of fishing vessels in 2006 (kg/year)

7–2 Coatings, Shipping & Fisheries
7.2 Emissions 1990-2006
Tables 16-20 below show the emissions by coatings on seagoing
vessels and fishing vessels for the years 1990 through 2006 for both
the NCP and the Dutch ports and shipping lanes.
Name of substance 1990 1995 2000 2005 2006
Copper 19489 18698 18245 21416 22796
Tributylin compounds 9518 9132 8211 4634 3327
Dichlofluanide 60 58 83 286 365
Irgarol 60 58 83 286 365
Tolylfluanide 60 58 83 286 365
Copper thiocyanate 60 58 83 286 365
Seanine-211 (kathon) 60 58 83 286 365
Zineb 60 58 83 286 365
Zinc pyrithion 60 58 83 286 365
Name of substance 1990 1995 2000 2005 2006
Copper 4009 3847 3754 4415 4704
Tributylin compounds 1958 1879 1689 953 684
Dichlofluanide 12 12 17 59 75
Irgarol 12 12 17 59 75
Tolylfluanide 12 12 17 59 75
Copper thiocyanate 12 12 17 59 75
Seanine-211 (kathon) 12 12 17 59 75
Zineb 12 12 17 59 75
Zinc pyrithion 12 12 17 59 75
Name of substance 1990 1995 2000 2005 2006
Copper 12051 11562 11283 13220 14060
Tributylin compounds 5912 5672 5100 2878 2066
Dichlofluanide 37 36 51 175 224
Irgarol 37 36 51 175 224
Tolylfluanide 37 36 51 175 224
Copper thiocyanate 37 36 51 175 224
Seanine-211 (kathon) 37 36 51 175 224
Zineb 37 36 51 175 224
Zinc pyrithion 37 36 51 175 224
. . . . . . . . . . . . . . . . . . . . . . . . . . . . . . .
. . . . Table 16 Emissions by coatings of seagoing vessels on NCP in the period in 1990-2006 (kg/year)
. . . . . . . . . . . . . . . . . . . . . . . . . . . . . . .
. . . . Table 17 Emissions by coatings of seagoing vessels sailing from/to/in ports in the period in 1990-2006 (kg/year)
. . . . . . . . . . . . . . . . . . . . . . . . . . . . . . .
. . . . Table 18 Emissions by coatings of seagoing vessels moored in ports in the period in 1990-2006 (kg/year)

7–3 Coatings, Shipping & Fisheries
Name of substance 1990 1995 2000 2005 2006
Copper 1689 1488 1474 1565 1587
Tributylin compounds 825 727 664 33 0
Dichlofluanide 5 5 7 32 34
Irgarol 5 5 7 32 34
Tolylfluanide 5 5 7 32 34
Copper thiocyanate 5 5 7 32 34
Seanine-211 (kathon) 5 5 7 32 34
Zineb 5 5 7 32 34
Zinc pyrithion 5 5 7 32 34
Name of substance 1990 1995 2000 2005 2006
Copper 3310 2917 2889 3071 3113
Tributylin compounds 1624 1431 1306 66 0
Dichlofluanide 10 9 13 63 67
Irgarol 10 9 13 63 67
Tolylfluanide 10 9 13 63 67
Copper thiocyanate 10 9 13 63 67
Seanine-211 (kathon) 10 9 13 63 67
Zineb 10 9 13 63 67
Zinc pyrithion 10 9 13 63 67
. . . . . . . . . . . . . . . . . . . . . . . . . . . . . . . Table 19 Emissions by coatings of fishing vessels on NCP in the period in 1990-2006 (kg/year)
. . . . . . . . . . . . . . . . . . . . . . . . . . . . . . . Table 20 Emissions by coatings of fishing vessels moored in ports in the period in 1990-2006 (kg/year)

7–4 Coatings, Shipping & Fisheries
7.3 Emissions forecast, 2009-2027
Tables 21-25 below show the forecasts for emissions by coatings on
seagoing vessels and fishing vessels for the years 2009 through 2027
for both the NCP and the Dutch ports and shipping lanes.
Name of substance 2009 2015 2021 2027
Copper 26579 24387 22611 24906
Tributylin compounds 290 0 0 0
Dichlofluanide 561 525 487 536
Irgarol 561 525 487 536
Tolylfluanide 561 525 487 536
Copper thiocyanate 561 525 487 536
Seanine-211 (kathon) 561 525 487 536
Zineb 561 525 487 536
Zinc pyrithion 561 525 487 536
Name of substance 2009 2015 2021 2027
Copper 5547 5390 5297 5891
Tributylin compounds 60 0 0 0
Dichlofluanide 117 116 114 127
Irgarol 117 116 114 127
Tolylfluanide 117 116 114 127
Copper thiocyanate 117 116 114 127
Seanine-211 (kathon) 117 116 114 127
Zineb 117 116 114 127
Zinc pyrithion 117 116 114 127
Name of substance 2009 2015 2021 2027
Copper 16325 14225 12459 13724
Tributylin compounds 180 0 0 0
Dichlofluanide 342 304 266 293
Irgarol 342 304 266 293
Tolylfluanide 342 304 266 293
Copper thiocyanate 342 304 266 293
Seanine-211 (kathon) 342 304 266 293
Zineb 342 304 266 293
Zinc pyrithion 342 304 266 293
. . . . . . . . . . . . . . . . . . . . . . . . . . . . . . . Table 21 Emissions by coatings of seagoing vessels on NCP in the period in 2009-2027 (kg/year)
. . . . . . . . . . . . . . . . . . . . . . . . . . . . . . . Table 22 Emissions by coatings of seagoing vessels sailing from/to/in ports in the period in 2009-2027 (kg/year)
. . . . . . . . . . . . . . . . . . . . . . . . . . . . . . . Table 23 Emissions by coatings of seagoing vessels moored in ports in the period in 2009-2027 (kg/year)

7–5 Coatings, Shipping & Fisheries
Name of substance 2009 2015 2021 2027
Copper 1735 1490 1280 1100
Tributylin compounds 0 0 0 0
Dichlofluanide 37 32 28 24
Irgarol 37 32 28 24
Tolylfluanide 37 32 28 24
Copper thiocyanate 37 32 28 24
Seanine-211 (kathon) 37 32 28 24
Zineb 37 32 28 24
Zinc pyrithion 37 32 28 24
Name of substance 2009 2015 2021 2027
Copper 2948 2533 2175 1869
Tributylin compounds 0 0 0 0
Dichlofluanide 63 54 47 40
Irgarol 63 54 47 40
Tolylfluanide 63 54 47 40
Copper thiocyanate 63 54 47 40
Seanine-211 (kathon) 63 54 47 40
Zineb 63 54 47 40
Zinc pyrithion 63 54 47 40
7.4 Comments and changes in regard to previous version
The methodology for determining the emissions is the same as the
previous version of the fact sheets (Meijerink, 2003a,b), although new
insights prompted the change of both the emission factors and the
application percentages of the coating types. The emission values for
copper have been changed from the previous version of this protocol
by virtue of the fact that now, copper emission factors are also applied
to TBT-based coatings, and at the same time, the emission factors for
copper-based coatings have been adjusted downward. With tributyltin,
the difference can only be explained by the adjustment of application
percentages. Likewise, with biocides, the application percentages were
adjusted as a function of the rise of the copper-based coating types.
No changes in the methodology were made for the 2008 emission
inventory.
. . . . . . . . . . . . . . . . . . . . . . . . . . . . . . . Table 24 Emissions by coatings of fishing vessels on NCP in the period in 2009-2027 (kg/year)
. . . . . . . . . . . . . . . . . . . . . . . . . . . . . . . Table 25 Emissions by coatings of fishing vessels moored in ports in the period in 2009-2027 (kg/year)
7–6 Coatings, Shipping & Fisheries
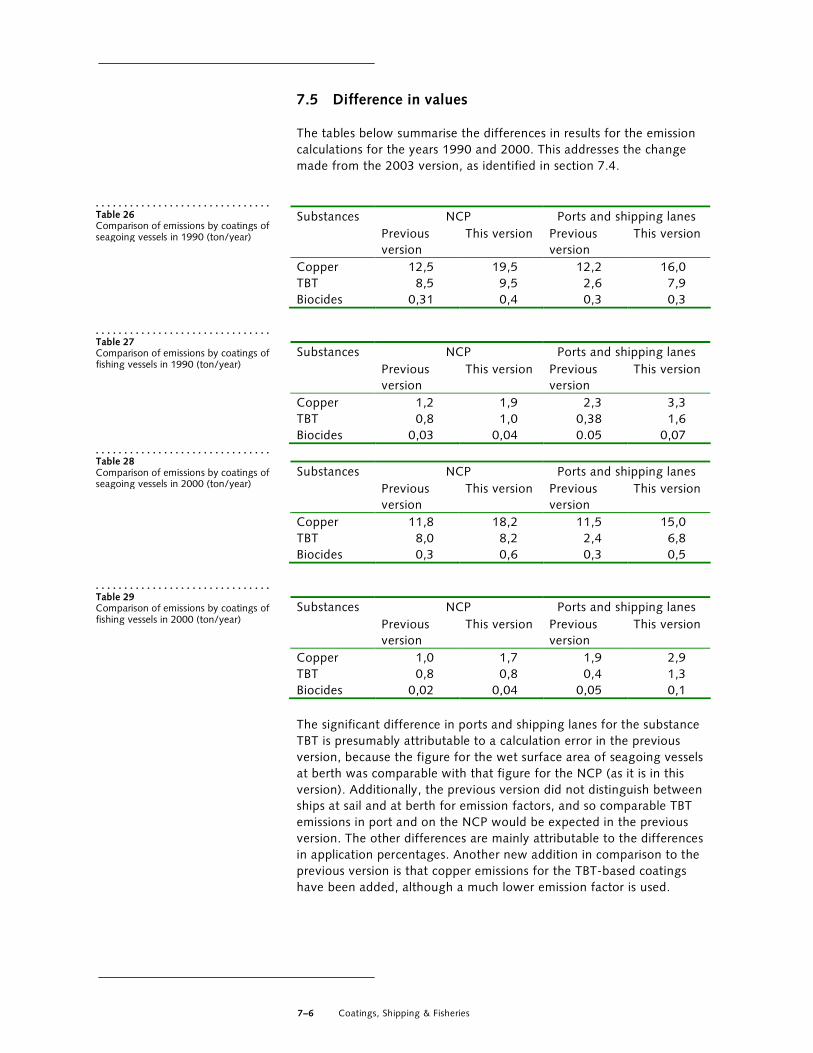
7.5 Difference in values
The tables below summarise the differences in results for the emission
calculations for the years 1990 and 2000. This addresses the change
made from the 2003 version, as identified in section 7.4.
NCP Ports and shipping lanes Substances
Previous
version
This version Previous
version
This version
Copper 12,5 19,5 12,2 16,0
TBT 8,5 9,5 2,6 7,9
Biocides 0,31 0,4 0,3 0,3
NCP Ports and shipping lanes Substances
Previous
version
This version Previous
version
This version
Copper 1,2 1,9 2,3 3,3
TBT 0,8 1,0 0,38 1,6
Biocides 0,03 0,04 0.05 0,07
NCP Ports and shipping lanes Substances
Previous
version
This version Previous
version
This version
Copper 11,8 18,2 11,5 15,0
TBT 8,0 8,2 2,4 6,8
Biocides 0,3 0,6 0,3 0,5
NCP Ports and shipping lanes Substances
Previous
version
This version Previous
version
This version
Copper 1,0 1,7 1,9 2,9
TBT 0,8 0,8 0,4 1,3
Biocides 0,02 0,04 0,05 0,1
The significant difference in ports and shipping lanes for the substance
TBT is presumably attributable to a calculation error in the previous
version, because the figure for the wet surface area of seagoing vessels
at berth was comparable with that figure for the NCP (as it is in this
version). Additionally, the previous version did not distinguish between
ships at sail and at berth for emission factors, and so comparable TBT
emissions in port and on the NCP would be expected in the previous
version. The other differences are mainly attributable to the differences
in application percentages. Another new addition in comparison to the
previous version is that copper emissions for the TBT-based coatings
have been added, although a much lower emission factor is used.
. . . . . . . . . . . . . . . . . . . . . . . . . . . . . . . Table 26 Comparison of emissions by coatings of seagoing vessels in 1990 (ton/year)
. . . . . . . . . . . . . . . . . . . . . . . . . . . . . . . Table 27 Comparison of emissions by coatings of fishing vessels in 1990 (ton/year)
. . . . . . . . . . . . . . . . . . . . . . . . . . . . . . . Table 28 Comparison of emissions by coatings of seagoing vessels in 2000 (ton/year)
. . . . . . . . . . . . . . . . . . . . . . . . . . . . . . . Table 29 Comparison of emissions by coatings of fishing vessels in 2000 (ton/year)
8–1 Coatings, Shipping & Fisheries
8 Accuracy and indicated subjects for improvement
. . . . . . . . . . . . . . . . . . . . . . . . . . . . . . . . . . . . . . . . . . . . . . . . . . . . . . . . . . . . . . . . . . . . . . . . . . . . . . .
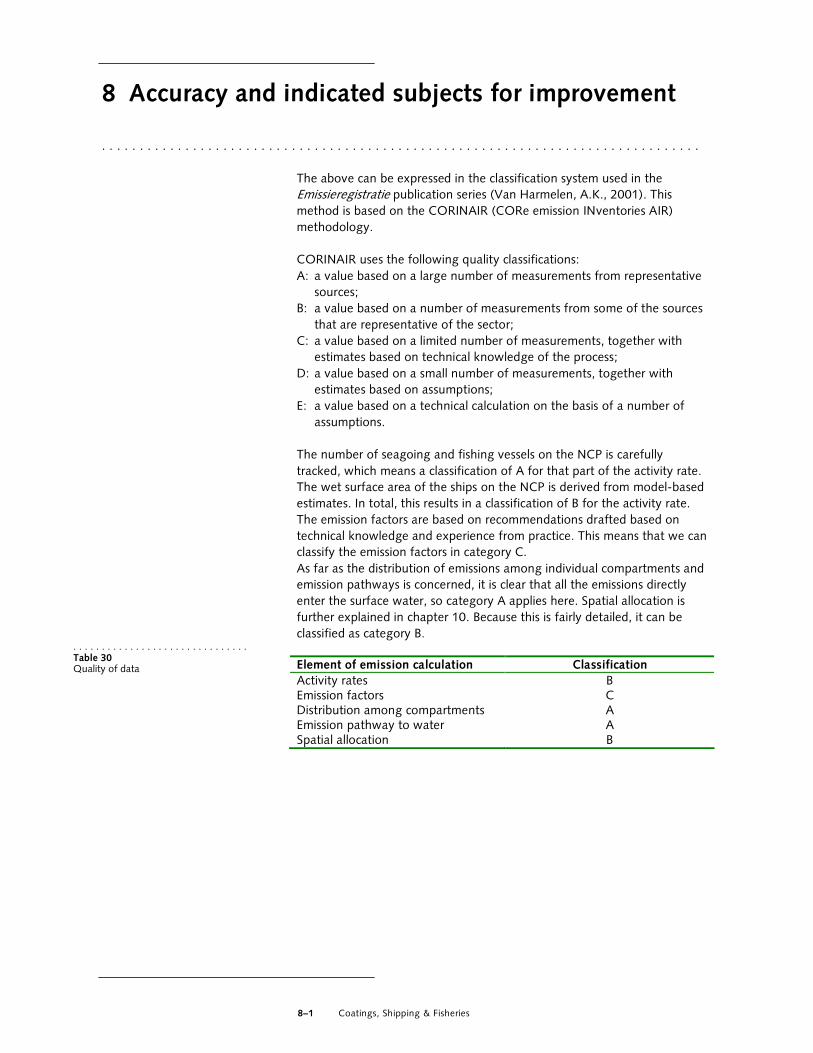
The above can be expressed in the classification system used in the
Emissieregistratie publication series (Van Harmelen, A.K., 2001). This
method is based on the CORINAIR (CORe emission INventories AIR)
methodology.
CORINAIR uses the following quality classifications:
A: a value based on a large number of measurements from representative
sources;
B: a value based on a number of measurements from some of the sources
that are representative of the sector;
C: a value based on a limited number of measurements, together with
estimates based on technical knowledge of the process;
D: a value based on a small number of measurements, together with
estimates based on assumptions;
E: a value based on a technical calculation on the basis of a number of
assumptions.
The number of seagoing and fishing vessels on the NCP is carefully
tracked, which means a classification of A for that part of the activity rate.
The wet surface area of the ships on the NCP is derived from model-based
estimates. In total, this results in a classification of B for the activity rate.
The emission factors are based on recommendations drafted based on
technical knowledge and experience from practice. This means that we can
classify the emission factors in category C.
As far as the distribution of emissions among individual compartments and
emission pathways is concerned, it is clear that all the emissions directly
enter the surface water, so category A applies here. Spatial allocation is
further explained in chapter 10. Because this is fairly detailed, it can be
classified as category B.
Element of emission calculation Classification
Activity rates B Emission factors C Distribution among compartments A Emission pathway to water A Spatial allocation B
. . . . . . . . . . . . . . . . . . . . . . . . . . . . . . . Table 30 Quality of data

8–1 Coatings, Shipping & Fisheries
The number of ships on the NCP is only known for the year 2004. So as
to also be able to present values for the years 1990 through 2003, this
figure was compared to the Statistics Netherlands annual values for the
total number of seagoing vessels calling at Dutch ports. Both the values
of the Statistics Netherlands and Lloyds were considered reliable, but a
linear relationship between the number of ships on the NCP and the
number of ships calling at Dutch ports is not assured.
There are no systematic monitoring data available on the trends in the
application of the various coating types on ships; estimates were made
based on a range of recent references.
Information on the number of vessels on the NCP and their wet surface
area is only known for the year 2004, and this data comes from the
Lloyds database. So as to still be able to present values for the years
1990 through 2002, a constant average surface (that for the year
2000) per ship was assumed.
Both the values of the Statistics Netherlands and Lloyds were
considered reliable, but whether the data on the ships on the NCP can
be directly projected onto the ships in port is uncertain.
8.1 Most significant areas for improvement
Simply based on the above, the most significant areas for improvement
can be identified as follows (in order of importance):
- In a subsequent year, a study can be set up to establish trends in the
use of the various different types of coating over time
- It would be worthwhile to catalogue the application of the various
co-biocides in more detail, particularly the application of diuron and
irgarol, which are substances that sometimes cause exceeding of
environmental threshold limit values;
- Comparing the results of calculations based on multiple traffic and
transport databases can provide a better picture of the development
of the wet surface area on the NCP
- The wet surface area need to be recalculated, not only to be
increased for the increase in number of ships.

9–1 Coatings, Shipping & Fisheries
9 Spatial allocation
. . . . . . . . . . . . . . . . . . . . . . . . . . . . . . . . . . . . . . . . . . . . . . . . . . . . . . . . . . . . . . . . . . . . . . . . . . . . . . .
9.1 Seagoing vessels and fishing vessels on NCP
The emissions per 5x5 km map square are determined using the wet
surface area (WSA) calculated per vessel type by MARIN using the
Lloyds traffic and transport database for the year 2004.
The traffic types this includes are:
- Route-specific shipping transport
- Ships at anchor
- Fishing vessels
- Work ships
For every ship sailing on the Dutch portion of the continental shelf, the
maximum wet surface area is calculated using the vessel dimensions
known from the Lloyds ship register. Where possible, this calculation
was based on the Mennen-Holtrop equation (equation 1); where this
was not possible due to the lack of data, calculation was based on the
derived method for determining WSA based on ship size in GT
(equation 2). The actual wet surface area was obtained after correction
for actual cargo using equation 3. MARIN then applied this data to the
traffic and transport database after first averaging across the SAMSON
vessel types and SAMSON vessel size classes. Next, a determination of
the location of each kilometre square (in which water body defined in
the Water Framework Directive the square is situated) was made. The
emissions were then calculated for each Water Framework Directive
water body.

9–2 Coatings, Shipping & Fisheries
Figures 7 through 11 below show the wet surface area of the four
types of shipping traffic in spatial terms.
. . . . . . . . . . . . . . . . . . . . . . . . . . . . . . . Figure 7 Distribution of the total wet surface area of ships on the Dutch section of the continental shelf.
. . . . . . . . . . . . . . . . . . . . . . . . . . . . . . .
. . . . Figure 9 Distribution of the wet surface area of ships at anchor on the Dutch section of the continental shelf.
. . . . . . . . . . . . . . . . . . . . . . . . . . . . . . .
. . . . Figure 8 Distribution of the wet surface area of route-specific ships on the Dutch section of the continental shelf.
. . . . . . . . . . . . . . . . . . . . .
. . . . . Figure 11 Distribution of the total wet surface area of work ships on the Dutch section of the continental shelf.
. . . . . . . . . . . . . . . . . . . . Figure 10 Distribution of the total wet surface area of fishing vessels on the Dutch section of the continental shelf.

9–3 Coatings, Shipping & Fisheries
9.2 Seagoing vessels in Dutch territory
Spatial allocation of the shipping emissions calculated was performed
based on the data on seagoing vessels calling at the major seaports.
In this calculation, a distinction is made by vessel type and the phase
the ship is in: sailing in, manoeuvring and in port. All basic data are
drawn from the EMS models for the calculation of atmospheric
emissions. The activity rates from the atmosphere module are expressed
for these phases in GT-km for sailing in, GT-hours for manoeuvring and
GT for in port. These quantities are assigned per port and per phase to
shipping lane segments from the database “Nationaal Wegenbestand”
(NWB, a publication of the Traffic and Transport Advisory Service, an
agency of the Ministry of Public Works & Water Management). The
activities are assigned to each port in proportion to the length of the
shipping lane segments traversed.
For each phase that the vessels sail in Dutch territory, a different
formula is used for the calculation of the average wet surface area
(WSA) present.
The formula for conversion of ships in port is:
GT * WSA/GT * Time in port / 8760
The GT of ships in port is derived from the file supplied by AVV for the
calculation of atmospheric emissions.
The formula for conversion of ships at sail is:
GT-km / Speed * WSA/GT / 8760
The GT-km of sailing ships is calculated using the model with which the
atmospheric emissions of sailing ships are calculated.
The formula for conversion of manoeuvring ships is:
GT-hours * WSA/GT / 8760
The GT-hours of manoeuvring ships is calculated using the model with
which the atmospheric emissions of manoeuvring ships are calculated.
Table 31 shows the factors used for conversion from GT to WSA.
Vessel type WSA/GT
(m2/GT)
Time in
port
(hours)
Speed
(km/hour)
Oil Tankers (Crude) 0.23 28 17.3
Other Tankers (Juice,
Chemical)
0.43 24
19.2
Bulk carriers 0.24 52 20
Container Ships 0.25 21 20.2
Conv. General Cargo 0.54 25 20.2
Ferries/Ro-ro 0.18 24 23.1
Reefers 0.51 31 24.8
Other Ships 0.5 46 26.3
. . . . . . . . . . . . . . . . . . . . . . . . . . . . . . . Table 31 Conversion factors for ships in port, manoeuvring and at sail, by wet surface
9–4 Coatings, Shipping & Fisheries
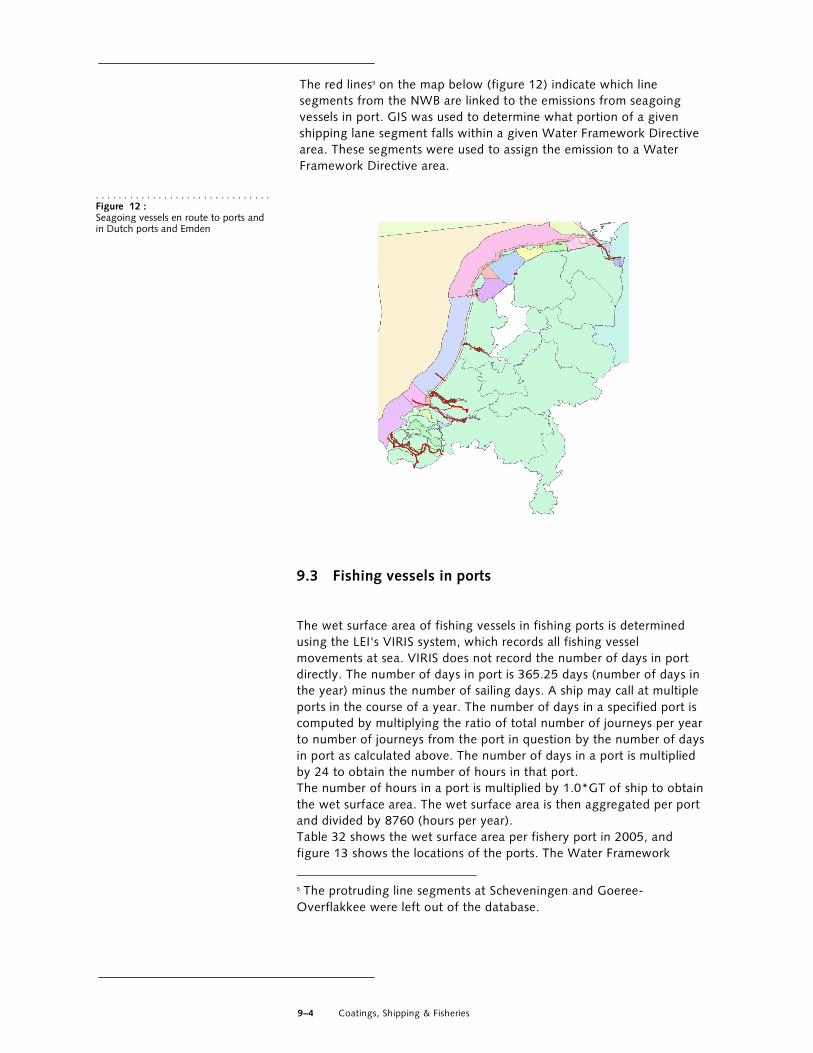
The red lines5 on the map below (figure 12) indicate which line
segments from the NWB are linked to the emissions from seagoing
vessels in port. GIS was used to determine what portion of a given
shipping lane segment falls within a given Water Framework Directive
area. These segments were used to assign the emission to a Water
Framework Directive area.
9.3 Fishing vessels in ports
The wet surface area of fishing vessels in fishing ports is determined
using the LEI's VIRIS system, which records all fishing vessel
movements at sea. VIRIS does not record the number of days in port
directly. The number of days in port is 365.25 days (number of days in
the year) minus the number of sailing days. A ship may call at multiple
ports in the course of a year. The number of days in a specified port is
computed by multiplying the ratio of total number of journeys per year
to number of journeys from the port in question by the number of days
in port as calculated above. The number of days in a port is multiplied
by 24 to obtain the number of hours in that port.
The number of hours in a port is multiplied by 1.0*GT of ship to obtain
the wet surface area. The wet surface area is then aggregated per port
and divided by 8760 (hours per year).
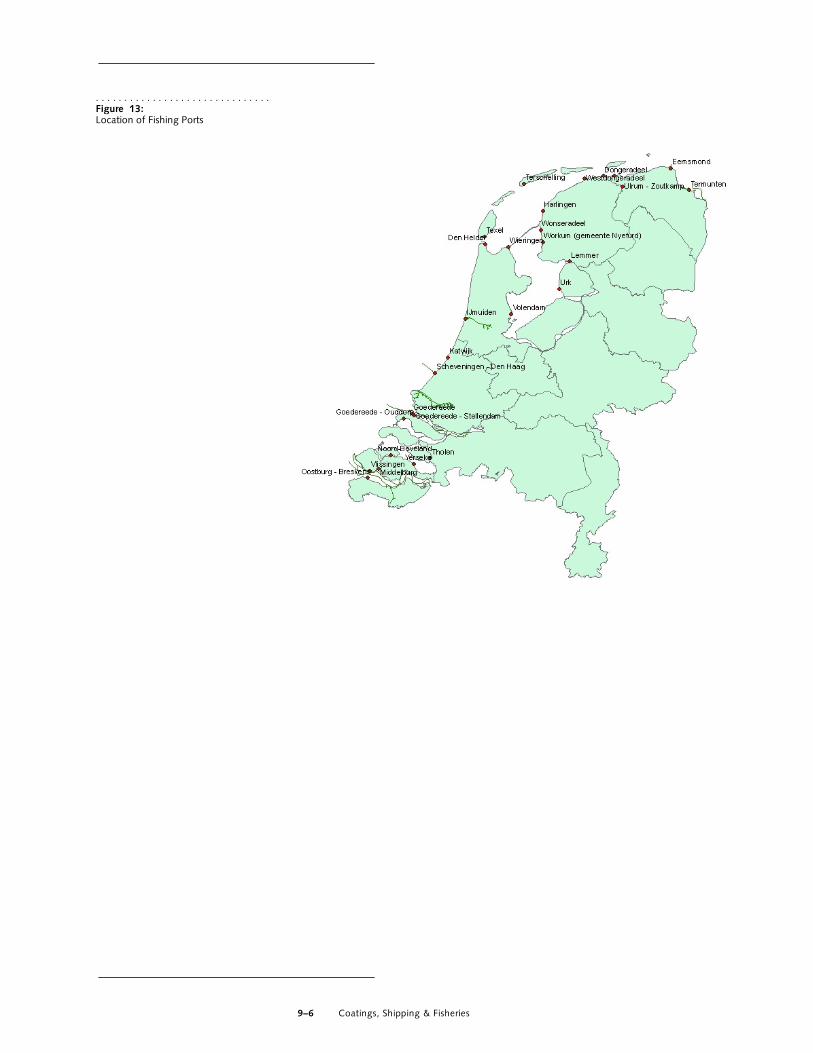
Table 32 shows the wet surface area per fishery port in 2005, and
figure 13 shows the locations of the ports. The Water Framework
5 The protruding line segments at Scheveningen and Goeree-
Overflakkee were left out of the database.
. . . . . . . . . . . . . . . . . . . . . . . . . . . . . . . Figure 12 : Seagoing vessels en route to ports and in Dutch ports and Emden

9–5 Coatings, Shipping & Fisheries
Directive area of each port is known. Not all ports are located in Water
Framework Directive areas that are classified as saline.
Port WSA6
Oostburg - Breskens 952
Schouwen Duiveland 51
Delfzijl 1770
Harlingen 19569
Den Helder 9199
Hemelumer-Oldeferd (municipality of
Nyefurd)
20
IJmuiden 52300
Katwijk 3
Ulrum - Lauwersoog 5559
Terneuzen 19
Scheveningen - The Hague 14577
Goedereede - Stellendam 6369
Stavoren (municipality of Nyefurd) 98
Terschelling 158
Texel 4320
Urk 253
Vlissingen 10309
Wonseradeel 116
Wieringen 2522
Yerseke 385
Zierikzee 10
128559
6 Corrected for calls of foreign fishing vessels.
. . . . . . . . . . . . . . . . . . . . . . . . . . . . . . . Table 32 Average wet surface of fishing vessels present in fishing ports in 2005
9–6 Coatings, Shipping & Fisheries
. . . . . . . . . . . . . . . . . . . . . . . . . . . . . . . Figure 13: Location of Fishing Ports

10–1 Coatings, Shipping & Fisheries
10 References
. . . . . . . . . . . . . . . . . . . . . . . . . . . . . . . . . . . . . . . . . . . . . . . . . . . . . . . . . . . . . . . . . . . . . . . . . . . . . . .
Berg, E.A. (1995). Measuring copper release from antifouling paints. Eur. Coat. J., 7-8/95, p. 534-538.
Centraal Bureau voor de Statistiek. (2003) Elektronische database Statline. Internetapplicatie.
Ciba (1995) Summary on ecological and health effects of Irgarol 1051, Information Brochure Ciba Geigy, Basel
CPB, MNP, RPB (2006), Welvaart en leefomgeving, een scenariodocument voor Nederland in 2040, Centraal Planbureau,
Milieu- en Natuurplanbureau en Ruimtelijk Planbureau, ISBN-13: 978-
90-6960-149-6
Finnie A.A. (2006) Improved estimates of environmental copper release
rates from antifouling products. Biofouling 22(5): pp. 279-291.
Fisher A.S., Hill S.J., Waldock M., Thomas K.V. (1997) Health and
Safety Executive Contract Report 3283/R51.82, Cited in Thomas et al.
(1999)
Glansdorp, C.C., Tak, C. van der. (1993) Modellering van de functie "scheepvaart"in het MANS-project. MARIN&MSCN.
Greenpeace (2000), Persbericht 28 September 2000,
Hare, C.H. (1993). Anatomy of paint - antifouling coatings. J. Protective coatings and linings, Vol. 10, 83-90.
Harmelen, A.K. van et al. (2001) Emissiemonitor, jaarcijfers 1999 en ramingen 2000 voor emissies en afval. Rapportage reeks milieumonitor
nr. 2.
Hattum, B. van, Baart, A.C., Boon, J.G. (2002) Computer model to generate predicted environmental concentrations (PECs) for antifouling in the marine environment, 2nd edition accompanying the release of Mam-Pec version 1.4. rapportnr. E-02-04 / Z3117. IVM, Amsterdam WL, Delft.
Holtrop J., A (1977) Statistical Analysis of Performance Test Results. International Shipbuilding Progress, 1977, Vol 24, No. 270.
Johnson A., Luttik R. (1994) Risk assessment of antifoulants - position
paper. Paper nr. 1994-05-03 presented at the 7th meeting of the Ad Hoc Group of Experts of Non-Agricultural Pesticides, 16-18 May 1994.
10–2 Coatings, Shipping & Fisheries
National Chemicals Inspectorate, Sweden, National Institute for Public
Health and the Environment, Netherlands.
Kill S., Dam Johansen K., Weinell C.E., Pedersen M.S., Codolar S.A.
(2002) Dynamic simulations of a self-polishing antifouling paint
exposed to seawater, J. Coatings Technology, 74( 929), pp. 45-54
Kiil S. ; Dam-Johansen K. ; Weinell C.E.; Pedersen M. S.; Codolar S. A.
(2003):
Estimation of Polishing and Leaching Behaviour of Antifouling Paints
Using Mathematical Modelling: a Literature Review, Biofouling, vol: 19, pages: 37-43, 2003
Koivisto, S. (2003), Proposal for Finnish exposure scenarios for antifouling products, Finnish Environment Institute, 2003
Lindgren P., Olsson B., Unger C., (1998). Antifoulingsprodukter FARTYG PM-beslut 1998-10-20, KEMI, Stockholm (in Swedish)
Maersk (2006). Maersk brochure: “Constant care for the environment”, http://www.maerskline.com/globalfile/?path=/pdf/environmental_broc
hure
Man-Diesel (2002) Basic principles of ship propulsion, Man-Diesel
document P-254-04-04; http://www.manbw.com/article_003859.html
Meijerink, J. (2003a) EMS-protocol Emissies door Zeevaart en Visserij, Coatings op schepen op het NCP. RIZA-werkdocument nr. 2003.153X.
Meijerink, J (2003b), EMS-protocol Emissies door Zeevaart en Visserij, Coatings op schepen in havens. RIZA-werkdocument nr. 2003.153X.
Morrison, S. (2005). Technology update: antifouling coatings. Background article on www.specialchem4coatings.com.
O&C (2000). Convenant beëindiging gebruik tinhoudende
aangroeiwerende verven op visserijvaartuigen d.d. 14 december 2000,
Oppervlaktebehandeling en Corrosiebestrijding, jaargang 44, 200 nr. 4.
OECD (2005) Emission scenario document on antifouling products, OECD Environmental Health and Safety Publications Series on Emission
Scenario Documents No. 13, Environment Directorate Organisation for
Economic Co-operation and Development, Paris, France
Okamura, H., H. Mieno (2006). Present status of antifouling systems in
Japan. In: Konstantinou, I.K. (Ed.). Antifouling Paint Biocides. Handbook of Environmental Chemistry Vol. 5/O, Springer Verlag,
Berlin (Germany). P. 201-212
10–3 Coatings, Shipping & Fisheries
OSPAR (1992). Zinc inputs to the environment from sacrificial anodes used offshore and inland.
Readman (2006). Development, occurence and regulation of
antifouling paint biocides: historical review and future trends. In:
Konstantinou, I.K. (Ed.). Antifouling Paint Biocides. Handbook of Environmental Chemistry, Vol. 5/O, Springer Verlag, Berlin (Germany).
P. 1-16
Roovaart, J.C. van den. (2002) Uitloging zeeschepen in havens. RIZA-
werkdocument nr. 2001.088X, volgnr. 3.
Scarlett A. Donkin M.E. Fileman T.W. and Donkin P. (1997)
Occurrence of the marine antifouling agent Irgarol 1051 within the
Plymouth Sound locality: implications for the green macroalga
Enteromorpha intestinalis., Mar. Pollut. Bull. 34: 645
Stronkhorst J. (1996) TBT Contamination and toxicity of sediments: a
persistent problem. In: Stewen U (ed.). The present status of TBT-copolymer antifouling paints. Proceeding of an International One Day Symposium on antifouling paints for ocean-going vessels, 21st Febr.
1996, The Hague. Ministry of Transport, Public Works and Water
Management, Rijkswaterstaat, DGSM; ORTEP, Association, The Hague
Tak, K van der (2006), personal communication, MARIN, Wageningen.
Thomas K.V., Raymond K., Chadwick J., Waldock M. (1999) The
effects of short-term changes in environmental parameters on the
release of biocides from antifouling coatings: cuprous oxide and
tributyltin, Appl. Organomet. Chem., 13, pp. 453-460
Thomas K.V. (2001) The environmental fate and behaviour of
antifouling paint booster biocides: a review, Biofouling, 17, pp. 73-86 Valkirs A.O., Seligman P.F., Haslbeck E., Caso J.S. (2003) Measurement of copper release rates from antifouling paint under laboratory and in-situ conditions: implications for loading estimates to marine water bodes, Marine Pollution Bulletin, 46, 2003, pp. 763-779).
Willemsen P.R., Ferrari, G.M. (1992) Emissies van organotin naar Nederlandse oppervlaktewateren. TNO-rapport, rapportnr. C 92.1003.
Willingham G.L., Jacobson A.H. (1996) Designing an environmentally
safe marine antifoulant. In: De Vito, S.C and R.L. Garrett (eds).
Designing safer chemicals - Green chemistry for pollutant prevention. American Chemical Society, Washington DC. ACS Symposium Series
640, p. 225-233.
Wulffraat, K.J. et al (1993). De belasting van de Noordzee met verontreinigende stoffen 1980 – 1990. Rapport DGW 93-037.

10–4 Coatings, Shipping & Fisheries
Yebra D.M., Kiil S., Dam-Johansen K. (2004) Antifouling technology –
past, present and future steps towards efficient and environment
friendly antifouling coatings, Prog. Org. Coatings, 50, pp. 75-104
Yebra D.M., Kiil S., Weinell C.E., Dam-Johansen K. (2006a) Effects of
marine microbial biofilms on the biocide release rate from antifouling
paints – a model based analysis, Prog. Org. Coatings, 57, pp. 56-66
Yebra D.M., Kiil S., Dam-Johansen K. (2006b) Mathematical modelling
of tin-free chemically active antifouling paint behaviour, AIChE J., 52, 5: pp. 1926-1940.