fact sheet air pollution from vehicles in california · pollution is of particular concern in...
TRANSCRIPT

Transportation constitutes a significant source of both global warming emis-sions and air pollution in California. This analysis from the Union of Concerned Scientists (UCS) quantifies the formation of particulate matter (PM) air pollution from on-road vehicles and identifies the locations and populations most at risk regarding this pollution. The analysis measures the annual average concentration of particulate matter using a 2014 estimate of emissions as input data (EPA 2014). Research links exposure to particulate matter smaller than 2.5 micrometers in diameter (PM2.5)—20 times smaller than even fine human hair—to increased ill-ness and death, primarily from heart and lung diseases. These particles are small enough to penetrate deeply into the lungs, and the smallest particles can even enter into the bloodstream. The use of cars, trucks, and buses in California both directly produces PM2.5 and also produces gases that lead to the formation of additional PM2.5.
This analysis of particulate matter from cars, trucks, and buses in California finds the following:
• On average, African American, Latino, and Asian Californians are exposed to more PM2.5 pollution from cars, trucks, and buses than white Californians. These groups are exposed to PM2.5 pollution 43, 39, and 21 percent higher, respectively, than white Californians.
• Exposure to PM2.5 from cars, trucks, and buses is not equally distributed across the state (Figure 1, p. 2). People living in Los Angeles County are exposed to 60 percent more vehicle pollution than the state average and 250 percent more than the San Francisco Bay Area.
FACT SHEET
Who Bears the Burden?HIGHLIGHTS
This analysis explores the significant
contributions of cars, trucks, and buses
to particulate matter air pollution in
California and the disproportionate
effects on communities of color and low-
income communities. Advancing clean
transportation policies—such as those
that encourage vehicle electrification,
cleaner fuels, and reduced driving—will
help reduce air pollution emissions.
Additionally, policies and investments
should be evaluated for their ability to
reduce the current inequities in exposure to
vehicular air pollution borne by low-income
Californians and communities of color. This
report helps to inform such strategies.
Inequitable Exposure to Air Pollution from Vehicles in California
trekandshoot/iStockphoto
Millions of California residents live near major highways (such as Highway 110 in Los Angeles County, shown here) and are exposed to high levels of vehicular air pollution. African American and Latino Californians are disproportionately exposed to more of this pollution, as are low-income households.

2 union of concerned scientists
FIGURE 1. Disproportionately High Exposure for African Americans and Latinos in California
African American and Latino Californians have 19 and 15 percent higher exposure to PM2.5, respectively, than the state average, while white Californians are exposed to 17 percent lower concentrations.Note: The following US Census Bureau–defined racial groups were used in the analysis: White; Black or African American; American Indian or Alaska Native; Asian; Native Hawaiian or Other Pacific Islander; Hispanic; Latino; and Some Other Race. In the chart above, Latino includes census respondents who select Hispanic, Latino, or both; Other Race includes census respondents who select Some Other Race as their only race.
SOURCES: US CENSUS BUREAU 2018; EPA 2014.
20%
10%
0
-10%
-20%
-30%
Pop
ulat
ion-
Wei
ghte
d P
M2.
5 Exp
osur
e (r
elat
ive
to s
tate
ave
rage
)
Multiracial WhiteAfrican American
Latino AsianOther Race
Pacific Islander
Native American
and construction dust. However, much of the PM2.5 forms indirectly through the reactions of pollutant gases in the atmosphere (Fine, Sioutas, and Solomon 2008). These gases include ammonium, nitrogen oxides, sulfur oxides, and vola-tile organic compounds. Most of these pollutants are emitted in vehicle exhaust, though volatile organic compounds also come from the evaporation of gasoline during refueling and from leaks in vehicles’ fuel tanks and lines.
Exposure to PM2.5 has significant negative health impacts; it has been estimated that fine particulate air pol-lution is responsible for the vast majority of the 3 million to 4 million annual deaths attributed to air pollution worldwide. While PM2.5 is not the only air pollutant that adversely affects health, it is estimated to be responsible for approximately 95 percent of the global public health impacts from air pollu-tion (Landrigan et al. 2018; Lelieveld et al. 2015). Both acute and chronic exposure to PM2.5 have been linked to illness and death (Brook et al. 2010). Short-term exposure to elevated levels of PM2.5 can exacerbate lung and heart ailments, cause asthma attacks, and lead to both increased hospitalizations and mortality from cardiovascular diseases (Orellano et al. 2017; Pope and Dockery 2006). Chronic exposure to PM2.5 also causes increased death rates attributed to cardiovascular diseases, including heart attacks, and has been linked to other adverse impacts such as lung cancer (Fine, Sioutas, and
• The lowest-income households in the state live where PM2.5 pollution is 10 percent higher than the state aver-age, while those with the highest incomes live where PM2.5 pollution is 13 percent below the state average.
• Californians living in households without a personal vehicle are also exposed to much higher levels of vehicle pollution than other households because they tend to live in urban areas surrounded by vehicle traffic.
Cleaner technologies are now available to replace gasoline, diesel, and other combustion-powered1 vehicles, making some of these local transportation emissions avoidable. By supporting strategies such as cleaner fuels, the reduction of miles driven, and the electrification of vehicles—and by targeting clean technology deployment to benefit the most af-fected communities—both air pollution and carbon emissions that cause climate change can be reduced, while addressing the inequity of PM2.5 exposure.
Why Is Particulate Matter Air Pollution a Problem?
Some PM2.5 pollution forms directly during combustion, from sources such as fires, power plant emissions, and vehicle exhaust. Additional PM2.5 comes from sources such as road
3Inequitable Exposure to Air Pollution from Vehicles in California
combined that information with population and demographic data to understand how exposure to PM2.5 varies among groups and locations.
The human health impacts from PM2.5 pollution depend not only on the concentration of pollution but also on the number of people exposed. Elevated PM2.5 levels in densely populated regions of the state will have a greater public health impact than the same pollution concentration in un-populated areas. Therefore, to compare PM2.5 levels between regions of the state (and between demographic groups), we used population-weighted PM2.5 concentrations. For example, to determine the average exposure for a resident of a par-ticular county, we multiplied the concentration in a census tract by the population in the tract. We then divided the sum of these values for the county by the county population to determine the average exposure for a resident of the county. We used a similar process to find the average exposure for demographic groups within the state.
Other types of transportation—such as airplanes, marine vessels, and trains—are not included in these estimates, and their emissions would add to the exposures shown in this work. Operations at freight facilities and ports are also ex-cluded from the PM2.5 concentration and exposure modeling. These other transportation and freight emissions can cause significant health impacts—especially for those who live closest to these facilities—leading to known environmental justice concerns (Hricko 2008). The contributions of on-road vehicles to local PM2.5 exposure—and related issues of envi-ronmental justice—are less well known and yet affect many Californians.
PM2.5 Exposure from Cars, Trucks, and Buses Causes Significant Health Impacts
Based on the location of the particulate matter air pollution and the total population exposed, research estimates that PM2.5 from on-road transportation leads to approximately 3,100 premature deaths per year in California due to cardio-vascular disease, heart attacks, and other illnesses (Tessum, Hill, and Marshall 2014; Krewski et al. 2009). For comparison, in 2017, 1,829 homicides were reported in the state, or about 40 percent less than the estimated deaths due to PM2.5 pol-lution from cars and trucks (Bulwa 2018). The number of pollution-related deaths is only slightly lower than the 3,600 traffic fatalities reported statewide in 2016 (CAOTS 2017). Given the projected increase in death rate, this pollution has an annual cost of $29 billion, based on the US Environmental Protection Agency’s estimate of the value of risks to human life (EPA 2018).
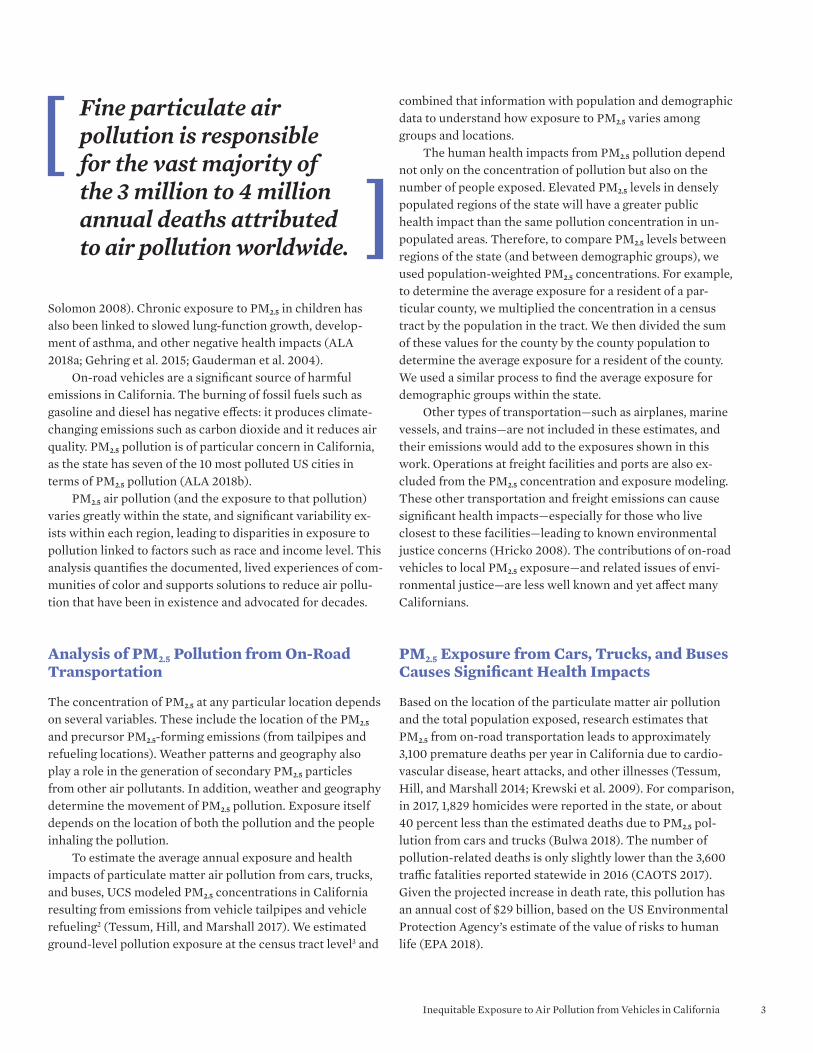
Solomon 2008). Chronic exposure to PM2.5 in children has also been linked to slowed lung-function growth, develop-ment of asthma, and other negative health impacts (ALA 2018a; Gehring et al. 2015; Gauderman et al. 2004).
On-road vehicles are a significant source of harmful emissions in California. The burning of fossil fuels such as gasoline and diesel has negative effects: it produces climate-changing emissions such as carbon dioxide and it reduces air quality. PM2.5 pollution is of particular concern in California, as the state has seven of the 10 most polluted US cities in terms of PM2.5 pollution (ALA 2018b).
PM2.5 air pollution (and the exposure to that pollution) varies greatly within the state, and significant variability ex-ists within each region, leading to disparities in exposure to pollution linked to factors such as race and income level. This analysis quantifies the documented, lived experiences of com-munities of color and supports solutions to reduce air pollu-tion that have been in existence and advocated for decades.
Analysis of PM2.5 Pollution from On-Road Transportation
The concentration of PM2.5 at any particular location depends on several variables. These include the location of the PM2.5 and precursor PM2.5-forming emissions (from tailpipes and refueling locations). Weather patterns and geography also play a role in the generation of secondary PM2.5 particles from other air pollutants. In addition, weather and geography determine the movement of PM2.5 pollution. Exposure itself depends on the location of both the pollution and the people inhaling the pollution.
To estimate the average annual exposure and health impacts of particulate matter air pollution from cars, trucks, and buses, UCS modeled PM2.5 concentrations in California resulting from emissions from vehicle tailpipes and vehicle refueling2 (Tessum, Hill, and Marshall 2017). We estimated ground-level pollution exposure at the census tract level3 and
Fine particulate air pollution is responsible for the vast majority of the 3 million to 4 million annual deaths attributed to air pollution worldwide.
4 union of concerned scientists
Greater PM2.5 Pollution for Latinos and African Americans, Low-Income Households
The PM2.5 pollution burden from cars, trucks, and buses is inequitably distributed among racial groups in California (Figure 1). Latino community members are, on average, exposed to 15 percent higher PM2.5 concentrations than the average Californian, and African Americans in California experience concentrations 18 percent higher than the average Californian. White Californians have average exposure that is 17 percent lower than the mean for the state. Thus, African Americans in California are, on average, burdened with PM2.5 pollution 43 percent higher than that affecting white com-munity members.
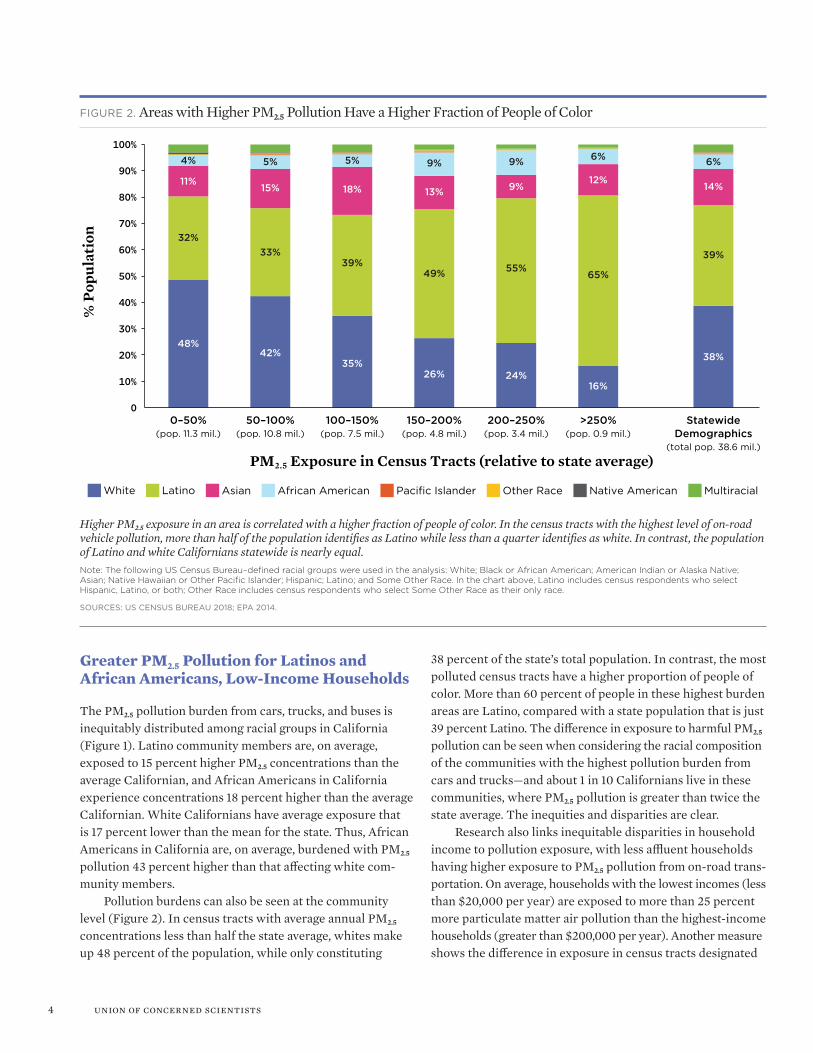
Pollution burdens can also be seen at the community level (Figure 2). In census tracts with average annual PM2.5 concentrations less than half the state average, whites make up 48 percent of the population, while only constituting
38 percent of the state’s total population. In contrast, the most polluted census tracts have a higher proportion of people of color. More than 60 percent of people in these highest burden areas are Latino, compared with a state population that is just 39 percent Latino. The difference in exposure to harmful PM2.5 pollution can be seen when considering the racial composition of the communities with the highest pollution burden from cars and trucks—and about 1 in 10 Californians live in these communities, where PM2.5 pollution is greater than twice the state average. The inequities and disparities are clear.
Research also links inequitable disparities in household income to pollution exposure, with less affluent households having higher exposure to PM2.5 pollution from on-road trans-portation. On average, households with the lowest incomes (less than $20,000 per year) are exposed to more than 25 percent more particulate matter air pollution than the highest-income households (greater than $200,000 per year). Another measure shows the difference in exposure in census tracts designated
FIGURE 2. Areas with Higher PM2.5 Pollution Have a Higher Fraction of People of Color
Higher PM2.5 exposure in an area is correlated with a higher fraction of people of color. In the census tracts with the highest level of on-road vehicle pollution, more than half of the population identifies as Latino while less than a quarter identifies as white. In contrast, the population of Latino and white Californians statewide is nearly equal.Note: The following US Census Bureau–defined racial groups were used in the analysis: White; Black or African American; American Indian or Alaska Native; Asian; Native Hawaiian or Other Pacific Islander; Hispanic; Latino; and Some Other Race. In the chart above, Latino includes census respondents who select Hispanic, Latino, or both; Other Race includes census respondents who select Some Other Race as their only race.
SOURCES: US CENSUS BUREAU 2018; EPA 2014.
48%
11%
42%
15%
35%
18%
26%
13%
24%
9%
16%
12%
38%
14%
100%
90%
80%
70%
60%
50%
40%
30%
20%
10%
0
% P
opul
atio
n
PM2.5 Exposure in Census Tracts (relative to state average)
0–50%(pop. 11.3 mil.)
50–100%(pop. 10.8 mil.)
100–150%(pop. 7.5 mil.)
150–200%(pop. 4.8 mil.)
200–250%(pop. 3.4 mil.)
>250%(pop. 0.9 mil.)
Statewide Demographics
(total pop. 38.6 mil.)
Asian African American Pacific Islander Other Race Native American MultiracialWhite Latino
32%
4%
33%
5%
39%
5%
49%
9%
55%
9%
65%
6%
39%
6%

5Inequitable Exposure to Air Pollution from Vehicles in California
as “low-income qualified”4 by the US Department of Housing and Urban Development (HUD). In HUD-designated low-income areas, average PM2.5 pollution levels from on-road vehicles were 32 percent higher than outside these areas.
Those without Cars Experience Higher Amounts of PM2.5 Pollution
Another group that, on average, is exposed to higher amounts of particulate matter air pollution includes those in house-holds without a car. People in this category face exposure to pollution levels 19 percent above the state average. Many of these households are located in urban areas of the state with higher population densities, where car, truck and bus pollu-tion is more concentrated.
California has proposed strategies to reduce air pollution and climate-changing emissions from personal transporta-tion. These include efforts to reduce personal car driving, as
PM2.5 from On-Road Vehicles, Average Annual Concentration (µg/m )Major Highway
Oakland
San Jose
Modesto
Sacramento
Miles20 40100
Los Angeles
San Diego
San Bernardino
Bakersfield
30Miles
60150
well as land use policies such as transit-oriented development and the addition of high-density housing in existing urban ar-eas (CARB 2017). These strategies could increase the number of people who live in high-density urban housing and have greater access to alternative modes of travel, such as public transit, walking, or biking. It will be important to institute the complementary policies envisioned in California’s strategy (see p. 7), such as vehicle electrification, to reduce air pollu-tion from transportation and avoid increasing the number of people exposed to elevated levels of PM2.5.
Particulate Pollution from On-Road Vehicles Is Highest in Southern California
Los Angeles County ranks highest in average PM2.5 concentra-tion from on-road vehicles; however, the individual census tracts with the highest PM2.5 concentrations in the state are in the city of Bakersfield (Kern County) (Figure 3). Importantly,
FIGURE 3. PM2.5 Pollution Concentrations from On-Road Vehicles
Higher levels of fine particulate matter air pollution are found in pockets of southern California (left) and the Bay Area (right). Northern California’s air pollution is less concentrated than Southern California’s metropolitan areas.SOURCES: US CENSUS BUREAU 2018; EPA 2014.

6 union of concerned scientists
we note that the precision of the air quality model output for this analysis is one square kilometer. This is sufficient to see pollution differences within a city. However, specific loca-tions, such as busy intersections or shipping facilities, would not be distinguishable at this resolution, and hyperlocal PM2.5 concentrations could be higher than shown in this analysis.
PM2.5 Exposure from Cars and Trucks Varies Greatly within California
As noted earlier, Los Angeles County has the highest average PM2.5 pollution exposure from cars and trucks in the state: on average, 60 percent higher than the mean value for the state (Figure 4). One quarter of the population in Los Angeles
County experiences pollution levels that are more than double the state average. And because Los Angeles County is the most populous in the state, this higher level of pollution affects millions of people. Only six counties have an average exposure from on-road transportation that is greater than the state average, but four of them (Los Angeles, Orange, San Bernardino, and San Diego) are in the top five most populous counties in California, with a combined population of almost 19 million people.
Other areas, such as the San Francisco Bay Area, have zones of higher pollution but have much lower average expo-sure to vehicle-related particulate pollution compared with the state average. The worst regions of the Bay Area (such as downtown Oakland and San Jose) have annual average PM2.5 concentrations equal to the average across Los Angeles County.
FIGURE 4. California Counties with Highest Population-Weighted PM2.5 Exposure
Six counties, which are among the most populated counties in the state, have PM2.5 exposure levels above the state average. SOURCES: US CENSUS BUREAU 2018; EPA 2014.
Los Angeles
San Bernardino
Orange
San Diego
Fresno
Kern
Tulare
Riverside
Stanislaus
Sacramento
Alameda
Santa Clara
Placer
Madera
San Francisco
Cal
ifor
nia
Cou
nty
Population-Weighted PM2.5 Exposure (relative to state average)180%160%140%120%100%80%60%40%20%0%

7Inequitable Exposure to Air Pollution from Vehicles in California
It is important to note that these results are for a specific subset of pollution sources (on-road vehicles) and for one class of air pollutants (PM2.5). Therefore, these results do not indicate total impacts of air pollution in a region or for a demographic group. For example, while San Diego has higher predicted PM2.5 concentrations from on-road vehicles than does Fresno County, the overall air pollution in Fresno is of-ten worse than that in the San Diego region. The San Joaquin Valley (where Fresno is located) is noncompliant with federal PM2.5 air quality standards, while San Diego is currently within the compliance standard for PM2.5 air pollution. The difference between the two regions is caused by other sources of particulate matter air pollution from agriculture, the environment, and stationary sources such as factories, power plants, and refineries. Off-road transportation sources, such as trains and aviation, also cause additional PM2.5 burdens.
Opportunities to Reduce Harmful Impacts of Vehicle Use
Particulate matter air pollution from on-road transportation such as diesel and gasoline vehicles places significant health burdens on Californians, and those burdens are inequitably distributed. However, there are opportunities to greatly re-duce the exposure to PM2.5 by reducing tailpipe and refueling emissions, making these burdens avoidable.
Electrification of vehicles, both passenger and freight, could greatly reduce emissions. Battery-electric and fuel cell vehicles in particular have no tailpipe emissions (however, there are minor amounts of PM2.5 emissions from tire and brake wear) and completely avoid the need for, and emissions associated with, gasoline refueling. Electricity generation and hydrogen production can produce emissions; however, Cali-fornia has renewable content standards for both hydrogen for transportation and electricity that will limit additional emis-sions (Wisland 2018; California State Senate 2006).
More efficient and lower-emissions conventional vehicles are also important for reducing air pollution. Gasoline vehi-cles with higher fuel economy need less refueling, potentially
reducing the amount of volatile organic compounds evapo-rating during refueling and from spillage. And fuel-saving technologies, such as start-stop systems that reduce idling, can also contribute to reduced tailpipe emissions.
Decreasing the amount of driving, especially in higher population areas, is also a potential strategy to reduce harmful air pollution and improve public health. Land use decisions are important to reducing the need for driving, and policies that encourage use of public transit, walking, or biking in the place of private passenger auto use could reduce PM2.5 generation. This is especially true if the transit options are low-emissions, such as electric rail and buses.
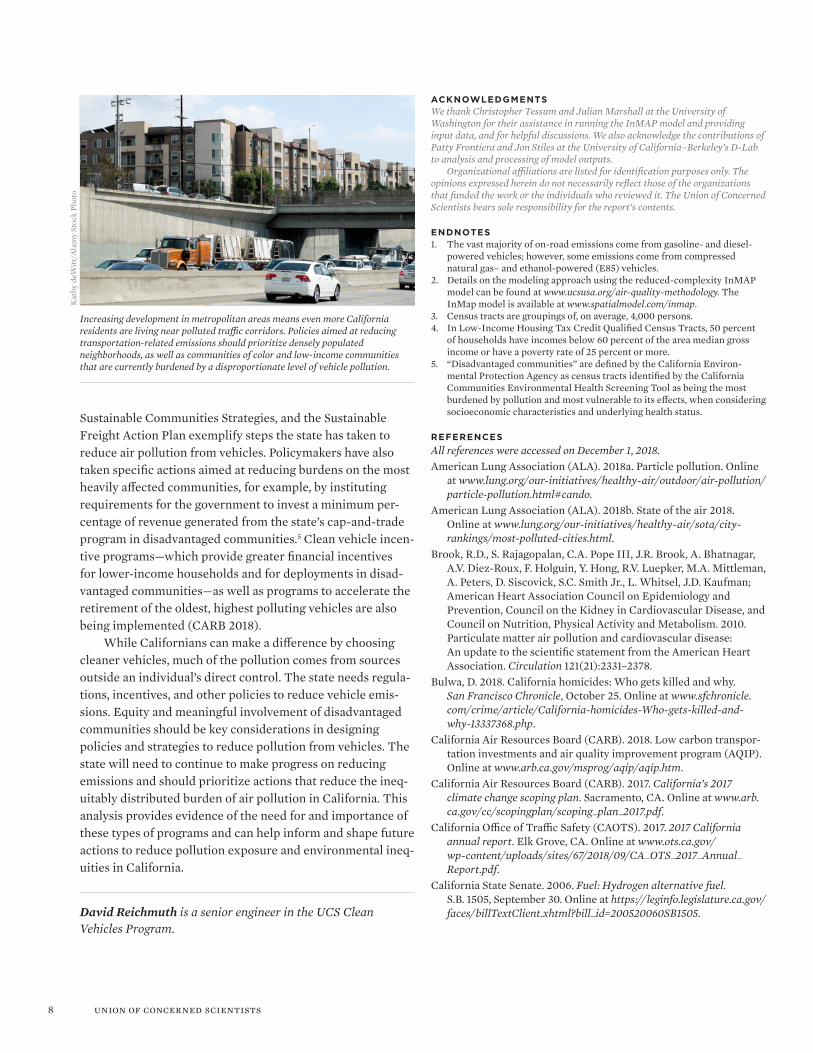
Importantly, state and local governments must take tar-geted actions to reduce emissions in and near densely popu-lated neighborhoods and in the communities of color and low-income communities that are currently burdened with a disproportionate share of pollution from cars and trucks. Existing actions such as California’s Clean Vehicle Rebate Project, low- and zero-emissions vehicle regulations, regional
A growing number of California communities (such as Oakland, served by AC Transit) are adopting fuel-cell and battery electric buses. Because they don’t have tailpipe emissions, electric-drive buses play an important role in reducing transportation-related air pollution in the state and can improve air quality in the communities they serve.
David R
eichmuth/U
CS
Electrifying passenger and freight vehicles could greatly reduce emissions—a critical solution for communities that are currently burdened with a disproportionate share of vehicle pollution.
8 union of concerned scientists
Sustainable Communities Strategies, and the Sustainable Freight Action Plan exemplify steps the state has taken to reduce air pollution from vehicles. Policymakers have also taken specific actions aimed at reducing burdens on the most heavily affected communities, for example, by instituting requirements for the government to invest a minimum per-centage of revenue generated from the state’s cap-and-trade program in disadvantaged communities.5 Clean vehicle incen-tive programs—which provide greater financial incentives for lower-income households and for deployments in disad-vantaged communities—as well as programs to accelerate the retirement of the oldest, highest polluting vehicles are also being implemented (CARB 2018).
While Californians can make a difference by choosing cleaner vehicles, much of the pollution comes from sources outside an individual’s direct control. The state needs regula-tions, incentives, and other policies to reduce vehicle emis-sions. Equity and meaningful involvement of disadvantaged communities should be key considerations in designing policies and strategies to reduce pollution from vehicles. The state will need to continue to make progress on reducing emissions and should prioritize actions that reduce the ineq-uitably distributed burden of air pollution in California. This analysis provides evidence of the need for and importance of these types of programs and can help inform and shape future actions to reduce pollution exposure and environmental ineq-uities in California.
David Reichmuth is a senior engineer in the UCS Clean Vehicles Program.
ACKNOWLEDGMENTSWe thank Christopher Tessum and Julian Marshall at the University of Washington for their assistance in running the InMAP model and providing input data, and for helpful discussions. We also acknowledge the contributions of Patty Frontiera and Jon Stiles at the University of California–Berkeley’s D-Lab to analysis and processing of model outputs. Organizational affiliations are listed for identification purposes only. The opinions expressed herein do not necessarily reflect those of the organizations that funded the work or the individuals who reviewed it. The Union of Concerned Scientists bears sole responsibility for the report’s contents.
ENDNOTES1. The vast majority of on-road emissions come from gasoline- and diesel-
powered vehicles; however, some emissions come from compressed natural gas– and ethanol-powered (E85) vehicles.
2. Details on the modeling approach using the reduced-complexity InMAP model can be found at www.ucsusa.org/air-quality-methodology. The InMap model is available at www.spatialmodel.com/inmap.
3. Census tracts are groupings of, on average, 4,000 persons.4. In Low-Income Housing Tax Credit Qualified Census Tracts, 50 percent
of households have incomes below 60 percent of the area median gross income or have a poverty rate of 25 percent or more.
5. “Disadvantaged communities” are defined by the California Environ-mental Protection Agency as census tracts identified by the California Communities Environmental Health Screening Tool as being the most burdened by pollution and most vulnerable to its effects, when considering socioeconomic characteristics and underlying health status.
REFERENCESAll references were accessed on December 1, 2018.American Lung Association (ALA). 2018a. Particle pollution. Online
at www.lung.org/our-initiatives/healthy-air/outdoor/air-pollution/particle-pollution.html#cando.
American Lung Association (ALA). 2018b. State of the air 2018. Online at www.lung.org/our-initiatives/healthy-air/sota/city-rankings/most-polluted-cities.html.
Brook, R.D., S. Rajagopalan, C.A. Pope III, J.R. Brook, A. Bhatnagar, A.V. Diez-Roux, F. Holguin, Y. Hong, R.V. Luepker, M.A. Mittleman, A. Peters, D. Siscovick, S.C. Smith Jr., L. Whitsel, J.D. Kaufman; American Heart Association Council on Epidemiology and Prevention, Council on the Kidney in Cardiovascular Disease, and Council on Nutrition, Physical Activity and Metabolism. 2010. Particulate matter air pollution and cardiovascular disease: An update to the scientific statement from the American Heart Association. Circulation 121(21):2331–2378.
Bulwa, D. 2018. California homicides: Who gets killed and why. San Francisco Chronicle, October 25. Online at www.sfchronicle.com/ crime/ article/California-homicides-Who-gets-killed-and- why- 13337368.php.
California Air Resources Board (CARB). 2018. Low carbon transpor-tation investments and air quality improvement program (AQIP). Online at www.arb.ca.gov/msprog/aqip/aqip.htm.
California Air Resources Board (CARB). 2017. California’s 2017 climate change scoping plan. Sacramento, CA. Online at www.arb.ca.gov/cc/scopingplan/scoping_plan_2017.pdf.
California Office of Traffic Safety (CAOTS). 2017. 2017 California annual report. Elk Grove, CA. Online at www.ots.ca.gov/wp-content/ uploads/sites/67/2018/09/CA_OTS_2017_Annual_Report.pdf.
California State Senate. 2006. Fuel: Hydrogen alternative fuel. S.B. 1505, September 30. Online at https://leginfo.legislature.ca.gov/ faces/billTextClient.xhtml?bill_id=200520060SB1505.
Increasing development in metropolitan areas means even more California residents are living near polluted traffic corridors. Policies aimed at reducing transportation-related emissions should prioritize densely populated neighborhoods, as well as communities of color and low-income communities that are currently burdened by a disproportionate level of vehicle pollution.
Kat
hy d
eWitt
/Ala
my
Stoc
k Ph
oto
NATIONAL HEADQUARTERS Two Brattle SquareCambridge, MA 02138-3780Phone: (617) 547-5552Fax: (617) 864-9405
WASHINGTON, DC, OFFICE1825 K St. NW, Suite 800Washington, DC 20006-1232Phone: (202) 223-6133Fax: (202) 223-6162
WEST COAST OFFICE500 12th St., Suite 340Oakland, CA 94607-4087Phone: (510) 843-1872Fax: (510) 451-3785
MIDWEST OFFICEOne N. LaSalle St., Suite 1904Chicago, IL 60602-4064Phone: (312) 578-1750Fax: (312) 578-1751
The Union of Concerned Scientists puts rigorous, independent science to work to solve our planet’s most pressing problems. Joining with people across the country, we combine technical analysis and effective advocacy to create innovative, practical solutions for a healthy, safe, and sustainable future.
web: www.ucsusa.org printed on recycled paper using vegetable-based inks © FEBRUARY 2019 union of concerned scientists
find this document online: www.ucsusa.org/CA-air-quality-equity
Fine, P.M., C. Sioutas, and P.A. Solomon. 2008. Secondary particulate matter in the United States: Insights from the Particulate Matter Supersites Program and related studies. Journal of the Air & Waste Management Association 58(2):234–253. doi:10.3155/ 1047- 3289. 58.2.234.
Gauderman, W.J., E. Avol, F. Gilliland, H. Vora, D. Thomas, K. Berhane, R. McConnell, N. Kuenzli, F. Lurmann, E. Rappaport, H. Margolis, D. Bates, and J. Peters. 2004. The effect of air pollution on lung develop-ment from 10 to 18 years of age. The New England Journal of Medicine 351(11):1057–1067. Online at www.nejm.org/doi/full/10.1056/NEJM oa040610.
Gehring, U., A.H. Wijga, G. Hoek, T. Bellander, D. Berdel, I. Brüske, E. Fuertes, O. Gruzieva, J. Heinrich, B. Hoffmann, J.C. de Jongste, C. Klümper, G.H. Koppelman, M. Korek, U. Krämer, D. Maier, E. Melén, G. Pershagen, D.S. Postma, M. Standl, A. von Berg, J.M. Anto, J. Bousquet, T. Keil, H.A. Smit, and B. Brunekreef. 2015. Exposure to air pollution and development of asthma and rhinoconjunctivitis throughout childhood and adolescence: A population-based birth cohort study. Lancet Respiratory Medicine 3(12): 933–942.
Hricko, A. 2008. Global trade comes home: Community impacts of goods movement. Environmental Health Perspectives 116(2): A78–A81.
Krewski, D., M. Jerrett, R.T. Burnett, R. Ma, E. Hughes, Y. Shi, M.C. Turner, C.A. Pope III, G. Thurston, E.E. Calle, and M.J. Thun. 2009. Extended follow-up and spatial analysis of the American Cancer Society study linking particulate air pollution and mortality. Research Report 140. Boston, MA: Health Effects Institute.
Landrigan, P.J., R. Fuller, N.J.R. Acosta, O. Adeyi, R. Arnold, N. Basu, A.B. Baldé, R. Bertollini, S. Bose-O’Reilly, J.I. Boufford, P.N. Breysse, T. Chiles, C. Mahidol, A.M. Coll-Seck, M.L. Cropper, J. Fobil, V. Fuster, M. Greenstone, A. Haines, D. Hanrahan, D. Hunter, M. Khare, A. Krupnick, B. Lanphear, B. Lohani, K. Martin, K.V. Mathiasen, M.A. McTeer, C.J.L. Murray, J.D. Ndahimananjara, F. Perera, J. Potočnik, A.S. Preker, J. Ramesh, J. Rockström, C. Salinas, L.D. Samson, K. Sandilya, P.D. Sly, K.R. Smith, A. Steiner, R.B. Stewart, W.A. Suk, O.C.P. van Schayck, G.N. Yadama, K. Yumkella, and M. Zhong. 2018. The Lancet Commission on pollution and health. The Lancet 391 (10119): 462–512.
Lelieveld, J., J.S. Evans, M. Fnais, D. Giannadaki, and A. Pozzer. 2015. The contribution of outdoor air pollution sources to premature mortality on a global scale. Nature, September 16, 367–371. Online at www.nature.com/articles/nature15371.
Orellano, P., N. Quaranta, J. Reynoso, B. Balbi, and J. Vasquez. 2017. Effect of outdoor air pollution on asthma exacerbations in children and adults: Systematic review and multilevel meta-analysis. PLoS ONE 12(3): e0174050. Online at https://doi.org/10.1371/journal.pone. 0174050.
Pinault, L., M. Tjepkema, D.L. Crouse, S. Weichenthal, A. van Donkelaar, R.V. Martin, M. Brauer, H. Chen, and R.T. Burnett. 2016. Risk estimates of mortality attributed to low concentrations of ambient fine particu-late matter in the Canadian community health survey cohort. Environmental Health 15:18. Online at https://doi.org/10.1186/s12940- 016-0111-6.
Pope III, C.A., and D.W. Dockery. 2006. Health effects of fine particulate air pollution: Lines that connect. Journal of the Air & Waste Management Association 56(6):709–742. Online at https://doi.org/ 10.1080/10473289.2006.10464485.
Tessum, C.W., J.D. Hill, and J.D. Marshall. 2017. InMAP: A model for air pollution interventions. PLoS ONE 12(4):e0176131. Online at https://doi.org/10.1371/journal.pone.0176131.
Tessum, C.W., J.D. Hill, and J.D. Marshall. 2014. Life cycle air quality impacts of conventional and alternative light-duty transportation in the United States. Proceedings of the National Academy of Sciences of the United States of America 111(52):18490–18495.
US Census Bureau. 2018. Summary file: 2012–2016 American commu-nity survey. Online at www.census.gov/programs-surveys/acs/data/summary-file.2016.html.
US Environmental Protection Agency (EPA). 2018. Environmental bene-fits mapping and analysis program—community edition user manual. Washington, DC. Online at www.epa.gov/sites/production/files/ 2015-04/ documents/benmap-ce_user_manual_march_2015.pdf.
US Environmental Protection Agency (EPA). 2014. 2014 National emissions inventory. Version 1. Washington, DC. Online at www.epa.gov/air-emissions-inventories/2014-national-emissions-inventory- nei-data.
Wisland, L. 2018. California takes another run at 100 percent clean elec-tricity. The Equation. Cambridge, MA: Union of Concerned Scientists. Blog, September 10. Online at http://blog.ucsusa.org/laura-wisland/california-100-percent-clean-electricity.