fact book 2017-2018
TRANSCRIPT

1
FACT BOOK 2017-2018

2
General Information.................................................................................. 04
About the Institution........................................................................................................05
Non-Discrimination Statement...................................................................................06
Benchmark Institutions…………………………………………………………………..………............07
Board of Regents & Presidents………………………………………………….…..……...............08
Organizational Chart......................................................................................................09
Tuition and Fees………………………………………………………………………………….................. 10
Institutional and Professional Accreditations……………………………………........... 12
Admissions and Enrollment .................................................................. 15
Quick Facts.................................................... .......................................................................16
Admission Facts.................................................................................................................17
Enrollment by Degree Type Trends................................. ..........................................19
Enrollment Summary: Fall Semester………………...................................................... 20
Enrollment Summary: Spring Semester…………………..............................................25
Enrollment Summary Summer Semester……………….............................................30
First-Time Transfer Students….....................................................................................32
Entering Freshmen ACT Scores & Matriculation..................................................34
Financial Aid...................................................................................35
Financial Aid Awards...................................................................................................36
Degrees Offered and Conferred ......................................................... 38
Degrees Offered............................................................................................................... 39
Degrees Awarded by Gender, Race/Ethnicity....................................................... 40
STEM+H Degrees Awarded...........................................................................................41
Degrees Conferred by College....................................................…………………………. 42
Student Affairs…………………………………..............................................……. 47
Student Organizations…………………………………………………………………………………….48
Athletics……………………………………………………………………………………………………………….51
University Housing……………………………………………………………………………………………..52
Education Abroad Program……………………………………………………………………………..53
Student Support Services…………………………………………………………………………………55
Faculty and Staff……………………………................................................…… 60
Full-Time Faculty by, Gender and Race………………………………………………………….61
Full-Time Faculty by College, Rank and Gender……………………………………………62
Full-Time Faculty by College, Rank and Tenure Status………………………………..64
Salary Increases………………………………………………………………………………………………….66
Faculty Staff Awards………………………………………………………………………………………….67
Graduation Information........................................................................... 71
Retention Rates………………………………………………………………………………………………….72
Graduation Rates……………………………………………………………………………………………….74
TABLE OF CONTENTS

3
Alumni Affairs............................................................................................... 76
Alumni Association...........................................................................................................77
Murray State University Foundation......................................................................... 78
Alumni by Kentucky County……………………………………………………………………………. 79
Alumni by State…………………………………………………………………………………………………. 80
University Libraries………………………………................................. 81
Financial Information…………………………………........................................ 84
Budget Summary………………………………………………………………………………….………..…85
Grants Awarded by Type…………………………………………………………………………………86
Grants Awarded by Category………………………………………………………………………… 87
Top 10 Federal Awarding Agencies………………………………………………………………. 88
TABLE OF CONTENTS
4
GENERAL INFORMATION

5
Strategic Directions
Murray State University is a student-centered and engaging regional public
university that we envision as the University of Choice for regional high
school students within the 18-county service region, community college
transfers, nontraditional students, and national and international students
who seek a university offering superior educational and co-
curricular experiences. We envision Murray State to be the University of
Choice for faculty and staff who desire to work for a progressive university
that offers distinctive academic programming, an energized work
environment and one that fosters community. We envision Murray State to
be the University of Choice for the citizens of the region, and the
Commonwealth, to look to a qualified workforce, to create applied
research and partnerships for solving community identified challenges and/
or capitalizing on new opportunities.
The strategic initiatives must directly address the core values that Murray
State fosters through the integration of multiple components. The
strategic initiatives are Academic Excellence; Student Success; Scholarship,
Research and Creative Activities; and Community Engagement.
ABOUT THE INSTITUTION
Murray State University places our highest priority on student learning
and excellent teaching, blending the range of educational opportunities
often experienced at research institutions with the nurturing student-
teacher interactions usually found at smaller universities. We offer
relevant undergraduate and graduate degree programs with core studies
in the liberal arts and sciences, leading to degrees from certificates to
advanced practice doctorates that prepare students for success. Through
effective and creative teaching, the opportunity to apply knowledge and
skills to real-world situations, and academic and student support services,
our quality faculty and staff foster student growth in knowledge, critical
inquiry, and innovative thinking. As a public comprehensive university
dedicated to diversity, global awareness, and intellectual curiosity, we
actively engage students, faculty, staff, and the community in collaborative
scholarship, creative activity, and research. We invest in our communities
through thoughtful public service in our 18-county service region and
beyond. Our uniqueness arises from our combination of academic
excellence, welcoming atmosphere, and dedication to student success
through mentored, real-world learning opportunities in an open-minded
and supportive learning environment.
M urray State University began as Murray State Normal School in 1922 with a class of 202 students who all had a promising future as teachers. Located
in the Jackson Purchase area of western Kentucky, Murray State University today is a state-assisted comprehensive university with four academic
colleges, one Center for Adult and Regional Education, two schools, and two libraries. The university’s 236-acre main campus is in Murray, a city of
16,600. The Murray State University shield is symbolic of the coat-of-arms of William Murray, Earl of Mansfield and Lord Chief Justice of Great Britain in 1756.
William Murray’s ancestors founded the city of Murray and the university was proudly given the name. The three stars on the shield represent hope, endeavor
and achievement, which is what Murray State University aims for all of its students.
Mission

6
NON-DISCRIMINATION STATEMENT
The following statement shall serve as the official nondiscrimination statement of
Murray State University for its Affirmative Action Plan and for all other purposes. This
statement supersedes and replaces all others that may have previously existed in any
other form or by any other title in University policies, governance and other
documents, internal and external communications, correspondence, and all other
official materials:
Murray State University endorses the intent of all federal and state laws created to
prohibit discrimination. Murray State University does not discriminate on the basis of
race, color, national origin, gender, sexual orientation, religion, age, veteran status, or
disability in employment, admissions, or the provision of services and provides, upon
request, reasonable accommodation including auxiliary aids and services necessary to
afford individuals with disabilities equal access to participate in all programs and
activities.
In particular and without limiting the preceding and pursuant to and consistent with
the requirements of Title VI of the Civil Rights Act of 1964 and its regulations 34 CFR
100 et seq.; Section 504 of the Rehabilitation Act of 1973 and its regulations 34 CFR 104;
Title IX of the Education Amendments of 1972, 20 USC 1681 et seq., and its regulations
34 CFR 106 et seq; and the Age Discrimination Act of 1975 and its regulations 34 CFR 110,
Murray State University does not discriminate on the basis of race, color, national
origin, sex, handicap, or age in its educational programs and activities. This non-
discrimination in education programs and activities extends to employment and
admissions and to recruitment, financial aid, academic programs, student services,
athletics, and housing. Murray State is required by Title IX and 34 CFR part 106 not to
discriminate on the basis of sex and the prohibition against sex discrimination
specifically includes a prohibition of sexual harassment and sexual violence. Examples
of prohibited sexual harassment and sexual violence can be found in the “Policy
Prohibiting Sexual Harassment” which can be accessed via the link referenced in
Appendix I.
Inquiries concerning the application of these provisions may be referred to: 1) the
Executive Director of Institutional Diversity, Equity, and Access/ Murray State
University Title IX Coordinator, Murray State University, 103 Wells Hall, Murray, KY
42071 Telephone: (270) 809-3155 Fax: (270) 809-6887; TDD: (270) 809-3361; Email:
[email protected]; or 2) to the Assistant Secretary of the United States
Department of Education, U.S. Department of Education, Office for Civil Rights, 400
Maryland Avenue, SW, Washington, D.C. 20202-1100; Telephone: 1-800-421-3481 FAX:
202-453-6012; TDD: 1-800-877-8339; Email: [email protected]
For more information, contact the Title IX Coordinator and Executive Director of
Institutional Diversity, Equity and Access, 103 Wells Hall, (270) 809-3155 (voice), (270)
809-3361 (TDD).
Date Modified: August 2004, February 2008, November 2008 (amended), July 2013
(Office Title Change), August 2015
NOTE: THE OFFICE OF EQUAL OPPORTUNITY TRANSITIONED TO THE OFFICE OF
INSTITUTIONAL DIVERSITY, EQUITY & ACCESS EFFECTIVE JULY 1, 2013 AND THE
WEBSITE IS LOCATED AT: MURRAYSTATE.EDU/IDEA. ALL REFERENCES WITHIN
CAMPUS-WIDE DOCUMENTS TO THE OFFICE OF EQUAL OPPORTUNITY SHOULD
BE CONSIDERED ANALOGOUS TO THE OFFICE OF INSTITUTIONAL DIVERSITY,
EQUITY AND ACCESS.

7
BENCHMARK INSTITUTIONS
Central Connecticut State University (New Britain, CT)
Eastern Illinois University (Charleston, IL)
Eastern Washington University (Cheney, WA)
Frostburg State University (Frostburg, MD)
Indiana State University (Terre Haute, IN)
Northwest Missouri State University (Maryville, MO)
Oakland University (Rochester Hills, MI)
Pittsburg State University (Pittsburg, KS)
Plymouth State University (Plymouth, NH)
Rhode Island College (Providence, RI)
Southeast Missouri State University (Cape Girardeau, MO)
Stephen F. Austin State University (Nacogdoches, TX)
The University of Tennessee-Chattanooga (Chattanooga, TN)
The University of Tennessee-Martin (Martin, TN)
University of Central Missouri (Warrensburg, MO)
University of Montevallo (Montevallo, AL)
University of Nebraska at Omaha (Omaha, NE)
Western Carolina University (Cullowhee, NC)
Western Illinois University (Macomb, IL)
Reaffirmed by the Murray State University Board of Regents, August 2011

8
Mr. Stephen A. Williams (2009-2018) Goshen, Kentucky (Chair)
Ms. Susan Shaffer Guess (2010-2019) Paducah, Kentucky (Vice– Chair)
Ms. Sharon Green (2009-2021) Murray, Kentucky
Mr. J. Daniel Kemp (2014-2020) Hopkinsville, Kentucky
Mr. Jerry P. Rhoads (2015-2021) Madisonville, Kentucky
Ms. Jenny Lynn Sewell (2011-2017) Dawson Springs, Kentucky
Dr. Walter Bumphus (2016-2022) Austin, Texas
Ms. Lisa Rudolph (2016-2022) Murray, Kentucky
Ms. Katherine Farmer (2016– 2019) Murray, Kentucky (Faculty Regent)
Mr. Philip R. Schooley (2009-2018) Murray, Kentucky (Staff Regent)
Mr. Clinton F. Combs (2016-2017) Murray, Kentucky (Student Regent)
Dr. Robert O. Davies 2014 - present
Dr. Tim Miller 2013 - 2014
Dr. Randy Dunn 2006 - 2013
Dr. Tim Miller (Interim; Aug-Nov) 2006
Dr. Kern Alexander (Interim; Jan-Aug) 2006
Dr. F. King Alexander 2001 - 2005
Dr. Kern Alexander 1994 - 2001
Dr. Ronald J. Kurth 1990 - 1994
Dr. James L. Booth (Acting) 1989 - 1990
Dr. Kala M. Stroup (on leave 1989-1990) 1983 - 1990
Dr. Constantine W. Curris 1973 - 1983
Dr. Harry M. Sparks 1968 - 1973
Dr. Ralph H. Woods 1945 - 1968
Dr. James H. Richmond 1936 - 1945
Dr. John W. Carr (2nd term) 1933 - 1936
Dr. Rainey T. Wells 1926 - 1932
Dr. John W. Carr (1st term) 1923 - 1926
Presidents Board of Regents
Board of Regents & Presidents

9
ADMINISTRATION

10
Undergraduate Full-Time Annual Tuition and Fees
TUITION AND FEES
Combined Tuition and Fees Tuition Only Required Fees
In-district 8,820 7,656 1,164 In-state 8,820 7,656 1,164 Out-of-state 23,820 22,656 1,164
Nonresident Alien 23,820 22,656 1,164
Undergraduate Full-Time Semester Tuition and Fees
Undergraduate Credit Hour Tuition
Undergraduate Credit Hour Tuition Combined Tuition and Fees Tuition Only Required Fees
In-district 367.50 319 48.50
In-state 367.50 319 48.50
Out-of-state 992.50 944 48.50
Nonresident Alien 992.50 944 48.50
Online, In-state* 432.50 319 113.50
Online, Out-of-state* 1057.50 944 113.50
Combined Tuition and Fees Tuition Only Required Fees
In-district 4,410 3,828 582
In-state 4,410 3,828 582
Out-of-state 11,910 11,328 582
Nonresident Alien 11,910 11,328 582

11
Graduate Full-Time Annual Tuition & Fees
TUITION AND FEES
Graduate Full-Time Semester Tuition & Fees
Graduate Credit Hour Tuition
Combined Tuition and Fees Tuition Only Required Fees
In-district 528 479.50 48.50
In-state 528 479.50 48.50
Out-of-state 1,489.50 1,441 48.50
Nonresident Alien 1,489.50 1,441 48.50
Online 737 623.50 113.50
Combined Tuition and Fees Tuition Only Required Fees
In-district 9,504 8,631 873
In-state 9,504 8,631 873
Out-of-state 26,811 25,938 873
Nonresident Alien 26,811 25,938 873
Combined Tuition and Fees Tuition Only Required Fees
In-district 4,752 4,315.50 436.50
In-state 4,752 4,315.50 436.50
Out-of-state 13,405.50 12,969 436.50
Nonresident Alien 13,405.50 12,969 436.50

12
INSTITUTIONAL & PROFESSIONAL
ACCREDITATIONS
College of Humanities and Fine Arts
Accrediting Body Full Name Acronym Last Review Date Accredited Programs
Masters in Psychology Accreditation Council MPAC 2014 Clinical Psychology (MA, MS)
National Association of Schools of Art and Design NASAD 2007 Art (BA, BFA, BS)
Art Education (BA, BFA, BS)
National Association of Schools of Music NASM
Music (BA, BS)
2013 Music Education (BM, MME)
Music Composition (BM
Music Business (BS)
National Association of Schools of Theatre NAST 2014 Theatre (BA, BS)
Arthur J. Bauernfeind College of Business
Accrediting Body Full Name Acronym Last Review Date Accredited Programs
Accrediting Council on Education in Journalism and Mass Communications
ACEJMC 2015
Advertising (BA/BS) Journalism (BA/BS)
Public Relations (BA/BS) Television Production (BA/BS)
Association to Advance Collegiate Schools of Business
AACSB International 2013
Accounting (all tracks) (BAB, BSB) Business Administration (BAB, BSB)
Computer Information Systems (BAB, BSB, MS)
Finance (all tracks) (BAB, BSB) International Business (BAB, BSB)
Management (all tracks) (BAB, BSB)
Marketing (all tracks) (BAB, BSB)
Master of Business Administration (MBA)

13
INSTITUTIONAL & PROFESSIONAL
ACCREDITATIONS
Accrediting Body Full Name Acronym Last Review Date Accredited Programs
Council for Accreditation of Counseling and Related Edu-
cational Programs CACREP 2014
Clinical Mental Health Counseling (EdS)
School Counseling (MA)
Council on Social Work Education CSWE 2010 Social Work (BSW)
American Speech-Language-Hearing
Association ASHA 2008
Communication Disorders (BA/BS)
Speech-Language Pathology (MS)
Council for the Accreditation of Educator Preparation CAEP 2017
Elementary Education (BA/BS)
Health and Physical Education Advising (BA/BS)
Interdisciplinary Early Childhood Education (BS/BA)
Middle School Educations (BS/BA)
Secondary Education (BS/BA)
Learning and Behavior Disorders (BS)
Kentucky Education Professional
Standards Board EPSB
Elementary Education (BA/BS)
2010
Health and Physical Education Advising (BA/BS)
Interdisciplinary Early Childhood Education (BS/BA)
Middle School Educations (BS/BA)
Secondary Education (BS/BA)
Learning and Behavior Disorders (BS)
College of Education and Human Services

14
INSTITUTIONAL & PROFESSIONAL
ACCREDITATIONS Jesse D. Jones College of Science, Engineering and Technology
Accrediting Body Full Name Acronym Last Review Date Accredited Programs
American Chemical Society ACS 2013 Chemistry (BS/BA)
Applied Science Accreditation Commission of the Accreditation Board for Engineering and Technology
ASAC/ABET 2015 Occupational Safety and Health (BS, MS)
Engineering Accreditation Commission of the Accreditation Board for Engineering and Technology
EAC/ABET 2015 Engineering Physics (BS)
Technology Accreditation Commission of the Accreditation Board for Engineering and Technology
TAC/ABET 2010 Civil Engineering Technology (BS)
School of Nursing & Health Professions
Accrediting Body Full Name Acronym Last Review
Date Accredited Programs
Accreditation Council for Education in Nutrition and Dietetics ACEND 2013 Didactic Program in Dietetics (BS)
Dietetic Internship Program (graduate)
Commission on Accreditation of Athletic Training Education CAATE 2012 Athletic Training (MSAT)
Commission on Accreditation of Allied Health Education Programs CAAHEP 2012 Exercise Science (BS)
Commission on Collegiate Nursing Education CCNE 2013
Nursing (BSN) Nursing/Post-R.N. (BSN, MSN)
Nurse Anesthetist (MSN) Nursing Practice (DNP)
Council on Accreditation of Nurse Anesthesia Educational Programs COA 2011 Nurse Anesthetist (MSN)
Nursing Practice (DNP)

15
ADMISSIONS & ENROLLMENT

16
QUICK FACTS
Students by Race/ Ethnicity
Race/Ethnicity Percentage of Student Population
American Indian or Alaskan Native 0.20%
Asian 0.90%
Black, Non-Hispanic 5.80%
Hispanic 1.90%
Native Hawaiian or Other 0.10%
Non Resident Alien 3.50%
Two or More Races 2.70%
White, Non-Hispanic 82.0%
Unknown 2.90%
8,559 Undergraduates
1,453 Graduates 3 out of 5 Students
are Female

17
ADMISSIONS FACTS

18
ADMISSIONS FACTS

19
ADMISSIONS FACTS

20
ENROLLMENT BY DEGREE LEVEL TRENDS

21
ENROLLMENT SUMMARY: FALL SEMESTER
1FTE = undergraduate student credit hours divided by 15 plus graduate student credit hour divided by 12.

22
ENROLLMENT SUMMARY: FALL SEMESTER
1FTE = undergraduate student credit hours divided by 15. 2Includes auditing and visiting students

23
ENROLLMENT SUMMARY: FALL SEMESTER
1FTE = graduate student credit hours divided by 12.

24
ENROLLMENT SUMMARY: SPRING SEMESTER
1FTE = undergraduate student credit hours divided by 15 plus graduate student credit hour divided by 12.

25
ENROLLMENT SUMMARY: SPRING SEMESTER
1FTE = undergraduate student credit hours divided by 15.
2Includes auditing and visiting students

26
ENROLLMENT SUMMARY: SPRING SEMESTER
1FTE = graduate student credit hours divided by 12.

27
ENROLLMENT SUMMARY: SUMMER SEMESTER

28
FIRST-TIME TRANSFER STUDENTS
By Sending Institutions Fall 2014 Fall 2015 Fall 2016 Fall 2017
Total from All Institutions 761 630 605 558
Kentucky Public Institutions 380 362 382 332
Kentucky Public Universities 40 30 39 26
Eastern Kentucky University 5 4 2 1
Kentucky State University -- 1 -- —
Morehead State University 2 2 -- —
Northern Kentucky University -- 1 -- 1
University of Kentucky 10 12 12 5
University of Louisville 5 5 5 9
Western Kentucky University 18 5 20 10
KCTCS Institutions 380 332 343 306
Ashland Community & Technical College 3 1 1 —
Big Sandy Community & Technical College -- -- 1 2
Bluegrass Community & Technical College 6 3 7 3
Elizabethtown Community & Technical College 2 -- 4 4
Gateway Community & Technical College -- 1 1 1
Hazard Community & Technical College 1 22 -- —
Henderson Community College 24 64 31 20
Hopkinsville Community College 62 6 64 57
Jefferson Community & Technical College 7 68 6 4
Madisonville Community College 79 2 63 64
Maysville Community & Technical College 9 12 1 —
Owensboro Community & Technical College 12 -- 16 12
Somerset Community College 4 1 2 1
Southcentral Kentucky Technical & Community College 5 2 -- —
Southeast Kentucky Community & Technical College -- 1 -- —
West Kentucky Community & Technical College 166 149 146 138

29
FIRST-TIME TRANSFER STUDENTS
By Sending Institutions Fall 2014 Fall 2015 Fall 2016 Fall 2017
Total from All Institutions 761 630 635 558
Kentucky Public Institutions 380 362 382 332
Kentucky Independent Institutions 84 20 11 18
Asbury College -- -- -- —
Bellarmine University -- 4 -- 1
Berea College -- -- -- 1
Brescia University 3 -- -- 2
Campbellsville University 3 1 2 3
Centre College -- -- -- —
Georgetown College -- 3 -- 2
Kentucky Christian University -- -- -- 1
Kentucky Wesleyan College 3 1 3 2
Lindsey Wilson College 3 1 3 1
Mid-Continent University 71 3 -- 2
Midway College -- 2 1 1
Saint Catharine College -- 1 1 —
Spalding University 1 -- -- —
Sullivan University -- -- -- —
Transylvania University -- 1 1 1
Union College -- -- -- —
University of Pikeville -- -- -- —
University of the Cumberlands -- 3 -- 1
Out-of-State and Foreign Institutions 257 248 242 208

30
FRESHMEN ACT SCORES AND MATRICULATION
Mean Enhanced ACT Standard Scores Fall 2013 Fall 2014 Fall 2015 Fall 2016 Fall 2017 ENGLISH
Murray State
Admitted 24.1 23.9 24.1 25.8 25.8 Conditionally Admitted 18.0 18.3 17.5 20.5 20.1
National 22.2 22.1 22.2 20.1 20.3 MATHEMATICS
Murray State Admitted 22.4 22.3 22.3 24.0 24.3 Conditionally Admitted 17.6 18.0 17.6 18.7 18.5
National 22.3 22.3 22.3 20.6 20.7 COMPOSITE
Murray State Admitted 23.5 23.5 23.5 24.8 25.1 Conditionally Admitted 18.6 18.6 18.2 20.2 20
National 22.5 22.5 22.6 20.8 21
Matriculation Information Fall 2013 Fall 2014 Fall 2015 Fall 2016 Fall 2017
Total New Freshmen Applied 4,953 4,760 4,874 6,479 6,900
Total New Freshmen Admitted 4,068 3,806 4,416 5,530 5,980
Total New Freshmen Enrolled 1,581 1,508 1,468 1,502 1,443
Acceptance Rate 82.1% 80.0% 90.6% 85.3% 86.7%
Matriculation Rate 38.9% 39.6% 33.2% 27.1% 24.1%
Notes: Matriculation Rate is Total New Freshmen Enrolled/Total New Freshmen Admitted.
"Total New Freshmen Enrolled" includes both full-time and part-time students.

31
FINANCIAL AID

32
FINANCIAL AID AWARDS Update coming soon
Total Number of Unduplicated
Students by Category
Number of Awards per Fund*
Amount of Awards Average Awards
Based on Number of Awards*
Average Award per Student by Category**
GRANTS
PELL
SEOG
KHEAA State Grant (CAP)
PHEAA State Grant
TEACH Grant
Total
SCHOLARSHIPS/WAIVERS
Academic
Athletics
KEES
Teacher Scholarship
MSU Foundation
Housing/Dining-Auxiliary
Departmental
Racer Advantage Grant
Out-of-State
Other
Institutional Fee Waivers
Total

33
FINANCIAL AID AWARDS
Total Number of Unduplicated Students by
Category
Number of Awards per
Fund* Amount of Awards
Average Awards Based on Number
of Awards*
Average Award per Student by
Category**
STUDENT EMPLOYMENT/ ASSISTANTSHIPS
Federal Work-Study
Graduate Assistantships
University Student Employment
Total
STUDENT LOANS
Nursing Student Loan
Owen (Adult) Loan
Parent Loan (PLUS)
Graduate (PLUS) Loan
Perkins Loan
Student Loan (Subsidized)
Student Loan (Unsubsidized)
Alternative Private Loan
Total
TOTAL FINANCIAL AID (Number of students receiving assistance and aver-age award per student)
34
DEGREES OFFERED & CONFERRED

35
DEGREES OFFERED
Associate Degrees
• AA Associate of Arts
• AS Associate of Science
Baccalaureate Degrees
• BA Bachelor of Arts
• BAB Bachelor of Arts in Business
• BFA Bachelor of Fine Arts
• BIS Bachelor of Integrated Studies
• BM Bachelor of Music
• BS Bachelor of Science
• BSA Bachelor of Science in Agriculture
• BSE Bachelor of Science in Engineering
• BSB Bachelor of Science in Business
• BSN Bachelor of Science in Nursing
• BSW Bachelor of Social Work
Master’s Degrees
• MA Master of Arts
• MAEd Master of Arts in Education
• MAT Master of Arts in Teaching
• MBA Master of Business Administration
• MFA Master of Fine Arts
• MME Master of Music Education
• MPA Master of Public Administration
• MS Master of Science
• MSAT Master of Science in Athletic Training
• MSIS Master of Science in Information Systems
• MSN Master of Science in Nursing
Specialist Degree
• EdS Specialist in Education
Doctorate Degrees
• DA Doctor of Arts
• DNP Doctor in Nursing Practice
• EdD Doctor of Education

36
DEGREES AWARDED BY GENDER, RACE/ETHNICITY
Associate’s Bachelor’s Graduate
Certificate
Master’s Doctorate Total
Total Degrees 13 1,699 12 616 10 2350
Gender
Female 12 1024 9 328 10 1383
Male 1 675 3 288 0 967
Race-Ethnicity
American Indian, Alaskan Native - 1 - 1 - 2
Asian - 15 - 3 - 18
Black, African American 1 118 2 41 - 162
Hispanic or Latino - 29 - 6 - 35
Native Hawaiian, Pacific Islander - 1 - - - 1
Nonresident Alien 1 75 2 187 - 265
Two or More Races - 25 2 5 - 32
White 11 1,403 6 368 10 1,798
Unknown - 32 - 4 - 36
Degrees awarded from summer 2016 through spring 2017

37
STEM+H DEGREES AWARDED
Associate’s Bachelor’s Graduate
Certificate
Master’s Doctorate Total
Total Degrees 1 709 1 204 10 925
Gender
Female 1 373 1 71 10
Male 336 133
Race-Ethnicity
American Indian, Alaskan Native 1
Asian 8
Black, African American 18 4
Hispanic or Latino 7 2
Multiracial 15 2
Native Hawaiian, Pacific Islander 1
Nonresident Alien 44 117
White 1 598 1 77 10
Unknown 17 2
The Kentucky Council on Postsecondary Education determines which programs count as STEM+H.

38
DEGREES CONFERRED BY COLLEGE
Hutson School of Agriculture
College CIP Code Major Associate's Bachelor's Graduate
Certificate Master's Total
Hutson School of Agriculture 1.9999 Agricultural Science 1 102 - 19 122
Hutson School of Agriculture 51.0808 Animal & Equine Science
Animal Technology, Veterinary Hospital Mgmt.
- 94 1 - 95
School of Nursing & Health Professions
College CIP Code Major Associate's Bachelor's Graduate
Certificate Master's Doctorate Total
School of Nursing & Health Professions 19.0501 Nutrition, Dietetics and Food
Management - 10 - - - 10
School of Nursing & Health Professions 31.0505 Exercise Science - 45 - - - 45
School of Nursing & Health Professions 51.0913 Athletic Training - 5 - - - 5
School of Nursing & Health Professions 51.2208 Community Health and Preventative Medicine
- 6 - - - 6
School of Nursing & Health Professions 51.3801 Nursing - 114 - - - 114
School of Nursing & Health Professions 51.3818 Nursing Practice - - - - 10 10
Interdisciplinary
College CIP Code Major Associate’s Bachelor's Master's Total
Interdisciplinary 24.0102 General Studies - 114 - 114

39
DEGREES CONFERRED BY COLLEGE
Arthur J. Bauernfeind College of Business
College CIP Code Major Associate's Bachelor's Graduate
Certificate Master's Doctorate Total
Bauernfeind College of Business 9.0101 Mass Communications - - - 15 - 15
Bauernfeind College of Business 9.0401 Journalism - 7 - - - 7
Bauernfeind College of Business 9.0701 Television Production - 14 - - - 14
Bauernfeind College of Business 9.0901 Organizational Communication - 34 - 8 - 42
Bauernfeind College of Business 9.0902 Public Relations - 45 - - - 45
Bauernfeind College of Business 9.0903 Advertising - 14 - - - 14
Bauernfeind College of Business 10.0301 Graphic Communications Media - 4 - - - 4
Bauernfeind College of Business 11.0103 Computer Information Systems - 5 - 20 - 25
Bauernfeind College of Business 11.0701 Computer Science - 20 - - - 20
Bauernfeind College of Business 45.0601 Economics - 12 - 3 - 15
Bauernfeind College of Business 52.0101 Business Administration 2 92 111 - - 205
Bauernfeind College of Business 52.0201 Management - 28 - - - 28
Bauernfeind College of Business 52.0203 Logistics & Supply Chain Mgmt. - 1 - - - 1
Bauernfeind College of Business 52.0301 Accounting - 38 - - - 38
Bauernfeind College of Business 52.0801 Finance - 22 - - - 22
Bauernfeind College of Business 52.1101 International Business - 6 - - - 6
Bauernfeind College of Business 52.1401 Marketing - 24 - - - 24

40
DEGREES CONFERRED BY COLLEGE College of Education & Human Services
College CIP
Code Major Associate's Bachelor's
Graduate Certificate
Master's Doctorate Total
College of Education & Human Services 13.0499 Education Administration - - - 30 - 30
College of Education & Human Services 13.1001 Special Education - 32 - 13 - 45
College of Education & Human Services 13.1101 School Counseling - - - 18 - 18
College of Education & Human Services 13.1202 Elementary Education - 64 - 23 - 87
College of Education & Human Services 13.1203 Middle School Education - 35 - 9 - 44
College of Education & Human Services 13.1205 Secondary Teacher Leader - - - 18 - 18
College of Education & Human Services 13.1206 Teacher Education, Multiple Levels - - - 1 - 1
College of Education & Human Services 13.1210 Interdisciplinary Early Childhood - 5 - 10 - 15
College of Education & Human Services 13.1307 Health and Physical Education - 10 - - - 10
College of Education & Human Services 13.1309 Career and Technical Education - - - 2 - 2
College of Education & Human Services 13.1312 Music Teacher Education - - - 4 - 4
College of Education & Human Services 13.1315 Reading and Writing - - - 12 - 12
College of Education & Human Services 13.1320 Career and Technical Education 2 - - - - 2
College of Education & Human Services 13.1334 Library Media - - - 10 - 10
College of Education & Human Services 13.1399 Career and Technical Education - 5 - - - 5
College of Education & Human Services 31.0601 Recreation and Leisure Services - 10 - - - 10
College of Education & Human Services 43.0104 Criminal Justice - 25 - - - 25
College of Education & Human Services 44.0201 Human Development and Leadership
- - 7 49 - 56
College of Education & Human Services 44.0701 Social Work - 88 - - - 88
College of Education & Human Services 44.0702 Nonprofit Leadership Studies - 26 2 3 - 31
College of Education & Human Services 51.0204 Communications Disorders, Speech-Language Pathology
- 35 - 21 - 56

41
DEGREES CONFERRED BY COLLEGE
College of Humanities and Fine Arts
College CIP
Code Major Associate's Bachelor's
Graduate Certificate
Master's Doctorate Total
College of Humanities & Fine Arts 5.0299 Gender Studies - - 1 - - 1
College of Humanities & Fine Arts 13.1401 TESOL - - - 15 - 15
College of Humanities & Fine Arts 16.0302 Japanese - 6 - - - 6
College of Humanities & Fine Arts 16.0501 German - 3 - - - 3
College of Humanities & Fine Arts 16.0901 French - 1 - - - 1
College of Humanities & Fine Arts 16.0905 Spanish - 4 - - - 4
College of Humanities & Fine Arts 23.0101 English - 23 - 7 - 30
College of Humanities & Fine Arts 23.1302 Creative Writing - 4 - 8 - 12
College of Humanities & Fine Arts 24.0101 Liberal Arts 8 3 - - - 11
College of Humanities & Fine Arts 38.0101 Philosophy - 3 - - - 3
College of Humanities & Fine Arts 42.2704 Psychology, General
Experimental Psychology - - - 2 - 2
College of Humanities & Fine Arts 42.2799 Psychology, General
Experimental Psychology - 48 1 - - 49
College of Humanities & Fine Arts 42.2801 Clinical Psychology - - - 9 - 9
College of Humanities & Fine Arts 44.0401 Public Administration - - - 15 - 15
College of Humanities & Fine Arts 45.0901 International Studies - 6 - - - 6
College of Humanities & Fine Arts 45.1001 Political Science - 12 - - - 12
College of Humanities & Fine Arts 45.1101 Sociology - 11 - - - 11
College of Humanities & Fine Arts 50.0501 Theatre - 7 - - - 7
College of Humanities & Fine Arts 50.0702 Art - 26 - - - 26
College of Humanities & Fine Arts 50.0901 Music (BM) - 19 - - - 19
College of Humanities & Fine Arts 50.0999 Music (BA/BS) - 7 - - - 7
College of Humanities & Fine Arts 50.1003 Music Business - 10 - - - 10
College of Humanities & Fine Arts 54.0101 History - 19 - 3 - 22

42
DEGREES CONFERRED BY COLLEGE
Jones College of Science, Engineering & Technology
College CIP Code Major Bachelor's Graduate Cer-
tificate Master's Total
Jones College of Science, Engineering & Technology 3.0601 Wildlife & Conservation Biology 21 - - 21
Jones College of Science, Engineering & Technology 11.0401 Telecommunications Systems
Management 31 - 21 52
Jones College of Science, Engineering & Technology 14.1201 Engineering Physics 27 - - 27
Jones College of Science, Engineering & Technology 15.0000 Applied Engineering and Tech-
nology Management - - 75 75
Jones College of Science, Engineering & Technology 15.0201 Civil Engineering Technology 28 - - 28
Jones College of Science, Engineering & Technology 15.0403 Electromechanical Engineering
Technology 14 - - 14
Jones College of Science, Engineering & Technology 15.0613 Manufacturing Technology 1 - - 1
Jones College of Science, Engineering & Technology 15.0701 Occupational Safety and Health 98 - 37 135
Jones College of Science, Engineering & Technology 15.1302 Engineering Graphics & Design 20 - - 20
Jones College of Science, Engineering & Technology 26.0101 Biology 30 - 1 31
Jones College of Science, Engineering & Technology 26.1304 Watershed Science - - 1 1
Jones College of Science, Engineering & Technology 27.0101 Mathematics 17 5 - 22
Jones College of Science, Engineering & Technology 40.0501 Chemistry 14 2 - 16
Jones College of Science, Engineering & Technology 40.0601 Geoscience 16 - - 16
Jones College of Science, Engineering & Technology 41.0301 Chemical Manufacturing Mgmt. - - 2 2

43
STUDENT AFFAIRS

44
STUDENT ORGANIZATIONS 2017-18 At Murray State University, the faculty and staff feel that in order to have a full and rich educational experience students should
get involved with as many organizations and activities as their schedules permit. Not only will students feel a greater sense of
belonging to Murray State and its traditions, but they will also have a greater understanding of balancing work, relaxation, health
and wellness, as well as a sense of accomplishment.
Active Minds African Student Association Agribusiness Club Agriculture Ambassadors Agriculture Engineering & Technology Club Agriculture Leadership Council Alpha Delta Pi Alpha Gamma Delta Alpha Gamma Epsilon Alpha Gamma Rho Alpha Kappa Alpha Sorority, Incorporated Alpha Mu Gamma Alpha Omicron Pi Alpha Sigma Alpha Alpha Sigma Phi Alpha Tau Gamma Alpha Zeta Honors Agricultural Fraternity American Industrial Hygiene Association American Institute of Professional Geologists American Society of Safety Engineers Amnesty International Archery Club Association for Computing Machinery Association of Information Technology Professionals Association for Renaissance Martial Arts Association of Post-Secondary Education Administrative Leaders Association of Telecommunications System Management
Athletic Trainers' Association Baptist Campus Ministry Bass Anglers Beta Alpha Psi Beta Beta Beta Biological Honor Society Black Student Council Block & Bridle Campus Activities Board Campus Lights Campus Outreach Campus Y Chinese Student Association Christ in You Fellowship Cirque des Boules Criminal Justice Society Dart Club Delta Sigma Theta Sorority, Inc. Delta Zeta Elizabeth College Honor Society English Student Organization Environmental Engineering Technology Society Euclidean Math Club Exercise Science Club G.A.M.E.: Game, Anime, Manga Enthusiasts Gamma Beta Phi Honor Society Gentleman’s Club Geoclub Global Trekkers: Study Abroad Her Campus Murray State Hester Residential College Council
Honors Student Council Horseman's Association Horticulture Club Indian Students' Association Institute of Electrical and Electronics Engineers International Cultures and Languages Association InterFraternity Council International Student Organization Japanese Club Journey Student Organization Judicial Board Kappa Delta Sorority Kentucky Association of Nursing Students Kentucky Education Association Student Program Korean Club Korean Student Association Lambda Chi Alpha
Lambda Zeta Omicron
Lee Clark Residential College Council
LGBT Alliance
Love MKY Campus Ministry
Math Tank of Future Math Educators
Middle Level Association

45
STUDENT ORGANIZATIONS
MSU Student Chapter of American Society for
Photogrammetry and Remote Sensing
Murray Chi Alpha
Murray Christian Fellowship
Murray Dressage Club
Murray Environmental Student Society
Murray State Agronomy Club
Murray State College Democrats
Murray State College Republicans
Murray State Dance Company
Murray State Lions Club
Murray State Rodeo Club
Murray State Student Ambassadors
Murray State University Chapter of The
Wildlife Society
Murray State University Collegiate FFA
Mu Sigma Chi Chapter of Chi Sigma Iota
M-Track Records
National Art Education Association
National Council of Teachers of English
Student Affiliate
National Pan-Hellenic Council
National Residence Hall Honorary
National Society of Collegiate Scholars
National Society of Leadership and Success
National Student Speech Language
Hearing Association
New Life Campus Ministry
Newman House Catholic Campus Ministry
Omicron Delta Kappa
Order of Omega Greek Honor Society
Organization of Murray Art Students
Panhellenic Council
Phi Kappa Tau - Delta Pi Chapter
Phi Mu Alpha Sinfonia
Pi Kappa Alpha
Pre-Health Professionals (PHP)
PSI CHI
Psychology Club
Public Relations Student Society of America
(PRSSA)
Racer Band
Racer Girls
Racers for Christ
Regents Residential College
Residential College Association
Rho Sigma Kappa
Richmond Residential College Council
Rotaract Murray State
Rowing
Saudi Students Organization
Secular Student Alliance
Sigma Alpha Iota
Sigma Alpha Lambda
Sigma Alpha Professional Agricultural Sorority-
Alpha Upsilon Chapter
Sigma Chi
Sigma Phi Epsilon Fraternity
Sigma Pi
Sigma Sigma Sigma
Smash University
Sock and Buskin
Society for Human Resource Management
Speech & Debate Union
Springer-Franklin Residential College
Student Association of Social Workers
Student Chapter of the Association for
Woman in Mathematics
Student Council for Exceptional Children
Student Government Association
Student Liaisons Advisory Board for Trio SSS
St. Jude Up 'Till Dawn
Student Members of the American
Chemical Society
Swine Club
Swing Dance Club
The Bravery Foundation
The Episcopal College Foundation
The Honor Society of Phi Kappa Phi - Chapter 302
The Wesley Foundation
TV Club
Veterans Student Organization
Veterinary Technology/Pre-Vet Club
Voices of Praise Ministries
White Residential College
Zeta Phi Beta
STUDENT ORGANIZATIONS 2016– 2017

46
ATHLETICS
Mission
The Student-Athlete Services Department of Murray State Athletics is committed to assisting all Racer student-athletes in reaching their
full potential in and outside of the classroom. Student-Athlete Services staff work cooperatively with every possible department at
Murray State University to assist student-athletes in the areas of class scheduling, degree progress, tutorial programs, community
service and career development. In doing so, Racer student-athletes build the necessary skills and tools to graduate, become leaders in
the community and lead productive lives after their career at Murray State concludes.
The Racer Student-Athlete Advisory Committee (SAAC) is the governing body for student-athletes at Murray State and is comprised of
representatives from each team. Team representatives are selected on the basis of strong leadership and communication skills as well as
a dedication to their sport.
SAAC has many different responsibilities but primarily works to address the following areas:
1) Cultivate productive relationships and communication between the MSU Athletics Department and its student-athletes.
2) Provide opportunities for all student-athletes to take an active role in campus and community projects and activities.
3) Enhance the academic and athletic experiences for MSU student-athletes.
Student-Athlete Advisory Committee

47
UNIVERSITY HOUSING
Fall 2017
Residential College Capacity Occupied % per Building
Clark 282 273 97%
Elizabeth 293 281 96%
Franklin 376 353 94%
Hart 505 475 94%
Hester 299 273 91%
Regents 355 284 80%
Richmond 193 118 61%
Springer 281 176 63%
White 354 303 86%
Total 2,938 2,536 86%
Spring 2018
Residential College Capacity Occupied % per Building
Clark 282 259 92%
Elizabeth 293 233 80%
Franklin 376 340 90%
Hart 505 431 85%
Hester 299 237 79%
Regents 355 249 70%
Richmond 193 106 55%
Springer 281 160 57%
White 354 244 69%
Total 2,938 2,259 77%

48
About Education Abroad Program
EDUCATION ABROAD PROGRAM
The Center for International Programs was established in 1981 for the unified coordination of international education activities at Murray State.
Renamed the Institute for International Studies (IIS) in 1998, one of the principal components of this focus is providing MSU students with an
array of education abroad options with the assistance of the Education Abroad staff. Education abroad options include a full academic year, a
semester, summer or winter break terms, and spring break.
Country 2013-14 2014-15 2015-16 2016-17 2017-2018
Argentina - 8 9 15 -
Australia 1 1 18 1 -
Austria 15 14 8 2 3
Belize 7 57 35 29 20
British Virgin Islands - - - 1 - Chile 6 2 4 4 - China 10 14 5 5 Colombia - - - 1 8
Costa Rica 24 3 1 3 3
Czech Republic 6 20 12 - 4 Denmark - 1 - 3 - Ecuador - 1 1 2 - England 35 9 54 14 57
England/Ireland - 15 - 17 3
Europe – Multi-Country 40 37 3 2 4
Finland - - - 2 -
France 8 3 3 5 5
Germany 18 35 47 39 23
Greece - - - 2 1
Hungary - 1 10 - 1
India - - 6 - 1

49
About Education Abroad Program
EDUCATION ABROAD PROGRAM
The Center for International Programs was established in 1981 for the unified coordination of international education activities at Murray State.
Renamed the Institute for International Studies (IIS) in 1998, one of the principal components of this focus is providing MSU students with an
array of education abroad options with the assistance of the Education Abroad staff. Education abroad options include a full academic year, a
semester, summer or winter break terms, and spring break.
Country 2013-14 2014-15 2015-16 2016-17 2017-2018
Ireland 5 16 20 35 66
Italy 14 12 3 29 30
Jamaica - - - - 9
Japan 26 11 11 11 8
Malaysia - - 1 - -
Mexico 9 3 3 4 5
Morocco - - 1 - 1
New Zealand - - - 1 2
Panama - 18 - - -
Scotland 1 8 20 12 17
South Africa 1 1 5 5 2
South Korea 1 8 2 8 2
Spain 8 10 9 12 6
St. John - - - - -
Switzerland - - 1 - -
Thailand - - - 5 -
Turkey - - - - -
Uganda - - - 1 1
Total 235 308 292 269 281

50
Health Services
STUDENT SUPPORT SERVICES
The U.S. Department of Health and Human Services Healthy People 2020 has charged colleges and universities with the responsibility
of providing health promotion and disease prevention strategies. The staff at Murray State University Health Services enhances the
educational process by promoting an optimal level of wellness, enabling the campus community members to make informed
decisions about health-related concerns, and empowering individuals to be confident and well-educated consumers of health care
services. Our ultimate goal is to support efforts in assisting individuals to achieve their academic and personal goals.
Each staff member possesses experience sensitive to the needs of a diverse college population and strives to provide a caring
environment that fosters personal growth and academic achievement, through offering the following free services to MSU students,
faculty, and staff:
Alcohol and other drug awareness
Tobacco cessation
Various laboratory testing
FREE STI/HIV counseling/testing
FREE Assessment, diagnosis and treatment of acute
injury/disease processes
Referrals to outside agencies/healthcare providers
24 hour on-call nurse
Service on committees (10) influencing the health, well-
ness, and safety of community members

51
STUDENT SUPPORT SERVICES
The mission of University Counseling Services is to provide effective services that enhance the growth and development of our students.
Services are provided by specially trained and licensed professionals in the Counseling Center and the Testing Center. Through mental health
services, standardized testing services, consultation, education, and advocacy, we work together to help develop and maintain a positive and
cooperative campus environment that promotes the retention and graduation of all our students.
The Counseling Center conducted 2,646 counseling sessions. These included 2,151 scheduled individual, couple, and group counseling sessions,
and 495 walk-in sessions.
The Counseling Center provided counseling services for 487 individuals, in addition to participants in group sessions. We also provided
numerous consultations with faculty, staff, family members, roommates, and friends of clients and potential clients.
Counseling Center staff provided more than 30 talks, trainings, and presentations for more than 3,000 individuals across campus. These
included trainings for RAs, RDs, and Summer O Counselors. Presentations were provided upon request for Transitions classes and other student
groups, including various talks requested by RAs for their residents. In addition, staff members participated in each of the Summer Orientation
days and provided information tables at Racer Days and the Admitted Student Open House.
The Director of University Counseling Services is an active member of several university-wide committees, including the Student Intervention
Team, Campus Safety Committee, Housing and Public Safety Team, McNair Advisory Board, LGBT Advisory Board, and the Sexual Assault
Response Team.
Counseling Services
The Testing Center administered 2,615 tests, including the ACT, GRE, LSAT, CLEP, Accuplacer, MAT, TOEFL, Dantes, Accuplacer, Praxis
Series, and Distance Learning Tests (aka proctored exams). The Testing Center offers testing services in two locations: the Testing Lab
in Oakley Applied Science, and the STN Center in Alexander Hall.
Testing Center

52
STUDENT SUPPORT SERVICES Career Services
Career Services provides career counseling and coaching to all Murray State students and alumni. Career counselors guide students
through career assessments and research to aid in the purposeful exploration of majors and career paths. Career coaches provide
resume and cover letter critiques as well as interview, networking and job search strategies through one-on-one appointments and
workshops. Career Services strives to connect students with employers who are looking to fill internship, full and part-time positions
through Racer Tracks, on-campus recruiting and multiple career events. Resources are available through the
website: www.murraystate.edu/career
Total Number of Contacts and Presentations 5,115
Contacts by Class Standing Total Contacts
Freshman 108
Sophomore 158
Junior 296
Senior 503
Graduate 109
Alumni 6
Group Count 1,180
Contacts by Race-Ethnicity Unique Contacts American Indian, Alaskan Native -
Asian 65
Black, African American 69
Hispanics or Latino, any race 6
Native Hawaiian, Pacific Islander -
White 922
Two or More Races 15
Unknown/Not Reported 89

53
STUDENT SUPPORT SERVICES
Career Services
Types of Contacts Total Contacts Career Assessment/ Interpretation 38 Career Exploration/ Research 40 Career Fair Prep 0 Career Services Overview 14 Choosing a Major/ Undecided 61 Clothing Closet 105 College to Career Transition 2 Graduate/ Professional School 7 Internships/ Co-op 43 Interview Skills 8 Job Search Assistance 50 KHEAA 166 Mock Interview 50 National Student Exchange 5 Negotiating Job Offers/ Salary 0 Part-time/ Seasonal Employment 2 Personal Branding/ Social Media 4 Racer Tracks 15 Resume/CV/Cover Letter 444 Retention - Special Population Topics - Total 1035

54
STUDENT SUPPORT SERVICES
Career Services
On-Campus Interviews Total Contacts Internship Interview
Employer Interview
Skype/Phone Interview
Racer Tracks Job Database Statistics (Jan2017-May 2017) Total Contacts
Employers
Jobs Posted
Student & Alumni Users
Events Hosted by Career Services # of Events Career Fairs
Classroom Presentations 2863
Workshops
Employer Presentations
55
GRADUATION INFORMATION FACULTY AND STAFF

56
FULL-TIME FACULTY AND STAFF BY OCCUPAIONAL CATEGORY
Faculty and Staff by Occupational Category1
Fall 2017
Full-time Part-time Total
# % of Category # % of Category # % of all Employees
FACULTY & STAFF Totals2 1,332 81.2% 309 18.8% 1641 100%
Instructional/Research Faculty3 457 67.6% 219 32.4% 676 41.2%
Library Faculty 9 100% - 9 0.5%
Research 1 100% - - 1 <0.1%
Archivists, Curators - - - - - -
Library Technicians 10 100% - - 10 0.6%
Other Teachers; Student & Education Services 64 100.0% - - 64 3.9%
Management, Administration 60 100.0% - - 60 3.7%
Business and Financial Operations 86 97.7% 2 2.3% 88 5.4%
Computer, Engineering, Science Occupations 62 98.4% 1 1.6% 63 3.8%
Community Service, Legal, Arts, and Media 79 54.5% 66 45.5% 145 8.8%
Healthcare Practitioners and Technical Occupations 28 90.3% 3 9.7% 31 1.9%
Service 179 95.2% 9 4.8% 188 11.5%
Sales, Sales Related 19 100% - - 19 1.2%
Office and Administrative Support 191 95.5% 9 4.5% 200 12.2%
Natural Resources, Construction, Maintenance 68 100% - - 68 4.1%
Production, Transportation, Materials Moving 19 100% - - 19 1.2%
GRADUATE ASSISTANTS - - 84 100% 84
1The occupational categories included in this table are the same categories reported to the U.S. Department of Education through the Integrated Postsecondary Educational Data System (IPEDS).
The occupational categories reported by universities were revised beginning fall 2012. Many of the current occupational categories can't be directly compared to those used in previous years. 2Faculty and staff totals do not include graduate assistants.
3This occupational category includes faculty from each academic college/school and Breathitt Veterinary Center faculty. It doesn't include faculty who primarily serve an
administrative role (deans, provost, etc.), who primarily teach pre-college-level courses (Community College), or who primarily serve an educational support or public service role (TES and TQI faculty).

57
FULL-TIME FACULTY AND STAFF BY CATEGORY 1, GENDER AND RACE
1The occupational categories included in this table are the same categories reported to the U.S. Department of Education through the Integrated Postsecondary Educational Data System (IPEDS).
The occupational categories reported by universities were revised beginning fall 2012. Many of the current occupational categories can't be directly compared to those used in previous years.
2This occupational category includes faculty from each academic college/school and Breathitt Veterinary Center faculty. It doesn't include faculty who primarily serve an
administrative role (deans, provost, etc.), who primarily teach pre-college-level courses (Community College), or who primarily serve an educational support or public service role (TES and TQI faculty).
Full-Time Faculty and Staff by Occupational Category1, Gender, and Race-Ethnicity
Fall 2017
Race and Ethnicity
Nonresident Alien
Hispanic or Latino
American Indian or
Alaska Native
Asian Black or African
American
Native Hawaiian or
other Pacific Islander
White Two or
More Races
Unknown TOTAL
# % # % # % # % # % # % # % # % # % #
FACULTY & STAFF 40 3 10 1 7 1 31 2 65 5 1 0 1136 86 9 1 29 2 1328
Women 15 2 6 1 3 0 10 1 32 5 1 0 604 87 4 1 17 2 692
Men 25 4 4 1 4 1 21 3 37 6 0 0 532 83 5 1 12 2 640
Instructional/Research Faculty2 35 8 5 1 2 0 22 5 16 4 1 0 368 81 4 1 4 1 457
Women 14 7 3 1 0 8 4 9 4 1 0 173 82 1 0 3 1 212
Men 21 9 2 1 2 1 14 6 7 3 0 195 80 3 1 1 0 245
Library faculty 0 0 0 0 0 0 2 22 0 0 0 0 7 78 0 0 0 0 9
Women 0 0 0 0 0 0 0 0 0 0 0 0 6 100 0 0 0 0 6
Men 0 0 0 0 0 0 2 67 0 0 0 0 1 33 0 0 0 0 3
Research 0 0 0 0 0 0 0 0 0 0 0 0 1 100 0 0 0 0 1
Women 0 0 0 0 0 0 0 0 0 0 0 0 0 0 0 0 0 0 0
Men 0 0 0 0 0 0 0 0 0 0 0 0 1 0 0 0 0 0 1
Library Technicians 0 0 0 0 0 0 0 0 1 10 0 0 8 80 0 0 1 10 10
Women 0 0 0 0 0 0 0 0 1 14 0 0 5 71 0 0 1 14 7
Men 0 0 0 0 0 0 0 0 0 0 0 0 3 100 0 0 0 0 3
Other Teachers; Student & Education Services 0 0 1 2 0 0 0 0 8 13 0 0 49 77 0 0 6 9 64
Women 0 0 1 2 0 0 0 0 6 12 0 0 38 76 0 0 5 10 50
Men 0 0 0 0 0 0 0 0 2 14 0 0 11 79 0 0 1 7 14
Management, Administration 0 0 0 0 0 0 1 2 4 7 0 0 53 88 1 2 1 2 60
Women 0 0 0 0 0 0 0 0 2 7 0 0 25 86 1 3 1 3 29
Men 0 0 0 0 0 0 1 3 2 6 0 0 28 90 0 0 0 0 31
Business and Financial Operations 1 1 0 0 0 0 1 1 0 0 0 0 81 98 0 0 0 0 83
Women 1 2 0 0 0 0 1 2 2 3 0 0 57 93 0 0 0 0 61
Men 0 0 0 0 0 0 0 0 1 4 0 0 24 96 0 0 0 0 25

58
FULL-TIME FACULTY AND STAFF BY CATEGORY 1, GENDER AND RACE
1The occupational categories included in this table are the same categories reported to the U.S. Department of Education through the Integrated Postsecondary Educational Data System (IPEDS).
The occupational categories reported by universities were revised beginning fall 2012. Many of the current occupational categories can't be directly compared to those used in previous years.
Full-Time Faculty and Staff by Occupational Category1, Gender, and Race-Ethnicity
Fall 2017
Race and Ethnicity
Nonresident Alien
Hispanic or Latino
American Indian or
Alaska Native
Asian Black or African
American
Native Hawaiian or
other Pacific Islander
White Two or
More Races
Unknown TOTAL
# % # % # % # % # % # % # % # % # % #
Computer, Engineering, Science Occupations 0 0 1 2 0 0 3 5 1 2 0 0 55 89 0 0 2 3 62
Women 0 0 0 0 0 0 0 0 0 0 0 0 16 100 0 0 0 0 16
Men 0 0 1 2 0 0 3 7 1 2 0 0 39 85 0 0 2 4 46
Community Service, Legal, Arts, Media 2 3 0 0 1 1 0 0 4 5 0 0 68 86 0 0 4 5 79
Women 0 0 0 0 1 3 0 0 0 0 0 0 32 91 0 0 2 6 35
Men 2 5 0 0 0 0 0 0 4 9 0 0 36 82 0 0 2 5 44
Healthcare Practitioners & Technical Occupation 0 0 0 0 0 0 0 0 3 11 0 0 24 86 0 0 1 4 28
Women 0 0 0 0 0 0 0 0 2 9 0 0 20 87 0 0 1 4 23
Men 0 0 0 0 0 0 0 0 1 20 0 0 4 80 0 0 0 0 5
Service 2 1 0 0 2 1 2 1 14 8 0 0 155 87 2 1 2 1 179
Women 0 0 0 0 0 0 1 2 2 3 0 0 62 94 1 2 0 0 66
Men 2 2 0 0 2 2 1 1 12 11 0 0 93 82 1 1 2 2 113
Sales, Sales Related 0 0 0 0 1 6 0 0 0 0 0 0 17 94 0 0 0 0 18
Women 0 0 0 0 1 6 0 0 0 0 0 0 14 88 0 0 0 0 15
Men 0 0 0 0 0 0 0 0 0 0 0 0 3 100 0 0 0 0 3
Office Administrative Support 0 0 2 1 1 1 0 0 8 4 0 0 174 91 1 1 5 3 191
Women 0 0 2 1 1 1 0 0 7 4 0 0 154 91 1 1 4 2 169
Men 0 0 0 0 0 0 0 0 1 5 0 0 20 91 0 0 1 5 22
Natural Resources, Construction, Maintenance 0 0 1 1 0 0 0 0 4 6 0 0 59 87 1 1 3 4 68
Women 0 0 0 0 0 0 0 0 0 0 0 0 0 0 0 0 0 0 0
Men 0 0 1 1 0 0 0 0 4 6 0 0 59 87 1 1 3 4 68
Production, Transportation, Materials Moving 0 0 0 0 0 0 0 0 2 11 0 0 17 89 0 0 0 0 19
Women 0 0 0 0 0 0 0 0 0 0 0 0 2 100 0 0 0 0 2
Men 0 0 0 0 0 0 0 0 2 12 0 0 15 88 0 0 0 0 17

59
PART-TIME FACULTY AND STAFF BY CATEGORY 1, GENDER AND RACE
1The occupational categories included in this table are the same categories reported to the U.S. Department of Education through the Integrated Postsecondary Educational Data System (IPEDS).
The occupational categories reported by universities were revised beginning fall 2012. Many of the current occupational categories can't be directly compared to those used in previous years.
2This occupational category includes faculty from each academic college/school and Breathitt Veterinary Center faculty. It doesn't include faculty who primarily serve an
administrative role (deans, provost, etc.), who primarily teach pre-college-level courses (Community College), or who primarily serve an educational support or public service role (TES and TQI faculty).
Part-Time Faculty and Staff by Occupational Category1, Gender, and Race-Ethnicity
Fall 2017
Race and Ethnicity
Nonresident Alien
Hispanic or Latino
American Indian or
Alaska Native
Asian Black or African
American
Native Hawaiian or
other Pacific Islander
White Two or
More Races
Unknown TOTAL
# % # % # % # % # % # % # % # % # % #
FACULTY & STAFF2 2 1 2 1 1 0 5 2 13 4 0 0 253 82 1 0 32 10 309
Women 2 1 1 0 0 0 2 1 13 6 0 0 171 83 1 0 17 8 207
Men 0 0 1 1 1 1 3 3 0 0 0 0 82 80 0 0 15 15 102
Instructional/Research Faculty2 2 1 2 1 1 0 5 2 5 2 0 0 178 82 0 0 25 11 218
Women 2 2 1 1 0 0 2 2 5 4 0 0 105 82 0 0 13 10 128
Men 0 0 1 1 1 1 3 3 0 0 0 0 73 81 0 0 12 13 90
Other Teachers; Student & Education Services 0 0 0 0 0 0 0 0 0 0 0 0 0 0 0 0 0 0 0
Women 0 0 0 0 0 0 0 0 0 0 0 0 0 0 0 0 0 0 0
Men 0 0 0 0 0 0 0 0 0 0 0 0 0 0 0 0 0 0 0
Management, Administration 0 0 0 0 0 0 0 0 0 0 0 0 0 0 0 0 0 0 0
Women 0 0 0 0 0 0 0 0 0 0 0 0 0 0 0 0 0 0 0
Men 0 0 0 0 0 0 0 0 0 0 0 0 0 0 0 0 0 0 0
Business and Financial Operations 0 0 0 0 0 0 0 0 0 0 0 0 2 100 0 0 0 0 2
Women 0 0 0 0 0 0 0 0 0 0 0 0 1 100 0 0 0 0 1
Men 0 0 0 0 0 0 0 0 0 0 0 0 1 100 0 0 0 0 1
Computer, Engineering, Science Occupations 0 0 0 0 0 0 0 0 0 0 0 0 1 100 0 0 0 0 1
Women 0 0 0 0 0 0 0 0 0 0 0 0 1 100 0 0 0 0 1
Men 0 0 0 0 0 0 0 0 0 0 0 0 0 0 0 0 0 0 0
Community Service, Legal, Arts, Media 0 0 0 0 0 0 0 0 7 11 0 0 57 86 1 2 1 2 66
Women 0 0 0 0 0 0 0 0 7 11 0 0 52 85 1 2 1 2 61
Men 0 0 0 0 0 0 0 0 0 0 0 0 5 100 0 0 0 0 5
Healthcare Practitioners & Technical Occupation 0 0 0 0 0 0 0 0 0 0 0 0 3 100 0 0 0 0 3
Women 0 0 0 0 0 0 0 0 0 0 0 0 1 100 0 0 0 0 1
Men 0 0 0 0 0 0 0 0 0 0 0 0 2 100 0 0 0 0 2

60
PART-TIME FACULTY AND STAFF BY CATEGORY 1, GENDER AND RACE
1The occupational categories included in this table are the same categories reported to the U.S. Department of Education through the Integrated Postsecondary Educational Data System (IPEDS).
The occupational categories reported by universities were revised beginning fall 2012. Many of the current occupational categories can't be directly compared to those used in previous years.
Part-Time Faculty and Staff by Occupational Category1, Gender, and Race-Ethnicity
Fall 2017
Race and Ethnicity
Nonresident Alien
Hispanic or Latino
American Indian or
Alaska Native
Asian Black or African
American
Native Hawaiian or
other Pacific Islander
White Two or
More Races
Unknown TOTAL
# % # % # % # % # % # % # % # % # % #
Service 0 0 0 0 0 0 0 0 1 10 0 0 3 30 0 0 6 60 10
Women 0 0 0 0 0 0 0 0 1 14 0 0 3 43 0 0 3 43 7
Men 0 0 0 0 0 0 0 0 0 0 0 0 0 0 0 0 3 100 3
Office Administrative Support 0 0 0 0 0 0 0 0 0 0 0 0 9 100 0 0 0 0 9
Women 0 0 0 0 0 0 0 0 0 0 0 0 8 100 0 0 0 0 8
Men 0 0 0 0 0 0 0 0 0 0 0 0 1 100 0 0 0 0 1
Graduate Assistants 21 25 1 1 1 1 1 1 4 5 0 0 56 66 1 1 2 2 85
Women 10 18 1 2 0 0 1 2 3 5 0 0 37 70 1 2 0 0 55
Men 11 37 0 0 0 0 0 0 1 3 0 0 18 60 0 0 0 0 30

61
FULL-TIME FACULTY BY GENDER, RACE
1.Includes instructional/research and library faculty. Does not include faculty who primarily serve an administrative role (deans, provost, etc.), who primarily
teach pre-college-level courses (Community College), or who primarily serve an educational support or public service role (TES and TQI faculty).
2.Not Hispanic or Latino
FULL-TIME FACULTY1 BY GENDER AND RACE-ETHNICITY
Race/Ethnicity Fall 2015 Fall 2016 Fall 2017
Female Male Total Female Male Total Female Male Total
American Indian or Alaskan Native2 — 3 3 — 2 2 0 2 2
Asian2 10 15 25 9 15 24 8 14 22
Black or African American2 9 8 17 8 8 16 9 7 16
Hispanic or Latino, any race 3 2 5 4 2 6 3 2 5
Native Hawaiian or other Pacific Islander2 1 0 1 1 0 1 1 0 1
Nonresident alien 12 21 33 12 22 34 13 21 34
Two or More Races2 2 2 4 1 2 3 1 3 4
White2 162 212 374 175 192 367 173 195 368
Unknown/Not Reported 2 1 3 0 1 1 3 1 4
Grand Total 201 264 465 210 244 454 211 245 456
62
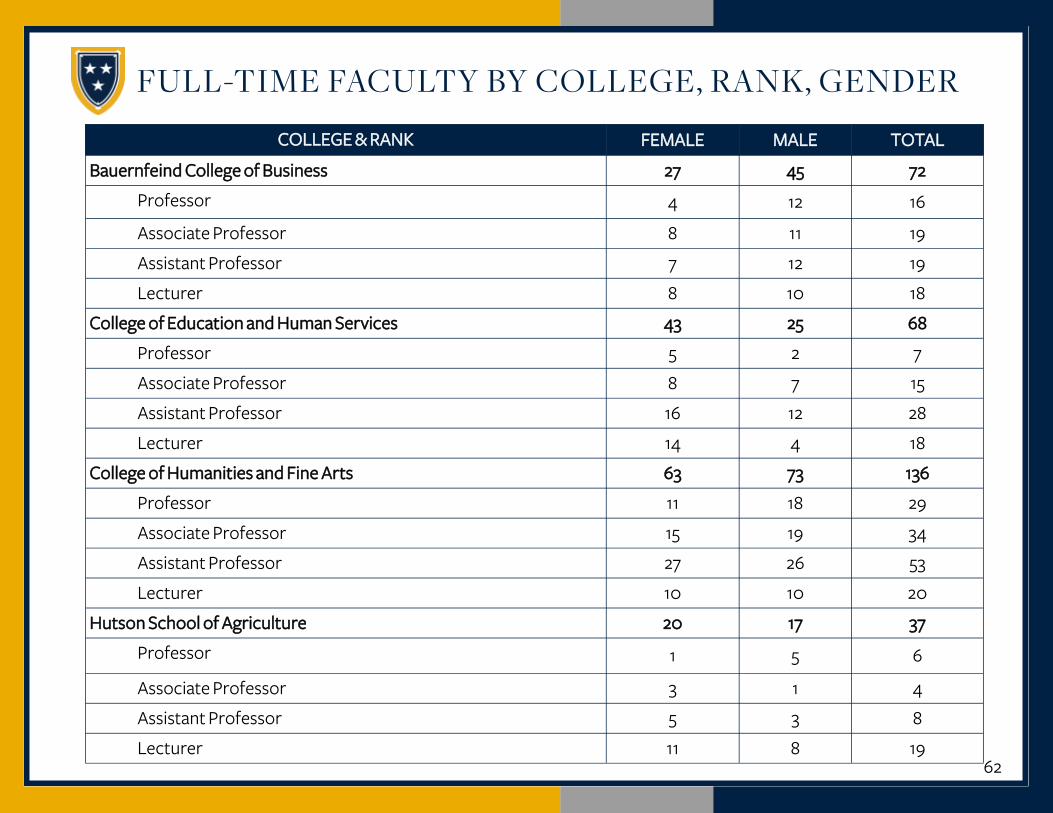
FULL-TIME FACULTY BY COLLEGE, RANK, GENDER
COLLEGE & RANK FEMALE MALE TOTAL
Bauernfeind College of Business 27 45 72
Professor 4 12 16
Associate Professor 8 11 19
Assistant Professor 7 12 19
Lecturer 8 10 18
College of Education and Human Services 43 25 68
Professor 5 2 7
Associate Professor 8 7 15
Assistant Professor 16 12 28
Lecturer 14 4 18
College of Humanities and Fine Arts 63 73 136
Professor 11 18 29
Associate Professor 15 19 34
Assistant Professor 27 26 53
Lecturer 10 10 20
Hutson School of Agriculture 20 17 37
Professor 1 5 6
Associate Professor 3 1 4
Assistant Professor 5 3 8
Lecturer 11 8 19

63
FULL-TIME FACULTY BY COLLEGE, RANK, GENDER
COLLEGE & RANK FEMALE MALE TOTAL
Jones College of Science, Engineering and Technology 33 80 113
Professor 7 21 28
Associate Professor 4 28 32
Assistant Professor 11 18 29
Lecturer 11 13 24
School of Nursing and Health Professions 25 4 29
Professor 2 2 4
Associate Professor 2 0 2
Assistant Professor 11 1 12
Lecturer 10 1 11
Honors College 0 1 1
Professor 0 1 1
GRAND TOTAL 211 245 456

64
FULL-TIME FACULTY BY COLLEGE, RANK, TENURE
COLLEGE & RANK NOT ON
TENURE TRACK
ON TENURE
TRACK TENURED TOTAL
Bauernfeind College of Business 17 20 35 72
Professor 0 0 16 16
Associate Professor 0 1 18 19
Assistant Professor 0 18 1 19
Lecturer 17 1 0 18
College of Education and Human Services 18 25 25 68
Professor 0 0 7 7
Associate Professor 0 0 15 15
Assistant Professor 1 24 3 28
Lecturer 17 1 0 18
College of Humanities and Fine Arts 22 51 63 136
Professor 1 1 27 29
Associate Professor 0 0 34 34
Assistant Professor 3 48 2 53
Lecturer 18 2 0 20

65
FULL-TIME FACULTY BY COLLEGE, RANK, TENURE
COLLEGE & RANK NOT ON
TENURE TRACK
ON TENURE
TRACK TENURED TOTAL
Hutson School of Agriculture 21 5 11 37
Professor 0 0 6 6
Associate Professor 0 0 4 4
Assistant Professor 2 5 1 8
Lecturer 19 0 0 19
Jones College of Science, Engineering and Technology 25 28 60 113
Professor 0 1 27 28
Associate Professor 0 3 29 32
Assistant Professor 2 23 4 29
Lecturer 23 1 0 24
School of Nursing and Health Professions 10 11 8 29
Professor 0 0 4 4
Associate Professor 0 0 2 2
Assistant Professor 0 10 2 12
Lecturer 10 1 0 11
Honors College 0 0 1 1
Professor 0 0 1 1
GRAND TOTAL 113 140 203 456

66
SALARY INCREASES Fiscal Employment Total % Satisfactory
Year Group Increase Other Performance Merit
2017-18
Faculty
Exempt
Non-Exempt (hourly)
2016-17 1.00% Comp Study*
Faculty 1.00% 0.00%
Exempt 1.00% 0.00%
Non-Exempt (hourly) 1.00% 0.00%
* Year one of a three year adjustment for the non-exempt compensation study was implemented with
some non-exempt wages increased based on a diminishing wage scale adjustment.
2015-16 *1% - 1.5%
Faculty 1.00% 0.00%
Exempt 1.00% 0.00%
Non-Exempt (hourly) 1.00% 0.00%
* A 1.5% increase on base salary up to $25,000 and 1% on base salary above $25,000

67
FACULTY AND STAFF AWARDS
Alumni Association Distinguished Professor (established 1964) | Susan Edington
Recipients are recognized for teaching excellence and classroom performance, concern for students, professional activity, and
recognition/service to the university and community.
Note: Award honorees for the 2016-2017 academic year are listed above. For a list of honorees in previous years, please see fact books from previous years, or contact the award sponsor.
Alumni Association Distinguished Researcher (established 2002) | Randall Black
Recipients are recognized for teaching excellence and classroom performance, concern for students, professional activity, and
recognition/service to the university and community.
Alumni Association Emerging Scholar (established 2008) | Urmi Engineer| Gary ZeRuth
Recipients are faculty members in the early phases of their careers who show professional promise. They are recognized for su-
perior research, scholarly, or creative work.
Distinguished Mentor (established 2009) | Yoko Hatakeyama
An effective mentor serves as an advisor, teacher, advocate, sponsor, and role model. The Office of the Provost and Vice Presi-
dent for Academic Affairs, in conjunction with the Office of Undergraduate Research and Scholarly Activity, present this award
to recognize the efforts and accomplishments of fulltime faculty who serve as outstanding mentors.
Faculty Distinguished Service Award (established 2013) |
This award was established by the Office of the Provost and Vice President for Academic Affairs to recognize faculty members
whose professional life has been characterized by a commitment to service activities that have had a significant, positive, impact
on the University and community.

68
FACULTY AND STAFF AWARDS
President’s Award for Diversity and Inclusion (established 2010) | Update coming soon
The President’s Award for Diversity and Inclusion is presented in recognition of extraordinary efforts by faculty, staff, and students who
foster success for historically underrepresented populations, work through a lens of appreciation for diversity, and advance an inclusive
community for all. [From 2010 through 2013, one award was given annually to a faculty or exempt (salaried) staff member. Beginning 2014,
the award is presented to one faculty/exempt staff member, one non-exempt (hourly) staff member, and one student.]
Presidential Research Fellow (established 1992) | Juyoung Song
The Presidential Research Fellowship is awarded by the Research Policy Committee. This award may be presented to full-time faculty, staff,
or administration members engaged in research, scholarly, or creative activity resulting in a significant contribution to his/her professional
field.
Sandra Flynn Professor of the Year (established 2002) | Update coming soon
Murray State international students elect a professor each year who has shown outstanding support both in and outside the classroom.
Note: Award honorees for the 2016-2017 academic year are listed above. For a list of honorees in previous years, please see fact books from previous years, or contact the award sponsor.

69
FACULTY AND STAFF AWARDS
Max. G. Carman Outstanding Teacher Award (established 1974) | Update coming soon
The Max G. Carman Outstanding Teacher Award was created by the Student Government Association to honor a faculty
member who has established a record of teaching excellence.
Note: Award honorees for the 2016-2017 academic year are listed above. For a list of honorees in previous years, please see fact books from previous years, or contact the award sponsor.
Outstanding Research Award (established 2013) Update coming soon
Recipients are recognized for outstanding contributions in research, scholarly, or creative activity during the previous calendar year.
Kern Alexander Book Award (established 2001 ) | J . David Wilson
The Kern Alexander Book Award is awarded to an individual who has contributed significantly to the development and growth of
the residential college system.
Omicron Delta Kapa Faculty Advisor of the Year (established 2009) | Bassam H. Atieh
The Offices of Student Affairs and Omicron Delta Kappa developed this award to honor one faculty advisor who has gone above
and beyond his/her job requirements to serve as an Outstanding Faculty Advisor and the impact they made on college students.

70
FACULTY AND STAFF AWARDS
Regents’ Awards for Teaching Excellence (established 1985) Update coming soon
This award was established to honor faculty members who, in the judgment of peers, deserve recognition as exemplary teachers.
Note: Award honorees for the 2016-2017 academic year are listed above. For a list of honorees in previous years, please see fact books from previous years, or contact the award sponsor.
Staff Excellence Awards (established 1986)
This award was established by the MSU Staff Congress to recognize outstanding staff members and to promote an understanding and
appreciation of the contributions made by staff to the mission of Murray State University.
At Large
Misty Williams
Jason Youngblood
Executive/ Managerial
Angie Trezepacz
Maria Rosa
Secretarial/ Clerical
Mary Ann Gardner
Rhonda Timmons
Facilities Management/ General
Paul Gann
Jacks Smith

71
GRADUATION INFORMATION

72
RETENTION RATES

73
RETENTION RATES

74
GRADUATION RATES
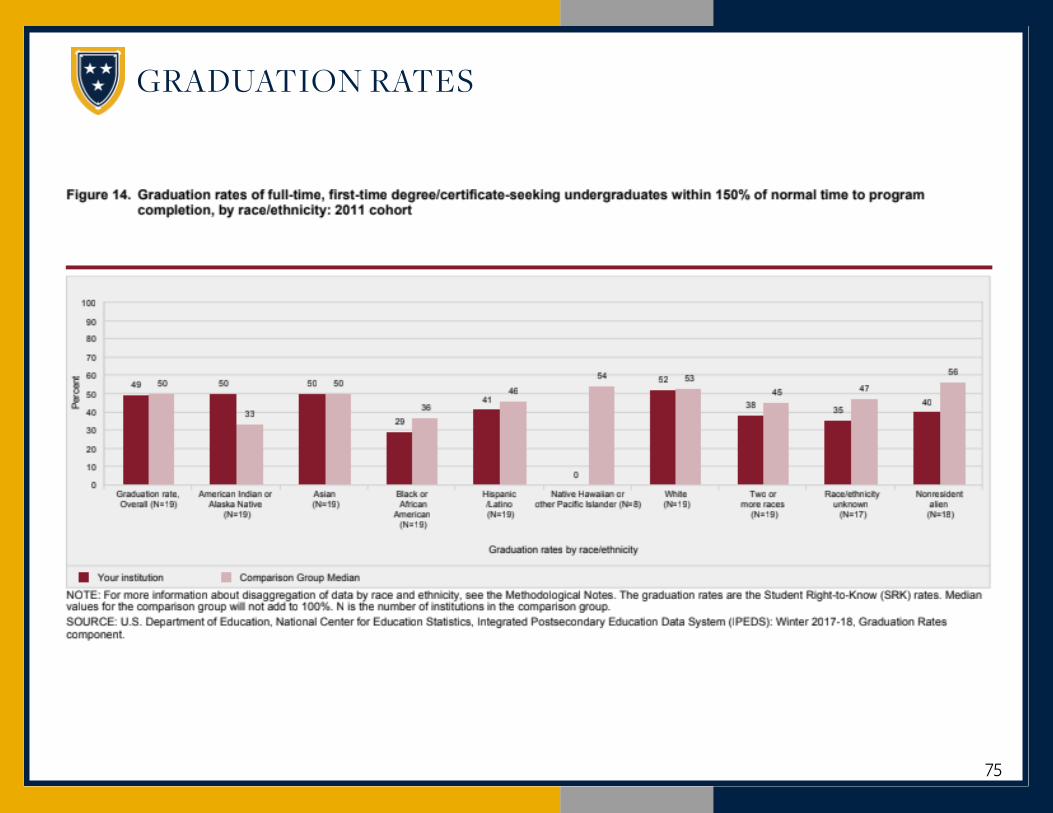
75
GRADUATION RATES

76
STUDENT ATHLETE GRADUATION RATES
1Six-year graduation rate = percentage of students who graduated by the end of August, six years after first enrolling as freshmen 2Cohort year = Student's first fall semester of college. 3Cohort = New, full-time, degree-seeking freshmen who were student athletes receiving aid.

77
STUDENT ATHLETE GRADUATION RATES BY SPORT AND GENDER
Cohort Year2 2009 2010 2011
Graduated by August 31 of
2015 2016 2017
Cohort3 Graduated Graduation Rate Cohort3 Graduated Graduation Rate Cohort3 Graduated Graduation Rate
Men 20 9 45.0% 22 13 59.1% 20 10 50.0%
Football 8 3 37.5% 13 7 53.8% 8 5 62.5%
Basketball 3 0 0.0% 2 0 0.0% 4 0 0.0%
Baseball 7 4 57.1% 3 3 100.0% 3 3 100.0%
Other Sports 2 2 100% 4 3 75% 5 2 40%
Women 33 19 57.6% 16 9 56.3% 39 27 69.2%
Basketball 8 6 75.0% 2 1 50.0% 4 1 25.0%
Cross-Country/Track
3 1 33.3% 4 1 25.0% 12 11 91.7%
Other Sports 22 12 54.5% 10 7 70.0% 23 15 65.2%
1Six-year graduation rate = percentage of students who graduated by the end of August, six years after first enrolling as freshmen 2Cohort year = Student's first fall semester of college. 3Cohort = New, full-time, degree-seeking freshmen who were student athletes receiving aid.

78
ALUMNI AFFAIRS

79
ALUMNI ASSOCIATION
Mission
The Murray State University Alumni Association connects, celebrates, and engages alumni and friends of Murray State through communi-cation, activities and events to foster lifelong relationships that support the mission and strategic plan of the university.
Vision
The Murray State University Alumni Association will be recognized internationally for excellence in alumni engagement through communi-cation, activities and events and for collaborating with other university units to produce more effective student recruitment, donor solici-tation and stewardship, and legislative advocacy.
History
The Murray State Normal and Teachers College Alumni Association was organized June 1, 1926 during a meeting in Wells Hall immediately following the commencement of the first graduating class of 16 in the Little Chapel. Since that first graduation ceremony well over 75,000 students have earned degrees from this institution.
The Association was established to provide an opportunity for graduates, former students, faculty, staff, and members of the governing board of the institution to coordinate their efforts on behalf of Murray State. To that end, scholarships have been awarded by the Alumni Association since 1941.
The Murray State University Alumni Association is a dues-based membership organization that supports integral programming designed to advance the mission of the University and creating meaningful connections among alumni.

80
MURRAY STATE UNIVERSITY FOUNDATION
The Foundation
The Murray State University Foundation was established in 1946 to "do and perform all things necessary for the development, growth, ex-pansion, progress, the accomplishment of educational objectives, the development of the physical plant, the improvement of the faculty, and aid to the student body and alumni of Murray State University." A Kentucky non-profit 501 (C)(3) corporation that is separate and not affiliated with the University, the Murray State University Foundation serves as the umbrella organization for accepting private support to the University.
The business policies, procedures, and goals of the Foundation are established by a 30-member Board of Trustees including the President of Murray State University, two members of the faculty or staff, and a minimum of two alumni of the University.
The duties and responsibilities of the Murray State University Foundation include the administration of scholarship funds, endowments, and other contributions that are established through private support. The Foundation manages planned, current, and deferred gifts. Gift arrangements through trusts, annuities, bequests, and insurance policies account for numerous endowments which fund scholarships and other educational programs. The Foundation staff ensure that the stated objectives of the donor are met, currently managing over 800 scholarships and endowment accounts.
Contributions received by the Murray State University Foundation are administered by the Joint Investments Committee. The Joint Invest-ments Committee establishes the investment policy and supervises the portfolio of the Murray State University Foundation. The invest-ment pool is comprised of Foundation funds as well as funds held for the Alumni Association and Murray State University. The Joint Invest-ments Committee is composed of at least two members of the Murray State University Board of Regents, two members of the Alumni Council, and three members of the Board of Trustees.
The Foundation investment pool is in excess of $103 million, with total assets in excess of $124.2 million. (Investment Pool Average Rate of Return Summary) The Foundation provides more than $1.5 million in scholarship awards to deserving students annually.
Information about making donations may be obtained through the Murray State Office of Development web site. You may reach the Office of Development by phone at 877.282.0033.
The Murray State University Foundation, Inc. operates the Frances E. Miller Memorial Golf Course. A championship course, the par-71 layout was built on land donated in 1979 by L. D. Miller, a 1937 Murray State alumnus who died in 1992. The golf course is located three miles off highway 94 East on Highway 280 in Murray, Kentucky.

81
ALUMNI BY KENTUCKY COUNTY
Jackson Purchase Region
County Alumni Count
Ballard 558
Calloway 6264
Carlisle 314
Fulton 331
Graves 2997
Hickman 199
Marshall 2809
McCracken 5135
Pennyrile Region
County Alumni Count County Alumni Count
Adair 21 Livingston 474
Allen 40 Logan 213
Barren 57 Lyon 478
Breckinridge 126 Meade 85
Caldwell 787 Metcalfe 7
Casey 6 Monroe 8
Christian 2077 Pulaski 54
Clinton 7 Russell 15
Crittenden 375 Simpson 57
Cumberland 12 Taylor 40
Green 6 Todd 189
Hardin 331 Trigg 760
Hart 24 Warren 426
Hopkins 1846 Wayne 10
Larue 33
Western Coal Field
County Alumni Count
Butler 31
Daviess 1393
Edmonson 8
Grayson 77
Hancock 68
Henderson 1149
McLean 162
Muhlenberg 561
Ohio 116
Union 437
Webster 496

82
ALUMNI BY KENTUCKY COUNTY
Knobs Arc Region
County Alumni Count
Bullitt 174
Estill 2
Garrard 19
Lincoln 15
Madison 90
Marion 20
Nelson 123
Rockcastle 2
Bluegrass Region
County Alumni Count County Alumni Count
Anderson 87 Jessamine 78
Bath 2 Kenton 136
Boone 148 Lewis 4
Bourbon 26 Mason 18
Boyle 72 Mercer 40
Bracken 4 Nicholas 5
Campbell 97 Oldham 370
Carroll 9 Owen 9
Clark 38 Pendleton 9
Fayette 781 Robertson 1
Fleming 13 Scott 112
Franklin 283 Shelby 189
Gallatin 9 Spencer 53
Grant 19 Trimble 10
Henry 48 Washington 14
Harrison 25 Woodford 101
Jefferson 2886

83
ALUMNI BY KENTUCKY COUNTY
Eastern Coal Field Region
County Alumni Count County Alumni Count
Bell 7 Leslie 2
Boyd 2 Letcher 6
Breathitt 25 Magoffin 1
Carter 7 Martin 3
Clay 4 McCreary —
Elliott 1 Menifee 1
Floyd 8 Montgomery 21
Greenup 17 Morgan 2
Harlan 7 Owsley 1
Jackson 1 Perry 8
Johnson 7 Pike 10
Knott 4 Powell 2
Knox 2 Rowan 18
Laurel 24 Whitely 22
Lawrence 4 Wolfe 2
Lee 4
Unknown
3

84
ALUMNI BY STATE
North West Region
State Alumni Count
Idaho 68
Montana 48
Oregon 131
Washington 220
Wyoming 32
Armed Forces
Location Alumni Count
Africa, Canada, Europe, Middle East 41
Americas Except Canada 1
Pacific 12
Mid-West Region
State Alumni Count
Illinois 4,785
Indiana 2,507
Iowa 133
Kansas 169
Kentucky 38,309
Michigan 375
Minnesota 139
Missouri 2,367
Nebraska 56
North Dakota 13
Ohio 899
South Dakota 21
Wisconsin 169
South West Region
State Alumni Count
Arizona 333
Colorado 426
New Mexico 102
Oklahoma 167
Texas 1,581
Utah 72
West Region
State Alumni Count
California 875
Nevada 116
Other
Location Alumni Count
Alaska 56
District of Columbia 38
Guam 2
Hawaii 49
Puerto Rico 9
Virgin Islands 3
North East Region
State Alumni Count
Connecticut 91
Maine 36
Massachusetts 130
New Hampshire 43
Rhode Island 34
Vermont 20

85
ALUMNI BY STATE
South East Region
State Alumni Count
Arkansas 313
Louisiana 224
Tennessee 7,754
Alabama 853
Mississippi 339
Georgia 1,186
Florida 2,143
North Carolina 823
South Carolina 532
Mid-Atlantic Region
State Alumni Count
New York 603
New Jersey 385
Pennsylvania 365
Delaware 35
Maryland 329
West Virginia 90
Virginia 772

86
GRADUATION INFORMATION FACILITIES UNIVERSITY LIBRARIES

87
UNIVERSITY LIBRARIES
The Murray State University Libraries serve as the student-centered learning commons of the university community and as
a resource that bolsters the regional economy and culture. We provide traditional and evolving services, collections, in-
struction, and spaces to empower our diverse learners.
The University Libraries respond to the Murray State University’s Vision, Mission and Value Statements by:
Providing instruction in information, media and technological literacy skills using appropriate instruction methods and
tools to teach the university community how to find, assess and use information;
Supporting the curricular and research needs of the university community through continually acquiring, maintaining,
preserving and managing access to quality materials in varying formats, as determined by effective collection assess-
ment;
Adapting physical and virtual spaces to the changing technological and learning needs of the university community
through maintaining, and planning for new, responsive learning environments.
Measurement of instruction is operationalized using numbers of instruction sessions taught and research interactions
completed.
Instruction Sessions Taught 317 332 261
Participants in Instruction Sessions 7,914 7,331 5,601
Research Interactions 7,351 7,699 5,229

88
UNIVERSITY LIBRARIES
The University Libraries provide or have mediated access to the following collections:
Books 392,820 363,292 290,773
E-books 153,685 193,453 185,486
Print journal subscriptions 256 317 1,305
Electronic journal subscriptions 729 639 653
Database subscriptions 176 128 128
Media 34,020 11,399 12,706
Journal article purchases 1,094 1,463 812
Interlibrary loan borrowing requests 5,656 4,928 3,354
Interlibrary loan lending requests 3,094 1,588 1,255
In order to provide responsive learning environments, Waterfield Library (the main library) provides three different sound zones to meet the needs of the university community including a Quiet Study Floor. As part of the Learning Com-mons philosophy, Waterfield also incorporates several student-oriented services within the building itself. The Racer Writing Center and the Racer Oral Communication Center offer assistance with both individual appointments and group workshops. Two classrooms are available for instruction from both the library faculty and faculty from around campus. Starbooks coffee shop provides drinks and snacks for visitors to purchase.

89
FINANCIAL INFORMATION

90
BUDGET SUMMARY
For information regarding Murray State University financial information for the 2016-2017 academic
year, please click here.

91
GRANT AWARDS BY TYPE

92
GRANT AWARDS BY CATEGORY

93
TOP 10 FEDERAL AWARDING AGENCIES

94
Fact Book 2017-2018