facing the challenges of a greener future
TRANSCRIPT
1WaterRock Energy Economics
Facing the Challenges of a Greener FutureLiutong Zhang (Lucas), [email protected]
Director, WaterRock Energy Economics
Nov 23, 2020
To be replaced with another
ocean picture without the turtle
Prepared for UBS Virtual Asia Energy, Utilities, and Materials Conference 2020
2WaterRock Energy Economics
DISCLAIMER
This draft document is developed to facilitate and stimulate discussion. It may not have been reviewed, and may have
factual or other errors.
This document is not to be further reproduced or distributed without express permission from WaterRock Energy
Economics (HK) Limited.

3WaterRock Energy Economics
Agenda
1 Market Background
Key Challenges of the Wind and Solar Sector in China
Subsidy Payment Delay
(Lack of) Flexible Capacity
Wind and Solar Curtailment
Slow Progress of Market Mechanisms to Price CO2
Summary
2
3
2a
2b
2c
2d

4WaterRock Energy Economics
Market Background
The 2060 carbon neutrality target sets the direction for de-carbonization in the long term, but it may not affect power sector much in near- and medium-term
▪ President Xi Jinping UN Address on Sep 22, 2020
− CO2 emissions peak before 2030 and achieve carbon
neutrality before 2060
− “….. achieve a green recovery of the world economy in the
post-COVID era….”
▪ Non-fossil fuel mix targets in primary energy
consumption in 2014 under COP 21 Paris Agreement
− 2020: 15% [Actual non-fossil fuel mix is 9.4% in 2010
and15.3% in 2019]
− 2030: 20%
− Propose to peak CO2 emission around 2030 and make
efforts to peak earlier if possible.
0
2,000
4,000
6,000
8,000
10,000
12,000
14,000
16,000
199
0
199
2
199
4
199
6
199
8
200
0
200
2
200
4
200
6
200
8
201
0
201
2
201
4
201
6
201
8
202
0
202
2
202
4
202
6
202
8
203
0
203
2
203
4
203
6
203
8
204
0
204
2
204
4
204
6
204
8
205
0
205
2
205
4
205
6
205
8
206
0
CO2 Emission in China
Source: Climate Action Tracker, WaterRock Energy Research and Analysis
2030 2060
For 2030 target, new commitment is similar to what was announced in 2014.
For 2060 target, it is 40 years away and there are many trajectories to achieve same aim in 2030-2040
Typical forecast from
research institutes
and universities
Mt CO2e/annum
5WaterRock Energy Economics
0.32 2
11 914
3034
2318
25
22
1
4
19
21
12
13
0
10
20
30
40
50
60
2010 2011 2012 2013 2014 2015 2016 2017 2018 2019 2020E
Utility-scale solar Distributed solar
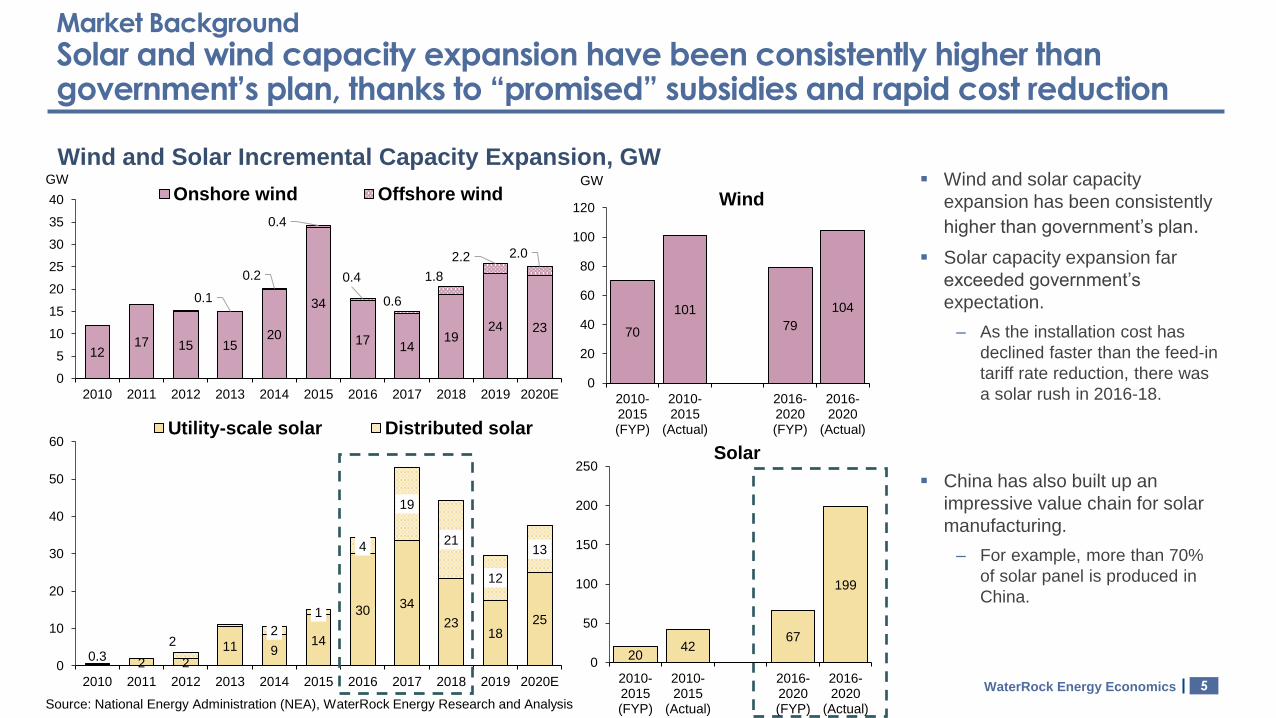
Market Background
Solar and wind capacity expansion have been consistently higher than government’s plan, thanks to “promised” subsidies and rapid cost reduction
Wind and Solar Incremental Capacity Expansion, GW▪ Wind and solar capacity
expansion has been consistently
higher than government’s plan.
▪ Solar capacity expansion far
exceeded government’s
expectation.
‒ As the installation cost has
declined faster than the feed-in
tariff rate reduction, there was
a solar rush in 2016-18.
▪ China has also built up an
impressive value chain for solar
manufacturing.
‒ For example, more than 70%
of solar panel is produced in
China.
Source: National Energy Administration (NEA), WaterRock Energy Research and Analysis
1217 15 15
20
34
1714
1924 23
0.1
0.2
0.4
0.4
0.6
1.8
2.2 2.0
0
5
10
15
20
25
30
35
40
2010 2011 2012 2013 2014 2015 2016 2017 2018 2019 2020E
Onshore wind Offshore windGW
70
101
79
104
0
20
40
60
80
100
120
2010-2015(FYP)
2010-2015
(Actual)
2016-2020(FYP)
2016-2020
(Actual)
GW
2042
67
199
0
50
100
150
200
250
2010-2015(FYP)
2010-2015
(Actual)
2016-2020(FYP)
2016-2020
(Actual)
Wind
Solar
6WaterRock Energy Economics
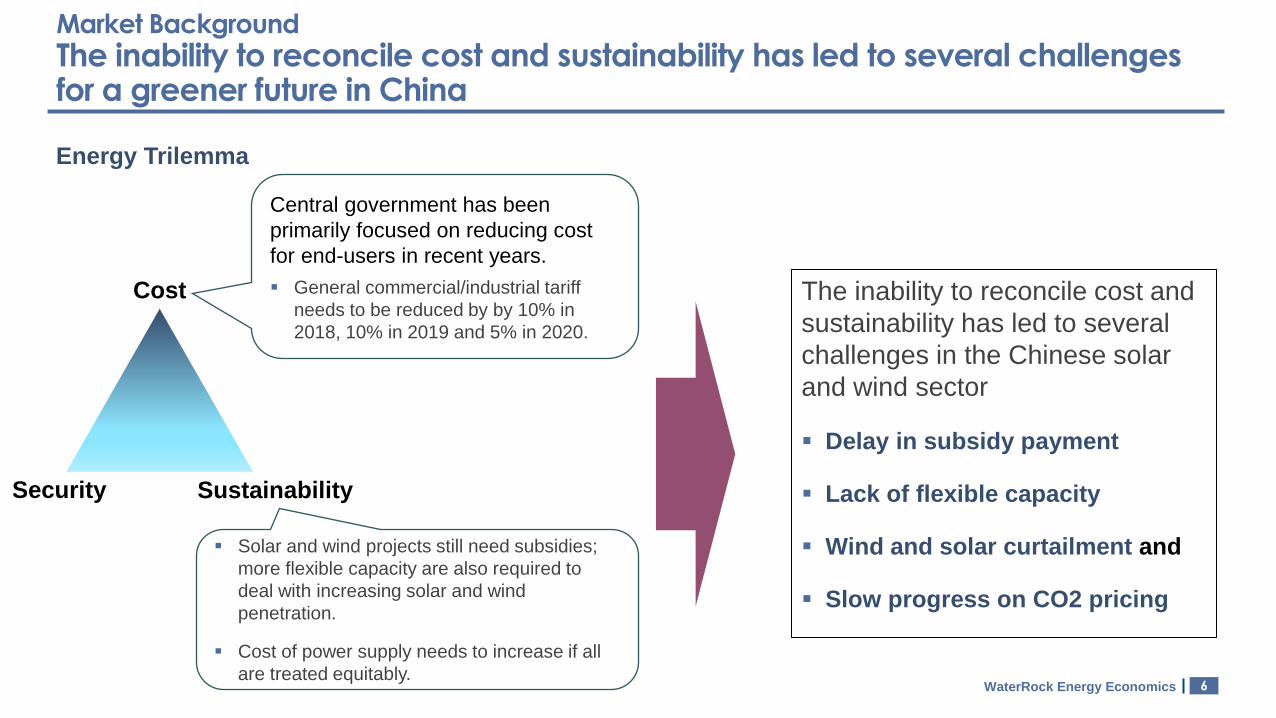
Market Background
The inability to reconcile cost and sustainability has led to several challenges for a greener future in China
The inability to reconcile cost and
sustainability has led to several
challenges in the Chinese solar
and wind sector
▪ Delay in subsidy payment
▪ Lack of flexible capacity
▪ Wind and solar curtailment and
▪ Slow progress on CO2 pricing
Energy Trilemma
Cost
Security Sustainability
Central government has been
primarily focused on reducing cost
for end-users in recent years.
▪ General commercial/industrial tariff
needs to be reduced by by 10% in
2018, 10% in 2019 and 5% in 2020.
▪ Solar and wind projects still need subsidies;
more flexible capacity are also required to
deal with increasing solar and wind
penetration.
▪ Cost of power supply needs to increase if all
are treated equitably.

7WaterRock Energy Economics
Agenda
1 Market Background
Key Challenges of the Wind and Solar Sector in China
Subsidy Payment Delay
(Lack of) Grid Flexibility
Wind and Solar Curtailment
Slow Progress of Market Mechanisms to Price CO2
Summary
2
3
2a
2b
2c
2d

8WaterRock Energy Economics
Issue (a): Subsidy Payment Delay
The subsidy component of the solar and wind farms are distributed to developers via the REDF, but it has delays of 3-5 years
Solar
Wind
Subsidy
Subsidy
On-grid
coal
tariff
On-grid
coal
tariff
▪ On-grid coal tariff (including de-NOx and de-SOx) is paid by the grid
companies each month, and there is no delay on the payment.
▪ The on-grid coal tariffs vary by provinces, ranging from 0.25-0.4
RMB/kWh.
▪ For some provinces (like Yunnan), part of the generation volume
is based on “market” tariff rather than on-grid coal tariff.
▪ The subsidy component is paid from the Renewable Energy
Development Fund (REDF), which is from the renewable
surcharge on end-users*.
▪ Fund from the REDF is paid to RE plants in “batches” based on their
commissioning date.
− A total of eight batches have been announced. The dispatch of the subsidy
payment has been opaque and irregular. Projects built after Feb 2016
have yet to receive their first payment.
Payment of FIT is split into two components
Note: Since Jan 1, 2019, tax authority has become the new entity for collection of renewable charge. This could help to improve the collection rate.
Source: NEA, China Electric Council (CEC), WaterRock Energy Research and Analysis
9WaterRock Energy Economics
0
50
100
150
200
250
300
Annual RE Funding (from RE surcharge)
Annual RE subsidy requirement
Cumulative RE funding deficit
0.000
0.005
0.010
0.015
0.020
0.025
0.030
0.035
0
100
200
300
400
500
600
700
800
Ju
n-0
6
Fe
b-0
7
Oct-
07
Ju
n-0
8
Fe
b-0
9
Oct-
09
Ju
n-1
0
Fe
b-1
1
Oct-
11
Ju
n-1
2
Fe
b-1
3
Oct-
13
Ju
n-1
4
Fe
b-1
5
Oct-
15
Ju
n-1
6
Fe
b-1
7
Oct-
17
Ju
n-1
8
Fe
b-1
9
Oct-
19
Ju
n-2
0
Avg Annual Wind Gen Avg Annual Solar Gen
RE Surcharge (RHS)
Renewable
surcharge 0.019
Issue (a): Subsidy Payment Delay
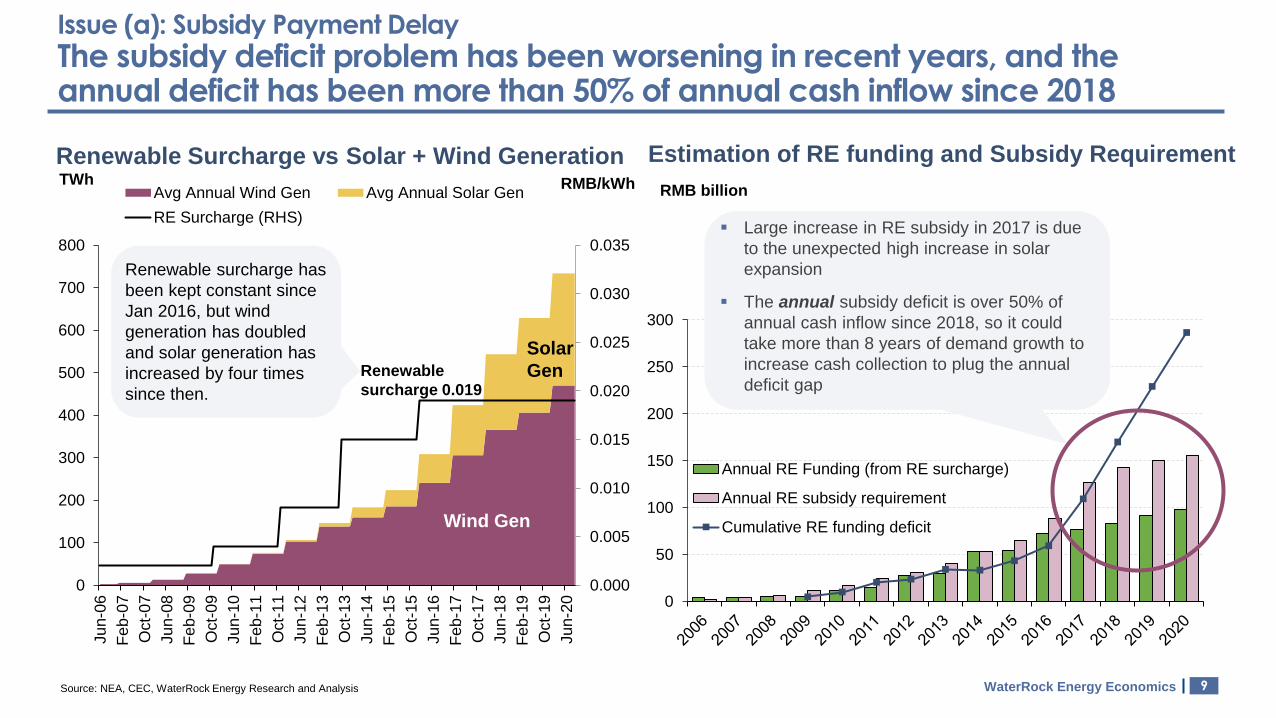
The subsidy deficit problem has been worsening in recent years, and the annual deficit has been more than 50% of annual cash inflow since 2018
RMB billion
Estimation of RE funding and Subsidy Requirement
▪ Large increase in RE subsidy in 2017 is due
to the unexpected high increase in solar
expansion
▪ The annual subsidy deficit is over 50% of
annual cash inflow since 2018, so it could
take more than 8 years of demand growth to
increase cash collection to plug the annual
deficit gap
Source: NEA, CEC, WaterRock Energy Research and Analysis
RMB/kWh
Renewable Surcharge vs Solar + Wind GenerationTWh
Wind Gen
Solar
Gen
Renewable surcharge has
been kept constant since
Jan 2016, but wind
generation has doubled
and solar generation has
increased by four times
since then.
10WaterRock Energy Economics
Issue (a): Subsidy Payment Delay
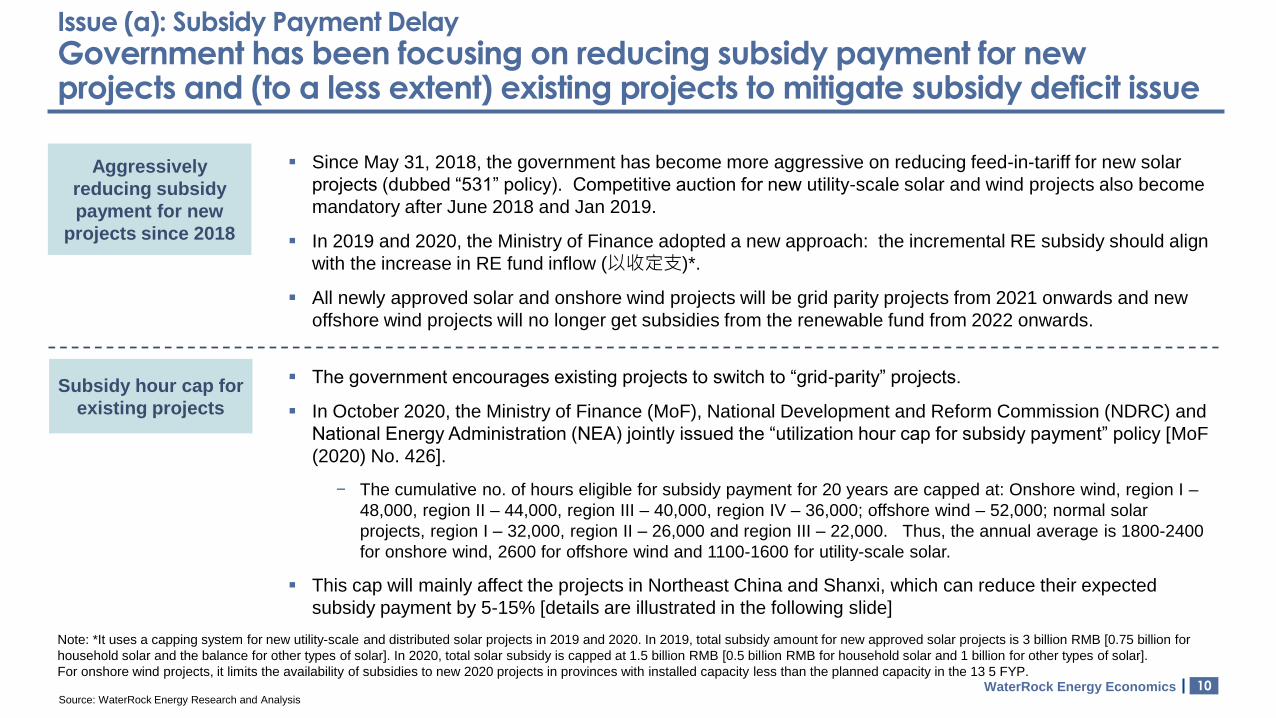
Government has been focusing on reducing subsidy payment for new projects and (to a less extent) existing projects to mitigate subsidy deficit issue
Aggressively
reducing subsidy
payment for new
projects since 2018
▪ Since May 31, 2018, the government has become more aggressive on reducing feed-in-tariff for new solar
projects (dubbed “531” policy). Competitive auction for new utility-scale solar and wind projects also become
mandatory after June 2018 and Jan 2019.
▪ In 2019 and 2020, the Ministry of Finance adopted a new approach: the incremental RE subsidy should align
with the increase in RE fund inflow (以收定支)*.
▪ All newly approved solar and onshore wind projects will be grid parity projects from 2021 onwards and new
offshore wind projects will no longer get subsidies from the renewable fund from 2022 onwards.
Subsidy hour cap for
existing projects
▪ The government encourages existing projects to switch to “grid-parity” projects.
▪ In October 2020, the Ministry of Finance (MoF), National Development and Reform Commission (NDRC) and
National Energy Administration (NEA) jointly issued the “utilization hour cap for subsidy payment” policy [MoF
(2020) No. 426].
− The cumulative no. of hours eligible for subsidy payment for 20 years are capped at: Onshore wind, region I –
48,000, region II – 44,000, region III – 40,000, region IV – 36,000; offshore wind – 52,000; normal solar
projects, region I – 32,000, region II – 26,000 and region III – 22,000. Thus, the annual average is 1800-2400
for onshore wind, 2600 for offshore wind and 1100-1600 for utility-scale solar.
▪ This cap will mainly affect the projects in Northeast China and Shanxi, which can reduce their expected
subsidy payment by 5-15% [details are illustrated in the following slide]
Note: *It uses a capping system for new utility-scale and distributed solar projects in 2019 and 2020. In 2019, total subsidy amount for new approved solar projects is 3 billion RMB [0.75 billion for
household solar and the balance for other types of solar]. In 2020, total solar subsidy is capped at 1.5 billion RMB [0.5 billion RMB for household solar and 1 billion for other types of solar].
For onshore wind projects, it limits the availability of subsidies to new 2020 projects in provinces with installed capacity less than the planned capacity in the 13 5 FYP.
Source: WaterRock Energy Research and Analysis
11WaterRock Energy Economics
0
200
400
600
800
1,000
1,200
1,400
1,600
1,800
Ningxia Gansu(Region Izones)
Xinjiang(Region Izones)
Gansu(Region II
zones)
Xinjiang(Region II
zones)
QinghaiHaixi
Qinghai(Region II
zones)
InnerMongolia(Region Izones)
InnerMongolia(Region II
zones)
Heilongjiang Jilin Hebei(Region II
zones)
Shanxi(Region II
zones)
Liaoning Shaanxi(Region II
zones)
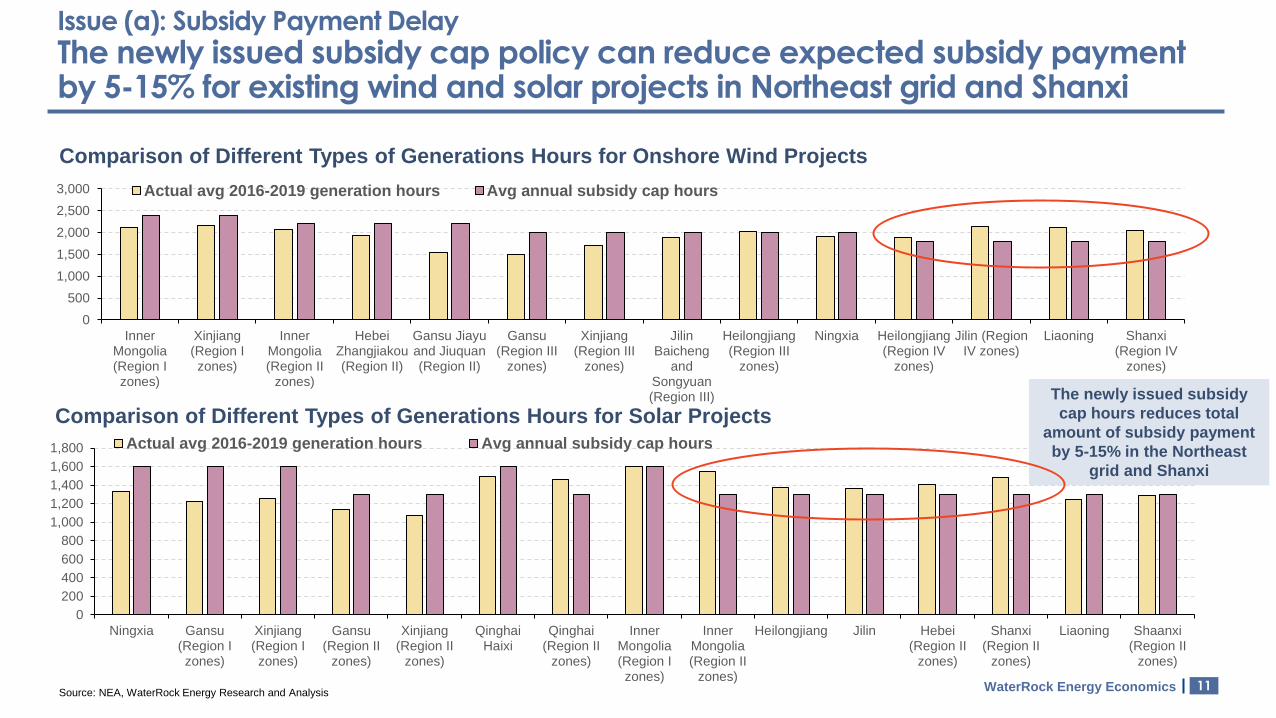
Actual avg 2016-2019 generation hours Avg annual subsidy cap hours
Issue (a): Subsidy Payment Delay
The newly issued subsidy cap policy can reduce expected subsidy payment by 5-15% for existing wind and solar projects in Northeast grid and Shanxi
0
500
1,000
1,500
2,000
2,500
3,000
InnerMongolia(Region Izones)
Xinjiang(Region Izones)
InnerMongolia(Region II
zones)
HebeiZhangjiakou(Region II)
Gansu Jiayuand Jiuquan(Region II)
Gansu(Region III
zones)
Xinjiang(Region III
zones)
JilinBaicheng
andSongyuan(Region III)
Heilongjiang(Region III
zones)
Ningxia Heilongjiang(Region IV
zones)
Jilin (RegionIV zones)
Liaoning Shanxi(Region IV
zones)
Actual avg 2016-2019 generation hours Avg annual subsidy cap hours
Comparison of Different Types of Generations Hours for Onshore Wind Projects
The newly issued subsidy
cap hours reduces total
amount of subsidy payment
by 5-15% in the Northeast
grid and Shanxi
Source: NEA, WaterRock Energy Research and Analysis
Comparison of Different Types of Generations Hours for Solar Projects

12WaterRock Energy Economics
Issue (a): Subsidy Payment Delay
There are no practical “easy” fixes to resolve the subsidy delay issue for existing RE projects
Increasing
renewable
surcharge
▪ There have been recurring calls to increase the renewable surcharge since 2017, but the government have
consistently said that it is not going to increase the surcharge.
− The most recent government statement is in an official letter from the Ministry of Finance (MoF) to the CEO of
one of the state-owned power companies (Huadian) released publicly on Oct 10, 2020*. MoF mentioned that
the time for increasing renewable surcharge is not right as the central government intends to reduce taxes
and power tariffs for the end-users.
Bond issue by the
grid companies
Unlikely in near-term
Note: * The detailed letter can be sourced from website http://bgt.mof.gov.cn/zhuantilanmu/rdwyh/tianbanli/2020lh/2020fwgk/202010/t20201010_3601101.htm .
Source: WaterRock Energy Research and Analysis
Diminishing possibility
▪ In Q3 2020, it was understood that the Chinese government is studying the possibility to ask the grid
companies to issue bond to get upfront capital to help mitigate/resolve the subsidy delay issue. Nonetheless,
there are practical implementation issues. We understand that this proposal is likely to be shelved.
▪ The government has officially mentioned that it encourages corporations to issue bond based on the subsidy
“receivables” on their own.
Other Potential
Sources of Revenues
Mostly speculative
▪ In the medium term, the government may be able to shift fund collection from the national carbon market to
the Renewable Energy Development Fund (REDF) to help plug the deficit.
▪ Some have called to shift tax or other surcharge collections of the RE generation to the REDF. MoF has
officially said that this option is not feasible.
The subsidy delay issue poses cash flow challenges for existing investors, especially for private solar
investors, and does reduce appetite for new capacity investment from private and foreign investors/lenders
13WaterRock Energy Economics
Issue (a): Subsidy Payment Delay
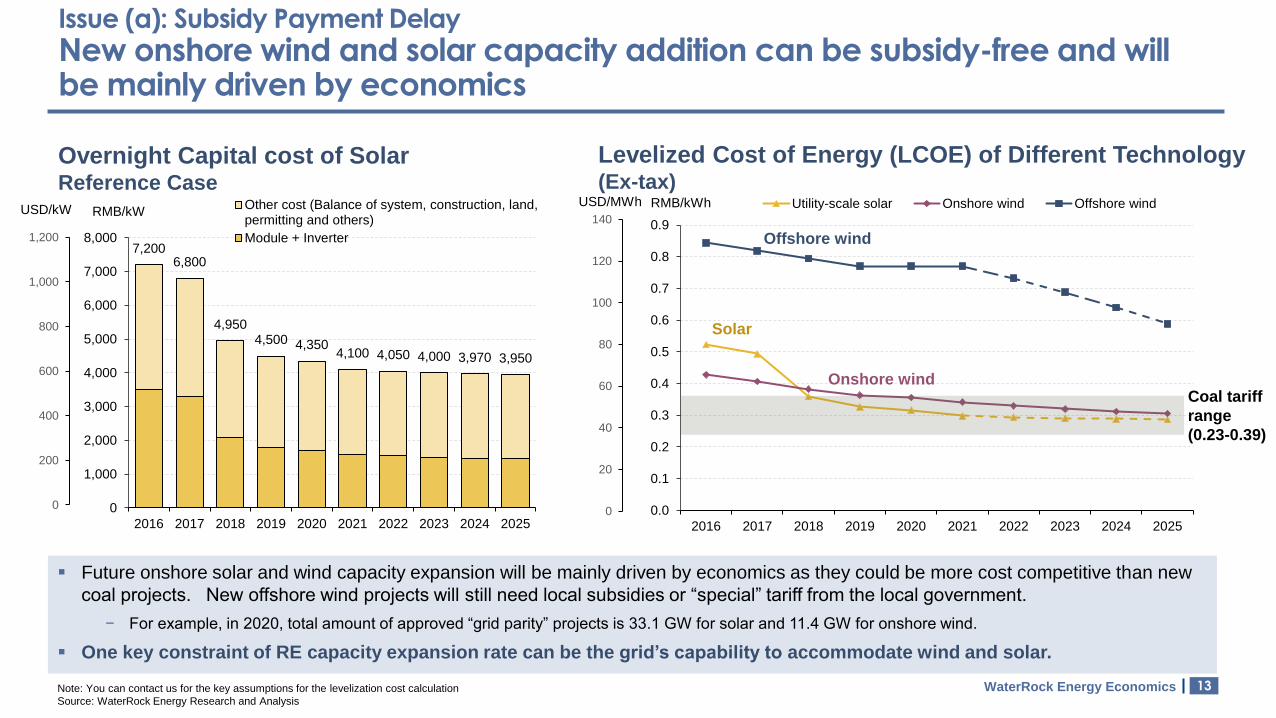
New onshore wind and solar capacity addition can be subsidy-free and will be mainly driven by economics
7,2006,800
4,9504,500 4,350
4,100 4,050 4,000 3,970 3,950
0
1,000
2,000
3,000
4,000
5,000
6,000
7,000
8,000
2016 2017 2018 2019 2020 2021 2022 2023 2024 2025
Other cost (Balance of system, construction, land,permitting and others)
Module + Inverter
RMB/kW
Overnight Capital cost of Solar Reference Case
0
200
400
600
800
1,000
1,200
USD/kW
Levelized Cost of Energy (LCOE) of Different Technology(Ex-tax)
0.0
0.1
0.2
0.3
0.4
0.5
0.6
0.7
0.8
0.9
2016 2017 2018 2019 2020 2021 2022 2023 2024 2025
Utility-scale solar Onshore wind Offshore wind
0
20
40
60
80
100
120
140
RMB/kWhUSD/MWh
Coal tariff
range
(0.23-0.39)
Solar
Onshore wind
Offshore wind
▪ Future onshore solar and wind capacity expansion will be mainly driven by economics as they could be more cost competitive than new
coal projects. New offshore wind projects will still need local subsidies or “special” tariff from the local government.
− For example, in 2020, total amount of approved “grid parity” projects is 33.1 GW for solar and 11.4 GW for onshore wind.
▪ One key constraint of RE capacity expansion rate can be the grid’s capability to accommodate wind and solar.
Note: You can contact us for the key assumptions for the levelization cost calculation
Source: WaterRock Energy Research and Analysis
14WaterRock Energy Economics
Agenda
1 Market Background
Key Challenges of the Wind and Solar Sector in China
Subsidy Payment Delay
(Lack of) Flexible Capacity
Wind and Solar Curtailment
Slow Progress of Market Mechanisms to Price CO2
Summary
2
3
2a
2b
2c
2d
15WaterRock Energy Economics
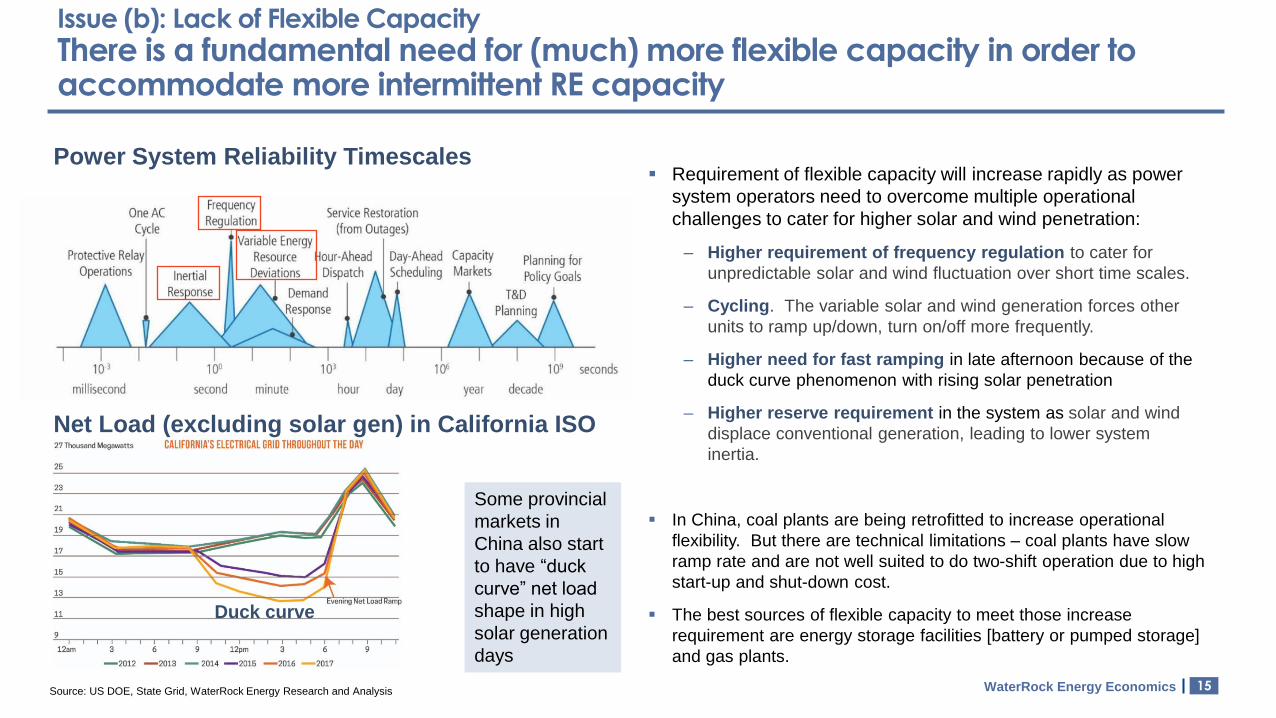
Issue (b): Lack of Flexible Capacity
There is a fundamental need for (much) more flexible capacity in order to accommodate more intermittent RE capacity
▪ Requirement of flexible capacity will increase rapidly as power
system operators need to overcome multiple operational
challenges to cater for higher solar and wind penetration:
‒ Higher requirement of frequency regulation to cater for
unpredictable solar and wind fluctuation over short time scales.
‒ Cycling. The variable solar and wind generation forces other
units to ramp up/down, turn on/off more frequently.
‒ Higher need for fast ramping in late afternoon because of the
duck curve phenomenon with rising solar penetration
‒ Higher reserve requirement in the system as solar and wind
displace conventional generation, leading to lower system
inertia.
▪ In China, coal plants are being retrofitted to increase operational
flexibility. But there are technical limitations – coal plants have slow
ramp rate and are not well suited to do two-shift operation due to high
start-up and shut-down cost.
▪ The best sources of flexible capacity to meet those increase
requirement are energy storage facilities [battery or pumped storage]
and gas plants.
Power System Reliability Timescales
Source: US DOE, State Grid, WaterRock Energy Research and Analysis
Net Load (excluding solar gen) in California ISO
Duck curve
Some provincial
markets in
China also start
to have “duck
curve” net load
shape in high
solar generation
days
16WaterRock Energy Economics
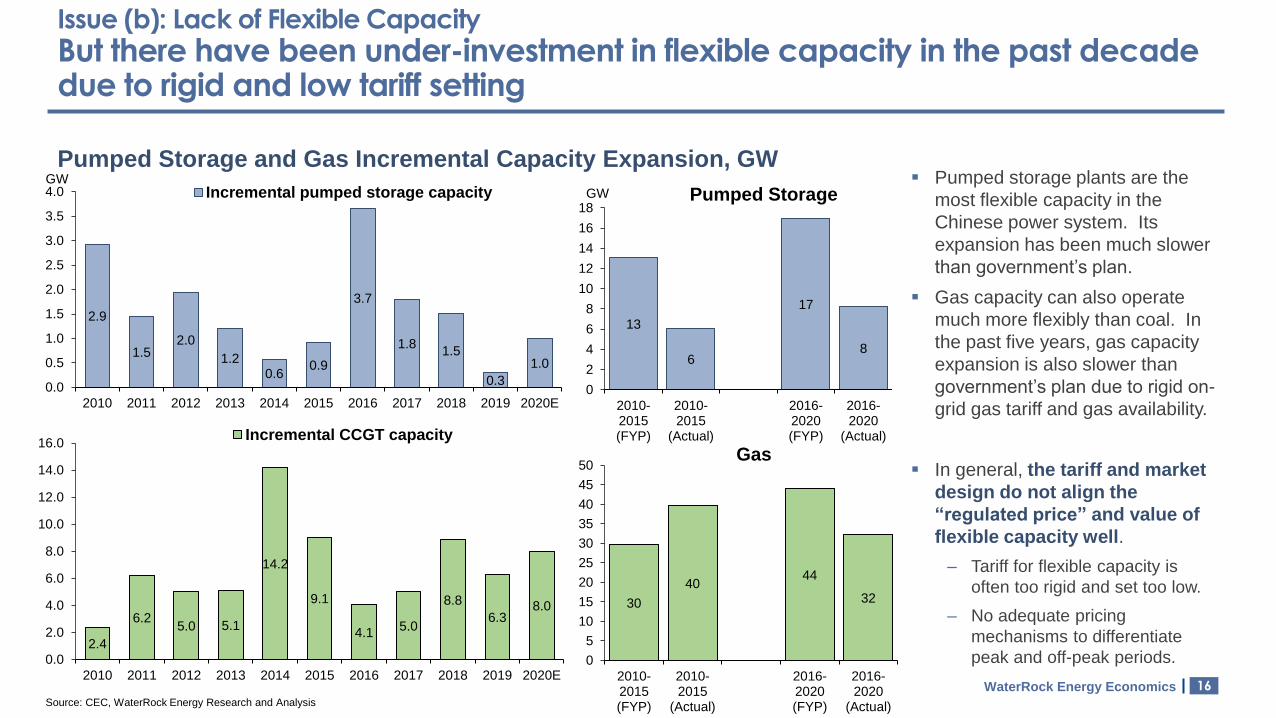
Issue (b): Lack of Flexible Capacity
But there have been under-investment in flexible capacity in the past decade due to rigid and low tariff setting
Pumped Storage and Gas Incremental Capacity Expansion, GW▪ Pumped storage plants are the
most flexible capacity in the
Chinese power system. Its
expansion has been much slower
than government’s plan.
▪ Gas capacity can also operate
much more flexibly than coal. In
the past five years, gas capacity
expansion is also slower than
government’s plan due to rigid on-
grid gas tariff and gas availability.
▪ In general, the tariff and market
design do not align the
“regulated price” and value of
flexible capacity well.
‒ Tariff for flexible capacity is
often too rigid and set too low.
‒ No adequate pricing
mechanisms to differentiate
peak and off-peak periods.
Source: CEC, WaterRock Energy Research and Analysis
2.9
1.52.0
1.20.6
0.9
3.7
1.81.5
0.3
1.0
0.0
0.5
1.0
1.5
2.0
2.5
3.0
3.5
4.0
2010 2011 2012 2013 2014 2015 2016 2017 2018 2019 2020E
Incremental pumped storage capacityGW
13
6
17
8
0
2
4
6
8
10
12
14
16
18
2010-2015(FYP)
2010-2015
(Actual)
2016-2020(FYP)
2016-2020
(Actual)
GW
2.4
6.25.0 5.1
14.2
9.1
4.15.0
8.8
6.38.0
0.0
2.0
4.0
6.0
8.0
10.0
12.0
14.0
16.0
2010 2011 2012 2013 2014 2015 2016 2017 2018 2019 2020E
Incremental CCGT capacity
30
4044
32
0
5
10
15
20
25
30
35
40
45
50
2010-2015(FYP)
2010-2015
(Actual)
2016-2020(FYP)
2016-2020
(Actual)
Pumped Storage
Gas
17WaterRock Energy Economics
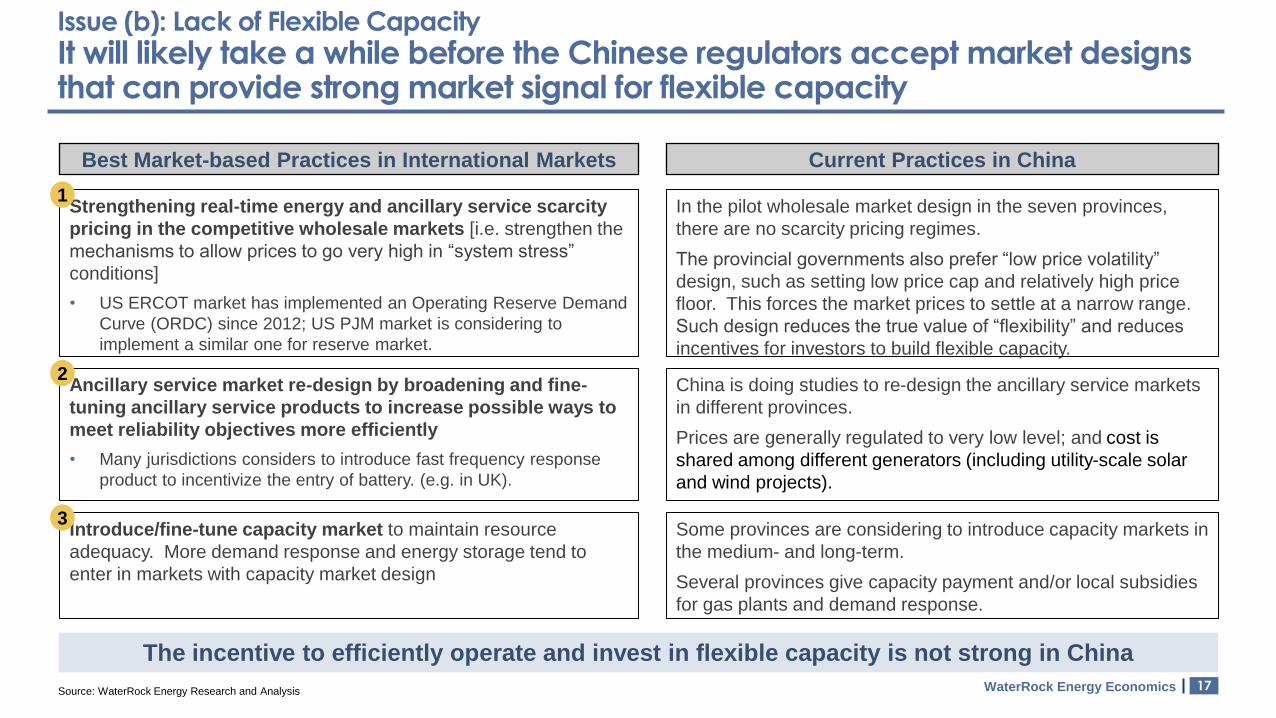
Issue (b): Lack of Flexible Capacity
It will likely take a while before the Chinese regulators accept market designs that can provide strong market signal for flexible capacity
Strengthening real-time energy and ancillary service scarcity
pricing in the competitive wholesale markets [i.e. strengthen the
mechanisms to allow prices to go very high in “system stress”
conditions]
• US ERCOT market has implemented an Operating Reserve Demand
Curve (ORDC) since 2012; US PJM market is considering to
implement a similar one for reserve market.
Best Market-based Practices in International Markets
1
Current Practices in China
In the pilot wholesale market design in the seven provinces,
there are no scarcity pricing regimes.
The provincial governments also prefer “low price volatility”
design, such as setting low price cap and relatively high price
floor. This forces the market prices to settle at a narrow range.
Such design reduces the true value of “flexibility” and reduces
incentives for investors to build flexible capacity.
Ancillary service market re-design by broadening and fine-
tuning ancillary service products to increase possible ways to
meet reliability objectives more efficiently
• Many jurisdictions considers to introduce fast frequency response
product to incentivize the entry of battery. (e.g. in UK).
2China is doing studies to re-design the ancillary service markets
in different provinces.
Prices are generally regulated to very low level; and cost is
shared among different generators (including utility-scale solar
and wind projects).
Introduce/fine-tune capacity market to maintain resource
adequacy. More demand response and energy storage tend to
enter in markets with capacity market design
3Some provinces are considering to introduce capacity markets in
the medium- and long-term.
Several provinces give capacity payment and/or local subsidies
for gas plants and demand response.
Source: WaterRock Energy Research and Analysis
The incentive to efficiently operate and invest in flexible capacity is not strong in China
18WaterRock Energy Economics
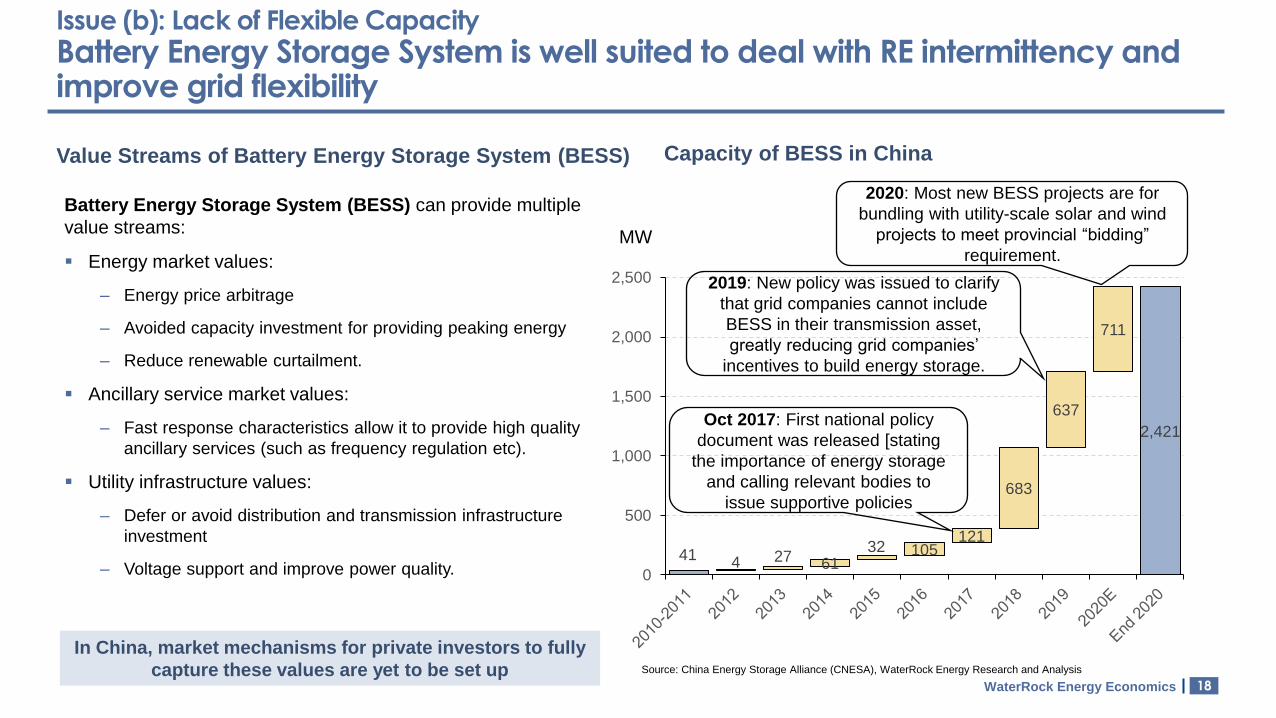
Issue (b): Lack of Flexible Capacity
Battery Energy Storage System is well suited to deal with RE intermittency and improve grid flexibility
41
2,421
4 27 6132 105
121
683
637
711
0
500
1,000
1,500
2,000
2,500
Capacity of BESS in China
2020: Most new BESS projects are for
bundling with utility-scale solar and wind
projects to meet provincial “bidding”
requirement.
2019: New policy was issued to clarify
that grid companies cannot include
BESS in their transmission asset,
greatly reducing grid companies’
incentives to build energy storage.
MW
Value Streams of Battery Energy Storage System (BESS)
Battery Energy Storage System (BESS) can provide multiple
value streams:
▪ Energy market values:
‒ Energy price arbitrage
‒ Avoided capacity investment for providing peaking energy
‒ Reduce renewable curtailment.
▪ Ancillary service market values:
‒ Fast response characteristics allow it to provide high quality
ancillary services (such as frequency regulation etc).
▪ Utility infrastructure values:
‒ Defer or avoid distribution and transmission infrastructure
investment
‒ Voltage support and improve power quality.
In China, market mechanisms for private investors to fully
capture these values are yet to be set up Source: China Energy Storage Alliance (CNESA), WaterRock Energy Research and Analysis
Oct 2017: First national policy
document was released [stating
the importance of energy storage
and calling relevant bodies to
issue supportive policies
19WaterRock Energy Economics
0
50
100
150
200
250
300
350
400
2018 2020 2025 2030 2035 2040 2045 2050
USD/kWh
Fast declining case
Mid case
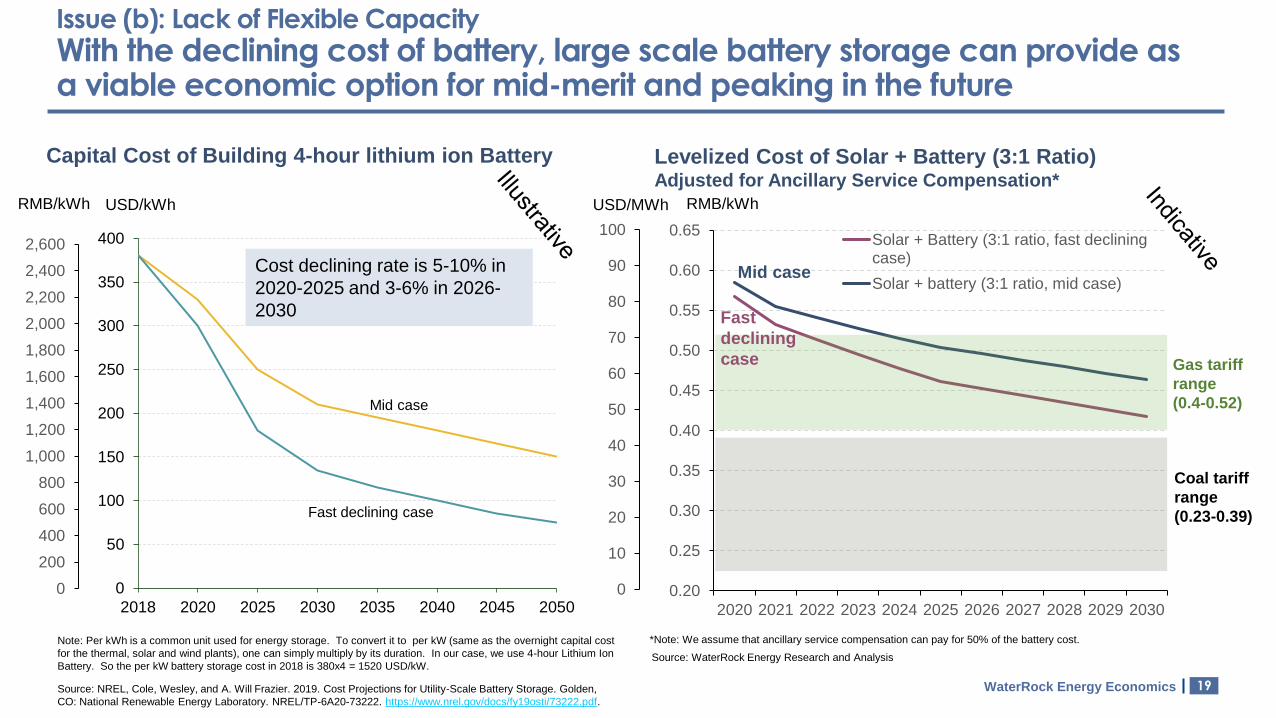
Issue (b): Lack of Flexible Capacity
With the declining cost of battery, large scale battery storage can provide as a viable economic option for mid-merit and peaking in the future
Capital Cost of Building 4-hour lithium ion Battery
Source: NREL, Cole, Wesley, and A. Will Frazier. 2019. Cost Projections for Utility-Scale Battery Storage. Golden,
CO: National Renewable Energy Laboratory. NREL/TP-6A20-73222. https://www.nrel.gov/docs/fy19osti/73222.pdf.
Note: Per kWh is a common unit used for energy storage. To convert it to per kW (same as the overnight capital cost
for the thermal, solar and wind plants), one can simply multiply by its duration. In our case, we use 4-hour Lithium Ion
Battery. So the per kW battery storage cost in 2018 is 380x4 = 1520 USD/kW.
Levelized Cost of Solar + Battery (3:1 Ratio)Adjusted for Ancillary Service Compensation*
*Note: We assume that ancillary service compensation can pay for 50% of the battery cost.
0.20
0.25
0.30
0.35
0.40
0.45
0.50
0.55
0.60
0.65
2020 2021 2022 2023 2024 2025 2026 2027 2028 2029 2030
Solar + Battery (3:1 ratio, fast decliningcase)
Solar + battery (3:1 ratio, mid case)
RMB/kWhRMB/kWh
0
200
400
600
800
1,000
1,200
1,400
1,600
1,800
2,000
2,200
2,400
2,600
USD/MWh
Source: WaterRock Energy Research and Analysis
0
10
20
30
40
50
60
70
80
90
100
Coal tariff
range
(0.23-0.39)
Gas tariff
range
(0.4-0.52)
Cost declining rate is 5-10% in
2020-2025 and 3-6% in 2026-
2030
Mid case
Fast
declining
case
20WaterRock Energy Economics
Agenda
1 Market Background
Key Challenges of the Wind and Solar Sector in China
Subsidy Payment Delay
(Lack of) Grid Flexibility
Wind and Solar Curtailment
Slow Progress of Market Mechanisms to Price CO2
Summary
2
3
2a
2b
2c
2d
21WaterRock Energy Economics
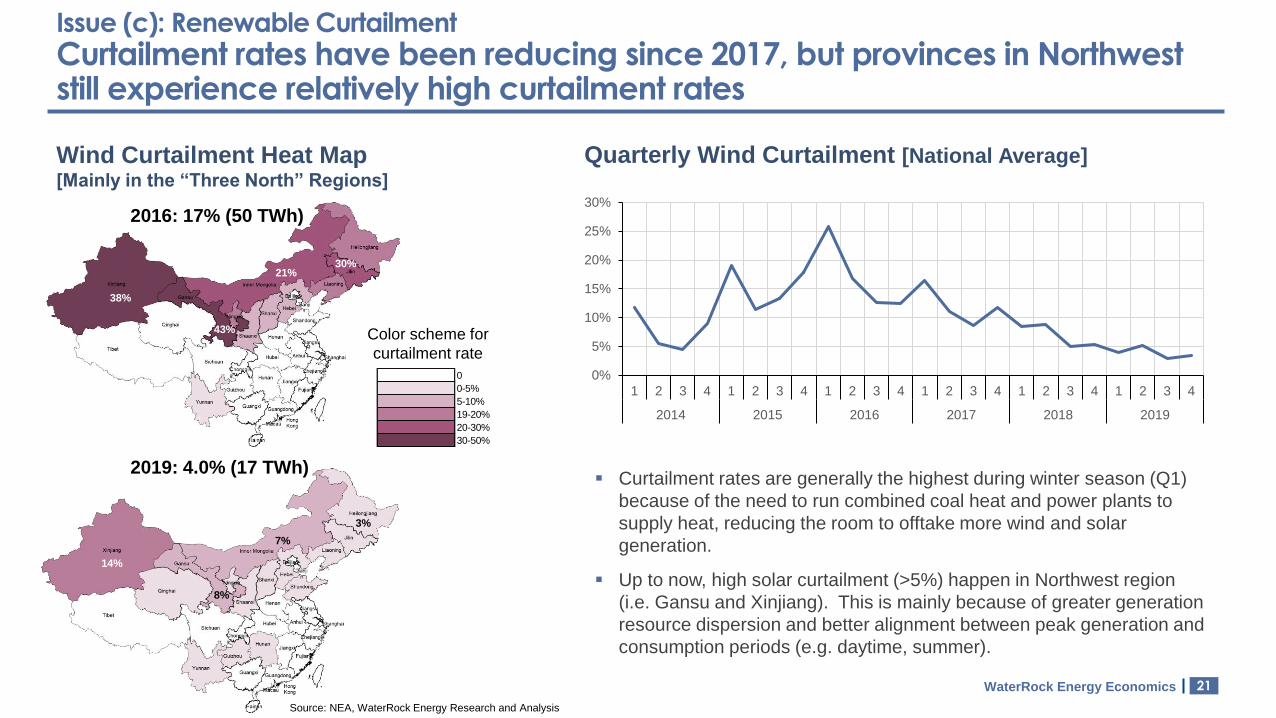
Issue (c): Renewable Curtailment
Curtailment rates have been reducing since 2017, but provinces in Northwest still experience relatively high curtailment rates
Wind Curtailment Heat Map [Mainly in the “Three North” Regions]
Quarterly Wind Curtailment [National Average]
2016: 17% (50 TWh)
2019: 4.0% (17 TWh)
43%
38%
21%30%
3%
7%
14%
8%
Color scheme for
curtailment rate
0
0-5%
5-10%
19-20%
20-30%
30-50%
0%
5%
10%
15%
20%
25%
30%
1 2 3 4 1 2 3 4 1 2 3 4 1 2 3 4 1 2 3 4 1 2 3 4
2014 2015 2016 2017 2018 2019
▪ Curtailment rates are generally the highest during winter season (Q1)
because of the need to run combined coal heat and power plants to
supply heat, reducing the room to offtake more wind and solar
generation.
▪ Up to now, high solar curtailment (>5%) happen in Northwest region
(i.e. Gansu and Xinjiang). This is mainly because of greater generation
resource dispersion and better alignment between peak generation and
consumption periods (e.g. daytime, summer).
Source: NEA, WaterRock Energy Research and Analysis
22WaterRock Energy Economics
Issue (c): Renewable Curtailment
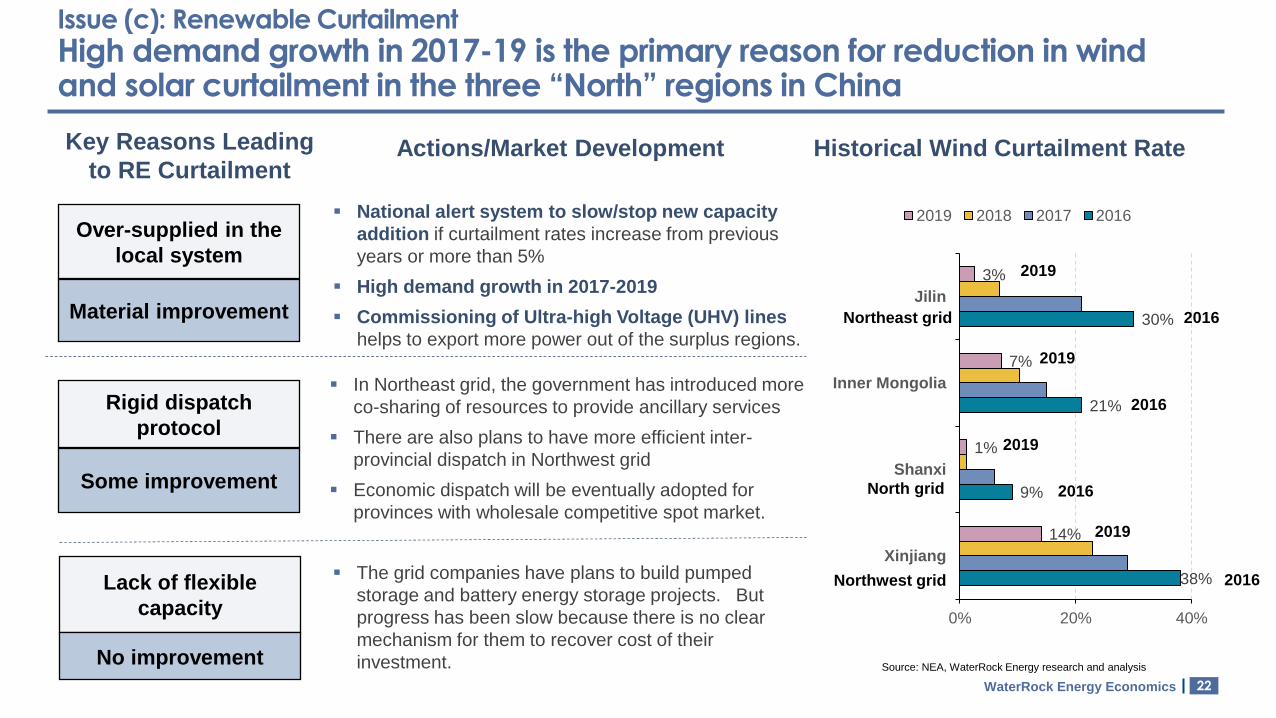
High demand growth in 2017-19 is the primary reason for reduction in wind and solar curtailment in the three “North” regions in China
Over-supplied in the
local system
Lack of flexible
capacity
Rigid dispatch
protocol
Key Reasons Leading
to RE CurtailmentActions/Market Development
▪ National alert system to slow/stop new capacity
addition if curtailment rates increase from previous
years or more than 5%
▪ High demand growth in 2017-2019
▪ Commissioning of Ultra-high Voltage (UHV) lines
helps to export more power out of the surplus regions.
▪ The grid companies have plans to build pumped
storage and battery energy storage projects. But
progress has been slow because there is no clear
mechanism for them to recover cost of their
investment.
▪ In Northeast grid, the government has introduced more
co-sharing of resources to provide ancillary services
▪ There are also plans to have more efficient inter-
provincial dispatch in Northwest grid
▪ Economic dispatch will be eventually adopted for
provinces with wholesale competitive spot market.
38%
9%
21%
30%
14%
1%
7%
3%
0% 20% 40%
Xinjiang
Shanxi
Inner Mongolia
Jilin
2019 2018 2017 2016
Historical Wind Curtailment Rate
Material improvement
No improvement
Some improvement
Source: NEA, WaterRock Energy research and analysis
2016
2019
2016
2019
2016
2019
2016
2019
Northeast grid
North grid
Northwest grid
23WaterRock Energy Economics
Issue (c): Renewable Curtailment
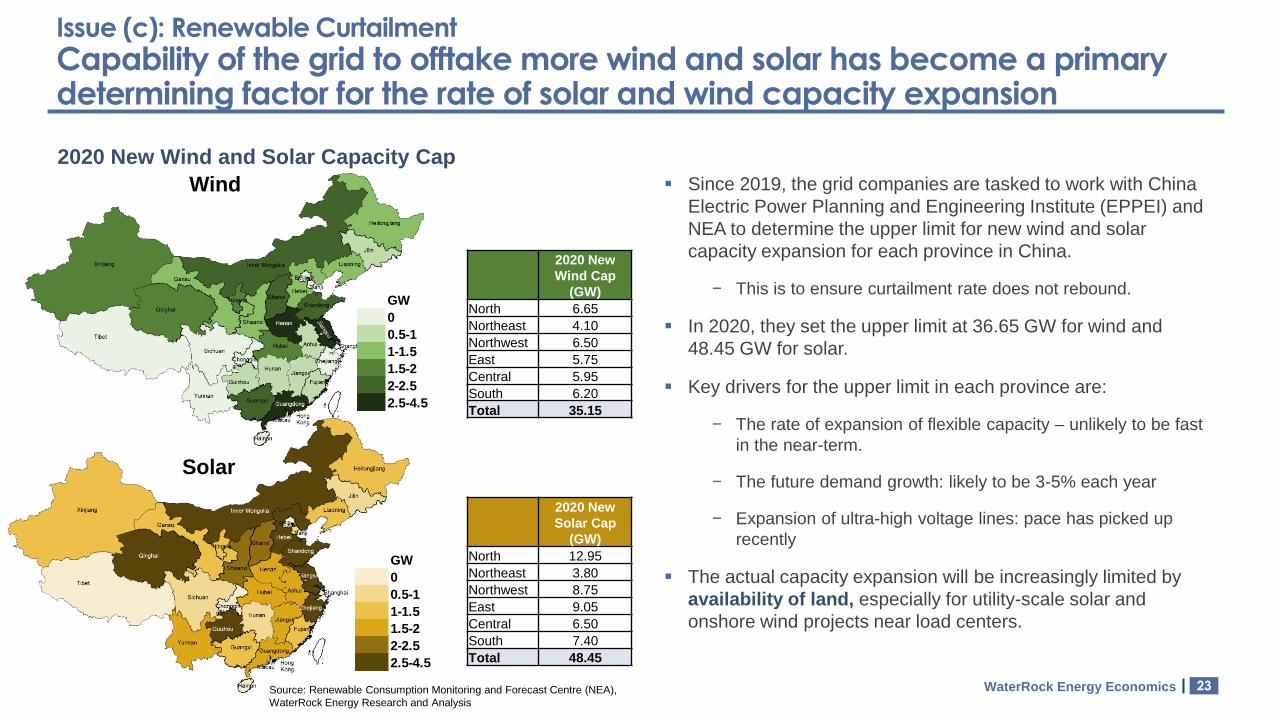
Capability of the grid to offtake more wind and solar has become a primary determining factor for the rate of solar and wind capacity expansion
▪ Since 2019, the grid companies are tasked to work with China
Electric Power Planning and Engineering Institute (EPPEI) and
NEA to determine the upper limit for new wind and solar
capacity expansion for each province in China.
− This is to ensure curtailment rate does not rebound.
▪ In 2020, they set the upper limit at 36.65 GW for wind and
48.45 GW for solar.
▪ Key drivers for the upper limit in each province are:
− The rate of expansion of flexible capacity – unlikely to be fast
in the near-term.
− The future demand growth: likely to be 3-5% each year
− Expansion of ultra-high voltage lines: pace has picked up
recently
▪ The actual capacity expansion will be increasingly limited by
availability of land, especially for utility-scale solar and
onshore wind projects near load centers.
Wind
2020 New
Wind Cap
(GW)
North 6.65
Northeast 4.10
Northwest 6.50
East 5.75
Central 5.95
South 6.20
Total 35.15
2020 New Wind and Solar Capacity Cap
GW
0
0.5-1
1-1.5
1.5-2
2-2.5
2.5-4.5
Solar
GW
0
0.5-1
1-1.5
1.5-2
2-2.5
2.5-4.5
2020 New
Solar Cap
(GW)
North 12.95
Northeast 3.80
Northwest 8.75
East 9.05
Central 6.50
South 7.40
Total 48.45
Source: Renewable Consumption Monitoring and Forecast Centre (NEA),
WaterRock Energy Research and Analysis

24WaterRock Energy Economics
Issue (c): Renewable Curtailment
New demand drivers from electrification, data centres and residential sector will likely lead to moderately high load growth in the next five years (3-5%)
China Power Demand Growth Rate by Sectors
Source: State Grids, MIIT, Various news clips, research paper and WaterRock Energy analysis
Electrification (e.g. coal-to-power
switching, electric
cars etc)
ResidentialData Centers
New demand
drivers can help to
maintain power
consumption
growth above 3%
in the medium-
term
1.41.9 2.2 2.5
3.10.30.2
0.20.6
0.1
0.10.3
0.4
0.6
1.30.9
1.4
0.6
0.0
1.52.0
4.7
0.72.3
4.9
5.6
9.6
4.5
0
2
4
6
8
10
12
2015 2016 2017 2018 2019
Other demand
Residential (excl. electrification)
Bitcoin mining
Data Centre
Electrification
Growth rate, %
Electrification,
digitalization of
the economy
(5G, big data
etc) and rising
household
income are the
new structural
drivers for
power
consumption
growth
3.12.6
2.21.8 2.0 2.1
0.00.3
0.3
0.30.3
0.3
0.60.7
0.7
0.70.7
0.7
-1.5
1.1
1.0
0.9 0.8 0.7
2.2
4.7
4.1
3.6 3.7 3.8
-2.0
-1.0
0.0
1.0
2.0
3.0
4.0
5.0
6.0
2020E 2021 2022 2023 2024 2025
Other demandResidential (excl. electrification)Bitcoin miningData CentreElectrification
Growth rate, %
25WaterRock Energy Economics
1,040 1,149
90119
35640449
210
349204
394
0
500
1,000
1,500
2,000
2,500
3,000
2009 2010 2011 2012 2013 2014 2015 2016 2017 2018 2019 2020 2021 2022 2023 2024 2025
Coal Gas Oil
Pumped storage Hydro Nuclear
Wind Solar Peak demand
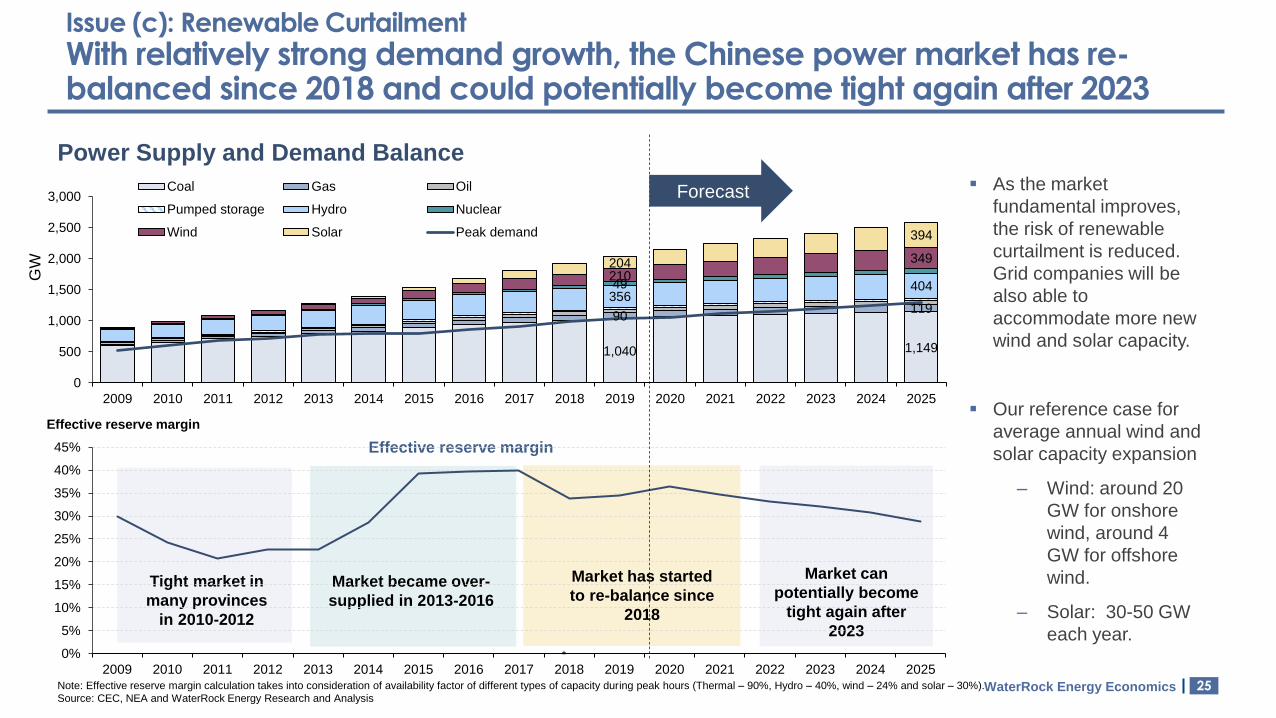
Issue (c): Renewable Curtailment
With relatively strong demand growth, the Chinese power market has re-balanced since 2018 and could potentially become tight again after 2023
Note: Effective reserve margin calculation takes into consideration of availability factor of different types of capacity during peak hours (Thermal – 90%, Hydro – 40%, wind – 24% and solar – 30%).
Source: CEC, NEA and WaterRock Energy Research and Analysis
Power Supply and Demand Balance
*
Tight market in
many provinces
in 2010-2012
Market became over-
supplied in 2013-2016
Market has started
to re-balance since
2018
Effective reserve margin
Effective reserve margin
GW
Market can
potentially become
tight again after
2023
0%
5%
10%
15%
20%
25%
30%
35%
40%
45%
2009 2010 2011 2012 2013 2014 2015 2016 2017 2018 2019 2020 2021 2022 2023 2024 2025
Forecast ▪ As the market
fundamental improves,
the risk of renewable
curtailment is reduced.
Grid companies will be
also able to
accommodate more new
wind and solar capacity.
▪ Our reference case for
average annual wind and
solar capacity expansion
‒ Wind: around 20
GW for onshore
wind, around 4
GW for offshore
wind.
‒ Solar: 30-50 GW
each year.
26WaterRock Energy Economics
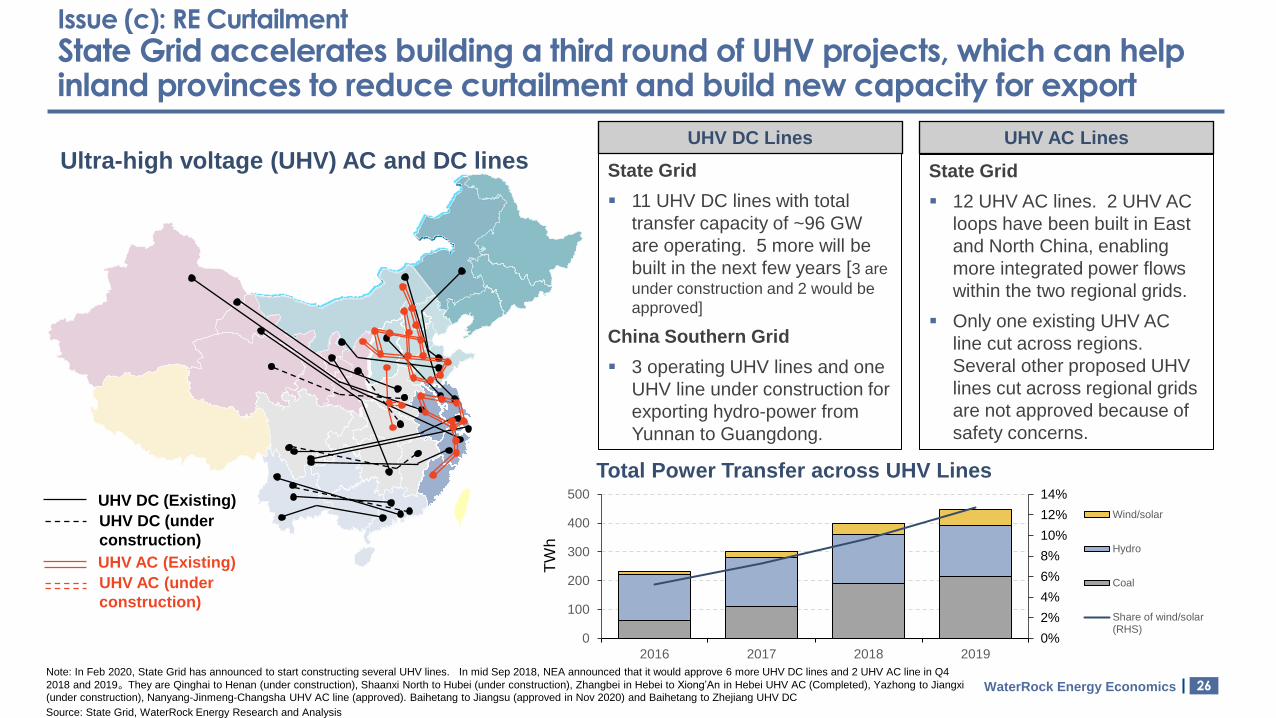
Issue (c): RE Curtailment
State Grid accelerates building a third round of UHV projects, which can help inland provinces to reduce curtailment and build new capacity for export
Ultra-high voltage (UHV) AC and DC lines
Note: In Feb 2020, State Grid has announced to start constructing several UHV lines. In mid Sep 2018, NEA announced that it would approve 6 more UHV DC lines and 2 UHV AC line in Q4
2018 and 2019。 They are Qinghai to Henan (under construction), Shaanxi North to Hubei (under construction), Zhangbei in Hebei to Xiong’An in Hebei UHV AC (Completed), Yazhong to Jiangxi
(under construction), Nanyang-Jinmeng-Changsha UHV AC line (approved). Baihetang to Jiangsu (approved in Nov 2020) and Baihetang to Zhejiang UHV DC
State Grid
▪ 11 UHV DC lines with total
transfer capacity of ~96 GW
are operating. 5 more will be
built in the next few years [3 are
under construction and 2 would be
approved]
China Southern Grid
▪ 3 operating UHV lines and one
UHV line under construction for
exporting hydro-power from
Yunnan to Guangdong.
UHV DC Lines
State Grid
▪ 12 UHV AC lines. 2 UHV AC
loops have been built in East
and North China, enabling
more integrated power flows
within the two regional grids.
▪ Only one existing UHV AC
line cut across regions.
Several other proposed UHV
lines cut across regional grids
are not approved because of
safety concerns.
UHV AC Lines
UHV DC (Existing)
UHV DC (under
construction)
UHV AC (Existing)
UHV AC (under
construction)
Source: State Grid, WaterRock Energy Research and Analysis
0%
2%
4%
6%
8%
10%
12%
14%
0
100
200
300
400
500
2016 2017 2018 2019
Wind/solar
Hydro
Coal
Share of wind/solar(RHS)
Total Power Transfer across UHV Lines
TW
h
27WaterRock Energy Economics
Agenda
1 Market Background
Key Challenges of the Wind and Solar Sector in China
Subsidy Payment Delay
(Lack of) Grid Flexibility
Wind and Solar Curtailment
Slow Progress of Market Mechanisms to Price CO2
Summary
2
3
2a
2b
2c
2d
28WaterRock Energy Economics
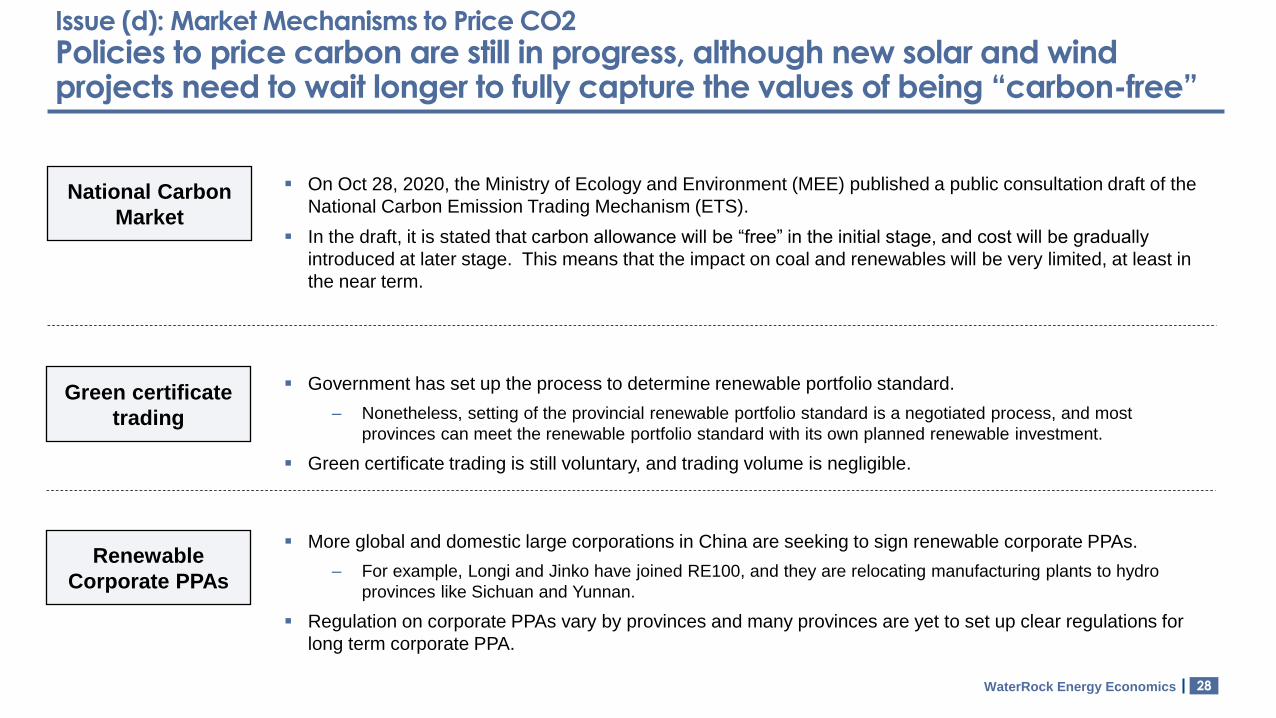
Issue (d): Market Mechanisms to Price CO2
Policies to price carbon are still in progress, although new solar and wind projects need to wait longer to fully capture the values of being “carbon-free”
National Carbon
Market
▪ On Oct 28, 2020, the Ministry of Ecology and Environment (MEE) published a public consultation draft of the
National Carbon Emission Trading Mechanism (ETS).
▪ In the draft, it is stated that carbon allowance will be “free” in the initial stage, and cost will be gradually
introduced at later stage. This means that the impact on coal and renewables will be very limited, at least in
the near term.
Green certificate
trading
▪ Government has set up the process to determine renewable portfolio standard.
‒ Nonetheless, setting of the provincial renewable portfolio standard is a negotiated process, and most
provinces can meet the renewable portfolio standard with its own planned renewable investment.
▪ Green certificate trading is still voluntary, and trading volume is negligible.
Renewable
Corporate PPAs
▪ More global and domestic large corporations in China are seeking to sign renewable corporate PPAs.
‒ For example, Longi and Jinko have joined RE100, and they are relocating manufacturing plants to hydro
provinces like Sichuan and Yunnan.
▪ Regulation on corporate PPAs vary by provinces and many provinces are yet to set up clear regulations for
long term corporate PPA.
29WaterRock Energy Economics
Agenda
1 Market Background
Key Challenges of the Wind and Solar Sector in China
Subsidy Payment Delay
(Lack of) Grid Flexibility
Wind and Solar Curtailment
Slow Progress of Market Mechanisms to Price CO2
Summary
2
3
2a
2b
2c
2d
30WaterRock Energy Economics
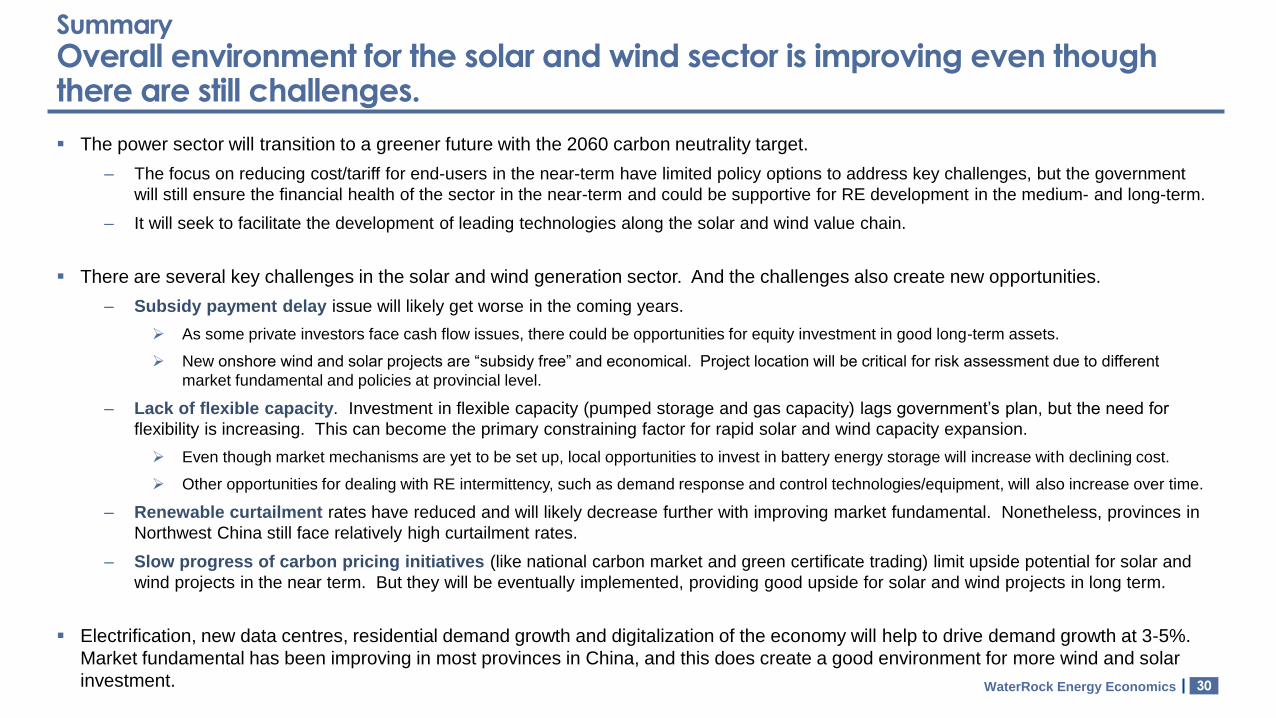
Summary
Overall environment for the solar and wind sector is improving even though there are still challenges.
▪ The power sector will transition to a greener future with the 2060 carbon neutrality target.
‒ The focus on reducing cost/tariff for end-users in the near-term have limited policy options to address key challenges, but the government
will still ensure the financial health of the sector in the near-term and could be supportive for RE development in the medium- and long-term.
‒ It will seek to facilitate the development of leading technologies along the solar and wind value chain.
▪ There are several key challenges in the solar and wind generation sector. And the challenges also create new opportunities.
‒ Subsidy payment delay issue will likely get worse in the coming years.
➢ As some private investors face cash flow issues, there could be opportunities for equity investment in good long-term assets.
➢ New onshore wind and solar projects are “subsidy free” and economical. Project location will be critical for risk assessment due to different
market fundamental and policies at provincial level.
‒ Lack of flexible capacity. Investment in flexible capacity (pumped storage and gas capacity) lags government’s plan, but the need for
flexibility is increasing. This can become the primary constraining factor for rapid solar and wind capacity expansion.
➢ Even though market mechanisms are yet to be set up, local opportunities to invest in battery energy storage will increase with declining cost.
➢ Other opportunities for dealing with RE intermittency, such as demand response and control technologies/equipment, will also increase over time.
‒ Renewable curtailment rates have reduced and will likely decrease further with improving market fundamental. Nonetheless, provinces in
Northwest China still face relatively high curtailment rates.
‒ Slow progress of carbon pricing initiatives (like national carbon market and green certificate trading) limit upside potential for solar and
wind projects in the near term. But they will be eventually implemented, providing good upside for solar and wind projects in long term.
▪ Electrification, new data centres, residential demand growth and digitalization of the economy will help to drive demand growth at 3-5%.
Market fundamental has been improving in most provinces in China, and this does create a good environment for more wind and solar
investment.
31WaterRock Energy Economics
Thanks and ContactWaterRock Energy Economics
WaterRock Energy
Economicswww.waterrockenergy.com
For enquiries, contact
Liutong Zhang (Lucas)[email protected]
+852 9365 8216
Research and
Consulting
Modelling and
Valuation
Thoughtful
Analysis
Practical
Insights
32WaterRock Energy Economics
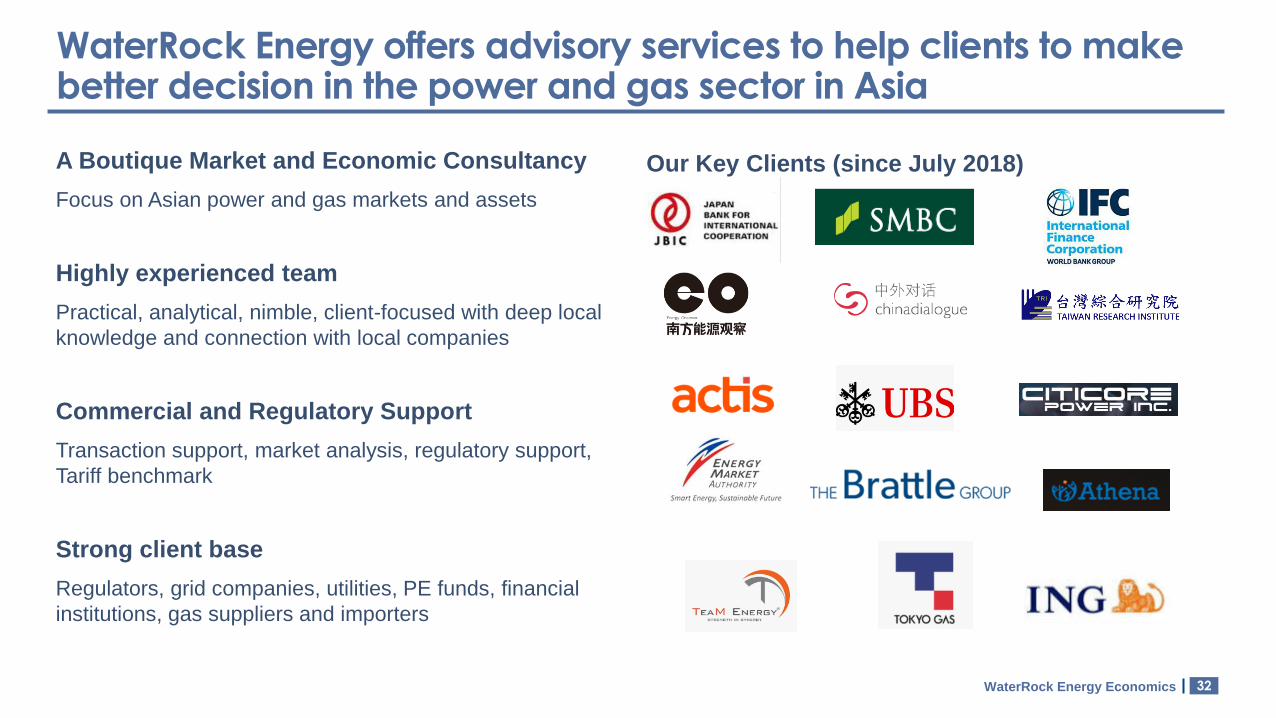
WaterRock Energy offers advisory services to help clients to make better decision in the power and gas sector in Asia
A Boutique Market and Economic Consultancy
Focus on Asian power and gas markets and assets
Highly experienced team
Practical, analytical, nimble, client-focused with deep local
knowledge and connection with local companies
Commercial and Regulatory Support
Transaction support, market analysis, regulatory support,
Tariff benchmark
Strong client base
Regulators, grid companies, utilities, PE funds, financial
institutions, gas suppliers and importers
Our Key Clients (since July 2018)
33WaterRock Energy Economics
Contact Information of the Author
Liutong Zhang Director at WaterRock Energy Economics
+852 9365 8216
Liutong has over 12 years’ experience of providing advisory services on the power and gas market in China and ASEAN
electricity markets.
He has in-depth knowledge in greater China region, including forecasting of solar and wind curtailment and power tariffs,
asset valuation and evaluation of opportunities/risks of investing in renewables and gas infrastructure in mainland China,
Hong Kong and Taiwan.
He has also been extensively involved in the market design of a Forward Capacity Market in Singapore since early 2019.
In the Philippines, he was invited to present to the Philippines' Energy Committee of the Senate and Philippines' House
of Representatives on the role of natural gas and economics of building new LNG terminals in early 2020.
He holds a Bachelor of Chemical Engineering with first class honours from the National University of Singapore (NUS).
He is fluent in English and Mandarin.

34WaterRock Energy Economics
Appendix

35WaterRock Energy Economics
Subsidy Delay Issue
Key determining factors on the priority of subsidy payment are the commissioning date of the projects and type of the projects
Quota
announcement
date
Commissioning Date
1st 12 Jun 2012 N.A
2nd 21 Sep 2012 N.A
3rd 20 Dec 2012 N.A
4th 26 Feb 2013 N.A
5th 21 Aug 2014 Bef Aug 13
6th 24 Aug 2016 Aug 13 – Feb 15
7th 11 June 2018 Mar 15 – end Feb 2016
8th Jan 2020
Mar 2016 – Dec 2019 for wind, solar under
front-run program and 2019 competitive
bidding program
March 2016 – July 2017 for normal solar
projects.
Batch-wise Quota System for Projects in 2012-2019
▪ China used to have a batch-wise quota system to dispatch
subsidies to the wind and solar projects.
‒ The plants commissioning in earlier date have higher priority.
‒ Under the regulation, the fund is supposed to be distributed to
the eligible plants on a quarterly basis. However, the exact
implementation process is opaque and fund distribution time-line
is not predictable [although they try to distribute to eligible plants
at least once every year].
▪ In early 2020, it announced that it is going to change the fund
distribution process, but it remains uncertain how the new
process will work.
‒ One possibility is that RE cash inflow may be distributed to all the
eligible RE plants, and they all only get a fraction of their total
subsidy; or
‒ the dispatch of fund remains largely the same (i.e. the plants built
in earlier years have higher priority).
Source: WaterRock Energy Research and Analysis
Note:* based on government announcement http://www.gov.cn/zhengce/zhengceku/2020-03/23/content_5494490.htm
36WaterRock Energy Economics
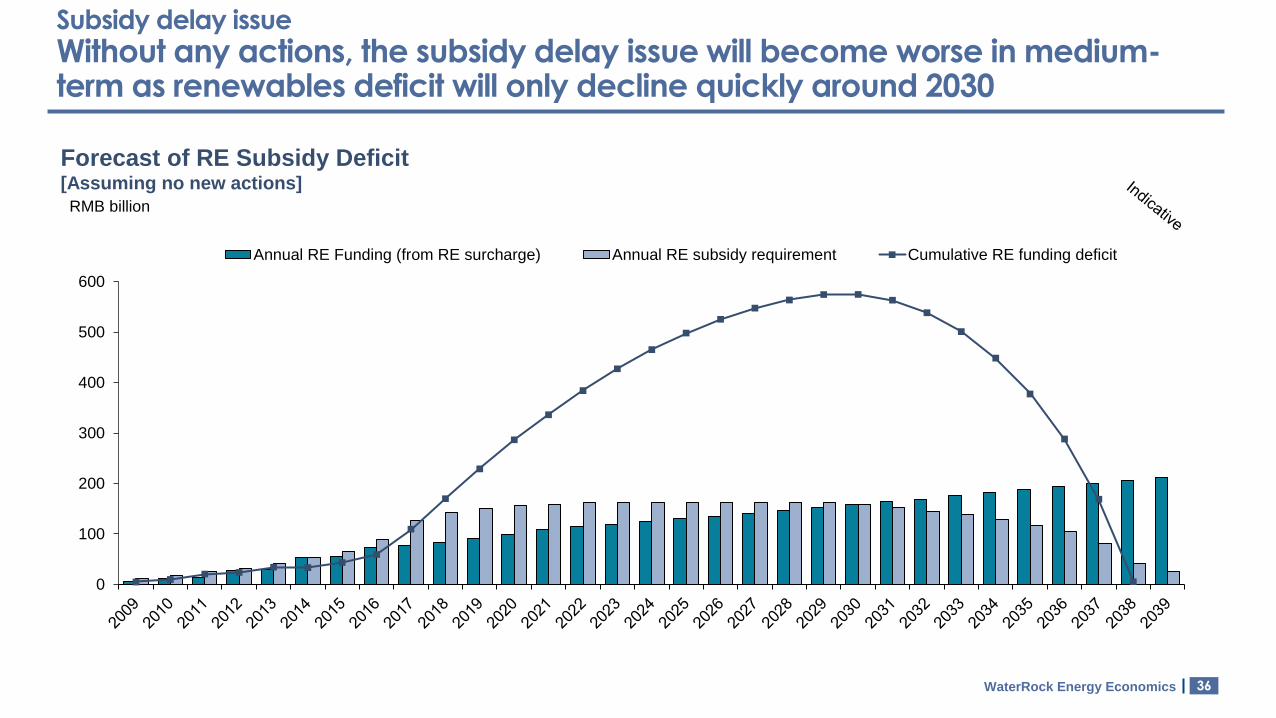
Subsidy delay issue
Without any actions, the subsidy delay issue will become worse in medium-term as renewables deficit will only decline quickly around 2030
RMB billion
Forecast of RE Subsidy Deficit [Assuming no new actions]
0
100
200
300
400
500
600
Annual RE Funding (from RE surcharge) Annual RE subsidy requirement Cumulative RE funding deficit

37WaterRock Energy Economics
Renewable Curtailment
Fundamental reasons for the RE curtailment is over-supplied in the local system, the lack of flexible capacity and rigid dispatch protocol
Wind
and
solar
Minimum
coal gen
Operable
thermal
rangeOperable
thermal
range
Minimum
coal gen
Wind
and
solar
Curtailed
RE
Peak load of the day
Min load of the day
Must-take
(infeasible)
Feasible
dispatch with
curtailed RE
The NEA’s Rules identify three typical constraints under which a Dispatch
Organization (DO) may curtail renewable output:
1. system security constraints;
2. insufficient load following capacity; and
3. system emergencies.
When the DO curtails RE output, it is required to provide the amount of
output curtailed, the reason for curtailment, and the situation under which
curtailment occurred.
The quantity of minimum coal gen has material impact on
renewable curtailment, and it is driven by:
▪ Whether the coal plants need to provide heating requirement
▪ Amount of flexible resources to provide ancillary services (such as
ramping and regulating reserves) to ensure power system reliability
▪ Amount of unpredictable resources (such as solar and wind) that
could increase ancillary service demand
▪ Capability to share resources (such as pumped storage plants) across
different provinces.
Source: WaterRock Energy research and analysis

38WaterRock Energy Economics
Renewable Curtailment (Impact of COVID-19)
In Q2 2020, Power demand growth have returned to positive in most provinces
as China manages to contain COVID-19
% Change of Power Demand in 2020 vs 2019
Source: CEC, WaterRock Energy estimates
Q1 2020 vs Q1 2019: -6.5%
(Nation-wide)Q3 2020 vs Q3 2019: 6%
(Nation-wide)
Q2 2020 vs Q2 2019: 3%
(Nation-wide)
<-25%
minus 10% - minus 25%
0 - minus 10%
0-5%
5-10%
>10%
Demand change
In Jan-Sep 2020, demand is up by 1.3% year-on-year in China
39WaterRock Energy Economics
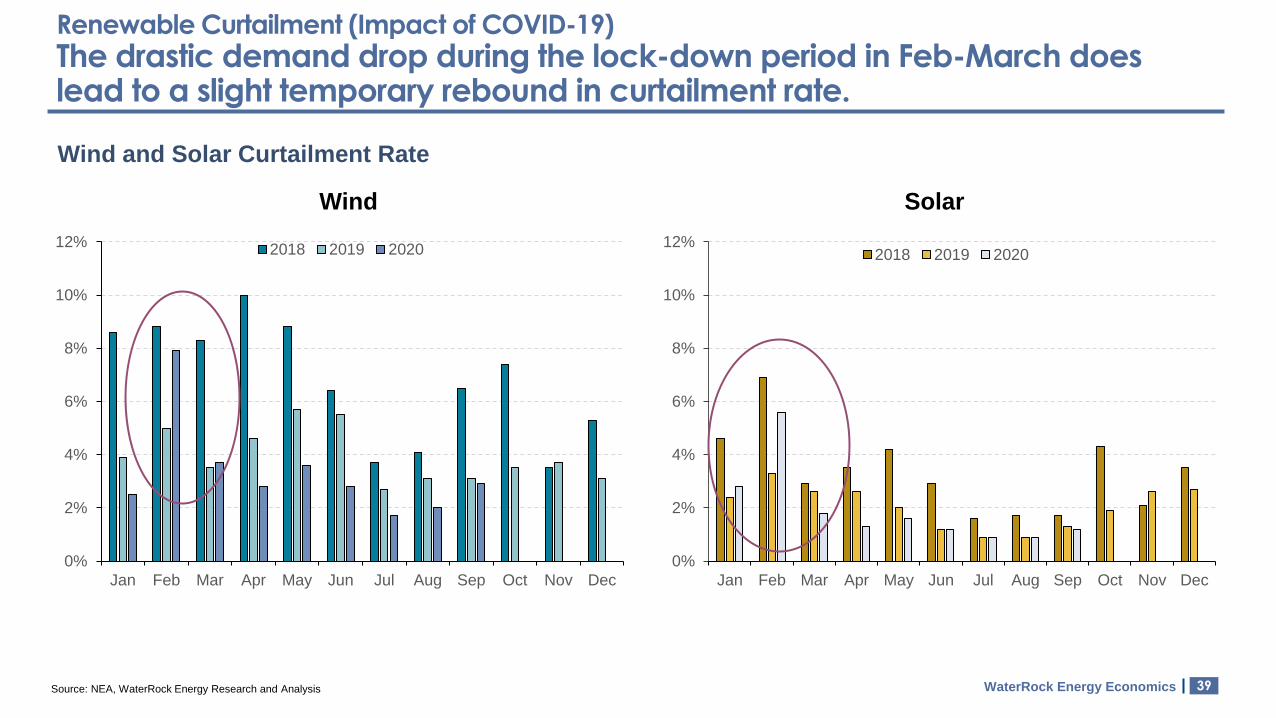
Renewable Curtailment (Impact of COVID-19)
The drastic demand drop during the lock-down period in Feb-March does lead to a slight temporary rebound in curtailment rate.
Wind and Solar Curtailment Rate
0%
2%
4%
6%
8%
10%
12%
Jan Feb Mar Apr May Jun Jul Aug Sep Oct Nov Dec
2018 2019 2020
0%
2%
4%
6%
8%
10%
12%
Jan Feb Mar Apr May Jun Jul Aug Sep Oct Nov Dec
2018 2019 2020
Wind Solar
Source: NEA, WaterRock Energy Research and Analysis