facilitator’s guide - jagna, boholjagna.gov.ph/wp-content/uploads/2014/01/manual-for...bottom-up...
TRANSCRIPT

Facilitator’s Guide for the planning activity of the Bottom-Up Budgeting Process
2013
Bottom Up Budgeting

1
Contents INTRODUCTION ............................................................................................................................................. 2
I. Main tasks and qualities of a facilitator ................................................................................................ 3
II. Contextualizing BuB: Poverty in the Philippines ................................................................................... 5
III. KEY INFORMATION REGARDING the BuB ......................................................................................... 6
IV. Pre-planning preparations .............................................................................................................. 11
V. Conduct of the actual workshop ......................................................................................................... 22
Session 1. The CSO orientation on the basics of local public finance .............................................. 23
Session 2. Opening the Planning Session ......................................................................................... 23
Session 3. Briefing on the BuB ......................................................................................................... 24
Session 4. Presentation and validation of situation analysis: The Problem Tree .......................... 24
Session 5. Crafting Poverty Reduction Strategies: The Solution Tree............................................. 29
Session 6. Identifying and Prioritizing PPAs ..................................................................................... 30
Session 7. LPRAP Documentation Reporting and Documentation Requirements .......................... 30

2
INTRODUCTION
This guide is designed to direct facilitators in assisting the Local Poverty Reduction Action Team
(LPRAT) formulate its Local Poverty Reduction Action Plan (LPRAP).
The following references were used in the preparation of this guide:
• Participatory Guide to Local Poverty Reduction Action Plan (NAPC, 2012) • How to Formulate an Executive and Legislative Agenda for Local Governance and
Development: A Manual (DILG, 2004) • Rationalized Local Planning System of the Philippines (DILG, 2005) • KALAHI-CIDSS manuals and training materials (DSWD) • Harmonized Gender and Development Guidelines for Project Development,
Implementation, and Monitoring: Training Manual (NEDA, 2007)
This guide is divided into four parts:
Part 1. Tasks and qualities of a BuB planning workshop facilitator
Part 2. Contextualizing and understanding the BuB process
Part 3. Pre-workshop preparations
Part 4. Workshop Guide

3
I. Main tasks and qualities of a facilitator
The main role of the facilitatoris to ensure active participation and meaningful exchanges of the
LPRAT members during the planning process and formulation of LPRAP. The following
summarizes the primary skills and tasks of the facilitator (Source: KALAHI-CIDSS Manual).
Main tasks:
Ensure the effective flow of communication within a group so that the participants can share information and arrive at decisions.
Pose problems and encourages group analysis Provoke people to think critically and motivates them towards action. Does not change or ignore any decisions reached by the participants through consensus. Guides the participants to move through a process together. The facilitator draws out
opinions and ideas of the participants. Qualities of a facilitator: Is sensitive, both to the verbal and non-verbal communications that occur in the group. Is sensitive to the feelings, attitudes, culture, interests and any hidden agenda that may be
present in a group. Focuses on how the participants are contributing to the process of planning. Remains neutral during the process of facilitation. Ensures that everyone can participate by making everyone feels comfortable. Develops structure that allows everyone to freely share their ideas Makes sure that the group has ownership of the plan Summarizes what has been achieved and opens for questions and comments before
moving forward. Learns to manage conflict Directs /sustains smooth and systematic flow of discussion Have mastery of subject matter being discussed Gives everybody a chance to talk/participate Always give a running summary of the discussion/agreements Surfaces feelings and experiences of participants Be sharp and sensitive to participants’ needs Synthesizes the entire discussion Be relaxed, confident, warm, and trusting Reflects, judges and decides objectively Responds quickly to verbal and nonverbal reactions of participants.

4
The facilitator should also be conscious of conflict/possible conflict with arising from the planning process. To resolve conflict, a facilitator should be able to sense the ADI: A is for Agreement D is for Disagreement I is for Irrelevance
Agreements should be explored, disagreements respected and irrelevancies identified so that the focus will be on reaching an agreement. Exploring Ds can also be explored towiden the A.
Things to avoid: Do not drive the planning process. Do not express personal opinion, standpoint or viewpoint Do not be the seat of wisdom in the planning process. Do not memorize a script Do not quarrel with participants Do not lecture like a teacher Do not embarrass nor insult the participants Do not act like a terror teacher Do not reprimand participants Do not get angry with the participants Do not overdo the sense of humor Do not be too accommodating to theparticipants Do not be too serious Do not be a dispenser of clarity but an enabler that empowers others Do not lead participants by asking questions to have wanted answers Do not exercise authority over the group
Do not indoctrinate

5
II. Contextualizing BuB: Poverty in the Philippines (Source: KALAHI-CIDSS Manual)
Our understanding of poverty determines the way we are going to respond to it. The most popular measurement of poverty is level of income. This is based on an assumption that you need a certain level of income to be able to purchase basic good and services. Based on this assumption, our usual response would be the provision of livelihood or employment opportunities. As more studies were completed, a poor Filipino family was later described in terms of the quality of life of its members. Specifically, poverty was later defined as the sustained inability of Filipino families to meet minimum basic needs. Thus, poor families are usually characterized as having malnourished children; poor health; low educational attainment; are unemployed or underemployed; and homeless. With this perspective, poverty reduction responses focused on accelerated delivery of basic services. Experiences also revealed that the conditioning factors of poverty include poor roads; unavailability of basic facilities such as electricity, potable water sources, school building, health centers, sanitary toilets, production as well as communication facilities; lack of access to basic services; peace and order problem; and calamities. Moreover, the root causes include inequitable distribution of production assets such as land, coastal resources, ancestral domain; non-participation in decision-making; and a culture of silence or helplessness. Studies also showed that poverty has a sectoral dimension such that certain groups of Filipinos have become marginalized or vulnerable. These groupings are referred to as the basic sectors. The following are required readings to understand the anti-poverty thrust of the Aquino administration: National Anti Poverty Commission, “National Anti-Poverty Program (2010-2016) Part 1”, available at: http://maps.napc.gov.ph/napcportal/images/stories/pdf/National_Anti-Poverty_Program_Part1.pdf National Anti Poverty Commission, “National Anti-Poverty Program (2010-2016) Part 2”, available at: http://maps.napc.gov.ph/napcportal/images/stories/pdf/National_Anti-Poverty_Program_Part2.pdf

6
III. KEY INFORMATION REGARDING the BuB
1. What is BuB?
The Bottom-up Budgeting (BUB) program is a project of the Human Development and Poverty Reduction Cabinet Cluster of the government. It has the following objectives:
Reduce poverty Empower citizens in the national government’s planning and budgeting process,
project implementation and monitoring; Make national government more responsive to local needs; Incentivize local governance reforms; and Strengthen devolution of government services.
2. What is the BuB process?
Bottom-up Budgeting (BuB) is a planning process which ensures funding for the
development needs of poorest/focus cities and municipalities in the budget proposals of
participating national government agencies. This initiative will also make the planning and
budgeting processes of both local and national governments more participatory through the
genuine involvement of grassroots organizations and communities, strengthening the
convergence of the delivery of national services in the community.
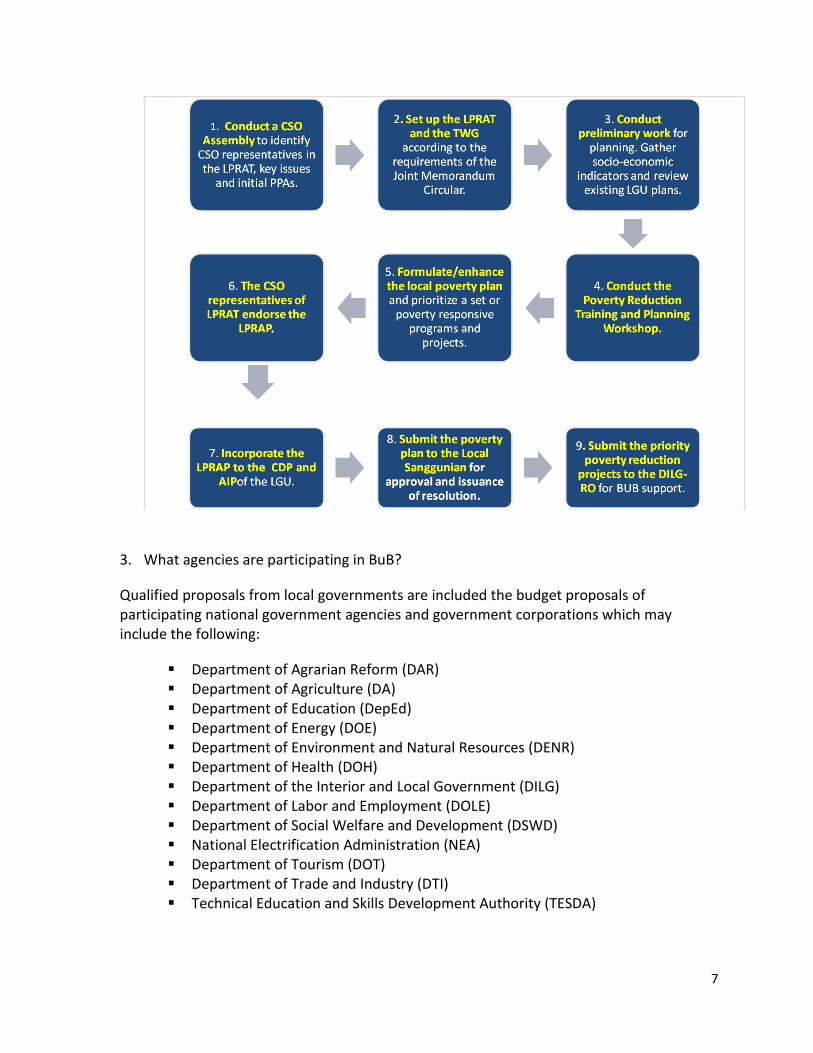
The BuB process involves the following steps:
7
3. What agencies are participating in BuB?
Qualified proposals from local governments are included the budget proposals of participating national government agencies and government corporations which may include the following:
Department of Agrarian Reform (DAR) Department of Agriculture (DA) Department of Education (DepEd) Department of Energy (DOE) Department of Environment and Natural Resources (DENR) Department of Health (DOH) Department of the Interior and Local Government (DILG) Department of Labor and Employment (DOLE) Department of Social Welfare and Development (DSWD) National Electrification Administration (NEA) Department of Tourism (DOT) Department of Trade and Industry (DTI) Technical Education and Skills Development Authority (TESDA)

8
4. The BuB requires the participation of the basic sectors in the community. What are the
basic sectors of the poor and marginalized?
Republic Act No. 8425 which created the National Anti-Poverty Commission and
institutionalized the social reform and poverty alleviation program identifies the basic
sectors. These sectors should be represented in the LPRAT team.
Farmers and landless rural workers Artisanal fisher folk Urban poor Indigenous people and cultural communities Workers in formal labor and migrant workers Workers in the informal sector Women Children Youth and students Senior citizens Persons with disabilities Victims of disasters and calamities Non-governmental organizations Cooperatives
5. What is the structure of the BuB?
The Local Poverty Reduction Action Team (LPRAT) shall be a sub-committee of the local development council.
6. What is the composition of the LPRAT?
The LPRAT is composed of representatives from the government and civil society. Typically, an LPRAT has the following members:
LDC
Econ Social Infra Environ Governance LPRAT

9
Chairperson: Local Chief Executive (LCE) Co-Chairperson: A CSO representative Members: Representatives from Government, namely: Sangguniang Lungsod/Bayan Chairperson of the Committee on Appropriation;
All local government department heads such as the Planning Officer, Budget Officer, Agriculture Officer, Social Welfare and Development Officer, and Health Officer; and
Representatives of national government agencies (NGAs) such as the DSWD municipal links, PESO manager and the DILG City/Municipal Local Government Operations Officer, the school district supervisor and Agrarian Reform Officer.
Representatives of CSOs (who are residents of the city or municipality), namely: Pantawid Pamilya Parent-Leader;
Leader from DOH-organized Community Health Teams;
Leader of Parent-Teacher Associations;
Leader of CSOs accredited by LGUs;
Leader of CSOs accredited or recognized by any NGA;
Leader of women’s groups;
Leader of basic sector organization;
Leader of other community or grassroots organizations; and
Representative from the business sector.
The LPRAT shall be composed of an equal number of government representatives (including the LCE) and non-government representatives (civil society and business). It should also be composed of at least 40% women.
7. Who should convene the local poverty reduction action team or LPRAT?
The local chief executive shall convene the local poverty reduction action team or LPRAT.
8. What projects can be proposed for funding under the BuB program?
All projects that will be submitted to the national government for funding must contribute to the following national government priorities:
a. Provision of Basic Social Services and Attainment of the Millennium
Development Goals, including poverty reduction; b. Hunger Mitigation and Elimination;

10
c. Job Generation and Inclusive Local Economic Development; and d. Climate Change Adaptation/Mitigation and Disaster Preparedness
Localities that experience a high prevalence of hunger shall include hunger
mitigation/elimination programs in their requested projects. Likewise, localities that are situated in geo-hazardous areas shall include disaster risk reduction/climate change adaptation programs in their requested projects.
9. What projects are not allowed under the BuB program?
The following projects are not allowed under the BuB program:
1. Expansion of Pantawid Pamilya Program beneficiaries (since identification of
beneficiaries is done through NHTS); 2. Housing Projects (due to the substantial cost requirement; such projects should
be requested from NHA/NHMFC which have the necessary funding); 3. Major Flood control projects (due to huge cost requirement) 4. Vaccination program (since universal coverage is already provided by DOH and
PhilHealth); 5. National Health Insurance Program (since coverage for indigents is already
provided by PhilHealth); 6. Projects related to law enforcement, fire protection, and jail management (since
these are not poverty reduction projects); 7. Construction of city/municipal hall and other multi-purpose buildings,
procurement of furniture and fixtures, (since these are not poverty reduction projects);
8. Construction of new school buildings and classrooms and teacher deployment (since this will be provided for in the FY 2013 National Budget);
9. Purchase of motor vehicles (i.e. ambulances, trucks, fire trucks); and 10. International trainings / scholarships
10. Are there other requirements in identifying BuB programs and projects? In identifying priority projects, the LPRAT must allocate eighty percent (80%) of their budget cap for projects included in the Menu of Programs provided by the national government. The remaining twenty percent (20%) of their budget cap may be allocated for new programs proposed by the LPRAT so long as it is consistent with national government priorities.
Total funding for proposed priority poverty reduction projects requested by each city and municipality from national government can be found in the attached documents of the joint memorandum circular of the BuB.

11
IV. Pre-planning preparations
1. Know the members of the LPRAT
It is important for the facilitators to know the members of the LPRAT. Civil society
representatives in the LPRAT were selected during the CSO assembly. They should
represent the basic sectors in the community. The profile of the members of the LPRAT
should give the facilitator an idea on the possible dynamic of the LPRAT during the
planning process.
2. Acquire the initial list of PPAs generated during the CSO assembly.
The facilitator should acquire an initial list of poverty programs, projects and activities
identified during the assembly from the Municipal Planning and Development
Coordinator (MPDC). It is important for the facilitator to review and familiarize
his/herself with this list and the rationale of the CSOs for coming up with the list.
3. Organize the planning data
Coordinate with the Municipal Planning and Development Coordinator (MPDC) on the
latest data that will be useful for the conduct of the planning. The data on the poverty
situation of the locality will help the LPRAT produced an evidenced-based plan with
projects aim to reduce poverty in the community. In addition to data from the MPDC,
two additional sources of data are the Community Based Monitoring System (CBMS)
and the Local Governance Performance Management System (LGPMS). The CBMS data
are available for downloading from this link:
http://maps.napc.gov.ph/downloads/index.php/2-uncategorised/1-cbms-data
The LGPMS data can be downloaded from this link:
http://www.blgs.gov.ph/lgpmsv2/cmshome/
It is important that the data that will be used for planning are accurate, up to date and specific. The following table is a checklist of data that maybe use for the planning activity. To complete the template, check the column Yes if the data source is available in your LGU, indicate the year when the data set was generated/created.

12
Database Yes No Year
Socio-Economic Profile (SEP)
Ecological Profile (EP)
Community-based Monitoring System (CBMS)
Local Governance Performance Management
System (LGPMS)
National Household Targeting System for
Poverty Reduction (NHTS-PR)
Field Health Services Information System
(FHSIS)
Registry System for Basic Sectors in Agriculture
(RSBSA)
National Farmers Registry System (NFRS)
Participatory Situational Analysis (PSA) Results
for KALAHI-CIDSS areas
Operation Timbang (OPT)
School Improvement Plans
Others
1.
2.
3.
4.
5.
4. Analyze the data.
The following poverty-related indicators may be used for planning and how they should
be interpreted.
(Source: Participatory Guide to Local Poverty Reduction Action Plan)

13
Sector / Sub-sector
Indicators Source Details Level of
Disaggregation
I. SOCIAL
A. Education
1. Elementary education
Proportion of children aged 6-12 years old who are not attending elementary school
CBMS Total number of children aged 6-12 years old who are not attending elementary school over total number of children aged 6-12 years old
City/Municipality
Elementary completion rate
LGPMS To compute, (Number of pupils who completed elementary education from public and private schools ÷ Total Number of pupils who were enrolled six years ago ) x 100
City/Municipality
Elementary participation rate
LGPMS To compute, (Total number of enrollees in public and private elementary schools aged 6-11 ÷ Total population of children aged 6-11) x 100.
Participation Rate is the ratio between the enrolment in the school-age range to the total population of that age range (DepEd Definition)
City/Municipality
Elementary participation rate (Net enrolment rate)
DepEd District Supervisor
Ratio between the enrolment in the school-age range to the total population of that age range
City/Municipality
Education of household members
NHTS (DSWD) City/Municipality
Dropout rate DepEd District Supervisor
Proportion of pupils/students who leave school during the year as well as those who complete the grade level but fail to enroll in the next grade level of the following school year to the total number of pupils/students enrolled during the previous school year
City/Municipality
Completion rate DepEd District Supervisor
Percentage of first year entrants in a level of education who complete/finish the level in accordance with the required number of years of study
City/Municipality
2. Secondary education
Proportion of children aged 13-16 years old who are not attending secondary school
CBMS Total number of children aged 13-16 years old who are not attending secondary school over total number of children aged 13-16 years old
City/Municipality

14
Secondary completion rate
LGPMS To compute, (Number of students who completed high school education from public and private schools ÷ Total number of high school students who enrolled four years ago ) x 100
Completion rate is the percentage of first year entrants in a level of education who complete/finish the level in accordance with the required number of years of study (DepEd Definition)
City/Municipality
3. Literacy Percent (%) % of illiterate members 10 years old and above
CBMS City/Municipality
Basic or simple literacy rate
LGPMS To compute, (Population aged 10 years old and above who can read and write simple messages in any language or dialect as of profile year ÷ Total population aged 10 and above) x 100
City/Municipality
B. Health and Nutrition
1. Water supply
Proportion of households without access to safe water supply
CBMS Total number of households without access to community water system, artesian deep and shallow wells or bottled water over total number of households
City/Municipality
Percent (%) of households with access to piped-in water supply (Level III)
LGPMS To compute, (Number of households with access to piped-in (Level III) water supply ÷ Total number of households in the local government unit) x 100.
Level III is a full waterworks system with individual house connections. Other water supply systems are Level I (point source) and Level II (communal). Research shows that there is a great consumers’ demand for Level III water supply service regardless of economic status and geographical location but only few households are served with such service especially those outside Metro Manila and other Highly Urbanized Cities (presented during the 3
rd Health Research for Action
National Forum - DOH)
City/Municipality
2. Sanitary toilet
Proportion of households without access to sanitary toilet facilities
CBMS Total number of households without access to water-sealed toilet or closed pit over total number of households
City/Municipality
Percent (%) of households with sanitary toilet facility
LGPMS To compute, (Number of households with sanitary toilets ÷ Total number of households) x 100.
City/Municipality

15
3. Nutrition
Proportion of children aged 0-5 years old who are malnourished
CBMS Total number of children aged 0-5 years old who are moderately or severely underweight over total number of children aged 0-5 years old
City/Municipality
Percent (%) of children aged 0-5 years old with below normal weights
LGPMS To compute, (Number of children under six (6) years of age with below normal weights ÷ Total number of children under six (6) years of age) x 100.
City/Municipality
Underweight prevalence
Operation Timbang, NNC
To compute, (Total number of underweight and severely underweight pre-school children ÷ Total number of preschool children weighed) x 100
City/Municipality
4. Children’s health
Percentage of fully immunized children
FHSIS (DOH), BHS, RHU
City/Municipality
Proportion of children with diarrhea and given ORT, ORS
FHSIS (DOH), BHS, RHU Children 0-59 months
City/Municipality
Children orally fit/given basic oral health care
FHSIS (DOH), BHS, RHU Children 12-71 months
City/Municipality
5. Morbidity
Morbidity rate per 10,000 population compared to the national target for: TB, malaria, diarrhea, HIV (prevalence rate), heart and vascular diseases, dengue
LGPMS To compute, (Number of reported cases for each illness ÷ Total number of population as of profile year) x 10,000
City/Municipality
Morbidity rate per 10,000 population for: TB, malaria, diarrhea, HIV (prevalence rate), heart and vascular diseases, dengue
FHSIS (DOH), BHS, RHU
To compute, (Number of reported cases for each illness ÷ Total number of population as of profile year) x 10,000
Province, City
6. Mortality
Crude death rate - Incidence of death per 1,000 population
LGPMS To compute, (Number of recorded deaths in the locality ÷ Total number of population as of profile year) x 1,000
It is “Crude” in a sense that all ages are represented in the rate and does not take into account the variations in risks of dying at particular ages.
City/Municipality
Crude death rate - Incidence of death per 1,000 population
FHSIS (DOH), BHS, RHU
Province, City
C. Reproductive Health

16
1. Maternal mortality
Maternal mortality rate (% of women who died due to pregnancy, childbirth, and post-natal per 1,000 live births)
LGPMS To compute, (Total number of deaths from maternal causes ÷ number of live births) x 1,000
City/Municipality
Proportion of women who died due to pregnancy related causes
CBMS Total number of women who died due to pregnancy related causes ÷ (the total number of children less than one year old plus total number of women who died due to pregnancy related causes)
City/Municipality
2. Infant and child mortality
Proportion of children under 5 years old who died
CBMS Total number of children aged 0 to less than 5 years old who died ÷ (the sum of total number of children aged 0 to less than 5 years old plus the total number of child deaths 0 to less than 5 years old)
City/Municipality
Proportion of children aged 0-1 year old who died
CBMS Total number of children aged 0 to 1 year old who died ÷ (the sum of total number of children aged 0 to 1 year old plus the total number of child deaths 0 to 1 year old)
City/Municipality
Infant mortality rate (% of infants who died per 1,000 live births)
LGPMS To compute, (Number of deaths among infants below one year old ÷ Total live births) x 1,000
City/Municipality
Proportion of children aged 1-6 years old who died
CBMS Total number of children aged 1 to 6 years old who died divided by (the sum of total number of children aged 1 to 6 years old plus the total number of child deaths 1 to 6 years old)
City/Municipality
Under 5 mortality rate
LGPMS To compute, (Number of deaths among children aged 0 to 4 years old ÷ Total live births) x 1,000.
City/Municipality
D. Shelter
1. Informal settlers
Proportion of households who are informal settlers
CBMS Total number of households occupying house and/or lots without permission of owner over total number of households
City/Municipality
Percent (%) of non-owner households
LGPMS To compute, (Number of households without houses ÷ Total number of households in the local government unit) x 100.
City/Municipality

17
Percent (%) of squatters or informal dwellers
LGPMS To compute, (Number of squatting households ÷ Total number of households) x 100
Squatter or informal dweller – one who settles on the land of another without title or right or without the owner’s consent whether in urban or rural areas. (Source: NSCB Official Concepts and Definitions for Statistical Purposes, Board Resolution No. 11 – Series of 2003)
City/Municipality
Tenure status of housing
NHTS (DSWD) City/Municipality
2. Housing material
Percent (%) of households with makeshift houses
LGPMS To compute, (Number of households who live in makeshift houses ÷ Total number of households in the local government unit) x 100.
Makeshift houses are made of salvaged or improvised materials.
City/Municipality
Proportion of households living in makeshift housing
CBMS Total number of households living in housing with makeshift roof and/or walls over total number of households
City/Municipality
Housing structure (construction materials of the roof and walls)
NHTS (DSWD) City/Municipality
3. Electricity
Percent (%) of households with electricity
LGPMS To compute, (Number of households with electricity ÷ Total number of households in the local government unit) x 100.
City/Municipality
Status of energization (number of barangays, sitios, and connections)
National Electrification Administration (NEA)
By province and electric cooperative Barangays, sitios
Sector / Sub-sector
Indicators Source Details Level of
Disaggregation
E. Public Order and Safety
1. Crime Incidence of index crime (per 100,000 population)
LGPMS To compute, ( Total Number of Index Crime ÷ Projected population as of profile year) x 100,000
Index Crime refers to those violations of the penal code considered having socio-economic significance and occurs with sufficient regularity. This includes crimes versus persons (murder, homicide, physical injury, and rape), and crimes versus property (robbery and theft).
City/Municipality

18
Incidence of non- index crime (per 100,000 population)
LGPMS To compute, (Total Number of reported Non-Index Crimes as of profile year ÷ Projected Population as of profile year) x 100,000.
Non-Index crime refers to all other crimes not classified as index crimes. These are mostly composed of victimless offenses (e.g. crimes against national security, crimes against the fundamental laws of the state, crimes against public order, crimes against public morals, and violations of special laws). Non-index crimes include illegal gambling, illegal possession of firearms, carnapping, illegal drugs, kidnapping, serious illegal detention, and smuggling, among others.
City/Municipality
2. Disaster risk
Areas susceptible to flooding and landslide
GDIS Map Viewer
The GDIS is an integrated web-based mapping application that contains GIS layers such as 1:50,000 scale Flooding and Landslide Susceptibility Map, 1:50,000 scale Geology Map, location of Mineral Resources and Geological, Reference Databases.
City/Municipality
II. ECONOMIC
1. Income Proportion of households with income below the poverty threshold
CBMS Total number of households with income below the poverty threshold over total number of households
City/Municipality

19
Poverty incidence - % of population living below the Annual Per Capita Poverty Threshold
LGPMS Poverty incidence means that the per capita income is less than the per capita poverty threshold.
Poverty threshold is the minimum income required to meet the basic food and non-food requirements (i.e., Basic food requirements are currently based on 100% adequacy for the Recommended Energy and Nutrient Intake (RENI) for protein and energy equivalent to an average of 2000 kilocalories per capita, and 80% adequacy for other nutrients. On the other hand, basic non-food requirements, indirectly estimated by obtaining the ratio of food to total basic expenditures from a reference group of families, cover expenditure on: 1) clothing and footwear; 2) housing; 3) fuel, light, water; 4) maintenance and minor repairs; 5) rental of occupied dwelling units; 6) medical care; 7) education; 8) transportation and communication; 9) non-durable furnishings; 10) household operations; and 11) personal care)
To answer, get the percentage of the population where the Annual Per Capita Income is lower than the Annual Per Capita Poverty Threshold.
Annual Per Capita Income is determined by computing the annual family income divided by family size.
City/Municipality
Proportion of households with income below the food threshold
CBMS Total number of households with income below the food (subsistence) threshold over total number of households
City/Municipality
Proportion of households who experienced food shortage
CBMS Total number of households who experienced food shortage over total number of households
City/Municipality

20
Sector / Sub-sector
Indicators Source Details Level of
Disaggregation
2. Employment Proportion of persons in the labor force who are unemployed
CBMS Total number of persons aged 15 and above who are not working but actively seeking work over total number of labor force
City/Municipality
Unemployment rate - Percent (%) of residents aged 15 years old and above who are unemployed
LGPMS To compute, (Total number of unemployed persons ÷ total number of persons in the labor force) x 100
Unemployed persons include all those, who during the reference year are 15 years old and over as of their last birthday, who have no jobs or businesses and are actively looking for work
Also considered unemployed are persons without jobs or businesses who are reported not looking for work because of their belief that no work was available or because of temporary illnesses or disabilities, bad weather, pending job applications or waiting for job interviews.
Labor force refers to population 15 years old and above who are either employed or unemployed.
City/Municipality
Underemployment rate - % residents aged 15 years old and above who are underemployed
LGPMS To compute, (Total number of underemployed persons ÷ total number of employed persons x 100)
It indicates proportion of working population who are underemployed
City/Municipality
Employment of household members
NHTS (DSWD) City/Municipality
Employed persons
Local PESO (Public Employment Service Office)
City/Municipality
5. Review and familiarize self with the LGU plans
It is important that the facilitator is familiar with the different plans of the LGU.LGUs
produce long term, medium term and short term plans. It is important to acquire a copy of
each of the plan to be familiar with the documents.
Comprehensive Land Use Plan A long-term plan for the management of the local territory. It identifies areas where development can and

21
cannot be located and directs public and private investments accordingly. It contains the spatial strategies, the land use policies, land use related programs and the Zoning Ordinance, which is the CLUP’s implementing tool.
Comprehensive Development Plan
A long term (6-10 year) multi-sectoral development plan which embodies the vision, sectoral goals, objectives, development strategies and policies within the term of LGU officials and the medium-term. It contains corresponding PPAs which serve as primary inputs to investment programming and subsequent budgeting and implementation of projects for the growth and development of local government territories.
Executive-Legislative Agenda (ELA)
Term-based plan covering a 3-year period This document is mutually developed and agreed upon by both the executive and legislative departments of an LGU.
Local Development Investment Plan (LDIP)
A basic document linking the local plan to the budget. It contains a prioritized list of PPAs which are derived from the CDP in the case of cities and municipalities,
Annual Investment Plan (AIP) the AIP constitutes the annual slice of the LDIP, referring to the indicative yearly expenditure requirements of the LGUs’ programs, projects and activities (PPAs) to be integrated into the annual budget. It constitutes the total resource requirements for the budget year, including the detailed annual allocation of each PPA in the annual slice of the LDIP and the regular operational budget items broken down into Personal Services, Maintenance and Other Operating Expenses and Capital Outlay. (JMC 1, 2007)
6. Get a copy of the latest version of the BuB Joint Memorandum Circular and its
attachments from the DILG or NAPC. The JMC can also be downloaded from this
website: http://maps.napc.gov.ph/napcportal/
7. Coordinate with the MPDO to ensure the documentation and reporting requirements
are completed and submitted to the regional office of the DILG. Ensure that the
Logistical requirements for the workshop – training kit programs, attendance sheets, name tags,
all sorts of papers and pens, laptops, LCDs, microphones, etc. are also coordinated with the
MPDO.
8. Inform the representatives of the national agencies, MLGOO, NAPC and DSWD
representatives, of the date of the planning workshop.

22
V. Conduct of the actual workshop
Overview
The main task of the facilitator is to conduct the actual BuB planning workshop of the local
government unit. A whole day should be dedicated in conducting this workshop. In the morning
of the planning workshop of the LPRAT, the facilitator shall meet only with the CSO members of
the LPRAT to orient the CSO participants on the basic concepts and processes of local public
finance concepts.
In the afternoon, the facilitator shall then meet with the LPRAT to conduct the actual planning
workshop. The following are the sessions of the planning workshop.
The following discussions should guide you in conducting the different sessions of the planning
workshop.
Sessions of the Actual Planning Workshop
Session 1. Pre-planning orientation of CSO members on Local Public Finance
Session 2. Opening remarks from the local chief executive and introduction of
participants
Session 3. Objective setting
Session 4. Briefing on BuB by the MLGOO or the NAPC representative
Session 5. Presentation and Validation of Socio Economic Data of the community:
problem tree analysis
Session 6. Crafting of pro-poor strategies/targets
Session 7. Prioritizing pro-poor programs, projects and activities
Session 8. Reporting and documentation requirements

23
Session 1. The CSO orientation on the basics of local public finance
Session participants: CSOs and business sector members of the LPRAT only
Objective: To deepen understanding of the local planning process towards active engagement
in local public finance
Background: This session entitled “Local Public Finance 101” is an introductory session to the formulation of LPRAP. A brief discussion on local public finance will contextualize the BuB process vis-a-vis local planning and budgeting. The goal is to provide a deeper understanding of the local planning-budgeting process for better appreciation of the importance of the LPRAP. Session references:
• DILG-NEDA-DBM and DOF JMC 1, series of 2007, entitled "Guidelines on the Harmonization
of Local Planning, Investment Programming, Revenue Administration, Budgeting and Expenditure Management"
• Updated Budget Operations Manual, 2008 (UBOM) of the DBM • Rationalized Planning System of the Philippines, 2005 (DILG) • A Manual: How to Formulate an Executive and Legislative Agenda (ELA) for Local
Governance and Development, 2004 (DILG-NEDA / Philippines-Canada Local Government Support Program)
Session outline: • General principles, different elements/components of local public finance • Plan-Budget Link Model • Areas of people’s participation
Session 2. Opening the Planning Session
Open the session with a remark from the Mayor and the introduction of participants. Follow
the introduction with a quick explanation of the objectives of the planning which is
“to come up with a Local Poverty Reduction Action Plan that is relevant to the context
of the community through a participatory process.”

24
Session 3. Briefing on the BuB
After clarifying the objective of the planning exercise, present the background material on the
BuB to ensure that all the members of the LPRAT have the same level of understanding
regarding BuB.
Session 4. Presentation and validation of situation analysis: The
Problem Tree
As presented by the C/MPDC, the key conditions that represent a baseline status of your LGU focuses on four (4) development sectors and sub-sectors namely: • Social (education, shelter, nutrition and health, including reproductive health) • Economic (livelihood and employment) • Infrastructure Support (water and sanitation/WATSAN, electricity) • Environment (disaster). In the analysis of poverty problems and issues, use of sex-disaggregated data generated especially on the social sectors is highly encouraged. This is crucial in order for the LPRAT to identify the gaps to be translated to goals and subsequently determine the needed actions or interventions, particularly towards poverty reduction. Let us know summarize the scenario in your LGU by developing a problem tree.
Developing a Problem Tree http://evaluationtoolbox.net.au/index.php?option=com_content&view=article&id=28&Itemid=134 A problem tree involves writing all the known causes to an identified problem in a negative form (i.e. high incidence of malnutrition, low productivity of farmers/fisher folks, high incidence of grade school drop-outs, etc.). Figure 2 shows how a Problem Tree looks like.

25
Figure 2. Problem Tree Model
Steps in developing a problem tree: To be able to “create” a problem tree or problem trees which will present an overview of all the known causes and effect to an identified problem/s, the following are the steps needed to be undertaken: Step 1:The first step in developing the problem tree is to identify the problem that the project seeks to address. As the members of the LPRAT are government and non-government representatives, the group will have to discuss and agree on what the core problem is. For the CSOs, you have done this during your CSO Assembly while the LGUs do this as a regular planning activity. Ideally projects should have a specific problem (e.g. low productivity of famers/fisher folks in Barangay ____) which can be addressed if the change, that is the implementation of the project, is to occur. A vague or broad problem (e.g. increasing productivity of all farmers/fisher folks) will have too many causes for an effective and meaningful project to be developed. Step 2:Identify the causes and effects After agreeing on the core problem, participants discuss what the direct causes and effects of the problem are. Each cause statement needs to be written in negative terms. Figure 3 Developing the linear cause-effect relationship for a problem tree Participants need to continue to repeat the process on further horizontal lines until they are no longer able to identify any further underlying causes, as shown in Figure 3.
CORE PROBLEM CORE PROBLEM
IMMEDIATE EFFECT/S
IMMEDIATE CAUSE/S
SECONDARY CAUSE/S

26
Figure 3. Cause-Effect Relationship for a Problem Tree
The sequence of cause and effects should be reviewed to make sure that they are clear and make logical sense (e.g. Does this lead to that? Or is there a missing step? Is this the effect of that happening). It is important to ensure that there is agreement among the participants. If there is more than one cause to an effect, you can place these side by side.

27
Income of small farming households fall
below poverty threshold (average of
PhP2500-3000/month vs. poverty
threshold of PhP6195/family
requirement for basic needs)
High cost of production as fertilizer
requirement and prices of inputs
increase
Low farm yield
Soil is depleted
Small farmers are very dependent on a capital-intensive, inefficient (high cost-
low yield/income) and environmentally harmful sugar-based monoculture
Poor nutrition
Child labor
Increased pressure to
clear forests
Increased pressure to
further intensify farming
further harming agri
ecology
Limited capacity of farmers to adapt
sustainable agricultural techniques
Farmers are unable to put up
alternative/ non-land sources of
income
Inadequate
farming facilities
for diversification
Weak support
system
forfarmers
Inadequate
production
capital
Inadequate capital and
skill for alternative
livelihood
Limited
knowledge on
sustainable
technologies
Weak LGU system for
agricultural services
delivery
Limited capacity
of farmers’
organizations
Inadequate agricultural
extension services
Farmers do not have
access to water for
irrigation
Sample tree Analysis for Farming Sector

28
Instructions in conducting the actual activity: a. Participants will be divided into groups, each group representing an LGU.
b. Materials needed:
- Manila paper or Meta cards (yellow for the core problem, green for the immediate effect, pink for the immediate cause and blue for the secondary cause)
- Pentel pen - Adhesive tape
c. The core problem is written down in the middle of the paper, or on a meta card in the middle of
a wall. Things to help define the core problem include lessons from previous projects, the stakeholder analysis, and other research. If there seems to be more than one core problem, it may be best to develop a problem tree for each one.
d. Identify the causes and effects. There are a couple of ways to undertake this. Participants can
either collectively brainstorm all the negative statements about the problem at hand, and a facilitator writes each negative statement down on a piece of paper. The statements would then be placed on a wall, for the participants to analyse and reorder. Alternatively, participants could work through the cause and effect on a sequential basis, starting from the core problem. The immediate causes to the problem are placed in a line below that of the core problem. The immediate effect is placed above the problem. Any further or subsequent effects are placed above the line of immediate effects.
Once the order or placement of all the cause and effect relationships is agreed, they can be linked with vertical lines. Horizontal lines can be used to join related causes or effects. The result is a problem tree which outlines the cause and effect relationship between the different levels.
e. Each group will present its Problem Tree
f. Training team documents the presentation – the Problem Tree and discussion of each group

29
Session 5. Crafting Poverty Reduction Strategies: The Solution Tree Reversing the problem tree, by replacing negative statements with positive ones, creates a solution tree. A solution tree identifies means-end relationships as opposed to cause-effects. This provides an overview of the range of projects or interventions that need to occur to solve the core problem.
Income of small farming households to
increase
Low cost of production as fertilizer
requirement and prices of inputs
increase
High farm yield
Soil is enriched
Small farmers are not dependent on a capital-intensive, inefficient (high cost-
low yield/income) and environmentally harmful sugar-based monoculture
Adequate nutrition
No Child labor
No forests clearing
Decreased harmful
farming practices so as
not to damage agri
ecology
Enhanced capacity of farmers to
adapt sustainable agricultural
techniques
Farmers are able to put up
alternative/ non-land sources of
income
Substantial farming
facilities for
diversification
Strong support
system
forfarmers
Adequate
production
capital
Adequate capital and
skill for alternative
livelihood
Unlimited
knowledge on
sustainable
technologies
StrongLGU system for
agricultural services
delivery
Unlimited
capacity of
farmers’
organizations
Adequate agricultural
extension services
Farmers have access to
water for irrigation
Sample Solution Tree Analysis for Farming
Sector

30
Session 6. Identifying and Prioritizing PPAs Session Objective: At the end of the session, the participants are able to:
• Learn how to identify and prioritize programs, projects and activities Once there is agreement on the major development issues, the participants should proceed with the process of identifying and prioritizing programs, projects and activities (PPAs). Tool __, Problem Prioritization will be used to assist issues and concerns on prioritizing activities. Other steps and criteria in prioritizing PPAs are discussed in the succeeding paragraphs. The session consists of:
• Definition of programs and projects • Identifying where programs and projects, and legislation, if needed, are to be derived,
from: – Data generated from the Problem-Solution Tree Analysis – CBMS-recommended tools in diagnosing poverty – LGPMS information as guide in determining appropriate policy interventions, including
legislations to address critical performance and services areas that posted the widest gap or inadequacies
• Prioritization of PPAs: Concepts, Steps, Ranking • Preparation of Project Brief
Session 7. LPRAP Documentation Reporting and Documentation Requirements
Session Objective: At the end of the session, the participants are able to:
• Come up with a final list of identified projects – the LPRAP, using the template provided in the BuB JMC
The last session involves a discussion on how to report and document the output of the previous sessions – a list of the identified tangible projects- the LPRAP, using the template provided in Annex ___ of the JMC on BuB. As required in the JMC, the LPRAP has to be approved by the LPRAT, specifically endorsed by three (3) CSO members and signed by the City/Municipal Mayor A Project Brief for each of the projects listed in the LPRAP is likewise required in the JM. The above-listed documents are then forwarded to the local sangguniang for adoption, through the issuance of a resolution - “Resolution Approving the List of Anti-Poverty Reduction Projects.” The submission of the LPRAP should contain the following:
• Cover letter signed by the city/municipal mayor; • List of Priority Projects using the prescribed format, with ALL pages signed by the three
(3) CSP representatives • Project brief for each proposed projects • Copy of Sangguniang Resolution approving the list of projects