facies, diagenesis and pore characterisation of the …
TRANSCRIPT

PhD Thesis | 2019
1
FACIES, DIAGENESIS AND PORE
CHARACTERISATION OF THE LOWER
CARBONIFEROUS HODDER MUDSTONE
FORMATION, BOWLAND BASIN, UK
A thesis submitted to The University of Manchester for the
degree of Doctor of Philosophy in the Faculty of Science and
Engineering
2019
TIMOTHY M. OHIARA
SCHOOL OF EARTH AND ENVIRONMENTAL SCIENCES
The University of Manchester

PhD Thesis | 2019
2
List of contents
Title page…………………………………………………………………………………………………………………. 1
List of contents ................................................................................................................................................ 2
List of figures ................................................................................................................................................... 7
List of tables ................................................................................................................................................... 16
Abstract ............................................................................................................................................................ 18
Declaration ..................................................................................................................................................... 20
Copyright statement ................................................................................................................................... 20
Dedication ....................................................................................................................................................... 21
Acknowledgements ..................................................................................................................................... 22
The author ...................................................................................................................................................... 23
1 Introduction .......................................................................................................................................... 25
Research rationale ..................................................................................................................... 25
The Bowland Basin geologic setting ................................................................................... 28
1.2.1 Palaeogeography ................................................................................................................ 29
1.2.2 Stratigraphy ......................................................................................................................... 32
Research aims .............................................................................................................................. 35
Research objectives ................................................................................................................... 36
Dataset and methodology ........................................................................................................ 38
1.5.1 Core description, logging and sampling .................................................................... 40
1.5.2 Optical thin section petrography ................................................................................. 41
1.5.3 SEM microscopy ................................................................................................................. 41
1.5.4 Micron-scale mineral mapping and SEM cathodoluminescence ..................... 42
1.5.5 Bulk X-ray Powder Diffraction ...................................................................................... 43
1.5.6 Major and trace elemental analysis ............................................................................ 44
1.5.7 Total organic carbon and Rock-Eval........................................................................... 44
1.5.8 Nitrogen gas adsorption .................................................................................................. 45
PhD Thesis | 2019
3
1.5.9 X-ray computed tomography ........................................................................................ 49
Thesis synopsis............................................................................................................................ 50
References ..................................................................................................................................... 52
2 A Review on Mudstones .................................................................................................................... 60
Introduction .................................................................................................................................. 60
Mudstone mineralogy ............................................................................................................... 61
2.2.1 Detrital (extra-basinal) components .......................................................................... 62
2.2.2 In-situ derived (intra-basinal) components ............................................................ 62
Mud sedimentation .................................................................................................................... 68
Mud depositional environments .......................................................................................... 70
2.4.1 Shallow marine (muddy coastlines, continental shelves and slopes) ........... 70
2.4.2 Deep marine basins ........................................................................................................... 72
2.4.3 Lacustrine ............................................................................................................................. 73
2.4.4 Alluvial plains ...................................................................................................................... 74
Diagenesis ...................................................................................................................................... 75
Mudstone facies characterisation ........................................................................................ 79
Mudstones: self-sourcing hydrocarbon reservoirs ....................................................... 88
2.7.1 Mudstone porosity and permeability......................................................................... 89
Conclusion ..................................................................................................................................... 94
References ..................................................................................................................................... 95
3 Mud-rich Calciclastic Facies in the Viséan Submarine Fans of the Bowland Basin, UK
104
Introduction ............................................................................................................................... 106
Tectonic evolution and stratigraphy ................................................................................ 108
3.2.1 Viséan stratigraphy of the Bowland Basin ............................................................ 111
Methods ....................................................................................................................................... 114
Results .......................................................................................................................................... 116

PhD Thesis | 2019
4
3.4.1 Sedimentological elements and facies description ............................................ 116
3.4.2 Facies architecture and depositional geometries .............................................. 135
Discussion ................................................................................................................................... 143
3.5.1 Carbonate turbidite facies classification ................................................................ 143
3.5.2 Depositional setting ....................................................................................................... 145
Conclusion .................................................................................................................................. 156
References .................................................................................................................................. 157
4 Diagenetic Evolution in the Carbonate- and Siliceous-rich Hodder Mudstone
Formation, Bowland Basin, UK ............................................................................................................ 166
Introduction ............................................................................................................................... 168
Study area ................................................................................................................................... 170
Research data and methods ................................................................................................ 172
Results .......................................................................................................................................... 175
4.4.1 Lithology description .................................................................................................... 175
4.4.2 Bulk XRD composition .................................................................................................. 178
4.4.3 Palaeo-environmental proxies .................................................................................. 180
4.4.4 Petrographic description ............................................................................................. 185
4.4.5 Organic matter characterisation and maturity data ......................................... 186
4.4.6 Detrital components ...................................................................................................... 189
4.4.7 Authigenic minerals ....................................................................................................... 191
4.4.8 Fractures ............................................................................................................................ 201
Discussion ................................................................................................................................... 205
4.5.1 Paleo-redox conditions ................................................................................................. 205
4.5.2 Paragenetic sequence .................................................................................................... 206
Implications ............................................................................................................................... 217
Conclusion .................................................................................................................................. 219
References .................................................................................................................................. 220

PhD Thesis | 2019
5
5 Pore Morphology and Nanopore Characterisation of the Hodder Unconventional
Reservoir, Bowland Basin, UK .............................................................................................................. 259
Introduction ............................................................................................................................... 260
5.1.1 Lower Carboniferous Bowland Basin shale gas potential .............................. 264
5.1.2 Samples and methods ................................................................................................... 266
Results .......................................................................................................................................... 272
5.2.1 Lithology description and sample mineralogy .................................................... 272
5.2.2 Pore types and morphology ........................................................................................ 278
5.2.3 Pore size quantification ................................................................................................ 283
Discussion ................................................................................................................................... 293
5.3.1 Sample composition and qualitative pore observations ................................. 293
5.3.2 Mineral composition and pore quantification ..................................................... 295
5.3.3 Implication for Bowland-Hodder unconventional shale gas exploration . 299
Conclusion .................................................................................................................................. 301
References .................................................................................................................................. 301
6 Summary, conclusion & future work ........................................................................................ 338
Summary of Results and Implications ............................................................................. 338
6.1.1 Study 1 (Chapter 3): A characterisation of sedimentary facies and
depositional controls of the studied succession .................................................................. 338
6.1.2 Study 2 (Chapter 4): The diagenetic evolution of minerals in Hodder
Mudstone ............................................................................................................................................. 341
6.1.3 Study 3 (Chapter 5): Qualitative descriptions and quantitative analysis of
pores in the Hodder Mudstone ................................................................................................... 343
Conclusion .................................................................................................................................. 344
Recommendations for future work .................................................................................. 346
6.3.1 Sediment provenance analysis .................................................................................. 347
6.3.2 Clay mineral diagenesis ................................................................................................ 347

PhD Thesis | 2019
6
6.3.3 Multi-scale high-resolution image-based pore characterisation ................. 348
References .................................................................................................................................. 350
7 Appendix .............................................................................................................................................. 351
Sample list and data acquired ............................................................................................. 351
Graphic logs ............................................................................................................................... 354
XRD Diffractograms and Quantitative Data ................................................................... 365
XRF Major elemental data .................................................................................................... 446
Carbonate Pore Systems of the Carboniferous Hodder Mudstone Formation,
Bowland Basin, UK* ............................................................................................................................. 450

PhD Thesis | 2019
7
List of figures
Figure 1.1: Palaeogeographical reconstruction for the Carboniferous of southern Britain.
Maps adapted from Dean et al., (2011). AlB- Alston Block; AsB- Askrigg Block; CB-
Craven Basin/Bowland Basin (red boxed); CH- Cheviot High; CuB- Culm Basin; DB-
Dublin Basin; LH- Leinster High; ML–D-Manx-Lake District High; MV- Midland Valley;
NT- Northumberland Trough; RB- Rossendale Block; SB- Shannon Basin; SUH- Southern
Uplands High. ................................................................................................................................................. 31
Figure 1.2: Summarised mega sequences and stratigraphic column of the Lower
Carboniferous UK East Midlands as modified from Fraser and Gawthorpe (1990),
Waters et al. (2009) and Waters et al. (2011). Global chronostratigraphy follow
Gradstein et al. (2012) and regional stages and substages taken from Holliday and
Molyneux (2006). Miospores and Ammonoids biostratigraphic zonation follow Waters
et al. (2009) and Waters and Condon (2013). Bowland Basin lithostratigraphic column
and nomenclature around Bowland Forest adapted from Waters et al. (2009). ................ 33
Figure 1.3: Location map of the study area (a) highlighting major bounding fault lines
and study area. Map adapted from Evans and Kirby (1999). Borehole location of core
samples in (b) map taken from Google map data ©2019 Google. Borehole selection
based on the presence of argillaceous mudstone beds. ................................................................ 36
Figure 1.4: Thesis logical workflow from literature review, data collection and analyses
and final research output .......................................................................................................................... 40
Figure 1.5: An illustration of typical isotherm curves with adsorption branch (red) and
desorption branch (green). Regions (i) representing the onset of microporous filling, (ii)
monolayer filling and (iii) multilayer filling of pores .................................................................... 47
Figure 2.1: Deep sea sedimentary processes for fine-grained sediments modified after
Stow et al. (1996) ......................................................................................................................................... 72
Figure 2.2: General scheme of kerogen types and thermal evolution of kerogen
presented on a modified Van Krevelen’s diagram (Tissot & Welte 1978). Changes to
kerogen is brought about by increased heat during burial (Boyer et al. 2006) and
characterised by the generation of non-hydrocarbon gases (CO2 & H2O), oil, wet gas and
dry gas. Type I kerogen: generated from lacustrine environments; Type II kerogen:
typically from marine environments with reducing conditions; Type III kerogen:
Derived primarily from terrestrial plant debris; Type IV kerogen: “dead carbon” derived
from older sediments redeposited after erosion ............................................................................. 79

PhD Thesis | 2019
8
Figure 2.3: Diagrammatic illustration on a ternary plot of an example of the complete
three-component classification using clay, diatoms, and nannofossils as the three end
members, from Dean et al. (1985) ........................................................................................................ 84
Figure 2.4: Ternary plot illustrating sand, silt, and clay end members of mudstones
dominated by detrital components, from Macquaker and Adams (2003) ............................ 85
Figure 2.5: Compositional classification for fine-grained sediments and sedimentary
rocks as proposed by Milliken (2014) ................................................................................................. 85
Figure 2.6: Nomenclature guidelines for fine-grained sedimentary rocks: texture (grain
size), Lazar et al. (2015) ............................................................................................................................ 86
Figure 2.7: Nomenclature guidelines for fine-grained sedimentary rocks: composition,
Lazar et al. (2015) ........................................................................................................................................ 87
Figure 2.8: Summary diagram of the major stages in mudstone burial diagenesis in
relation to pore types, after Loucks et al. (2012) ............................................................................ 92
Figure 2.9: Schematic representation of pore classification by Loucks et al. (2012) ........ 93
Figure 3.1: (a) Location and geological map of the Bowland Basin showing bounding
faults and surrounding areas. Approximate location of studied wells is shown in (b)
inset in Figure 3.1(a). Geological map, structural elements and surface exposures
adapted from the BGS 1:250 000 Liverpool Bay Sheet (Clarke et al. 2018) ...................... 110
Figure 3.2: A simplified summary diagram on the Lower Carboniferous
tectonostratigraphic evolution of the Bowland Basin. (a) Tournaisian to Early Viséan
structural configuration showing emergent/shallow marine areas (northwest and
southeast) and the development of carbonate ramp slope on a simple half-graben tilting
towards the basin margin fault (southeast) (present-day Pendle Monocline). (b) Viséan
to Namurian structural configuration showing progressive extension, hanging wall
segmentation by a series of NE-SW-trending transfer faults and NE-SW-trending
antithetic faults. Diagrams adapted from Gawthorpe (1987) approximate location of
studied samples is indicated. (c) Schematic conceptual diagram (not drawn to scale)
showing the sedimentary depositional architecture of the Bowland Basin and sequence
stratigraphic units (Andrews 2013). ................................................................................................. 111
Figure 3.3: Viséan (Late Chadian to Asbian) lithostratigraphy of the study area shown in
Figure 3.1. Sedimentary thicknesses and facies may vary across basin (after Gawthorpe
1985) .............................................................................................................................................................. 113

PhD Thesis | 2019
9
Figure 3.4: Showing mm to cm scale continuous and discontinuous wavy laminations.
Normal and inverse-to-normal lamina-set are common in F1 facies. Clay-rich ripple
laminae eroded surfaces with a combined effect of sediment compaction. Visible
skeletal fragments (blue) are mostly of abraded crinoid. ......................................................... 118
Figure 3.5: Example of interlaminated rudstone (a), packstone, wackestone and
mudstone laminae (b). These lithologies make up the bulk of the F1 facies at varying
thicknesses. Grain imbrication is mostly horizontal. .................................................................. 119
Figure 3.6: Core images highlighting the textural features of the F1 facies recognised by
their distinctive wavy laminations and bioclast content. Facies comprise transitory
rudstone, packstone, wackestone and mudstone laminae ....................................................... 121
Figure 3.7: Textural features of the F2 facies showing core sample with lamina-
disruptive bioturbation trails. Bioturbation traces are preserved as anastomosing traces
typical of Chondrites (arrow indication) with the deposition of relatively larger grains of
bioclast fragments in burrows ............................................................................................................. 123
Figure 3.8: Unlaminated sand- and silt-rich facies: (a) showing core image of facies
comprising very fine quartz-rich sand facies (B) from MHD1 core. Grain size in (c) and
(d) is between silt to very fine carbonate-rich sand. Distinguishing feature between the
two examples is the dominance of quartz grains in (b) and dominance of rhombic
dolomite crystals in (d). .......................................................................................................................... 124
Figure 3.9: Unlaminated clay-dominated mudstone showing (a), core of a dull-lustred
mudstone; (b) photomicrograph of apparently homogenous mud and (c) mineral
component of F4 constituting calcite, quartz and muscovite (mica) surrounding matrix
are dominated by kaolinite. .................................................................................................................. 127
Figure 3.10: Lamina set geometries in planar laminated F5 facies. (A) Showing the
resultant effect of intermittent erosion of silt- and clay-rich lamina and formation of
internal cross-ripples in silt-rich layers (XL). Clay-rich laminae are susceptible to
erosion and easily re-suspended hence apparent erosional surfaces (ES), limited
preservation and thin sub millimetre thickness in (A). Evidence of submarine erosion
can be seen in the formation of lenticular clasts (LL) from sculpted unconsolidated
water-rich muddy sediments. (B) Shows normally graded laminae sets of silt/clay
couplets as indicated by the arrows. Silt grade laminae represents traction carpets and
suspended load aspects (clay grade lamina) typical of waning turbidity flow. Inclination

PhD Thesis | 2019
10
of laminae may due to post-depositional deformation most likely from a section of
convoluted beds. ........................................................................................................................................ 128
Figure 3.11: F6 facies showing planar lamination features (a, b & c) and convolute
laminations. Carbonate silt-rich lamina overlying clay-rich planar laminae bounded by a
sharp erosive in the photomicrograph. SEM micrograph of silt/clay laminae contacts (b)
and (c). SEM images highlight the mineralogical variation of a dolomite-cemented (D)
mud-rich lamina and a calcite-cemented silt-rich lamina. Effects of soft sediment
disruption can be seen in the core sample (d), and in petrographic sections (e) & (f). 130
Figure 3.12: F6 facies in core photo (a) showing poorly sorted, conglomeratic fabric.
Micrograph examples show clasts of mostly fragmented crinoids, gastropods (Gast.),
pyritized shells and other shell debris.(b) and (c) reveals translational lineations
(dashed lines) due to internal deformation .................................................................................... 131
Figure 3.13: Typical F7 facies showing (a) & (b) core images of sub-angular to sub-
rounded clasts in mostly sandy matrix. Pencil tip in (a) used for scale. Thin section
photograph (c) shows examples of foraminifera (arrow-indicated) present in lithoclasts.
.......................................................................................................................................................................... 134
Figure 3.14: Correlation of cores MHD9, MHD12, MHD5, MHD4, MHD8, MHD1 & MHD11
from the proximal (west) to distal (east) of the study area. This 3.62 km transect shows
the depositional architecture of the Viséan succession in the study area. The
depositional architecture shows a deepening sedimentary sequence both laterally from
west to east, and vertically. Interval 1 packages are dominated by resedimented
carbonates while interval 2 comprise silt- and clay-rich mudstones. The datum is taken
across a regional sequence boundary (B1-B2a) band above interval 2. Notice a possible
impact of calciclastic facies in interval 2 muddy deposits in MHD1 that is likely
associated with deformation of planar laminated beds in MHD8 and MHD11. Reference
to borehole location is shown in inset and reference for figure 3.15 and 3.16 transects.
Gradation pattern is F3>F2>F1where F3 is coarser and F1 is finer due to ....................... 137
Figure 3.15: Northwest to southeast transect across boreholes MHD1, MHD18 and
MHD3 in an apparent dip direction. Transect illustrates the depositional architecture of
the Viséan Succession oblique to the basin slope. This section highlights the asymmetric
thickening of interval 2 facies towards the southeast. There is an increased intensity in
convoluted laminae towards the southeast. Location reference for boreholes is shown in
Figure 3.14. .................................................................................................................................................. 138

PhD Thesis | 2019
11
Figure 3.16: Transect illustrating thickening and deepening of interval 2 facies toward
an apparent depocentre as seen in Figure 3.15. The intensity of soft sediment
deformation also increases towards the deeper section with an apparent impact from
debris flow deposits. The locations of core logs are shown in Figure 3.14. ....................... 139
Figure 3.17: Continuous core section showing alternation of sand- (light grey) and mud-
rich (dark grey) facies of interval 1. Image constitutes facies F1, F2 and F3 distinguished
by bioclast content and degree of lamination. Constituent lithologies are mainly
rudstones, packstones, wackestones and mudstones. Interval 1 has a general fining
upwards trend ............................................................................................................................................ 141
Figure 3.18: Schematic illustration of major depositional environments existing in a
muddy calciclastic submarine fan system with multiple sediment sources. Illustration is
adapted from Mud-rich multiple source ramp model of Stow & Mayall (2000) and the
calciclastic model of Payros & Pujalte (2008). Mud–rich fan models are characterised by
extensive sheets. ........................................................................................................................................ 149
Figure 3.19: Models (not drawn to scale) for soft sediment deformation within the basin
as adapted from Gawthorpe & Clemmey (1985). Model (a) is a typical pervasive
deformation of slide sheets; (b) Deformation concentrated on glide planes; (c)
concentrated deformation in lower part of slide. The F5, F6 and F7 facies seen in
interval 2 are most likely associated with soft sediment deformation. ............................... 150
Figure 3.20: (a) Sketch map of Bowland Basin during regional erosion in the Early
Visean from Riley (1990) with study area located in green spot. (b) Graphic
reconstruction of the main depositional environments and possible processes
responsible for the facies of the studied Bowland Basin Viséan succession. Deposition
was tectonically controlled with influx from biogenic and terrigenous sediments
deposited along slope and basin plain. Calciturbitic flows were responsible for the
deposition of calciclastic sediments along channel and levee complexes and floor fans.
Hemipelagic fallout and mud-rich turbidite cloud produced muddy deposits across the
depositional environment. Slope failures resulted in debris flows and soft sediment
deformation ................................................................................................................................................. 155
Figure 4.1: Location map of the Bowland Basin, showing major bounding faults (dashed
lines), the Bowland High on the north-western basin margin and the Central Lancashire
High to the southeast. Study samples were taken from the MHD boreholes. Map
modified after Evans and Kirby (1999). Red-filled triangles are location of key

PhD Thesis | 2019
12
hydrocarbon exploration wells onshore Bowland Basin, and green-filled triangles are
location studied borehole cores. ......................................................................................................... 171
Figure 4.2: A representative core lithologic log from borehole MHD13 showing textural
variations in lithology and sedimentary structures .................................................................... 177
Figure 4.3: Ternary plot of minerals by textural variations. Samples are dominantly
carbonate rich with high tectosilicate and phyllosilicate fractions in clay-rich lithologies.
Although carbonate cemented, very high (> wt. 80%) carbonate content of most clay-
rich samples are due to carbonate cemented micro fractures and occasional shell
fragment. ...................................................................................................................................................... 180
Figure 4.4: Facies variationa in trace element variation for the Hodder Mudstone
samples ......................................................................................................................................................... 182
Figure 4.5: Histograms for palaeo-redox proxies U/Th and V/(V+Ni). More than 50% of
the Hodder Mudstone samples were deposited in an anoxic environment ....................... 183
Figure 4.6: Petrographic images in UV transmitted light (left) and SEM (right) of BR
samples (a) & (b); SR samples (c) &( d) and CR samples (e) & (f). Sample matrix contain
up to 50% mud-sized particles. Grains are dominated by calcite, kaolinite, quartz,
muscovite and dolomite ......................................................................................................................... 186
Figure 4.7: Organic matter residue (OM) mostly preserved as migrated bitumen ......... 188
Figure 4.8: Hydrogen index versus Tmax plot showing a mature, type II/III Hodder
Mudstone. Maturation boundary information taken from Tissot et al. (1974) ................ 189
Figure 4.9: Cross plots of major elements showing evidence of largely detrital
(terrestrial) derived compounds (NaO, K2O, SiO2). CaO shows strong negative trend
indicative of dominant marine origin. NaO and SiO2 may have intrabasinal influence
hence weaker positive correlation. .................................................................................................... 191
Figure 4.10: Calcite cementation seen in optical microscope and SEM images. (A) XPL
photomicrographs showing partial micritization of the outer shell (arrow) of an
indeterminate organism and sparry calcite cementation of shell cavity. (B) Micritized
shells of endothyracid (left bottom of the sample) and milliolid (centre top of the
sample) Forams. (C) & (D) SEM and SEM Cl images showing calcified outer shell of
Foram fragments; minor dissolution produces intragranualar pore spaces in shells. (E)
and F) XPL photomicrographs showing Radiolarian spherules (Ra) and spines of Sponge
spicules (SS) cemented by calcite. ...................................................................................................... 193

PhD Thesis | 2019
13
Figure 4.11: Calcite cementation occluding intercrystalline pores in pyrite framboid. To
the right of framboid, calcite has been partially displaced by authigenic quartz. ........... 194
Figure 4.12: (A) and (B) SEM and SEM CL photo example of syntaxial planar dolomite
nucleation, with marked compositional, well developed outward-progressing zones of
mostly ferroan rhombohedral rims. (C) Showing scattered dolomite micron-sized
rhombs (arrows) in the clay-rich lamina. (D)Non planar dolomites, indicative of Later
phase partial dolomitization of calcite-cemented kaolinite in shelter pore (paragenetic
sequence from cross cutting relationship shows kaolinite-calcite-dolomite-quartz). .. 195
Figure 4.13: (A) to (D) Quartz cementation showing the dominance of authigenic quartz
in the Hodder Mudstone in form of quartz overgrowths and euhedral crystals.
Quantitative data was derived from statistical pixel filtering. (E) Microcrystalline quartz
(Q) in association with illite crystals. (F) Silica/calcite intergrowths suggesting a
potential displacement of calcite by silica ....................................................................................... 197
Figure 4.14: (A) & (B) Interparticle kaolinite minerals between grains (arrow.) (C) & (D)
Kaolinite intergrowth between Mica sheets. (E) & (F) Kaolinite precipitation in shelter
pores with preserved intercrystalline pore spaces. Notice calcite cementation of
kaolinite around the outer perimeter in (E). .................................................................................. 199
Figure 4.15: Several occurrences and crystal morphologies of authigenic pyrite (A – D)
and Marcasite (E & F) in the Hodder Mudstone samples. (A) Very fine framboids. (B)
Evidence of early diagenetic poly-framboidal pyrite of varying diameters displaced by a
micro fault. (C) Micro-framboidal pyrite mineralization of skeletal test (arrow-
indicated). (D) Complete body (mouldic) pyritization of a fossil (foram?) and partial
recrystallization. (E) Tabular bladed marcasite. (F) Marcasite and pyrite coexistence.
.......................................................................................................................................................................... 201
Figure 4.16: Fracture orientation, morphology and cementation. (A) & (B) shows the
nature of calcite micro-fracture propagation through clay-rich and silt-rich samples.
Fibrous meandering morphologies are typical in silt-rich units while fractures in more
clay-rich units occur as relative linear bifurcating veins. (C) An example of horizontal
laminae-parallel dolomitized fractures in the clay-rich core sample. (D) Showing
multiple fracture and cement-filling phases. (E) fault-related laminae-displacing
fractures. (F) SEM micrograph of a multi-fractured siderite vein (light grey) crosscut by
calcite (dark grey), iron sulphide veins (bright white thin fractures), organic matter
(black pigments) and host rock inclusions. .................................................................................... 203
PhD Thesis | 2019
14
Figure 4.17: (A) – (B) Cement bridges from the simultaneous sealing of fractures as
they open (synkinematic cements- Hilgers and Urai (2002) or crack-seal mechanism–
Gale et al. (2017). Some bridges may contain brecciated host rock inclusions as
observed in (C) & (D). .............................................................................................................................. 204
Figure 4.18: Paragenetic evolution chart of the Carboniferous Hodder Formation ....... 207
Figure 5.1: The various methods utilized for estimating porosity and pore size
distribution in mudstones. Redrawn from Clarkson et al. (2013). Red-outlined
techniques were utilized in this study. ............................................................................................. 264
Figure 5.2: (A) Location and geological map of the Bowland Basin showing surface
outcrops and location of cited wells. Map adapted from the BGS 1:650000 geological
map of the UK. (B) Interpreted seismic section GC83-352 taken from Clarke et al (2018),
location of seismic line is highlighted in (A), vertical scale in two way time. ................... 265
Figure 5.3: A) An illustration of a typical isotherm plot with adsorption branch (red) and
desorption branch (green). Regions (i) representing the onset of microporous filling, (ii)
monolayer filling and (iii) multilayer filling of pores. Forced closure of the desorption
branch onto the adsorption branch marks the limit of multilayer filling. A hysteresis
loop is formed due to capillary condensation mostly in mesopores. (B) Referenced
isotherm types I, II, IIB and IV, and (C) referenced hysteresis loops H1, H2, H3 and H4 as
defined by IUPAC (F. Rouquerol et al. 2013). Desorption branch of isotherm may exhibit
a complete forced closure and minor closure (dashed lines). ................................................. 271
Figure 5.4: Ternary plot of weighted fraction of minerals calculated from XRD data.
Plotted to fit into the Lazar et al. (2015) mudstone classification ......................................... 273
Figure 5.5: Core photographs (CP), thin sections scans (TS) and microscope
photographs in plane polarised light (PM) showing samples H-1 to H-5. H-1
characterised by planar laminations of silt- and clay-rich laminae with horizontal and
vertical mineralised fractures.H-2 representing horizontally fractured clay-rich units. H-
3 is a representative sample of calcareous silt-rich samples. H-4, a typical clay-rich
sample with meandering mineralized fractures. H-5 represents an unlaminated bioclast-
dominated (mostly crinoidal) mudstone. ........................................................................................ 276
Figure 5.6: Core photographs (CP), thin sections scans (TS) and microscope
photographs in plane polarised light (PM) showing samples H-6 to H-10. H-6 showing
clay-dominated sample. H-7 here representing dendritic-fractured silt-rich samples. H-8
represents a bioturbated calcareous silt-rich unit. H-9 shows images from the wavy

PhD Thesis | 2019
15
laminated bioclast-dominated unit. H-10 represents bioturbated bioclast- and silt-
dominated unit. .......................................................................................................................................... 278
Figure 5.7: Inter-particle framework pores showing (A), inter-granular pores (arrows)
in pressure shadows between calcite and kaolinite; (B) inter-granular elongate slit-like
pores (arrows) occurring around a bent muscovite grain; (C), inter-crystalline slit-like
pores in between kaolinite sheets and shadow pressure pores (arrow) preserved
between grain; (D) inter-crystalline pores hosted by illite minerals between quartz
grains. (E) and (F) show pores hosted in pyrite framboids ..................................................... 280
Figure 5.8: Examples of identified intra-particle pores in the studied samples. Calcite
hosted dissolution intra-particle pores observed in calcite-cemented shells and cavities
outlined in (A) & (B). SEM image (C) is a zoomed in section of calcareous shell
magnifying the morphologies of intra-particle pores. Dolomite crystals are shown in (D)
also host intra-particle pores ............................................................................................................... 281
Figure 5.9: High-resolution SEM showing non-porous organic matter occurrences (OM).
(A) & (B) Wavy and elongate organic matter lamellar. (C) Bituminous patch under back-
scatter emission and (D) same region under secondary emission. (E) & (F) shows pores
around pore walls of organic matter both under the secondary emission with (F) taken
from an ion-milled surface. ................................................................................................................... 283
Figure 5.10: Low-pressure N2 (77K) adsorption-desorption isotherms of samples H-1 to
H-10. Regions A1 and A2 demarcated at 0.5 P/Po, for calculating fractal dimensions of
monolayer adsorption regions (A1) and multilayer adsorption regions (A2). Isotherm
curves are apparently similar but significant variations can be observed in the volume
of adsorbed gas by samples at corresponding relative pressures. Higher values of
adsorption recorded in H-4 and lowest values in H-9 & H-10. Pie chart of bulk
mineralogy indicate control of mineralogy on isotherm behaviour. .................................... 285
Figure 5.11: Graphic illustration of pore network effects in adsorption measurements of
interconnected small (a, b), intermediate (c) and large pores (d) (adapted from Groen et
al. (2013). Pores (a) and (b) will empty at their corresponding low pressure during
desorption than needed for emptying pore (c). Since pore (d) can only empty via (c), it
will accordingly empty at a lower pressure empirically required. ........................................ 287
Figure 5.12: BJH pore size distribution (PSD) curves for samples H-1 to H-10 obtained
from N2 isotherms, displaying the volume (amount of gas adsorbed) occupied by

PhD Thesis | 2019
16
various pore sizes (pore diameter) using the BJH Model. Calculated porosity data of
samples using bulk densities of quartz and calcite is also shown. ........................................ 288
Figure 5.13: Relationship between lnV and lnln(1/(P/Po) from the FHH fractal analysis
based on N2 adsorption isotherms. D1 is the fractal dimension values derived from the
slope (blue) of monolayer adsorption data (Region A1 of Figure 5.10), and D2 is the
fractal dimension derived from the slope (red) of multilayer adsorption data (Region A2
of Figure 5.10). ........................................................................................................................................... 292
Figure 5.14: FHH fractal dimension versus (A) average pore diameter and (B) total pore
volume. D1 (blue) uses fractal values of Figure 5.13 for monolayer adsorption, and D2
uses fractal values of Figure 5.13 for multilayer adsorption. .................................................. 293
Figure 5.15: Comparative statistical analysis of sample mineralogy in relative weight
percent (quartz:carbonate:phyllosilicate) and pore attributes .............................................. 298
Figure 6.1: Summary diagram of Hodder Mudstone facies distribution and the
correlative variation of reservoir properties. Bed thickness, porosity and TOC increases
distally, while brittleness are more pronounced in proximal areas. .................................... 346
Figure 6.2: 3D XCT image of rock volume (a) from a representative sample. Statistical
grey-scale pixel filtering is utilized to segment identified minerals as confirmed from
SEM images and EDS spectra; (b) shows carbonate mineral distribution caused by the
presence of skeletal debris in a fine-grained muddy matrix. Fragments are mostly from
crinoids, bivalves, brachiopods, gastropods, foraminifers and calcareous algae.
Intraparticle pores may exist within carbonate grains. (c) shows pyrite distribution.
Framboidal pyrite hosts inter-crystalline pores between microcrysts. (d) represents
organic matter particles which are mostly secondary or migrated residual hydrocarbon
and bitumen. Pores in the samples could not be resolved from this data. ......................... 349
List of tables
Table 1: Mudstone mineralogy compiled from studies by Potter et al. (1980) and
Milliken (2014). ............................................................................................................................................ 67
Table 2: "Mudstone" terminologies taken from Stow (1981) and Lazar et al. (2015). .... 82
Table 3: Facies terminologies as given by Dean et al. (1985) ..................................................... 83
Table 4: Pore size classifications ............................................................................................................ 91

PhD Thesis | 2019
17
Table 5: Weighted percentage mineralogical data from XRD bulk analysis. See Appendix
for raw data. ................................................................................................................................................ 179
Table 6: Summary data showing enrichment of redox sensitive trace elements and
ratios in selected Hodder Mudstone sample. Samples are mostly enriched in U and Mo
relative to average shale values .......................................................................................................... 184
Table 7: Pyrolysis and TOC values of selected samples from the Hodder Mudstone. .... 188
Table 8: Descriptive summary of core samples ............................................................................ 274
Table 9: Pore quantitative analysis of samples H-1 to H-10 .................................................... 288
Table 10: Unconventional reservoir assessment for prospectivity of the Hodder
Mudstone facies. ........................................................................................................................................ 345
Word count 88,950

PhD Thesis | 2019
18
Abstract
Facies, Diagenesis and Pore Characterisation of the Lower
Carboniferous Hodder Mudstone Formation, Bowland Basin, UK
A thesis submitted to the University of Manchester for the degree of Doctor of
Philosophy in the Faculty of Engineering and Physical Sciences, May 2019
An understanding of the various controls in sediment deposition, burial processes and
deformation of rock strata is required in the adequate estimation and conversion of
hydrocarbon resources to reserves. In recent years, petroleum technology has evolved
enabling oil and gas production from organic-rich mudstones. Understanding the
distribution of organic and inorganic materials and how they relate to porosity
development in fine-grained rocks is critical in predicting the rock’s physical properties
and successful hydrocarbon production. This thesis presents sedimentological,
diagenetic and porosity characterisation of a potential UK unconventional shale gas
reservoir; the Hodder Mudstone Formation of the Bowland Basin. This unconventional
gas-bearing section is a ca. 900 m thick unit of organic-rich Viséan strata, primarily
comprising hemipelagic mudstones and thinly laminated calcareous turbidites deposited
on a carbonate ramp setting. A total of 1,679 m of continuous cores from 11 boreholes
have been logged and sampled for this study. For sedimentological facies
characterisation, 132 samples were selected for laboratory analyses after producing
graphic core logs and lithologic description. 50, oriented 30 µm thick, polished, thin
sections were further prepared from samples for optical and scanning electron
microscopy and electron probe microanalysis. Whole rock XRD mineral analysis of 76
samples was carried out and trace and major elemental analysis acquired from 67
samples to aid provenance and diagenetic study. To understand the organic matter
properties and maturity, the total organic carbon content of 30 representative organic-
rich core samples were determined. Bulk pyrolysis was also performed on the same
samples and maturity data estimated from the pyrolysis data. These datasets were
further combined with digital image analysis of pore structure and quantitative porosity
measurements from nitrogen gas adsorption to characterise pores and evaluate the
relationship between mineral distribution and the physical properties of associated
pores. Results from these studies show that the succession comprises gravity flow,
calciclastic sediments. Recognised facies were grouped into calciturbidites, densite

PhD Thesis | 2019
19
mudstones and calcidebrites. Calciturbidites comprise mostly of high- to low-density,
wavy-laminated bioclast-rich facies. Low-density densite mudstones are characterised
by planar laminated and unlaminated mud-dominated facies. Calcidebrites are
comprised of muddy or hyper-concentrated debris-flow deposits occurring as poorly-
sorted, chaotic, mud-supported floatstones. These facies were deposited in a tectonically-
controlled submarine fan setting. Primary sedimentary comprised intrabasinal skeletal
debris, microscopic biogenic detritus and extrabasinal silt- and clay-sized siliciclastic
(quartz and muscovite) detritus. Constituent diagenetic minerals include calcite, siderite,
dolomite, ankerite, quartz, kaolinite, pyrite and marcasite with minor phosphate and
chlorite. Samples show organic richness of 1.5% present day TOC, and maturation
analysis reveals an oil to gas widow mature source rock. The textural fabric of analysed
samples shows significant diagenetic overprinting with a high abundance of authigenic
carbonate and silicate minerals. Mineral authigenesis and precipitation were localised
and controlled by primary constituents and the mobility of minerals. These changes
affected the evolution and preservation of inter- and intra-particle pores within the
studied samples. Inter-particle pores dominate argillaceous (>50% tectosilicates and
phyllosilicates content) samples while intra-particle pores control porosity in calcareous
(>50% carbonate content) samples. The calculated average porosity of calcareous
samples is between 3.6 – 4.4 % while in more argillaceous samples is between 5.6 – 6.8
% porosity. The results from this research have allowed for the first time, the evaluation
of submarine density flow deposits of the Viséan Bowland Basin succession. It has added
a layer of knowledge on the mineral fabric, organic matter and diagenesis within a range
of Hodder Mudstone facies. This will significantly enhance the understanding of reservoir
quality in this potential shale play. The control on pore distribution and quartz diagenesis
in the Hodder mudstones highlighted in this thesis has implications in the mechanical
properties of the Hodder Mudstone as a target for hydraulic fracturing.

PhD Thesis | 2019
20
Declaration
No portion of the work referred to in the thesis has been submitted in support of an application for another degree or qualification of this or any other university or other institute of learning.
Copyright statement
i. The author of this thesis (including any appendices and/or schedules to this thesis) owns certain copyright or related rights in it (the “Copyright”) and he has given The University of Manchester certain rights to use such Copyright, including for administrative purposes.
ii. Copies of this thesis, either in full or in extracts and whether in hard or electronic copy, may be made only in accordance with the Copyright, Designs and Patents Act 1988 (as amended) and regulations issued under it or, where appropriate, in accordance with licensing agreements which the University has from time to time. This page must form part of any such copies made.
iii. The ownership of certain Copyright, patents, designs, trademarks and other intellectual property (the “Intellectual Property”) and any reproductions of copyright works in the thesis, for example graphs and tables (“Reproductions”), which may be described in this thesis, may not be owned by the author and may be owned by third parties. Such Intellectual Property and Reproductions cannot and must not be made available for use without the prior written permission of the owner(s) of the relevant Intellectual Property and/or Reproductions.
iv. Further information on the conditions under which disclosure, publication and commercialisation of this thesis, the Copyright and any Intellectual Property and/or Reproductions described in it may take place is available in the University IP Policy (see http://documents.manchester.ac.uk/DocuInfo.aspx?DocID=24420), in any relevant Thesis restriction declarations deposited in the University Library, The University Library’s regulations (see http://www.library.manchester.ac.uk/about/regulations/) and in The University’s policy on Presentation of Theses.

PhD Thesis | 2019
21
Dedication
To the creator of life and the author of wisdom, the eternal God.
In the blessed and loving memory of my father
Samuel Ogbonna Ohiarah
(1954 – 2017)

PhD Thesis | 2019
22
Acknowledgements
The studies presented in this thesis would not have been possible without my
supervisors. I wish to place on record my sincere thanks to my lead supervisor Prof. Kevin
G. Taylor and Dr Patrick J. Dowey my second supervisor for giving me the opportunity of
working with you. Your valuable suggestions, guidance, criticism, comments and
encouragement made my work productive. As stated by John F. Kennedy that “as we
express our gratitude, we must never forget that the highest appreciation is not to utter
words, but to live by them"; the exemplary qualities you have shown me, may I extend to
others. All the students and staff (academic and non academic) of the University of
Manchester are thank for their support through out my study years here in Manchester.
No words can express the depth of gratitude to my late father who through selfless love,
enduring sweat and unflinching trust in me sponsored my education till PhD level. He
bent over backwards for me. His sacrifice I cannot repay, but may I live to remember his
life and show same self-sacrificing love to my loved ones.
To my mum and siblings (Nnamdi, Chibueze, Chima and Ogechi), if I tried to tell you how
much I appreciate you, I would be talking for the rest of my life. You all have been
awesome. I could not have asked for more. Your love, prayers, and moral and emotional
support are inestimable. How truly I desire to give back to you. I am also grateful to my
other family members who have supported me along the way.
To my wonderful Seventh-day Adventist family members dotted around the globe
including those I met at Adventist Students events and societies. May God bless the days
I met each one of you. No act of gratitude can relay the extent to which your prayers and
friendship went in leading me to where I am today. Please accept this note as a token of
my heartfelt appreciation to you individually. A special mention goes to the NEC ASC
advisory team (Ps Ramdin, Chantal, Abi, Naomi, Kallie, Nat and Bonie) for your inspiration
and cheer.
The journey of a PhD student will be a lonely and boring one without fellow wayfarers
through the rough and winding paths. With a special mention to Wumi, Sebastian, Milton,
Moh, Yusuf B., Yusuf A. (major), Dan, Jeff, Melissa, I will miss our noisy lunchtimes. It has
been real. Not forgetting other PhD students in the mix, you are all appreciated.
To the Back of House Team at Manchester United football club, Ridwan (boss), Martin,
Edrissa, Ahmed, Samy, Godstime, Julian, Clinton, you have treated me not just as a
colleague but as family. I thank you and the rest of the staff for your support and
understanding while I worked part-time with you all. I shall not forget your kindness and
friendship.
And to my girlfriend Caroline, no gift can represent what your encouragement and
support mean to me. There could not have been a better time to begin this journey with
you. I hope in some way, you realise how much you’ve meant to me. Thank you for being
a companion through the most difficult time of my PhD.

PhD Thesis | 2019
23
The author
Timothy Ohiara holds a Bachelor of Science degree in Geology from Niger Delta
University, Nigeria. He graduated in 2010 after submitting a dissertation titled
“Interpretation of Resistivity Data from Orè, Ondo state Nigeria”. He went to on to do a one-
year national service where he served as a high school teacher in Esanma Grammar
School, Delta state Nigeria. Subsequently, he got admitted to pursue a Master of Science
degree in petroleum geoscience at The University of Manchester, UK. By 2013, he
completed his Master of Science degree with a distinction, best research poster
presentation and a dissertation titled “Petroleum System Modelling of the North Viking
Graben, Northern North Sea”.
Having a strong desire to pursue his career further, Timothy began his PhD studies in
petroleum geoscience and basin studies at the University of Manchester since September
2015. His interest focused on understanding the variability in organic-rich mudstone
succession. The results of this are documented in this thesis. During the past three and
half years, he has received training in optical and scanning electron microscopy,
elemental dispersive spectrometry and nitrogen adsorption data analysis. He has been
able to interpret XRD and XRF data. He has also gained skills in image processing and
analysis using Avizo and Matlab.
While undertaken his PhD research, Timothy has been involved with other roles
including:
Graduate teaching assistant at the School of Earth and Environmental Sciences,
University of Manchester (2015 – 2018)
The vice president for the AAPG student chapter at the University of Manchester
(2016 – 2017)
Widening participation fellow for the School of Earth and Environmental Science,
University of Manchester (2016 – 2017)
GIS data technical support, School of Earth and Environmental Sciences,
University of Manchester
Timothy has presented results of his research at several conferences and also won up to
$2700 in grants from AAPG, IAS and SEPM. He is a fellow of the Geological Society, London
and a student member of the AAPG, EAGE, IAS, SEPM and BSRG.

PhD Thesis | 2019
24
Chapter 1 Introduction

PhD Thesis | 2019
25
1 Introduction
Research rationale
Conventional hydrocarbon production in the oil industry classically results from
carbonate and coarse-grained (>63 μm) siliciclastic reservoirs. However, the decline in
the production of relatively “easy” and “accessible” hydrocarbons has spurred the
application of technologies to tight and cemented mudstones, which are loosely termed
shales (Schieber 2011b). Hydrocarbon deposits stored in mudstones are considered
unconventional resources due to the low-to-ultra low (<0.1mD) permeability and <15%
porosity of mudstones (Williams 2012; Jarvie 2014) and the technologies required for
production (McGlade et al. 2013). Production of gas from shales, however, is not an
entirely new paradigm as records have shown significant volumes of gas production from
organic-rich shales since the 1820s (Jarvie 2014). To enable economic production of gas
or oil, the flow properties of mudstones are artificially enhanced by inducing hydraulic
fractures that result in the production of free oil and/or gas retained in fine-grained
organic-rich mudstones (Rybacki et al. 2016). This technique is equally not a new process
as the concept of hydraulic fracturing for hydrocarbon production has been efficient in
conventional wells though in lesser magnitude than utilized in shale gas prospects (Jarvie
2014). Significant success has been achieved in shale exploration and production
especially in North America (Jarvie 2012a; McGlade et al. 2013). This paradigm has thus
spurred global interests, and economic investments are actively growing in various
countries including the UK (Soeder 2018).
Despite the advances in shale resource technology with a recorded high-energy
simulation of >60,000 wells (Jarvie 2014) and the rising economic importance in
unconventional plays, understanding lithologic variation, diagenesis and porosity

PhD Thesis | 2019
26
distribution in organic-rich mudstones remains a challenge (Clarkson, Wood, et al. 2012;
Jarvie 2012a; Klaver et al. 2015). This is chiefly due to spatial heterogeneities in shale
properties and associated complex micro-pore structure (Pommer & Milliken 2015). The
projected potential of unconventional gas production still remains speculative with
respect to uncertainties over resource estimations and recoverability of resource. As the
development of shale resource is relatively expensive compared to conventional
hydrocarbon production, with widespread implications for energy, economic and
environmental policies, it necessitates efficient prediction of resource size and shale
petrophysical properties. The success of such predictions is dependent upon the
understanding of sedimentology, diagenesis, porosity and permeability distribution in
these rocks.
Lithologic heterogeneities from primary depositional components and diagenetic
mineral alteration are major controls on porosity and permeability (Slatt 2011; Kuila et
al. 2012; Bust et al. 2013; Kuila & Prasad 2013a). These heterogeneities vary from field
(outcrop) scales to microscopic scales well below log resolutions and demand physical
studies of rock samples in high resolution (Bust et al. 2013). The mineral composition of
fine-grained sediments can vary over an extensive mineralogical spectrum from
carbonate- to siliciclastic-rich. A number of active US shale resource plays are from
carbonate-rich mudstones (e.g. Eagle Ford Formation, Bakken Shale, Niobrara
Formation) and siliceous-rich (e.g. Barnett shale and Woodford shale), and are
dominated by complex pore types and pore geometries (Slatt 2011). Their pore
morphologies are controlled by the distribution of diagenetic-modified bioclasts, quartz,
clay minerals and interparticle cements (e.g. Milliken et al. 2007; Bustin et al. 2008; Kuila
et al. 2012; Bai et al. 2013; Lazar et al. 2015; Han et al. 2015; Milliken & Curtis 2016).
Questions still remain on what sedimentary and/or post sedimentary events controlled

PhD Thesis | 2019
27
the variation of porosity, permeability and key mechanical properties (e.g. brittleness and
“fracability”) (Rybacki et al. 2016). Pore evaluation and successful prediction of lateral
reservoir properties distribution are akin to a comprehensive description of mudstone
succession into distinct facies within its sequence stratigraphic context.
Over the past decade, exploration activities and research for shale gas within ca. 5000 m
thick Viséan to Namurian age mudstone succession in the Bowland Basin have risen
significantly (e.g. Andrews 2013; Clarke et al. 2014; Clarke et al. 2018; Brindle et al. 2015;
Hennissen et al. 2017). In March 2019, Cuadrilla reported flow-testing results at a peak
rate of 200,000 standard cubic feet per day from the first horizontal shale well through
the Bowland Shale (EAGE 2019). This is considered an economic flow rate with a
potential of 3 to 8 million standard cubic feet per day upon completion. There is, thus, a
potential for economic production of gas from the Bowland Basin especially from the
actively explored Bowland Shales. Other formations within the basin, for example, the
Hodder Mudstone, are also considered to host technically recoverable shale gas
(Andrews 2013; Clarke et al. 2018). An understanding of the mineralogical composition
and distribution in these formations, the impact on authigenic and detrital minerals on
reservoir properties and the porosity variation are yet underexplored. These properties
have implications for reservoir mechanical properties and their understanding is vital in
the successful extraction of unconventional gas reserves from these formations.
The research documented in this thesis presents studies on the sedimentological,
diagenetic and porosity characterisation of a carbonate clastics- and siliciclastic-rich
shale gas reservoir prospect in the Bowland Basin, UK. The Carboniferous Bowland-
Hodder Shale unit in the Bowland Basin, northern England, is a carbonate-rich potential
UK shale gas play (Andrews 2013; Clarke et al. 2018). Studies presented in this research

PhD Thesis | 2019
28
focused on the stratigraphically oldest unit of the resource play – The Hodder Mudstone.
The Hodder mudstone is Arundian (Lower Viséan) in age and forms the lower section of
the Carboniferous Bowland-Hodder Shale Gas play in the Bowland Basin (Andrews
2013). The lithology of Hodder Mudstone is predominantly medium to dark grey
hemipelagic mudstones with subordinate thin-bedded calcareous siltstones turbidites
(Riley 1990; Aitkenhead et al. 1992; Waters et al. 2009). It underlies the actively explored
Bowland Shales. Studies by Andrews (2013) and Clarke et al. (2018) have shown its
potential as a shale gas prospect but what is yet unclear is its sedimentological variability,
diagenetic evolution and the nature of pores within the formation. Very little is currently
known about the controls on mineral variability within the Hodder Mudstone and its
efficiency as a shale gas reservoir. Hence, the studies presented in this thesis address such
questions.
The Bowland Basin geologic setting
The Carboniferous geology of central Britain around the Pennines is comprised of a
network of complex fault-bounded basins and troughs with isolated highs (Gawthorpe et
al. 1989; Kimbell et al. 1989; Ebdon et al. 1990; Fraser et al. 1990; Fraser & Gawthorpe
1990; Fraser & Gawthorpe 2003). Basin formation was initiated during in the late
Devonian – Tournaisian times (Gawthorpe 1987). These were steep-sided, slowly-
subsiding blocks and intervening rapidly-subsiding troughs (Leeder 1982; Bott 1967;
Soper et al. 1987; Miller & Grayson 1982; Gawthorpe et al. 1989). They are reported to
have been controlled by dextral shearing (Arthurton 1984) and back-arc rifting (Leeder
1982) during the late Palaeozoic Variscan Orogeny. Fault-controlled subsidence within
these grabens, shaped sedimentation as thick hemipelagic muds and clastic sediments

PhD Thesis | 2019
29
were deposited in the troughs with relatively thin carbonate platforms on concomitant
highs (Aitkenhead et al. 1992; Fraser & Gawthorpe 2003).
The Bowland Basin represents part of the several sedimentary basins on half-graben
structures formed in North England during the Carboniferous (R. L. Gawthorpe 1987;
Aitkenhead et al. 1992). The Basin also referred to as Bowland Trough (Waters et al.
2009) or Craven Basin (Fewtrell & Smith 1980; Aitkenhead et al. 1992; Fraser &
Gawthorpe 2003) is located in Lancashire, north-western UK. It is a NE – SW – oriented
half-graben tilting to the south and is structurally bounded to the north by the Bowland
High (Gawthorpe 1986; R. L. Gawthorpe 1987), Lake District Massif (Grayson & Oldham
1987) and the Askrigg Block (Hudson 1933; Gawthorpe 1986) (Figure 1.3). The southern
boundaries are the Pennine/Pendle Fault (Fraser & Gawthorpe 1990) and the Central
Lancashire High (Miller & Grayson 1982).
1.2.1 Palaeogeography
The British Isles were located within the equatorial belt at the close of the Devonian.
Central Britain lay in the foreland/back-arc terrain of the Laurasian continent and
associated rift basins were forming due to extensional tectonics (Leeder 1982; Leeder
1988). The Lower Carboniferous era was globally marked by extensive carbonate
platforms on uplifted fault blocks in the equatorial epicontinental seas (Wright 1994;
Menning et al. 2006; Dean et al. 2011). Ramp carbonates and marine hemipelagic
sedimentation dominated Britain’s intra-Carboniferous Basins (Riley 1990; Gawthorpe
1986; 1987; Aitkenhead et al. 1992; Fraser & Gawthorpe 1990; Waters et al. 2009; Dean
et al. 2011).
The facies mosaic of the Bowland Basin documents a basin-wide and intra-basinal
asymmetric depositional sequence (R. L. Gawthorpe 1987). Sedimentation was governed

PhD Thesis | 2019
30
by the rate of subsidence and thermal sagging, recurrent vertical movement and faulting,
and eustatic sea-level change (Aitkenhead et al. 1992). Muddy open marine environments
prevailed at this time with occasional turbidity currents (Aitkenhead et al. 1992). Shallow
marine fauna and flora thrived yielding high hates of carbonate sediment production and
transportation of sediments from marginal shelf areas and uplifted footwalls (Aitkenhead
et al. 1992). The climate became wetter with the movement of the continents to higher
latitudes and deltas became more prominent bringing coarse terrigenous sediments to
the basin by the end of the Viséan (Aitkenhead et al. 1992). Towards the climax of the
Hercynian orogeny, eustatic sea-level generally increased drowning the deltas and
terminating sand deposition (Figure 1.1). By the end of Carboniferous, a compressive
movement had initiated, giving rise to regional uplift, folding and termination of sediment
deposition (Aitkenhead et al. 1992; Fraser & Gawthorpe 2003).

PhD Thesis | 2019
31
Figure 1.1: Palaeogeographical reconstruction for the Carboniferous of southern Britain. Maps adapted from Dean et al., (2011). AlB- Alston Block; AsB- Askrigg Block; CB- Craven Basin/Bowland Basin (red boxed); CH- Cheviot High; CuB- Culm Basin; DB- Dublin Basin; LH- Leinster High; ML–D-Manx-Lake District High; MV- Midland Valley; NT- Northumberland Trough; RB- Rossendale Block; SB- Shannon Basin; SUH- Southern Uplands High.

PhD Thesis | 2019
32
1.2.2 Stratigraphy
The sequence stratigraphic scheme of the UK’s northwest region based on regional
seismic reflection data and biostratigraphy shows three mega tectonostratigraphic units
(Fraser & Gawthorpe 1990; Fraser & Gawthorpe 2003). These three mega sequences
from the Late Devonian to Early Permian periods are (1) syn-rift; (2) post-rift and (3)
inversion sequences. They are further split into a series of lithostratigraphic sequences
grading from localised basal syn-rift alluvial/fluvial clastics to shallow/deep water
hemipelagic sequences and carbonates, a post-rift clastic fluviodeltaic sequences and
adjacent molasse in inverted synclinal basins (Figure 1.1).
Nine different depositional lithofacies association from these sequences have been
recognised in the Carboniferous of Britain of which six are documented in the Bowland
Basin located on the western margin of northern England (Dean et al. 2011). These facies,
adopting the regional Western European chronostratigraphic stage nomenclature are:
Late Devonian to Tournaisian continental and peritidal facies.
Tournasian to Viséan Open marine platform and ramp carbonate facies.
Viséan hemipelagic facies.
Fluviodeltaic facies, known as the “Millstone Grits” of Namurian to
Westphalian age.
Westphalian Fluvio-deltaic facies (“Coal Measures”).
Westphalian to Stephanian Alluvial facies (“Barren Measures”).

PhD Thesis | 2019
33
Figure 1.2: Summarised mega sequences and stratigraphic column of the Lower Carboniferous UK East Midlands as modified from Fraser and Gawthorpe (1990), Waters et al. (2009) and Waters et al. (2011). Global chronostratigraphy follow Gradstein et al. (2012) and regional stages and substages taken from Holliday and Molyneux (2006). Miospores and Ammonoids biostratigraphic zonation follow Waters et al. (2009) and Waters and Condon (2013). Bowland Basin lithostratigraphic column and nomenclature around Bowland Forest adapted from Waters et al. (2009).
1.2.2.1 Late Devonian to Early Carboniferous
Precedent to the early Carboniferous lithospheric stretching of British/Irish Hercynian
foreland and basin formation, sediment deposition began in the Bowland Basin by the
late Devonian period (Fraser & Gawthorpe 1990). No sedimentological data has been
retrieved from the basement presently; however, the oldest proven sediments are of

PhD Thesis | 2019
34
Courceyan age (Charsley 1984; Fraser & Gawthorpe 2003) which correlates with the top
oldest sequence (EC1b) of Fraser and Gawthorpe (1990) in the area (Figure 1.2).
1.2.2.2 Carboniferous
The Bowland Basin-fill constitutes mainly of Tournaisian to Stephanian carbonates and
clastic lithofacies developed by the interplay of glacio-eustatic sea-level fluctuations and
tectonic events (Aitkenhead et al. 1992; Fraser & Gawthorpe 2003). Due to regional
progressive uplift within the Pennines, post-Carboniferous sediments are not preserved
in the Bowland Basin sequence (Aitkenhead et al. 1992).
In the Tournaisian stage, the Bowland Basin lay south of the eroded Caledonian mountain
belt and was consequently sediment-starved at this time due to the distal proximity from
the uplifted mountain (Fraser & Gawthorpe 1990). Surrounded by carbonate platforms
on structural highs, mudstones, siltstones and detrital limestones were deposited under
shallow to deeper (>200 m depth) water condition in the trough from Tournaisian to
Early Viséan stage (Aitkenhead et al. 1992; Fraser & Gawthorpe 2003). Shallow water
carbonate allochems were transported from proximal inner ramp to distal portion of
adjoining carbonate ramps forming argillaceous packstones and wackestones (Charsley
1984; Gawthorpe et al. 1989). With regional thermal subsidence in the Viséan stage, a
transgressive depositional regime succeeded with the development of drowned
carbonate platform and thick hemipelagic mudstone-dominated lithofacies intercalated
with externally sourced carbonate sediments towards the basin floor (Aitkenhead et al.
1992).
Due to an onward establishment of fluvio-deltaic conditions across most of central
Britain, Namurian to Westphalian-C sediments comprise mostly of clastic fluvio-deltaic
sequences (Gawthorpe 1986). This clastic lithofacies marked the end of the thermal sag

PhD Thesis | 2019
35
phase of extensional subsidence in Northern Britain and a truncation in depositional
sequence by pulses of the Variscan Orogenic events (Fraser & Gawthorpe 1990). The
resultant inversion of all major hanging walls of initial syn-rift half grabens caused
peneplanation and deposition of Permo-Triassic molasse sediments on adjoining
intermontane synclines (Fraser & Gawthorpe 1990; Fraser & Gawthorpe 2003). These
post-Carboniferous molasses unconformably overly the Mid-Dinantian sediments in
various regions (Earp et al. 1961).
Research aims
The aims of this research are to characterize the Viséan (Arundian) aged Hodder
Mudstone within a sedimentological and stratigraphic context, explore its paragenetic
evolution and investigate the pore types, size distribution and controlling factors. By
using a facies approach within the context of sediment gravity flow deposition, a review
of the sedimentary processes responsible for deposition of the mudstone is explored.
Secondly, this research extrapolates the nature and timing of mineral cements, and
finally, it aims to characterize pore structures and quantitative values within the
succession and subsequently explores the implication of these results to hydrocarbon
exploration. In a broader context, this research aims to understand the evolution and
controls on porosity in mixed calciclastic and siliciclastic mudstones.

PhD Thesis | 2019
36
Figure 1.3: Location map of the study area (a) highlighting major bounding fault lines and study area. Map adapted from Evans and Kirby (1999). Borehole location of core samples in (b) map taken from Google map data ©2019 Google. Borehole selection based on the presence of argillaceous mudstone beds.
Research objectives
There are three main objectives for this thesis:
I. To characterize sedimentary facies and understand depositional controls of
the studied succession: Earlier studies had developed different depositional
models for the Bowland Basin (Gawthorpe 1986; Newport et al. 2017).
However, owing to recent advances in carbonate clastic deposition, several

PhD Thesis | 2019
37
questions still remain unanswered in regards to processes in sediment
deposition. The understanding of these processes aids in the adequate
prediction of laminae- to bed-scale facies variation. Using core and thin section
data, this study sets out to highlight the sedimentological evidence for
submarine fan systems within the units of a mud-rich calciclastic succession.
It further reviews the depositional processes responsible for the distribution
of facies in a current context of sediment gravity (density) flow deposits.
Finally, it produces a conceptual depositional model for the mud-rich
calciclastic facies of the Lower Carboniferous Bowland Basin.
II. To evaluate diagenetic processes and their impact on rock properties:
Diagenesis plays a crucial role in the modification of rock properties especially,
porosity and mechanical behaviour. This thesis examines evidence from high-
resolution petrography (ultra-violet light microscopy, SEM), mineralogy
(XRD) and geochemical data (XRF, EDS, EPMA, RockEval pyrolysis) to
understand and characterise the diagenetic events of the Lower Carboniferous
Hodder Mudstone succession. It interprets the paragenetic sequence and the
resulting minerals and textures within the Hodder Mudstone. Lastly, it argues
the abundance of authigenic quartz cement as an integral component in these
rocks and discusses the likely origin, geological controls and timing of
authigenic quartz.
III. To produce qualitative descriptions and quantitative data analysis on
mudstone porosity: Another study documented in this thesis is the
characterisation of pore structure and pore size distribution from
representative facies of the Hodder Mudstone using nitrogen adsorption data

PhD Thesis | 2019
38
and SEM imaging. It further explores the relationship between porosity
variability and mineral compositions.
Dataset and methodology
Borehole rock samples were recommended for sampling over outcrop samples due to
instability of mud rich beds on outcrops. Core samples yield adequate mudstone sample
quality for valuable petrographic information. Regional studies of Bowland Basin
evolution were conducted, and 11 onshore borehole cores were idneitified that best
suited the objectives of the study. The selected borehole cores are shallow (< 300 m depth
from top soil) borehole cores recovered from solid mineral exploration boreholes (Marl
Hill Moor (MHD) boreholes) located in Whitewell towards the southern margin of the
Forest of Bowland (53°55´0.66´´N, 2°30´26.33´´W) (Figure 1.4). Boreholes were drilled
around the uplifted anticline of the basin and penetrated from topsoil through underlying
Namurian to Viséan age strata (Aitkenhead et al. 1992). Borehole selection was
contrained by the presence of thickly bedded argillaceous bed and limestone interbeds
to present a representative stratigraphy of the Viséan succession. This selection aided the
understanding of stratigraphic and lateral variation of studied rock properties. Samples
were chosen at irregular intervals following lithologic variation and defining facies and
diagenetic features (e.g. lithologic boundaries, planar laminations, nodular stuctures).
Due to brittleness of mud-rich samples during mechanical sample preparation, sampling
frequency was higher at argillaceous units. Sampled boreholes included MHD1, MHD2,
MHD3, MHD4, MHD5, MHD8, MHD9, MHD11, MHD12, MHD13 and MHD18 (Figure 1.3).
Core logs, sample points and analyses carried out on each sample are presented in
Appendices 1 and 2.

PhD Thesis | 2019
39
A workflow for this thesis as shown in Figure 1.4 was adopted. Core description and facies
analysis were undertaken on samples utilising thin sections scans and optical and
scanning electron microscopy. X-ray diffraction (XRD) and X-ray fluorescence (XRF)
analyses were further utilised respectively for bulk whole-rock mineral analysis and
elemental analysis of both major and trace elements. TOC and rock-Eval data were
acquired to understand hydrocarbon potential and organic matter maturity. SEM
microphotographs from mechanically polished thin-sections and focused ion beam
milled sections were digitally analysed for pore characterisation. A further quantitative
pore analytical study was carried out using nitrogen gas adsorption technique to
characterise pore volume, size, surface area, roughness and pore size distribution (0.3
nm to 300 nm sized pores). An attempt was also made for high-resolution 3D imaging of
samples using 3D X-ray computed tomographic data of 1cm3 sample for 3D pore
characterisation.

PhD Thesis | 2019
40
Figure 1.4: Thesis logical workflow from literature review, data collection and analyses and final research output
1.5.1 Core description, logging and sampling
Core logging and visual hand specimen description of 1.6km of continuous core from 11
boreholes were carried out at the BGS core repository, Keyworth, Nottingham, UK. The
formation-tops of the succession of interest (Arundian mudstone succession) were
identified using the lithologic and biostratigraphic log results of Aitkenhead et al. (1992),
Riley (1993), Waters et al. (2009) and Waters & Condon (2013) (Figure 1.2). Sampling
was aided by the identification of rock lithologies and sedimentary structures, surface
lustre, visible mineralogical changes, macro-fossil biota, concretions and other diagenetic
features. One hundred and thirty-one rock samples (Appendix) were collected measuring
about 20 – 40 cm3 each in size.

PhD Thesis | 2019
41
1.5.2 Optical thin section petrography
A total of 50 polished thin sections perpendicular to bedding were acquired from 41
depth points. Thin sections were scanned utilizing a Kodak esp 1.2 scanner at 1200 dpi
resolution for colour variations and structures. Petrographic analysis was undertaken
using Nikon Eclipse E200 ultraviolet polarized light microscope at the University of
Manchester. Optical thin section petrography revealed grain sizes, mineral components
of sand- and silt-sized grains. Bioclast fauna, trace fossils, cements and matrix
composition were also characterised. Constituent minerals were distinguished using the
distinctive optical properties (e.g. extinction angle and pleochroism). Photomicrographs
of samples were also taken at low and high magnification in plane polarised light (PPL)
and cross polarised light (XPL). This data enabled the description of facies in Chapters 3,
4 & 5.
1.5.3 SEM microscopy
Subsequent to optical microscope examination and identification of defining
petrographic features and grain size same samples were selected for SEM description
while avoiding duplicates. These samples were also adequate to visualization of pore
structure. These selected polished thin sections were carbon-coated and analysed using
the Philips XL30 FEG Environmental Scanning Electron Microscope (ESEM) equipped
with an energy dispersive x-ray spectrometer (EDS) analyser. 9 nm thick conductive
coating of carbon was applied on polished thin sections to limit surface charging.
Acquired SEM images provided two-dimensional, topographic scanned images of various
signals (radiations) across the sample surface as a primary electron beam interacts with
the sample (Welton 2003; Huang et al. 2013). The beam settings for this research were
set to 15kv acceleration voltage, with 10 mm working distance, a spot size of 4 and mostly
in back-scattered electron emission (BSE) mode. BSE emissions take off at angles

PhD Thesis | 2019
42
favourable for analysing compositional variability and crystalline structure of ~5nm
resolution (Huang et al. 2013). SEM imaging offered a direct visualization and
measurement of rock microstructure to a practical resolution of 5 nm. This technique has
proven effective in mineral and pore characterisation of unconventional reservoirs (e.g.
Nole et al. 2016; Milliken & Curtis 2016). A focused ion beam surface milling was
attempted on one representative sample due to a perceived inadequacy of mechanically
polished samples in visualizing organic matter associated pores (Loucks et al. 2009).
Surface polishing on uncovered 5 mm2 chip was done using a dual beam FIB (Nova 600i,
FEI) at the School of Materials, University of Manchester. A conductive coating of carbon
was also applied to limit surface charging during SEM imaging. Data from this technique
are shown in the three results chapters of this thesis (Chapters 3, 4 & 5)
1.5.4 Micron-scale mineral mapping and SEM cathodoluminescence
Digital X-ray mineral mapping was employed in this research using a JEOL JXA-8530F
Field Emission Electron Probe Microanalyzer (FE-EPMA) located in the School of
Materials, University of Manchester. The apparatus is equipped with a Field Emission
Scanning Electron Microscope (FE-SEM), wavelength-dispersive spectrometer (WDS)
and a JEOL panchromatic cathodoluminescence (CL) system fitted with a NIR filter (for
monochromatic image output of CL signals). The beam was set to run on 20 KV
accelerating voltage and a beam current of 100 nA. Minerals of interest (Fe, Si, K, Na and
Mg) mineral maps were scanned simultaneously using the thallium acid phthalate (TAP)
crystal-fitted WDS. Ca and Al were mostly abundant and observed under EDS using the
SEM apparatus. Total image collection time per sample was approximately 6.5 minutes.
Collated images aided the evaluation of magnesium-rich carbonates grains and the
distinction of detrital and authigenic silica. This technique provides an opportunity to
relate CL intensities to intracrystal compositional changes especially in carbonate and

PhD Thesis | 2019
43
quartz crystals (Martire et al. 2014). This data was essential for the diagenetic study
presented in Chapter 4 of this thesis.
1.5.5 Bulk X-ray Powder Diffraction
Semi-quantitative bulk mineral analyses were acquired from XRD analysis. XRD analysis
measures the minerals present within a sample (Stanjek & Häusler 2004). Solid
crystalline minerals exhibit specific diffraction patterns when they interact with X-rays
(Jenkins & Snyder 1996). Combined with other techniques (e.g. energy dispersive X-ray
spectroscopy) it allows the characterisation and semi-quantification of minerals within
the studied dataset. Seventy-eight samples were crushed using an agate pestle and
mortar to produce <65 µm sized aliquots. An internal standard XRD method at the School
of Earth and Environmental Science, University of Manchester was adopted which
involves taking 0.2 g of each powdered samples mixed with ~1ml of a volatile organic
solvent (iso-amyl acetate) to produce a slurry mount on a glass slide. Samples on glass
slides were air-dried and inserted into a Bruker D8 Advance Diffractometer. The
diffractometer is equipped with a Göbel mirror, a Lynxeye sensitive detector and an X-
ray tube emitting monochromatic CuKα1 X-rays with 1.5406Å wavelength. Scanning
mode for each step was set from 5°-70° 2Ɵ of diffracted beam, with a step size of 0.02°
and a count time of 0.2 seconds. Generated diffraction peak profiles were evaluated using
the EVA version 4 software, a software program for Bruker Diffractometer. These were
compared mineral standards from the International Centre for Diffraction Data (ICDD)
database. Quantitatively, peak intensities of minerals were measured from X-ray
diffraction data using the Bruker TOPAS software. The mineralogical data from this
technique aided the study on diagenesis (Chapter 4) and the impact of mineral
distribution in pore values (Chapter 5). The diffractograms of analysed samples are
presented in the Appendix.

PhD Thesis | 2019
44
1.5.6 Major and trace elemental analysis
For major and trace elemental analysis, 12 grams of 67 crushed samples were prepared
for analysis. Samples were pelleted using a pneumatic press. Pelleted samples weighed
~15g (12g powdered sample and 3g of non-reactive wax binder) and analysed using
PANalytical Axios sequential X-ray Fluorescence (XRF) Spectrometer at the University of
Manchester. Element geochemical indices, especially trace metals, have been routinely
utilised in paleoredox environmental reconstruction and provenance studies (e.g. Jones
& Manning 1994; Böning et al. 2004; Tribovillard et al. 2004; Abanda & Hannigan 2006;
Tribovillard et al. 2006; Rimstidt et al. 2017; Haddad et al. 2018). The covariation of both
major and trace elements was examined in this study for the reconstruction of
paleoproductivity and paleoredox conditions. Quantitative data of major elements from
XRF analysis were acquired using the Malvern Panalytical’s XRF softwere suite (Omnian)
for 11 major elements Na, Mg, Al, Si, P, S, Cl, Ti, Ca, Fe and K in their respective oxide
species. The Pro-Trace element analytical software from Malvern Panalytical software
suite was utilised to determine net intensities of 35 trace-elements and 5 rare earth
elements in each sample. This data was effective in understanding early diagenetic redox
conditions for the diagenetic study presented in Chapter 4.
1.5.7 Total organic carbon and Rock-Eval
TOC data and Rock-Eval data were acquired from 2 g aliquots of selected samples based
on visual distinction of dark- to black-coloured samples from argillaceous units and
reference samples from carbonate-rich units. 30 visibly organic-rich samples were
analysed for TOC from which 12 representative aliquots of mainly darker, argillaceous
samples were taken for Rock-Eval analysis. Analytical procedures for both analyses
followed the Norwegian Industry Guide to Organic Geochemical Analysis (NIGOGA)
guidelines (Weiss et al. 2006). For TOC analysis, samples were crushed and analysed

PhD Thesis | 2019
45
using the Leco method at Applied Petroleum Technology (APT), Norway. Samples were
initially treated with 10% (vol.) concentrated HCl acid to remove carbonate components
before being introduced to a Leco SC-632 combustion oven. Whilst an industry standard,
the sample preparation for TOC may not necessarily remove all carbonates (e.g. dolomite,
ankerite and siderite), hence measured TOC might be an overestimation. The amount of
carbon was determined by measuring the amount of carbon dioxide using infrared
detection.
Rock-Eval data was acquired using the HAWK apparatus also at the Applied Petroleum
Technology (APT), Norway. Jet-Rock 1 sample (a Norwegian Geochemical Standard
sample) was run intermittently as a standard and checked against the acceptable range
given in NIGOGA. This data provided information on generated and residual
hydrocarbons using the amounts of hydrocarbon and CO2 released per gram of sample at
reference temperatures (300 °C – 650 °C) under laboratory maturation (Espitalié et al.
1977). These proxies in conjunction with TOC data served as input values for the
determination of organic matter type, hydrocarbon source potential and quality (S1, S2
and S3 peaks), and source rock thermal maturity (Tmax). The information gathered from
these results aided diagenetic and pore analytical studies presented respectively in
Chapters 4 & 5.
1.5.8 Nitrogen gas adsorption
Gas adsorption on porous solids and powders (e.g. carbonaceous solids, zeolites and
siliceous materials) is a technique widely utilized for direct measurement of pore
properties and has been modified since Langmuir’s, and Brunauer, Emmett and Teller’s
(BET) theory (F. Rouquerol et al. 2013). Pore characterisation using this technique is
achieved by accurately measuring the amount of gas adsorbed on a solid material. Due to

PhD Thesis | 2019
46
nanodarcy permeability of mudstones, crushing of samples enhances volume
measurement by facilitating the intrusion of low-pressure cryogenic gas in the pore
spaces (Luffel & Guidry 1989; Bertoncello & Honarpour 2013). Adsorptive gases
including Ar, CH4, CO2 and N2 are frequently used in their fluid phase on varying materials
depending on research interest (Groen et al. 2003). Sub-critical gas adsorption using
nitrogen gas has been successfully applied for quantitative characterisation of 0.3 to 200
nm size pores in mudstones and has been utilised in this study (e.g. Ross & Marc Bustin
2009; Kuila et al. 2012; Kuila & Prasad 2013a; Chalmers et al. 2012). For N2 adsorption
on mudstone samples, dry powdered samples are exposed to cryogenic liquid nitrogen at
a constant temperature of ~77.3K. At this temperature over relative equilibrium pressure
P/P0 (ratio of absolute equilibrium pressure and condensation pressure of N2 at room
temperature), nitrogen gas is adsorbed on the exposed particles. The volume of adsorbed
gas on the solid surface is measured while pressure is systematically increased until P/P0
= 1 (i.e. absolute pressure equals condensation pressure). Nitrogen gas adsorption
analysis for this research was carried out at University of Greenwich using a
Micromeritics 3Flex 3.01 surface characterisation analyser. Ten dry <40-mesh powdered
samples were degassed at 40 °C and exposed to nitrogen gas at constant cryogenic liquid
nitrogen temperature of ~77.3K (e.g. Kuila & Prasad 2013a). The data from this
experiment aided by specific mathematical models (e.g. BET theory, Harkins-Jura (HJ)
thickness equation and the Barret, Joyner & Halenda (BJH) technique) are applied to
produce different plots for the quantitative and semi-qualitative interpretation of pores.
Isotherm curves, hysteresis loops and the BJH-HJ pore size distribution curves are
derivative plots that provide a series of information on pore attributes nano-porous
solids. These are presented in Chapter 5 of this thesis. Isotherm curves provide a

PhD Thesis | 2019
47
qualitative assessment of the porous structure of materials (Sing et al. 1985; Kuila et al.
2012).
Figure 1.5: An illustration of typical isotherm curves with adsorption branch (red) and desorption branch (green). Regions (i) representing the onset of microporous filling, (ii) monolayer filling and (iii) multilayer filling of pores
Six types of isotherm curves are identified by the IUPAC in gas-adsorption analysis – type
I to type VI (Sing et al. 1985). For clays, only three of these isotherms are applicable,
namely: type I, II and IV for samples dominated by micropores, macropores or non-
porous and mesoporous respectively (Kuila & Prasad 2013a) (see Section 5.1.2.4).
However, a type IIB isotherm curve has been proposed by Rouquerol et al. (1999) to
interpret a near-type IV match that has an absence of high relative pressure (P/P0)
plateau.
The appearance of hysteresis in isotherm curves is an indication of multilayer adsorption
and capillary condensation. Vapour condenses at about 0.4 P/P0 depending on the pore
diameter (Kuila & Prasad 2013a) as adsorption and desorption are being controlled

PhD Thesis | 2019
48
“pore-body” sizes and pore throat (the smallest diameter of an irregular pore)
respectively (Mason 1982; Groen et al. 2003). The hysteresis phenomenon reflects the
irreversibility of physisorption in mostly mesopores during “filling” and “emptying” –
adsorption and desorption respectively, thus a loop is formed between them (Figure 1.5).
Hysteresis loops can exhibit gentle (normal) or forced closure, where the desorption
branch of the isotherm collapses onto the adsorption isotherm. A forced closure
(observed at ~0.4 P/P0) is attributed to “tensile strength effect” which reflects the
collapse of the hemispherical meniscus during capillary evaporation in pores with a
diameter of <4nm (Groen et al. 2003). Shape, size, and nature of closure within hysteresis
loops reveal predominant pore-size present in samples (Sing et al. 1985). IUPAC provides
four types of hysteresis pattern or loops- H1, H2, H3 and H4 (Sing et al. 1985).
The BJH-HJ pore size distribution (BJH-HJ PSD) is the application of the BJH pore size
distribution technique (Barrett et al. 1951) using the HJ thickness equation (Kuila &
Prasad 2013a). The BJH technique is based on the Kelvin equation which explains that
the surface curvature of the vapour-liquid interface (meniscus) has a significant effect on
the transition vapour pressure; hence, the pore diameter is related to the relative
pressure of gas condensation. The BJH-HJ PSD is then the partial volume of each pore
diameter obtained using the Kelvins equation to invert measured isotherm data of
samples while accommodating the effects of thinning of the adsorbed layer using a
thickness curve (HJ statistical thickness curve/equation). Pore diameter <1.7nm are not
resolved by the BJH as Kelvin equation is invalid in such pores (pore diameter being too
small for multi-molecular adsorption). Pore surface area (PSA) measurements are also
estimated from multimolecular adsorption. The PSA is determined by comparing results
from a single point surface area at P/P0 = 0.3, the modified BET analysis and a t-plot
micropore/external surface area derivative. The BET analysis is the conversion of the

PhD Thesis | 2019
49
monolayer capacity of nitrogen molecules on external porous surfaces to the specific
surface area. A molecule of nitrogen has a cross-sectional area of 0.162 nm2 at 77.3K, the
average area occupied by each molecule after a complete monolayer (single layer)
adsorption is termed the monolayer capacity (Kuila et al. 2012). The BET technique is
applicable to pores exhibiting multilayer adsorption, hence for micropores (<2nm)
exhibiting micropore filling, the technique is not applicable. Rouquerol et al. (2007)
improved the adequacy of the BET analysis to measure surface areas on micropores, by
exploiting equivalent surface area from the BET plots.
1.5.9 X-ray computed tomography
High-resolution XCT technique or micro-CT involves the acquisition of three-dimensional
reconstructed images of samples from a series of two-dimensional image projections
(Blunt et al. 2013; Cnudde & Boone 2013). This technique allows for examining rock
texture, component volume fractions, grain size distribution and pore characterisation
(Cnudde & Boone 2013). A rock sample is rotated between an x-ray source and detector
from which a series of 2D radiographs are collected. Sample components attenuate the x-
rays by varying amounts based on the component density and atomic number. The
acquired 2D radiographs (over 1000 images) are then mathematically reconstructed into
a three-dimensional volume (computed tomography) (Feldkamp et al. 1984). For this
study, micro-CT data was collected on a representative sample at the Henry Moseley X-
ray Imaging Facility (MXIF), University of Manchester. Scanning was carried out on I mm
cube sample size using the Zeiss Xradia Versa XCT system. The sample was prepared by
extracting 1 mm slices of polished 1mm thick thin sections using a wire saw. X-ray
machine parameter was set to run at a voltage of 80kV and 7W power. Avizo 3-D
visualization software (FEI) was utilised for data visualization and analysis of the 3D
volume. This analysis, however, rendered a digital image volume with poor resolution

PhD Thesis | 2019
50
unsuitable for micro-pore identification. The data generated was advantageous in
understanding mineral and organic matter distribution.
Thesis synopsis
This thesis is structured in Journal Format formally referred to as the alternative format
according to the standards of the University of Manchester. The thesis presented is
subdivided into 6 individual, yet, interdependent chapters.
Chapter 1 (this chapter) introduces the research rationale, aims and objectives. It also
introduces the study area, its geological setting and the scientific methods utilised to
answer highlighted research questions.
Chapter 2 follows with a comprehensive literature review on mudstone mineralogy,
sedimentation, depositional environments, mudstone diagenesis, facies schemes and
mudstone properties as unconventional reservoirs.
The succeeding three chapters address the research objectives developed in this thesis
(see Section 1.4). Chapter 3 presents a detailed facies characterisation of the Viséan
succession of the Bowland Basin. Chapter 4 explores the paragenetic evolution and
thermal maturation of the studied succession and Chapter 5 evaluates the porosity and
pore attributes of the Hodder Mudstone.
Chapter 6 summarizes, concludes and provides recommendations to be considered for
further study. An abstract of poster publication is contained in the Appendix
This order was designed to follow a logical sequence in line with the chronological
workflow developed for the research. Chapters 3, 4 and 5 are original studies,
observations, discussions and hypothesis presented as stand-alone papers for
publication. These papers include separate abstracts, introductions, geological settings,

PhD Thesis | 2019
51
methods, results, discussions, conclusions and references. Therefore, some ideas,
discussions and references may be recurrent throughout the thesis. The results in these
chapters have also been presented separately at international conferences and
consortium meetings. Chapter 3 was submitted to the Journal ‘Sedimentology’ in late
2018, this was rejected due to major revisions with an invitation to resubmit at a later
date. These corrections have been made and the updated version is presented in this
thesis, ahead of resubmission to a different journal. Chapters 4 & 5 are currently being
prepared for journal publication. These research chapters are briefly summarised below.
Chapter 3: Mud-rich Calciclastic Facies in the Viséan submarine fans of the
Bowland Basin, UK. This uses core data and petrographic tools to highlight significant
stratigraphic and sedimentological features of a complex Carboniferous mud-rich
calciclastic turbiditic facies deposited in the Bowland Basin, north-western England. The
results show the distribution and variation of a calciclastic and muddy turbidite facies
sequence from the interaction of sea-level variations and extensional tectonics on a
distally steepened carbonate ramp.
Contributing authors: Kevin G. Taylor (main supervisor, manuscript review and
discussions) & Patrick J. Dowey (co-supervisor, manuscript review and discussions).
Major revisions from Journal of Sedimentology reviews, which included comments and
corrections from two reviewers (John J. G. Reijmer and an anonymous reviewer), the chief
editor – Peir Pufahl and the associate editor – Christian Betzler.
Publication status: In preparation for submission to the Journal of Sedimentary Research.
Chapter 4: Diagenetic evolution in the mixed carbonate- and siliceous-rich Hodder
Mudstone Formation, Bowland Basin, UK. This study presents evidence from high-

PhD Thesis | 2019
52
resolution petrography (ultra-violet light microscopy, SEM), mineralogy (XRD) and
geochemical data (XRF, EDS, EPMA, RockEval pyrolysis) to understand and characterise
the diagenetic events of the Lower Carboniferous Hodder Mudstone succession. It also
argues the abundance of authigenic quartz cement as an integral component in the
Hodder Mudstone and discusses the likely origin, geological controls and timing of
authigenic quartz.
Contributing authors: Kevin G. Taylor (main supervisor, manuscript review and
discussions) & Patrick J. Dowey (co-supervisor, manuscript review and discussions)
Publication status: In preparation for submission to the Journal of Sedimentary Geology
Chapter 5: Pore Morphology and Nanopore Characterisation of the Hodder
Unconventional Reservoir, Bowland Basin, UK. In this study, a quantitative and direct
visual qualitative dual-scale approach is utilised to analyses pores of mudstone samples from
the Hodder Mudstone, Bowland Basin. It characterises the pore structure and pore size
distribution of representative Hodder Mudstone samples from varying depths and different
facies using nitrogen adsorption data and SEM imaging and links porosity variability to mineral
compositions.
Contributing authors: Kevin G. Taylor (main supervisor, manuscript review and
discussions) & Patrick J. Dowey (co-supervisor, manuscript review and discussions)
Publication status: In preparation for submission to the Journal of Marine and Petroleum
Geology.
References
Abanda, P.A. & Hannigan, R.E., 2006. Effect of diagenesis on trace element partitioning in shales. Chemical Geology, 230(1–2), pp.42–59.
Aitkenhead, N. et al., 1992. Geology of the Country Around Garstang. British Geological

PhD Thesis | 2019
53
Survey Memoir for 1:50000 geological sheet 67 (England and Wales).
Andrews, I.J., 2013. The Carboniferous Bowland Shale gas study: geology and resource estimation. British Geological Survey for Department of Energy and Climate Change, London, UK.
Arthurton, R.S., 1984. The Ribblesdale fold belt, NW England—a Dinantian-early Namurian dextral shear zone. Geological Society, London, Special Publications, 14(1), p.131 LP-138..
Bai, B. et al., 2013. Rock characterization of Fayetteville shale gas plays. Fuel, 105, pp.645–652.
Barrett, E.P., Joyner, L.G. & Halenda, P.P., 1951. The Determination of Pore Volume and Area Distributions in Porous Substances. I. Computations from Nitrogen Isotherms. Journal of the American Chemical Society, 73(1), pp.373–380.
Bertoncello, A. & Honarpour, M.M., 2013. Standards for Characterization of Rock Properties in Unconventional Reservoirs: Fluid Flow Mechanism, Quality Control, and Uncertainties. SPE Annual Technical Conference and Exhibition.
Blunt, M.J. et al., 2013. Pore-scale imaging and modelling. Advances in Water Resources, 51, pp.197–216.
Böning, P. et al., 2004. Geochemistry of Peruvian near-surface sediments. Geochimica et Cosmochimica Acta, 68(21), pp.4429–4451.
Bott, M.H.P., 1967. Geophysical investigations of the Northern Pennine basement rocks. Proceedings of the Yorkshire Geological Society, 36, pp.139–168.
Brindle, S. et al., 2015. An integrated approach to unconventional resource play reservoir characterization, Thistleton-1 case study, NW England. First Break, 33(2), pp.79–86.
Bust, V.K. et al., 2013. The petrophysics of shale gas reservoirs: Technical challenges and pragmatic solutions. Petroleum Geoscience, 19(2).
Bustin, R. et al., 2008. Impact of shale properties on pore structure and storage characteristics. SPE Shale Gas Production Conference, p.SPE 119892.
Chalmers, G.R., Bustin, R.M. & Power, I.M., 2012. Characterization of gas shale pore systems by porosimetry, pycnometry,surfacearea,andfield emission scanning electron microscopy/ transmission electron microscopy image analyses: Examples from the Barnett, Woodford, Haynesville, Marcellus,andDoig units. AAPG Bulletin, 96(6), pp.1099–1119.
Charsley, T.J., 1984. Early Carboniferous rocks of the Swinden No. 1 Borehole, west of Skipton, Yorkshire. Report of the British Geological Survey, 84(1), pp.5–12.
Clarke, H. et al., 2018. Shale gas resources of the Bowland Basin, NW England: a holistic study. Petroleum Geoscience, 066.
Clarke, H., Turner, P. & Bustin, R.M., 2014. Unlocking the resource potential of the Bowland Basin, NW England. Society of Petroleum Engineers - European Unconventional Resources Conference and Exhibition 2014: Unlocking European Potential, 2(February), pp.25–27.

PhD Thesis | 2019
54
Clarkson, C.R. et al., 2012. Nanopore-structure analysis and permeability predictions for a tight gas siltstone reservoir by use of low-pressure adsorption and mercury-intrusion techniques. SPE Reservoir Evaluation & Engineering, 15(6), pp.648–661.
Cnudde, V. & Boone, M.N., 2013. High-resolution X-ray computed tomography in geosciences: A review of the current technology and applications. Earth-Science Reviews, 123, pp.1–17.
Dean, M.T. et al., 2011. A lithostratigraphical framework for the Carboniferous successions of northern Great Britain (onshore). British Geological Survey Research Report RR/09/01, p.174.
EAGE, 2019. Industry News. First Break, 37(3), p.28.
Earp, J.R. et al., 1961. Geology of the country around Clitheroe and Nelson. Memoir of the Geological Survey of Great Britain, Sheet 68.
Ebdon, C.C. et al., 1990. The Dinantian Stratigraphy of the East Midlands: A seismostratigraphic approach. Journal of the Geological Society London, 147, pp.519–536.
Espitalié, J. et al., 1977. Source rock characterization method for petroleum exploration. Offshore Technology Conference, Houston.
Evans, D.J. & Kirby, G.A., 1999. The architecture of concealed Dinantian carbonate sequences over the Central Lancashire and Holme highs, northern England. Proceedings of the Yorkshire Geological Society, 52(3), pp.297–312.
Feldkamp, L.A., Davis, L.C. & Kress, J.W., 1984. Practical cone-beam algorithm. Journal of the Optical Society of America A, 1(6), pp.612–619.
Fewtrell, M. & Smith, D., 1980. Revision of the Dinantian stratigraphy of the Craven Basin, N England. Geological Magazine, 117(01), pp.37–49.
Fraser, A.J. et al., 1990. A regional assessment of the intra-Carboniferous play of northern England J. J. Brooks, ed. Classic Petroleum Provinces, 50, pp.417–440.
Fraser, A.J. & Gawthorpe, R.L., 2003. An atlas of Carboniferous basin evolution in Northern England. Geological Society Memoir, 28.
Fraser, A.J. & Gawthorpe, R.L., 1990. Tectono-stratigraphic development and hydrocarbon habitat of the Carboniferous in northern England. Geological Society, London, Special Publications, 55(1), pp.49–86.
Gawthorpe, R.L., 1986. Sedimentation during carbonate ramp-to-slope evolution in a tectonically active area: Bowland Basin (Dinantian), northern England. Sedimentology, 33, pp.185–206.
Gawthorpe, R.L., 1987. Tectono-sedimentary evolution of the Bowland Basin, northern England, during the Dinantian. Journal of the Geological Society London, 144, pp.59–71.
Gawthorpe, R.L., Gutteridge, P. & Leeder, M.R., 1989. Late Devonian and Dinantian basin evolution in Northern England and North Wales R. S. Arthurton, P. Gutteridge, & S. C. Nolan, eds. The role of tectonics in Devonian and carboniferous sedimenration in the British isle., 6, pp.1–23.

PhD Thesis | 2019
55
Gradstein, F.M. et al., 2012. The Geologic Time Scale 2012 Vol. 2.
Grayson, R.F. & Oldham, L., 1987. A new structural framework for the northern British Dinantian as a basis for oil, gas and mineral exploration J. Miller, A. E. Adams, & V. P. Wright, eds. European Dinantian environments, pp.33–59.
Groen, J.C., Peffer, L.A.A. & Pérez-Ramírez, J., 2003. Pore size determination in modified micro- and mesoporous materials. Pitfalls and limitations in gas adsorption data analysis. Microporous and Mesoporous Materials, 60(1–3), pp.1–17.
Haddad, E.E. et al., 2018. Ichnofabrics and chemostratigraphy argue against persistent anoxia during the Upper Kellwasser Event in New York State. Palaeogeography, Palaeoclimatology, Palaeoecology, 490.
Han, Y., Mahlstedt, N. & Horsfield, B., 2015. The Barnett Shale: Compositional fractionation associated with intraformational petroleum migration, retention, and expulsion. AAPG Bulletin, 99(12), pp.2173–2201.
Haszeldine, R.S., 1984. Carboniferous North Atlantic palaeogeography: stratigraphic evidence for rifting, not megashear or subduction. Geological Magazine, 121(5), pp.443–463.
Hennissen, J.A.I. et al., 2017. The prospectivity of a potential shale gas play: An example from the southern Pennine Basin (central England, UK). Marine and Petroleum Geology, 86, pp.1047–1066..
Holliday, D.W. & Molyneux, S.G., 2006. Editorial statement: new official names for the subsystems, series and stages of the Carboniferous System - some guidance for contributors to the Proceedings. Proceedings Of The Yorkshire Geological Society, 56, pp.57–58.
Huang, J., Cavanaugh, T. & Nur, B., 2013. An Introduction to SEM Operational Principles and Geologic Applications for Shale Hydrocarbon Reservoirs. Electron microscopy of shale hydrocarbon reservoirs: AAPG Memoir 102, pp.1–6.
Hudson, R.G.S., 1933. The general geology and the Carboniferous Rocks: The geology of the country around Harrogate. Proceedings of the Geologists’ Association, 49, pp.295–352.
Jarvie, D.M., 2014. Components and processes affecting producibility and commerciality of shale resource systems. Geologica Acta, 12(4), pp.307–325.
Jarvie, D.M., 2012. Shale Resource Systems for Oil and Gas: Part 1—Shale-gas Resource Systems J. A. Breyer, ed. Shale reservoirs—Giant resources for the 21st century, 97, pp.69–87.
Jones, B. & Manning, D.A.C., 1994. A comparison and correlation of different geochemical indices used for the interpretation of depositional environments in ancient mudstones. Chemical Geology, 111(1–4), pp.111–129.
Kimbell, S.F. et al., 1989. The structure and evolution of the Northumberland Trough from new seismic reflection data and its bearing on modes of continental extension. Journal of the Geological Society London, 146, pp.775–787.
Klaver, J. et al., 2015. BIB-SEM characterization of pore space morphology and

PhD Thesis | 2019
56
distribution in postmature to overmature samples from the Haynesville and Bossier Shales. Marine and Petroleum Geology, 59, pp.451–466.
Kuila, U. et al., 2012. Compositional Controls on Mudrock Pore-Size Distribution: An Example from Niobrara Formation. SPE Annual Technical Conference and Exhibition, p.16.
Kuila, U. & Prasad, M., 2013. Application of nitrogen gas-adsorption technique for characterization of pore structure of mudrocks. The Leading Edge, 32(12), pp.1478–1485.
Lazar, O.R. et al., 2015. Capturing key attributes of fine-grained sedimentary rocks in outcrops, cores, and thin sections; nomenclature and description guidelines. Journal of Sedimentary Research, 85(3), pp.230–246.
Leeder, M.R., 1988. Recent developments in Carboniferous geology: a critical review with implications for the British Isles and NW Europe. Proceedings of the Geologists’ Association, 99, pp.73–100.
Leeder, M.R., 1982. Upper Palaeozoic basins of the British Isles-Caledonide inheritance versus Hercynian plate margin processes. Journal of the Geological Society, London, 139(1980), pp.479–491.
Loucks, R.G. et al., 2009. Morphology, Genesis, and Distribution of Nanometer-Scale Pores in Siliceous Mudstones of the Mississippian Barnett Shale. Journal of Sedimentary Research, 79(12), pp.848–861.
Luffel, D.L. & Guidry, F.K., 1989. Reservoir rock properties of Devonian shale from core and log analysis. In Society of Core Analysts Conference.
Martire, L. et al., 2014. Selective dolomitization by syntaxial overgrowth around detrital dolomite nuclei: A case from the Jurassic of the Marguareis Ligurian Briançonnais (Ligurian Alps). Journal of Sedimentary Reseach, 84(October), pp.40–50.
Mason, G., 1982. The Effect of Pore-Space Connectivity on the Hysteresis of Capillary Condensation in Adsorption Desorption Isotherms. Journal.of.Colloid and.Interface Science, 88(1), pp.36–46.
McGlade, C., Speirs, J. & Sorrell, S., 2013. Unconventional gas - A review of regional and global resource estimates. Energy, 55, pp.571–584.
Menning, M. et al., 2006. Global time scale and regional stratigraphic reference scales of Central and West Europe, East Europe, Tethys, South China, and North America as used in the Devonian-Carboniferous-Permian Correlation Chart 2003 (DCP 2003). Palaeogeography, Palaeoclimatology, Palaeoecology, 240(1–2), pp.318–372.
Miller, J. & Grayson, R.F., 1982. The Regional Context of Waulsortian Facies in Northern England K. Bolton, R. H. Lane, & D. V Le Mone, eds. Symposium on the paleoenvironmental setting and distribution of the Waulsortian facies, pp.17–33.
Milliken, K. et al., 2007. “Cherty” stringers in the Barnett Shale are agglutinated foraminifera. Sedimentary Geology, 198(3–4), pp.221–232.
Milliken, K.L. & Curtis, M.E., 2016. Imaging pores in sedimentary rocks: Foundation of porosity prediction. Marine and Petroleum Geology, 73, pp.590–608.

PhD Thesis | 2019
57
Newport, S.M. et al., 2017. Sedimentology and microfacies of a mud-rich slope succession: in the Carboniferous Bowland Basin, NW England (UK). Journal of the Geological Society, London, (Gawthorpe 1987), p.16pp.
Nole, M. et al., 2016. A method for estimating microporosity of fine-grained sediments and sedimentary rocks via scanning electron microscope image analysis. Sedimentology, pp.1507–1521.
Pommer, M. & Milliken, K., 2015. Pore types and pore-size distributions across thermal maturity, Eagle Ford Formation, southern Texas. AAPG Bulletin, 99(9).
Riley, N.J., 1993. Dinantian (Lower Carboniferous) biostratigraphy and chronostratigraphy in the British Isles. Journal of the Geological Society London, 150(3), pp.427–446.
Riley, N.J., 1990. Stratigraphy of the Worston Shale Group (Dinantian), Craven Basin, north-west England. Proceedings of the Yorkshire Geological Society, 48(2), pp.163–187.
Rimstidt, J.D., Chermak, J.A. & Schreiber, M.E., 2017. Processes that control mineral and element abundances in shales. Earth-Science Reviews, 171(September 2016), pp.383–399.
Ross, D.J.K. & Marc Bustin, R., 2009. The importance of shale composition and pore structure upon gas storage potential of shale gas reservoirs. Marine and Petroleum Geology, 26(6), pp.916–927.
Rouquerol, F. et al., 2013. Introduction. Adsorption by Powders and Porous Solids: Principles, Methodology and Applications: Second Edition, pp.1–24.
Rouquerol, F., Rouquerol, J. & Sing, K., 1999. Chapter 3 - Methodology of Adsorption at the Gas-Solid Interface. In Adsorption by Powders and Porous Solids. pp. 51–92.
Rouquerol, J., Llewellyn, P. & Rouquerol, F., 2007. Is the BET equation applicable to microporous adsorbents? Studies in Surface Science and Catalysis, 160, pp.49–56.
Rybacki, E., Meier, T. & Dresen, G., 2016. What controls the mechanical properties of shale rocks? - Part II: Brittleness. Journal of Petroleum Science and Engineering, 144, pp.39–58.
Schieber, J., 2011. Shales. Encyclopedia of Geobiology, pp.785–791.
Sing, K.S.W. et al., 1985. International union of pure and applied chemistry physical chemistry division reporting physisorption data for gas/soils systems with special reference to the determination of surface area and porosity. Pure Appl. Chemistry, 57(4), pp.603–619.
Slatt, R.M., 2011. Important geological properties of unconventional resource shales. Central European Journal of Geosciences, 3(4), pp.435–448.
Soeder, D.J., 2018. The successful development of gas and oil resources from shales in North America. Journal of Petroleum Science and Engineering, 163, pp.399–420.
Soper, N.J., Webb, B.C. & Woodcock, N.H., 1987. Late Caledonian (Acadian) transgression in North West England: timing, geometry and geotcctonic significance. Proceedings of the Yorkshire Geological Society, 46, pp.175–192.

PhD Thesis | 2019
58
Stanjek, H. & Häusler, W., 2004. Basics of X-ray Diffraction. Hyperfine Interactions, 154(1–4), pp.107–119.
Tribovillard, N. et al., 2004. Deep-water anoxia over the Frasnian-Famennian boundary (La Serre, France): A tectonically induced oceanic anoxic event? Terra Nova, 16(5), pp.288–295.
Tribovillard, N. et al., 2006. Trace metals as paleoredox and paleoproductivity proxies: An update. Chemical Geology, 232(1–2), pp.12–32.
Waters, C.N. et al., 2009. A lithostratigraphical framework for the Carboniferous successions of northern Great Britain (onshore). British Geological Survey Research Report RR/09/01.
Waters, C.N. et al., 2011. Craven Basin and southern Pennines. In C. N. Waters, ed. A revised correlation of Carboniferous rocks in the British Isles. London: Geological Society (London) Special Report, pp. 74–81.
Waters, C.N. & Condon, D.J., 2013. Nature and timing of Late Mississippian to Mid-Pennsylvanian glacio-eustatic sea-level changes of the Pennine Basin, UK: Discussion Reply. Journal of the Geological Society, 170(5), pp.850–850.
Weiss, H.M. et al., 2006. The Norwegian Industry Guide to Organic Geochemical Analyses [online]. Edition 4.0 Norsk Hydro Statoil, Geolab Nor. SINTEF Petroleum Research and the Norwegian Petroleum Directorate.
Welton, J.E., 2003. SEM petrology atlas,
Williams, K.E., 2012. The Permeability of Overpressure Shale Seals and of Source Rock Reservoirs is the Same.
Wright, V.P., 1994. Early Carboniferous carbonate systems: an alternative to the Cainozoic paradigm. Sedimentary Geology, 93(1–2), pp.1–5.

PhD Thesis | 2019
59
Chapter 2 A Review on Mudstones

PhD Thesis | 2019
60
2 A Review on Mudstones
Introduction
In terms of rock volume and recorded stratigraphic time, fine-grained (<62.5 µm) rocks
dominate the sedimentary record (Potter et al. 1980; Schieber 2003; Potter et al. 2005).
They may consist of <62.5 µm sized terrigenous silicate grains, calcareous debris and/or
open marine (hemi) pelagic sediments in varying proportions. In the literature, a wide
range of names are routinely applied to this rock type. “Mudstone”, “mudrock”, and
“claystone” are a plethora of names together with “shale” used in the literature to refer to
rocks having a mixture of clay and silt rock-fraction as the dominant (>50%) grain-size
(Potter et al. 1980; Stow 1981; Dean et al. 1985; Quine & Bosence 1991; Lazar et al. 2015).
Although the term shale implies fissility – a by-product of weathering resulting from the
preferential arrangement of individual phyllosilicate minerals (Lazar et al. 2015) – it has,
however, become a class-name widely used in the oil and gas industries for siliciclastic
fine-grained rocks with grain size <62.5μm. The ambiguity in nomenclature has been
elucidated by Twenhofel (1937); Tourtelot (1960); Pettijohn (1975); Blatt et al. (1980);
Stow (1981); Aplin et al. (1999); Macquaker and Adams (2003); Lazar et al. (2010);
Milliken (2014); Lazar et al., (2015), and is discussed further in the next chapter. While
this review seeks not to posit a suitable name for fine-grained rocks, if follows Tourtelot
(1960) and Lazar et al., (2015), who considered “mudstone” to be a generally accepted
‘class name’ for fine-grained siliciclastic rocks in preference to shale. Thus, the term
“mudstone” is preferred throughout this thesis, except where other terminologies have
been historically applied in formation names.
Mudstones due to their grain-size, high organic matter content and widespread
occurrence (Potter et al. 1980; Stow 1981; Blatt 1982; Aplin et al. 1999; Aplin &

PhD Thesis | 2019
61
Macquaker 2011) are of utmost importance as they contain a useful amount of
stratigraphic information within sedimentary sequences (Blatt 1982). More so,
mudstones serve as hydrocarbon source rocks, reservoirs and seals, they host economic
metals and are useful long term storage of nuclear waste and carbon dioxide. Despite this
significance, mudstones have not been satisfactorily understood. Their mode of
deposition, diagenesis processes and their mechanical and petrophysical behaviour are
still being debated (e.g. Schieber 1999; Schieber 2011a; Aplin & Macquaker 2011;
Milliken & Day-Stirrat 2013; Taylor & Macquaker 2014; Lazar et al. 2015).
Mudstone mineralogy
The mineralogical compositions of mudstones are a function of provenance and
diagenetic history (Macquaker et al. 2007; Milliken 2014). Deposited sediments mostly
comprise materials from physical/chemical weathering, primary production in basins,
diagenetic overprinting, and other trace constituents (Table 1) (Garrels & Mackenzie
1971; Hillier 1995; Potter et al. 2005). Occasionally, there could be inputs from volcanic
ashes (Potter et al. 1980) and terrestrially derived organic matter (Tyson 1995). Grain
sizes exhibited by these constituents vary greatly as particles range from 0.1μm to
62.5μm, consequently increasing heterogeneity (Potter et al. 1980; Macquaker &
Gawthorpe 1993). Constituent minerals consist of a mixture of clay minerals (e.g.
kaolinite, smectite, illite and chlorite), micas, carbonates, quartz, feldspars, sulphides,
phosphates, amorphous materials and organic matter (Blatt et al. 1980; Potter et al. 2005;
Aplin & Macquaker 2011). Characterising the differing proportions of minerals in
mudstones and their origin is a precursor to achieving an understanding of the small-
scale to large-scale changes.

PhD Thesis | 2019
62
2.2.1 Detrital (extra-basinal) components
Detrital grains are predominantly terrigenous or extrabasinal sediments deposited in
ocean basins by river systems (Hillier 1995; Wright 2001; Potter et al. 2005; Schieber
2016a). In few cases, provenance could be from volcanic ashes or aeolian dust (Potter et
al. 1980). Grains occur as detrital silt fraction (grain size 2μm – 62.5μm) of quartz,
feldspar, micas, lithic fragments and silicified algal cysts (Aplin & Macquaker 2011).
These are mostly resistant fractions of chemical weathering (Aplin & Macquaker 2011).
Clay minerals from chemical weathering with crystalline grain sizes below 2μm (e.g.
smectite, chlorite and kaolinite) also make up the detrital mineral volume delivered along
with resistant mineral detritus.
2.2.2 In-situ derived (intra-basinal) components
Mudstones also compose of sediments produced primarily from biological actions or
from diagenetic/authigenic processes. Diagenetic components are products of
neoformation (precipitation from amorphous silicate materials), transformation and/or
modification of originally deposited minerals. More stable components replace unstable
non-resistant minerals during diagenesis, e.g. amorphous silica to authigenic quartz and
smectite to illite (Peltonen et al. 2008). In various cases, fossilized remains of larger
organisms could be present, preserved either as a complete skeleton, in fragments or
replaced by mineral recrystallization, e.g. corals, echinoderms, gastropods, brachiopods,
mollusc, other vertebrates and unicellular organisms. In-situ derived components range
from carbonates (aragonite, calcite, dolomites, and siderites), sulphides (pyrite),
biologically derived phosphates and opaline silica to amorphous organic matter. These
components mostly act as cements in mature samples.

PhD Thesis | 2019
63
SHALE MINERALOGY
MINERALS EXAMPLES ENVIRONMENTAL
INDICATION
OCCURRENCE RESPONSE TO
DIAGENESIS
FR
AM
EW
OR
K S
ILIC
AT
ES
Quartz
(Extrabasinal/
Authigenic)
Detrital Silica
(SiO2)
Microcrystalline
silica cement
Grain replacement
quartz
Detrital quartz grains
indicative of shoreline
proximity.
Diagenetic quartz reflects
pore water chemistry, burial
depth and temperature.
20%-30% present in average shale.
Small silt-size quartz crystals or as chalcedony
crystals.
Remains relatively
unchanged in mineralogy.
Noticeable quartz
overgrowth around grain
perimeter.
Feldspars Plagioclase
(Na/Ca- feldspars)
Orthoclase (K-
Feldspars)
Indicative of shoreline
proximity and provenance.
Plagioclase more abundant than orthoclase mostly
from authigenic processes.
Less abundant than quartz.
Replaced by clay minerals.
Zeolites Phillipsite
Clinoptilolite
Indicative of low-grade
metamorphism.
Mostly as altered products of volcanic glass.
Found in hypersaline lakes.
Occurs as prehnite at
temperature of about 90⁰C.
CL
AY
MIN
ER
AL
S
(PH
YL
LO
SIL
ICA
TE
S)
Kaolinite group Kaolinite
Dickite
Halloysite
Indicative of tropical and
subtropical weathering.
Good palaeogeographic
indicator as it occurs near
shore.
In soils associated with abundant rainfall, good
drainage and acid water.
Mineralogy relatively
unchanged.
Authigenic forms occur as
booklets that reduces
porosity.
Smectite group Smectite
(montmorillonite
and bentonite)
Provenance and shoreline
proximity.
Hydrated expandable mineral in many alkaline soils
Also derived from volcanic glass (as bentonites).
Smectite transforms to
Illite.

PhD Thesis | 2019
64
Mica Group Illite
Muscovite
Glauconite
Vermiculite
Provenance and shoreline
proximity, and extent of
diagenesis.
Also shows thermal history
as a result of altered Illite.
Illite is the most abundant clay mineral found in
deeply buried shales in association with chlorite.
Muscovite is the coarsest clay mineral aligning on
bedding and lamination surfaces.
Glauconite is exclusively marine and very iron rich.
Forms from slow sedimentation.
Vermiculite is formed by weathering or
hydrothermal alteration of iron-bearing Mg-rich
biotite.
Illite transforms to
Muscovite with further
diagenesis.
Muscovite detrital grains
are unaltered and occur
with biotite.
Glauconite forms from the
substitution of Al3+ for Fe3+
in illite – glauconite
transformation.
Vermiculite transforms to
corrensite
Chlorite Group Chlorite
Corrensite
Chamosite
Rare in tropical and
subtropical soil as it is prone
to weathering.
Shows chronology.
Apparently, the second most abundant clay mineral
in post Palaeozoic shales.
Forms diagenetically with burial in magnesium-rich
pore-water.
Chamosite occurs mostly in oolitic iron ores.
Remains relatively
unaltered.
Mg-rich
Aluminosilicates Sepiolite
Attapulgite
Palygorskite
Exclusively saline lakes and
recent marine muds
associated with volcanic
activity.
Forms when pore waters are rich in Mg. Diagenetically unaltered.
OX
IDE
S A
ND
HY
DR
OX
IDE
S
Iron oxides and
Hydroxides Haematite (oxide)
Magnetite (oxide)
Geothite
(hydroxide)
Limonite
(hydroxide)
Shows differences in
oxidizing and reducing
environments –
paleogeography.
Haematite is the most common oxides.
Hydrous goethite and Limonite occur mostly as
hydroxides.
They occur as coatings on clay minerals.
In a more reducing
environment, the iron
coating is changed to
sulphides (pyrite) and iron
carbonates (siderite) as
concretions.
Gibbsite Gibbsite Extreme tropical weathering
and acid leaching.
Associated with kaolinite in marine shales as
derivatives of weathering.
Remains relatively stable
as bauxite.

PhD Thesis | 2019
65
(Aluminium
Hydroxides) Bauxites Occurs as bauxite due to much weathering.
CA
RB
ON
AT
ES
Calcite Calcium carbonates
precipitated from
organism
Marine muds deposited
within the CCD (calcium
carbonate compensation
depth).
Common in marine shales than non-marine.
Could be deposited by turbidity current below CCD.
May dissolve or form
cement along pores.
Dolomite Magnesium
carbonates
Marine shales as in calcium
carbonates but a
replacement of Ca2+ by Mg2+
Common in marine shales than non-marine but no
direct link to occurrence with calcite.
May dissolve or form
cement along pores.
Ferroan
carbonates Siderite or ferroan
calcite
Ankerite or
ferroan dolomite
Paleogeographic
reconstruction in more
strongly reducing
environment.
Occurs mostly in concretion and as cementing
agent.
Siderite changes by
diagenesis to ankerite.
SUL
PH
UR
MIN
ER
AL
S
Sulphates Gypsum
Anhydrite
Barite
Indicative of hypersaline
environment both syn- and
post-deposition.
Occur as concretions in shales. Product of diagenesis.
Sulphides Pyrite or
marcasite
Indicating high reducing
conditions.
Abundant in marine shales than continental shales
as crystalline FeS2
May be altered to limonite
if environment turns
oxidizing.
OR
GA
NIC
MA
TE
RIA
LS
Terrigenous
organic matter Palynomorphs
Small coaly
fragments
Identifying proximity to
shorelines in Phanerozoic
shales.
Reflects thermal maturity of
basins.
Continentally derived sediments. Thermal alteration of
organic components.
Organic materials Sapropelic
Kerogen- Type I
Lipid-rich
kerogen- Type II
Indicating environment of
deposition.
Chronology.
Sapropelic kerogen is planktonic algal/amorphous
organic matter in lacustrine to marine environment.
Lipid-rich kerogen is mixed marine and continental
(phyto-and Zooplankton, spores and cuticles).
Organic matter
transformation in anoxic
environments

PhD Thesis | 2019
66
Humic Kerogen-
Type III
Basin (maturation) history.
Level and nature of organic
input.
Humic kerogen- exclusively from terrestrial woody
matter.
Complex diagenetic
transformation
(catagenesis).
Organic allochems Graptolites, marine algal spores.
Biogenic carbonate
allochems Bottom dwellers
(benthos)
Water-column
dwellers
(Planktons)
Exclusively marine Benthos: Molluscs, foraminifera, echinoderms,
brachiopods, bryozoan, calcareous algae.
Planktons: nannoplanktons (coccoliths),
foraminifera, stylolinids, crinoids, cephalopods.
Mineralized test with
calcite.
Biogenic Siliceous
Allochems Bottom dwellers
(benthos)
Water-column
dwellers
(Planktons)
Exclusively marine Benthos: Sponge spicules.
Planktons: Radiolaria and Diatomaceous oozes,
silicoflagellate.
Test mineralization with
microcrystalline quartz
under increased pore-
water acidity.
Sediment
Aggregates Bottom products
(benthic)
Water-column
dwellers
(Planktons)
Exclusively marine (organic
and inorganic flocculation)
Benthic: pellets, fragmented biofilms and mats,
intraclasts, fragmented agglutinated skeletons,
remains of soft-bodied sediment injesters.
Water column: coprolites, pellets, organo-minerallic
aggregates (marine snow), floccules.
Compaction and
cementation of grains.
Phosphates Apatite
Vivianite
Indicative of phosphorous
rich environment mostly
reducing
Occurs mostly in marine mud from phosphatic
allochems, e. g. conodonts, vertebrate bones and
teeth.
Forms phosphatic nodules.
Relatively unchanged.

PhD Thesis | 2019
67
Vivianite is an iron-bearing phosphate that occurs
in association with siderite in reducing
environment.
OT
HE
R C
ON
STIT
UE
NT
S
Lithic Fragments Fine rock
fragments
Close proximity to
weathered fragments.
Fine-crystalline metamorphic rocks.
Fine-crystalline volcanic rocks.
Fine-grained limestone and dolomites
Cherts.
Remains mineralogically
unaltered.
Volcanic glass Fragments of
rhyolites
(obsidian)
Associated with volcanism. Non-crystalline silica
Common in modern muds of either marine or
continental environments with volcanic influence
Transforms to zeolites or
smectites during burial.
Heavy Minerals Includes zircon,
rutile, tin oxides
and most minerals
occurring as
concretions
No restriction to region of
occurrence.
Could be generated anywhere but mostly
weathered from igneous origin.
Remains unaltered.
Table 1: Mudstone mineralogy compiled from studies by Potter et al. (1980) and Milliken (2014).

PhD Thesis | 2019
68
Mud sedimentation
Mud is a name given for unconsolidated fine-grained sediments that has a full range of
dispersal mechanism and deposition which is still being explored (Macquaker et al.
2010). There is a growing amount of current literature on turbulent mud depositional
processes along river systems, shelf, slope channels and fan fringes as opposed earlier
assumption of quiet settling of mud particles (e.g. Schieber 2016b; Schieber 2016a;
Knapp et al. 2017; Yawar & Schieber 2017; van de Lageweg et al. 2018; Boulesteix et al.
2019). Mud sedimentation requires processes of erosion/production, transportation and
deposition. Early ideas suggest that relatively low energy water conditions aid mud
particles deposition, where particles are perceived to settle out of suspension (McCave
1975; Potter et al. 1980; Alexander et al. 1991; Kineke et al. 1996; Potter 1998). In this
mechanism, the prevailing sediment transport system is fluvial (Aplin & Macquaker
2011). Flocculation and pelletization of particles are the normal processes in mud
sedimentation that occurs by organic or inorganic processes (Krank 1973; Macquaker
and Bohacs 2007; Aplin & Macquaker 2011). Inorganic flocculation involves
electrophysical processes of the mutual attraction of minute electrostatically charged
clay flakes (Stow et al. 1996). It initiates as sediments delivered by rivers experience
change in water salinity, resulting in floccule formation along shorelines, and may range
from 10μm - 700μm (Potter et al. 1980). The change in salinity increases the
concentration of electrolytes, reducing the thickness of the double diffuse layers on
minerals (Kranck 1973; Kranck 1975; Aplin & Macquaker 2011). Organic flocculation
(pelletization) involves processes where zooplankton ingests small clayey particles and
excretes them as loose organically bound faecal pellets at the sediment-water interface
(Macquaker & Bohacs 2007). These biologically reworked organic aggregates and their
inorganic counterparts are termed “marine snow” by Silver et al., (1978); Lampitt (1985);

PhD Thesis | 2019
69
Alldredge and silver (1998); Stow et al., (1996). These deposited aggregates form muddy
successions in packages (Aplin & Macquaker 2011). Conversely, individual differential
settling of grains is minimal as the rates of settling are not proportional to the dimension
of individual grains (Macquaker & Bohacs 2007). Clay particles can only exhibit
individual differential settling in very low energy aqueous environments, e.g. estuarine
(McIlroy 2004). As energy within the fluid is insufficient to keep the particles in
suspension, coarser particles with wider particle-diameter settle initially before finer-
grained particles. Sediments with grain size of <10μm are mostly deposited as ‘flocs’
while a grain size >10μm may remain as individual grains (Curran et al. 2002; Curran et
al. 2004; Warrick & Milliman 2003). Potter et al., (1980) suggests four different
suspension-settling patterns:
Mud aggregates settling and accumulating in ephemeral flood basins of rivers or
in temporary water bodies (dried up lakes).
Settling of individual particles one at a time in lakes, ocean and seas.
Suspended mud aggregates and pellets flocculated by the action of aquatic
organisms deposited in aquatic environments.
The settling of inorganically flocculated particles.
Recent findings (Macquaker & Bohacs 2007; Macquaker et al. 2007; Macquaker et al.
2010; Schieber 2011a; Talling et al. 2012) have shown that mud accumulation does occur
under higher-energy, wave- and current influenced conditions (e.g. advective traction
currents), as opposed exclusive quiescent suspension settling. Floccules can travel as
bedloads forming current ripples and laminated sediments (Schieber et al. 2007;
Schieber & Bennett 2013). Evidence of migrating ripples, localized erosion and
progressively fine-grained beds supports wave-influenced mud deposition (Macquaker

PhD Thesis | 2019
70
et al. 2010). McCave and Jones (1988) earlier discovered the accumulation of ungraded
mud by the action of turbidity current as fluid mud. As turbulent flow decelerates,
turbulence is dampened and low-density increases resulting in the ‘freezing’ of high-
density, non-turbulent fluid mud (McCave & Jones 1988; Wright & Friedrichs 2006; Plint
et al. 2012; Talling et al. 2012). Thus, mudstones can be deposited under more energetic
conditions than earlier and widely assumed (Macquaker & Bohacs 2007).
Mud depositional environments
2.4.1 Shallow marine (muddy coastlines, continental shelves and slopes)
Shallow marine environments exist in pericontinental seas and epicontinental
seas/epeiric seas (Wright & Burchette 1996; Johnson & Baldwin 1996). Pericontinental
seas lie along continental margins, having a classic shoreline-shelf-slope profile while
epicontinental seas are restricted within continental areas with shallow shelf water
depth and could possess a shelf-slope profile in the deeper interior basin (Johnson &
Baldwin 1996). The continental shelf is found in the upper section of the shallow marine
profile exhibiting a gentle gradient of <1°, extending to a water depth of about 200m
(Johnson & Baldwin 1996). With normal marine salinities, continental shelves lie along
passive margins of continents, convergent margins and foreland basins. Shelf muds in
modern times are found in coastal accumulation, inner- to outer-shelf mud belts and
cross-shelf blankets (McCave 1972). Sedimentation patterns and facies distribution on
the shelves are controlled by the nature and origin of sediment supply, relative sea-level
fluctuations or rate of basin subsidence, biological and chemical composition within the
sediment-water interface, prevailing climatic condition and frequency/intensity of
storm-induced currents. (Alexander et al. 1991; Ogston et al. 2000; Friedrichs & Wright
2004; Bridge & Demicco 2008)

PhD Thesis | 2019
71
Shelves may be tide-dominated, wave-dominated, storm-dominated or ocean current-
dominated (Bridge & Demicco 2008). Tide-dominated shelves make up about 17% of the
world’s shelf seas (Johnson & Baldwin 1996). They are found in epicontinental seas (e.g.
the North Sea), swept daily by sea tides and are characterised by constant seabed erosion
and transport. Mud accumulates in ‘mud zones’ at the turnover of tidal currents when
current velocity and wave activity are relatively low (Johnson & Baldwin 1996). Seasonal
fluctuations in wave and current intensities are the dominant actions in wave-dominated
(low-energy/low-frequency wave storm climates) and storm-dominated (high-
energy/high-frequency wave storm climates) shelves. They make up about 80% of the
world’s shelf seas found mostly in partially enclosed basins (Johnson & Baldwin 1996).
Ocean current-dominated shelves are persistently swept by unidirectional currents
generated in ocean basins, typical of a narrow pericontinental sea. About 3% of the
world’s continental shelves are ocean current dominated (Johnson & Baldwin 1996).
Mud sediments suspended in the fluid or nepheloid layers (near-bed or near-surface
concentrations) gets deposited either in areas of low energy conditions (mud zone)
within the continental shelf or across shelf regions into deeper water areas (Johnson &
Baldwin 1996; Bridge & Demicco 2008). Sediments are derived from either extrabasinal
sources (onshore), lateral offshore delivery, upward from bottom resuspension or
downward (near-surface organic layer) delivery (Johnson & Baldwin 1996). The mid-
shelf region tends to accommodate a greater percentage of the mud deposits (Nittrouer
& Sternberg 1981; McCave 1972). During periods of greater sediment supply, fine-
grained sediments supplied by onshore rivers spread across the shelf creating thick
muddy shelf successions (Swift & Thorne 1991); often characterised by variable
bioturbation (e.g. Amazon shelf).

PhD Thesis | 2019
72
2.4.2 Deep marine basins
Three main environments of deep marine mud deposition have been identified – basin
floor, submarine fans (inner-, mid- and outer-fan) and slope aprons (Bridge & Demicco
2008). Muds found along slopes occur in mud-filled channels transported via dense fluid
muds, highly turbid flows from rivers and remobilised surface sediments from wave
action (e.g. Wright & Friedrichs 2006; Talling et al. 2012). Sediments that bypass the slope
accumulate on the basin floor (Aplin & Macquaker 2011).
Figure 2.1: Deep sea sedimentary processes for fine-grained sediments modified after Stow et al. (1996)
The complexity in the deposits of the deep marine is influenced by ocean currents
(surface and bottom) and gravity-driven flows (Bridge & Demicco 2008). Gravity flows
include turbidity currents, fluidized sediment flows, grain flows and cohesive debris
flows (Talling et al. 2012) (Figure 2.1). These particles deposited in the basin floor results
from three processes:

PhD Thesis | 2019
73
Pelagic and hemipelagic settling: This result from biogenic materials produced
in the open seas settling on to the basin floor. Pelagic sediments have >75% of
biogenic components mixed with other constituents from dilute plumes of
terrigenous clay particles, volcanic ash and wind-blown aeolian dust. It is termed
hemipelagic when these non-biogenic components are greater than 25% (Stow et
al. 1996).
Semi-permanent bottom currents: This process involves the reworking of
sediments on the basin floor or slope edge by deep ocean bottom currents (e.g.
Macquaker & Bohacs 2007).
Sediment gravity (density) flow processes: Processes where sediments are
transported from shallower depths by turbidity currents and subaqueous slides
(Baas & Best 2002; Basilone 2017).
2.4.3 Lacustrine
Lakes are relatively low energy environments, favourable for mud suspension and
settling. Sedimentation patterns in lakes reflect lake water properties (density,
temperature, salinity, sediment concentration and water chemistry), shoreline
fluctuations and relative abundance of detrital/biogenic sediments (Talbot & Allen 1996;
Cohen 2003; Bridge & Demicco 2008). However, currents are responsible for sediment
circulation (Talbot & Allen 1996). They can be wind-driven, river inflows (deltas), littoral
warming or cooling and hydrographic slope currents from rivers (Talbot & Allen 1996).
Lake water can exhibit stratification, mainly seasonal/thermal stratification observed in
temperate lakes that occurs due to variation in temperature or salinity relative to
seasonal changes

PhD Thesis | 2019
74
(Talbot & Allen 1996; Cohen 2003). In tropical lakes, stratification is a function of
prevailing wind patterns rather than temperature (Beadle 1981). Therefore, these
stratified layers reflect regions of overflows, interflows and underflow, which are
indicative of prevailing currents –surface currents, undercurrents and turbidity currents
respectively. Sediments are mostly fine-grained, rich in siliciclastics, carbonates, siliceous
deposits, iron-rich deposits, saline minerals (gypsum) and organic matter (Talbot & Allen
1996). Organic matter concentration in lacustrine sediments is mostly above average in
comparison with other sedimentary rocks; at approximately 1-5% and up to 40-50% in
exceptional circumstances (Talbot & Allen 1996). Based on the organic matter
productivity, lakes are classified into – oligotrophic and eutrophic lakes, the former
reflecting limited organic productivity (Cohen 2003). ”Oil shale”, a kerogen-rich
laminated mudstone remains an important lacustrine fine-grained deposit due to its
economical usage (Bridge & Demicco 2008).
2.4.4 Alluvial plains
Much of fine-grained deposits in river-dominated environments occur as overbank
deposits (flood plains and levees) (Bennett & Simon 2004). Some mud aggregates
transported as bedload can occur within channels or on distal terminal fans – point bars
of low energy streams (Ekes 1993). Other regions of mud accumulation are in abandoned
channels and extensive lakes in flood plains. Actions of debris flow, bedload, suspended
load and wind-blown processes deposit mud particles (Collinson 1996).
Debris flow: high-density cohesive sediment-water mixture. Debris flows may lose their
plasticity with increases in water concentration, thus, entraining sediments in suspension
(e.g. Talling et al. 2012).

PhD Thesis | 2019
75
Bedload: clay-rich vertisols eroded as sand-sized aggregates in bed loads or fine-
grained aggregates transported by advective traction currents (e.g. Schieber et al.
2007; Schieber 2011a).
Suspended particles: Suspended fine-grained particles and aggregates in
turbulent fluid, deposited at the end of the river course (lakes and seas) or along
channels in overbank areas and fan surfaces (e.g. Baas et al. 2009).
Wind-blown: Mud-rich loess deposited by wind-blown dust from dried up
riverbeds and alluvial plains. Preserved sediments are seldom due to sediment
reworking by subsequent river flow (Collinson 1996).
Diagenesis
Diagenesis in mudstones begins with sediment compaction and reduction in pore volume
(Bjørlykke 1998; Milliken & Day-Stirrat 2013). Diagenetic processes create
physicochemical and mineralogical changes that modify the features of sediment after
deposition (Milliken 2003). Diagenesis can be early (shallow burial) or late (deep burial)
diagenesis, classified as ‘eogenesis’ and ‘mesogenesis’ respectively by Choquette and Pray
(1970). A third member – ‘telogenesis’ is included that occurs during tectonic uplift and
exhumation.
Soft mud, prior compaction, can have initial porosities of up to 50% (Bjørlykke 1999;
Boggs Jr. 2006; Bridge & Demicco 2008). Mechanical compaction and dewatering, over
the first kilometre of burial, characterize early diagenetic processes (Aplin & Macquaker
2011). Early diagenetic processes in mudstones are accelerated in comparison to
sandstones (Milliken & Day-Stirrat 2013). Depending on compositional variations,
mineralogical changes after deposition occur through the precipitation of new minerals
forming early diagenetic cements and concretions (Curtis & Coleman 1986; Huggett

PhD Thesis | 2019
76
1994; Scholle & Ulmer-Scholle 2003; Peltonen et al. 2008; Taylor & Macquaker 2014).
Early diagenetic minerals include: iron sulphides (Rickard 1997; Raiswell & Canfield
1998; Taylor & Macquaker 2000; Macquaker et al. 2014), kaolinite (Bjørlykke 1998;
Taylor & Macquaker 2000; Peltonen et al. 2008), transformed amorphous silica (Opal A
to Opal CT) (Michalopoulos & Aller 2004; Behl 2011a) and carbonates (Milliken & Day-
Stirrat 2013). Lithostatic pressure builds as burial increases generating physical (e.g.
grain reorientation) and chemical changes (e.g. increase in pore water salinity)
(Bjørlykke 1998).
The late phase of diagenesis involves further mineralogical changes. As minerals attain a
chemical equilibrium within geochemical environments of sediment burial, diagenetic
events are dominated by mineral transformation, dissolution-reprecipitation processes
and direct mineral precipitation (Burley 1993). Precipitation and grain dissolution of
minerals which were relatively stable at surface conditions are altered partially or
completely replaced by more stable minerals (Nichols 2009). Various minerals behave
differently in response to increased temperature with depth. Hydrous minerals lose
water molecules to form denser, more stable minerals, silicate minerals dissolve at point
contacts, and carbonate minerals undergo precipitation except in cases where an
increase in pore water acidity (reduced pH) dissolves the carbonates (Peltonen et al.
2008).
Summarily, diagenetic actions/reactions in mudstones involve:
Compaction: Reduction in pore spaces and volume, flattening of soft grains or bending
in response to pressure, increased grain-grain contact and suturing (Nichols 2009;
Mondol et al. 2007).

PhD Thesis | 2019
77
Cementation/dissolution: Variable cementation occurring as concretions and in pores
spaces in mud deposits include but not limited to carbonate cementation and/or
dissolution, biogenic silica recrystallization and sulphide cementation (Curtis & Coleman
1986; Huggett 1994; Macquaker et al. 1997; Taylor et al. 2000; Taylor et al. 2002; Taylor
& Macquaker 2000).
Mineral recrystallization/replacement and clay mineral authigenesis: During
diagenesis, there are variable scales of mineral recrystallization or replacement that are
reflections of changes in pore water chemistry, subsurface temperature and deep burial
(Shaw & Primmer 1991; Hillier 1993; Taylor & Macquaker 2014). Unstable minerals
change their mineralogy to more stable phases but retain their shapes. Feldspars are
replaced by clay minerals, amorphous opaline silica transforms to microcrystalline
quartz (Bjørlykke & Egeberg 1993; Spinelli et al. 2007; Behl 2011a), aragonite to calcite
(Bjørlykke 2015b), calcic-plagioclase replaced by sodic-plagioclase (albitization),
smectite – illite – chlorite transformations, and kaolinite – illite/chlorite transformation
(Bjørlykke 1998; Thyberg & Jahren 2011). Clay mineral transformations occur at
temperatures in excess of 70⁰C (Einsele 2000).
Organic matter transformation: Mudstones serve as carbon sinks and are mostly rich
in organic matter. Bacterial metabolism of organic matter in sediments control carboxylic
reactions (equations below; Curtis et al. 1977; Curtis et al. 1986) associated with early
diagenetic events At surface conditions, organic matter is subject to bacterial oxidation
via oxygen diffusion (released oxygen from eogenesis) (Nichols 2009).
𝐶𝐻2𝑂 + 𝑂2 → 𝐻+ + 𝐻𝐶𝑂3− Oxic/aerobic OM decomposition
𝐶𝐻2𝑂 + 2𝑀𝑛𝑂2 + 𝐻2𝑂 → 2𝑀𝑛2+ + 3𝑂𝐻− + 𝐻𝐶𝑂3
− Manganese reduction

PhD Thesis | 2019
78
𝐶𝐻2𝑂 + 2𝐹𝑒𝑂3 + 3𝐻2𝑂 → 2𝐹𝑒2+ + 7𝑂𝐻− + 𝐻𝐶𝑂3
− Iron reduction
2𝐶𝐻2𝑂 + 𝑆𝑂42− → 𝐻𝑆− + 2𝐻𝐶𝑂3
− + 𝐻+ Bacterial sulphate reduction
2𝐶𝐻2𝑂 + 𝐻2𝑂 → 𝐶𝐻4+ + 𝐻+ + 𝐻𝐶𝑂3
− Microbial methanogenesis
Organic matter may be oil or gas prone hence under suitable temperature and pressure
conditions may yield liquid and/or gas hydrocarbon (Boyer et al. 2006) (Figure 2.2).
When sediments are deeply buried, anoxic/anaerobic conditions prevail with high
temperatures favourable for organic matter transformation. The rate of production,
dilution, and destruction controls the accumulation and concentration of organic matter
in the marine environment (Bohacs & Fraticelli 2008). Preservation is enhanced where
the rates of clastic or biogenic matter dilution are low and organic matter production is
optimized relative to a reduced destruction rate. Different layers occur, which differ
entirely from a more exclusive continental setting generating peat and coal as products
of organic matter transformation. These layers though complex may include:
Upper few centimetres characterized by bioturbation and diffusion
A sulphate reduction zone within 10m below the surface level (Nichols 2009)
where sulphate ions are reduced to sulphide ions by bacterial sulphate reeduction
At depth greater than 10m bacterial fermentation takes place with the breaking
down of organic matter to biogenic methane and carbon dioxide (Nichols 2009).
With an increase in temperature, catagenesis ensues, leaving behind insoluble
organic matter (kerogen) that gets transformed into oil and gas (hydrocarbons)
(Figure 2.2) (Boyer et al. 2006)
Mesogenetic stage of organic matter is termed catagenesis, occurring at depths
between 1km – 4km and temperatures between 40⁰C - 150⁰C (Tissot & Welte

PhD Thesis | 2019
79
1978; Boyer et al. 2006), where petroleum is the product of kerogen
transformation (Figure 2.2).
Figure 2.2: General scheme of kerogen types and thermal evolution of kerogen presented on a modified Van Krevelen’s diagram (Tissot & Welte 1978). Changes to kerogen is brought about by increased heat during burial (Boyer et al. 2006) and characterised by the generation of non-hydrocarbon gases (CO2 & H2O), oil, wet gas and dry gas. Type I kerogen: generated from lacustrine environments; Type II kerogen: typically from marine environments with reducing conditions; Type III kerogen: Derived primarily from terrestrial plant debris; Type IV kerogen: “dead carbon” derived from older sediments redeposited after erosion
Mudstone facies characterisation
Fine-grained sediments vary in a range of occurrences; from predominantly carbonate-
rich to siliciclastic-rich sediments. Owing to the economic importance and complexity in
fine-grained sedimentary rocks, various studies since the late nineteenth century have
PhD Thesis | 2019
80
presented terminologies and different classification models defined by texture, grain size,
mineralogical composition, colour, bedding, primary/diagenetic structure, fossil content
and fissility (Udden 1898; Wentworth 1922; Ingram 1953; Shepard 1954; Dunbar &
Rogers 1957; Folk 1968; Weser 1974; Pettijohn 1975; Blatt et al. 1980; Lundegard &
Samuels 1980; Potter et al. 1980; Stow 1981; Dean et al. 1985; Quine & Bosence 1991;
Flemming 2000; Macquaker & Adams 2003; Macquaker et al. 2007; Milliken 2014; Lazar
et al. 2010; Lazar et al. 2015). Classification models aim to provide generally acceptable
and readily applicable terminologies for use in facies description and analysis. It is of
utmost importance to assign facies to fine-grained sediments as they aid analyses in basin
reconstruction, depositional environments, diagenetic controls and a facile integration
into basin-scale facies model (Macquaker & Adams 2003; Milliken 2014). Due to complex
inherent compositional heterogeneity and grain size distribution, classification models
vary slightly relative to class boundaries. Lazar et al. (2015) in view of this, conclusively
indicated that “there is currently no naming scheme that captures the inherent
heterogeneity of this rock (mudstones)”. Hence, a particular model may not be
conveniently applicable in every instance. Structure, texture, mineralogical and fossil
composition, depositional environment and degree of metamorphism are basic modifiers
employed in fine-grained facies analysis (Flemming 2000; Macquaker & Adams 2003;
Milliken 2014; Lazar et al. 2015). Efficient descriptions are frequently given from
interpretations made from field observation, hand specimen description and laboratory
analysis.
Basic textural classification of clastic sediments largely employs a sand-silt-clay
percentage end member system on ternary plots (Shepard 1954; Folk 1968; Flemming
2000; Macquaker & Adams 2003). These textural terminologies (Table 2) with
descriptive modifiers are employed in defining fine-grained sedimentary facies (Dean et

PhD Thesis | 2019
81
al. 1985; Macquaker & Adams 2003; Macquaker et al. 2007; Milliken 2014; Lazar et al.
2015). Stow (1981), by modifying analyses from earlier authors (Wentworth 1922;
Ingram 1953; Dunbar & Rogers 1957; Folk 1968; Weser 1974; Pettijohn 1975; Blatt et al.
1980), grouped fine-grained sediments based on relative dominance in mineralogical
composition, grain size distribution and fissility. From Stow’s (1981) and Lazar et al.
(2015) descriptions, the terms mud and mudstone represent terminologies for
unlithified and lithified sediments respectively with a mixture of clay and silt fraction as
the dominant grain-size (>50% volume) as seen in the table below.
Basic terms
Unlithified Lithified/non-
fissile
Lithified/fissile Root Term
Silt Siltstone Silt-shale [>2/3 silt-sized (4-63 m)] Coarse mudstone
Mud Mudstone Mud-shale [silt and clay mixture
(<63m)]
Medium mudstone
Clay Claystone Clay-shale [>2/3 clay-sized (<4m)] Fine mudstone
Metamorphic terms
Name Texture Grain size
Argillite Slightly metamorphosed/non-fissile Silt and clay mixture
Slate Metamorphosed/fissile Silt and clay mixture
Textural Terms
Textural descriptors Approximate grain-proportions

PhD Thesis | 2019
82
Silty >10% silt-size
Muddy >10% silt- and/or clay-size (applied to non-
mudstone sediments)
Clayey >10% clay size
Sandy. Pebbly, etc. >10% sand-size, pebble-size etc.
Compositional descriptors Approximate grain-proportions
Calcareous >10% CaCO3 (skeletal, nannofossil, etc.)
Siliceous >10% SiO2 (mostly biogenic quartz e.g. radiolarian)
Carbonaceous >1% organic carbon
Pyritiferous, ferruginous, micaceous
etc.
Commonly used for contents greater than about 1-
5%
Table 2: "Mudstone" terminologies taken from Stow (1981) and Lazar et al. (2015).
Dean et al. (1985) later classified facies solely on compositional variability with relative
biogenic and non-biogenic (terrigenous/volcanogenic) components. Like many authors
(e.g. Lazar et al. 2015), sediment component (grain size) with the highest percentage
(>50%) form the root-name with other constituents as modifiers (e.g. Table 3 and Figure
2.3).
>50% composition (Root Term)
Biogenic - Calcareous and Siliceous (induration) Non-Biogenic
Ooze (soft) Clay
(unlithified)
Chalk – Diatomite or
Radiolarite
(firm) Silt

PhD Thesis | 2019
83
Sand
Limestone
(hard)
Claystone
(lithified) Porcellanite
Siltstone
Chert Sandstone
25% - 50% (Major modifier) 10% - 25% (minor modifier)
Biogenic Non-biogenic
Biogenic
(calcareous and
siliceous)
Non-
biogenic
Calcareous Siliceous
Nannofossil-,
foraminiferan-
Diatom-,
radiolarian-
-Clayey
-Silty
-Sandy
“-bearing” (e.g.
diatom-bearing)
“-bearing”
(e.g. silt-
bearing)
Table 3: Facies terminologies as given by Dean et al. (1985)
A third classification model reviewed in this chapter is the Macquaker and Adams (2003)
classification. In characterizing mudstones, suffixes indicating the percentage
composition of relatively abundant sediment present is attached in their classification.
Terms including “–dominated”, “–rich” and “–bearing” are added for mudstones
containing >90%, 50-90% and 10-50% respectively of any of the three component
materials (clay, silt, sand). Typical illustrations for this classification are: “silt-rich
mudstone”, “sand-dominated, silt-bearing mudstone”, “clay-bearing, silt-rich mudstone”.
This classification scheme is further modified by adding a prefix of sedimentary
structures and/or textures present in rock samples, for example: “cross-bedded clay-
bearing, silt-rich mudstone”, “bioturbated silt-bearing mudstone”. With this scheme, a
typical “shale” will be described as a “silt-bearing, clay-rich mudstone”, while “chalk”; a
“calcareous, nanoplankton-dominated mudstone”, a “marl”; “carbonate-cement and silt-
bearing clay-rich mudstone”, and a typical “calcite concretion”; a “calcite cement-
dominated mudstone.

PhD Thesis | 2019
84
Without discriminating between biogenic components, Milliken (2014) recommended
different terminologies using the same three component system as Dean et al. (1985).
Milliken’s (2014) classification model replaced the root term “mudstone” with
“argillaceous”. Thus, mudstone with >75% extrabasinal/non-biogenic derivations is
termed “terrigenous argillaceous (Tarl)” or, if composed of a significant amount of
volcanogenic input it is referred to as “volcanogenic argillaceous (Varl). Mudstone with
<75% extrabasinal components having calcareous biogenic derivations over biosiliceous
component are designated “calcareous argillaceous (Carl), and “siliceous argillaceous
(Sarl)” if the biogenic siliceous components is more. However, if for both “carls” and
“sarls”, the extrabasinal component is within the range of 50-75%, the term “argillaceous”
is used. In cases where the extrabasinal constituent is <10%, limestone terminologies of
Folk (1968) and Dunham (1962) are used for carbonate-rich sediments, and the siliceous
terms of Dean et al. (1985) are given for siliceous-rich sediments.
Figure 2.3: Diagrammatic illustration on a ternary plot of an example of the complete three-component classification using clay, diatoms, and nannofossils as the three end members, from Dean et al. (1985)

PhD Thesis | 2019
85
Figure 2.4: Ternary plot illustrating sand, silt, and clay end members of mudstones dominated by detrital components, from Macquaker and Adams (2003)
Figure 2.5: Compositional classification for fine-grained sediments and sedimentary rocks as proposed by Milliken (2014)
In establishing grain-size class boundaries exclusively for mud and mudstone, Lazar et al.
(2015) suggested three end members.

PhD Thesis | 2019
86
Fine mud (clay and very fine silt); <8 µm grain size
Medium mud (fine and medium silt); 8 – 32 µm grain size
Coarse mud (coarse silt); 32 – 62.5µm
These end members form root names for an integrated descriptive three-component
classification scheme. This classification scheme highlights texture, bedding and
composition of rock type. Bedding and distinctive composition form the primary
modifiers while secondary modifiers include: the degree of bioturbation, type and
abundance of fossils, physical sedimentary structures, diagenetic components and colour.
In order to make provision for grain sizes >62.5 µm in a ternary plot, a sand component
is added, hence an adjustment of the “medium mud” to fit at a mid-point between fine and
coarse mud (see Figure 2.6)
Figure 2.6: Nomenclature guidelines for fine-grained sedimentary rocks: texture (grain size), Lazar et al. (2015)

PhD Thesis | 2019
87
Bedding classification defines the geometry and continuity of laminae, laminasets, beds
and bedsets visible either in hand specimen or under digital scans of thin sections (Lazar
et al. 2015). Definitive terms include: “continuous planar parallel”, “discontinuous planar
parallel”, “continuous wavy parallel”, “discontinuous wavy parallel”, “continuous curved
parallel”, “discontinuous curved parallel”. When the geometry of laminae or bed between
bounding surfaces are not parallel, the suffix “-nonparallel” is attached in place of parallel.
To incorporate the compositional modifier, a ternary plot (Figure 2.7) is generated. The
end members being the major mudstone mineralogical compositions: clay mineral,
quartz and carbonates.
With this review of the above classification models, it is important that any facies
classification scheme to be used is carefully examined to ensure strict adherence to
outlined objectives of ones proposed research scope. Therefore, in the progression of this
research more descriptive terminologies shall be employed in facies analysis depending
on obvious distinguishable characteristics of the formations under investigation.
Figure 2.7: Nomenclature guidelines for fine-grained sedimentary rocks: composition, Lazar et al. (2015)

PhD Thesis | 2019
88
Mudstones: self-sourcing hydrocarbon reservoirs
In hydrocarbon prospecting, mudstones rich in organic matter serve as hydrocarbon
source rocks for petroleum systems, while their high capillary entry pressure and low
permeability make them efficient seals and flow barriers or baffles in the petroleum
system (Boyer et al. 2006; Aplin & Macquaker 2011). As organic matter in source rocks
mature under high temperature and pressure conditions, oil and gas molecules in tight
connected pore spaces migrate (primary migration) to more porous adjacent rocks
(reservoirs). These migrated hydrocarbons accumulate and are stored in reservoirs so
long as the reservoir rock is sealed in all directions by impervious layers/barriers.
Hydrocarbon production from such situations termed ‘conventional’ has since been the
norm in the petroleum industries for decades.
Organic-rich source rocks after primary migration may yet contain residual oil and gas
stored interstitially as free molecules or adsorbed to the surface of organic components
(Boyer et al. 2006; Jarvie 2012a). In recent years, the dynamics in the industry has
advanced, spurring a new paradigm shift in hydrocarbon technology. The properties of
mudstones have been artificially enhanced by inducing hydrofractures resulting in the
production of the adsorbed oil and/or gas retained in the rocks (Montgomery et al. 2005;
Aplin & Macquaker 2011; Jarvie 2012a; Han et al. 2015; Soeder 2018; Passey et al. 2010).
Organic-rich mudstones/shales in proven locations like in North America not only serve
as source rocks but also recognised as reservoirs of hydrocarbon(USEIA 2013). They are
considered ‘unconventional plays’ (examples: tight shale, hybrid shale and fractured
shale). The Eagle Ford Shale, Barnett Shale, Bakken Shale, Marcellus Shale and the
Niobrara Formation are examples of US “unconventional” resource systems (Jarvie
2012a; Stephenson 2015; Soeder 2017). Economic hydrocarbon production from shale
PhD Thesis | 2019
89
reservoirs uses greater amounts of energy than its conventional counterpart uses, and
thus, requires improved predictive capability and enhanced recovery rates.
Another form of extraction technique though relatively uneconomical requires the
laboratory/subsurface retorting of immature source rocks to produce hydrocarbon
locked up within kerogen (Andrews 2014).
Source rocks rich in organic matter and viable for shale gas play are characterised by
certain conditions (Boyer et al. 2006; Charpentier & Cook 2011; Jarvie 2012a):
The type and amount of organic matter present, preferably type II organic matter
(Hydrogen index: 250 – 800 mg/g) with organic richness >1.00 wt. % present-day
TOC
The presence of significant rigid grains that might enhance brittleness. E.g.
significant silica content >30% with carbonate, and absence of non-swelling clays
State of thermal maturity, mostly in the gas window (>1.4% Ro)
Timing in relation to all other petroleum system elements
Adequate porosity between 4 to 7%
Laterally extensive and highly overpressured
Among these qualities, the understanding of lithofacies variations, existing pore spaces
and mudstone diagenesis has significant implication on reservoir properties and
completion technology of shale plays.
2.7.1 Mudstone porosity and permeability
Measuring porosity and permeability of mudstones conventionally from cores in
laboratories as with sandstones and carbonates is rather complicated owing to the small
grain sizes and micro- and nano-scale pore throats of shales (Bowker 2007). Except for

PhD Thesis | 2019
90
borehole coring, retrieval of homogenous samples from shale formations in boreholes
has been relatively arduous (Slatt et al. 2012). The use of Scanning Electron Microscope
techniques and Field Emission-Scanning Electron Microscope (FE-SEM) are the best ways
of describing pore networks in shales (Harrington & Horseman 1999; O’Brien & Slatt
1990). X-ray CT scans become useful in visualizing pore distribution and
interconnectivity. Pores vary widely in origin, shape and size and result from both
depositional and diagenetic processes, showing multiple phase-origins from deposition,
compaction, cementation and dissolution (Loucks et al. 2012).
Loucks at al. (2012) produced a simple pore classification system for mudstones. The
classification encompasses earlier descriptive/interpretive nomenclatures (e.g. Slatt &
O’Brien 2011a). Pore sizes in mudstones are nanometre (nm) to micrometre (µm) in scale
and occur mostly in the form of matrix pores and fracture pores.
Mineral matrix pores: primary inter-particle pores and intra-particle pores
Organic matter pores (organo-pores): diagenetic intra-particle pores created by
the decomposition of organic matter.
Fracture pores: linear, micro-fractures from deep diagenetic processes
crosscutting bedding planes.
Inter-particle pores commonly exist between clay and matrix mineral particles or
between ductile clay and rigid particles as inter-platelet or inter-granular pores (Loucks
et al. 2012). Inter-crystalline pores occur between crystals. The pore shapes range from
elongate to round to angular (Milliken & Reed 2010) and are abundant in slightly
compacted young shallow sediments. Triangular and linear-shaped pores seen in cross-
sections are products of compaction and diagenesis (Loucks et al. 2012). Inter-particle
pores tend to exhibit greater chance of interconnectivity than all other pore types (Loucks
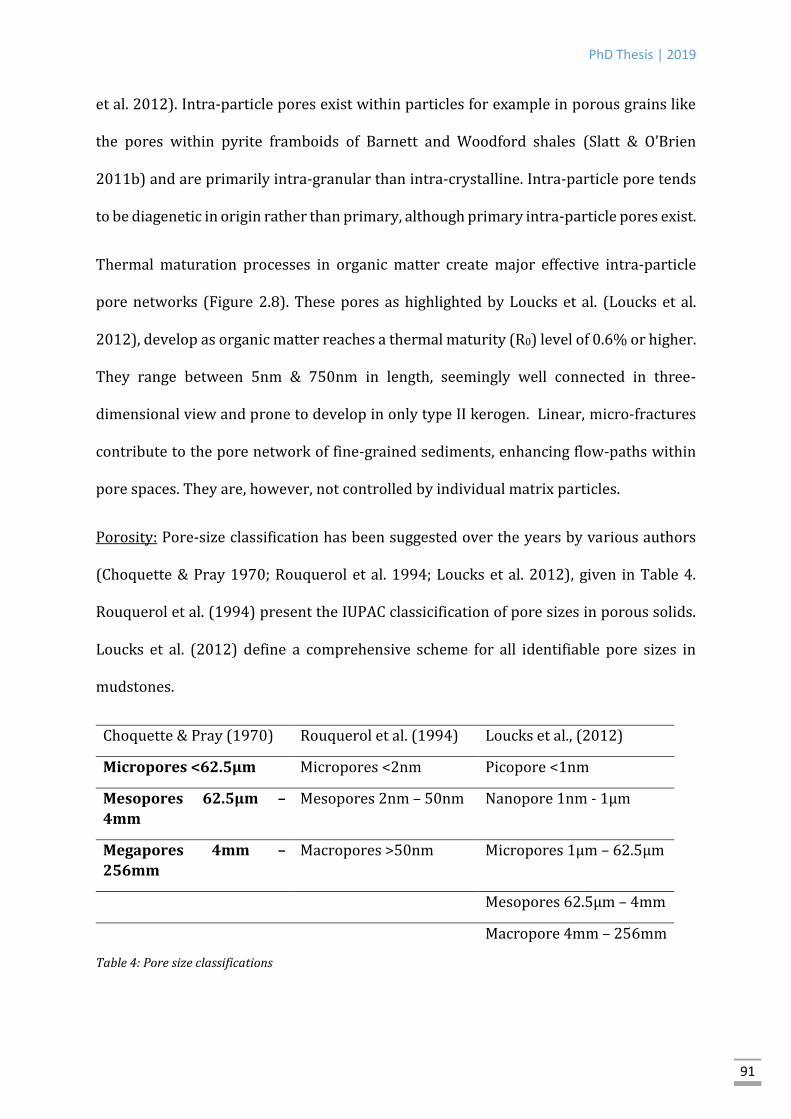
PhD Thesis | 2019
91
et al. 2012). Intra-particle pores exist within particles for example in porous grains like
the pores within pyrite framboids of Barnett and Woodford shales (Slatt & O’Brien
2011b) and are primarily intra-granular than intra-crystalline. Intra-particle pore tends
to be diagenetic in origin rather than primary, although primary intra-particle pores exist.
Thermal maturation processes in organic matter create major effective intra-particle
pore networks (Figure 2.8). These pores as highlighted by Loucks et al. (Loucks et al.
2012), develop as organic matter reaches a thermal maturity (R0) level of 0.6% or higher.
They range between 5nm & 750nm in length, seemingly well connected in three-
dimensional view and prone to develop in only type II kerogen. Linear, micro-fractures
contribute to the pore network of fine-grained sediments, enhancing flow-paths within
pore spaces. They are, however, not controlled by individual matrix particles.
Porosity: Pore-size classification has been suggested over the years by various authors
(Choquette & Pray 1970; Rouquerol et al. 1994; Loucks et al. 2012), given in Table 4.
Rouquerol et al. (1994) present the IUPAC classicification of pore sizes in porous solids.
Loucks et al. (2012) define a comprehensive scheme for all identifiable pore sizes in
mudstones.
Choquette & Pray (1970) Rouquerol et al. (1994) Loucks et al., (2012)
Micropores <62.5µm Micropores <2nm Picopore <1nm
Mesopores 62.5µm –
4mm
Mesopores 2nm – 50nm Nanopore 1nm - 1µm
Megapores 4mm –
256mm
Macropores >50nm Micropores 1µm – 62.5µm
Mesopores 62.5µm – 4mm
Macropore 4mm – 256mm
Table 4: Pore size classifications

PhD Thesis | 2019
92
Figure 2.8: Summary diagram of the major stages in mudstone burial diagenesis in relation to pore types, after Loucks et al. (2012)

PhD Thesis | 2019
93
Figure 2.9: Schematic representation of pore classification by Loucks et al. (2012)
Permeability: The relative ability of a reservoir to transmit fluid through its
interconnected pore spaces is its permeability. This is,the measure of fluid conductivity
of a rock (Hartmann & Beaumont 1999). Several parameters define permeability:
Pore throat, volume, distribution and pore geometry
Water saturation
Lateral continuity, number and position of flow units
Reservoir pressure and drive mechanism
Organic-rich shales reportedly have oil adsorbed in the organic matter, consequently
reducing the free flow of oil (Jarvie 2012b). This contrasts with organic-lean shales (low
TOC) which are more permeable (Jarvie 2012b). Organic-rich shales may possess an

PhD Thesis | 2019
94
appreciable percentage of porosity but permeability is low, hence the need for hydraulic
fracturing, typical of tight shale resource systems, e.g. Barnett Shale. In a system of
interbedded organic-rich and organic-lean (carbonate-rich) shales permeability is higher
(e.g. Bakken Shale).
Conclusion
Mudstones are abundant in the rock record and their complexity in texture and mineral
composition have resulted in a plethora of classifications. The grain assemblage of
mudstones are dominated by <62.5µm carbonate, tectosilicate and phyllosilicate grains
and crystals. They may also contain volcanic debris, biogenic minerals (e.g. phosphates)
and hemipelagic materials. These components are grouped as detrital-derived
(allochthonous) components, in situ productivity-derived (autochthonous) components
and diagenesis-derived components.
The deposition of mudstones occurs across a wide spectrum of depositional
environments from lacustrine environment, alluvial and fluvial channels and plains to
shallow and deep marine settings. These environments are characterised by varied
transport mechanisms and depositional processes. More significantly, recent findings
show that mudstones do not accumulate solely by quiet settling of fine-grained
(<62.5µm) particles. Together with the settling of hemipelagic aggregates (“flocs”,
“floccules” or “marine snow”), fine-grained sediments can be transported and deposition
in turbulent environmental conditions.
Mudstones experience complex post-depositional effects from compaction, grain
replacement, cementation and fracturing. The controls on diagenetic alteration of
minerals in mudstones and their effects on texture and mechanical properties are still
being investigated. Precipitation and alteration of minerals begin either in water-column

PhD Thesis | 2019
95
or at sediment-water interface termed early diagenesis, and during sediment burial,
classified as late diagenesis. Understanding these diagenetic processes have strong
implications in characterising facies and controls on large scale spatial (facies
architecture) and temporal variability.
Due to their richness in organic matter and low permeability, mudstones can serve as
hydrocarbon source and seal rocks. Provided adequate conditions are met in the nature
and content organic carbon and thermal maturity, organic-rich mudstone yield oil and
gas which are mostly stored in juxtaposed more porous and permeable rocks
(reservoirs). However, not all produced oil and/or gas in the source rocks migrate to
storage in reservoir rocks. Some hydrocarbons remain as free or adsorbed molecules
between submicron-scale pores of mudstones. Such pores occur between and within
constituent grains termed interparticle and intraparticle pores respectively. Most pores
are also contained in and around organic matter particle, commonly referred to as
organo-pores. Recently, the residual hydrocarbon deposits stored in mudstones have
been economically exploited for energy needs. This makes mudstones act as self-sourcing
hydrocarbon plays which are being explored across the globe.
References
2.9 References
Alexander, C.R., DeMaster, D.J. & Nittrouer, C.A., 1991. Sediment accumulation in a modern epicontinental-shelf setting: The Yellow Sea. Marine Geology, 98(1), pp.51–72.
Alldredge, A.L. & Silver, M.W., 1998. Characteristics, dynamics and significance of marine snow. Prog. Oceanography, 20, pp.41–82.
Andrews, I.J., 2014. The Jurassic shales of the Weald Basin: geology and shale oil and shale gas resource estimation. British Geological Survey for Department of Energy and Climate Change, London, UK.
Aplin, A.C., Fleet, A.J. & Macquaker, J.H.S., 1999. Muds and mudstones: physical and fluid-flow properties. Geological Society, London, Special Publications, 158, pp.1–8.

PhD Thesis | 2019
96
Aplin, A.C. & Macquaker, J.H.S., 2011. Mudstone diversity: Origin and implications for source, seal, and reservoir properties in petroleum systems. AAPG Bulletin, 95, pp.15–34.
Baas, J.H. et al., 2009. A Phase Diagram for Turbulent, Transitional, and Laminar Clay Suspension Flows. Journal of Sedimentary Research, 79(4), pp.162–183.
Basilone, L., 2017. Seismogenic rotational slumps and translational glides in pelagic deep-water carbonates. Upper Tithonian-Berriasian of Southern Tethyan margin (W Sicily, Italy). Sedimentary Geology, 356, pp.1–14.
Beadle, L.C., 1981. The Inland Waters of Tropical Africa, 2nd edition 2nd ed., Longman, London.
Behl, R.J., 2011. Chert spheroids of the Monterey Formation, California (USA): Early-diagenetic structures of bedded siliceous deposits. Sedimentology.
Bennett, S.J. & Simon, A., 2004. Riparian vegetation and fluvial geomorphology, American Geophysical Union.
Bjørlykke, K., 1998. Clay Mineral Diagenesis in Sedimentary Basins — A Key to the Prediction of Rock Properties. Examples from the North Sea Basin. Clay Minerals, 33(1), pp.15–34.
Bjørlykke, K., 2015. Petroleum geoscience: From sedimentary environments to rock physics, second edition,
Bjørlykke, K., 1999. Principal aspects of compaction and fluid flow in mudstones. Geological Society, London, Special Publications, 158(1), pp.73–78.
Bjørlykke, K. & Egeberg, P.K., 1993. Quartz cementation in sedimentary basins. American Association of Petroleum Geologists Bulletin, 77(9), pp.1538–1548.
Blatt, H., 1982. Sedimentary Petrology, Freeman, New York.
Blatt, H., Middleton, G. V. & Murray, R.C., 1980. Origin of sedimentary rocks. Englewood Cliffs, New Jersey, Prentice-Hall, xvii, p.782.
Boggs Jr., S., 2006. Principles of Sedimentology and Stratigraphy 4th ed., New Jersey: Prentice Hall.
Bohacs, K.M. & Fraticelli, C., 2008. Paleo-environmental reconstruction and analysis (paleogeography, paleoclimate, plaeo-oceanography, paleobiology) as part of integrated source rock prediction. International Petroleum Conference, IPTC, 2, pp.1130–1139.
Bowker, K.A., 2007. Barnett shale gas production, Fort Worth Basin: Issues and discussion. AAPG Bulletin, 91, pp.523–533.
Boyer, C. et al., 2006. Producing Gas from Its Source. Oifield review, Autumn 200.
Bridge, J.S. & Demicco, R. V., 2008. Earth surface processes, landforms and sediment deposits, Cambridge, UK ; New York: Cambridge University Press.

PhD Thesis | 2019
97
Burley, S.D., 1993. Models of burial diagenesis for deep exploration plays in Jurassic fault traps of the Central and Northern North Sea J. R. Parker, ed. From Petroleum Geology of Northwest Europe: Proceedings of the 4th Conference, pp.1353–1375.
Charpentier, R.R. & Cook, T.A., 2011. USGS Methodology for Assessing Continuous Petroleum Resources. U. S. G. Survey, ed., U.S. Geological Survey Open-File Report.
Choquette, P.W. & Pray, L.C., 1970. Geologic nomenclature and classification of porosity in sedimentary carbonates. America Association. Petroleum Geologists Bulletin, 54, pp.207–250.
Cohen, A.S., 2003. Paleolimnology: the history and evolution of lake systems, Oxford University Press.
Collinson, J.D., 1996. Alluvial Sediments H. G. Reading, ed. Sedimentary Environments: Processes, Facies and Stratigraphy, 3rd edition, pp.37–82.
Curran, K.J. et al., 2004. Inferring the mass fraction of floc deposited mud: Application to fine-grained turbidites. Sedimentology, 51, pp.927–944.
Curran, K.J., Hill, P.S. & Milligan, T.G., 2002. Fine-grained suspended sediment dynamics in the Eel River flood plume. Continental Shelf Research, 22, pp.2537–2550.
Curtis, C.D., Burns, R.G. & Smith, J. V, 1977. Sedimentary Geochemistry: Environments and Processes Dominated by Involvement of an Aqueous Phase [and Discussion]. Philosophical Transactions of the Royal Society of London A: Mathematical, Physical and Engineering Sciences, 286(1336), pp.353–372.
Curtis, C.D. & Coleman, M.L., 1986. Controls on the precipitation of early diagenetic calcite, dolomite and siderite concretions in complex depositional sequences D. L. Gautier, ed., SEPM Special Publication.
Curtis, C.D., Coleman, M.L. & Love, L.G., 1986. Pore water evolution during sediment burial from isotopic and mineral chemistry of calcite, dolomite and siderite concretions. Geochimica et Cosmochimica Acta, 50(10), pp.2321–2334.
Dean, W.E., Leinen, M. & Stow, D.A. V, 1985. Classification of deep-sea, finegrained sediments. Journal of Sedimentary Petrology, 55, pp.250–256.
Dunbar, C.O. & Rogers, J., 1957. Principles of Stratigraphy, John Wiley & Sons Inc., New York.
Dunham, R.J., 1962. Classification of carbonate rocks according to depositional textures.
Einsele, G., 2000. Sedimentary Basin: Evolution, Facies and Sediment Budget, 2nd edition, Springer.
Ekes, C., 1993. Bedload-transported pedogenic mud aggregates in the Lower Old Red Sandstone in Southwest wales. Geological Society (London), 150, pp.469–472.
Flemming, B.W., 2000. A revised textural classification of gravel-free muddy sediments on the basis of ternary diagrams. Continental Shelf Research, 20(10), p.1125–1137(13).
Folk, R.L., 1968. Petrology of sedimentary rocks, Hemphills, Austin.

PhD Thesis | 2019
98
Friedrichs, C.T. & Wright, L.D., 2004. Gravity-driven sediment transport on the continental shelf: implications for equilibrium profiles near river mouths. Coastal Engineering, 51, pp.795–811.
Garrels, R.M. & Mackenzie, F.T., 1971. Evolution of sedimentary rocks, New York: W. W. Norton.
Gawthorpe, R.L. & Clemmey, H., 1985. Geometry of submarine slides in the Bowland Basin (Dinantian) and their relation to debris flows. Journal of the Geological Society, 142(3), pp.555–565.
Harrington, J.F. & Horseman, S.T., 1999. Gas transport properties of clays and mudrocks. Geological Society, London, Special Publications, 158(1–86239–030–4/99/$15.00), pp.107–124.
Hartmann, D.J. & Beaumont, E.A., 1999. Predicting Reservoir System Quality and Performance E. A. Beaumont & N. H. Forster, eds. AAPG treatise of petroleum geology, exploration for oil and gas traps, ch. 9, p.9.1-9.154.
Hillier, S., 1995. Erosion, sedimentation and sedimentary origin of clays B. Velde, ed., Berlin, Germany: Springer-Verlag.
Hillier, S., 1993. Origin, diagenesis, and mineralogy of chlorite minerals in Devonian lacustrine mudrocks, Orcadian Basin, Scotland. Clays and Clay Minerals, 41, pp.240–259.
Huggett, J.M., 1994. Diagenesis of mudrocks and concretions from the London Clay Formation in the London Basin. Clay Minerals, 29, pp.693–707.
Ingram, R.L., 1953. Fissility of mudrocks. Bulletin of the Geological Society of America, 64(8), pp.869–878.
Jarvie, D.M., 2012a. Shale Resource Systems for Oil and Gas: Part 1—Shale-gas Resource Systems J. A. Breyer, ed. Shale reservoirs—Giant resources for the 21st century, 97, pp.69–87.
Jarvie, D.M., 2012b. Shale Resource Systems for Oil and Gas: Part 2—Shale-oil Resource Systems. in J. A. Breyer, ed., Shale reservoirs—Giant resources for the 21st century: AAPG Memoir, 97, pp.89–119.
Johnson, H.D. & Baldwin, C.T., 1996. Shallow clastic seas H. G. Reading, ed. Sedimentary Environments: Processes, Facies and Stratigraphy, 3rd edition, pp.232–280.
Kineke, G.C. et al., 1996. Fluid-mud processes on the Amazon continental shelf. Continental Shelf Research, 16, pp.667–696.
Kranck, K., 1973. Flocculation of suspended sediment in the sea. Nature, London, 246, pp.348–350.
Kranck, K., 1975. Sediment deposition from flocculated suspensions. Sedimentology, 22, pp.111–123.
Lampitt, R.S., 1985. Evidence for the seasonal deposition of detritus to the deep-sea floor and its subsequent resuspension. Deep-Sea Research, 22(8A), pp.885–897.
PhD Thesis | 2019
99
Lazar, O.R. et al., 2015. Capturing key attributes of fine-grained sedimentary rocks in outcrops, cores, and thin sections; nomenclature and description guidelines. Journal of Sedimentary Research, 85(3), pp.230–246.
Lazar, O.R. et al., 2010. Fine-grained rocks in outcrops: classification and description guidelines J. Schieber, O. R. Lazar, & K. M. Bohacs, eds. Sedimentology and Stratigraphy of Shales: Expressions and Correlation of Depositional Sequences in the Devonian of Tennessee, Kentucky, and Indiana, pp.3–14.
Loucks, R.G. et al., 2012. Spectrum of pore types and networks in mudrocks and a descriptive classification for matrix-related mudrock pores. AAPG Bulletin, 96(6), pp.1071–1098.
Lundegard, P.D. & Samuels, N.D., 1980. Field classification of fine-grained sedimentary rocks. Journal of Sedimentary Petrology, 50, pp.781–786.
Macquaker, J.H.S. et al., 2014. Compositional controls on early diagenetic pathways in fine-grained sedimentary rocks: Implications for predicting unconventional reservoir attributes of mudstones. AAPG Bulletin, 98(3), pp.587–603.
Macquaker, J.H.S. & Adams, A.E., 2003. Maximizing information from fine-grained sedimentary rocks: an inclusive nomenclature for mudstones. Journal of Sedimentary Research, 73, pp.735–744.
Macquaker, J.H.S., Bentley, S.J. & Bohacs, K.M., 2010. Wave-enhanced sediment-gravity flows and mud dispersal across continental shelves: Reappraising sediment transport processes operating in ancient mudstone successions. Geology, 38, pp.947–950.
Macquaker, J.H.S. & Bohacs, K.M., 2007. On the accumulation of mud. Science, 318, pp.1734–1735.
Macquaker, J.H.S., Curtis, C.D. & Coleman, M.L., 1997. The role of iron in mudstone diagenesis: Comparison of Kimmeridge Clay Formation mudstones from onshore and offshore (UKCS) localities. Journal of Sedimentary Research, 67(5), pp.871–878.
Macquaker, J.H.S. & Gawthorpe, R.L., 1993. Mudstone lithofacies in the Kimmeridge Clay Formation, Wessex Basin, southern England; implications for the origin and controls of the distribution of mudstones. Journal of Sedimentary Research, 63(6), pp.1129–1143.
Macquaker, J.H.S., Taylor, K.G. & Gawthorpe, R.L., 2007. High-resolution facies analyses of mudstones: Implication for paleoenvironmental and sequence stratigraphic interpretations of offshore ancient mud-dominated successions. Journal of Sedimentary Research, 77, pp.324–339.
McCave, I.N., 1972. Transport and escape of fine-grained sediment from shelf areas D. J. P. Swift, ed. Shelf Transport: Process and Pattern. Dowden, pp.225–248.
McCave, I.N., 1975. Vertical flux of particles in the ocean. Deep Sea Res, 22, pp.491–502.
McCave, I.N. & Jones, K.P.N., 1988. Deposition of ungraded muds from high-density non-turbulent turbidity currents. Nature, 333, pp.250–252.

PhD Thesis | 2019
100
McIlroy, D., 2004. Ichnology and facies model of a tidedominated delta: Jurassic upper Ror and Ile formations of Kristin field, Halten Terrace, offshore mid-Norway D. McIlroy, ed. The application of ichnology to paleoenvironmental and stratigraphic analysis, 228, pp.237–272.
Michalopoulos, P. & Aller, R.C., 2004. Early diagenesis of biogenic silica in the Amazon delta: Alteration, authigenic clay formation, and storage. Geochimica et Cosmochimica Acta, 68(5), pp.1061–1085.
Milliken, K., 2014. A Compositional Classification For Grain Assemblages In Fine-Grained Sediments and Sedimentary Rocks. Journal of Sedimentary Research , 84(12), pp.1185–1199.
Milliken, K.L., 2003. Diagenesis G. V Middleton, ed. Encyclopedia of Sediments and Sedimentary Rocks.
Milliken, K.L. & Day-Stirrat, R.J., 2013. Cementation in mudrocks: Brief review with examples from cratonic basin mudrocks. AAPG Memoir, 103, pp.133–150.
Milliken, K.L. & Reed, R.M., 2010. Multiple causes of diagenetic fabric anisotropy in weakly consolidated mud, Nankai accretionary prism, IODP Expedition 316. Journal of Structural Geology, 32(12), pp.1887–1898.
Mondol, N.H. et al., 2007. Experimental mechanical compaction of clay mineral aggregates—Changes in physical properties of mudstones during burial. Marine and Petroleum Geology, 24, pp.289–311.
Montgomery, S.L. et al., 2005. Mississippian Barnett Shale, Fort Worth Basin, north-central Texas: Gas-shale play with multitrillion cubic foot potential. AAPG Bulletin, 89, pp.155–175.
Nichols, G., 2009. Sedimentology and Stratigraphy 2nd ed., Wiley-Blackwell.
Nittrouer, C.A. & Sternberg, R.W., 1981. The formation of sedimentary strata in an allochthonous shelf environment: The Washington continental-shelf. Marine Geology, 42, pp.201–232.
O’Brien, N.R. & Slatt, R.M., 1990. Argillaceous rock atlas, New York: Springer-Verlag.
Ogston, A.S. et al., 2000. Observations of storm and river flood-driven sediment transport on the northern California continental shelf. Continental Shelf Research, 20, pp.2141–2162.
Peltonen, C.B. et al., 2008. Clay mineral diagenesis and quartz cementation in mudstones: The effects of smectite to illite reaction on rock properties. Marine and Petroleum Geology, 26(6), pp.887–898.
Pettijohn, F.J., 1975. Sedimentary rocks, New York: Harper and Row.
Plint, A.G., Macquaker, J.H.S. & Varban, B.L., 2012. Bedload Transport of Mud Across A Wide, Storm-Influenced Ramp: Cenomanian–Turonian Kaskapau Formation, Western Canada Foreland Basin. Journal of Sedimentary Research , 82(11), pp.801–822.

PhD Thesis | 2019
101
Potter, P.E., 1998. Shale-rich basins: controls and origin J. Schieber, W. Zimmerle, & P. S. Sethi, eds. Shale and Mudstones I. Basin studies, Sedimentology and Palaeontology, pp.21–32.
Potter, P.E., Maynard, J.B. & Depetris, P.J., 2005. Mud and mudstones: Introduction and overview, Berlin, Germany: Springer.
Potter, P.E., Maynard, J.B. & Pryor, W.A., 1980. Sedimentology of shale, New York: Springer-Verlag.
Quine, M. & Bosence, D., 1991. Stratal geometries, facies and sea-floor erosion in Upper Cretaceous Chalk, Normandy, France. Sedimentology, 38, pp.1113–1152.
Raiswell, R. & Canfield, D.E., 1998. Sources of iron for pyrite formation in marine sediments. American Journal of Science, 298(3), pp.219–245.
Rickard, D., 1997. Kinetics of pyrite formation by the H2S oxidation of iron (II) monosulfide in aqueous solutions between 25 and 125°C: The rate equation. Geochimica et Cosmochimica Acta, 61(1), pp.115–134.
Rouquerol, J., Avnir, D., Fairbridge, C.W., Everett, D.H., Haynes, J.H., Pernicone, N., Ramsay, J.D.F., et al., 1994. Recommendations for the characterization of porous solids. Pure and Applied Chemistry, 66(8), pp.1739–1758.
Rouquerol, J., Avnir, D., Fairbridge, C.W., Everett, D.H., Haynes, J.H., Pernicone, N., Sing, J.D.F., et al., 1994. Recommendations for the characterization of porous solids. Pure and Applied Chemistry, 66, pp.1739–1758.
Schieber, J., 2003. Depositional fabric of mudstones. Encyclopedia of Sediments and Sedimentary Rocks, 8, pp.203–207.
Schieber, J., 1999. Distribution and deposition of mudstone facies in the Upper Devonian Sonyea Group of New York. Journal of Sedimentary Research, 69(4), pp.909–925.
Schieber, J., 2011. Reverse engineering mother nature - Shale sedimentology from an experimental perspective. Sedimentary Geology, 238(1–2), pp.1–22.
Schieber, J. & Bennett, R., 2013. Bedload transport of mud across a wide, storm-influenced ramp: Cenomanian–Turonian Kaskapau Formation, western Canada foreland basin—Discussion. Journal of Sedimentary Research, 83(12), pp.1198–1199.
Schieber, J., Southard, J. & Thaisen, K., 2007. Accretion of mudstone beds from migrating floccule ripples. Science , 318, pp.1760–1763.
Scholle, P.A. & Ulmer-Scholle, D.S., 2003. A Color Guide to the Petrography of Carbonate Rocks: Grains, textures, porosity, diagenesis. Aapg Memoir, 77, p.460.
Shaw, H.F. & Primmer, T.J., 1991. Diagenesis of mudrocks from the Kimmeridge Clay Formation of the Brae Area, U.K. North Sea. Marine Petrology Geol, 8, pp.270–277.
Shepard, F.P., 1954. Nomenclature based on sand-silt-clay ratios: Journal Sedimentary Petrology. , 24, pp.151–158.

PhD Thesis | 2019
102
Silver, M.W., Shanks, a L. & Trent, J.D., 1978. Marine snow: microplankton habitat and source of small-scale patchiness in pelagic populations. Science (New York, N.Y.), 201(4353), pp.371–373.
Slatt, R.M. et al., 2012. Pore-to-regional-scale integrated characterization workflow for unconventional gas shales J. A. Breyer, ed. Shale reservoirs-Giant resources for the 21st century, 97, pp.127–150.
Slatt, R.M. & O’Brien, N.R., 2011a. Geological properties of unconventional resource shales I: pore types. Report, (December), pp.1–17.
Slatt, R.M. & O’Brien, N.R., 2011b. Pore types in the Barnett and Woodford gas shales: Contribution to understanding gas storage and migration pathways in fine-grained rocks. AAPG Bulletin, 95(12), pp.2017–2030.
Spinelli, G.A. et al., 2007. Diagenesis, sediment strength, and pore collapse in sediment approaching the Nankai Trough subduction zone. Bulletin of the Geological Society of America, 119(3–4), pp.377–390.
Stephenson, M., 2015. Shale gas and fracking: The science behind the controversy, Elsevier.
Stow, D.A. V, 1981. Fine-grained sediments: Terminology. Quarterly Journal of Engineering Geology, London, 14, pp.243–244.
Stow, D.A. V, Reading, H.G. & Collinson, J.D., 1996. Deep Seas H. G. Reading, ed. Sedimentary Environments: Processes, Facies and Stratigraphy, 3rd edition, pp.395–453.
Swift, D.J.P. & Thorne, J.A., 1991. Sedimentation on continental margins, 1: a general model for shelf sedimentation D. J. Swift et al., eds. Shelf Sand and Sandstone Bodies; Geometry, Facies and Sequence Stratigraphy, pp.3–31.
Talbot, M.R. & Allen, P.A., 1996. Lakes H. G. Reading, ed. Sedimentary Environments: Processes, Facies and Stratigraphy, 3rd edition, pp.83–124.
Talling, P.J. et al., 2012. Subaqueous sediment density flows: Depositional processes and deposit types. Sedimentology, 59(7), pp.1937–2003.
Taylor, K.G. et al., 2000. Carbonate cementation in a sequence-stratigraphic framework: upper Cretaceous sandstones, Book Cliffs, Utah-Colorado. Journal of Sedimentary Research, 70, pp.360–372.
Taylor, K.G. et al., 2002. Stratigraphic significance of ooidal ironstones from the Cretaceous Western Interior Seaway: the Peace River Formation, Alberta and the Castlegate Sandstone, Utah. Journal of Sedimentary Research, 72, pp.345–356.
Taylor, K.G. & Macquaker, J.H.S., 2014. Diagenetic alterations in a silt- and clay-rich mudstone succession: An example from the Upper Cretaceous Mancos Shale of Utah, USA. Clay Minerals, 49, pp.213–227.
Taylor, K.G. & Macquaker, J.H.S., 2000. Early diagenetic pyrite morphology in a mudstone-dominated succession: The Lower Jurassic Cleveland Ironstone Formation, eastern England. Sedimentary Geology, 131(1–2), pp.77–86.

PhD Thesis | 2019
103
Thyberg, B. & Jahren, J., 2011. Quartz cementation in mudstones: sheet-like quartz cement from clay mineral reactions during burial. Petroleum Geoscience, 17(1), pp.53–63.
Tissot, B.P. & Welte, D.H., 1978. Petroleum Formation and Occurrence: a new approach to oil and gas exploration, New York: Springer-Verlag.
Tourtelot, H.A., 1960. Origin and use of the word “shale.” American Journal of Science, Bradley Volume, 258–A, pp.335–343.
Twenhofel, W.H., 1937. Terminology of the fine grained mechanical sediments. Report of Committee on Sedimentation 1936-1937: National Research Council washington, D.C., 5, pp.81–104.
Tyson, R. V, 1995. Sedimentary organic matter: Organic facies and palynofacies, London: Chapman and Hall.
Udden, J.A., 1898. The Mechanical Composition of Wind Deposits,
Warrick, J.A. & Milliman, J.D., 2003. Hyperpycnal sediment discharge from semiarid southern California rivers: Implications for coastal sediment budgets. GSA Geology, 31(9), pp.781–784.
Wentworth, C.K., 1922. A scale of grade and class terms for clastic sediments. Journal of Geology, Chicago, 30, pp.377–392.
Weser, O.E., 1974. Sediment classification based on Deep Sea Drilling Project drilling. Geological Society of America, Program with Abstract, 6, pp.1073–1074.
Wright, J., 2001. Making loess-size quartz silt: Data from laboratory simulations and implications for sediment transport pathways and the formation of “desert” loess deposits associated with the Sahara. Quaternary International, 76/77, pp.7–19.
Wright, L.D. & Friedrichs, C.T., 2006. Gravity-driven sediment transport on continental shelves: A status report. Continental Shelf Research , 26, pp.2092–2107.
Wright, V.P. & Burchette, T.P., 1996. Shallow-water Carbonate Environment. In H. G. Reading, ed. Sedimentary Environments: Processes, Facies and Stratigraphy, 3rd edition. Blackwell Publishing, p. 688.
.
Chapter 3 Mud-rich Calciclastic Facies in the
Viséan submarine fans of the Bowland
Basin, UK

PhD Thesis | 2019
104
3 Mud-rich Calciclastic Facies in the Viséan Submarine Fans of the
Bowland Basin, UK
Timothy M. Ohiara1, Kevin G. Taylor1, Patrick J. Dowey1
1 – School of Earth and Environmental Sciences, the University of Manchester, Oxford
Road, Manchester M13 9PL, UK
Keywords: Facies, Viséan, Hodder Mudstone, calciclastic submarine fan, turbidites,
debris flows
Abstract
Deposits of clastic carbonate-dominated (calciclastic) sedimentary slope systems in the
rock record have been identified mostly as linearly-consistent carbonate apron deposits,
even though most ancient clastic carbonate slope deposits fit the submarine fan systems
better. Calciclastic submarine fans are consequently rarely described and are poorly
understood. Subsequently, very little is known especially in mud-dominated calciclastic
submarine fan systems. Presented in this study are a sedimentological core and
petrographic characterisation of samples from eleven boreholes from the Lower
Carboniferous of Bowland Basin (Northwest England) that reveals a >250 m thick
calciturbidite complex deposited in a calciclastic submarine fan setting. Seven facies are
recognised from core and thin section characterisation and are grouped into three
carbonate turbidite sequences. They include: 1) Calciturbidites, comprising mostly of
high- to low-density, wavy-laminated bioclast-rich facies; 2) low-density densite
mudstones which are characterised by planar laminated and unlaminated mud-
dominated facies; and 3) Calcidebrites which are muddy or hyper-concentrated debris-
flow deposits occurring as poorly-sorted, chaotic, mud-supported floatstones. These

PhD Thesis | 2019
105
facies present evidence for a hybid carbonate clastic and terrigenous mud-rich sediment
gravity (density) flow deposits. Results suggest that sediments were deposited along
amalgamated feeder slope channels to fan fringe/basin plains in a tectonically active
setting. The deposited facies resulted from the interaction of upper slope gullies,
channelled slope turbidites systems and basin plain processes. The integration of
sedimentary elements and facies correlation across boreholes also reveals that sediments
were deposited on a distally steepened ramp slope (mid-to-outer fan setting) to basin
plain environments. Basin physiography was controlled by tectonics and resulted in the
asymmetric depositional sequence of high- to low-density turbidites and occasional
debris flow beds. These high- to low-density turbidites were further overlain by basin
plain sediments. This study presents evidence for an ancient carbonate submarine fan
systems within the Carboniferous back-arc basins of central Britain. It has also
documented the distribution and variation of a calciclastic and muddy turbidite facies
sequence.
PhD Thesis | 2019
106
Introduction
Understanding and documentation of ancient calciclastic submarine fan systems are still
lacking in comparison with siliciclastic equivalents (Payros & Pujalte 2008; Courjault et
al. 2011; Ielpi & Cornamusini 2013). Recent studies suggest that deposits of calciclastic
submarine fans may be more common in the stratigraphic record than generally
recognised (Payros & Pujalte 2008; Courjault et al. 2011; Grosheny et al. 2015). The
classification of calciclastic sedimentary units as products of submarine fan systems
requires an understanding of sediment transfer processes, the depositional geometries
and the depositional controls on calciclastic slope systems. Current understanding of
ancient calciclastic submarine fans has been influenced by a combination of the
extensively developed siliciclastic submarine fan models of Normak (1970) and the slope
apron/base-of-slope apron models of Mullins and Cook (1986). With no bona fide
present-day analogues for calciclastic submarine fans, a direct knowledge of sedimentary
processes in calciclastic slope systems has been acquired from several studies on modern
carbonate slopes (e.g. the Bahamian slopes) (Betzler et al. 1999; Saxena 2000; Reijmer et
al. 2002; Eberli et al. 2004; Tournadour et al. 2015; Chabaud et al. 2016; Tournadour et
al. 2017; Wunsch et al. 2017; Principaud et al. 2018). A considerable amount of literature
has also been published on ancient carbonate slope systems (e.g. Herbig & Bender 1992;
Savary & Ferry 2004; Savary 2005; Courjault et al. 2011; Ferry et al. 2015; Grosheny et
al. 2015). These studies have provided sedimentologists with a good understanding of
calciclastic slope systems, but our knowledge still lags behind that of siliciclastic systems.
For example, advances have been made in siliciclastic models to include all grain size
variables with several likely facies expected in almost all systems (e.g. Stow & Piper 1984;
Lowe 1982; Shanmugam 1997; Shanmugam 2000; Mulder & Etienne 2010; Talling et al.

PhD Thesis | 2019
107
2012). In comparison with the inventory on siliciclastic systems, more case studies are
still needed in order to fill the knowledge gap within calciclastic systems.
Advances that have been made in understanding ancient calciclastic submarine fans
within the stratigraphic record have hitherto not focused on mud-rich (>50% mud)
calciclastic systems. Despite the growing importance of mudstones as self-sourcing
reservoirs (Mullen 2010; Lazar et al. 2015; Liang et al. 2016) and their potential as
locations for carbon dioxide (Schepers et al. 2009) and nuclear waste storage (Neuzil
2013b), there remain significant questions on the lateral distribution and geometries of
mud-rich facies in hybrid calciclastic systems.
This study presents significant stratigraphic and sedimentological features from a hybrid
mud-rich calciclastic turbiditic facies deposited in the Carboniferous Bowland Basin,
northwestern England. In their sedimentary models for extensional basins, Leeder and
Gawthorpe (1987) recognised the Bowland Basin as a carbonate coastal/shelf, tilt
block/half-graben. The Lower Carboniferous (Viséan) succession of the Bowland Basin,
was described as sediment gravity flow deposits deposited along a carbonate platform
slope during basinal extension and submergence of the carbonate platform (Gawthorpe
1986). No reference to either calciclastic submarine fan system or the carbonate slope
apron system has been made as to the interpreted sedimentary system. No attempt has
also been made to characterise its mud-rich facies in light of recent developments in
submarine gravity flow deposits. As common in mud-dominated systems, the Viséan
Bowland succession has been previously interpreted as a medium to dark grey
hemipelagic mudstone, interbedded with thin-bedded calcareous siltstones and
turbidites (Gawthorpe 1986; Riley 1990; Aitkenhead et al. 1992; Waters et al. 2009;
Newport et al. 2017). Sedimentary architecture is interpreted to be a product of eustatic
PhD Thesis | 2019
108
sea-level changes and syndepositional tectonics that resulted in a mixed deposition of
deep marine hemipelagic sediments with intermittent limestone turbidites shed from
adjacent carbonate shelves and platforms (Riley 1990; R. L. Gawthorpe 1987; Fraser &
Gawthorpe 1990). In this study, bed-scale sedimentary structures, microtextural
elements and lamina-scale sedimentological variations of the Bowland Basin carbonate
slope deposits have been examined using exceptional core data density and high-
resolution petrographic tools. This enables an improved interpretation of turbidite and
debris flow facies and provides stratigraphic controls on facies reconstruction within a
mud-rich calciclastic succession. The chapter aims to (i) Identify the sedimentological
evidence for submarine fan systems within the units of a mud-rich calciclastic succession,
(ii) review the sediment gravity (density) flow depositional processes responsible for the
facies distribution, and (iii) produce a conceptual depositional model for the mud-rich
calciclastic facies of the Lower Carboniferous Bowland Basin.
Tectonic evolution and stratigraphy
At the close of the Devonian, the British Isles were located within the equatorial belt.
Central Britain lay in the foreland/back-arc terrain of the Laurasian continent and
associated rift basins formed due to extensional tectonics (Leeder 1982; Leeder 1988). In
the Carboniferous, dextral shearing (Arthurton 1984), back-arc rifting (Leeder 1982) and
North Atlantic rifting (Haszeldine 1984) have been suggested as regional-scale processes
that controlled basin development in Northern Britain. The Bowland Basin represents
one half-graben sub-basin comprising the several sedimentary sub-basins formed in
North England during the Carboniferous (R. L. Gawthorpe 1987; Aitkenhead et al. 1992).
It is a NE-SW oriented basin bounded by the Bowland High to the northeast and the
Rossendale High to the southwest (Figure 3.1). The Bowland Basin evolution was

PhD Thesis | 2019
109
controlled by two distinct rifting episodes of basin extension in a back-arc setting (Leeder
1982),: a Late Chadian (Tournaisian) to Early Arundian (Early Viséan) episode and a Late
Asbian to early Brigantian (Late Viséan) episode (Figure 3.1). The basin evolution
involved a NW – SE- to N – S-deepening half-graben, controlled by a basin-margin fault
along the line of the present day Pendle Monocline (Figure 3.2). Complex normal and
transfer fault systems and dextral shear periods associated with the extensional tectonics
controlled sediment deposition (Figure 3.2 (b)) (R. L. Gawthorpe 1987; Leeder &
Gawthorpe 1987). The facies mosaic of the Bowland Basin documents the basin-wide and
intra-basinal asymmetric depositional sequence (R. L. Gawthorpe 1987). Due to Late
Carboniferous compression and transpression, the Bowland Basin is presently situated
on the Ribblesdale Fold Belt and the Becconsall-Ashnott High (Figure 3.1) (R. L.
Gawthorpe 1987; Leeder & Gawthorpe 1987).
There are nine different depositional lithofacies association recognised in the
Carboniferous of Britain, of which, six are documented in the Bowland Basin located on
the western margin of northern England (Dean et al. 2011). These facies, adopting the
regional Western European chronostratigraphic stage nomenclature are: (1) Late
Devonian to Tournaisian continental and peritidal facies; (2) Tournasian to Viséan Open
marine platform and ramp carbonate facies; (3) Viséan hemipelagic facies; (4)
Fluviodeltaic facies, known as the “Millstone Grits” of Namurian to Westphalian age; (5)
Westphalian Fluvio-deltaic facies (“Coal Measures”) and (6) Westphalian to Stephanian
Alluvial facies (“Barren Measures”) (Chapter 2).

PhD Thesis | 2019
110
Figure 3.1: (a) Location and geological map of the Bowland Basin showing bounding faults and surrounding areas. Approximate location of studied wells is shown in (b) inset in Figure 3.1(a). Geological map, structural elements and surface exposures adapted from the BGS 1:250 000 Liverpool Bay Sheet (Clarke et al. 2018)

PhD Thesis | 2019
111
Figure 3.2: A simplified summary diagram on the Lower Carboniferous tectonostratigraphic evolution of the Bowland Basin. (a) Tournaisian to Early Viséan structural configuration showing emergent/shallow marine areas (northwest and southeast) and the development of carbonate ramp slope on a simple half-graben tilting towards the basin margin fault (southeast) (present-day Pendle Monocline). (b) Viséan to Namurian structural configuration showing progressive extension, hanging wall segmentation by a series of NE-SW-trending transfer faults and NE-SW-trending antithetic faults. Diagrams adapted from Gawthorpe (1987) approximate location of studied samples is indicated. (c) Schematic conceptual diagram (not drawn to scale) showing the sedimentary depositional architecture of the Bowland Basin and sequence stratigraphic units (Andrews 2013).
3.2.1 Viséan stratigraphy of the Bowland Basin
As rifting progressed during the Viséan, there was extensive fault-block tilting resulting
in erosion, sediment transfer of sedimentary detritus from marginal shelf areas and
footwalls scarps into basinal regions, and soft sediment deformation (R. L. Gawthorpe
1987; Aitkenhead et al. 1992). Carbonate detritus was derived from the NW margin of the
basin while terrigenous predominantly mud-rich sediments were derived axially from

PhD Thesis | 2019
112
the NE (R L Gawthorpe 1987). Various identified calcareous algae suggest deposition in
a warm shallow water of 75 – 100 m water depth (R. L. Gawthorpe 1987) on the platform.
By the end of the Viséan, the climate had become progressively wetter with the
movement of the continents to higher latitudes, and deltas became more prominent
bringing coarse-grained terrigenous sediments to the basin (Aitkenhead et al. 1992). The
Viséan sedimentary succession in the Bowland Basin is dominated by marine hemipelagic
deposits and carbonate debris (Riley 1990; Gawthorpe 1986; Aitkenhead et al. 1992;
Fraser & Gawthorpe 1990; Waters et al. 2009; Dean et al. 2011). Carbonate slope
sedimentation was dominant between the Chadian/Early Arundian and the Late
Asbian/Early Brigantian (R. L. Gawthorpe 1987). The “Viséan hemipelagic facies” include
the Hodder Mudstone (Lower Viséan) and the actively studied Upper Viséan (Brigantian)
Bowland Shales (e.g. Gross et al. 2015; Emmings et al. 2017; Newport et al. 2017),
interbedded with brecciated carbonates (Hodderense and Pendleside limestone) (Figure
3.3). The Hodder succession forms part of the Bowland-Hodder Unit within a potential
UK shale play (Figure 3.2 (c)) (Andrews 2013; Clarke et al. 2014). Within the regional
stratigraphic sequence, the Hodder Mudstone is a member of the Craven Group (Waters
et al. 2009) and forms the EC3 (late Chadian to Holkerian regional stages) seismic
stratigraphic sequence (Fraser & Gawthorpe 1990) (Chapter 2).

PhD Thesis | 2019
113
Figure 3.3: Viséan (Late Chadian to Asbian) lithostratigraphy of the study area shown in Figure 3.1. Sedimentary thicknesses and facies may vary across basin (after Gawthorpe 1985)

PhD Thesis | 2019
114
Methods
The data presented herein are detailed petrographic results of core samples taken from
a suite of onshore solid mineral exploration boreholes (Marl Hill borehole (MHD) series).
The boreholes were drilled by BP Mineral International Ltd during a Pb-Zn solid mineral
prospecting around Whitewell towards the southern margin of the Forest of Bowland
(53°55´0.66´´ N, 2°30´26.33´´ W) (Figure 3.2). Studied cores penetrated present day
topsoil through underlying Namurian to Viséan age strata (Aitkenhead et al. 1992) and
are stored by the British Geological Survey (BGS) in Keyworth, Nottinghamshire, UK. The
formation tops of the Lower Viséan succession were identified from lithologic and
biostratigraphic log results of Aitkenhead et al. (1992) and Riley (1993). A total of 1,679
m (5,508 ft.) of continuous cores from 11 boreholes were logged and sampled for this
study. 131 samples were selected using graphic core logs and lithologic variation to guide
sample selection for detailed petrographic analysis.
Textural terminologies used to characterise the facies description were adapted from
Macquaker and Adams (2003) classification of mudstones, and are based on the
percentage composition of constituent grains irrespective of provenance. This
classification was used as it conveniently captured the defining general textural features
of each facies. However, in describing the carbonate textural aspects of lithotypes within
the facies, carbonate textural terminologies of Dunham (1962) and Embry & Klovan
(1971), and the clastic carbonate terminology “calciclastics” for calcium carbonate
containing sediments, removed from pre-existing and redoposited as clastic sediments
(Braunstein 1961), have been applied for clarity. The term calciclastic can also be applied
to mixed carbonate and siliciclastic sytems where carbonate sediments are dominant
(Payros & Pujalte 2009). Percentage composition of clay, silt, sand or skeletal materials

PhD Thesis | 2019
115
(bioclast) are defined by suffixes; “–dominated” (>90%), “–rich” (50 – 90%) and “–
bearing” (10 – 50%). The terminologies are further modified by the addition of prefixes
denoting sedimentary structures and textures present.
Core samples enabled the recognition of internal sedimentary structures and were
primarily described from visual inspection. Lithology was identified using colour,
sedimentary structures, grain size, visible mineral and fossil content, fracture patterns
and diagenetic structures. 10% dilute HCl was used to confirm the presence of carbonate
minerals and a grain size analysis chart for grain size analysis. Rock samples collected
were approximately 20 – 40 cm3 in size guided by distinct and subtle visual variations.
Fifty 20 µm thick, polished thin sections perpendicular to bedding with blue epoxy
impregnation were prepared from samples. Thin sections were scanned with Kodak
esp® 1.2 scanner to provide high-resolution images (1200x1200 dpi) of the whole thin
section. A detailed petrographic analysis was undertaken using Nikon Eclipse E200
ultraviolet polarized light microscope at the University of Manchester. Optical
petrographic microscope observation provided two-dimensional sections revealing grain
fabric and texture. Sand- and silt-sized mineral components, bioclasts, trace fossils and
cements were characterised with the polarizing microscope. Photomicrographs of
samples were also taken at low and high magnification in plane polarised light (PPL) and
cross polarised light (XPL).
Representative polished thin sections were further carbon-coated and analysed using
the Philips XL30 FEG Environmental Scanning Electron Microscope (ESEM) equipped
with an energy dispersive x-ray spectrometer (EDS) analyser. This enabled clear
identification of minerals and their distribution. Machine parameters were set to 15kV
acceleration voltage, with 10 mm working distance, spot size of 4 and in back-scattered

PhD Thesis | 2019
116
electron emission (BSE) mode. Qualitative chemical variability was determined using
the EDS system.
Results
3.4.1 Sedimentological elements and facies description
Seven facies are described based on constituent sediment types, grain-sizes, grain-
sorting and sedimentary structures. Descriptions utilized core logging and hand
specimen observations and were further modified by petrographic observations. The
identified facies are mostly intercalated and defined by gradational to sharp boundaries.
Facies include: F1- Wavy-laminated, gravel-to-sand (bioclastic) and silt-rich limestone;
F2- Poorly-laminated, bioturbated, silt-rich and sand (bioclastic)-bearing limestone; F3-
Unlaminated sand- and silt-rich arenite; F4- Unlaminated clay-dominated mudstone;
F5- Parallel, planar-laminated to convoluted silt- and clay-rich mudstone; F6-
Unlaminated silt- and bioclast-dominated limestone; F7- Intraclastic, bioclast- and sand-
rich limestone.
3.4.1.1 F1- Wavy-laminated, gravel-to-sand (bioclastic) and silt-rich limestone
Description: The F1 facies have bed thicknesses between 0.5 – 30 m and constitute
alternating light to dark grey laminae (Figure 3.4). Facies are thickest (ca. 30 m) to the
west of the study area towards MHD12 borehole but generally thins (<0.5 m) out in the
southeast direction. F1 facies may grade into F2 or F3 facies described below, depending
on mud to bioclast ratio and the presence or absence of laminae.
Wavy, discontinuous and mostly parallel laminations are a distinctive feature of this
facies (Figures 3.4, 3.5 & 3.6). Laminae are marked by erosive bases and by lamina-scale
normal and inverse-to-normal grading of rudstone, packstone and wackestone (Figures
3.4 & 3.5). Grain-size and sorting differ within and across laminae but facies generally

PhD Thesis | 2019
117
fine upwards through sand-to-silt-to-mud laminae. This fabric results in the transitory
inter-lamination of packstone, wackestone and carbonate-sand dominated beds (Figure
3.6). Horizontal grain-imbrication and sediment sculpting are common (Figures 3.4 &
3.5).
A typical F1 facies contains abundant shallow marine skeletal debris of mostly
echinoderm, mollusc, brachiopod, benthic foraminifera, bryozoans, corals and calcareous
algae. Echinoderms are abundant and are dominated by crinoids. The diameter of most
crinoid ossicles can be as large as 2cm. The average size of other calcareous fossil
fragments is between 3 mm to <1mm. Bioclast to mud ratio from a visual estimate is
about 2:1 while most intervals are characterised by calcarenitic matrix. The muddy
matrix is composed mostly of siliciclastic grains and micrite. Siliciclastic components
include silt- to clay-sized quartz and muscovite grains. The micritic matrix contains
calcitic microscopic remains of bryozoans and microfossils of calcareous algae, benthic
foraminifers, calcified tests of radiolarian and sponge spicules and some indeterminate
biota. Other carbonate minerals are calcite and ferroan dolomite cements.

PhD Thesis | 2019
118
Figure 3.4: Showing mm to cm scale continuous and discontinuous wavy laminations. Normal and inverse-to-normal lamina-set are common in F1 facies. Clay-rich ripple laminae eroded surfaces with a combined effect of sediment compaction. Visible skeletal fragments (blue) are mostly of abraded crinoid.

PhD Thesis | 2019
119
Figure 3.5: Example of interlaminated rudstone (a), packstone, wackestone and mudstone laminae (b). These lithologies make up the bulk of the F1 facies at varying thicknesses. Grain imbrication is mostly horizontal.
Interpretation: The dominance of calcareous bioclastic debris from shallow marine
biota indicates allogenic sedimentation mostly from the adjacent shelf or platform slope

PhD Thesis | 2019
120
(Payros et al. 2007). Coarse-grained (gravel-to-sand sized) calcareous bioclastic debris
and the associated normal to inverse grading and wavy erosive lamina-bases are
considered to be results of high-density turbidity current (Payros & Pujalte 2008; Plint et
al. 2012). The interlamination of rudstone, packstone and wackestone lithotypes may be
due to fluctuation in turbulence. Scoured surfaces and low amplitude wavy laminations
are typical of traction/traction carpet component of high- to low-density turbulence
(Baas et al. 2009; Talling et al. 2012). The traction carpet in F1 is characterised by the
basal gravely to sandy debris flows. The depositional process is characterised by an initial
intergranular frictional “freezing” of traction carpet and subsequent rapid suspension of
the finer-grained top layer by genetically related high-concentration turbidity currents
(Payros et al. 2007). The erosion of the top mud-rich laminae resulted in the thin, darky-
grey mud laminae seen in Figure 3.4. The reduction in bioclastic fragments and the
presence of sand/silt and mud laminae couplets in wavy laminations may also be
indicative of a repeated collapse of the lamina shear layers (Talling et al. 2012). The F1
facies is typical of conglomeratic to stratified calciturbidites (Payros et al. 2007), and is
comparable to the TB-1 / TB-2 siliciclastic model of Talling et al. (2012). Although the
specific density of calcite mineral is higher than quartz mineral (2.71 g/cm3 and 2.65
g/cm3 respectively), carbonate grains are mostly flat-shaped and possess intra-particle
pores which reduces their bulk density (Eberli 1991). Hence, it is expected that most
coarse-grained skeletal debris exhibit similar hydrodynamic behaviour equivalent to that
of fine-grained compact and mostly spherical particles. Within mud-rich sediment gravity
flows, deposits may be composed of pure carbonates units (e.g. packstones and
wackestones) or mixed with very fine-grained siliclastic components (Payros & Pujalte
2008) as observed in the studied facies.

PhD Thesis | 2019
121
Figure 3.6: Core images highlighting the textural features of the F1 facies recognised by their distinctive wavy laminations and bioclast content. Facies comprise transitory rudstone, packstone, wackestone and mudstone laminae
3.4.1.2 F2- Poorly-laminated, bioturbated, silt-rich and sand (bioclastic)-bearing
limestone
Description: The F2 facies consists of dark grey wackestone to mudstone strata with
thicknesses from <1 to 5m. Some F2 facies display thin (1 to 2mm) indistinct
discontinuous wispy laminations marked by occasional swirls both in core and thin
section (Figure 3.7). F2 facies are commonly intercalated with F1 and F3 facies due to
variable mud to bioclast ratio.
The identified shell debris are from shallow water fauna similar to F1 bioclastic
components. These components make up between 10 to 50% of calciclastic content.
These fragments are mostly observed as silt to sand-sized abraded bivalves and
brachiopod shells. Echinoderm spines and shells are also distinctive. In most samples,

PhD Thesis | 2019
122
bioturbation traces typical of Chondrites are present (Figure 3.7). Bioturbation in the F2
facies is moderate and localised in thinner intervals, differing from the intense
bioturbation occurring in F3 facies.
The matrix contains micrite and siliciclastic components (silt-sized quartz and
phyllosilicate clay minerals). The micritic assemblage is similar to that observed in F1
facies. However, F2 has lower concentrations and smaller-sized microbioclasts and
higher concentrations of sparite and angular silt-sized siliciclastic components than the
F1 facies.
Interpretation: The lack of sedimentary laminations and the presence of bioturbated
facies may indicate relatively slow sedimentation and the reworking of sediments by
epifaunal “sediment swimmers (Schieber 2003)”. Chondrites are dwelling structures
typical of deep-tier chemosymbiotic faunal traces (Uchman & Wetzel 2012). Sediments
were fluidized to enable the reworking of sediments by worm-like burrowers (Lobza &
Schieber 1999). The preservation of Chondrites in the F2 facies and the interstratification
with F1 may be attributed to the interaction of slow energy fluid mud processes and
subsequent turbulent flow regimes. Preserved faint laminations may however, be due to
the presence of bottom currents that partly reworked the sediment (e.g. Ielpi &
Cornamusini 2013). Both bioturbation and bottom currents are possible events in
turbiditic environments.

PhD Thesis | 2019
123
Figure 3.7: Textural features of the F2 facies showing core sample with lamina-disruptive bioturbation trails. Bioturbation traces are preserved as anastomosing traces typical of Chondrites (arrow indication) with the deposition of relatively larger grains of bioclast fragments in burrows
3.4.1.3 F3- Unlaminated sand- and silt-rich arenite
Description: The unlaminated sequences of F3 facies consist of light to medium grey
(Figures 3.8 (a) & (b)), 2 to 10 m thick sandstone and siltstone packages. Facies F3 often
overlies F2 but are locally intercalated with F1. The base of the F3 facies is mostly
gradational from underlying F1 and F2 and overlain by F4 facies. Sand beds are localised
in boreholes towards the west of the study area and a localised <1.5m thick quartz
arenitic sand bed (Figures 3.8 (a) & (b)) observed in MHD1 core.
Sedimentary structures are rare but indistinct wavy laminations may be observed.
Constituent lithotypes are mostly calcilutite, calcarenite and quartz arenite (Figure 3.8).
Facies units in core scale contain rare fragments of crinoids and molluscs shell debris.
Microscopic evidence show <0.25 mm sized matrix assemblage of abraded crinoids,
gastropods and brachiopods, foraminifers, radiolarian tests, sponge spicules and
calcispheres. Matrix is dominated by sand-, silt- and clay-sized quartz, muscovite, calcite

PhD Thesis | 2019
124
and dolomite. Dolomite are are dominant in calcarenitic beds with idiomorphic mosaic of
sub- to euherdal crystal morpohology (Figure 3.8d) similar to those observed by
Gawthorpe (1987) in the study area. Bioturbation is present and can be locally delineated
in thin sections as dentritic burrows typical of Chondrites and simple Planolites traces.
Figure 3.8: Unlaminated sand- and silt-rich facies: (a) showing core image of facies comprising very fine quartz-rich sand facies (B) from MHD1 core. Grain size in (c) and (d) is between silt to very fine carbonate-rich sand. Distinguishing feature between the two examples is the dominance of quartz grains in (b) and dominance of rhombic dolomite crystals in (d).

PhD Thesis | 2019
125
Interpretation: The rare to complete absence of laminations, presence of isolated sand-
sized skeletal fragments in silt-/sand-rich matrix and the interstratification of F3 with F1
and F2 may be a result of damped turbulence and fluid mud processes (e.g. Baas & Best
2002; Bhattacharya & MacEachern 2009; Ichaso & Dalrymple 2009; Sumner et al. 2009;
Talling et al. 2012; Kase et al. 2016). The depositional process may have been in the form
of en masse deposition, grain flow and/or settling from flocculated suspension (e.g
McCave & Jones 1988; Talling et al. 2012). This resulted in the succession of calcilutite
and the sand-dominated calcarenitic facies with constituent calciclastic and siliciclastic
grains in the samples. During sediment en masse deposition, mud concentrations may
range from 0.5 to 11% volume (Talling et al. 2012) occasionally supporting the
entrainment of fossil fragments and sand-sized grains in a resultant mud ‘gel’. The
presence or muddy matrix and the localised fine-grained sand bodies observed in the
studied succession, F3 facies is likely to have been transported en masse through a gel
and a subsequent settling sand to the base of the deposit (e.g. Amy et al. 2006; Sumner et
al. 2009; Talling et al. 2012). Calcarenitic units subsequently experienced significant
dolomitization of calcite spar as indicated by the presence of sub- to euhedral dolomite
crystals (cf. Gawthorpe 1987). Localised bioturbation traces may suggest colonization of
the sea floor in between turbidity flows (e.g. Ielpi & Cornamusini 2013).
3.4.1.4 F4- Unlaminated clay-dominated mudstone
Description: This facies constitutes dark grey, conchoidal, dull to vitreous-lustre
mudstone (Figure 3.9 (a)). The thickness of these beds varies from 10 metres in the west
of the study area to more than 80 metres towards the southeast. They are also thinly (<
0.5 cm) interlaminated with F1, F2 & F3 facies (e.g. Figures 3.4 & 3.5). No primary
sedimentary structures are observed but concretionary nodules are common in most

PhD Thesis | 2019
126
horizons. Nodules may occur as rusty brown to grey sub-rounded to sub-angular calcitic
to dolomite concretions.
In thin section, this facies is almost devoid of skeletal debris (Figure 3.9b), but may locally
contain crinoidal debris, indeterminate calcitic skeletal fragments and pyrite-replaced
moulds of indeterminate organisms. Tests of sponge spicules and radiolarian are
localised in bioclast-bearing units. This facies comprises mostly micritic carbonate
crystals, silt- to clay- sized quartz, muscovite and kaolinite (Figure 3.9 (c)). Local
intrastratification of F6 facies was observed.
Interpretation: The presence of silt- to clay-dominated grains observed in the F4
represent suspended sediment load (e.g. Schieber 1999). The observed lustre variations
are reflective of the percentage composition of mineral ratios. Carbonate bioclasts, quartz
and muscovite grain compositions suggest of a mixed terrigenous (detrital quartz and
phyllosilicates) and platform-sourced carbonate grains (bioclasts). Grain orientations
indicate no obvious horizontal grain imbrication to infer quiet settling. Due to deposition
of facies within a turbulent environment, F4 facies could be regarded as low-density
turbulent deposits. Traction-generated structures are present in the inter-laminated and
convoluted intervals of the F5 facies. Additional, the F4 facies were disrupted by events
deposition of F6 facies and sediment load occasionally entrained bioclastic debris. It is
suggested here that the mud deposits are likely deposits of severely damped turbulence
of a dense non-turbulent suspended mud-flow (e.g. McCave & Jones 1988), which is
typical of fluid mud deposition.

PhD Thesis | 2019
127
Figure 3.9: Unlaminated clay-dominated mudstone showing (a), core of a dull-lustred mudstone; (b) photomicrograph of apparently homogenous mud and (c) mineral component of F4 constituting calcite, quartz and muscovite (mica) surrounding matrix are dominated by kaolinite.
3.4.1.5 F5- Parallel, planar-laminated to convoluted silt- and clay-rich mudstone
Description: This facies usually contain well-laminated 0.2 to 12 mm thick lamina-
couplets, composed of medium- to coarse-grained silt (calcisiltite) and fine-silt- to clay-
grained (mudstone) (Figures 3.10 & 3.11). Laminations vary, with both parallel planar to
convolute laminae, which are independent of their thickness (<0.2 to 1 cm) (Figure 3.10).
Planar lamina-set geometries are inclined relative to core orientation (20-60°) in both
the MHD8 and MHD18 borehole samples.
Facies thickness can be between 5 to about 10 m. Beds with convoluted laminae may
show strongly distorted bands (Figure 3.11 (d)) of asymmetrical overturned laminae.

PhD Thesis | 2019
128
Other features are water escape structures (flame structures), micro-normal and -reverse
faults and small scale over-folds. Internal normal grading is distinctive within the F5
facies. Erosional bases are present with occasional low angle internal micro cross ripple-
lamination (Figure 3.10 (a)). Erosional surfaces are mostly observed on clay-rich lamina
surfaces overlain by silt lamina (Figures 3.10 & 3.11). In thin section, lamina-boundaries
are gradational to sharp with planar and undulatory surfaces (Figures 3.10 (a), 3.11 (b)
& 11 (c)). Silt-rich laminae are dominated by silt-sized quartz and calcite grains while
clay-rich laminae are composed mostly of quartz, muscovite and dolomite crystals
(Figure 3.11 (c)). Silt-rich lenticular structures and the imbrication of clay minerals can
be observed. F5 facies overlies the F4 facies but can be intercalated. This facies is however
absent in MHD 1, 5, 8, 9 and 12 boreholes.
Figure 3.10: Lamina set geometries in planar laminated F5 facies. (A) Showing the resultant effect of intermittent erosion of silt- and clay-rich lamina and formation of internal cross-ripples in silt-rich layers (XL). Clay-rich laminae are susceptible to erosion and easily re-suspended hence apparent erosional surfaces (ES), limited preservation and thin sub millimetre thickness in (A). Evidence of submarine erosion can be seen in the formation of lenticular clasts (LL) from sculpted unconsolidated water-rich muddy sediments. (B) Shows normally graded laminae sets of silt/clay couplets as indicated by the arrows. Silt grade laminae represents traction carpets and suspended load aspects (clay grade lamina) typical of waning turbidity flow. Inclination of laminae may due to post-depositional deformation most likely from a section of convoluted beds.
Interpretation: Planar parallel to internal low-angle cross laminations, normally graded
lamina-sets and occasional internal scours are indicative of the waxing and waning of

PhD Thesis | 2019
129
turbidity currents during continued lateral sediment transport (Stow & Shanmugam
1980). Internal ripple laminations in silt-rich laminae may represent periods of tractional
movements during silt-sized particle deposition (Stow & Shanmugam 1980). Mud-rich
laminae deposited in turbulent environments are often easily resuspended by
subsequent turbidity current (Wilson & Schieber 2014). This resulted in the erosive
surfaces on clay-rich laminae. The progressive break-up of clay and silt-rich flocs and a
subsequent increase in fluid turbulence near the boundary layers may result in repeated
laminations and ripples of silt and clay (McCave 1969; Schieber et al. 2007; Schieber
2011a). Multiple cyclical patterns of this overall waning event resulted in thick repeated
successions of silt/clay laminae-sets found in the F5 facies. These silt- and clay-rich
laminated facies can be deposited in distal offshore environments by traction currents.
The soft sediment deformation recorded during basin extensional tectonics (Gawthorpe
& Clemmey 1985) of semi-consolidated planar laminated mud units resulted in
convolution or laminae displacement.

PhD Thesis | 2019
130
Figure 3.11: F6 facies showing planar lamination features (a, b & c) and convolute laminations. Carbonate silt-rich lamina overlying clay-rich planar laminae bounded by a sharp erosive in the photomicrograph. SEM micrograph of silt/clay laminae contacts (b) and (c). SEM images highlight the mineralogical variation of a dolomite-cemented (D) mud-rich lamina and a calcite-cemented silt-rich lamina. Effects of soft sediment disruption can be seen in the core sample (d), and in petrographic sections (e) & (f).
3.4.1.6 F6- Unlaminated silt- and bioclast-dominated limestone
Description: Most of the studied core sections show unlaminated silt- and bioclast-
dominated limestone facies interstratified with F5 facies. They are present in MHD3,
MHD5, MHD13 and MHD18 boreholes. These comprise matrix-supported conglomeratic
beds or floatstones with thicknesses from 5 to 30 cm (Figure 3.12). The F6 facies is
typically ungraded to weakly graded and poorly sorted where it passes into F5 facies. No
inverse grading was observed and basal surfaces are slightly erosional. In the microscopic
scale, this facies has large scale imbrication and internal deformation with apparent flow
directions (Figure 3.12). Bioclast components are 50 to 80 % non-segregated crinoidal
fragments (1 to 25 mm crinoid stems, columnals and plates), fragmented gastropods,

PhD Thesis | 2019
131
bivalves, bryozoans, corals and rare foraminifers with partial and complete pyritized
cavities in dark grey muddy matrix (Figure 3.12 (b)). These clasts are similar to those in
F1 and are angular to well-rounded shell debris. Muddy matrix components are made of
silt- to clay- sized siliciclastics and micrite similar to F5 facies.
Figure 3.12: F6 facies in core photo (a) showing poorly sorted, conglomeratic fabric. Micrograph examples show clasts of mostly fragmented crinoids, gastropods (Gast.), pyritized shells and other shell debris.(b) and (c) reveals translational lineations (dashed lines) due to internal deformation

PhD Thesis | 2019
132
Interpretation: Chaotic, poorly-sorted, floatstones and rudstones with a dark grey
muddy matrix are indicative of high-density muddy debris flow (Payros & Pujalte 2008).
The bioclast types and a dark grey muddy matrix are similar to the F1 facies. The
deposition may be from a proximal unstable gully/scarp or from resedimented slope
deposits. The latter is in this case, due to the internal deformation features observed in
F6 (Figure 3.12) which are typical of debris flow deposits from slumping of earlier
deposited unstable slope lithofacies (Gawthorpe & Clemmey 1985). Interstratification
with F4 facies suggests several episodes of event slope slumping deposition during mud
accumulation.
3.4.1.7 F7- Intraclastic, bioclast- and sand-rich facies
Description: Slightly similar to F6 but more grain-supported, the F7 facies consist of 1 to
8m thick pale to grey breccia beds. The F7 differs significantly with the F6 due to presence
of more abraded lithoclasts with >5cm diameter (beyond core resolution) and sand-rich
matrix. This facies overlies the F5 or the F4 in almost all studied sections except in MHD1,
MHD4 and MHD5 cores. This facies is weathered in most sections with distinctive red
clays in rock crevices. No grading is observed and facies show, sub-angular to sub-
rounded light grey clasts and intraclasts in core observation (Figures 3.13 (a) & (b)). Core
examination reveals intraclast components (lithoclasts) of up to 5cm sized packstones to
wackestone. Clasts and intraclasts comprise of resedimented and remobilised skeletal
assemblage. Recognised skeletal assemblage includes fragments of echinoderms,
bryozoan, calcareous algae, mollusc and benthonic foraminifera. Benthonic foraminifera
is represented by endothyracid and milliolids (Figure 3.13 (c)). Clasts show no obvious
imbrication but thin deformation-related lineation. The matrix may be calcarenite,
wackestone or mudstone but with very low mud content in comparison with F6. The mud
composition is mostly silt-sized quartz and calcite.

PhD Thesis | 2019
133
Interpretation: Intraclastic components of gravel-sized packstones and wackestones
represents a reworking of limestone deposits. Given the fossil assemblage of packstones
to wackestone intraclasts, these beds originated from coeval shelves or ramp slopes. The
calcarenitic matrix also shows shallow marine allogenic sources. Deposition is thought to
be by cohesion and/or intergranular frictional freezing from a high concentrated debris
flow (Payros & Pujalte 2008). The abundance of fragmented bioclasts and rounded
lothoclasts indicate likely deposition from proximal unstable gully/scarp of a carbonate
platform. Proximal carbonate platform microscopic allochems included calcareous alge
and benthonic foraminifera which are preserved in the lithoclasts.

PhD Thesis | 2019
134
Figure 3.13: Typical F7 facies showing (a) & (b) core images of sub-angular to sub-rounded clasts in mostly sandy matrix. Pencil tip in (a) used for scale. Thin section photograph (c) shows examples of foraminifera (arrow-indicated) present in lithoclasts.

PhD Thesis | 2019
135
3.4.2 Facies architecture and depositional geometries
Transects through the Viséan slope succession of Hodder Mudstone can be reconstructed
along the depositional dip (W-E) or at oblique orientations (NW-SE). Three correlation
sections are shown in Figure 3.14 (west-east orientation) and Figures 3.15 and 3.16
(northwest-southeast orientation). The west to east panel spans 3.62 km and correlates
genetic facies across a section of seven cores down the depositional dip. The two
northwest to southeast-oriented cross sections are located towards the east of the study
area and are orthogonal to west-east oriented section. These northwest-southeast-
orientated sections span 1.44 km (Figure 3.15) and 0.54 km (Figure 3.16), respectively.
They are oblique to the basin slope.
Stacking patterns and sediment fabrics display an overall fining-upward basinward
lateral deepening. They represent the transgressive to highstand stratigraphic system (cf.
Riley 1990). Within the borehole transects, facies distributions and stacking patterns are
interpreted from two sedimentary packages. The packages represent two parasequence
sets of the Hodder Mudstone (Upper) and the Clitheroe Limestone (Lower). This
stratigraphic boundary was based on the stratigraphic division and correlation of MHD
1, 3, 4, 5, 8, 11 & 18 boreholes in the Gargstang Memoir (Aitkenhead 1992). The divisions
correlate with the BB-B1 ammonoid biostratigraphic sequence boundary, which divides
the Hodder Mudstone and the Clitheroe Limestone Formations of the Craven Group
(Waters et al. 2009; Waters & Condon 2013). In the studied boreholes, the top of the
uppermost interval is correlated to the B1-B2a band (base of the Bollandoceras
hodderense beds) (Waters & Condon 2013) and serves as the datum surface. The base of
the lower interval was not reached. Due to tectonic uplift and bed erosion, the top B1-B2a
band in MHD1, 4 and 5 cores was indeterminate due to overlying weathered topsoil. For

PhD Thesis | 2019
136
clarity, these two parasequence sets are herein termed interval 1 and interval 2. Interval
1 is the lowermost of the studied succession and ranges between 30 to >50 m in thickness
except in boreholes MHD 2, 3, 4, 5, 8, 18 where it was not sampled. Interval 2 represents
the thicker upper section with thicknesses between 60 to 170 m. This facies generally
thins out towards the west of the study area.

PhD Thesis | 2019
137
Figure 3.14: Correlation of cores MHD9, MHD12, MHD5, MHD4, MHD8, MHD1 & MHD11 from the proximal (west) to distal (east) of the study area. This 3.62 km transect shows the depositional architecture of the Viséan succession in the study area. The depositional architecture shows a deepening sedimentary sequence both laterally from west to east, and vertically. Interval 1 packages are dominated by resedimented carbonates while interval 2 comprise silt- and clay-rich mudstones. The datum is taken across a regional sequence boundary (B1-B2a) band above interval 2. Notice a possible impact of calciclastic facies in interval 2 muddy deposits in MHD1 that is likely associated with deformation of planar laminated beds in MHD8 and MHD11. Reference to borehole location is shown in inset and reference for figure 3.15 and 3.16 transects. Gradation pattern is F3>F2>F1where F3 is coarser and F1 is finer due to

PhD Thesis | 2019
138
Figure 3.15: Northwest to southeast transect across boreholes MHD1, MHD18 and MHD3 in an apparent dip direction. Transect illustrates the depositional architecture of the Viséan Succession oblique to the basin slope. This section highlights the asymmetric thickening of interval 2 facies towards the southeast. There is an increased intensity in convoluted laminae towards the southeast. Location reference for boreholes is shown in Figure 3.14.

PhD Thesis | 2019
139
Figure 3.16: Transect illustrating thickening and deepening of interval 2 facies toward an apparent depocentre as seen in Figure 3.15. The intensity of soft sediment deformation also increases towards the deeper section with an apparent impact from debris flow deposits. The locations of core logs are shown in Figure 3.14.

PhD Thesis | 2019
140
3.4.2.1 Interval 1
Interval 1 is distinguished from the overlying interval 2 by the dominace of coarse-
grained (gravel- to sand-sized) calciclastic F1, F2 and F3 facies. F1 with muddy matrix is
considered finer than F3 which is composed of sandy matrix, and F2 is intermediate. An
asymmetric, normal and inverse grading is common at the bed scale. Interval 1 is
characterised by <2 to 50 m thick irregular stacked units of F1, F2 and F3 facies. Lamina-
sets vary from packstone to wackestone and mudstone with mud- and sand-rich matrix
(Figure 3.17). A few packages are capped by bioturbated F3 or F4 facies with erosive tops.
The facies assemblage of Interval 1 are generally diachronous cutting through the BB-B1
biozone into Interval 2.
On a bed scale, interval 1 exhibits a wedge-like architecture (Figures 3.15 & 3.16). Facies
thicknesses vary between cores but are generally finer and thinner downslope. Near to
the western basin margin (e.g. MHD9), the non-correlated facies may be components of
Interval 1 but a lack of bostratigraphic data in these boreholes made correlation
impractical. In most cores, the F3 facies forms isolated (up to 8m) dark to medium grey,
fine-grained sand bodies with rare bioclast fragments (figure 3.17). These sand bodies
are structureless and difficult to correlate across cores.
The lateral distribution, stacking pattern and progressive change in bioclast-sizes from
F1 and F2 facies indicate that these are likely genetically related facies. This is also shown
by similarity in muddy matrix composition and skeletal fragments of transported
shallow-water echinoderms, bivalves, gastropods and brachiopods (Figure 3.17).

PhD Thesis | 2019
141
Figure 3.17: Continuous core section showing alternation of sand- (light grey) and mud-rich (dark grey) facies of interval 1. Image constitutes facies F1, F2 and F3 distinguished by bioclast content and degree of lamination. Constituent lithologies are mainly rudstones, packstones, wackestones and mudstones. Interval 1 has a general fining upwards trend

PhD Thesis | 2019
142
3.4.2.2 Interval 2
Interval 2 overlies interval 1 and is capped by the B1-B2a sequence boundary where
defined (Figures 3.14, 3.15 & 3.16). It principally comprises the F4 and F5 facies with
basal and interbedded coarser-grain facies. Towards regions where the subcrops have
experienced significant erosion, the topsoil overlies this interval (e.g. MHD 1, 4 and 5)
(Figure 3.14). The dominant F4 and F5 facies are comprosed of clay to silt-rich mud with
limited bioclastic grains. This facies assemblage of F4 and F5 varies in thickness between
<20 (MHD 4, 5 and 12) to ~150 m (MHD 18). In general, Interval 2 is thickest towards the
basin’s east and thins out to the west. It is distinguished from interval 1 by the change in
facies from bioclastic-rich facies to fine-grained bioclastic-lean facies. A most striking
feature of the correlation is the apparent geometry of likely channel or a submarine slide
seen in MHD1 core resulting in the convolution of F6 facies in MHD8 and MHD11 cores
(Figures 3.14 & 3.15). Due to sediment gravity flow over unconsolidated sediments, the
underlying planar laminated facies were deformed convoluted and overturned.
Laminated facies are generally closely spaced with a thickness of ~40 m, but may be
separated by up to 20 m of unlaminated F5 facies (e.g. MHD 18). The lateral correlation
of individual planar and convolute laminated units were not be possible from studied ~5
cm-diameter cores. This is due to unknown core orientation along the post-Carboniferous
deformed strata as most inclined laminae may be planar- or convolute- laminated
depending on the section of borehole coring through anticlinal/synclinal structures.
Cores taken through an overturned to recumbent convoluted laminae will have a
horizontal axial plane and may appear horizontally planar in cross section. Likewise,
laminated sections through the lower limb away from the maximum inflection points may
appear sub-horizontal to horizontal. Conversely, lamninated sections will be more
inclined towards the upright fold axis of convoluted laminae.

PhD Thesis | 2019
143
Discussion
3.5.1 Carbonate turbidite facies classification
Based on depositional processes inferred from sedimentological elements described
above, facies can be grouped into three units: (1) calciturbidites, (2) densite mudstone
and (3) calcidebrites.
3.5.1.1 Calciturbidites (high- to low-density turbidites)
The calciturbidites facies classification dominates Interval 1. The term calciturbidites
have been used to describe detrital carbonate (calciclastic) deposits deposited via
turbulent flows generated from adjacent active carbonate shelves and along ramp slopes
(e.g. Payros et al. 2007; Ielpi & Cornamusini 2013; Reijmer et al. 2015). Calciturbidite
facies in this study are represented by the F1, F2 and F3 facies, and are characterised by
wavy laminations of interlaminated mud, sand and gravel (which contains skeletal
debris) (Figures 3.4, 3.5, 3.6). Occasional erosional bases may indicate turbulent flows
and erosion of apparently unconsolidated slurry substratum (e.g. Ielpi & Cornamusini
2013). The fossiliferous association and sorting of gravel- to sand-sized shell fragments
in the calciturbidites are indicative of load deposition from fully turbulent sediment-rich
flows (Lowe 1982; Plint et al. 2012; Ielpi & Cornamusini 2013). High-density turbidites
are often characterised by normal to normal-to-inverse grading (Payros & Pujalte 2008)
which was observed in the F1 facies. A reduction in lamina sizes and fluctuation in the
frequency of the erosive wavy laminations in all three facies has previously been
associated with progressive current reworking and erosion (e.g. Ielpi & Cornamusini
2013). Endobenthic colonization as seen in bioturbated F2 and F3 facies indicate reduced
sedimentation, and support the interpretation that these are the tops of turbidity flows
(Savary et al. 2004). Characteristic Chondrites ichnogenus fabric in F2 and F3 is a notable
deep-sea trace in carbonate-rich fine-grained turbidite sequences (Uchman & Wetzel

PhD Thesis | 2019
144
2012). Between long periods of successive turbidite deposition, stationary
chemosymbiotic burrowers colonized soupy substrates in dysoxic pore water conditions
producing branched traces typical of Chondrites (Figure 3.7) (Uchman & Wetzel 2011).
3.5.1.2 Densite mudstone (low energy muddy turbidites)
Densite mudstones include deposits of low density cohesive muddy turbidites, mostly
comprising clay flocs and silt grains (sensu Talling et al. 2012). Within the study area, the
F4 and F5 facies are identified components of densite mudstone. Low-density turbidites
are characterised by laminated, fine-grained calcilutite commonly interbedded with
hemipelagic deposits (Payros & Pujalte 2008). Carbonate-silt laminae with characteristic
internal ripples and erosive to non-erosive bases are interpreted to have resulted from
the load deposition of the diluted turbidity currents. Silt/clay couplets are indicative of
the alternation of turbidity flow tails and pelagic sedimentation (Ielpi & Cornamusini
2013). Erosional surfaces with scouring reliefs (Figure 3.10) on most laminae represent
the erosion of sediments by tractional currents mostly below the storm wave base (e.g.
Borcovsky et al. 2017). Tectonic stress increasingly following sediment deposition
resulted in the deformation of parallel planar laminae (Gawthorpe & Clemmey 1985). Soft
sediment deformation could be triggered by any event which causes subaqueous
translational debris flow of unconsolidated or semi-consolidated units. These may be
slump folds associated with mass transport deposits (Shanmugam 2017), the progressive
deformation of detached semi-consolidated slide moving downslope (Cook & Mullins
1983) or from seismically (earthquake and tsunamis) deformed basin plain deposits
(Alsop & Marco 2011; Alsop & Marco 2012; Daigle et al. 2013; Basilone et al. 2016;
Basilone 2017).

PhD Thesis | 2019
145
3.5.1.3 Calcidebrite (debris flow deposits)
Calcidebrites are massive, structureless, coarse-grained carbonate debris flow deposits
characterised by poorly sorted, chaotically arranged bioclast-rich units of mud and sand
matrix (e.g. Reijmer et al. 2015). Two facies (F6 and F7) distinguished by their matrix are
distinctive of calcidebrite facies. They may contain muddy matrix as in the case of F6
facies or calcarenitic matrix typical of F7 facies. They are deposited by intergranular
frictional freezing of clast-supported or matrix supported debris flow (Payros & Pujalte
2008). F6 exhibits a high (>30%) mud matrix content with gravel-sized clasts. The less
cohesive F7 has a calcarenitic matrix (20-30% mud matrix) and contain larger brecciated
limestone intraclasts and bioclasts of similar composition with F6 (Figures 3.12 & 3.13).
Mud content enabled cohesive conditions in both facies and was able to transport large
(up to 5 cm) bioclastic limestone intraclasts and disseminated skeletal grains. Both F6
and F7 facies lack grain-segregation and are matrix-supported, indicative of cohesive
freezing in a non-turbulent (laminar) flow (Lowe 1982; Shanmugam 2000).
3.5.2 Depositional setting
Studies on the depositional setting of the Bowland Basin have identified a carbonate
ramp-to-slope depositional setting during the Viséan (e.g. Gawthorpe 1986; R. L.
Gawthorpe 1987; Newport et al. 2017). No clear distinction is made as to what
depositional system controlled sedimentation on the slope. The existing conceptual
models made no reference or argument in presenting a case for either a carbonate apron
sediment deposition (Mullins & Cook 1986; Stow & Mayall 2000) or a calciclastic
submarine fan sediment deposition (Payros & Pujalte 2008). Submarine fans are
distinctive constructional sea floor features that developes seawards from a single source
such as canyon, gully or a trough along the base-of-slope (Payros and Pujalte 2008). A
carbonate apron, however, is characterised by sediment gravity flow produced by linear

PhD Thesis | 2019
146
mass wasting failures which moves downslope until “frozen” on a flat area (e.g. base-of-
slope) or a topographic obstacle along slope (Mullins & Cook 1986; Payros and Pujalte
2008). Due to the common usage of the slope apron and base-of-slope apron models in
describing calciclastic slope systems (Payros & Pujalte 2008), it is likely that the previous
descriptions of the Bowland Basin Viséan slope facies were made assuming one or both
of the carbonate apron systems. The model of a classic calciclastic fan model seems to
adequately fit the observed sedimentological features and the sedimentary architecture
presented in this study. One argument for this interpretation is that calciclastic
submarine fan systems are generally characterised by the presence of high-and low-
density turbidites, muddy- and hyper-concentrated debris flow deposits and low energy
hemipelagic sediments (Payros & Pujalte 2008). Secondly, low-density turbidites are
relatively abundant and there is a paucity of high-density turbidites (e.g. Ielpi &
Cornamusini 2013). Finally, the carbonate-slope environment during the deposition of
the Viséan sediments in the Bowland Basin is interpreted to have a gently-dipping slope
(Gawthorpe 1986; R. L. Gawthorpe 1987). The low angles of distally steepened carbonate
ramps (generally <5°) are fundamental to the formation of calciclastic submarine fans as
higher angle slopes would result in the formation of slope aprons (Payros & Pujalte
2008). For example, in steep slopes as common in apron deposits, off rimmed-shelves
gullies do not merge downwards into channels and gravity flows tend to deposit their
sediment linearly at any point of the base of the slope (payros & Pujalte 2008). Deposits
of calciclastic submarine fans are distinguished by several sedimentary components
(Mutti & Ricci Lucchi 1972; Payros et al. 2007; Payros & Pujalte 2008; Reijmer et al.
2015). They are mostly made up of calciturbidites and debrites fed by single or multiple
point-sourced feeder channels (Payros & Pujalte 2008). The recognition of the main
facies assemblages in the study area and their relative lateral and vertical positions are

PhD Thesis | 2019
147
typical of environments within a calciclastic submarine fan systems (Figure 3.18).
Between the proximal carbonate platform edge and the basin plain in a calciclastic
submarine fan systems, three major depositional environments exist: (i) the inner/upper
fan, (ii) the middle fan and (iii) the outer/lower fan (Figure 3.18). The succeeding
discussions evaluate the sedimentary environments within the proposed calciclastic
submarine fan system of the Viséan Bowland Basin facies.
3.5.2.1 Submarine floor fan setting
High- to low-density turbidites as discussed in the preceding section are represented by
the F1 – F3 facies calciclastic sequences. Calciturbidite facies can be found in all three
depositional environments of the fan system and may be deposited during lowstand to
highstand platform shedding through slope tributary gullies and channels (Betzler et al.
1999; Payros & Pujalte 2008; Ielpi & Cornamusini 2013). Lowstand turbidites are
characterised by the mixture of shallow water skeletal components and pelagic
componenets while highlstand turbidites are more laterally extensive dominated by
shallow water skeletal debris (Beltzer et al. 2000). Within the study area, facies present
deposits of a lowstand to highstand event which correlate with the late Chadian to early
Arundian rifting and basinal extension (Gawthorpe 1987). The mixture of shallow water
echinoderm fragments (e.g. crinoids) and pelagic sediments (e.g. calcareous algae) in
calciturbidite facies and the calcidebrites are indicative of lowstand systems. In most
cases, sediments are dominated by periplatform skeletal debris while pelagic
components are rare.
The boreholes of this study show an increase of muddy matrix in calcituburditie facies
towards the southeast of the study area (Figure 3.14). Mostly characterised by fining-
thing upwards sequence of high- to low-density turbidites. These deposits show a
textural trend of a basinward deepening of facies along the apparent depositional dip.

PhD Thesis | 2019
148
Leeder and Gawthorpe (1987) suggested a distally steepened ramp slope profile for the
Bowland Basin which are known to enhance the formation of slope tributary gullies and
the subsequent formation of slope feeder systems in calciclastic fan systems (Payros &
Pujalte 2008; Tournadour et al. 2017). Although such sedimentary profile could not be
established in this study, the slopeward decrease in thickness and generally finning-
upward Interval 1 packages recognised in the studied succession is typical of slope feeder
channels deposits (e.g. Savary 2005; Vigorito et al. 2006; Payros et al. 2007). Slumps,
debrites and high-density turbidites are typical of channelized feeder system in mud-rich
calciclastic fan systems (Patros & Pujalte 2008). Feeder channels are located in inner- and
mid-fan environments (Figure 3.18) and are characterised by leveed channels and
braided channel axis (Vigorito et al. 2005; Vigorito et al. 2006; Payros et al. 2007; Payros
& Pujalte 2008). The intercalation of debrites and sand-rich high-density turbidites as
observed in MHD 9, 12, 5, 4 and 11 are typical of coarse-grained facies found along the
channel axis of feeder channels (e.g. Ielpi & Cornamusini 2013; Payros & Pujalte 2008).
The high-density finer-grained turbidites with muddy matrix were likely deposited along
the marginal levees (e.g. Ielpi & Cornamusini 2013).
Muddy facies (F4 and F5) of interval 2 generally indicate low-energy, deep-marine
conditions. Texturally, these deposits range from unlaminated to planar-laminated beds.
The interaction of the calciclastic and hemipelagic deposits in muddy F4 and F5 facies
indicate the interaction of turbidity fan and pelagic sedimentation within the peripheral
fan fringe in deeper waters (e.g. Payros et al. 2007; Ielpi & Cornamusini 2013).
Sedimentation within this environment is characterised by low-density turbidites
interbedded with basin plain deposits (Payros & Pujalte 2008). This depositional setting
suggests a basin plain intersected by the distal influence of turbidity flows. The
occurrence of randomly intercalated F6 and F7 facies in both intervals points to the

PhD Thesis | 2019
149
occasional impact of sediment slides and slumps during deposition (Figure 3.19). These
events may also be responsible for soft-sediment deformation of F5 facies as studied by
Gawthorpe and Clemmey (1985) (Figure 3.19). Such events beds were not restricted to a
particular region of the submarine fan system. Additionally, the Bowland Basin was
bounded to the southeast by a steeply-dipping footwall (Figure 3.2) margin which may
influence soft-sediment deformation (Figure 3.20).
The sedimentary elements and architecture of the described facies, present similar facies
variation comparable to that of a medium-grained, medium-sized calciclastic submarine
fan model (Payros & Pujalte 2008). The submarine model for the studied succession is
classified herein as a multiple-source, lateral-feeding submarine fan system.
Figure 3.18: Schematic illustration of major depositional environments existing in a muddy calciclastic submarine fan system with multiple sediment sources. Illustration is adapted from Mud-rich multiple source ramp model of Stow & Mayall (2000) and the calciclastic model of Payros & Pujalte (2008). Mud–rich fan models are characterised by extensive sheets.

PhD Thesis | 2019
150
Figure 3.19: Models (not drawn to scale) for soft sediment deformation within the basin as adapted from Gawthorpe & Clemmey (1985). Model (a) is a typical pervasive deformation of slide sheets; (b) Deformation concentrated on glide planes; (c) concentrated deformation in lower part of slide. The F5, F6 and F7 facies seen in interval 2 are most likely associated with soft sediment deformation.

PhD Thesis | 2019
151
3.5.2.2 Depositional Model
The depositional setting of the studied Viséan Bowland succession was influenced by a
combination of several factors: (1) extensional basin tectonics which tilted fault blocks
and controlled sediment transport, deposition, erosion and episodic remobilization of
sediments; (2) sea-level rise and drowning of carbonate platform; (3) high rates of
sediment production and transport from shallow marine carbonates.
Studies show that a carbonate slope, deepening towards a south-eastern basin-margin
fault developed during the Late Tournaisian (R. L. Gawthorpe 1987). An isometric,
southeast distally steepened slope bounded at the southeast edge by a footwall scarp was
a resultant effect of this basinal extension (Figure 3.20). Depositional architecture
observed from west-east transect (Figure 3.14) indicates a low-angle, gently-dipping
slope with southerly directed density flow deposition. The observed high rates of coarse-
grained calciclastic accumulations are typical of distally steepened carbonate ramp-
slopes (Burchette & Wright 1992; Pomar et al. 2004). Calciclastic slope sedimentary
accumulations are easily built close to the slope break due to the efficient transport of
outer ramp sediments via sediment gravity flows along the slope (Payros & Pujalte 2008;
Mulder et al. 2017). Downslope funnelling of sediments is also known to be enhanced in
areas of tectonically-controlled seafloor topography (Payros & Pujalte 2008).
The footwall-to-hanging wall basin margin located to the distal southeast of the basin was
also characterised by gravity flow deposition from slumps, debris flows and submarine
fans from the steep-sloped footwall escarpment (Figure 3.20) (Leeder & Gawthorpe
1987; R. L. Gawthorpe 1987). The location of the study area may have been affected by
the footwall scarp deposition. However, the extent of these footwall-derived sediments
and their interaction with the described facies could not be determined in this study.

PhD Thesis | 2019
152
The deposition of interval 1 with abundant shallow water allochems indicates allogenic
sediment deposition which is the product of sea-level low-stand deposits. The shedding
and redeposition of calciturbidites along distally steepened ramp are mainly regarded as
the response to low sea-level (e.g. Betzler et al. 1999; Reijmer et al. 2015). With a
progressive rise in sea-level, the erosion of shallow water carbonate debris is reduced
and turbidite shedding is suppressed (Reijmer et al. 2015). This is indicated in the studied
succession by the transition from Interval 1 to Interval 2. Grain-rich (bioclastic)
accumulations are dominant features of calciclastic submarine fans and sediments are
transported to the slope though sediment gravity flows (Payros & Pujalte 2008). Previous
studies on the Bowland Basin and early Carboniferous carbonate platforms reveal
shelves dominated by crinoid banks and Waulsortian mounds (Gawthorpe 1986; Wright
& Faulkner 1990; Wright 1994; Kammer & Ausich 2007). The fragmented and abraded
grain components are evidence of sediment shedding from a proximal shelf to slope.
Erosion of platform shelves results in the downslope transport of calcareous debris (e.g.
Loucks & Ruppel 2007). Alternating wavy laminations consisting of fragmented skeletal
debris and fine- to medium-mud, indicates mud-rich environment with intermittent,
high-energy resedimentation events (e.g. Plint et al. 2012; Abadi et al. 2015; Reijmer et
al. 2015). The distribution of gravel- to sand-sized grains and grain imbrication within
calciturbidites of interval 1 (Figures 3.4, 3.5 & 3.6) are products of rapid deposition of
bed load and suspension settling of grains in the depocentre (Bhattacharya et al. 2014;
Bohacs et al. 2014). Also associated with wavy-laminated facies are bioturbated lamina-
sets dominated by Chondrites ichnofabric (Figure 3.7). Sediment substrate was hence
sufficiently fluidized (70 – 75%) to enable traces typical of “sediment swimmers”
(Schieber 2003). These traces are also considered to be pre-lithification burrows
indicative of escape activity (Uchman & Wetzel 2011) and irregular periods of slow, low-
PhD Thesis | 2019
153
energy sedimentation between high energy depositional events (Schieber 1999). The
high mud content of the facies is likely to be attributed to high fallout rates and/or high
influx of terrigenous mud. The occurrence of both calciclastic and siliciclastic components
is equally suggestive of mixed terrigenous feeding system depositing largely muddy
sediments.
The densite mudstones of interval 2 comprise a mix of bed-sets with thick-bedded mud
containing planar to convoluted laminations (Figure 3.11). Fluid mud processes
prevailed as turbulence dampened depositing thick mud sequences. The action of
submarine traction currents resulted in planar, parallel laminations with internal cross
ripples (Figure 3.10) typical of tractional sediment reworking (e.g. Ielpi & Cornamusini
2013). Calcareous silt-rich lenticular structures and the imbrication of clay minerals
within laminae of F5 reinforces the evidence of sub-aqueous erosion in water-rich muddy
sediments (Schieber et al. 2010; Kase et al. 2016). Micro-pelagic remains of sponge and
radiolarian tests show evidence of hemipelagic settling. The interval 2 facies package
thickens downslope (Figure 3.14, 3.15 & 3.16) illustrating the textural transformation
from underlying wavy-laminated, coarse-grained fabric to unlaminated and parallel,
planar-laminated mudstone fabric.
Calcidebrite facies are deposits of short-lived sediment slump events. The occurrences of
F6 and F7 facies at varied intervals may suggest periods of highly mobile muddy to hyper-
concentrated debris flow events that deposited the coarse-grained F6 facies within a
mud-rich matrix. Submarine slide deformation may like be associated with calcidebrite
flow as observed in Figure 3.19. Although characterised by a gently-dipping slope, fault-
controlled instability allowed for slope destabilization and soft sediment deformation.

PhD Thesis | 2019
154
The proximity of a depocentre to the adjacent footwall margin is likely to have influenced
debrite deposition.
Due to the synsedimentary tectonic influence on basin physiography, a multiple (point)
source complex fan system may have developed within the Bowland Basin. It is proposed
in this study that a multiple source ramp (Stow & Mayall 2000) with frequent fault-
controlled physiography influenced the formation and deposition of channelized
submarine fan complex (Figure 3.20). The lateral distribution of facies also indicates an
asymmetric areal distribution pattern of the Viséan Succession as highlighted by
Gawthorpe (1987).

PhD Thesis | 2019
155
Figure 3.20: (a) Sketch map of Bowland Basin during regional erosion in the Early Visean from Riley (1990) with study area located in green spot. (b) Graphic reconstruction of the main depositional environments and possible processes responsible for the facies of the studied Bowland Basin Viséan succession. Deposition was tectonically controlled with influx from biogenic and terrigenous sediments deposited along slope and basin plain. Calciturbitic flows were responsible for the deposition of calciclastic sediments along channel and levee

PhD Thesis | 2019
156
complexes and floor fans. Hemipelagic fallout and mud-rich turbidite cloud produced muddy deposits across the depositional environment. Slope failures resulted in debris flows and soft sediment deformation
Conclusion
This study has highlighted distinct facies and sedimentary features typical of submarine
gravity flow deposits. These facies are grouped into three carbonate turbidite members,
namely: calciturbidites, densite mudstone and calcidebrite. The calciturbidites and
caclcidebrites represent calciclastic deposits comprising mainly of bioclasts and
lithoclasts set in a muddy to a sandy matrix. Bioclast compositions are mostly shallow
water fauna and range in size from fine sand to pebble. They include fragmented tests of
organisms of shallow water origin including echinoderm (mainly crinoids), mollusc,
brachiopod, benthic foraminifera (endothyracid, nummulitids and milliolids), bryozoans,
corals and calcareous algae. Lithoclasts are however made of packstone and wackestone
granules also of shallow water origin. Densite mudstones include deposits of waning, tail-
end of turbulence and hemipelagic fallouts. Laminated sections within the densite
mudstone show evidence of soft sediment deformation of gravity flow deposits.
The evidence for a calciclastic submarine fan depositional systems for the studied facies
is supported by the presence of (i) facies architectural elements typical of calciclastic
floor fan setting; (ii) sediment interruption of siliciclastic to calciclastic channel-like sand
facies during mud deposition; (iii) calciclastic and siliciclastic components suggestive of
mixed terrigenous and upper carbonate slope tributary channel feeding system. The
described sedimentary architecture presents a medium-sized, syndepositional tectonic-
controlled submarine fan complex.
Facies were largely deposited along a distally steepened ramp slope (mid-to-outer fan
setting) to basin plain environments. Basin physiography was controlled by
synsedimentary tectonics and may have resulted in an asymmetric depositional sequence
PhD Thesis | 2019
157
of high- to low-density turbidites and event debris flow beds. Mud-rich high- to low-
density turbidites (i.e. high-efficiency turbidity currents deposits) were invariably
overlain by basin plain sediments.
This study has presented additional data for the evidence of ancient carbonate submarine
fan systems within the Carboniferous back-arc basins on central Britain. It has also
documented the distribution and variation of a calciclastic and muddy turbidite facies
sequence from the interaction of sea-level variations and extensional tectonics on a
distally steepened carbonate ramp.
References
Abadi, M.S. et al., 2015. Lower Carboniferous ramp sedimentation of the Central Alborz
Basin, northern Iran: integrated sedimentological and rock–magnetic studies.
Geological Society, London, Special Publications, 414.
Aitkenhead, N. et al., 1992. Geology of the Country around Garstang. British Geological
Survey Memoir for 1:50000 geological sheet 67 (England and Wales).
Alsop, G.I. & Marco, S., 2011. Soft-sediment deformation within seismogenic slumps of
the Dead Sea Basin. Journal of Structural Geology, 33(4), pp.433–457.
Alsop, G.I. & Marco, S., 2012. Tsunami and seiche-triggered deformation within offshore
sediments. Sedimentary Geology, 261–262, pp.90–107.
Amy, L.A. et al., 2006. An experimental investigation of sand–mud suspension settling
behaviour: implications for bimodal mud contents of submarine flow deposits.
Sedimentology, 53(6), pp.1411–1434.
Andrews, I.J., 2013. The Carboniferous Bowland Shale gas study: geology and resource
estimation. British Geological Survey for Department of Energy and Climate
Change, London, UK.
Arthurton, R.S., 1984. The Ribblesdale fold belt, NW England—a Dinantian-early
Namurian dextral shear zone. Geological Society, London, Special Publications,
14(1), p.131 LP-138.
Baas, J.H. et al., 2009. A Phase Diagram for Turbulent, Transitional, and Laminar Clay
Suspension Flows. Journal of Sedimentary Research, 79(4), pp.162–183.
Baas, J.H. & Best, J.L., 2002. Turbulence Modulation in Clay-Rich Sediment-Laden Flows
and Some Implications for Sediment Deposition. Journal of Sedimentary Research,
72(3), pp.336–340.

PhD Thesis | 2019
158
Basilone, L., 2017. Seismogenic rotational slumps and translational glides in pelagic
deep-water carbonates. Upper Tithonian-Berriasian of Southern Tethyan margin
(W Sicily, Italy). Sedimentary Geology, 356, pp.1–14.
Basilone, L., Sulli, A. & Gasparo Morticelli, M., 2016. The relationships between soft-
sediment deformation structures and synsedimentary extensional tectonics in
Upper Triassic deep-water carbonate succession (Southern Tethyan rifted
continental margin — Central Sicily). Sedimentary Geology, 344, pp.310–322.
Betzler, C. et al., 1999. Sedimentary patterns and geometries of the Bahamian outer
carbonate ramp (Miocene-Lower Pliocene, Great Bahama Bank). Sedimentology,
46(6), pp.1127–1143.
Bhattacharya, J.P. et al., 2014. Bedload Transport of Mud across a Wide, Storm-
Influenced Ramp: Cenomanian-Turonian Kaskapau Formation, Western Canada
Foreland Basin--Discussion. Journal of Sedimentary Research, 83(12), pp.1198–
1199.
Bhattacharya, J.P. & MacEachern, J.A., 2009. Hyperpycnal Rivers and Prodeltaic Shelves
in the Cretaceous Seaway of North America. Journal of Sedimentary Research,
79(4), pp.184–209.
Bohacs, K.M., Lazar, O.R. & Demko, T.M., 2014. Parasequence types in shelfal mudstone
strata-Quantitative observations of lithofacies and stacking patterns, and
conceptual link to modern depositional regimes. Geology, 42(2), pp.131–134.
Borcovsky, D. et al., 2017. Sedimentology, facies architecture, and sequence stratigraphy
of a Mississippian black mudstone succession-The upper member of the Bakken
Formation, North Dakota, United States. AAPG Bulletin, 101(10).
Braunstein, J., 1961. Calciclastic and siliciclastic. AAPG Bulletin, 45(12), p.2017.
Burchette, T.P. & Wright, V.P., 1992. Carbonate ramp depositional systems. Sedimentary
Geology, 79(1–4), pp.3–57.
Chabaud, L. et al., 2016. Sedimentary processes determining the modern carbonate
periplatform drift of Little Bahama Bank. Marine Geology, 378, pp.213–229.
Available at: http://dx.doi.org/10.1016/j.margeo.2015.11.006.
Clarke, H. et al., 2018. Shale gas resources of the Bowland Basin, NW England: a holistic
study. Petroleum Geoscience, 066(Bushell 1986).
Clarke, H., Turner, P. & Bustin, R.M., 2014. Unlocking the resource potential of the
Bowland Basin, NW England. Society of Petroleum Engineers - European
Unconventional Resources Conference and Exhibition 2014: Unlocking European
Potential, 2(February), pp.25–27.
Cook, H.E. & Mullins, H.T., 1983. Basin Margin Environment. In P. A. Scholle, D. G.
Bebout, & C. M. Moore, eds. Carbonate Depositinal Environments. AAPG Memoir,
pp. 540–617.

PhD Thesis | 2019
159
Courjault, T. et al., 2011. Detailed anatomy of a deep-water carbonate breccia lobe
(Upper Jurassic, French subalpine basin). Sedimentary Geology, 238(1–2), pp.156–
171.
Daigle, H. et al., 2013. Widespread deformation of basin-plain sediments in Aysén fjord
(chile) due to impact by earthquake-triggered, onshore-generated mass
movements. Marine Geology, 337(October), pp.67–79.
Dean, M.T. et al., 2011. A lithostratigraphical framework for the Carboniferous
successions of northern Great Britain (onshore). British Geological Survey
Research Report RR/09/01, p.174.
Dunham, R.J., 1962. Classification of carbonate rocks according to depositional texture
W. E. Hamm, ed. Classification of Carbonate Rocks, pp.108–121.
Eberli, G.P. et al., 2004. Carbonate Platform to Basin Transitions on Seismic Data and in
Outcrops: Great Bahama Bank and the Maiella Platform Margin, Italy. Seismic
Imaging of Carbonate Reservoirs and Systems: AAPG Memoir 81, pp.207–250.
Embry III, A.F. & Klovan, J.E., 1971. A late Devonian reef tract on northeastern Banks
Island, NWT. Bulletin of Canadian Petroleum Geology, 19(4), pp.730–781.
Emmings, J.F. et al., 2017. Stream and slope weathering effects on organic-rich
mudstone geochemistry and implications for hydrocarbon source rock
assessment: A Bowland Shale case study. Chemical Geology, 471(February),
pp.74–91.
Ferry, S. et al., 2015. The base-of-slope carbonate breccia system of Céüse (Tithonian, S-
E France): Occurrence of progradational stratification in the head plug of coarse
granular flow deposits. Sedimentary Geology, 317, pp.71–86.
Fraser, A.J. & Gawthorpe, R.L., 1990. Tectono-stratigraphic development and
hydrocarbon habitat of the Carboniferous in northern England. Geological Society,
London, Special Publications, 55(1), pp.49–86.
Gawthorpe, R.L., 1986. Sedimentation during carbonate ramp-to-slope evolution in a
tectonically active area: Bowland Basin (Dinantian), northern England.
Sedimentology, 33, pp.185–206.
Gawthorpe, R.L., 1987. Tectono-sedimentary evolution of the Bowland Basin, northern
England, during the Dinantian. Journal of the Geological Society London, 144,
pp.59–71.
Gawthorpe, R.L. & Clemmey, H., 1985. Geometry of submarine slides in the Bowland
Basin (Dinantian) and their relation to debris flows. Journal of the Geological
Society, 142(3), pp.555–565.
Grosheny, D., Ferry, S. & Courjault, T., 2015. Progradational patterns at the head of
single units of base-of-slope, submarine granular flow deposits (“Conglomérats
des Gas”, Coniacian, SE France). Sedimentary Geology, 317, pp.102–115.

PhD Thesis | 2019
160
Gross, D. et al., 2015. Organic geochemistry of Mississippian shales (Bowland Shale
Formation) in central Britain: Implications for depositional environment, source
rock and gas shale potential. Marine and Petroleum Geology, 59, pp.1–21.
Haszeldine, R.S., 1984. Carboniferous North Atlantic palaeogeography: stratigraphic
evidence for rifting, not megashear or subduction. Geological Magazine, 121(5),
pp.443–463.
Herbig, H.G. & Bender, P., 1992. A eustatically driven calciturbidite sequence from the
Dinantian II of the Eastern Rheinisches Schiefergebirge. Facies, 27(1), pp.245–261.
Ichaso, A.A. & Dalrymple, R.W., 2009. Tide- and wave-generated fluid mud deposits in
the Tilje Formation (Jurassic), offshore Norway. Geology, 37(6), pp.539–542.
Ielpi, A. & Cornamusini, G., 2013. An outer ramp to basin plain transect: interacting
pelagic and calciturbidite deposition in the Eocene-Oligocene of the Tuscan
domain, Adria Microplate (Italy). Sedimentary Geology, 294, pp.83–104.
Kammer, T.W. & Ausich, W.I., 2007. New cladid and flexible crinoids from the
Mississippian (Tournaisian, Ivorian) of England and Wales. Palaeontology, 50(5),
pp.1039–1050.
Kase, Y. et al., 2016. The use of microstructures for discriminating turbiditic and
hemipelagic muds and mudstones. Sedimentology.
Lazar, O.R. et al., 2015. Capturing key attributes of fine-grained sedimentary rocks in
outcrops, cores, and thin sections; nomenclature and description guidelines.
Journal of Sedimentary Research, 85(3), pp.230–246.
Leeder, M.R., 1988. Recent developments in Carboniferous geology: a critical review
with implications for the British Isles and NW Europe. Proceedings of the
Geologists’ Association, 99, pp.73–100.
Leeder, M.R., 1982. Upper Palaeozoic basins of the British Isles-Caledonide inheritance
versus Hercynian plate margin processes. Journal of the Geological Society,
London, 139(1980), pp.479–491.
Leeder, M.R. & Gawthorpe, R.L., 1987. Sedimentary models for extensional tilt-
block/half-graben basins. Geological Society, London, Special Publications, 28(1),
pp.139–152.
Liang, C. et al., 2016. Deep-water depositional mechanisms and significance for
unconventional hydrocarbon exploration: A case study from the lower Silurian
Longmaxi shale in the southeastern Sichuan Basin. AAPG Bulletin, 100(05),
pp.773–794. 002.
Lobza, V. & Schieber, J., 1999. Biogenic sedimentary structures produced by worms in
soupy, soft muds: observations from the Chattanooga Shale (Upper Devonian) and
Experiments. Journal of Sedimentary Research1, 69(5), pp.1041–1049.

PhD Thesis | 2019
161
Loucks, R.G. & Ruppel, S.C., 2007. Mississippian Barnett Shale: Lithofacies and
depositional setting of a deep-water shale-gas succession in the Fort Worth Basin,
Texas. AAPG Bulletin, 91(4), pp.579–601.
Lowe, D.R., 1982. Sediment gravity flows: II Depositional models with special reference
to the deposits of high-density turbidity currents. Journal of Sedimentary Reseach,
52(1).
Macquaker, J.H.S. & Adams, A.E., 2003. Maximizing Information from Fine-Grained
Sedimentary Rocks: An Inclusive Nomenclature for Mudstones. Journal of
Sedimentary Research.
McCave, I.N., 1969. Deposition of fine-grained sediments from tidal currents. Nature,
London, 224, pp.1288–1289.
McCave, I.N. & Jones, K.P.N., 1988. Deposition of ungraded muds from high-density non-
turbulent turbidity currents. Nature, 333, pp.250–252.
Mulder, T. et al., 2017. Carbonate slope morphology revealing sediment transfer from
bank-to-slope (Little Bahama Bank, Bahamas). Marine and Petroleum Geology, 83,
pp.26–34.
Mulder, T. & Etienne, S., 2010. Lobes in deep-sea turbidite systems: State of the art.
Sedimentary Geology, 229(3), pp.75–80.
Mullen, J., 2010. Petrophysical Characterization of the Eagle Ford Shale in South Texas.
Canadian Unconventional Resources & International Petroleum Conference held in
Calgary, (October), pp.19–21.
Mullins, H.T. & Cook, H.E., 1986. Carbonate apron models: Alternatives to the submarine
fan model for paleoenvironmental analysis and hydrocarbon exploration.
Sedimentary Geology, 48(1–2), pp.37–79.
Mutti, E. & Ricci Lucchi, F., 1972. Le torbiditi dell’Appennino Settentrionale:
Introduzione all’analisi di facies: Memoria Società Geologica Italiana, v. 11.
Neuzil, C.E., 2013. Can Shale Safely Host U . S . Nuclear Waste ? , 94(30).
Newport, S.M. et al., 2017. Sedimentology and microfacies of a mud-rich slope
succession: in the Carboniferous Bowland Basin, NW England (UK). Journal of the
Geological Society, London, (Gawthorpe 1987), p.16pp.
Normark, W.R., 1970. Growth patterns of deep- sea fans. American Association of
Petroleum Geologists Bulletin, 54(11), pp.2170–2195.
Payros, A. & Pujalte, V., 2008. Calciclastic submarine fans: An integrated overview.
Earth-Science Reviews, 86(1–4), pp.203–246.
Payros, A., Pujalte, V. & Orue-etxebarria, X., 2007. A point-sourced calciclastic submarine
fan complex (Eocene Anotz Formation, western Pyrenees): Facies architecture,
evolution and controlling factors. Sedimentology, 54(1), pp.137–168.

PhD Thesis | 2019
162
Plint, A.G., Macquaker, J.H.S. & Varban, B.L., 2012. Bedload Transport of Mud across A
Wide, Storm-Influenced Ramp: Cenomanian–Turonian Kaskapau Formation,
Western Canada Foreland Basin. Journal of Sedimentary Research , 82(11),
pp.801–822.
Pomar, L., 2001. Types of carbonate platforms: a genetic approach. Basin Research,
13(3), pp.313–334.
Pomar, L., Brandano, M. & Westphal, H., 2004. Environmental factors influencing
skeletal grain sediment associations: a critical review of Miocene examples from
the western Mediterranean. Sedimentology, 51(3), pp.627–651.
Principaud, M. et al., 2018. Recent morphology and sedimentary processes along the
western slope of Great Bahama Bank (Bahamas). Sedimentology, 65(6), pp.2088–
2116.
Reijmer, J.J. et al., 2002. Bahamian carbonate platform development in response to sea-
level changes and the closure of the Isthmus of Panama. International Journal of
Earth Sciences, 91(3), pp.482–489.
Reijmer, J.J.G. et al., 2015. Calciturbidites and calcidebrites: Sea-level variations or
tectonic processes? Sedimentary Geology, 317, pp.53–70.
Riley, N.J., 1993. Dinantian (Lower Carboniferous) biostratigraphy and
chronostratigraphy in the British Isles. Journal of the Geological Society London,
150(3), pp.427–446.
Riley, N.J., 1990. Stratigraphy of the Worston Shale Group (Dinantian), Craven Basin,
north-west England. Proceedings of the Yorkshire Geological Society, 48(2),
pp.163–187.
Savary, B., 2005. Calcareous turbidity current emplacement as an initiation mechanism
for substrate brecciation and deformation. Geological Society, London, Special
Publications, 244(1), pp.207–220.
Savary, B. & Ferry, S., 2004. Geometry and petrophysical parameters of a calcarenitic
turbidite lobe (Barremian-Aptian, Pas-de-la-Cluse, France). Sedimentary Geology,
168(3–4), pp.281–304.
Savary, B., Olivero, D. & Gaillard, C., 2004. Calciturbidite dynamics and endobenthic
colonisation: Example from a late Barremian (Early Cretaceous) succession in
southeastern France. Palaeogeography, Palaeoclimatology, Palaeoecology, 211(3–
4), pp.221–239.
Saxena, C.B.M.P.S., 2000. Carbonate shedding and sedimentary cyclicities of a
distally.pdf. , pp.140–153.
Schepers, K.C. et al., 2009. Reservoir Modeling and Simulation of the Devonian Gas Shale
of Eastern Kentucky for Enhanced Gas Recovery and CO 2 Storage. SPE Journal,
pp.10–11.

PhD Thesis | 2019
163
Schieber, J., 1999. Distribution and deposition of mudstone facies in the Upper Devonian
Sonyea Group of New York. Journal of Sedimentary Research, 69(4), pp.909–925.
Schieber, J., 2011. Reverse engineering mother nature - Shale sedimentology from an
experimental perspective. Sedimentary Geology, 238(1–2), pp.1–22.
Schieber, J., 2003. Simple Gifts and Buried Treasures – Implications of Finding
Bioturbation and Erosion Surfaces in Black Shales. The Sedimentary Record, 1(2),
pp.4–9.
Schieber, J., Southard, J. & Thaisen, K., 2007. Accretion of mudstone beds from migrating
floccule ripples. Science, 318, pp.1760–1763.
Schieber, J., Southard, J.B. & Schimmelmann, A., 2010. Lenticular Shale Fabrics Resulting
from Intermittent Erosion of Water-Rich Muds--Interpreting the Rock Record in
the Light of Recent Flume Experiments. Journal of Sedimentary Research, 80(1),
pp.119–128.
Shanmugam, G., 2000. 50 Years of the Turbidite Paradigm (1950S-1990S): Deep Water
Processes and Facies Models - a Critical Perspective. Mar. Pet. Geol., 17(2), pp.285–
342.
Shanmugam, G., 2017. Global case studies of soft-sediment deformation structures
(SSDS): Definitions, classifications, advances, origins, and problems. Journal of
Palaeogeography, 6(4), pp.251–320.
Shanmugam, G., 1997. The Bouma sequence and the turbidite mind set. Earth-Science
Reviews, 42(4), pp.201–229.
Stow, D.A. V. & Piper, D.J.W., 1984. Deep-water fine-grained sediments: facies models.
Geological Society, London, Special Publications, 15(1), pp.611–646.
Stow, D.A. V & Mayall, M., 2000. Deep-water sedimentary systems: new models for the
21st century. Marine and Petroleum Geology, 17(2), pp.125–135.
Stow, D.A. V & Shanmugam, G., 1980. Sequence of structures in fine-grained turbidites:
Comparison of recent deep-sea and ancient flysch sediments. Sedimentary
Geology, 25(1–2), pp.23–42.
Sumner, E.J., Talling, P.J. & Amy, L.A., 2009. Deposits of flows transitional between
turbidity current and debris flow. Geology, 37(11), pp.991–994.
Talling, P.J. et al., 2012. Subaqueous sediment density flows: Depositional processes and
deposit types. Sedimentology, 59(7), pp.1937–2003.
Tournadour, E. et al., 2015. Origin and architecture of a Mass Transport Complex on the
northwest slope of Little Bahama Bank (Bahamas): Relations between off-bank
transport, bottom current sedimentation and submarine landslides. Sedimentary
Geology, 317, pp.9–26.
PhD Thesis | 2019
164
Tournadour, E. et al., 2017. Submarine canyon morphologies and evolution in modern
carbonate settings: The northern slope of Little Bahama Bank, Bahamas. Marine
Geology, 391(July), pp.76–97.
Uchman, A. & Wetzel, A., 2012. Deep-Sea Fans. Developments in Sedimentology, 64,
pp.643–671.
Uchman, A. & Wetzel, A., 2011. Deep-sea ichnology: The relationships between
depositional environment and endobenthic organisms 1st ed., Elsevier B.V.
Vigorito, M., Murru, M. & Simone, L., 2005. Anatomy of a submarine channel system and
related fan in a foramol/rhodalgal carbonate sedimentary setting: A case history
from the Miocene syn-rift Sardinia Basin, Italy. Sedimentary Geology, 174(1–2),
pp.1–30.
Vigorito, M., Murru, M. & Simone, L., 2006. Architectural patterns in a multistorey mixed
carbonate-siliciclastic submarine channel, Porto Torres Basin, Miocene, Sardinia,
Italy. Sedimentary Geology, 186(3–4), pp.213–236.
Waters, C.N. et al., 2009. A lithostratigraphical framework for the Carboniferous
successions of northern Great Britain (onshore). British Geological Survey
Research Report RR/09/01.
Waters, C.N. & Condon, D.J., 2013. Nature and timing of Late Mississippian to Mid-
Pennsylvanian glacio-eustatic sea-level changes of the Pennine Basin, UK:
Discussion Reply. Journal of the Geological Society, 170(5), pp.850–850.
Wilson, R.D. & Schieber, J., 2014. Muddy Prodeltaic Hyperpycnites In the Lower Genesee
Group of Central New York, USA: Implications For Mud Transport In
Epicontinental Seas. Journal of Sedimentary Research, 84(10).
Wright, V.P., 1994. Early Carboniferous carbonate systems: an alternative to the
Cainozoic paradigm. Sedimentary Geology, 93(1–2), pp.1–5.
Wright, V.P. & Faulkner, T.J., 1990. Sediment dynamics of Early Carboniferous ramps: a
proposal. Geol. J., 25(051), pp.139–144.
Wunsch, M. et al., 2017. Sedimentary dynamics along carbonate slopes (Bahamas
archipelago). Sedimentology, 64(3), pp.631–657.

PhD Thesis | 2019
165
Chapter 4 Diagenetic Evolution in the Carbonate-
and Siliceous-rich Hodder Mudstone
Formation, Bowland Basin, UK

PhD Thesis | 2019
166
4 Diagenetic Evolution in the Carbonate- and Siliceous-rich Hodder
Mudstone Formation, Bowland Basin, UK
Timothy M. Ohiara1, Kevin G. Taylor1, Patrick J. Dowey1
1 School of Earth and Environmental Sciences, the University of Manchester, Oxford Road,
Manchester M13 9PL, UK
Keywords: Hodder mudstone, diagenesis, cement, mineral, carbonate, silica
Abstract
Physicochemical processes of silicate and carbonate mineral diagenesis and organic
thermal maturation in mudstones are still enigmatic. Within mudstones, mineral phases
of silicate and carbonate minerals attain chemical equilibrium at varying temperature
and pressure conditions. These reactions, respond differently across the inherent
anisotropic rock matrix. The resultant effect of these processes controls the fluid storage
and flow capacity of mudstones as unconventional reservoirs. To evaluate such
syngenetic and diagenetic processes that influence textural and mineralogy anisotropy
within mudstones, a rich dataset of high-resolution petrography from core samples
combined with TOC, Rock-Eval and X-ray-based geochemical data from a silicic-
/calciclastic Carboniferous mudstone of the Bowland Basin, UK, have been examined in
this study. Primary sedimentary component of analysed samples comprised intrabasinal
skeletal debris, microscopic biogenic detritus and extrabasinal silt- and clay-sized
siliciclastic (quartz and muscovite) detritus. Diagenetic minerals are dominated by
microbially-induced early diagenetic cements (calcite, dolomite, siderite, ankerite and
iron sulphides), kaolinite, illite and authigenic quartz. Organic and thermal maturation
analysis show an organic maturity between the oil and gas window with an average TOC
content of 1.5% from mixed Type II/III organic matter. Sediments were preserved in a

PhD Thesis | 2019
167
generally anoxic setting with intermittent euxinic and dysoxic periods. Primary
depositional components controlled facies variation and subsequent geochemical
alterations. Early diagenetic kaolinite, pyrite and carbonate mineral precipitation
occurred prior to compaction. Dolomite nucleation and precipitation mediated by early
organogenic processes dominated organic/clay-rich units. Silica authigenesis was
significant during burial and was mainly aided by opal A-CT transformation and clay
mineral reactions. The presented analyses show complex mineral instability and facies-
controlled chemical reactivity with localised aqueous mass transport during burial.

PhD Thesis | 2019
168
Introduction
Over the past two decades, mudstones have been exploited as hydrocarbon reservoirs
within unconventional plays and have also been considered for long term geological
storage of nuclear waste and CO2 (Powell et al. 2010; Wang et al. 2011; McGlade et al.
2013; Neuzil 2013a; Melikoglu 2014; Hendry et al. 2015). Mudstones are complex
(heterogeneous, variable composition, organic-rich, poorly crystalline, small grain sizes,
variable low porosity and ultra-low permeability) and there is also added complexity
resulting from post-depositional processes (Schieber 1999; Macquaker & Howell 1999;
Bohacs et al. 2005; Macquaker et al. 2007; Aplin & Macquaker 2011; Milliken et al. 2012;
Macquaker et al. 2014; Taylor & Macquaker 2014). Although not easily discernable, the
compositional variability in mudstones has been shown to be important in large-scale
stratigraphic units from outcrop and core studies to nanometre-scale microfacies using
several imaging techniques (e.g. Macquaker et al. 2007; Schieber 2011a; Lazar et al.
2015). These observed variations in composition, mineralogy and texture have economic
and environmental implications for the industrial utilization of mudstones, especially in
predicting mudstone porosity, permeability and mechanical properties in
unconventional hydrocarbon reservoirs. Understanding these compositional variabilities
is also vital in considering mudstones as efficient geological barriers for the storage of
spent high-level nuclear waste (Neuzil 2013a) and carbon capture and storage sites
(Armitage et al. 2016).
Diagenesis significantly impacts textural and compositional heterogeneity in mudstones
(Milliken et al. 2012; Milliken & Day-Stirrat 2013; Macquaker et al. 2014; Taylor &
Macquaker 2014). The products of diagenetic reactions control the degree of cements in
pore spaces and affect mechanical properties such as brittleness and ductility

PhD Thesis | 2019
169
(Macquaker et al 2014). The controls on geochemical processes responsible for these
compositional changes and the ways in which mineral transformations affect mechanical
properties in mudstones are still uncertain (e.g. Macquaker et al. 2014; Chalmers & Bustin
2015; Schieber 2016b). For example, both detrital quartz and authigenic quartz are
abundant in mudstones (Blatt 2003), but the controls on silica cementation in mudstones
are still largely unclear. Data from Dowey and Taylor (2017) reveal the effect of pressure
solution on silica cementation. Earlier studies by Thyberg et al (2010) and Thyberg and
Jahren (2011) have shown the importance of clay mineral reactions such as
illite/smectite to illite and kaolinite to illite in maintaining silica saturation in pore fluids
during burial. Other pieces of evidence suggest the alteration of concentrated biogenic
amorphous silica from radiolarians tests, sponge spicules and diatoms as a significant
control to silica authigenesis (e.g. Schieber 2000; Milliken et al. 2016). These studies
reveal that questions still remain about the origin, mobility and precipitation of
authigenic silica in mudstones.
To evaluate the industrial utilization of mudstones there needs to be a fuller
understanding of mineral authigenesis, the geological controls and their impact on rock
properties. The Hodder Mudstone is a Lower Carboniferous carbonate- and siliciclastic-
rich mudstone in the UK and has been assessed as a prospective shale gas resource
(Andrews 2013; Clarke et al. 2018). Deposited in a carbonate slope-to-basin transition
within the study area, the Hodder Mudstone constitutes a mixed extrabasinal- and
intrabasinal-derived clastics (Gawthorpe 1986). They are characterised by periplatform
skeletal debris and sand- to silt-sized quart and muscovite (Vhapter 3). Detailed works
on basin tectonics, stratigraphy, sedimentary fabric and facies distributions have been
conducted by several authors (e.g. Gawthorpe 1986; Fraser & Gawthorpe 1990; Riley

PhD Thesis | 2019
170
1990; Newport et al. 2017; Chapter 3), but, there has been no previous research on the
diagenetic development of this mixed calciclastic and siliciclastic mudstone.
This study posits evidence from high-resolution petrography (ultra-violet light
microscopy, SEM), mineralogy (XRD) and geochemical data (XRF, EDS, EPMA, RockEval
pyrolysis) to understand and characterise the diagenetic events of the Lower
Carboniferous Hodder Mudstone succession. This chapter interprets the diagenetic
evolution and the resulting minerals and textures within the Hodder Mudstone. Secondly,
it argues the abundance of authigenic quartz cement as an integral component in these
rocks and discusses the likely origin, geological controls and timing of authigenic quartz.
Study area
The Bowland Basin also referred to as the Bowland Trough (Waters et al. 2009) or Craven
Basin (Fewtrell & Smith 1980; Aitkenhead et al. 1992; Fraser & Gawthorpe 2003) is
located in Lancashire, north-western UK. Morphologically, the basin is a NE – SW –
oriented half graben tilting to the south and is structurally bounded to the north by the
Bowland High (Gawthorpe 1986; Fraser & Gawthorpe 2003), Lake District Massif and the
Askrigg Block (Hudson 1933; Gawthorpe 1986). The southern boundaries are the
Pennine/Pendle Fault and the Central Lancashire High (Figure 4.1). Subsequent to the
early Carboniferous lithospheric stretching of British/Irish Hercynian foreland and basin
formation, sediment deposition began in the Bowland Basin by the late Devonian (Fraser
& Gawthorpe 1990). The Bowland basin-fill constitutes Tournaisian to Stephanian
carbonate and terrigenous clastic lithofacies developed by the interplay of glacio-eustatic
sea-level fluctuations and tectonic events (Aitkenhead et al. 1992; Fraser & Gawthorpe
2003). Due to regional progressive uplift within the Pennines, post-Carboniferous

PhD Thesis | 2019
171
sediments were barely preserved in the Bowland Basin sequence (Aitkenhead et al.
1992).
The Bowland Basin holds an estimated 1300 TCF of total original gas in place (Clarke et
al. 2014). The gas-bearing section of the basin is >6000ft (1800m) thick unit of Viséan to
Namurian strata, predominantly hemipelagic mudstones and thinly laminated calcareous
turbidites (Fraser & Gawthorpe 1990; Andrews 2013). Of preferred interest to this study
is the Viséan aged syn-rift fine-grained sediment density flow deposits of Hodder
Mudstone Formation. The Hodder Mudstone forms the basal section of the Bowland-
Hodder shale gas resource play. The Hodder is reportedly the thickest section within the
shale gas play (Brandon et al. 1998; Waters et al. 2009).
Figure 4.1: Location map of the Bowland Basin, showing major bounding faults (dashed lines), the Bowland High on the north-western basin margin and the Central Lancashire High to the southeast. Study samples were taken from the MHD boreholes. Map modified after Evans and Kirby (1999). Red-filled triangles are location
PhD Thesis | 2019
172
of key hydrocarbon exploration wells onshore Bowland Basin, and green-filled triangles are location studied borehole cores.
Research data and methods
A suite of samples from ten borehole cores retrieved from a mineral exploration project
around the Bowland Basin area (Aitkenhead et al. 1992) were prepared for petrographic
and geochemical analyses. Samples originated from cores drilled by BP minerals for solid
mineral prospecting. Currently stored at the BGS core repository, Nottingham, UK, these
retrieved samples represent a range of lithologies in the Lower Carboniferous Hodder
Mudstone. Sampled depth points and analysis can be found in the Appendix. Petrographic
data from conventional transmitted polarized light optical microscopy and scanning
electron microscopy (SEM) were acquired from 50 polished thin sections from 41 depth
points cut perpendicular to bedding. Optical photomicrographs were taken from a Nikon
Eclipse E200 ultraviolet polarized light microscope at the University of Manchester.
Images were mostly taken in crossed nicols for identification of >40µm sized mineral
grains using their optical extinction angle and birefringence properties.
Thin section slides were further carbon-coated and examined at the University of
Manchester using a Philips XL30 FEG Environmental Scanning Electron Microscope
(ESEM) equipped with EDAX Gemini EDS analyser for qualitative elemental composition
analysis. The machine was set to operate at 15 KV accelerating voltage and spot size of 4.
Captured SEM images provided high resolution topographic scanned images favourable
for analysing compositional variability and crystalline structure. Diagenetic
reconstruction utilizing basic cross-cutting relationships of identified mineral forms and
mineral crystal growth was possible from back-scattered electron (BSE)-mode
micrographs.

PhD Thesis | 2019
173
Digital X-ray mineral mapping was performed on the samples using a JEOL JXA-8530F
Field Emission Electron Probe Microanalyzer (FE-EPMA) located in the School of
Materials, University of Manchester. The apparatus is equipped with a Field Emission
Scanning Electron Microscope (FE-SEM), wavelength-dispersive spectrometer (WDS)
and a JEOL panchromatic cathodoluminescence (CL) system fitted with a NIR filter (for
monochromatic image output of CL signals). The beam was set to run on 20 KV
accelerating voltage and a beam current of 100 nA. Fe, Si, K, Na and Mg mineral maps
were scanned simultaneously using the thallium acid phthalate (TAP) crystal-fitted WDS.
Ca and Al were mostly abundant and observed under EDS using the SEM apparatus. Total
image collection time per sample was approximately 6.5 minutes. Collated images aided
the evaluation of magnesium-rich carbonates grains and the distinction of detrital and
authigenic silica. Statistical pixel filtering using Matlab R2018a was performed on 12
selected SEM and SEM-CL images (6 each) to quantify the percentage by area of
authigenic to total quartz content. A threshold of grey scale values for quartz minerals in
the samples was determined and used to run an image segmentation script for area
determination.
For bulk, whole rock XRD mineral analysis, 72 samples were crushed using an agate
pestle and mortar to produce <65 µm sized powdered specimen. 0.2 g of each powered
samples were mixed with ~1ml of a volatile organic solvent (iso-amyl acetate) to produce
a slurry-smear mount on a glass slide. Samples on glass slides were air-dried and
analysed on a Bruker D8 Advance Diffractometer at the University of Manchester. The
diffractometer is equipped with a Göbel mirror, a Lynxeye sensitive detector and an X-
ray tube emitting monochromatic CuKα1 X-rays with 1.5406Å wavelength. Scanning
mode for each step was set from 5°-70° 2Ɵ of the diffracted beam, with a step size of 0.02°
and a count time of 0.2 seconds. Generated diffraction peak profiles were evaluated using

PhD Thesis | 2019
174
the EVA version 4 software. These were compared mineral standards from the
International Centre for Diffraction Data (ICDD) database. Quantitatively, peak intensities
of minerals were measured from X-ray diffraction data using the Bruker TOPAS software.
For trace and major elemental analysis, 12 grams of 67 crushed samples representing the
wide range of facies within the studied section were analysed. The analysis was carried
out on 15g pelleted samples (12g powdered sample and 3g of non-reactive wax binder)
using PANalytical Axios sequential X-ray Fluorescence Spectrometer at the University of
Manchester. The use of element geochemical indices, especially trace metals, in
paleoredox environmental reconstruction and provenance studies, have been successful
(e.g. Jones & Manning 1994; Böning et al. 2004; Tribovillard et al. 2004; Abanda &
Hannigan 2006; Tribovillard et al. 2006; Rimstidt et al. 2017; Haddad et al. 2018). The
covariation of both major and trace elements was examined in this study for the
reconstruction of paleoproductivity and paleoredox conditions. Quantitative data of
major elements from XRF analysis were acquired using Omnian analytical software for
11 major elements Na, Mg, Al, Si, P, S, Cl, Ti, Ca, Fe and K in their respective oxide species.
The Pro-Trace element analytical software was utilised to determine accurate net
intensities of 35 trace-elements and 5 rare earth elements in each sample.
2 g aliquots of 30 visibly organic-rich samples were crushed and analysed for TOC using
the Leco method at Applied Petroleum Technology (APT), Norway. Samples were initially
treated with 10% (vol.) concentrated HCl acid to remove carbonate components before
being introduced to a Leco SC-632 combustion oven. The amount of carbon was
determined by measuring the amount of carbon dioxide using infrared detection.
Analytical procedures for this analysis followed the Norwegian Industry Guide to Organic
Geochemical Analysis (NIGOGA) guidelines (Weiss et al. 2006). Rock-Eval data was

PhD Thesis | 2019
175
acquired using the HAWK apparatus at the Applied Petroleum Technology (APT),
Norway, from 12 representative aliquots. A Jet-Rock 1 sample was run intermittently as
a standard and checked against the acceptable range given in NIGOGA. Results from Rock-
Eval pyrolysis provides information on generated and residual hydrocarbons using the
amounts of hydrocarbon and CO2 released per gram of sample at reference temperatures
under laboratory maturation (Espitalié et al. 1977). These proxies in conjunction with
TOC data served as input values for the determination of organic matter type,
hydrocarbon source potential and quality (S1, S2 and S3 peaks), and source rock thermal
maturity (Tmax).
Results
4.4.1 Lithology description
Analysed samples of the studied Hodder Mudstone core constitute grey to dark grey,
conglomeratic and mud-rich rocks. Most samples contain gravel-sized to fine-grained
(<100µm) macro-skeletal fragments of echinoderm, mollusc and gastropod. Beds exhibit
lamina- and bed-scale gradation from conglomeratic, light-grey units into finer-grained,
dark-grey, mud-dominated units with intermediate sections of sand- and silt-rich beds.
Wavy, discontinuous but parallel laminations are distinctive of the conglomeratic beds
and the sand- to silt-rich sections. Clay-rich units are characteristically unlaminated to
planar parallel- and convolute-laminated sections. Nodules, fractures and bioturbation
are also characteristic features within the studied horizons. For ease of data analysis,
samples were texturally classified into three groups: (1) clay-rich lithologies (CR), (2)
sand-& silt-rich lithologies (SR), and (3) argillaceous-bioclastic & sand-rich calcareous
lithologies (BR). A summary log of lithologic description from representative borehole

PhD Thesis | 2019
176
core (MHD13) is shown in Figure 4.2. A comprehensive description of facies within the
study area can be found in the previous Chapter.

PhD Thesis | 2019
177
Figure 4.2: A representative core lithologic log from borehole MHD13 showing textural variations in lithology and sedimentary structures
PhD Thesis | 2019
178
4.4.2 Bulk XRD composition
Mineral components from XRD bulk analysis of the samples include calcite, dolomite,
siderite, ankerite, quartz, albite, muscovite, kaolinite, chlorite, pyrite and marcasite
(Table 5). Qualitative diffractograms and bulk mineral data are presented in the Appendix
2. Bioclastic-rich lithologies are dominated by carbonates with lesser amounts of quartz
and phyllosilicate minerals. On average, calcite makes up about 67 wt. % of total mineral
content in BR samples but progressively lower content in SR (45 wt. %) and CR (35 wt.
%) samples. Quartz is lower on average in BR samples (19 wt. %) than in SR (26 wt. %)
and CR samples (27 wt. %). An increase in silica content within silt-rich samples occurs,
although samples are generally dominated by carbonate minerals. On the ternary
diagram (Figure 4.3), clay-rich samples plot across the spectrum with variable
mineralogical content due to the presence/absence of isolated bioclastic fragments and
differing amounts of micro-fractures and calcite cement. Other accessory minerals
occurring in the Hodder Mudstone samples include fluorapatite and albite (Table 5).

PhD Thesis | 2019
179
Minerals (weighted fraction) CR (n=30)
SR (n=15)
BR (n=27)
Carbonates Calcite (Wt. %)
Min. Max.
1 85
0 93
26 99
Dolomite (Wt. %)
Min. Max.
0 0
0 5
0 22
Siderite (Wt. %)
Min. Max.
0 4
0 0
0 0
Ankerite (Wt. %)
Min. Max.
0 30
0 54
0 8
Tectosilicates Quartz (Wt. %)
Min. Max.
2 47
0 83
0 39
Albite (Wt. %)
Min. Max.
0 8
0 6
0 7
Phyllosilicates
Muscovite (Wt. %)
Min. Max.
0 44
0 44
0 26
Kaolinite (Wt. %)
Min. Max.
0 20
0 7
0 15
Chlorite (Wt. %)
Min. Max.
0 11
0 2
0 6
Sulphides Pyrite (Wt. %)
Min. Max.
0 5
0 6
0 5
Marcasite (Wt. %)
Min. Max.
0 1
0 0
0 2
Phosphate Fluorapatite (Wt. %)
Min. Max.
0 2
0 0
0 0
Table 5: Weighted percentage mineralogical data from XRD bulk analysis. See Appendix for raw data.

PhD Thesis | 2019
180
Figure 4.3: Ternary plot of minerals by textural variations. Samples are dominantly carbonate rich with high tectosilicate and phyllosilicate fractions in clay-rich lithologies. Although carbonate cemented, very high (> wt. 80%) carbonate content of most clay-rich samples are due to carbonate cemented micro fractures and occasional shell fragment.
4.4.3 Palaeo-environmental proxies
Alterations in trace metals within sediments are known to occur in a predictable manner
(Abanda & Hannigan 2006). A reconstruction of paleoredox environmental conditions
was deduced in this study by normalizing trace-element concentrations to aluminium
content, and calculating enrichment factors of redox-sensitive trace elements (Cd, Co, Cr,
Cu, Mo, Ni, U and V) with reference to average shale compositions (Enrichment Factor
(𝐸𝐹𝐸𝑙𝑒𝑚𝑒𝑛𝑡 𝑋) = 𝑋/𝐴𝑙2𝑂3𝑠𝑎𝑚𝑝𝑙𝑒
𝑋/𝐴𝑙2𝑂3𝑎𝑣𝑒𝑟𝑎𝑔𝑒 𝑠ℎ𝑎𝑙𝑒
; (Tribovillard et al. 2006)). The studied samples were
PhD Thesis | 2019
181
retrievd from Pb-Zn ore mineral exploration, hence, trace elements which may occur as
sulphide minerals (e.g. Pb-Galena, Zn-Shalerite) were not utilized. The Pb and Zn ore
deposits may be linked to the hydrothermal processes similar to the Carboniferous Irish
Midland Basin (e.g. Wilkinson et al. 2005). These hydrothermal deposits are localised in
the cparser-grained Waulsortian limestones.
The Hodder Mudstone samples show variably high U and Mo enrichment (Figure 4.4)
than average shale values (Wedepohl 1971) and a low Enrichment Factor (EF<1) for V,
Cu and Ni (Table 6; Figure 4.4). On a broader scale, relatively coarser samples (BR and
SR) show higher enrichment and the more argillaceous (CR) samples (Figure 4.4).
In sediments deposited under reducing conditions, both U and V occur mainly in
authigenic phases than in organic phases (Algeo & Maynard 2004). Threshold values of
the measured ratios (U/Th) showing oxic (<0.75) to dysoxic and anoxic (>1.25)
conditions (Nathan et al. 1997; Madhavaraju et al. 2016) were adopted for this study.
Results show a mean U/Th ratio of 2.24 with few data points between 0.61 – 0.67 (Figure
4.5). Clay-rich samples show an average U/Th ratio of 1.26, while silt-rich and bioclast-
rich samples show averages of 2.93 and 3.13 respectively. This is indicative of a dominant
dysoxic and anoxic conditions (Figure 4.5).

PhD Thesis | 2019
182
Figure 4.4: Facies variationa in trace element variation for the Hodder Mudstone samples
Another measure of redox potential using V/(V+Ni) ratios based on studies conducted by
Hatch and Leventhal (1992) show dysoxic, anoxic and euxinic settings having V/(V+Ni)
ratios of 0.46 – 0.60, 0.54 – 0.82 and 0.84 – 0.89 respectively. This study reports V/(V+Ni)

PhD Thesis | 2019
183
ratios between 0.35 – 0.71 for coarser grained (carbonate-rich) samples and for silt-
/clay-rich sections, 0.38 – 0.81 (Figure 4.5).
Figure 4.5: Histograms for palaeo-redox proxies U/Th and V/(V+Ni). More than 50% of the Hodder Mudstone samples were deposited in an anoxic environment

PhD Thesis | 2019
184
Borehole ID and number of analysed samples (n = 67)
Value ranges
Enrichment factor of trace elements Variable ratios
U V Mo Cr Ni Co Cu Th U/Th V(V+Ni)
MHD1 (n=7)
Min 2.71 0.67 0.42 1.09 0.58 0.93 0.30 0.79 0.82 0.49 Max 21.02 1.09 7.52 1.96 1.85 6.41 0.65 0.99 6.45 0.69 Mean 10.99 0.83 3.89 1.38 0.83 3.48 0.44 0.87 3.17 0.59
MHD2 (n=7)
Min 2.20 0.60 0.44 1.11 0.69 0.79 0.30 0.77 0.65 0.47 Max 12.85 0.86 2.25 1.37 1.31 5.29 0.80 1.51 2.13 0.69 Mean 4.91 0.71 1.11 1.17 0.91 1.57 0.44 0.93 1.22 0.60
MHD3 (n=8)
Min 2.85 0.65 0.20 1.09 0.57 0.79 0.22 0.61 0.87 0.53 Max 9.49 1.38 4.73 1.35 1.95 3.55 1.01 1.07 2.29 0.72 Mean 5.53 0.87 1.67 1.21 1.11 1.68 0.58 0.85 1.63 0.61
MHD4 (n=3)
Min 2.78 0.76 0.07 1.17 0.77 0.87 0.37 0.85 0.79 0.52 Max 132.45 1.03 20.65 4.89 1.82 36.74 0.57 6.26 5.29 0.66 Mean 46.77 0.88 9.64 2.47 1.27 12.95 0.47 2.67 2.52 0.58
MHD8 (n=4)
Min 2.27 0.70 0.13 1.05 0.67 0.83 0.12 0.79 0.68 0.60 Max 15.84 1.49 11.79 1.49 1.92 2.73 0.82 1.10 3.59 0.67 Mean 6.29 0.95 3.29 1.19 1.08 1.62 0.39 0.89 1.61 0.64
MHD9 (n=4)
Min 8.15 0.52 1.06 1.11 0.97 3.64 0.36 0.76 2.09 0.35 Max 241.08 0.69 20.23 7.45 2.32 75.44 0.47 1.21 5.82 0.56 Mean 73.27 0.62 8.11 2.87 1.65 23.71 0.41 0.98 4.36 0.46
MHD11 (n=8)
Min 2.37 0.49 0.19 0.99 0.66 0.66 0.29 0.60 0.75 0.50 Max 33.62 1.35 8.06 3.33 2.48 0.65 0.88 0.80 12.83 0.68 Mean 9.82 0.89 2.35 1.52 1.16 2.24 0.51 0.72 3.63 0.61
MHD12 (n=7)
Min 4.44 0.38 0.29 1.08 0.72 1.49 0.48 0.63 1.72 0.45 Max 51.89 1.01 12.43 2.27 2.06 8.13 1.08 4.09 5.21 0.64 Mean 22.71 0.70 5.05 1.67 1.18 5.47 0.69 1.83 3.18 0.53
MHD13 (n=11)
Min 2.12 0.67 0.05 1.03 0.49 0.50 0.18 0.65 0.61 0.43 Max 6.24 2.44 14.49 1.30 2.04 3.83 0.74 0.87 2.20 0.81 Mean 4.15 0.95 3.31 1.13 0.94 1.43 0.43 0.79 1.34 0.66
MHD18 (n=8)
Min 2.56 0.69 0.45 1.09 0.75 0.77 0.41 0.70 0.86 0.38 Max 10.82 1.84 6.75 1.90 2.46 6.70 1.16 1.54 2.03 0.74 Mean 5.08 0.93 1.75 1.32 1.35 2.73 0.63 0.90 1.33 0.57
Table 6: Summary data showing enrichment of redox sensitive trace elements and ratios in selected Hodder Mudstone sample. Samples are mostly enriched in U and Mo relative to average shale values

PhD Thesis | 2019
185
4.4.4 Petrographic description
Thin section examination from optical microscopy and SEM show that the Hodder
Mudstone samples contain >50% of mud-sized (<63µm) materials (Figure 4.6). Also
present are dark opaque organic residue and variable micro skeletal components. Sub
centimetre-scale laminae are distinctive in mud-rich laminated intervals, while
unlaminated units are characterised by burrows. Mud-sized components are mostly silt-
to clay-sized crystalline quartz, muscovite, kaolinite, calcite and dolomite while larger
grains are dominated by calcite, quartz and muscovite sheets (Figure 4.6). Silt and clay-
rich samples contain >70% (visual estimates) of <63µm grains within a 4mm2 surface
area while bioclast-rich samples comprise sand to gravel-sized echinoderm and molluscs
fragments in the mud-sized matrix (Figure 4.6 (a)). Most skeletal debris are calcite-
cemented, exhibiting sparry calcite morphology. Quartz grains are mostly anhedral to
euhedral crystals making up to 26% (visual estimate) of total grains under thin section
examination. Ankerite and dolomite are locally common as scattered euhedral (10 to 50
µm-sized nucleated dolomite) crystals to subhedral replacement minerals in fractures.
Pyrite is also commonly associated with marcasite. Illite is rarely observed in samples but
preserved as fibrous crystal where present in coarser (sand-sized) grained samples
between sand- and silt-sized grains. Fibrous illite occurrence is also mostly associated
with microcrystalline quartz.

PhD Thesis | 2019
186
Figure 4.6: Petrographic images in UV transmitted light (left) and SEM (right) of BR samples (a) & (b); SR samples (c) &( d) and CR samples (e) & (f). Sample matrix contain up to 50% mud-sized particles. Grains are dominated by calcite, kaolinite, quartz, muscovite and dolomite
4.4.5 Organic matter characterisation and maturity data
Organic matter components in analysed samples were mostly preserved as <20 um thick
wavy to sub-angular dark particles found as pore-filling matter in pores and fractures
(Figure 4.7). Visible petrographic evidence is consistent with TOC data as higher amounts

PhD Thesis | 2019
187
of amorphous organic matter strips are visually higher in planar-laminated and
bioturbated silt-rich units. Coarse-grained bioclastic-rich lithologies contain the least
measured present day TOC at 0.27% (Table 7). The maximum reported TOC value of
3.15% was recorded from silt-rich bioturbated lithology.
Overall, the average TOC value of the Hodder Mudstone studied samples is 1.13% with
modal distributions of organic richness (>2%) occurring in organic silt-rich lithologies.
S2 peaks of analysed samples (0.05 – 0.74 mgHC/g rock) are higher than S1 peaks (0.05
– 3.21 mgHC/g rock), which translates to limited generated and/or expelled
hydrocarbon. Organic maturity ranges from the oil window (pyrolysis Tmax >440°C) to
wet gas zone (pyrolysis Tmax <465°C) (Table 7). Using the Tmax to vitrinite reflectance
conversion formula (Ro = 0.0180 * Tmax – 7.16; Jarvie et al. 2001), estimated vitrinite
reflectance values (%Ro) of the studied samples range from 0.83% to 1.12%. Tmax to
%Ro conversions have been applied extensively with appreciable confidence on various
shale samples with type II and III kerogen, provided S2 peaks are >0.5 mgHC/g rock and
Tmax values >420°C < 500°C (e.g. Wust et al. 2013; Ko et al. 2016; Clarke et al. 2018).
Hydrogen index versus Tmax plot (Figure 4.8) indicates that the Hodder Mudstone is
predominantly a mature, type II/III kerogen, gas prone succession.

PhD Thesis | 2019
188
Figure 4.7: Organic matter residue (OM) mostly preserved as migrated bitumen
Sample ID S1 (mg/g)
S2 (mg/g)
S3 (mg/g)
Tmax (°C)
HI (mg HC/g TOC)
OI (mg CO2/g TOC)
TOC (%)
Ro (%) (calculated)
MHD3/118.8 0.74 2.39 0.07 452 172 5 1.39 0.976
MHD3/179.8 0.26 0.86 0.08 456 76 7 1.13 1.048
MHD3/238.2 0.25 0.52 0.08 444 90 14 0.58 0.832
MHD13/88.7 0.28 0.59 0.1 444 99 17 0.6 0.832
MHD13/90.4 0.34 0.63 0.05 448 69 5 0.92 0.904
MHD13/73.1 0.46 1.55 0.05 449 112 4 1.38 0.922
MHD13/72.4 0.7 3.21 0.1 452 153 5 2.1 0.976
MHD13/228.8
0.52 2.81 0.07 460 89 2 3.15 1.12
MHD11/100.2
0.49 2.56 0.1 447 137 5 1.87 0.886
MHD11/200.1
0.36 1.31 0.07 450 119 6 1.1 0.94
MHD18/159.3
0.05 0.05 0.14 453 19 52 0.27 0.994
MHD18/109.5
0.66 2.64 0.09 451 123 4 2.14 0.958
Table 7: Pyrolysis and TOC values of selected samples from the Hodder Mudstone.

PhD Thesis | 2019
189
Figure 4.8: Hydrogen index versus Tmax plot showing a mature, type II/III Hodder Mudstone. Maturation boundary information taken from Tissot et al. (1974)
4.4.6 Detrital components
Detrital components described in this section include terrestrially-derived components
(e.g. sand- and silt-grade quartz, and muscovite) and transported intrabasinal biogenic
debris (e.g. mollusc, echinoderm and brachiopod shells, and tests of foraminifera and
calcisphere). Such materials have been transported to sites of deposition and were
distinguished by identifying morphological evidence of grain transport and weathering
which include edge-angularity, roundness and crystal size. Other evidence for sediment
transport were bedding plane features in the form of wavy laminations, scoured bases
and laminae-scale gradation (Chapter 3). Additional quantitative data from major
elemental analysis provided information on mineral provenance. Aluminium and

PhD Thesis | 2019
190
zirconium are detrital major elemental proxies that remain insoluble and are relatively
immobile during diagenesis (Böning et al. 2004; Tribovillard et al. 2006). Hence, cross
plots of selected major rock-forming elemental fractions (SiO2, CaO, Na2O and K2O)
against Al2O3 content (Figure 4.9), aided in validating allochthonous sedimentary
materials of terrigenous and biogenic sources. Strong positive trends are observed in
Al2O3 versus SiO2, Na2O and K2O plots, with only CaO showing a negative correlation when
plotted against Al2O3. Positive correlation is indicative of terrestrial components while
biogenic constituents yield a negative correlation (Wright et al. 2010). These results show
that the sedimentary materials comprising the Hodder samples are a combination of
terrestrial and biogenic-sourced detritus. Calcite and dolomite observed in thin-section
and XRD make up the bulk of biogenic debris while muscovite, quartz and feldspar
(albite) are mostly terrestrial.

PhD Thesis | 2019
191
Figure 4.9: Cross plots of major elements showing evidence of largely detrital (terrestrial) derived compounds (NaO, K2O, SiO2). CaO shows strong negative trend indicative of dominant marine origin. NaO and SiO2 may have intrabasinal influence hence weaker positive correlation.
4.4.7 Authigenic minerals
Authigenic minerals are considered here as post-depositional minerals formed from
direct precipitation of aqueous solution or as in situ mineral recrystallization (e.g.
neomorphism). These minerals are often precipitated in pore spaces between grains,
nucleating around allochthonous crystals or emplaced in fracture networks. From
petrographic examination, some amount of quartz, calcite and dolomite with kaolinite,
pyrite, marcasite, Mg-rich chlorite (clinochlore) and illite represent a proportion of

PhD Thesis | 2019
192
authigenic mineral components within the Hodder Mudstone samples. Large rusty brown
to grey oblate and irregular 2 to 5 cm thick concretionary cements of carbonate are also
common features found in the studied Hodder Mudstone cores (Chapter 3). These
concretions are abundant in unlaminated clay-rich units.
4.4.7.1 Calcite
Authigenic calcite within the Hodder samples is observed in cemeted detrital shell
fragments and as interparticle cements. Distinctive features include micritized shell
walls, shell calcification, sparry calcite cementation in shell cavities and interparticle
cement fabrics (Figure 4.10). Calcite interparticle cements are also observed in
intercrystalline pores of pyrite framboid (Figure 4.11). In shell cavities, calcite
cementation has a replacive fabric, when they occur around earlier formed kaolinite
“booklets”. Sparry calcite fabric, shell wall micritization and replacive fabrics are strongly
indicative of authigenic calcite (Adams & MacKenzie 1999).
Semi-preserved shell fragments occasionally show microstructural alteration and minor
dissolution (Figures 4.10 (C) & (D)). Other bioclastic shell fragments comprising of sparry
calcite cement are largely pre-calcite (aragonitic) shells of bivalves and gastropods and
calcified tests of originally siliceous radiolarian and sponge tests (Figures 4.10 (E) & (F)).
Only a few shell fragments of primarily low-Mg calcite have well-preserved wall
structures (e.g. brachiopods, bryozoans and crinoids). Coarser units have higher calcite
cement concentrations. About 40% of calcified shell fragments and planktonic fossils
make up the grain assemblage of silt-rich beds with more than 60% of calcified fragments
in coarser grained beds. Occasional and localised silt-sized skeletal fragments are
observed in clay-rich units. A clear negative correlation coefficient of the CaO/Al2O3 cross
plot (Figure 4.9) is a strong indication of basinal resedimented and authigenic calcite
minerals in the Hodder Mudstones.

PhD Thesis | 2019
193
Figure 4.10: Calcite cementation seen in optical microscope and SEM images. (A) XPL photomicrographs showing partial micritization of the outer shell (arrow) of an indeterminate organism and sparry calcite cementation of shell cavity. (B) Micritized shells of endothyracid (left bottom of the sample) and milliolid (centre top of the sample) Forams. (C) & (D) SEM and SEM Cl images showing calcified outer shell of Foram fragments; minor dissolution produces intragranualar pore spaces in shells. (E) and F) XPL photomicrographs showing Radiolarian spherules (Ra) and spines of Sponge spicules (SS) cemented by calcite.

PhD Thesis | 2019
194
Figure 4.11: Calcite cementation occluding intercrystalline pores in pyrite framboid. To the right of framboid, calcite has been partially displaced by authigenic quartz.
4.4.7.2 Dolomite
Dolomite crystals were observed to be mostly preserved in the Hodder Mudstone
samples as microcrystalline (5 – 50 µm), sharp-edged, planar dolomites.A well-defined
nuleus may be observed in SEM basck scatter micrographs of most dolomitsed samples.
These nuclei appear dark-grey in colour having planar or curved crystal faces and
overgrown by relatively lighter-coloured syntaxial rhombic dolomite rims (Figure 4.12).
This phenomenon is a prominent feature in the clay-rich lithologies. The variance in
backscattering coefficients between inner, darker Mg-rich core and the lighter Fe-rich
rims is definitive of varying crytallizing solutions resulting in heterogenous nucleation
(e.g. Martire et al. 2014; Radwan et al. 2017). In general, observed nucleated dolomite
crystals were largely preserved as unaltered rhombs and as fragmented crystals. Sub-

PhD Thesis | 2019
195
rounded to sub-angular dolomite nuclei have been recognised by previous researchers
as detrital dolomite grains that act as substrates for dolomite nucleation (e.g. Radwan et
al. 2017; Schieber 2016a). Other authors presents evidences for early diagenetic dolomite
nucleation due to calcite recrystallization (e.g. Duncan & Gregg 1987; Wright et al. 2004;
Konari et al. 2018). An additional form of dolomite occurrence in the samples is observed
as partially dolomitised calcite in previously kaolinite-cemented shelter pores (Figure
4.12(D)). These are visible on SEM back scatter images as non-planar anhedral crystals
with irregular crystalline boundaries.
Figure 4.12: (A) and (B) SEM and SEM CL photo example of syntaxial planar dolomite nucleation, with marked compositional, well developed outward-progressing zones of mostly ferroan rhombohedral rims. (C) Showing scattered dolomite micron-sized rhombs (arrows) in the clay-rich lamina. (D)Non planar dolomites, indicative of Later phase partial dolomitization of calcite-cemented kaolinite in shelter pore (paragenetic sequence from cross cutting relationship shows kaolinite-calcite-dolomite-quartz).

PhD Thesis | 2019
196
4.4.7.3 Quartz
Detrital quartz crystals are easily distinguished from authigenic quartz by their bright
luminescence under SEM-CL imaging (Figures 4.13 (B) & (D)) (e.g. Thyberg et al. 2010;
Milliken 2013). This is due to the variable CL emission spectra of detrital (from weathered
prexisting rock) and authigenic quartz (Gotze et al. 2001; Thyberg et al. 2010). Figure
4.13 shows evidence for the presence of allochthonous and authigenic quartz within the
Hodder Mudstone. Quartz grain-sizes range from <5µm to 100 µm. Authigenic quartz is
pervasive in silt and clay-rich samples of the studied succession. These quartz cements
occur in the form of isolated euhedral crystals, anhedral quartz overgrowths around
detrital grains, irregular sheet-like microcrystalline quartz and in silicate/calcite
intergrowths (Figure 4.13 (F)). Sheet-like microcrystalline morphology and platelets of
quartz cements identified in the studied samples (Figure 4.13 (E)) are identical to those
from Thyberg et al. (2010) and Thyberg & Jahren (2011).

PhD Thesis | 2019
197
Figure 4.13: (A) to (D) Quartz cementation showing the dominance of authigenic quartz in the Hodder Mudstone in form of quartz overgrowths and euhedral crystals. Quantitative data was derived from statistical pixel filtering. (E) Microcrystalline quartz (Q) in association with illite crystals. (F) Silica/calcite intergrowths suggesting a potential displacement of calcite by silica
Identified quartz overgrowths are also typical of those identified in Dowey and Taylor
(2017) (Figures 4.13 (A) – (D)). When compared to detrital quartz grains using statistical
image threshholding of greyscale values, authigenic quartz cement makes up the larger
percentage (up to 98.4%) of total quartz mineral in the Hodder Mudstone. A statistical

PhD Thesis | 2019
198
relationship from major elemental cross plots (Figure 4.9) presents slight indications of
mixed silica allochthonous provenance (biogenic/terrestrial) of silica within the Hodder
Formation. Although a clear positive linear correlation exists between SiO2/Al2O3 plot (R2
= 0.9), a low correlation coefficient (R2 = 0.35) of 5 data points from more distal clay-rich
samples contributed to a slightly lower R2 in the SiO2/Zr plot (R2 = 0.84). This difference
may be due to limited delivery of Zr further in the basin. A lower positive correlation
coefficient (R2 = 0.63) is observed when quantitative quartz (silica) XRD values were
plotted against Zr (Figure 4.7). It is assumed that these trends in Si/Al and Si/Zr plots of
the Hodder Mudstone samples are likely a reflection of their mixed provenance.
4.4.7.4 Kaolinite
Kaolinite in the studied samples occurs in two forms: (1) anhedral, less-ordered kaolinite
crystals (Figures 4.14 (A) & (B)) and (2) a more abundant euhedral, vermicular and
ordered kaolinite crystals (Figures 4.14 (C) – (F)). The first forms are found in pore spaces
between rock matrix and while the well-develop non-compacted vermicular forms are
found as shelter pores of forams algae and gastropods or compacted between muscovite
sheets (Figure 4.14). In bioclast-rich samples, kaolinite grains are preserved as 0.5 to
15µm thick “booklets” occluding primary micro-shelter porosity in dissolved cavities of
calcareous algae and foraminifers (Figures 4.14 (E) & (F)). Patches and strips of kaolinite
also occur around quartz and calcite grains mostly in silt- and clay-rich samples. These
strips are occasionally found with pyrite crystals and have no regularity but infrequently
exhibit imbricated vermiform morphology between calcite and silica cements. Kaolinite-
muscovite intergrowths are equally present in silt-rich sections (Figures 4.14 (C) & (D))
showing similar authigenic textures as those defined by Arostegui et al. (2001) and
Bauluz et al. (2008). Vermicular morphology of high crystalline kaolinite crystals and
kaolinite-mica intergrowths are classic morphologies of authigenic kaolinite while

PhD Thesis | 2019
199
detrital kaolinite is distinguished by their anhedral crystal morphology with a low degree
of ordering (Bauluz et al. 2008).
Figure 4.14: (A) & (B) Interparticle kaolinite minerals between grains (arrow.) (C) & (D) Kaolinite intergrowth between Mica sheets. (E) & (F) Kaolinite precipitation in shelter pores with preserved intercrystalline pore spaces. Notice calcite cementation of kaolinite around the outer perimeter in (E).
4.4.7.5 Iron sulphides
Identified Fe-sulphide crystals from EDS spectra and backscatter electron microscope
images exhibit characteristic features of microcrystalline pyrite crystals, pyrite

PhD Thesis | 2019
200
framboids and marcasite (Figures 4.15 (A) – (F)). The sizes of pyrite framboids vary
widely, ranging from nanoframboids (<0.1µm) through microframboids (01.-1µm) to
very fine (1 to <18 µm) and large pyrite framboids (18 – 50 µm) (e.g. Sawlowicz 1993).
Various forms of polyframboids (multiple framboidal aggregates) are also prominent
(Figure 4.15 (B)). Occasionally, pyrite crystals occur in the samples as disaggregated
microcrystals (Figure 4.15 (D)) and single euhedral crystals tens to a few hundreds of
micrometre in size coexisting with or in isolation from framboids. Additionally, most
crystals form in cavities of microfossils (soft body pyritization) or around walls of
radiolarian tests (Figures 4.15 (C) – (D)).
From textural and morphological evidence, marcasite, a mineral diamorph of pyrite is
present in studied samples coexisting with pyrite (Figures 4.15 (E) & (F)). Observed
marcasite crystals exhibit characteristic tabular-bladed morphology as those defined by
Bush et al. (2004) and Schieber (2011). Petrographic examination of Fe-sulphide-rich 7
to 10 cm thick laminae reveals up to 80% (visual estimate) concentration of marcasite
and pyrite clusters with micro disseminated crystal aggregates in an organic-rich mud
matrix.

PhD Thesis | 2019
201
Figure 4.15: Several occurrences and crystal morphologies of authigenic pyrite (A – D) and Marcasite (E & F) in the Hodder Mudstone samples. (A) Very fine framboids. (B) Evidence of early diagenetic poly-framboidal pyrite of varying diameters displaced by a micro fault. (C) Micro-framboidal pyrite mineralization of skeletal test (arrow-indicated). (D) Complete body (mouldic) pyritization of a fossil (foram?) and partial recrystallization. (E) Tabular bladed marcasite. (F) Marcasite and pyrite coexistence.
4.4.8 Fractures
Natural fractures varying in orientation, propagation and width are common across silt-
and clay-rich lithologies. Fractures are mineralized with calcite and ankerite, and are

PhD Thesis | 2019
202
mostly sub-vertical, parallel or oblique to bedding (Figure 4.16). The morphology of most
microfractures seems to be controlled by the composition of the host rock matrix (Figures
4.16 (A), (B) & (C)). Dendritic patterns are dominant in silt-rich lithologies while single
linear fractures are prominent in more clay-rich lithologies. Most occurrences exhibit
complex concentration of multiple fracture generations (Figures 4.16 (D)). Laminae
displacement from mineralized micro-faults were additionally discernable in laminated
clay-rich lithologies (Figure 4.16 (E)). Overall fracture dimension varies from single and
dendritic <1 to 3 mm to large centimetre-scale vein-fills. Most fractures are open-faced
with clear, coarse to very coarse vuggy euhedral crystals of calcite. Determining the
length of propagation however, was impossible due to constraints of core diameter and
angle of borehole penetration. From microscopic observation, distinct phases of fracture
filling of “cement bridges” are visible comprising mostly of calcite and dolomite cements,
while some contain host rock inclusions (Figure 4.17). Such cements form in fractures
due to simultaneous sealing of fractures as they open. They are known as synkinematic
cements (Hilgers & Urai 2002) or mineralised fractures from crack-seal mechanism (Gale
et al. 2017). Bitumen-filled fractures are distinct under core examination with sub-
vertical and horizontal clay mylonite present in silt- and clay-rich lithologies. Saddle
dolomites are also common in samples showing evidence of hydrothermal vein-filling
activity observed in silt- and bioclastic-rich lithologies (Figure 4.16 (D), (E)).

PhD Thesis | 2019
203
Figure 4.16: Fracture orientation, morphology and cementation. (A) & (B) shows the nature of calcite micro-fracture propagation through clay-rich and silt-rich samples. Fibrous meandering morphologies are typical in silt-rich units while fractures in more clay-rich units occur as relative linear bifurcating veins. (C) An example of horizontal laminae-parallel dolomitized fractures in the clay-rich core sample. (D) Showing multiple fracture and cement-filling phases. (E) fault-related laminae-displacing fractures. (F) SEM micrograph of a multi-fractured siderite vein (light grey) crosscut by calcite (dark grey), iron sulphide veins (bright white thin fractures), organic matter (black pigments) and host rock inclusions.

PhD Thesis | 2019
204
Figure 4.17: (A) – (B) Cement bridges from the simultaneous sealing of fractures as they open (synkinematic cements- Hilgers and Urai (2002) or crack-seal mechanism– Gale et al. (2017). Some bridges may contain brecciated host rock inclusions as observed in (C) & (D).
PhD Thesis | 2019
205
Discussion
4.5.1 Paleo-redox conditions
Since authigenic processes are chemical reactions, the redox conditions within
sedimentary basins impact geochemical reactions especially in the precipitation of early
authigenic minerals. Trace-element enrichment studies allow for the reconstruction of
certain geochemical conditions that prevailed during deposition and early diagenesis
(Algeo & Maynard 2004; Tribovillard et al. 2006). The changes observed in trace element
enrichment are a reflection of changes in chemical conditions. Within the studied
samples, there is high trace element enoroch in coarser (silt-rich and bioclast-rich)
sampes. This variability in trace element concentration may be attributed to higher
mobility of aqueoous pore waters within the coarser sediments than sediments
dominated by clay-sized particles.
Under reducing conditions, redox-sensitive trace elements like U, V and Mo remain in
solution in reducing pore waters (e.g. Tribovillard et al. 2006). Their authigenic
enrichment is high in sediments preserved under poorly oxygenated conditions
(Tribovillard et al. 2006). The Hodder samples are observed to be more enriched with U
than V and Mo. While U and V accumulate largely under anoxic conditions, Mo
sequestration requires free H2S from euxinic setting (Calvert & Pedersen 1993; Algeo &
Maynard 2004; Tribovillard et al. 2004; Helz et al. 2011). In suboxic conditions, there is
more U uptake than Mo (Algeo and Tribovillard 2009). The EF data shown in Table 6
suggest generally suboxic conditions. Few Hodder Mudstone samples have maximum EF
values for Mo up top 20 (Figure 4.4). This may infer intermittent periods of euxinia.
The statistical data of V/(V+Ni) ratios (Figure 4.5) is indicative of sediment deposition in
a mostly anoxic environment. The observed variation in the U/Th ratios (Figure 4.5)

PhD Thesis | 2019
206
indicates a predominantly anoxic condition of deposition with limited oxygenated
periods. The enrichment values of Ni and Cu in the studied samples were significantly low
with average EF values between 0.99 and 7.45 for Ni and 0.12 and 1.16 for Cu (Table 6).
These values suggest either limited organic matter preservation or low biological
productivity during deposition of the Hodder Mudstone. Nickel and Copper are trace
elements delivered in association with organic matter as organometallic complexes and
are only released through organic matter decay (Piper & Perkins 2004; Tribovillard et al.
2006). Ni and Cu are not enriched in sediments unless trapped by settling organic
particle, even when reducing conditions are met. These EF values of Ni and Cu are low in
comparison to most black shales (e.g. Piper & Dean 2002; Algeo & Maynard 2004) and
suggests that the Hodder Mudstone apparently received a limited influx of organic
matter, although reducing conditions were met. The limited influx of organic matter may
likely be responsible for low TOC values recorded in the analysed samples.
4.5.2 Paragenetic sequence
The diagenetic mineral development within the Hodder Mudstone is largely dominated
by early carbonate and sulphide minerals diagenesis with kaolinite precipitation. Late
phase diagenesis was characterised by further carbonate crystallization, quartz
cementation, clay mineral transformation and organic matter maturation. The Bowland
Basin being earlier explored for Pb and Zn ore implies a possible impact of hydrothermal
processes with burial diagenetic mineral alteration, especially, dolomitization. A
paragenetic sequence summary chart of the Hodder Mudstone is presented in Figure
4.18.
Identified early diagenetic minerals in the Hodder Mudstone samples include framboidal
pyrite and marcasite, kaolinite, calcite and dolomite. Further evidence exists to suggest

PhD Thesis | 2019
207
early silica authigenesis in the form of opal A-CT transformation. Both quartz
authigenesis from opal-CT-quartz and kaolinite-illite transformation is attributed to late
diagenetic phases.
Figure 4.18: Paragenetic evolution chart of the Carboniferous Hodder Formation
The following processes in non-chronological order of events were considered active and
controlled diagenesis in the Hodder Mudstone.
Early dissolution of aragonite and calcite cementation.

PhD Thesis | 2019
208
Dissolution of opaline (siliceous) tests and subsequent calcification of tests.
Availability of Al-, Si-, Fe- and K-rich pore waters influenced by the detrital supply
of clay minerals, iron oxides and oxyhydroxides.
Ferroan carbonate and iron sulphide precipitation.
Clay mineral reaction (illitization of kaolinite) and release of Al and Si
Production of organic acids and localised mobility of Al- and Si-rich fluids in pores
Pore fluid over-pressuring, fracturing and precipitation of cements and emplacement of
hydrocarbon in fractures
4.5.2.1 Calcification and dolomitization
Calcite and ferroan dolomite nodules within the mud-rich beds may represent the earliest
formed diagenetic event. This was presumably prior to, or syngenetic with, micrometric
dolomite nucleation (Figure 4.12) and dissolution/calcification of aragonitic shells. Rusty
brown nodules of ferroan-dolomite composition probably formed from the authigenesis
and replacement of metastable primary carbonates, likely influenced by Mg-Ca-rich pore
water and products from organic matter reactions (Curtis & Coleman 1986). The
presence of skeletal debris of shallow marine platforms and biogenic allochems of
phytoplankton are possible primary sources of calcite mineral. The dissolution of
aragonitic shells and forams most likely provided Mg2+-rich solutes for dolomite
crystallization. The enrichment values of Ni and Cu suggested a possible degradation of
organic matter, hence, bicarbonate ions may have been released from organic matter
degradation resulting in organogenic dolomitization. Calcite cementation of kaolinite-
filled shelter pores and intercrystalline pores of pyrite framboids (Figure 4.12 (D); Figure
4.14 (C); Figure 4.11) suggests chemical precipitation subsequent to kaolinite and pyrite
formation. With an increased availability of Fe2+ ions in pore water under reducing
condition, ferroan carbonate nodules were likely formed in clay-rich beds. Fe may have

PhD Thesis | 2019
209
been sourced from hydroxide components of clay minerals. Al vs Zr cross plots indicate
terrestrial sources of sediments.
Zoned dolomite crystals exhibit dark grey cores and mostly concentric rhombohedral
syntaxial overgrowths (Figure 4.12). The irregularity in shape, their small grain size and
homogeneity in colour of cores within zoned dolomite crystals have been identified to be
typical of detrital dolomite cores (Martire et al. 2014). Nucleation of rhombic dolomite
around detrital dolomite substrates is a common form of dolomitization in sedimentary
rocks (e.g. Taylor & Gawthorpe 2003; Martire et al. 2014). However, the curved surfaces
observed in the microcrystalline nucleus of dolomite rhomb within the Hodder samples
are not ubiquitous and may only represent the dominance of surface free energy over the
free energy from the internal structure of anisotropic sub-micron-sized crystals (Sibley
and Gregg 1987). It is thus postulated in this study that both the nucleus and rhombic
planar crystal outgrowth of the nucleated dolomite crystals are entirely authigenic. The
bending of surrounding clay mineral sheets around dolomite rhombs from differential
compaction is suggestive of pre-compaction dolomitization event (Figure 4.12). Multiple
zoning patterns observed in the dolomite rhombs are most likely a reflection of changes
in Fe2+ and Mg2+ concentration in pore fluid early in the diagenetic history. Further
dolomitization of calcite especially in coarser-grained lithologies occurred as
petrographic patches of non-planar ferroan to non-ferroan rhombohedra texture
replacing calcite cement (Figure 4.12 (D)). Dolomitization may form from early
diagenetic or hydrothermal alteration. The studied cores were retrieved during a Pb-Zn
mineral exploration; Pb-Zn mineralization is widely reported to be associated with
dolomitization (Wilkinson et al. 2005; Wilkinson and Eyre 2005; Konari et al. 2018).
Crystalline boundary shapes are distinguishing features of early and later-phase
dolomitization. The planar dolomites observed in Figure 4.12(A-C) are typical of early

PhD Thesis | 2019
210
diagenetic dolomites while late diagenetic dolomites are mostly anhedral with non-
planar crystal boundary shape as observed in Figure 4.12 (D). Using the Sibley and Gregg
(1987) dolomite crystallization model, a low formation temperature (50 – 100° C) is
inferred. Early diagenetic iron-rich dolomite has been attributed to organogenic (organic
matter-mediated) dolomitization which is influenced by microbial decomposition by
sulphate reducing bacterial or microbial methanogenesis (Curtis & Coleman 1986;
Slaughter & Hill 1991). Planar dolomites can be hydrothermal in nature, forming at pore
water temperatures of >70°C (Hitzman et al. 1998). However, studies by Wright et al.
(2008) show that planar dolomite diagenesis is more compatible with a low-temperature
environment. It is not conclusive from this study as to the dolomitization temperature
given that isotopic analysis of the samples were beyond the remit of this study. However,
from basic cross-cutting relationship of crystal occurrences with neighbouring minerals
and mechanical deformation, the planar, euhedral dolomite crystals were formed prior
compaction and consequently under low temperature conditions. Determining the
source of fluid transport in the Bowland Basin also proved problematic, but, pore fluid
was significantly saturated with respect to Mg, Ca and Fe. The occurrence of early
diagenetic dolomite and pyrite may be attributed to microbial actions. Results from trace
elemental organic productivity data (Ni and Cu) shows limited organic matter
preservation which may be a reflection of increased bacterial action. Another alternative
to dolomite crystal precipitation is the mixing of meteoric water and sea water.
Determining this is possible using the δ 18O isotopic values which was beyond the scope
of the study.
4.5.2.2 Iron sulphide crystallization
Pyrite and marcasite in mudstones are common authigenic (syngenetic or diagenetic)
minerals formed in oxygen-depleted bottom water or pore fluids rich in ferrous iron and

PhD Thesis | 2019
211
hydrogen sulphide from microbial sulphate reduction (Raiswell 1982; Berner 1984;
Wilkin et al. 1997; Wilkin 2003). Studies have shown that precipitation of pyrite is not
restricted to any particular environment as they may form in near oxic to anoxic and
euxinic environments (Rickard 1997; Wilkin et al. 1996; Wilkin et al. 1997; Bond et al.
2004). Furthermore, pyrite mineral formation could be syngenetic (formed within the
water column) or early diagenetic (few meters below the SWI at the redox boundary)
(Wilkin et al. 1997). Due to their sensitivity to sedimentation rate, bottom-water
oxygenation and nature of reactive sulphides and iron, their environment of formation
can be inferred by measuring spherule diameter of the framboids (Wilkin et al. 1996;
Bond et al. 2004; Taylor & Macquaker 2000).
Micro-framboids dominate the studied Hodder Mudstone samples. They are occasionally
found in spherule moulds of organic materials and pseudomorphs of skeletal tests
(Figure 4.15). Framboids of <5 µm to nanometre sizes are found in the samples and are
recognised as products of euxinia (Wilkin et al. 1997; Wignal and Newton 1998). A few
analysed clay-rich samples in the Hodder were enriched with <5 µm sized framboids
which are attributed to the inability of minute pyrite spherules achieving larger
diameters in euxinic water column before sinking below the Fe-reduction zone (e.g.
Wilkin et al. 1997). Larger and more variably-sized framboids represent pyrite formation
along redox boundaries of anoxic-dysoxic sediment layer (e.g. Bond et al. 2004).
As shown in Figures 4.15 (E) & (F), marcasite appears as apparent remnant shapes of
pyrite framboids or overgrowths on pyrite crystals. These morphologies are similar to
those observed by Bush et al. (2004), Schieber & Ricipuli (2005) and Schieber (2011).
Marcasite is formed from intermittent oxidation and dissolution of reworked pyrite
grains (Schieber & Riciputi 2005; Schieber 2011). Schoonen & Barnes (1991) earlier

PhD Thesis | 2019
212
discovered that pyrite and marcasite coexist in solution with pH values between 4 and 6
(pH<4 marcasite formation dominates and at pH<6, only pyrite is formed). A reduction
in pH was caused by the raised dissolved iron from pyrite dissolution or a general
abundance of dissolved iron in pore water. The presence of marcasite and pyrite in the
Hodder samples, hence, indicates periods of intermittent but low pH in pore waters.
4.5.2.3 Kaolinitization
The observed site of kaolinite precipitation in shelter pores and between pore spaces
indicates authigenic kaolinite in the Hodder Mudstone to have precipitated early in the
burial history by direct precipitation from Al- and Si-rich pore fluids (e.g. Burton et al.
1987; Taylor & Macquaker 2014). Studies have shown that under shallow depth and low
temperature (<80°C) in marine environments, pore water is commonly in equilibrium
with respect to kaolinite and later calcite (Bjørlykke 2011; Bjørlykke 2015a).
Aluminosilicate solutions are commonly a by-product of feldspar
dissolution/replacement reactions (Bjørlykke 1998; Worden & Morad 2003; Taylor &
Macquaker 2014). Aluminisilicate solutions might also result from the transformation of
Al- and Fe-rich siliceous tests (Michalopoulos et al. 2000; Michalopoulos & Aller 2004),
alteration of unstable volcanic debris (Pollastro 1981) or silicification of hydrated oxides
from tropical drainage (Curtis & Spears 1971). Each of these processes involves the
mobility of aqueous fluids rich in aluminium and silica ions with the capacity of removing
Na+, K+ and /or Ca+ ions from the solution (Bjørlykke 1998).The possibility of kaolinite
precipitation from the alteration of volcanic debris may be ruled out as there was no
substantial evidence suggestive of volcanism within the succession.
In the Hodder Mudstone, the appearance of altered detrital albite crystals in few samples
shows a plausible indication of feldspar alteration as a precursor of authigenic kaolinite.
Additionally, the dissolution of biosiliceous tests as observed in calcified radiolarian tests

PhD Thesis | 2019
213
(Figure 4.10) presents a possible cause for aluminosilicate production (e.g.
Michalopoulos & Aller 2004). The transformation of feldspars in conjunction with opaline
silica dissolution at the earliest phase of diagenesis may also have supplied aluminium
and silica ions needed for the precipitation of kaolinite. More strongly, the abundance of
iron sulphides and ferroan carbonate cements in the studied samples suggests high
availability of Fe (II) that reacted with released sulphides and carbonates. Fe (II) are
products of reduced Fe (III) from detrital clay minerals by the action of Fe (III) reducing
bacteria (Adams et al. 2006), and Al required for kaolinite precipitation are also known
to be sourced from poorly crystalline aluminium oxides and clay minerals (Taylor and
Macquaker 2014). Based on evidence presented in this study, it is assumed that
terrestrially-derived clay minerals and aluminium oxides were responsible for kaolinite
precipitation in the studied samples. It is also expected that an efficient mobilization of
Al in pore waters to cementation sites was active. Owing to the presented evidence of
microbial processes, it could conceivably be hypothesised that organic acid produced
during microbial respiration provided Al-mobilization pore waters to sites of kaolinite
precipitation.
4.5.2.4 Silica authigenesis
Authigenic quartz is abundant in the samples, can be more than 90% on average of total
quartz in thin section and occurs in three forms, namely: (1) quartz
overgrowths/outgrowths, (2) pore-filling intergranular quartz and (3) microcrystalline
quartz. The abundance of authigenic quartz in the Hodder Mudstone poses a significant
question regarding the potential source of aqueous silica for the high rate of cementation.
In this section, three sources of dissolved silica for authigenic precipitation are
considered.
PhD Thesis | 2019
214
A biogenic origin is first considered. The presence of calcified sponge spicules and
radiolarian tests (Figures 4.10 (E) & (F)) and assuming a mixed detrital silica provenance
from major elemental data (Figure 4.8), leads to opal A-CT-to-quartz transformation as a
possible authigenic silica precursor. It is perceived that the dissolution of
thermodynamically unstable opaline silica from biosiliceous debris provided a silica-
saturated solution for precipitation of micro- and meso-crystalline quartz grains coatings,
pore-fillings and overgrowths (e.g. Behl 1998; Huggett et al. 2005; Thyberg et al. 2010;
Behl 2011b). It is proposed in this study that biogenic amorphous opaline silica (opal A)
dissolved under elevated temperature (50 – 70°C) and was precipitated as crystobalite
(opal CT) and progressively to quartz at temperatures between 60 and 80°C (e.g.
Bjørlykke & Egeberg 1993; Spinelli et al. 2007; Behl 2011b). This dissolution and
replacement of opal A to opal CT is considered to be early diagenetic, occurring under 1.5
– 2 km overburden assuming average geothermal gradient of 30 - 40°C/km (Bjørlykke
2015a). Whereas, the more thermodynamically stable quartz precipitated from
crystobalite under high temperature at a later stage (temperature ~80°C) (Behl 2011b).
Their textural expression can be observed in core and field exposures as hard dense
aphanitic texture with a smooth conchoidal fracture and a vitreous lustre (Behl 2011b).
Such features were visible in the Hodder Mudstone core samples (chapter 3).
A second conceivable source for silica cement in the Hodder Mudstone is from clay
mineral transformation reaction. Although not detected from whole rock XRD analysis,
fibrous illite is petrographically evident within a few samples occurring with
microcrystalline quartz (Figure 4.13 (E)). Sheet-like quartz precipitation has been
attributed to silica released by clay dissolution-precipitation reactions e.g. kaolinite-illite,
at temperatures between 120-140°C (Bjørlykke 1998; Thyberg & Jahren 2011). Illite is
significantly associated with microcrystalline quartz in the studied samples and is

PhD Thesis | 2019
215
identified as prominent clay mineral within some studied Hodder Mudstone samples by
Clarke et al. (2018). Hence, a second possible silica source for quartz cementation is a
dissolution-precipitation reaction of kaolinite-to-illite transformation (e.g. Bjørlykke &
Aagaard 1992; Bjørlykke 1998; Nadeau et al. 2002).
A third and final considered source of silica cement examined in this study is from
pressure solution of quartz grains at wielded quartz grain edges. Petrographic evidence
of silt-sized quartz grain contacts seemed problematic, however, the abundant stylolites
in silt-rich core samples provide evidence of pressure-related mineral dissolution.
Studies have shown that pressure solution of quartz is associated with stylolite formation
(Bjørlykke & Egeberg 1993; Walderhaug & Bjorkum 2003). Hence, this possibility cannot
be ruled out.
Any of these authigenic processes may have occurred at varying periods of burial. No
attempt, however, was made to determine the relative contributions of the different silica
sources due to technical adequacy beyond the scope of this study. From the available
evidence, the most likely dominant source of dissolved silica for authigenic quartz cement
in the Hodder Mudstone is here considered to be from the diagenesis of amorphous
opaline silica (opal A – opal CT – quartz transformation). This assumption is adopted due
to strong evidence of calcified test of siliceous radiolarian and sponge microfossils
(Figures 4.13 (C) & (D)). Also, assuming similar relative silica composition from present-
day warm marine environments, organic silica supply remains the dominant source of
dissolved silica in seawater (Bjørlykke 2015a). Another plausible hypothesis for a
substantial contributor of silica cement within the Hodder is from the illitization of
kaolinite. Although clay mineral transformation occur at higher crystallization
temperature than opal-quartz transformation, the absence of burial/thermal history

PhD Thesis | 2019
216
curve presents a challenge into adopting this possibility. If proven, this may have equally
contributed largely to quartz cementation in the Hodder Mudstones, although illite
cement was mostly found in sand-rich samples.
From petrographic textural evidence of silica cement distribution it is affirmed that
precipitation of authigenic quartz in the samples happened locally within sites of silica
dissolution (e.g. Bjørlykke & Egeberg 1993). It is thus concluded that the abundance of
authigenic silica in the Hodder Mudstones resulted from the local precipitation of
aqueous silica fluid originating largely from the dissolution of siliceous tests and possibly
illitization of kaolinite.
4.5.2.5 Fracture evolution
Fracture diagenesis in the Hodder Mudstone is attributed to late paragenetic events prior
to the expulsion of hydrocarbon due to lithostatic stress and tectonics. Basic cross-cutting
relationship of multiple fractures indicate multiple phases of stress and/or tectonics
(Figures 4.16 (D) & (F)). Millimetre-scale fractures observed in the studied samples
exhibit typical characteristics of hydraulic fractures formed due to pore-fluid
overpressure (e.g. Cosgrove 2001; Goulty et al. 2012). Morphologies of direct fault-
associated fractures are also evident (Figure 4.16 (E)). Hydraulic fracturing ensues under
extensional tectonic stress conditions when pore pressure approaches the minimum
principal stress (Goulty et al. 2012). Pore-fluid overpressure may have resulted within
the Hodder Mudstones from compaction disequilibrium (rapid burial) or thermal
expansion during catagenesis (e.g. Swarbrick et al. 2002; Goulty et al. 2012) or potentially
from fluid release during illitization (e.g. Lahann 2002; Nadeau et al. 2002).
Most fractured laminae are vertically displaced (microfaults) (Figure 4.16 (E)). The shear
patterns of resultant mineralised veins in these fractures are associative of brittle failure

PhD Thesis | 2019
217
from complex shear and tensile strain (Cosgrove 2001). This may be linked to lithostatic
pressure and syn- to post-depositional extensional basin tectonics. “Cement bridges” are
also significant features in most fractures (Figures 4.17 (A) – (D)) interpreted in this
study to have been emplaced simultaneously, sealing the fractures. This phenomenon is
described as synkinematic cementation by Hilgers and Urai (2002) and as the crack-seal
mechanism by Gale et al. (2017). The precipitation of ankerite cements in fractures
suggests that ankerite precipitation in fractures of clay-rich units was not inhibited by
the “unfavourable” organic– and clay-rich wall-rock material substrates as observed by
Lander and Laubach, (2014).
Implications
The success of hydraulic fracture simulation of mudstones for shale gas exploitation is
dependent upon the rock’s mechanical behaviour. Among other properties such as
porosity and diagenesis (Milliken et al. 2012), the mechanical property (brittleness) of
mudstones is significantly controlled by mineral composition (Bowker 2007; Jarvie et al.
2007; Han et al. 2015; Rybacki et al. 2016). Quartz and calcite are more brittle than clay
minerals, hence, the abundance of these minerals is desirable in shale resource
prospecting. All lithologies within the Hodder mudstones contain on average 50% of
calcite (Clay-rich units: 35%, silt-rich units: 45%; Bioclastic sand-rich units: 68%) and
24% quartz (Clay-rich units: 27%, silt-rich units: 26%, Bioclastic sand-rich units: 19%)
suggesting a bulk mineralogical composition of favourable brittleness.
The abundance of quartz in organic-rich mudstones have strong implications for fracture
simulation and hydrocarbon retaining capacity in shale reservoirs (Han et al. 2015). More
effectively, the occurrence of authigenic silica as grain-binding cements is known to
enhance brittle behaviour during both natural and induced mechanical deformation

PhD Thesis | 2019
218
(Milliken 2013). Comparatively, quartz content in the prolific Mississippian Barnet shale
and the Cretaceous Eagle Ford Formation is dominated by authigenic quartz (Loucks &
Ruppel 2007; Milliken et al. 2007; Milliken et al. 2016).
The occurrence of authigenic quartz in recent studies of quartz cementation within
mudstones presents a caution to mudstone sedimentary geologist on the danger in
misinterpreting quartz occurrences as detrital in the absence of SEM-CL examination. The
results from SEM-CL examination found that the total quartz content of the Hodder
samples is anomalously dominated by authigenic quartz (up to 90%) as euhedral and
anhedral quartz grains, grain-binding cements and microcrystalline quartz (Figure 4.12).
One of the more significant findings from this study is that the Hodder Mudstone present
a highly brittle formation suitable for hydraulic fracture simulation. However, important
questions are raised over the abundance of calcareous faunas with originally unstable
aragonitic composition. As observed from the results, the dissolution of aragonite leads
to nonporous sparry calcite precipitation in shelter pores and interparticle spaces, thus,
negatively affecting pore preservation. Conversely, however, early kaolinite precipitation
in shelter pores may enhance pore preservation between individual sheets, and the
bending of phyllosilicate sheets around rigid carbonate and quartz grains may preserve
wedge-shaped pores (e.g. Schieber 2013). But under a different circumstance where
kaolinite is precipitated between muscovite cleavage sheets, pore preservation is
unattainable due to its susceptibility to subsequent mechanical compaction.
Furthermore, cases of calcite cementation within kaolinite “booklets” in bioclastic
dominated beds amounts of further loss in porosity especially in coarser grained units.
Taken together, these findings point to the role of primary sedimentary components in
controlling carbonate and silica diagenesis within a mixed clastic mudstone. The ideas,

PhD Thesis | 2019
219
results and discussions presented in this study are not only profitable to the Bowland
Basin. While the understanding of diagenetic alteration in a mixed carbonate and
siliciclastic unconventional reservoir is significant in evaluating the Hodder Mudstone as
an effective unconventional reservoir, the implications of silica authigenesis is far
reaching in most mudstones.
Conclusion
The results shown from elemental, mineralogical and organic matter distribution within
the Hodder Mudstones suggests a mix of terrigenous and biogenic derived primary
sedimentary constituents. Textural differences within the lithologies reflect the observed
variations in the primary and subsequent diagenetic components. This has been clearly
observed in the increasing carbonate content with grain size increase and preferential
authigenic carbonate mineral cementation. Another significant finding from the analysis
of palaeoredox proxies suggests fluctuating redox conditions during early burial with
generally low pore-water oxygenation. Such fluctuations in redox conditions favoured
the formation of pyrite and marcasite, kaolinite and carbonate dissolution and
precipitation. Additional, it was very evident from the palaeo-productivity analysis that
organic matter influx was limited, hence, generally low TOC values.
In general, the paragenetic sequence of minerals within the Hodder Mudstone is
characterised by overlaps in biogeochemical and geochemical processes. Presented data
suggest a complex interplay of organic matter microbial methanogenesis, Fe- and Al-rich
pores fluids from the terrestrial influx and organic acid fluid mobility. Carbonate,
kaolinite and sulphide mineral precipitation occurred almost concurrently early in the
diagenetic history with certain framboidal pyrite forming within the water column

PhD Thesis | 2019
220
shortly prior sedimentation. These processes were succeeded by later phase silica
authigenesis with minor chlorite and illite clay mineral replacements.
Analyses presented here further shows that the Hodder Mudstone is composed of >70%
brittle material largely from authigenic processes, hence, a potentially good shale
reservoir. More significantly, authigenic quartz is the volumetrically dominant form of
silica within the Hodder Formation. The proposed hypothesis from this study posits that
diagenetic silica precipitation was sourced from the transformation of opaline silica and
further silicate mineral reactions (e.g. kaolinite-illite transformation) possibly
contributed to the release of aqueous silica during burial.
References
Abanda, P.A. & Hannigan, R.E., 2006. Effect of diagenesis on trace element partitioning in
shales. Chemical Geology, 230(1–2), pp.42–59.
Adams, A.E. & MacKenzie, W.S., 1999. A Colour Atlas of Carbonate Sediments and Rocks
under the-Microscope, Schweizerbart’sche Verlagsbuchhandlung.
Aitkenhead, N. et al., 1992. Geology of the Country around Garstang. British Geological
Survey Memoir for 1:50000 geological sheet 67 (England and Wales).
Algeo, T.J. & Maynard, J.B., 2004. Trace-element behavior and redox facies in core shales
of Upper Pennsylvanian Kansas-type cyclothems. Chemical Geology, 206(3–4),
pp.289–318.
Andrews, I.J., 2013. The Carboniferous Bowland Shale gas study: geology and resource
estimation. British Geological Survey for Department of Energy and Climate
Change, London, UK.
Aplin, A.C. & Macquaker, J.H.S., 2011. Mudstone diversity: Origin and implications for
source, seal, and reservoir properties in petroleum systems. AAPG Bulletin, 95,
pp.15–34.
Armitage, P.J. et al., 2016. Permeability of the Mercia Mudstone: Suitability as caprock to
carbon capture and storage sites. Geofluids, 16(1), pp.26–42.
Arostegui, J. et al., 2001. Microtextures and the origin of muscovite-kaolinite
intergrowths in sandstones of the utrillas formation, Basque Cantabrian Basin,
Spain. Clays and Clay Minerals, 49(6), pp.529–539.

PhD Thesis | 2019
221
Bauluz, B. et al., 2008. Genesis of kaolinite from Albian sedimentary deposits of the
Iberian Range (NE Spain): analysis by XRD, SEM and TEM. Clay Minerals, 43(3),
pp.459–475.
Behl, R.J., 2011. Chert spheroids of the Monterey Formation, California (USA): Early-
diagenetic structures of bedded siliceous deposits. Sedimentology, 58(2), pp.325–
351.
Behl, R.J., 1998. Relationships between silica diagenesis, deformation, and fluid flow in
Monterey formation cherts, Santa Maria Basin, California. SEPM Special
Publication, 83.
Berner, R.A., 1984. Sedimentary pyrite formation: An update. Geochimica et
Cosmochimica Acta, 48(4), pp.605–615.
Bjørlykke, K., 1998. Clay Mineral Diagenesis in Sedimentary Basins — A Key to the
Prediction of Rock Properties. Examples from the North Sea Basin. Clay Minerals,
33(1), pp.15–34.
Bjørlykke, K., 2015a. Mudrocks, shales, silica deposits and evaporites. In Petroleum
Geoscience: From Sedimentary Environments to Rock Physics, Second Edition.
Bjørlykke, K., 2011. Open-system chemical behaviour of Wilcox Group mudstones. How
is large scale mass transfer at great burial depth in sedimentary basins possible? A
discussion. Marine and Petroleum Geology, 28(7), pp.1381–1382.
Bjørlykke, K., 2015b. Petroleum geoscience: From sedimentary environments to rock
physics, second edition,
Bjørlykke, K. & Aagaard, P., 1992. Clay Minerals in North Sea Sandstone. SEPM Special
Publication, 47.
Bjørlykke, K. & Egeberg, P.K., 1993. Quartz cementation in sedimentary basins.
American Association of Petroleum Geologists Bulletin, 77(9), pp.1538–1548.
Bohacs, K.M. et al., 2005. Production, destruction, and dilution— the many pathways to
source-rock development K. M. Bohacs et al., eds. The Deposition of Organic-
Carbon-Rich Sediments: Models, Mechanisms, and Consequences, 82, pp.61–101.
Bond, D., Wignall, P.B. & Racki, G., 2004. Extent and duration of marine anoxia during
the Frasnian-Famennian (Late Devonian) mass extinction in Poland, Germany,
Austria and France. Geological Magazine, 141(2), pp.173–193.
Böning, P. et al., 2004. Geochemistry of Peruvian near-surface sediments. Geochimica et
Cosmochimica Acta, 68(21), pp.4429–4451.
Bowker, K.A., 2007. Barnett shale gas production, Fort Worth Basin: Issues and
discussion. AAPG Bulletin, 91, pp.523–533.
Brandon, A. et al., 1998. Geology of the Country around Lancaster: Memoir for 1:50 000
Geological Sheet 59 (England and Wales) - Geological Memoirs & Sheet
Explanations. British Geological Survey Research Report.

PhD Thesis | 2019
222
Burton, J.H., Krinsley, D.H. & Eye, K., 1987. Texas Gulf Coast Sediments. , 35(4), pp.291–
296.
Bush, R.T., McGrath, R. & Sullivan, L.A., 2004. Occurrence of marcasite in an organic-rich
Holocene estuarine mud. Soil Research, 42(6), p.617. Available at:
http://www.publish.csiro.au/?paper=SR03079.
Calvert, S.E. & Pedersen, T.F., 1993. Geochemistry of Recent oxic and anoxic marine
sediments: Implications for the geological record. Marine Geology, 113(1–2),
pp.67–88.
Chalmers, G.R.L. & Bustin, R.M., 2015. Porosity and pore size distribution of deeply-
buried fine-grained rocks: Influence of diagenetic and metamorphic processes on
shale reservoir quality and exploration. Journal of Unconventional Oil and Gas
Resources, 12, pp.134–142.
Clarke, H. et al., 2018. Shale gas resources of the Bowland Basin, NW England: a holistic
study. Petroleum Geoscience, 066(Bushell 1986).
Clarke, H., Turner, P. & Bustin, R.M., 2014. Unlocking the resource potential of the
Bowland Basin, NW England. Society of Petroleum Engineers - European
Unconventional Resources Conference and Exhibition 2014: Unlocking European
Potential, 2(February), pp.25–27.
Curtis, C.D. & Coleman, M.L., 1986. Controls on the precipitation of early diagenetic
calcite, dolomite and siderite concretions in complex depositional sequences D. L.
Gautier, ed., SEPM Special Publication.
Curtis, C.D. & Spears, D.A., 1971. Diagenetic development of kaolinite. Clays and Clay
Minerals, 19(4), pp.219–227.
Dowey, P.J. & Taylor, K.G., 2017. Extensive authigenic quartz overgrowths in the gas-
bearing Haynesville-Bossier Shale, USA. Sedimentary Geology, 356, pp.15–25.
Espitalié, J. et al., 1977. Source rock characterization method for petroleum exploration.
Offshore Technology Conference, Houston.
Fewtrell, M. & Smith, D., 1980. Revision of the Dinantian stratigraphy of the Craven
Basin, N England. Geological Magazine, 117(01), pp.37–49.
Fraser, A.J. & Gawthorpe, R.L., 2003. An atlas of Carboniferous basin evolution in
Northern England. Geological Society Memoir, 28.
Fraser, A.J. & Gawthorpe, R.L., 1990. Tectono-stratigraphic development and
hydrocarbon habitat of the Carboniferous in northern England. Geological Society,
London, Special Publications, 55(1), pp.49–86.
Gale, J.F.W. et al., 2017. Natural fractures in shale: A review and new observations. AAPG
Bulletin, 101(8), pp.2165–2216.
PhD Thesis | 2019
223
Gawthorpe, R.L., 1986. Sedimentation during carbonate ramp-to-slope evolution in a
tectonically active area: Bowland Basin (Dinantian), northern England.
Sedimentology, 33, pp.185–206.
Haddad, E.E. et al., 2018. Ichnofabrics and chemostratigraphy argue against persistent
anoxia during the Upper Kellwasser Event in New York State. Palaeogeography,
Palaeoclimatology, Palaeoecology, 490.
Han, Y., Mahlstedt, N. & Horsfield, B., 2015. The Barnett Shale: Compositional
fractionation associated with intraformational petroleum migration, retention,
and expulsion. AAPG Bulletin, 99(12), pp.2173–2201.
Harvey Blatt, 2003. Provenance Studies and Mudrocks. SEPM Journal of Sedimentary
Research, Vol. 55.
Hatch, J.R. & Leventhal, J.S., 1992. Relationship between inferred redox potential of the
depositional environment and geochemistry of the Upper Pennsylvanian
(Missourian) Stark Shale Member of the Dennis Limestone, Wabaunsee County,
Kansas, U.S.A. Chemical Geology, 99(1–3), pp.65–82.
Helz, G.R. et al., 2011. New model for molybdenum behavior in euxinic waters. Chemical
Geology, 21(4), pp.1139–1146.
Hendry, M.J. et al., 2015. Can argillaceous formations isolate nuclear waste? Insights
from isotopic, noble gas, and geochemical profiles. Geofluids, 15(3), pp.381–386.
Hilgers, C. & Urai, J.L., 2002. Experimental study of syntaxial vein growth during lateral
fluid flow in transmitted light: First results. Journal of Structural Geology, 24(6–7),
pp.1029–1043.
Hudson, R.G.S., 1933. The general geology and the Carboniferous Rocks: The geology of
the country around Harrogate. Proceedings of the Geologists’ Association, 49,
pp.295–352.
Huggett, J.M., Gale, A.S. & Wray, D.S., 2005. Diagenetic Clinoptilolite and Opal-CT from
the Middle Eocene Wittering Formation, Isle of Wight, U.K. Journal of Sedimentary
Research, 75(4), pp.585–595.
Jarvie, D.M. et al., 2007. Unconventional shale-gas systems: The Mississippian Barnett
Shale of north-central Texas as one model for thermogenic shale-gas assessment.
AAPG Bulletin, 91(4), pp.475–499.
Jones, B. & Manning, D.A.C., 1994. A comparison and correlation of different geochemical
indices used for the interpretation of depositional environments in ancient
mudstones. Chemical Geology, 111(1–4), pp.111–129.
Ko, L.T. et al., 2016. Pore and pore netwrok evolution of Upper Cretaceous Boquillas
(Eagle Ford-equivalent) mudrocks: Results from gold-tube pyrolysis experiments.
AAPG Bulletin.

PhD Thesis | 2019
224
Lazar, O.R. et al., 2015. Capturing key attributes of fine-grained sedimentary rocks in
outcrops, cores, and thin sections; nomenclature and description guidelines.
Journal of Sedimentary Research, 85(3), pp.230–246.
Loucks, R.G. & Ruppel, S.C., 2007. Mississippian Barnett Shale: Lithofacies and
depositional setting of a deep-water shale-gas succession in the Fort Worth Basin,
Texas. AAPG Bulletin, 91(4), pp.579–601.
Macquaker, J.H.S. et al., 2014. Compositional controls on early diagenetic pathways in
fine-grained sedimentary rocks: Implications for predicting unconventional
reservoir attributes of mudstones. AAPG Bulletin, 98(3), pp.587–603.
Macquaker, J.H.S. & Howell, J.K., 1999. Small-scale (<5.0 m) vertical heterogeneity in
mudstones: Implications for high-resolution stratigraphy in siliciclastic mudstone
successions. Journal of the Geological Society of London, 156, pp.105–112.
Macquaker, J.H.S., Taylor, K.G. & Gawthorpe, R.L., 2007. High-resolution facies analyses
of mudstones: Implication for paleoenvironmental and sequence stratigraphic
interpretations of offshore ancient mud-dominated successions. Journal of
Sedimentary Research, 77, pp.324–339.
Madhavaraju, J. et al., 2016. Paleoclimate, paleoweathering and paleoredox conditions of
Lower Cretaceous shales from the Mural Limestone, Tuape section, northern
Sonora, Mexico: Constraints from clay mineralogy and geochemistry. , pp.1–15.
Martire, L. et al., 2013. Selective dolomitization by syntaxial overgrowth around detrital
dolomite nuclei: A case from the Jurassic of the Marguareis (Ligurian
Briançonnais, Ligurian Alps). Journal of Mediterranean Earth Sciences, 5(October),
p.113.
McGlade, C., Speirs, J. & Sorrell, S., 2013. Unconventional gas - A review of regional and
global resource estimates. Energy, 55, pp.571–584.
Melikoglu, M., 2014. Shale gas: Analysis of its role in the global energy market.
Renewable and Sustainable Energy Reviews, 37, pp.460–468.
Michalopoulos, P. & Aller, R.C., 2004. Early diagenesis of biogenic silica in the Amazon
delta: Alteration, authigenic clay formation, and storage. Geochimica et
Cosmochimica Acta, 68(5), pp.1061–1085.
Michalopoulos, P., Aller, R.C. & Reeder, R.J., 2000. Conversion of diatoms to clays during
early diagenesis in tropical, continental shell muds. Geology, 28(12), pp.1095–
1098.
Milliken, K. et al., 2007. “Cherty” stringers in the Barnett Shale are agglutinated
foraminifera. Sedimentary Geology, 198(3–4), pp.221–232.
Milliken, K.L. et al., 2012. Grain assemblages and strong diagenetic overprinting in
siliceous mudrocks, Barnett Shale (Mississippian), Fort Worth Basin, Texas. AAPG
Bulletin, 96(8), pp.1553–1578.

PhD Thesis | 2019
225
Milliken, K.L., 2013. SEM-based cathodoluminescence imaging for discriminating quartz
types in mudrocks. Unconventional Resources Technology Conference, 1582467.
Milliken, K.L. & Day-Stirrat, R.J., 2013. Cementation in mudrocks: Brief review with
examples from cratonic basin mudrocks. AAPG Memoir, 103, pp.133–150.
Milliken, K.L., Ergene, S.M. & Ozkan, A., 2016. Quartz types, authigenic and detrital, in the
Upper Cretaceous Eagle Ford Formation, South Texas, USA. Sedimentary Geology,
339, pp.273–288.
Nadeau, P.H. et al., 2002. I-S precipitation in pore space as the cause of geopressuring in
Mesozoic mudstones, Egersund Basin, Norwegian continental shelf. American
Mineralogist, 87(11–12), pp.1580–1589.
Nathan, Y. et al., 1997. Geochemistry of cadmium in the negev phosphorites. Chemical
Geology.
Neuzil, C.E., 2013. Can Shale Safely Host U.S. Nuclear Waste? Trans. Am. Geophys. Union,
94(30), pp.261–262.
Newport, S.M. et al., 2017. Sedimentology and microfacies of a mud-rich slope
succession: in the Carboniferous Bowland Basin, NW England (UK). Journal of the
Geological Society, London, (Gawthorpe 1987), p.16pp.
Piper, D.Z. & Dean, W.E., 2002. Trace-Element Deposition in the Cariaco Basin,
Venezuela Shelf, under Sulfate-Reducing Conditions—a History of the Local
Hydrography and Global Climate, 20 ka to the Present. USGS, Profession, pp.1–45.
Piper, D.Z. & Perkins, R.B., 2004. A modern vs. Permian black shale - the hydrography,
primary productivity, and water-column chemistry of deposition. Chemical
Geology, 206(3–4), pp.177–197.
Pollastro, R.M., 1981. Authigenic Kaolinite and Associated Pyrite in Chalk of the
Cretaceous Niobrara Formation, Eastern Colorado. Journal of Sedimentary
Research, Vol. 51(2), pp.553–562.
Powell, J. et al., 2010. Managing radioactive waste safely: initial geological unsuitability
screening of West Cumbria. British geological survey.
Radwan, O., Bu Khamsin, A. & Al-Ramadan, K., 2017. Detrital dolomite: Characterization
and characteristics. Geological Quarterly, 62(1), pp.81–89.
Raiswell, R., 1982. Pyrite texture, Isotopic Composition and the Availability of Iron.
American Journal of Science, 282, pp.1244–1263.
Rickard, D., 1997. Kinetics of pyrite formation by the H2S oxidation of iron (II)
monosulfide in aqueous solutions between 25 and 125°C: The rate equation.
Geochimica et Cosmochimica Acta, 61(1), pp.115–134.
Riley, N.J., 1990. Stratigraphy of the Worston Shale Group (Dinantian), Craven Basin,
north-west England. Proceedings of the Yorkshire Geological Society, 48(2),
pp.163–187.

PhD Thesis | 2019
226
Rimstidt, J.D., Chermak, J.A. & Schreiber, M.E., 2017. Processes that control mineral and
element abundances in shales. Earth-Science Reviews, 171(September 2016),
pp.383–399.
Rybacki, E., Meier, T. & Dresen, G., 2016. What controls the mechanical properties of
shale rocks? - Part II: Brittleness. Journal of Petroleum Science and Engineering,
144, pp.39–58.
Sawlowicz, Z., 1993. Pyrite framboids and their development: a new conceptual
mechanism. Geologische Rundschau, 82(1), pp.148–156.
Schieber, J., 1999. Distribution and deposition of mudstone facies in the Upper Devonian
Sonyea Group of New York. Journal of Sedimentary Research, 69(4), pp.909–925.
Schieber, J., 2016a. Experimental testing of the transport-durability of shale lithics and
its implications for interpreting the rock record. Sedimentary Geology.
Schieber, J., 2011. Marcasite in Black Shales--a Mineral Proxy for Oxygenated Bottom
Waters and Intermittent Oxidation of Carbonaceous Muds. Journal of Sedimentary
Research, 81(7), pp.447–458.
Schieber, J., 2016b. Mud re-distribution in epicontinental basins - Exploring likely
processes. Marine and Petroleum Geology, 71, pp.119–133.
Schieber, J., 2011. Reverse engineering mother nature - Shale sedimentology from an
experimental perspective. Sedimentary Geology, 238(1–2), pp.1–22.
Schieber, J., 2013. SEM Observations on Ion-milled Samples of Devonian Black Shales
from Indiana and New York: The Petrographic Context of Multiple Pore Types.
Electron microscopy of shale hydrocarbon reservoirs: AAPG Memoir 102, (April
2010), pp.153–172.
Schieber, J. & Riciputi, L., 2005. Pyrite and Marcasite Coated Grains in the Ordovician
Winnipeg Formation, Canada: An Intertwined Record of Surface Conditions,
Stratigraphic Condensation, Geochemical “Reworking,” and Microbial Activity.
Journal of Sedimentary Research, 75(5), pp.907–920.
Schoonen, M.A.A. & Barnes, H.L., 1991. Reactions forming pyrite and marcasite from
solution: I. Nucleation of FeS2below 100°C. Geochimica et Cosmochimica Acta,
55(6), pp.1495–1504.
Slaughter, M. & Hill, R.J., 1991. The influence of organic matter in organogenic
dolomitization. Journal of Sedimentary Petrology, 61(2), pp.296–303.
Spinelli, G.A. et al., 2007. Diagenesis, sediment strength, and pore collapse in sediment
approaching the Nankai Trough subduction zone. Bulletin of the Geological Society
of America, 119(3–4), pp.377–390.
Taylor, K.G. & Gawthorpe, R.L., 2003. Basin-scale dolomite cementation of shoreface
sandstones in response to sea-level fall. Bulletin of the Geological Society of
America, 115(10), pp.1218–1229.

PhD Thesis | 2019
227
Taylor, K.G. & Macquaker, J.H.S., 2014. Diagenetic alterations in a silt- and clay- rich
mudstone succession: an example from the Upper Cretaceous Mancos Shale of
Utah, USA. Clay Minerals, 49, pp.245–259.
Taylor, K.G. & Macquaker, J.H.S., 2014. Diagenetic alterations in a silt- and clay-rich
mudstone succession: An example from the Upper Cretaceous Mancos Shale of
Utah, USA. Clay Minerals, 49, pp.213–227.
Taylor, K.G. & Macquaker, J.H.S., 2000. Early diagenetic pyrite morphology in a
mudstone-dominated succession: The Lower Jurassic Cleveland Ironstone
Formation, eastern England. Sedimentary Geology, 131(1–2), pp.77–86.
Thyberg, B. et al., 2010. Quartz cementation in Late Cretaceous mudstones, northern
North Sea: Changes in rock properties due to dissolution of smectite and
precipitation of micro-quartz crystals. Marine and Petroleum Geology, 27(8),
pp.1752–1764.
Thyberg, B. & Jahren, J., 2011. Quartz cementation in mudstones: sheet-like quartz
cement from clay mineral reactions during burial. Petroleum Geoscience, 17(1),
pp.53–63.
Tribovillard, N. et al., 2004. Deep-water anoxia over the Frasnian-Famennian boundary
(La Serre, France): A tectonically induced oceanic anoxic event? Terra Nova, 16(5),
pp.288–295.
Tribovillard, N. et al., 2006. Trace metals as paleoredox and paleoproductivity proxies:
An update. Chemical Geology, 232(1–2), pp.12–32.
Walderhaug, O. & Bjorkum, P.A., 2003. The Effect of Stylolite Spacing on Quartz
Cementation in the Lower Jurassic Sto Formation, Southern Barents Sea. Journal of
Sedimentary Research, 73(2), pp.146–156.
Wang, J., Ryan, D. & Anthony, E.J., 2011. Reducing the greenhouse gas footprint of shale
gas. Energy Policy, 39(12), pp.8196–8199.
Waters, C.N. et al., 2009. A lithostratigraphical framework for the Carboniferous
successions of northern Great Britain (onshore). British Geological Survey
Research Report RR/09/01.
Wilkin, R.T., 2003. Sulfide minerals in sediments. In G. V. Middleton, ed. Encyclopedia of
Sediments and Sedimentary Rocks. New York: Kluwer Academic Publishers, p.
701–703.
Wilkin, R.T., Arthur, M.A. & Dean, W.E., 1997. History of water-column anoxia in the
Black Sea indicated pyrite framboid size distributions. Earth and Planetary Science
Letters, 148, pp.517–525.
Wilkin, R.T., Barnes, H.L. & Brantley, S.L., 1996. The size distribution of framboidal
pyrite in modern sediments: An indicator of redox conditions. Geochimica et
Cosmochimica Acta, 60(20), pp.3897–3912.
Worden, R. & Morad, S., 2003. Clay mineral cements in sandstones,

PhD Thesis | 2019
228
Wright, A.M., Ratcliffe, K.T. & Spain, D., 2010. Application of Inorganic Whole Rock
Geochemistry to Shale Resource Plays. Canadian Unconventional Resources &
International Petroleum Conference, (October), pp.19–21.
Wust, R.A.J. et al., 2013. Vitrinite reflectance versus pyrolysis Tmax data: Assessing
thermal maturity in shale plays with special reference to the Duvernay shale play
of the Western Canadian Sedimentary Basin, Alberta, Canada. SPE Unconventional
Resources Conference and Exhibition-Asia Pacific, pp.1–11.
Abadi, M.S. et al., 2015. Lower Carboniferous ramp sedimentation of the Central Alborz Basin, northern Iran: integrated sedimentological and rock–magnetic studies. Geological Society, London, Special Publications, 414. Available at: http://sp.lyellcollection.org/content/early/2015/05/21/SP414.13.abstract [Accessed June 14, 2016].
Abanda, P.A. & Hannigan, R.E., 2006. Effect of diagenesis on trace element partitioning in shales. Chemical Geology, 230(1–2), pp.42–59.
Adams, A.E. & MacKenzie, W.S., 1999. A Colour Atlas of Carbonate Sediments and Rocks Under the-Microscope, Schweizerbart’sche Verlagsbuchhandlung.
Aitkenhead, N. et al., 1992. Geology of the Country Around Garstang. British Geological Survey Memoir for 1:50000 geological sheet 67 (England and Wales).
Alexander, C.R., DeMaster, D.J. & Nittrouer, C.A., 1991. Sediment accumulation in a modern epicontinental-shelf setting: The Yellow Sea. Marine Geology, 98(1), pp.51–72.
Algeo, T.J. & Maynard, J.B., 2004. Trace-element behavior and redox facies in core shales of Upper Pennsylvanian Kansas-type cyclothems. Chemical Geology, 206(3–4), pp.289–318.
Alldredge, A.L. & Silver, M.W., 1998. Characteristics, dynamics and significance of marine snow. Prog. Oceanography, 20, pp.41–82.
Alsop, G.I. & Marco, S., 2011. Soft-sediment deformation within seismogenic slumps of the Dead Sea Basin. Journal of Structural Geology, 33(4), pp.433–457. Available at: http://dx.doi.org/10.1016/j.jsg.2011.02.003.
Alsop, G.I. & Marco, S., 2012. Tsunami and seiche-triggered deformation within offshore sediments. Sedimentary Geology, 261–262, pp.90–107. Available at: http://dx.doi.org/10.1016/j.sedgeo.2012.03.013.
Ambrose, R.J. et al., 2010. New Pore-scale Considerations for Shale Gas in Place Calculations. SPE Unconventional Gas Conference 2010, pp.167–183. Available at: http://www.scopus.com/inward/record.url?eid=2-s2.0-77954232797&partnerID=40&md5=a564a840c789be814a61ccda8a1a0450%5Cnhttp://www.onepetro.org/mslib/servlet/onepetropreview?id=SPE-131772-MS&soc=SPE.
Amy, L.A. et al., 2006. An experimental investigation of sand–mud suspension settling

PhD Thesis | 2019
229
behaviour: implications for bimodal mud contents of submarine flow deposits. Sedimentology, 53(6), pp.1411–1434.
Andrews, I.J., 2013. The Carboniferous Bowland Shale gas study: geology and resource estimation. British Geological Survey for Department of Energy and Climate Change, London, UK.
Andrews, I.J., 2014. The Jurassic shales of the Weald Basin: geology and shale oil and shale gas resource estimation. British Geological Survey for Department of Energy and Climate Change, London, UK.
Anovitz, L.M. & Cole, D.R., 2015. Characterization and Analysis of Porosity and Pore Structures. Reviews in Mineralogy and Geochemistry, 80(1).
Aplin, A.C., Fleet, A.J. & Macquaker, J.H.S., 1999. Muds and mudstones: physical and fluid-flow properties. Geological Society, London, Special Publications, 158, pp.1–8.
Aplin, A.C. & Macquaker, J.H.S., 2011. Mudstone diversity: Origin and implications for source, seal, and reservoir properties in petroleum systems. AAPG Bulletin, 95, pp.15–34.
Armitage, P.J. et al., 2016. Permeability of the Mercia Mudstone: Suitability as caprock to carbon capture and storage sites. Geofluids, 16(1), pp.26–42.
Arostegui, J. et al., 2001. Microtextures and the origin of muscovite-kaolinite intergrowths in sandstones of the utrillas formation, Basque Cantabrian Basin, Spain. Clays and Clay Minerals, 49(6), pp.529–539.
Arthurton, R.S., 1984. The Ribblesdale fold belt, NW England—a Dinantian-early Namurian dextral shear zone. Geological Society, London, Special Publications, 14(1), p.131 LP-138. Available at: https://sp.lyellcollection.org/content/14/1/131.abstract.
Avnir, D., Farin, D. & Pfeifer, P., 1983. Chemistry in noninteger dimensions between two and three. II. Fractal surfaces of adsorbents. The Journal of chemical physics, 79(7), pp.3566–3571.
Avnir, D. & Jaroniec, M., 1989. An Isotherm Equation for Adsorption on Fractal Surfaces of Heterogeneous Porous Materials. Langmuir, 5(6), pp.1431–1433.
Baas, J.H. et al., 2009. A Phase Diagram for Turbulent, Transitional, and Laminar Clay Suspension Flows. Journal of Sedimentary Research, 79(4), pp.162–183. Available at: http://jsedres.sepmonline.org/cgi/doi/10.2110/jsr.2009.025.
Baas, J.H. & Best, J.L., 2002. Turbulence Modulation in Clay-Rich Sediment-Laden Flows and Some Implications for Sediment Deposition. Journal of Sedimentary Research, 72(3), pp.336–340. Available at: http://jsedres.sepmonline.org/cgi/doi/10.1306/120601720336.
Bai, B. et al., 2013. Rock characterization of Fayetteville shale gas plays. Fuel, 105, pp.645–652. Available at: http://dx.doi.org/10.1016/j.fuel.2012.09.043.
Barrett, E.P., Joyner, L.G. & Halenda, P.P., 1951. The Determination of Pore Volume and

PhD Thesis | 2019
230
Area Distributions in Porous Substances. I. Computations from Nitrogen Isotherms. Journal of the American Chemical Society, 73(1), pp.373–380. Available at: https://doi.org/10.1021/ja01145a126.
Basilone, L., 2017. Seismogenic rotational slumps and translational glides in pelagic deep-water carbonates. Upper Tithonian-Berriasian of Southern Tethyan margin (W Sicily, Italy). Sedimentary Geology, 356, pp.1–14. Available at: http://dx.doi.org/10.1016/j.sedgeo.2017.04.009.
Basilone, L., Sulli, A. & Gasparo Morticelli, M., 2016. The relationships between soft-sediment deformation structures and synsedimentary extensional tectonics in Upper Triassic deep-water carbonate succession (Southern Tethyan rifted continental margin — Central Sicily). Sedimentary Geology, 344, pp.310–322. Available at: http://dx.doi.org/10.1016/j.sedgeo.2016.01.010.
Bauluz, B. et al., 2008. Genesis of kaolinite from Albian sedimentary deposits of the Iberian Range (NE Spain): analysis by XRD, SEM and TEM. Clay Minerals, 43(3), pp.459–475. Available at: http://openurl.ingenta.com/content/xref?genre=article&issn=0009-8558&volume=43&issue=3&spage=459.
Beadle, L.C., 1981. The Inland Waters of Tropical Africa, 2nd edition 2nd ed., Longman, London.
Behl, R.J., 2011a. Chert spheroids of the Monterey Formation, California (USA): Early-diagenetic structures of bedded siliceous deposits. Sedimentology.
Behl, R.J., 2011b. Chert spheroids of the Monterey Formation, California (USA): Early-diagenetic structures of bedded siliceous deposits. Sedimentology, 58(2), pp.325–351.
Behl, R.J., 1998. RELATIONSHIPS BETWEEN SILICA DIAGENESIS, DEFORMATION, AND FLUID FLOW IN MONTEREY FORMATION CHERTS, SANTA MARIA BASIN, CALIFORNIA. SEPM Special Publication, 83.
Bennett, S.J. & Simon, A., 2004. Riparian vegetation and fluvial geomorphology, American Geophysical Union.
Bernard, S. & Brown, L., 2013. FIB-SEM and TEM Investigations of an Organic-rich Shale Maturation Series from the Lower Toarcian Posidonia Shale, Germany: Nanoscale Pore System and Fluid-rock Interactions. AAPG Memoir, 102, pp.53–66.
Berner, R.A., 1984. Sedimentary pyrite formation: An update. Geochimica et Cosmochimica Acta, 48(4), pp.605–615.
Bertoncello, A. & Honarpour, M.M., 2013. Standards for Characterization of Rock Properties in Unconventional Reservoirs: Fluid Flow Mechanism, Quality Control, and Uncertainties. SPE Annual Technical Conference and Exhibition.
Betzler, C. et al., 1999. Sedimentary patterns and geometries of the Bahamian outer carbonate ramp (Miocene-Lower Pliocene, Great Bahama Bank). Sedimentology, 46(6), pp.1127–1143.

PhD Thesis | 2019
231
Bhattacharya, J.P. et al., 2014. Bedload Transport of Mud Across A Wide, Storm-Influenced Ramp: Cenomanian-Turonian Kaskapau Formation, Western Canada Foreland Basin--Discussion. Journal of Sedimentary Research, 83(12), pp.1198–1199. Available at: http://pygs.lyellcollection.org/cgi/doi/10.1144/pygs.52.1.1.
Bhattacharya, J.P. & MacEachern, J.A., 2009. Hyperpycnal Rivers and Prodeltaic Shelves in the Cretaceous Seaway of North America. Journal of Sedimentary Research, 79(4), pp.184–209.
Bjørlykke, K., 1998. Clay Mineral Diagenesis in Sedimentary Basins — A Key to the Prediction of Rock Properties. Examples from the North Sea Basin. Clay Minerals, 33(1), pp.15–34.
Bjørlykke, K., 2015a. Mudrocks, shales, silica deposits and evaporites. In Petroleum Geoscience: From Sedimentary Environments to Rock Physics, Second Edition.
Bjørlykke, K., 2011. Open-system chemical behaviour of Wilcox Group mudstones. How is large scale mass transfer at great burial depth in sedimentary basins possible? A discussion. Marine and Petroleum Geology, 28(7), pp.1381–1382. Available at: http://dx.doi.org/10.1016/j.marpetgeo.2011.01.009.
Bjørlykke, K., 2015b. Petroleum geoscience: From sedimentary environments to rock physics, second edition,
Bjørlykke, K., 1999. Principal aspects of compaction and fluid flow in mudstones. Geological Society, London, Special Publications, 158(1), pp.73–78. Available at: http://sp.lyellcollection.org/cgi/doi/10.1144/GSL.SP.1999.158.01.06.
Bjørlykke, K. & Aagaard, P., 1992. Clay Minerals in North Sea Sandstone. SEPM Special Publication, 47.
Bjørlykke, K. & Egeberg, P.K., 1993. Quartz cementation in sedimentary basins. American Association of Petroleum Geologists Bulletin, 77(9), pp.1538–1548.
Blatt, H., 1982. Sedimentary Petrology, Freeman, New York.
Blatt, H., Middleton, G. V. & Murray, R.C., 1980. Origin of sedimentary rocks. Englewood Cliffs, New Jersey, Prentice-Hall, xvii, p.782.
Blunt, M.J. et al., 2013. Pore-scale imaging and modelling. Advances in Water Resources, 51, pp.197–216. Available at: http://dx.doi.org/10.1016/j.advwatres.2012.03.003.
Boggs Jr., S., 2006. Principles of Sedimentology and Stratigraphy 4th ed., New Jersey: Prentice Hall.
Bohacs, K.M. et al., 2005. Production, destruction, and dilution— The many pathways to source-rock development K. M. Bohacs et al., eds. The Deposition of Organic-Carbon-Rich Sediments: Models, Mechanisms, and Consequences, 82, pp.61–101.
Bohacs, K.M. & Fraticelli, C., 2008. Paleo-environmental reconstruction and analysis (paleogeography, paleoclimate, plaeo-oceanography, paleobiology) as part of integrated source rock prediction. International Petroleum Conference, IPTC, 2, pp.1130–1139.

PhD Thesis | 2019
232
Bohacs, K.M., Lazar, O.R. & Demko, T.M., 2014. Parasequence types in shelfal mudstone strata-Quantitative observations of lithofacies and stacking patterns, and conceptual link to modern depositional regimes. Geology, 42(2), pp.131–134.
Bond, D., Wignall, P.B. & Racki, G., 2004. Extent and duration of marine anoxia during the Frasnian-Famennian (Late Devonian) mass extinction in Poland, Germany, Austria and France. Geological Magazine, 141(2), pp.173–193.
Böning, P. et al., 2004. Geochemistry of Peruvian near-surface sediments. Geochimica et Cosmochimica Acta, 68(21), pp.4429–4451.
Borcovsky, D. et al., 2017. Sedimentology, facies architecture, and sequence stratigraphy of a Mississippian black mudstone succession-The upper member of the Bakken Formation, North Dakota, United States. AAPG Bulletin, 101(10).
Bott, M.H.P., 1967. Geophysical investigations of the Northern Pennine basement rocks. Proceedings of the Yorkshire Geological Society, 36, pp.139–168.
Boulesteix, K. et al., 2019. Transport and deposition of mud in deep‐water environments: Processes and stratigraphic implications. Sedimentology.
Bowker, K.A., 2007. Barnett shale gas production, Fort Worth Basin: Issues and discussion. AAPG Bulletin, 91, pp.523–533.
Boyer, C. et al., 2006. Producing Gas from Its Source. Oifield review, Autumn 200.
Brandon, A. et al., 1998. Geology of the Country Around Lancaster: Memoir for 1:50 000 Geological Sheet 59 (England and Wales ) - Geological Memoirs & Sheet Explanations. British Geological Survey Research Report.
Braunstein, J., 1961. Calciclastic and siliciclastic. AAPG Bulletin, 45(12), p.2017.
Bridge, J.S. & Demicco, R. V., 2008. Earth surface processes, landforms and sediment deposits, Cambridge, UK ; New York: Cambridge University Press.
Brindle, S. et al., 2015. An integrated approach to unconventional resource play reservoir characterization, Thistleton-1 case study, NW England. First Break, 33(2), pp.79–86.
Brunauer, S., Emmett, P.H. & Teller, E., 1938. Adsorption of Gases in Multimolecular Layers. Journal of the American Chemical Society, 60(1), pp.309–319. Available at: http://pubs.acs.org/doi/abs/10.1021/ja01269a023.
Burchette, T.P. & Wright, V.P., 1992. Carbonate ramp depositional systems. Sedimentary Geology, 79(1–4), pp.3–57.
Burley, S.D., 1993. Models of burial diagenesis for deep exploration plays in Jurassic fault traps of the Central and Northern North Sea J. R. Parker, ed. From Petroleum Geology of Northwest Europe: Proceedings of the 4th Conference, pp.1353–1375.
Burton, J.H., Krinsley, D.H. & Eye, K., 1987. Texas Gulf Coast Sediments. , 35(4), pp.291–296.
Bush, R.T., McGrath, R. & Sullivan, L.A., 2004. Occurrence of marcasite in an organic-rich
PhD Thesis | 2019
233
Holocene estuarine mud. Soil Research, 42(6), p.617. Available at: http://www.publish.csiro.au/?paper=SR03079.
Bust, V.K. et al., 2013. The petrophysics of shale gas reservoirs: Technical challenges and pragmatic solutions. Petroleum Geoscience, 19(2).
Bustin, R. et al., 2008. Impact of shale properties on pore structure and storage characteristics. SPE Shale Gas Production Conference, p.SPE 119892. Available at: http://www.onepetro.org/mslib/servlet/onepetropreview?id=SPE-119892-MS.
Calvert, S.E. & Pedersen, T.F., 1993. Geochemistry of Recent oxic and anoxic marine sediments: Implications for the geological record. Marine Geology, 113(1–2), pp.67–88.
Chabaud, L. et al., 2016. Sedimentary processes determining the modern carbonate periplatform drift of Little Bahama Bank. Marine Geology, 378, pp.213–229. Available at: http://dx.doi.org/10.1016/j.margeo.2015.11.006.
Chalmers, G.R., Bustin, R.M. & Power, I.M., 2012. Characterization of gas shale pore systems by porosimetry, pycnometry,surfacearea,andfield emission scanning electron microscopy/ transmission electron microscopy image analyses: Examples from the Barnett, Woodford, Haynesville, Marcellus,andDoig units. AAPG Bulletin, 96(6), pp.1099–1119.
Chalmers, G.R.L. & Bustin, R.M., 2015. Porosity and pore size distribution of deeply-buried fine-grained rocks: Influence of diagenetic and metamorphic processes on shale reservoir quality and exploration. Journal of Unconventional Oil and Gas Resources, 12, pp.134–142. Available at: http://dx.doi.org/10.1016/j.juogr.2015.09.005.
Charpentier, R.R. & Cook, T.A., 2011. USGS Methodology for Assessing Continuous Petroleum Resources. U. S. G. Survey, ed., U.S. Geological Survey Open-File Report.
Charsley, T.J., 1984. Early Carboniferous rocks of the Swinden No. 1 Borehole, west of Skipton, Yorkshire. Report of the British Geological Survey, 84(1), pp.5–12.
Choquette, P.W. & Pray, L.C., 1970. Geologic nomenclature and classification of porosity in sedimentary carbonates. America Association. Petroleum Geologists Bulletin, 54, pp.207–250.
Clarke, H. et al., 2018. Shale gas resources of the Bowland Basin, NW England: a holistic study. Petroleum Geoscience, 066(Bushell 1986). Available at: http://pg.lyellcollection.org/content/early/2018/05/04/petgeo2017-066.abstract.
Clarke, H., Turner, P. & Bustin, R.M., 2014. Unlocking the resource potential of the Bowland Basin, NW England. Society of Petroleum Engineers - European Unconventional Resources Conference and Exhibition 2014: Unlocking European Potential, 2(February), pp.25–27.
Clarkson, C.R., Freeman, M., et al., 2012. Characterization of tight gas reservoir pore structure using USANS/SANS and gas adsorption analysis. Fuel, 95, pp.371–385.

PhD Thesis | 2019
234
Clarkson, C.R., Wood, J.M., et al., 2012. Nanopore-structure analysis and permeability predictions for a tight gas siltstone reservoir by use of low-pressure adsorption and mercury-intrusion techniques. SPE Reservoir Evaluation & Engineering, 15(6), pp.648–661. Available at: https://www.onepetro.org/journal-paper/SPE-155537-PA.
Clarkson, C.R. et al., 2013. Pore structure characterization of North American shale gas reservoirs using USANS/SANS, gas adsorption, and mercury intrusion. In Fuel.
Clarkson, C.R., Jensen, J.L. & Blasingame, T.A., 2011. Reservoir Engineering for Unconventional Gas Reservoirs: What Do We Have to Consider. Society of Petroleum engineers, SPE 145080, pp.1–45.
Cnudde, V. & Boone, M.N., 2013. High-resolution X-ray computed tomography in geosciences: A review of the current technology and applications. Earth-Science Reviews, 123, pp.1–17. Available at: http://dx.doi.org/10.1016/j.earscirev.2013.04.003.
Cohen, A.S., 2003. Paleolimnology: the history and evolution of lake systems, Oxford University Press.
Collinson, J.D., 1996. Alluvial Sediments H. G. Reading, ed. Sedimentary Environments: Processes, Facies and Stratigraphy, 3rd edition, pp.37–82.
Cook, H.E. & Mullins, H.T., 1983. Basin Margin Environment. In P. A. Scholle, D. G. Bebout, & C. M. Moore, eds. Carbonate Depositinal Environments. AAPG Memoir, pp. 540–617.
Courjault, T. et al., 2011. Detailed anatomy of a deep-water carbonate breccia lobe (Upper Jurassic, French subalpine basin). Sedimentary Geology, 238(1–2), pp.156–171. Available at: http://dx.doi.org/10.1016/j.sedgeo.2011.04.010.
Curran, K.J. et al., 2004. Inferring the mass fraction of floc deposited mud: Application to fine-grained turbidites. Sedimentology, 51, pp.927–944.
Curran, K.J., Hill, P.S. & Milligan, T.G., 2002. Fine-grained suspended sediment dynamics in the Eel River flood plume. Continental Shelf Research, 22, pp.2537–2550.
Curtis, C.D., Burns, R.G. & Smith, J. V, 1977. Sedimentary Geochemistry: Environments and Processes Dominated by Involvement of an Aqueous Phase [and Discussion]. Philosophical Transactions of the Royal Society of London A: Mathematical, Physical and Engineering Sciences, 286(1336), pp.353–372. Available at: http://rsta.royalsocietypublishing.org/content/286/1336/353.abstract.
Curtis, C.D. & Coleman, M.L., 1986. Controls on the precipitation of early diagenetic calcite, dolomite and siderite concretions in complex depositional sequences D. L. Gautier, ed., SEPM Special Publication.
Curtis, C.D., Coleman, M.L. & Love, L.G., 1986. Pore water evolution during sediment burial from isotopic and mineral chemistry of calcite, dolomite and siderite concretions. Geochimica et Cosmochimica Acta, 50(10), pp.2321–2334.
Curtis, C.D. & Spears, D.A., 1971. Diagenetic development of kaolinite. Clays and Clay

PhD Thesis | 2019
235
Minerals, 19(4), pp.219–227.
Curtis, M.E. & Ambrose, R.J., 2011. Investigation of the relationship between organic porosity and thermal maturity in the Marcellus Shale. SPE North American unconventional Gas Conference, Woodlands, Texas, SPE 144370, p.4pp.
Curtis, M.E., Ambrose, R.J. & Sondergeld, C.H., 2010. Structural Characterization of Gas Shales on the Micro- and Nano-Scales. Canadian Unconventional Resources and International Petroleum Conference, (October), p.137693. Available at: http://www.onepetro.org/doi/10.2118/137693-MS.
Curtis, M.E., Ambrose, R.J. & Sondergeld, C.H., 2011. Structural Characterization of Gas Shales on the Micro- and Nano-Scales.
Daigle, H. et al., 2013. Widespread deformation of basin-plain sediments in Aysén fjord (chile) due to impact by earthquake-triggered, onshore-generated mass movements. Marine Geology, 337(October), pp.67–79. Available at: http://dx.doi.org/10.1016/j.margeo.2013.01.006.
Day-Stirrat, R.J. et al., 2010. Open-system chemical behavior in deep Wilcox Group mudstones, Texas Gulf Coast, USA. Marine and Petroleum Geology, 27(9), pp.1804–1818. Available at: http://dx.doi.org/10.1016/j.marpetgeo.2010.08.006.
Dean, M.T. et al., 2011. A lithostratigraphical framework for the Carboniferous successions of northern Great Britain (onshore). British Geological Survey Research Report RR/09/01, p.174.
Dean, W.E., Leinen, M. & Stow, D.A. V, 1985. Classification of deep-sea, finegrained sediments. Journal of Sedimentary Petrology, 55, pp.250–256.
Dowey, P.J. & Taylor, K.G., 2017. Extensive authigenic quartz overgrowths in the gas-bearing Haynesville-Bossier Shale, USA. Sedimentary Geology, 356, pp.15–25. Available at: http://dx.doi.org/10.1016/j.sedgeo.2017.05.001.
Dunbar, C.O. & Rogers, J., 1957. Principles of Stratigraphy, John Wiley & Sons Inc., New York.
Dunham, R.J., 1962. Classification of carbonate rocks according to depositional texture W. E. Hamm, ed. Classification of Carbonate Rocks, pp.108–121.
Dunham, R.J., 1962. Classification of carbonate rocks according to depositional textures.
EAGE, 2019. Industry News. First Break, 37(3), p.28.
Earp, J.R. et al., 1961. Geology of the country around Clitheroe and Nelson. Memoir of the Geological Survey of Great Britain, Sheet 68 (.
Ebdon, C.C. et al., 1990. The Dinantian Stratigraphy of the East Midlands: A seismostratigraphic approach. Journal of the Geological Society London, 147, pp.519–536.
Eberli, G.P., 1991. Calcareous turbidites and their relationship to sea-level fluctuations and tectonism. Cycles and events in stratigraphy, pp.340–359.

PhD Thesis | 2019
236
Eberli, G.P. et al., 2004. Carbonate Platform to Basin Transitions on Seismic Data and in Outcrops: Great Bahama Bank and the Maiella Platform Margin, Italy. Seismic Imaging of Carbonate Reservoirs and Systems: AAPG Memoir 81, pp.207–250. Available at: https://doi.org/10.1306/M81928.
Einsele, G., 2000. Sedimentary Basin: Evolution, Facies and Sediment Budget, 2nd edition, Springer.
Ekes, C., 1993. Bedload-transported pedogenic mud aggregates in the Lower Old Red Sandstone in Southwest wales. Geological Society (London), 150, pp.469–472.
Embry III, A.F. & Klovan, J.E., 1971. A late Devonian reef tract on northeastern Banks Island, NWT. Bulletin of Canadian Petroleum Geology, 19(4), pp.730–781.
Emmings, J.F. et al., 2017. Stream and slope weathering effects on organic-rich mudstone geochemistry and implications for hydrocarbon source rock assessment: A Bowland Shale case study. Chemical Geology, 471(February), pp.74–91. Available at: http://dx.doi.org/10.1016/j.chemgeo.2017.09.012.
Espitalié, J. et al., 1977. Source rock characterization method for petroleum exploration. Offshore Technology Conference, Houston.
Evans, D.J. & Kirby, G.A., 1999. The architecture of concealed Dinantian carbonate sequences over the Central Lancashire and Holme highs, northern England. Proceedings of the Yorkshire Geological Society, 52(3), pp.297–312. Available at: http://pygs.lyellcollection.org/cgi/doi/10.1144/pygs.52.3.297.
Feldkamp, L.A., Davis, L.C. & Kress, J.W., 1984. Practical cone-beam algorithm. Journal of the Optical Society of America A, 1(6), pp.612–619. Available at: http://josaa.osa.org/abstract.cfm?URI=josaa-1-6-612.
Ferry, S. et al., 2015. The base-of-slope carbonate breccia system of Céüse (Tithonian, S-E France): Occurrence of progradational stratification in the head plug of coarse granular flow deposits. Sedimentary Geology, 317, pp.71–86. Available at: http://dx.doi.org/10.1016/j.sedgeo.2014.07.001.
Fewtrell, M. & Smith, D., 1980. Revision of the Dinantian stratigraphy of the Craven Basin, N England. Geological Magazine, 117(01), pp.37–49.
Fishman, N.S. et al., 2012. The nature of porosity in organic-rich mudstones of the Upper Jurassic Kimmeridge Clay Formation, North Sea, offshore United Kingdom. International Journal of Coal Geology, 103, pp.32–50.
Flemming, B.W., 2000. A revised textural classification of gravel-free muddy sediments on the basis of ternary diagrams. Continental Shelf Research, 20(10), p.1125–1137(13).
Folk, R.L., 1968. Petrology of sedimentary rocks, Hemphills, Austin.
Fraser, A.J. et al., 1990. A regional assessment of the intra-Carboniferous play of northern England J. J. Brooks, ed. Classic Petroleum Provinces, 50, pp.417–440.
Fraser, A.J. & Gawthorpe, R.L., 2003. An atlas of Carboniferous basin evolution in

PhD Thesis | 2019
237
Northern England. Geological Society Memoir, 28.
Fraser, A.J. & Gawthorpe, R.L., 1990. Tectono-stratigraphic development and hydrocarbon habitat of the Carboniferous in northern England. Geological Society, London, Special Publications, 55(1), pp.49–86. Available at: http://sp.lyellcollection.org/content/55/1/49.abstract.
Friedrichs, C.T. & Wright, L.D., 2004. Gravity-driven sediment transport on the continental shelf: implications for equilibrium profiles near river mouths. Coastal Engineering, 51, pp.795–811.
Gale, J.F.W. et al., 2017. Natural fractures in shale: A review and new observations. AAPG Bulletin, 101(8), pp.2165–2216.
Garrels, R.M. & Mackenzie, F.T., 1971. Evolution of sedimentary rocks, New York: W. W. Norton.
Gawthorpe, R.L., 1987. Burial dolomitization and porosity development in a mixed carbonate-clastic sequence: an example from the Bowland Basin, northern England. Sedimentology, 34(4), pp.533–558. Available at: http://doi.wiley.com/10.1111/j.1365-3091.1987.tb00785.x.
Gawthorpe, R.L., 1986. Sedimentation during carbonate ramp-to-slope evolution in a tectonically active area: Bowland Basin (Dinantian), northern England. Sedimentology, 33, pp.185–206.
Gawthorpe, R.L., 1987. Tectono-sedimentary evolution of the Bowland Basin, northern England, during the Dinantian. Journal of the Geological Society London, 144, pp.59–71.
Gawthorpe, R.L. & Clemmey, H., 1985. Geometry of submarine slides in the Bowland Basin (Dinantian) and their relation to debris flows. Journal of the Geological Society, 142(3), pp.555–565.
Gawthorpe, R.L., Gutteridge, P. & Leeder, M.R., 1989. Late Devonian and Dinantian basin evolution in Northern England and North Wales R. S. Arthurton, P. Gutteridge, & S. C. Nolan, eds. The role of tectonics in Devonian and carboniferous sedimenration in the British isle., 6, pp.1–23.
Gradstein, F.M. et al., 2012. The Geologic Time Scale 2012 Vol. 2.
Grayson, R.F. & Oldham, L., 1987. A new structural framework for the northern British Dinantian as a basis for oil, gas and mineral exploration J. Miller, A. E. Adams, & V. P. Wright, eds. European Dinantian environments, pp.33–59.
Groen, J.C., Peffer, L.A.A. & Pérez-Ramírez, J., 2003. Pore size determination in modified micro- and mesoporous materials. Pitfalls and limitations in gas adsorption data analysis. Microporous and Mesoporous Materials, 60(1–3), pp.1–17.
Grosheny, D., Ferry, S. & Courjault, T., 2015. Progradational patterns at the head of single units of base-of-slope, submarine granular flow deposits (“Conglomérats des Gas”, Coniacian, SE France). Sedimentary Geology, 317, pp.102–115. Available at: http://dx.doi.org/10.1016/j.sedgeo.2014.10.007.

PhD Thesis | 2019
238
Gross, D. et al., 2015. Organic geochemistry of Mississippian shales (Bowland Shale Formation) in central Britain: Implications for depositional environment, source rock and gas shale potential. Marine and Petroleum Geology, 59, pp.1–21. Available at: http://dx.doi.org/10.1016/j.marpetgeo.2014.07.022.
Gupta, N., Fathi, E. & Belyadi, F., 2018. Effects of nano-pore wall confinements on rarefied gas dynamics in organic rich shale reservoirs. Fuel, 220(February), pp.120–129.
Haddad, E.E. et al., 2018. Ichnofabrics and chemostratigraphy argue against persistent anoxia during the Upper Kellwasser Event in New York State. Palaeogeography, Palaeoclimatology, Palaeoecology, 490.
Han, Y., Mahlstedt, N. & Horsfield, B., 2015. The Barnett Shale: Compositional fractionation associated with intraformational petroleum migration, retention, and expulsion. AAPG Bulletin, 99(12), pp.2173–2201.
Harkins, W.D. & Jura, G., 1944. Surfaces of Solids. XIII. A Vapor Adsorption Method for the Determination of the Area of a Solid without the Assumption of a Molecular Area, and the Areas Occupied by Nitrogen and Other Molecules on the Surface of a Solid. Journal of the American Chemical Society, 66(8), pp.1366–1373. Available at: https://doi.org/10.1021/ja01236a048.
Harrington, J.F. & Horseman, S.T., 1999. Gas transport properties of clays and mudrocks. Geological Society, London, Special Publications, 158(1–86239–030–4/99/$15.00), pp.107–124.
Hartmann, D.J. & Beaumont, E.A., 1999. Predicting Reservoir System Quality and Performance E. A. Beaumont & N. H. Forster, eds. AAPG treatise of petroleum geology, exploration for oil and gas traps, ch. 9, p.9.1-9.154.
Haszeldine, R.S., 1984. Carboniferous North Atlantic palaeogeography: stratigraphic evidence for rifting, not megashear or subduction. Geological Magazine, 121(5), pp.443–463. Available at: https://www.cambridge.org/core/article/carboniferous-north-atlantic-palaeogeography-stratigraphic-evidence-for-rifting-not-megashear-or-subduction/6A788998AF67A90532D7485D29FC6C2A.
Hatch, J.R. & Leventhal, J.S., 1992. Relationship between inferred redox potential of the depositional environment and geochemistry of the Upper Pennsylvanian (Missourian) Stark Shale Member of the Dennis Limestone, Wabaunsee County, Kansas, U.S.A. Chemical Geology, 99(1–3), pp.65–82.
Helz, G.R. et al., 2011. New model for molybdenum behavior in euxinic waters. Chemical Geology, 21(4), pp.1139–1146.
Hendry, M.J. et al., 2015. Can argillaceous formations isolate nuclear waste? Insights from isotopic, noble gas, and geochemical profiles. Geofluids, 15(3), pp.381–386.
Hennissen, J.A.I. et al., 2017. The prospectivity of a potential shale gas play: An example from the southern Pennine Basin (central England, UK). Marine and Petroleum Geology, 86, pp.1047–1066. Available at: http://dx.doi.org/10.1016/j.marpetgeo.2017.06.033.

PhD Thesis | 2019
239
Herbig, H.G. & Bender, P., 1992. A eustatically driven calciturbidite sequence from the Dinantian II of the Eastern Rheinisches Schiefergebirge. Facies, 27(1), pp.245–261.
Hilgers, C. & Urai, J.L., 2002. Experimental study of syntaxial vein growth during lateral fluid flow in transmitted light: First results. Journal of Structural Geology, 24(6–7), pp.1029–1043.
Hillier, S., 1995. Erosion, sedimentation and sedimentary origin of clays B. Velde, ed., Berlin, Germany: Springer-Verlag.
Hillier, S., 1993. Origin, diagenesis, and mineralogy of chlorite minerals in Devonian lacustrine mudrocks, Orcadian Basin, Scotland. Clays and Clay Minerals, 41, pp.240–259.
Holliday, D.W. & Molyneux, S.G., 2006. Editorial statement: new official names for the subsystems, series and stages of the Carboniferous System - some guidance for contributors to the Proceedings. Proceedings Of The Yorkshire Geological Society, 56, pp.57–58. Available at: http://apps.isiknowledge.com/InboundService.do?product=WOS&action=retrieve&SrcApp=Papers&UT=000238327500007&SID=Y2hOpKi@oMlo3CeIKgp&Init=Yes&SrcAuth=mekentosj&mode=FullRecord&customersID=mekentosj&DestFail=http://access.isiproducts.com/custom_images/wok_f.
Huang, J., Cavanaugh, T. & Nur, B., 2013. An Introduction to SEM Operational Principles and Geologic Applications for Shale Hydrocarbon Reservoirs. Electron microscopy of shale hydrocarbon reservoirs: AAPG Memoir 102, pp.1–6.
Hudson, R.G.S., 1933. The general geology and the Carboniferous Rocks: The geology of the country around Harrogate. Proceedings of the Geologists’ Association, 49, pp.295–352.
Huggett, J.M., 1994. Diagenesis of mudrocks and concretions from the London Clay Formation in the London Basin. Clay Minerals, 29, pp.693–707.
Huggett, J.M., Gale, A.S. & Wray, D.S., 2005. Diagenetic Clinoptilolite and Opal-CT from the Middle Eocene Wittering Formation, Isle of Wight, U.K. Journal of Sedimentary Research, 75(4), pp.585–595. Available at: http://jsedres.sepmonline.org/cgi/doi/10.2110/jsr.2005.048.
Ichaso, A.A. & Dalrymple, R.W., 2009. Tide- and wave-generated fluid mud deposits in the Tilje Formation (Jurassic), offshore Norway. Geology, 37(6), pp.539–542.
Ielpi, A. & Cornamusini, G., 2013. An outer ramp to basin plain transect: Interacting pelagic and calciturbidite deposition in the eocene-oligocene of the tuscan domain, adria microplate (italy). Sedimentary Geology, 294, pp.83–104.
Ingram, R.L., 1953. Fissility of mudrocks. Bulletin of the Geological Society of America, 64(8), pp.869–878.
Ismail, I.M.K. & Pfeifer, P., 1994. Fractal Analysis and Surface Roughness of Nonporous Carbon Fibers and Carbon Blacks. Langmuir, 10(5), pp.1532–1538.
Jarvie, D.M., 2014. Components and processes affecting producibility and commerciality

PhD Thesis | 2019
240
of shale resource systems. Geologica Acta, 12(4), pp.307–325.
Jarvie, D.M., 2012a. Shale Resource Systems for Oil and Gas: Part 1—Shale-gas Resource Systems J. A. Breyer, ed. Shale reservoirs—Giant resources for the 21st century, 97, pp.69–87.
Jarvie, D.M., 2012b. Shale Resource Systems for Oil and Gas: Part 2—Shale-oil Resource Systems. in J. A. Breyer, ed., Shale reservoirs—Giant resources for the 21st century: AAPG Memoir, 97, pp.89–119.
Jarvie, D.M. et al., 2007. Unconventional shale-gas systems: The Mississippian Barnett Shale of north-central Texas as one model for thermogenic shale-gas assessment. AAPG Bulletin, 91(4), pp.475–499.
Javadpour, F., 2009. Nanopores and apparent permeability of gas flow in mudrocks (shales and siltstone). Journal of Canadian Petroleum Technology, 48(8), pp.16–21.
Javadpour, F., Fisher, D. & Unsworth, M., 2007. Nanoscale gas flow in shale gas sediments. Journal of Canadian Petroleum Technology.
Jiao, K. et al., 2014. The characterization and quantitative analysis of nanopores in unconventional gas reservoirs utilizing FESEM–FIB and image processing: An example from the lower Silurian Longmaxi Shale, upper Yangtze region, China. International Journal of Coal Geology, 128–129, pp.1–11.
Johnson, H.D. & Baldwin, C.T., 1996. Shallow clastic seas H. G. Reading, ed. Sedimentary Environments: Processes, Facies and Stratigraphy, 3rd edition, pp.232–280.
Jones, B. & Manning, D.A.C., 1994. A comparison and correlation of different geochemical indices used for the interpretation of depositional environments in ancient mudstones. Chemical Geology, 111(1–4), pp.111–129. Available at: http://dx.doi.org/10.1016/0009-2541(94)90085-X.
Kammer, T.W. & Ausich, W.I., 2007. New cladid and flexible crinoids from the Mississippian (Tournaisian, Ivorian) of England and Wales. Palaeontology, 50(5), pp.1039–1050.
Kase, Y. et al., 2016. The use of microstructures for discriminating turbiditic and hemipelagic muds and mudstones. Sedimentology. Available at: http://doi.wiley.com/10.1111/sed.12296.
Katsube, T.J., 2000. Shale permeability and pore-structure evolution characteristics. Geological Survey of Canada, Current Re(2000-E15). Available at: http://www.nrcan.gc.ca/ gsc/bookstore.
Kazemi, M. & Takbiri-Borujeni, A., 2017. Multiscale Modeling of Gas Transport in Organic-Rich Shale: From Molecular Scale to Core Plug Scale.
Kelly, S. et al., 2016. Assessing the utility of FIB-SEM images for shale digital rock physics. Advances in Water Resources, 95.
Kimbell, S.F. et al., 1989. The structure and evolution of the Northumberland Trough from new seismic reflection data and its bearing on modes of continental extension.

PhD Thesis | 2019
241
Journal of the Geological Society London, 146, pp.775–787.
Kineke, G.C. et al., 1996. Fluid-mud processes on the Amazon continental shelf. Continental Shelf Research, 16, pp.667–696.
Klaver, J. et al., 2015. BIB-SEM characterization of pore space morphology and distribution in postmature to overmature samples from the Haynesville and Bossier Shales. Marine and Petroleum Geology, 59, pp.451–466. Available at: http://dx.doi.org/10.1016/j.marpetgeo.2014.09.020.
Klaver, J. et al., 2016. BIB-SEM pore characterization of mature and post mature Posidonia Shale samples from the Hils area, Germany. International Journal of Coal Geology, 158.
Knapp, L.J., McMillan, J.M. & Harris, N.B., 2017. A depositional model for organic-rich Duvernay Formation mudstones. Sedimentary Geology, 347.
Ko, L.T. et al., 2016. Pore and pore netwrok evolution of Upper Cretaceous Boquillas (Eagle Ford-equivalent) mudrocks: Results from gold-tube pyrolysis experiments. AAPG Bulletin.
Kranck, K., 1973. Flocculation of suspended sediment in the sea. Nature, London, 246, pp.348–350.
Kranck, K., 1975. Sediment deposition from flocculated suspensions. Sedimentology, 22, pp.111–123.
Kuila, U. et al., 2012. Compositional Controls on Mudrock Pore-Size Distribution: An Example from Niobrara Formation. SPE Annual Technical Conference and Exhibition, p.16. Available at: http://www.onepetro.org/doi/10.2118/160141-MS.
Kuila, U. et al., 2014. Nano-scale texture and porosity of organic matter and clay minerals in organic-rich mudrocks. Fuel, 135, pp.359–373. Available at: http://dx.doi.org/10.1016/j.fuel.2014.06.036.
Kuila, U. & Prasad, M., 2013a. Application of nitrogen gas-adsorption technique for characterization of pore structure of mudrocks. The Leading Edge, 32(12), pp.1478–1485.
Kuila, U. & Prasad, M., 2013b. Specific surface area and pore-size distribution in clays and shales. Geophysical Prospecting, 61(2), pp.341–362.
van de Lageweg, W.I. et al., 2018. Controls on mud distribution and architecture along the fluvial-to-marine transition. Geology, 46(11), pp.971–974.
Lampitt, R.S., 1985. Evidence for the seasonal deposition of detritus to the deep-sea floor and its subsequent resuspension. Deep-Sea Research, 22(8A), pp.885–897.
Lazar, O.R. et al., 2015. Capturing key attributes of fine-grained sedimentary rocks in outcrops, cores, and thin sections; nomenclature and description guidelines. Journal of Sedimentary Research, 85(3), pp.230–246.
Lazar, O.R. et al., 2010. Fine-grained rocks in outcrops: classification and description

PhD Thesis | 2019
242
guidelines J. Schieber, O. R. Lazar, & K. M. Bohacs, eds. Sedimentology and Stratigraphy of Shales: Expressions and Correlation of Depositional Sequences in the Devonian of Tennessee, Kentucky, and Indiana, pp.3–14.
Leeder, M.R., 1988. Recent developments in Carboniferous geology: a critical review with implications for the British Isles and NW Europe. Proceedings of the Geologists’ Association, 99, pp.73–100.
Leeder, M.R., 1982. Upper Palaeozoic basins of the British Isles-Caledonide inheritance versus Hercynian plate margin processes. Journal of the Geological Society, London, 139(1980), pp.479–491. Available at: http://jgs.lyellcollection.org/content/139/4/479.full.pdf+html.
Leeder, M.R. & Gawthorpe, R.L., 1987. Sedimentary models for extensional tilt-block/half-graben basins. Geological Society, London, Special Publications, 28(1), pp.139–152.
Liang, C. et al., 2016. Deep-water depositional mechanisms and significance for unconventional hydrocarbon exploration: A case study from the lower Silurian Longmaxi shale in the southeastern Sichuan Basin. AAPG Bulletin, 100(05), pp.773–794. Available at: http://search.datapages.com/data/doi/10.1306/02031615002.
Liu, K. et al., 2017. Nanoscale pore structure characterization of the Bakken shale in the USA. Fuel, 209.
Lobza, V. & Schieber, J., 1999. Biogenic sedimentary structures produced by worms in soupy, soft muds: observations from the Chattanooga Shale (Upper Devonian) and Experiments. Journal of Sedimentary Research1, 69(5), pp.1041–1049.
Löhr, S.C. et al., 2015. Is organic pore development in gas shales influenced by the primary porosity and structure of thermally immature organic matter? Organic Geochemistry, 87, pp.119–132.
Loucks, R.G. et al., 2009. Morphology, Genesis, and Distribution of Nanometer-Scale Pores in Siliceous Mudstones of the Mississippian Barnett Shale. Journal of Sedimentary Research, 79(12), pp.848–861. Available at: http://jsedres.sepmonline.org/content/79/12/848.abstract.
Loucks, R.G. et al., 2010. Preliminary Classification of Matrix Pores in Mudrocks. Gulf Coast Association of Geological Societies Transactions, 60(2), pp.435–441.
Loucks, R.G. et al., 2012. Spectrum of pore types and networks in mudrocks and a descriptive classification for matrix-related mudrock pores. AAPG Bulletin, 96(6), pp.1071–1098.
Loucks, R.G. & Ruppel, S.C., 2007. Mississippian Barnett Shale: Lithofacies and depositional setting of a deep-water shale-gas succession in the Fort Worth Basin, Texas. AAPG Bulletin, 91(4), pp.579–601.
Lowe, D.R., 1982. Sediment gravity flows: II Depositional models with special reference to the deposits of high-density turbidity currents. Journal of Sedimentary Reseach, 52(1).

PhD Thesis | 2019
243
Luffel, D.L. & Guidry, F.K., 1989. Reservoir rock properties of Devonian shale from core and log analysis. In Society of Core Analysts Conference.
Lundegard, P.D. & Samuels, N.D., 1980. Field classification of fine-grained sedimentary rocks. Journal of Sedimentary Petrology, 50, pp.781–786.
Ma, L., Fauchille, A.-L., et al., 2017. Correlative multi-scale imaging of shales: a review and future perspectives. Geological Society, London, Special Publications, 454(1), pp.175–199.
Ma, L., Taylor, K.G., et al., 2017. Multi-scale 3D characterisation of porosity and organic matter in shales with variable TOC content and thermal maturity: Examples from the Lublin and Baltic Basins, Poland and Lithuania. International Journal of Coal Geology, 180(August), pp.100–112.
Ma, L. et al., 2016. Novel 3D centimetre-to nano-scale quantification of an organic-rich mudstone: The Carboniferous Bowland Shale, Northern England. Marine and Petroleum Geology, 72, pp.193–205. Available at: http://dx.doi.org/10.1016/j.marpetgeo.2016.02.008.
Macquaker, J.H.S. et al., 2014. Compositional controls on early diagenetic pathways in fine-grained sedimentary rocks: Implications for predicting unconventional reservoir attributes of mudstones. AAPG Bulletin, 98(3), pp.587–603.
Macquaker, J.H.S. & Adams, A.E., 2003. Maximizing information from fine-grained sedimentary rocks: an inclusive nomenclature for mudstones. Journal of Sedimentary Research, 73, pp.735–744.
Macquaker, J.H.S. & Adams, A.E., 2003. Maximizing Information from Fine-Grained Sedimentary Rocks: An Inclusive Nomenclature for Mudstones. Journal of Sedimentary Research.
Macquaker, J.H.S., Bentley, S.J. & Bohacs, K.M., 2010. Wave-enhanced sediment-gravity flows and mud dispersal across continental shelves: Reappraising sediment transport processes operating in ancient mudstone successions. Geology, 38, pp.947–950.
Macquaker, J.H.S. & Bohacs, K.M., 2007. On the accumulation of mud. Science, 318, pp.1734–1735.
Macquaker, J.H.S., Curtis, C.D. & Coleman, M.L., 1997. The role of iron in mudstone diagenesis: Comparison of Kimmeridge Clay Formation mudstones from onshore and offshore (UKCS) localities. Journal of Sedimentary Research, 67(5), pp.871–878.
Macquaker, J.H.S. & Gawthorpe, R.L., 1993. Mudstone lithofacies in the Kimmeridge Clay Formation, Wessex Basin, southern England; implications for the origin and controls of the distribution of mudstones. Journal of Sedimentary Research, 63(6), pp.1129–1143.
Macquaker, J.H.S. & Howell, J.K., 1999. Small-scale (<5.0 m) vertical heterogeneity in mudstones: Implications for high-resolution stratigraphy in siliciclastic mudstone successions. Journal of the Geological Society of London, 156, pp.105–112.

PhD Thesis | 2019
244
Macquaker, J.H.S., Taylor, K.G. & Gawthorpe, R.L., 2007. High-resolution facies analyses of mudstones: Implication for paleoenvironmental and sequence stratigraphic interpretations of offshore ancient mud-dominated successions. Journal of Sedimentary Research, 77, pp.324–339.
Madhavaraju, J. et al., 2016. Paleoclimate, paleoweathering and paleoredox conditions of Lower Cretaceous shales from the Mural Limestone, Tuape section, northern Sonora, Mexico: Constraints from clay mineralogy and geochemistry. , pp.1–15.
Mahamud, M.M. & García, V., 2018. Textural characterization of chars using fractal analysis of N2and CO2adsorption. Fuel Processing Technology, 169(July 2017), pp.269–279. Available at: http://dx.doi.org/10.1016/j.fuproc.2017.10.013.
Mandelbrot, B.B., 1982. The fractal geometry of nature, WH freeman New York.
Martire, L. et al., 2014. Selective dolomitization by syntaxial overgrowth around detrital dolomite nuclei: A case from the Jurassic of the Marguareis Ligurian Briançonnais (Ligurian Alps). Journal of Sedimentary Reseach, 84(October), pp.40–50.
Mason, G., 1982. The Effect of Pore-Space Connectivity on the Hysteresis of Capillary Condensation in Adsorption Desorption Isotherms. Journal.of.Colloid and.Interface Science, 88(1), pp.36–46.
McCave, I.N., 1972. Transport and escape of fine-grained sediment from shelf areas D. J. P. Swift, ed. Shelf Transport: Process and Pattern. Dowden, pp.225–248.
McCave, I.N., 1975. Vertical flux of particles in the ocean. Deep Sea Res, 22, pp.491–502.
McCave, I.N. & Jones, K.P.N., 1988. Deposition of ungraded muds from high-density non-turbulent turbidity currents. Nature, 333, pp.250–252.
McGlade, C., Speirs, J. & Sorrell, S., 2013. Unconventional gas - A review of regional and global resource estimates. Energy, 55, pp.571–584.
McIlroy, D., 2004. Ichnology and facies model of a tidedominated delta: Jurassic upper Ror and Ile formations of Kristin field, Halten Terrace, offshore mid-Norway D. McIlroy, ed. The application of ichnology to paleoenvironmental and stratigraphic analysis, 228, pp.237–272.
Melikoglu, M., 2014. Shale gas: Analysis of its role in the global energy market. Renewable and Sustainable Energy Reviews, 37, pp.460–468. Available at: http://dx.doi.org/10.1016/j.rser.2014.05.002.
Menning, M. et al., 2006. Global time scale and regional stratigraphic reference scales of Central and West Europe, East Europe, Tethys, South China, and North America as used in the Devonian-Carboniferous-Permian Correlation Chart 2003 (DCP 2003). Palaeogeography, Palaeoclimatology, Palaeoecology, 240(1–2), pp.318–372.
Michalopoulos, P. & Aller, R.C., 2004. Early diagenesis of biogenic silica in the Amazon delta: Alteration, authigenic clay formation, and storage. Geochimica et Cosmochimica Acta, 68(5), pp.1061–1085.
Michalopoulos, P., Aller, R.C. & Reeder, R.J., 2000. Conversion of diatoms to clays during

PhD Thesis | 2019
245
early diagenesis in tropical, continental shell muds. Geology, 28(12), pp.1095–1098.
Miller, J. & Grayson, R.F., 1982. The Regional Context of Waulsortian Facies in Northern England K. Bolton, R. H. Lane, & D. V Le Mone, eds. Symposium on the paleoenvironmental setting and distribution of the Waulsortian facies, pp.17–33.
Milliken, K., 2014. A Compositional Classification For Grain Assemblages In Fine-Grained Sediments and Sedimentary Rocks. Journal of Sedimentary Research , 84(12), pp.1185–1199. Available at: http://jsedres.sepmonline.org/content/84/12/1185.abstract.
Milliken, K. et al., 2007. “Cherty” stringers in the Barnett Shale are agglutinated foraminifera. Sedimentary Geology, 198(3–4), pp.221–232.
Milliken, K.L., 2003. Diagenesis G. V Middleton, ed. Encyclopedia of Sediments and Sedimentary Rocks.
Milliken, K.L. et al., 2012. Grain assemblages and strong diagenetic overprinting in siliceous mudrocks, Barnett Shale (Mississippian), Fort Worth Basin, Texas. AAPG Bulletin, 96(8), pp.1553–1578.
Milliken, K.L. et al., 2013. Organic matter-hosted pore system, Marcellus Formation (Devonian), Pennsylvania. AAPG Bulletin, 97(2), pp.177–200.
Milliken, K.L., 2013. SEM-based cathodoluminescence imaging for discriminating quartz types in mudrocks. Unconventional Resources Technology Conference, 1582467.
Milliken, K.L. & Curtis, M.E., 2016. Imaging pores in sedimentary rocks: Foundation of porosity prediction. Marine and Petroleum Geology, 73, pp.590–608. Available at: http://dx.doi.org/10.1016/j.marpetgeo.2016.03.020.
Milliken, K.L. & Day-Stirrat, R.J., 2013. Cementation in mudrocks: Brief review with examples from cratonic basin mudrocks. AAPG Memoir, 103, pp.133–150. Available at: http://archives.datapages.com/data/specpubs/memoir103/data/133_aapg-sp1930133.htm.
Milliken, K.L., Ergene, S.M. & Ozkan, A., 2016. Quartz types, authigenic and detrital, in the Upper Cretaceous Eagle Ford Formation, South Texas, USA. Sedimentary Geology, 339, pp.273–288.
Milliken, K.L. & Reed, R.M., 2010. Multiple causes of diagenetic fabric anisotropy in weakly consolidated mud, Nankai accretionary prism, IODP Expedition 316. Journal of Structural Geology, 32(12), pp.1887–1898. Available at: http://dx.doi.org/10.1016/j.jsg.2010.03.008.
Mondol, N.H. et al., 2007. Experimental mechanical compaction of clay mineral aggregates—Changes in physical properties of mudstones during burial. Marine and Petroleum Geology, 24, pp.289–311.
Montgomery, S.L. et al., 2005. Mississippian Barnett Shale, Fort Worth Basin, north-central Texas: Gas-shale play with multitrillion cubic foot potential. AAPG Bulletin, 89, pp.155–175.

PhD Thesis | 2019
246
Mulder, T. et al., 2017. Carbonate slope morphology revealing sediment transfer from bank-to-slope (Little Bahama Bank, Bahamas). Marine and Petroleum Geology, 83, pp.26–34. Available at: http://dx.doi.org/10.1016/j.marpetgeo.2017.03.002.
Mulder, T. & Etienne, S., 2010. Lobes in deep-sea turbidite systems: State of the art. Sedimentary Geology, 229(3), pp.75–80.
Mullen, J., 2010. Petrophysical Characterization of the Eagle Ford Shale in South Texas. Canadian Unconventional Resources & International Petroleum Conference held in Calgary, (October), pp.19–21.
Mullins, H.T. & Cook, H.E., 1986. Carbonate apron models: Alternatives to the submarine fan model for paleoenvironmental analysis and hydrocarbon exploration. Sedimentary Geology, 48(1–2), pp.37–79.
Mutti, E. & Ricci Lucchi, F., 1972. Le torbiditi dell’Appennino Settentrionale: Introduzione all’analisi di facies: Memoria Società Geologica Italiana, v. 11.
Nadeau, P.H. et al., 2002. I-S precipitation in pore space as the cause of geopressuring in Mesozoic mudstones, Egersund Basin, Norwegian continental shelf. American Mineralogist, 87(11–12), pp.1580–1589.
Nathan, Y. et al., 1997. Geochemistry of cadmium in the negev phosphorites. Chemical Geology.
Naveen, P., Asif, M. & Ojha, K., 2018. Integrated fractal description of nanopore structure and its effect on CH4 adsorption on Jharia coals, India. Fuel, 232(June), pp.190–204. Available at: https://doi.org/10.1016/j.fuel.2018.05.124.
Nelson, P.H., 2009. Pore-throat sizes in sandstones, tight sandstones, and shales. AAPG Bulletin, 93(3), pp.329–340.
Neuzil, C.E., 2013a. Can Shale Safely Host U.S. Nuclear Waste? Trans. Am. Geophys. Union, 94(30), pp.261–262. Available at: http://doi.wiley.com/10.1002/2013EO300001.
Neuzil, C.E., 2013b. Can Shale Safely Host U . S . Nuclear Waste ? , 94(30).
Newport, S.M. et al., 2017. Sedimentology and microfacies of a mud-rich slope succession: in the Carboniferous Bowland Basin, NW England (UK). Journal of the Geological Society, London, (Gawthorpe 1987), p.16pp. Available at: http://jgs.lyellcollection.org/content/jgs/early/2017/11/09/jgs2017-036.full.pdf.
Nichols, G., 2009. Sedimentology and Stratigraphy 2nd ed., Wiley-Blackwell.
Nittrouer, C.A. & Sternberg, R.W., 1981. The formation of sedimentary strata in an allochthonous shelf environment: The Washington continental-shelf. Marine Geology, 42, pp.201–232.
Nole, M. et al., 2016. A method for estimating microporosity of fine-grained sediments and sedimentary rocks via scanning electron microscope image analysis. Sedimentology, pp.1507–1521.
Normark, W.R., 1970. Growth patterns of deep- sea fans. American Association of

PhD Thesis | 2019
247
Petroleum Geologists Bulletin, 54(11), pp.2170–2195.
O’Brien, N.R. & Slatt, R.M., 1990. Argillaceous rock atlas, New York: Springer-Verlag.
Ogston, A.S. et al., 2000. Observations of storm and river flood-driven sediment transport on the northern California continental shelf. Continental Shelf Research, 20, pp.2141–2162.
Passey, Q.R. et al., 2010. From Oil-Prone Source Rock to Gas-Producing Shale Reservoir – Geologic and Petrophysical Characterization of Unconventional Shale-Gas Reservoirs. CPS/SPE International Oil & Gas Conference and Exhibition in China 2010, pp.1707–1735.
Payros, A. & Pujalte, V., 2008. Calciclastic submarine fans: An integrated overview. Earth-Science Reviews, 86(1–4), pp.203–246.
Payros, A., Pujalte, V. & Orue-etxebarria, X., 2007. A point-sourced calciclastic submarine fan complex (Eocene Anotz Formation, western Pyrenees): Facies architecture, evolution and controlling factors. Sedimentology, 54(1), pp.137–168.
Peltonen, C.B. et al., 2008. Clay mineral diagenesis and quartz cementation in mudstones: The effects of smectite to illite reaction on rock properties. Marine and Petroleum Geology, 26(6), pp.887–898.
Pettijohn, F.J., 1975. Sedimentary rocks, New York: Harper and Row.
Pfeifer, P. et al., 1989. Multilayer adsorption on a fractally rough surface. Physical Review Letters, 62(17), pp.1997–2000.
Pfeifer, P. & Avnir, D., 1983. Chemistry in noninteger dimensions between two and three. I. Fractal theory of heterogeneous surfaces. The Journal of Chemical Physics, 79(7), pp.3558–3565.
Piper, D.Z. & Dean, W.E., 2002. Trace-Element Deposition in the Cariaco Basin, Venezuela Shelf, under Sulfate-Reducing Conditions—a History of the Local Hydrography and Global Climate, 20 ka to the Present. USGS, Profession, pp.1–45. Available at: http://geopubs.wr.usgs.gov/prof-paper/pp1670/pp1670.pdf.
Piper, D.Z. & Perkins, R.B., 2004. A modern vs. Permian black shale - the hydrography, primary productivity, and water-column chemistry of deposition. Chemical Geology, 206(3–4), pp.177–197.
Plint, A.G., Macquaker, J.H.S. & Varban, B.L., 2012. Bedload Transport of Mud Across A Wide, Storm-Influenced Ramp: Cenomanian–Turonian Kaskapau Formation, Western Canada Foreland Basin. Journal of Sedimentary Research , 82(11), pp.801–822. Available at: http://jsedres.sepmonline.org/content/82/11/801.abstract.
Pollastro, R.M., 1981. Authigenic Kaolinite and Associated Pyrite in Chalk of the Cretaceous Niobrara Formation, Eastern Colorado. Journal of Sedimentary Research, Vol. 51(2), pp.553–562. Available at: http://jsedres.sepmonline.org/cgi/doi/10.1306/212F7CD4-2B24-11D7-8648000102C1865D.

PhD Thesis | 2019
248
Pomar, L., 2001. Types of carbonate platforms: a genetic approach. Basin Research, 13(3), pp.313–334.
Pomar, L., Brandano, M. & Westphal, H., 2004. Environmental factors influencing skeletal grain sediment associations: a critical review of Miocene examples from the western Mediterranean. Sedimentology, 51(3), pp.627–651.
Pommer, M. & Milliken, K., 2015. Pore types and pore-size distributions across thermal maturity, Eagle Ford Formation, southern Texas. AAPG Bulletin, 99(9).
Potter, P.E., 1998. Shale-rich basins: controls and origin J. Schieber, W. Zimmerle, & P. S. Sethi, eds. Shale and Mudstones I. Basin studies, Sedimentology and Palaeontology, pp.21–32.
Potter, P.E., Maynard, J.B. & Depetris, P.J., 2005. Mud and mudstones: Introduction and overview, Berlin, Germany: Springer.
Potter, P.E., Maynard, J.B. & Pryor, W.A., 1980. Sedimentology of shale, New York: Springer-Verlag.
Powell, J. et al., 2010. Managing radioactive waste safely: initial geological unsuitability screening of West Cumbria. British geological survey.
Principaud, M. et al., 2018. Recent morphology and sedimentary processes along the western slope of Great Bahama Bank (Bahamas). Sedimentology, 65(6), pp.2088–2116.
Quine, M. & Bosence, D., 1991. Stratal geometries, facies and sea-floor erosion in Upper Cretaceous Chalk, Normandy, France. Sedimentology, 38, pp.1113–1152.
Radlinski, A.P. et al., 2004. Application of SAXS and SANS in evaluation of porosity, pore size distribution and surface area of coal. International Journal of Coal Geology.
Radwan, O., Bu Khamsin, A. & Al-Ramadan, K., 2017. Detrital dolomite: Characterization and characteristics. Geological Quarterly, 62(1), pp.81–89.
Raiswell, R., 1982. Pyrite texture, Isotopic Composition and the Availability of Iron. American Journal of Science, 282, pp.1244–1263.
Raiswell, R. & Canfield, D.E., 1998. Sources of iron for pyrite formation in marine sediments. American Journal of Science, 298(3), pp.219–245.
Reijmer, J.J. et al., 2002. Bahamian carbonate platform development in response to sea-level changes and the closure of the Isthmus of Panama. International Journal of Earth Sciences, 91(3), pp.482–489.
Reijmer, J.J.G. et al., 2015. Calciturbidites and calcidebrites: Sea-level variations or tectonic processes? Sedimentary Geology, 317, pp.53–70. Available at: http://dx.doi.org/10.1016/j.sedgeo.2014.10.013.
Rickard, D., 1997. Kinetics of pyrite formation by the H2S oxidation of iron (II) monosulfide in aqueous solutions between 25 and 125°C: The rate equation. Geochimica et Cosmochimica Acta, 61(1), pp.115–134.

PhD Thesis | 2019
249
Riley, N.J., 1993. Dinantian (Lower Carboniferous) biostratigraphy and chronostratigraphy in the British Isles. Journal of the Geological Society London, 150(3), pp.427–446.
Riley, N.J., 1990. Stratigraphy of the Worston Shale Group (Dinantian), Craven Basin, north-west England. Proceedings of the Yorkshire Geological Society, 48(2), pp.163–187.
Rimstidt, J.D., Chermak, J.A. & Schreiber, M.E., 2017. Processes that control mineral and element abundances in shales. Earth-Science Reviews, 171(September 2016), pp.383–399. Available at: http://linkinghub.elsevier.com/retrieve/pii/S0012825216302860.
Ross, D.J.K. & Marc Bustin, R., 2009. The importance of shale composition and pore structure upon gas storage potential of shale gas reservoirs. Marine and Petroleum Geology, 26(6), pp.916–927. Available at: http://dx.doi.org/10.1016/j.marpetgeo.2008.06.004.
Rouquerol, F. et al., 2013. Introduction. Adsorption by Powders and Porous Solids: Principles, Methodology and Applications: Second Edition, pp.1–24.
Rouquerol, F., Rouquerol, J. & Sing, K., 1999. Chapter 3 - Methodology of Adsorption at the Gas-Solid Interface. In Adsorption by Powders and Porous Solids. pp. 51–92. Available at: http://www.sciencedirect.com/science/article/pii/B978012598920650004X%5CnC:%5CUsers%5CFranta Pepa Jedni?ka%5CAppData%5CRoaming%5CMozilla%5CFirefox%5CProfiles%5C5vws6fbr.default%5Czotero%5Cstorage%5CD3GABSID%5CB978012598920650004X.html.
Rouquerol, J. et al., 2013. Adsorption by Powders and Porous Solids: Principles, Methodology and Applications: Second Edition,
Rouquerol, J., Avnir, D., Fairbridge, C.W., Everett, D.H., Haynes, J.H., Pernicone, N., Ramsay, J.D.F., et al., 1994. Recommendations for the characterization of porous solids. Pure and Applied Chemistry, 66(8), pp.1739–1758. Available at: http://iupac.org/publications/pac/66/8/1739/.
Rouquerol, J., Avnir, D., Fairbridge, C.W., Everett, D.H., Haynes, J.H., Pernicone, N., Sing, J.D.F., et al., 1994. Recommendations for the characterization of porous solids. Pure and Applied Chemistry, 66, pp.1739–1758.
Rouquerol, J., Llewellyn, P. & Rouquerol, F., 2007. Is the BET equation applicable to microporous adsorbents? Studies in Surface Science and Catalysis, 160, pp.49–56. Available at: http://www.sciencedirect.com/science/article/pii/S0167299107800085.
Rybacki, E., Meier, T. & Dresen, G., 2016. What controls the mechanical properties of shale rocks? - Part II: Brittleness. Journal of Petroleum Science and Engineering, 144, pp.39–58. Available at: http://dx.doi.org/10.1016/j.petrol.2016.02.022.
Sahouli, B., Blacher, S. & Brouers, F., 1997. Applicability of the fractal FHH equation.

PhD Thesis | 2019
250
Langmuir, 13(16), pp.4391–4394.
Savary, B., 2005. Calcareous turbidity current emplacement as an initiation mechanism for substrate brecciation and deformation. Geological Society, London, Special Publications, 244(1), pp.207–220.
Savary, B. & Ferry, S., 2004. Geometry and petrophysical parameters of a calcarenitic turbidite lobe (Barremian-Aptian, Pas-de-la-Cluse, France). Sedimentary Geology, 168(3–4), pp.281–304.
Savary, B., Olivero, D. & Gaillard, C., 2004. Calciturbidite dynamics and endobenthic colonisation: Example from a late Barremian (Early Cretaceous) succession in southeastern France. Palaeogeography, Palaeoclimatology, Palaeoecology, 211(3–4), pp.221–239.
Sawlowicz, Z., 1993. Pyrite framboids and their development: a new conceptual mechanism. Geologische Rundschau, 82(1), pp.148–156.
Saxena, C.B.M.P.S., 2000. Carbonate shedding and sedimentary cyclicities of a distally.pdf. , pp.140–153.
Schepers, K.C. et al., 2009. Reservoir Modeling and Simulation of the Devonian Gas Shale of Eastern Kentucky for Enhanced Gas Recovery and CO 2 Storage. SPE Journal, pp.10–11.
Schieber, J., 2010. Common Themes in the Formation and Preservation of Intrinsic Porosity in Shales and Mudstones - Illustrated with Examples Across the Phanerozoic.
Schieber, J., 1999. Distribution and deposition of mudstone facies in the Upper Devonian Sonyea Group of New York. Journal of Sedimentary Research, 69(4), pp.909–925.
Schieber, J., 2016a. Experimental testing of the transport-durability of shale lithics and its implications for interpreting the rock record. Sedimentary Geology, 331, pp.162–169.
Schieber, J., 2011. Marcasite in Black Shales--a Mineral Proxy for Oxygenated Bottom Waters and Intermittent Oxidation of Carbonaceous Muds. Journal of Sedimentary Research, 81(7), pp.447–458. Available at: http://jsedres.sepmonline.org/cgi/doi/10.2110/jsr.2011.41.
Schieber, J., 2016b. Mud re-distribution in epicontinental basins - Exploring likely processes. Marine and Petroleum Geology, 71, pp.119–133. Available at: http://dx.doi.org/10.1016/j.marpetgeo.2015.12.014.
Schieber, J., 2013. SEM Observations on Ion-milled Samples of Devonian Black Shales from Indiana and New York: The Petrographic Context of Multiple Pore Types. Electron microscopy of shale hydrocarbon reservoirs: AAPG Memoir 102, (April 2010), pp.153–172.
Schieber, J. & Bennett, R., 2013. Bedload transport of mud across a wide, storm-influenced ramp: Cenomanian–Turonian Kaskapau Formation, western Canada foreland basin—Discussion. Journal of Sedimentary Research, 83(12), pp.1198–
PhD Thesis | 2019
251
1199.
Schieber, J. & Riciputi, L., 2005. Pyrite and Marcasite Coated Grains in the Ordovician Winnipeg Formation, Canada: An Intertwined Record of Surface Conditions, Stratigraphic Condensation, Geochemical “Reworking,” and Microbial Activity. Journal of Sedimentary Research, 75(5), pp.907–920. Available at: http://jsedres.sepmonline.org/cgi/doi/10.2110/jsr.2005.070.
Schieber, J., Southard, J. & Thaisen, K., 2007. Accretion of mudstone beds from migrating floccule ripples. Science , 318, pp.1760–1763.
Schieber, J., Southard, J.B. & Schimmelmann, A., 2010. Lenticular Shale Fabrics Resulting from Intermittent Erosion of Water-Rich Muds--Interpreting the Rock Record in the Light of Recent Flume Experiments. Journal of Sedimentary Research, 80(1), pp.119–128. Available at: http://jsedres.sepmonline.org/cgi/doi/10.2110/jsr.2010.005.
Scholle, P.A. & Ulmer-Scholle, D.S., 2003. A Color Guide to the Petrography of Carbonate Rocks: Grains, textures, porosity, diagenesis. Aapg Memoir, 77, p.460.
Schön, J.H., 2015. Physical properties of rocks: Fundamentals and principles of petrophysics, Elsevier.
Schoonen, M.A.A. & Barnes, H.L., 1991. Reactions forming pyrite and marcasite from solution: I. Nucleation of FeS2below 100°C. Geochimica et Cosmochimica Acta, 55(6), pp.1495–1504.
Shanmugam, G., 2000. 50 Years of the Turbidite Paradigm (1950S-1990S): Deep Water Processes and Facies Models - a Critical Perspective. Mar. Pet. Geol., 17(2), pp.285–342.
Shanmugam, G., 2017. Global case studies of soft-sediment deformation structures (SSDS): Definitions, classifications, advances, origins, and problems. Journal of Palaeogeography, 6(4), pp.251–320.
Shanmugam, G., 1997. The Bouma sequence and the turbidite mind set. Earth-Science Reviews, 42(4), pp.201–229.
Shaw, H.F. & Primmer, T.J., 1991. Diagenesis of mudrocks from the Kimmeridge Clay Formation of the Brae Area, U.K. North Sea. Marine Petrology Geol, 8, pp.270–277.
Shepard, F.P., 1954. Nomenclature based on sand-silt-clay ratios: Journal Sedimentary Petrology. , 24, pp.151–158.
Silver, M.W., Shanks, a L. & Trent, J.D., 1978. Marine snow: microplankton habitat and source of small-scale patchiness in pelagic populations. Science (New York, N.Y.), 201(4353), pp.371–373. Available at: http://www.sciencemag.org/cgi/doi/10.1126/science.201.4353.371.
Sing, K.S.W. et al., 2013. Chapter 8. Assessment of Mesoporosity. In Adsorption by Powders and Porous Solids: Principles, Methodology and Applications.
Sing, K.S.W. et al., 1985. International union of pure and applied chemistry physical

PhD Thesis | 2019
252
chemistry division reporting physisorption data for gas/soils systems with special reference to the determination of surface area and porosity. Pure Appl. Chemistry, 57(4), pp.603–619.
Slatt, R.M., 2011. Important geological properties of unconventional resource shales. Central European Journal of Geosciences, 3(4), pp.435–448. Available at: http://www.degruyter.com/view/j/geo.2011.3.issue-4/s13533-011-0042-2/s13533-011-0042-2.xml.
Slatt, R.M. et al., 2012. Pore-to-regional-scale integrated characterization workflow for unconventional gas shales J. A. Breyer, ed. Shale reservoirs-Giant resources for the 21st century, 97, pp.127–150.
Slatt, R.M. & O’Brien, N.R., 2011a. Geological properties of unconventional resource shales I: pore types. Report, (December), pp.1–17. Available at: http://shale-consortium.com/docs/Report_Eagle_Ford_Laluna_Woodford.pdf.
Slatt, R.M. & O’Brien, N.R., 2013. Microfabrics Related to Porosity Development, Sedimentary and Diagenetic Processes, and Composition of Unconventional Resource Shale Reservoirs as Determined by Conventional Scanning Electron Microscopy. In Electron microscopy of shale hydrocarbon reservoirs: AAPG Memoir 102. pp. 37–44.
Slatt, R.M. & O’Brien, N.R., 2011b. Pore types in the Barnett and Woodford gas shales: Contribution to understanding gas storage and migration pathways in fine-grained rocks. AAPG Bulletin, 95(12), pp.2017–2030.
Slaughter, M. & Hill, R.J., 1991. THE INFLUENCE OF ORGANIC MATTER IN ORGANOGENIC DOLOMITIZATION. Journal of Sedimentary Petrology, 61(2), pp.296–303.
Soeder, D.J., 2018. The successful development of gas and oil resources from shales in North America. Journal of Petroleum Science and Engineering, 163, pp.399–420.
Soeder, D.J., 2017. Unconventional: The Development of Natural Gas from the Marcellus Shale; Product Code: SPE527; Published: March 27, 2017; Author: Daniel J. Soeder; ISBN Number: 978-0-8137-2527-7, National Energy Technology Lab.(NETL), Pittsburgh, PA, and Morgantown, WV ….
Sondergeld, C.H. et al., 2010. Micro-structural studies of gas shales. Society of Petroleum Engineers Unconventional Gas Conference, SPE Paper 131771, p.17.
Song, W. et al., 2018. Pore-scale numerical investigation into the impacts of the spatial and pore-size distributions of organic matter on shale gas flow and their implications on multiscale characterisation. Fuel.
Soper, N.J., Webb, B.C. & Woodcock, N.H., 1987. Late Caledonian (Acadian) transgression in North West England: timing, geometry and geotcctonic significance. Proceedings of the Yorkshire Geological Society, 46, pp.175–192.
Spinelli, G.A. et al., 2007. Diagenesis, sediment strength, and pore collapse in sediment approaching the Nankai Trough subduction zone. Bulletin of the Geological Society of America, 119(3–4), pp.377–390.

PhD Thesis | 2019
253
Stanjek, H. & Häusler, W., 2004. Basics of X-ray Diffraction. Hyperfine Interactions, 154(1–4), pp.107–119.
Stephenson, M., 2015. Shale gas and fracking: The science behind the controversy, Elsevier.
Stow, D.A. V. & Piper, D.J.W., 1984. Deep-water fine-grained sediments: facies models. Geological Society, London, Special Publications, 15(1), pp.611–646. Available at: http://sp.lyellcollection.org/lookup/doi/10.1144/GSL.SP.1984.015.01.38.
Stow, D.A. V, 1981. Fine-grained sediments: Terminology. Quarterly Journal of Engineering Geology, London, 14, pp.243–244.
Stow, D.A. V & Mayall, M., 2000. Deep-water sedimentary systems: new models for the 21st century. Marine and Petroleum Geology, 17(2), pp.125–135.
Stow, D.A. V, Reading, H.G. & Collinson, J.D., 1996. Deep Seas H. G. Reading, ed. Sedimentary Environments: Processes, Facies and Stratigraphy, 3rd edition, pp.395–453.
Stow, D.A. V & Shanmugam, G., 1980. Sequence of structures in fine-grained turbidites: Comparison of recent deep-sea and ancient flysch sediments. Sedimentary Geology, 25(1–2), pp.23–42.
Sumner, E.J., Talling, P.J. & Amy, L.A., 2009. Deposits of flows transitional between turbidity current and debris flow. Geology, 37(11), pp.991–994.
Swift, D.J.P. & Thorne, J.A., 1991. Sedimentation on continental margins, 1: a general model for shelf sedimentation D. J. Swift et al., eds. Shelf Sand and Sandstone Bodies; Geometry, Facies and Sequence Stratigraphy, pp.3–31.
Talbot, M.R. & Allen, P.A., 1996. Lakes H. G. Reading, ed. Sedimentary Environments: Processes, Facies and Stratigraphy, 3rd edition, pp.83–124.
Talling, P.J. et al., 2012. Subaqueous sediment density flows: Depositional processes and deposit types. Sedimentology, 59(7), pp.1937–2003.
Taylor, G.H. et al., 1998. Organic petrology.
Taylor, K.G. et al., 2000. Carbonate cementation in a sequence-stratigraphic framework: upper Cretaceous sandstones, Book Cliffs, Utah-Colorado. Journal of Sedimentary Research, 70, pp.360–372.
Taylor, K.G. et al., 2002. Stratigraphic significance of ooidal ironstones from the Cretaceous Western Interior Seaway: the Peace River Formation, Alberta and the Castlegate Sandstone, Utah. Journal of Sedimentary Research, 72, pp.345–356.
Taylor, K.G. & Gawthorpe, R.L., 2003. Basin-scale dolomite cementation of shoreface sandstones in response to sea-level fall. Bulletin of the Geological Society of America, 115(10), pp.1218–1229.
Taylor, K.G. & Macquaker, J.H.S., 2014. Diagenetic alterations in a silt- and clay- rich mudstone succession: an example from the Upper Cretaceous Mancos Shale of

PhD Thesis | 2019
254
Utah, USA. Clay Minerals, 49, pp.245–259.
Taylor, K.G. & Macquaker, J.H.S., 2014. Diagenetic alterations in a silt- and clay-rich mudstone succession: An example from the Upper Cretaceous Mancos Shale of Utah, USA. Clay Minerals, 49, pp.213–227.
Taylor, K.G. & Macquaker, J.H.S., 2000. Early diagenetic pyrite morphology in a mudstone-dominated succession: The Lower Jurassic Cleveland Ironstone Formation, eastern England. Sedimentary Geology, 131(1–2), pp.77–86.
Thyberg, B. et al., 2010. Quartz cementation in Late Cretaceous mudstones, northern North Sea: Changes in rock properties due to dissolution of smectite and precipitation of micro-quartz crystals. Marine and Petroleum Geology, 27(8), pp.1752–1764. Available at: http://dx.doi.org/10.1016/j.marpetgeo.2009.07.005.
Thyberg, B. & Jahren, J., 2011. Quartz cementation in mudstones: sheet-like quartz cement from clay mineral reactions during burial. Petroleum Geoscience, 17(1), pp.53–63. Available at: http://pg.lyellcollection.org/cgi/doi/10.1144/1354-079310-028.
Tissot, B.P. & Welte, D.H., 1978. Petroleum Formation and Occurrence: a new approach to oil and gas exploration, New York: Springer-Verlag.
Tournadour, E. et al., 2015. Origin and architecture of a Mass Transport Complex on the northwest slope of Little Bahama Bank (Bahamas): Relations between off-bank transport, bottom current sedimentation and submarine landslides. Sedimentary Geology, 317, pp.9–26. Available at: http://dx.doi.org/10.1016/j.sedgeo.2014.10.003.
Tournadour, E. et al., 2017. Submarine canyon morphologies and evolution in modern carbonate settings: The northern slope of Little Bahama Bank, Bahamas. Marine Geology, 391(July), pp.76–97. Available at: http://dx.doi.org/10.1016/j.margeo.2017.07.014.
Tourtelot, H.A., 1960. Origin and use of the word “shale.” American Journal of Science, Bradley Volume, 258–A, pp.335–343.
Tribovillard, N. et al., 2004. Deep-water anoxia over the Frasnian-Famennian boundary (La Serre, France): A tectonically induced oceanic anoxic event? Terra Nova, 16(5), pp.288–295.
Tribovillard, N. et al., 2006. Trace metals as paleoredox and paleoproductivity proxies: An update. Chemical Geology, 232(1–2), pp.12–32.
Twenhofel, W.H., 1937. Terminology of the fine grained mechanical sediments. Report of Committee on Sedimentation 1936-1937: National Research Council washington, D.C., 5, pp.81–104.
Tyson, R. V, 1995. Sedimentary organic matter: Organic facies and palynofacies, London: Chapman and Hall.
Uchman, A. & Wetzel, A., 2012. Deep-Sea Fans. Developments in Sedimentology, 64, pp.643–671.
PhD Thesis | 2019
255
Uchman, A. & Wetzel, A., 2011. Deep-sea ichnology: The relationships between depositional environment and endobenthic organisms 1st ed., Elsevier B.V. Available at: http://dx.doi.org/10.1016/B978-0-444-53000-4.00008-1.
Udden, J.A., 1898. The Mechanical Composition of Wind Deposits,
USEIA, 2013. Technically recoverable shale oil and shale gas resources: an assessment of 137 shale formations in 41 countries outside the United States. United States Energy Information Administration. Independent Statistics & Analysis, U.S. Department of Energy. Available at: http://www.eia.gov/analysis/studies/worldshalegas/.
Vigorito, M., Murru, M. & Simone, L., 2005. Anatomy of a submarine channel system and related fan in a foramol/rhodalgal carbonate sedimentary setting: A case history from the Miocene syn-rift Sardinia Basin, Italy. Sedimentary Geology, 174(1–2), pp.1–30.
Vigorito, M., Murru, M. & Simone, L., 2006. Architectural patterns in a multistorey mixed carbonate-siliciclastic submarine channel, Porto Torres Basin, Miocene, Sardinia, Italy. Sedimentary Geology, 186(3–4), pp.213–236.
Walderhaug, O. & Bjorkum, P.A., 2003. The Effect of Stylolite Spacing on Quartz Cementation in the Lower Jurassic Sto Formation, Southern Barents Sea. Journal of Sedimentary Research, 73(2), pp.146–156. Available at: https://pubs.geoscienceworld.org/jsedres/article/73/2/146-156/99285.
Wang, J., Ryan, D. & Anthony, E.J., 2011. Reducing the greenhouse gas footprint of shale gas. Energy Policy, 39(12), pp.8196–8199. Available at: http://dx.doi.org/10.1016/j.enpol.2011.10.013.
Wang, Z. et al., 2018. Characteristics of microscopic pore structure and fractal dimension of bituminous coal by cyclic gas adsorption/desorption: An experimental study. Fuel, 232(June), pp.495–505. Available at: https://doi.org/10.1016/j.fuel.2018.06.004.
Warrick, J.A. & Milliman, J.D., 2003. Hyperpycnal sediment discharge from semiarid southern California rivers: Implications for coastal sediment budgets. GSA Geology, 31(9), pp.781–784.
Waters, C.N. et al., 2009. A lithostratigraphical framework for the Carboniferous successions of northern Great Britain (onshore). British Geological Survey Research Report RR/09/01.
Waters, C.N. et al., 2011. Craven Basin and southern Pennines. In C. N. Waters, ed. A revised correlation of Carboniferous rocks in the British Isles. London: Geological Society (London) Special Report, pp. 74–81.
Waters, C.N. & Condon, D.J., 2013. Nature and timing of Late Mississippian to Mid-Pennsylvanian glacio-eustatic sea-level changes of the Pennine Basin, UK: Discussion Reply. Journal of the Geological Society, 170(5), pp.850–850. Available at: http://jgs.lyellcollection.org/lookup/doi/10.1144/jgs2013-055.
Weiss, H.M. et al., 2006. The Norwegian Industry Guide to Organic Geochemical

PhD Thesis | 2019
256
Analyses [online]. Edition 4.0 Norsk Hydro Statoil, Geolab Nor. SINTEF Petroleum Research and the Norwegian Petroleum Directorate. Available at: http://www.npd.no/engelsk/nigoga/default.htm.
Welton, J.E., 2003. SEM petrology atlas,
Wentworth, C.K., 1922. A scale of grade and class terms for clastic sediments. Journal of Geology, Chicago, 30, pp.377–392.
Weser, O.E., 1974. Sediment classification based on Deep Sea Drilling Project drilling. Geological Society of America, Program with Abstract, 6, pp.1073–1074.
Wilkin, R.T., 2003. Sulfide minerals in sediments. In G. V. Middleton, ed. Encyclopedia of Sediments and Sedimentary Rocks. New York: Kluwer Academic Publishers, p. 701–703. Available at: https://doi.org/10.1007/978-1-4020-3609-5_228.
Wilkin, R.T., Arthur, M.A. & Dean, W.E., 1997. History of water-column anoxia in the Black Sea indicated pyrite framboid size distributions. Earth and Planetary Science Letters, 148, pp.517–525.
Wilkin, R.T., Barnes, H.L. & Brantley, S.L., 1996. The size distribution of framboidal pyrite in modern sediments: An indicator of redox conditions. Geochimica et Cosmochimica Acta, 60(20), pp.3897–3912.
Williams, K.E., 2012. The Permeability of Overpressure Shale Seals and of Source Rock Reservoirs is the Same.
Wilson, R.D. & Schieber, J., 2014. Muddy Prodeltaic Hyperpycnites In the Lower Genesee Group of Central New York, USA: Implications For Mud Transport In Epicontinental Seas. Journal of Sedimentary Research, 84(10).
Worden, R. & Morad, S., 2003. Clay mineral cements in sandstones,
Wright, A.M., Ratcliffe, K.T. & Spain, D., 2010. Application of Inorganic Whole Rock Geochemistry to Shale Resource Plays. Canadian Unconventional Resources & International Petroleum Conference, (October), pp.19–21.
Wright, J., 2001. Making loess-size quartz silt: Data from laboratory simulations and implications for sediment transport pathways and the formation of “desert” loess deposits associated with the Sahara. Quaternary International, 76/77, pp.7–19.
Wright, L.D. & Friedrichs, C.T., 2006. Gravity-driven sediment transport on continental shelves: A status report. Continental Shelf Research , 26, pp.2092–2107.
Wright, V.P., 1994. Early Carboniferous carbonate systems: an alternative to the Cainozoic paradigm. Sedimentary Geology, 93(1–2), pp.1–5.
Wright, V.P. & Burchette, T.P., 1996. Shallow-water Carbonate Environment. In H. G. Reading, ed. Sedimentary Environments: Processes, Facies and Stratigraphy, 3rd edition. Blackwell Publishing, p. 688.
Wright, V.P. & Faulkner, T.J., 1990. Sediment dynamics of Early Carboniferous ramps: a proposal. Geol. J., 25(051), pp.139–144.

PhD Thesis | 2019
257
Wu, M.K., 1996. The roughness of aerosol particles: Surface fractal dimension measured using nitrogen adsorption. Aerosol Science and Technology, 25(4), pp.392–398.
Wunsch, M. et al., 2017. Sedimentary dynamics along carbonate slopes (Bahamas archipelago). Sedimentology, 64(3), pp.631–657.
Wust, R.A.J. et al., 2013. Vitrinite reflectance versus pyrolysis Tmax data: Assessing thermal maturity in shale plays with special reference to the Duvernay shale play of the Western Canadian Sedimentary Basin, Alberta, Canada. SPE Unconventional Resources Conference and Exhibition-Asia Pacific, pp.1–11. Available at: http://www.onepetro.org/doi/10.2118/167031-MS.
Yao, Y. et al., 2008. Fractal characterization of adsorption-pores of coals from North China: An investigation on CH4 adsorption capacity of coals. International Journal of Coal Geology, 73(1), pp.27–42.
Yawar, Z. & Schieber, J., 2017. On the origin of silt laminae in laminated shales. Sedimentary Geology, 360.

PhD Thesis | 2019
258
Chapter 5 Pore Morphology and Nanopore
Characterisation of the Hodder
Unconventional Reservoir, Bowland
Basin, UK

PhD Thesis | 2019
259
5 Pore Morphology and Nanopore Characterisation of the Hodder
Unconventional Reservoir, Bowland Basin, UK
Timothy M. Ohiara1, Kevin G. Taylor1, Patrick J. Dowey1
1 School of Earth and Environmental Sciences, the University of Manchester, Oxford Road,
Manchester M13 9PL, UK
Keywords: Pores, micropore, mesopore, nanopore, nitrogen gas adsorption, isotherms,
pore size, pore volume, fractal dimension
Abstract
Pores in shales or mudstones are mostly submillimetre-scale pores hosted in and around
inorganic constituents and in mature organic matter. Micrometre– and nanometer– scale
pores between and within particles of mudstone sequences are strongly influenced by
carbonate and silicate mineral diagenesis. A visual, qualitative description and direct
quantitative pore analyses on the Lower Carboniferous Hodder Mudstone Formation,
Bowland Basin is presented here to show the morphology and controls on pore size
distribution in a mixed carbonate- and silicate-rich mudstone. The studied formation is
the UK’s potential Hodder shale gas target characterised by varying silicic-to calcitic
mudstone lithofacies. The intent of this study was to characterise pore types and mineral
components from a suite of boreholes along the northern margin of the Bowland Basin
and evaluate pore values and size distribution. The work utilised X-ray diffraction, 2D
SEM-based image analysis and N2 gas-adsorption techniques. Samples consist of
calcareous mudstones, siliceous-argillaceous mudstones and argillaceous-siliceous
mudstones. Pore types found in the studied samples are grouped into three. These are:
1) inter-particle forms occurring between mineral matrix and grains, clay cleavage planes
between pyrite microcrystals; 2) intra-particle forms found mostly within carbonate
grains and cements; 3) organic matter associated pores which are found around organic

PhD Thesis | 2019
260
matter components. In the clay-rich mudstones, pores associated with inorganic
components were <300nm in diameter and comprised a large percentage of the pore
volume. Sand (bioclast)-rich mudstones exhibited isolated <1µm sized-pores due to
intense carbonate cementation and pore-filling kaolinite. The calculated porosity of
calcareous samples is between 3.6 – 4.4 % while in more argillaceous samples is 5.6 – 6.8
% porosity. Pore size distribution, pore volume, surface area and fractal dimension are
mineralogically-controlled. Argillaceous samples are dominated by smaller sized pores
and calcareous samples are mostly composed of larger sized pores. However, values of
pore volume in argillaceous samples are higher than those of calcareous samples.
Diagenetic modifications are localised and are akin to primary depositional grain
components, it is therefore posited in this study that pore values and morphology in
mudstones are primarily controlled by compositional variation of grain assemblages. The
study has implication in the resource estimation of the potential future UK shale-gas play
and in the identification of porosity controls in mixed carbonate-/silicate- mudstones.
Introduction
Technological advancement in horizontal drilling and hydraulic fracturing of organic-rich
mudstones (shales) for hydrocarbon production has prompted considerable research
into mudstone porosity (Schieber 2010; Clarkson et al. 2011; Slatt 2011; Loucks et al.
2009; Loucks et al. 2012; Chalmers & Bustin 2015; Rybacki et al. 2016; Ma, et al. 2017a).
Pore size distribution in mudstones affects the storage and migration of hydrocarbons in
mudstones (Bustin et al. 2008; Loucks et al. 2009; Slatt & O’Brien 2011; Kuila & Prasad
2013; Ma, et al. 2017b). A poor understanding of the porosity and pore size distributions
within these rocks may result in underestimation or overestimation of shale hydrocarbon
reserves (Nole et al. 2016).

PhD Thesis | 2019
261
Pores in mudstones are micron to nanometre-sized voids between or within inorganic
and organic rock components (O’Brien & Slatt 1990; Chalmers et al. 2012; Loucks et al.
2012; Milliken & Day-Stirrat 2013; Kuila et al. 2014). Nanometre-scale pores and pore-
throats dominate mudstone pore networks and are associated with clay minerals and
organic matter (Javadpour 2009; Loucks et al. 2009; Kuila et al. 2012; Kuila & Prasad
2013; Ma et al. 2016; Ma, et al. 2017b). When compared to conventional sandstones and
most carbonate reservoirs, pore sizes within mudstones are an order of magnitude
smaller than conventional reservoirs (Nelson 2009; Passey et al. 2010; Chalmers et al.
2012). The diameter of pore-throats in conventional reservoir rocks is greater than 2 µm
but range from 0.1 to 0.005 µm in mudstones (Nelson 2009).
The accurate and reproducible evaluation of mudstone porosity using procedures
utilized in conventional reservoirs is an arduous task (Clarkson et al. 2011; Slatt 2011).
The inherently small pore size, the capillarity of interstitial fluid, limited pore
connectivity and very fine-grained (≤63µm) rock matrix (Schieber 2010; Milliken &
Curtis 2016) make the measurements of porosity in mudstones challenging. Additionally,
mudstones are often mineralogically diverse with poorly understood diagenetic histories
(Aplin & Macquaker 2011; Milliken et al. 2012; Macquaker et al. 2014; Milliken & Curtis
2016). The complexities in mineral authigenesis and cementation within mudstones have
a significant implication in pore evolution (Milliken & Curtis 2016).
Over the past two decades, porosity measurements in mudstones have been subjected to
innovative scientific techniques (Figure 5.1). These include fluid invasion techniques
such as ultra-high pressure mercury injection (Katsube 2000; Javadpour et al. 2007) and
low-pressure CO2 and N2 gas adsorption techniques (Liu et al. 2017; Kuila & Prasad
2013a). Other techniques involving non-destructive methods include nuclear magnetic

PhD Thesis | 2019
262
resonance (NMR) imaging (Loucks et al. 2009; Sondergeld et al. 2010), scanning electron
microscopy (SEM) (Loucks et al. 2009; Jiao et al. 2014; Kelly et al. 2016; Klaver et al.
2016), transmission electron microscopy (TEM) (Curtis et al. 2010; Bernard & Brown
2013), high resolution X-ray micro- and nano-computed tomography (CT) (Cnudde &
Boone 2013; Ma et al. 2016), small angle X-ray scattering (Radlinski et al. 2004), and
small-angle and ultra-small-angle neutron scattering (SANS and USANS) (Clarkson,
Freeman, et al. 2012). The utility of these techniques affords pore characterisation at
various scales and different resolutions from 1 nm to 1 mm (Figure 5.1).
This study attempts a quantitative and direct visual qualitative pore analyses of
mudstone samples from the Hodder Mudstone, Bowland Basin, using a dual-scale
approach. The Hodder Mudstone forms the lower section of the Bowland-Hodder shale
gas play in Northwest England (Clarke et al. 2018). Studies by Andrews (2013) and Clarke
et al. (2018) of the Bowland-Hodder play report an organic-rich, thick and laterally
extensive mixed siliciclastic-carbonate sequence which may be suitable for economic
shale gas production. From outcrop and seismic data, the Hodder Mudstone is the
thickest of the three formations (Upper Bowland, Lower Bowland and Hodder Mudstone
Formations) within the hybrid Bowland-Hodder Shale gas play (Waters et al. 2009;
Clarke et al. 2018). Although previous studies have recognised its potential (Andrews
2013; Clarke et al. 2018), there has been no quantitative or qualitative characterisation
of pores within this formation. Pore quantification of one sample from the overlying
Bowland Shale using X-ray CT, SEM imaging and nitrogen adsorption by Ma et al. (2016)
showed the existence of nanometre-scale pores within organic and inorganic particles.
That study characterised the range of pore types, sizes and distributions over a range of
scales. While this provides unparalleled detail on the pore structure, it cannot be
considered to be representative and cannot be used to identify the controls on porosity

PhD Thesis | 2019
263
preservation during burial diagenesis. This chapter, (i) characterises the pore structure
and pore size distribution of selected Hodder Mudstone samples from varying depths and
different facies using nitrogen adsorption data and SEM imaging and (ii) seeks to link
porosity variability to mineral compositions.
Porosity is a fundamental parameter for hydrocarbon-in-place estimates (Clarkson et al.
2011). Therefore, the results of this study are of significance in evaluating the Bowland-
Hodder Shale Play. While the storage and migration of hydrocarbon molecules through
organic-rich mudstones are still being investigated (Kazemi & Takbiri-Borujeni 2017;
Gupta et al. 2018; Song et al. 2018), this study will provide data on pore distributions
across different mudstone facies.

PhD Thesis | 2019
264
Figure 5.1: The various methods utilized for estimating porosity and pore size distribution in mudstones. Redrawn from Clarkson et al. (2013). Red-outlined techniques were utilized in this study.
5.1.1 Lower Carboniferous Bowland Basin shale gas potential
Bowland Basin with surrounding intra-Carboniferous basins around the Pennine host 19
hydrocarbon fields (Andrews 2013). Increased exploration activities have resulted in a
number of exploration wells in the Bowland Basin with substantial 2D and 3D seismic
data for hydrocarbon and solid mineral prospecting since the 1960s (Figure 5.2) (Clarke
et al. 2018).

PhD Thesis | 2019
265
Figure 5.2: (A) Location and geological map of the Bowland Basin showing surface outcrops and location of cited wells. Map adapted from the BGS 1:650000 geological map of the UK. (B) Interpreted seismic section GC83-352 taken from Clarke et al (2018), location of seismic line is highlighted in (A), vertical scale in two way time.
Hydrocarbon exploration activities largely targeted conventional reservoirs, however,
the past decade has seen active exploration for shale gas within ca. 5000 m thick Viséan
to Namurian age mudstone succession in the Bowland Basin (e.g. Andrews 2013; Clarke
et al. 2014; Brindle et al. 2015; Hennissen et al. 2017; Clarke et al. 2018). This succession

PhD Thesis | 2019
266
consists of a hybrid of Carboniferous shale gas resource system (Figure 5.2) namely: the
Bowland-Hodder Shales and the Millstone Grit (Caton, Sabden and the Upper Shales). The
Bowland-Hodder shale unconventional resource system is divided into three units, the
Upper Bowland Shale, Lower Bowland Shale and the Hodder Mudstone (Clarke et al.
2018). These formations are laterally extensive within a network of complex fault-
bounded basins and troughs. Of interest to this study is the Hodder Mudstone Formation.
The Hodder Mudstone is a thick carbonate-rich hemipelagic mudstone with subordinate
calcareous turbidites (Gawthorpe 1986; Riley 1993; Waters et al. 2009; Andrews 2013).
It is estimated from outcrop data that the Bowland Basin is composed of about <270 m of
Bowland Shale and 900m of Hodder Mudstone (Brandon et al. 1998; Riley 1990; Waters
et al. 2009), making the Hodder Mudstone the thickest of the targeted play in Bowland
Basin.
5.1.2 Samples and methods
5.1.2.1 Samples
Ten samples from a continuous Marl Hill (MHD13) borehole core were selected for this
study (H-1 to H-10). The MHD13 borehole was drilled by BP Minerals International
Limited in 1982, on the uplifted anticline of the basin to explore for solid minerals
(Aitkenhead et al. 1992). Retrieved core samples penetrated the Carboniferous (Viséan –
Tournasian) mud and carbonate-rich succession of the Bowland Basin, and are currently
stored at the British Geological Survey (BGS) repository, Keyworth, Nottinghamshire UK
(BGS borehole reference; SD64NE35). All samples were chosen systematically following
core logging and visual inspection to include clay-and organic-rich lithologies, fractured
intervals and sections rich in bioclastic skeletal fragment. The mode of sample selection
represents the varying ranges of facies present in the Hodder Mudstone (Chapter 3).

PhD Thesis | 2019
267
5.1.2.2 Bulk Mineral analysis
Quantitative mineralogical data by weight percentage of each sample were acquired
using a Bruker D8 Advance Diffractometer at the University of Manchester. Samples were
initially crushed using an agate mortar and pestle, mixed with iso-amyl acetate and
subsequently smeared on glass slides for analysis. The analysing diffractometer was
equipped with a Göbel mirror, a Lynxeye sensitive detector and an x-ray tube emitting
monochromatic CuKα1 X-rays with 1.5406Å wavelength. Mineral diffraction patterns
were evaluated using the Bruker DIFFRAC.EVA® V4 software in comparison with mineral
standards from the International Centre for Diffraction Data (ICDD) database.
Quantitatively, peak intensities of minerals were measured from X-ray diffraction data
using the Bruker TOPAS software.
5.1.2.3 Thin section petrography and SEM imaging
Thin section samples were mechanically polished and impregnated with blue epoxy
resin. Samples were prepared perpendicular to bedding and scanned using a Kodak esp®
1.2 scanner to provide high-resolution images (1200x1200 dpi). Optical micro-textural
properties of samples were examined under the Nikon Eclipse E200 ultraviolet polarized
light microscope at the University of Manchester. Photomicrographs of samples were
captured under plane and cross polarised lights.
For SEM scans, a 9nm thick conductive coating of carbon was applied on polished thin
sections. Imaging was carried out using the Philips XL30 FEG Environmental Scanning
Electron Microscope (ESEM) equipped with an energy dispersive x-ray spectrometer
(EDS) analyser at the University of Manchester. SEM imaging offered a direct
visualization and measurement of rock microstructure to a practical resolution of 5 nm
as has been proven effective in micropore characterisation of unconventional reservoirs
(e.g. Nole et al. 2016; Milliken & Curtis 2016). For this study, only morphological features

PhD Thesis | 2019
268
of pore shape, relative size and occurrences were evaluated from SEM images. SEM
operational beam settings were set to 15kv acceleration voltage, with 10 mm working
distance, a spot size of 4 and mostly in back-scattered electron emission (BSE) mode. To
enable visualization of organic matter associated pores, one representative sample was
ion milled. Surface polishing on uncovered 5 mm2 chip was done using a dual beam FIB
(Nova 600i, FEI) at the School of Materials, University of Manchester. A conductive
coating of carbon was applied to limit surface charging during SEM imaging on the Philips
XL30 FEG ESEM.
5.1.2.4 Nitrogen gas adsorption pore analysis
Physical gas adsorption (physisorption) on porous solids and powders (e.g.
carbonaceous solids, zeolites and siliceous materials) is a technique widely used for
direct measurement of pore properties and has been adequately modified for various
materials since Langmuir’s attempt in 1916 and Brunauer, Emmett and Teller’s theory
(Rouquerol et al. 2013). Pore characterisation using this technique is achieved by
accurately measuring the amount of gas adsorbed on a solid material. Adsorptive gases
including Ar, CH4, CO2 and N2 are frequently used in their fluid phase on varying materials
depending on research interest (Groen et al. 2003). Sub-critical gas adsorption
mechanisms such as the N2 technique were used in this study to allow for quantitative
characterisation of 0.3 to 200nm size pores (e.g. Ross & Marc Bustin 2009; Kuila et al.
2012; Kuila & Prasad 2013a; Chalmers et al. 2012). Using isotherm data with application
of various mathematical models, the specific surface area, total pore volume, pore size
distribution and fractal analysis of pores can be calculated (e.g. Kuila & Prasad 2013a; Liu
et al. 2017).
Nitrogen gas adsorption data for the samples were carried out at Newcastle University
using a Micromeritics 3Flex 3.01 surface characterisation analyser. Ten dry <40-mesh

PhD Thesis | 2019
269
powdered samples were degassed and exposed to nitrogen gas at constant cryogenic
liquid nitrogen temperature of ~77.3K (e.g. Kuila & Prasad 2013a). Due to ultralow
permeability of mudstone (10 nanodarcy to 10 microdarcy), crushing of samples
enhances volume measurement by facilitating the intrusion of low-pressure cryogenic
gas in the pore spaces (Luffel & Guidry 1989; Bertoncello & Honarpour 2013). Under
constant temperature, the volume of adsorbed gas on the solid surfaces was measured at
discrete pressures over relative adsorption pressure (P/Po) until absolute pressure
equals condensation pressure (P/Po = 1). The volume of gas adsorbed during systematic
increase (adsorption) and decrease (desorption) of pressure produces adsorption-
desorption isotherm curves and hysteresis loops (space occurring between adsorption
and desorption curves along the multilayer range of physisorption due to capillary
condensation) (Figure 5.3). Isotherm data were analysed using various mathematical
functions (BET theory (Brunauer et al. 1938), Harkins-Jura (HJ) multilayer thickness
equation (Harkins & Jura 1944), the Barret, Joyner & Halenda (BJH) model for pore size
distribution (Barrett et al. 1951), t-plot model for micropores (Kuila et al. 2014) and the
Frenkel-Halsey-Hill (FHH) fractal analysis model (Avnir & Jaroniec 1989; Pfeifer et al.
1989). The results from these calculations were utilised for quantitative and semi-
qualitative analytical plots.
In the extended IUPAC classification (F. Rouquerol et al. 2013), nine groups of isotherm
curves exist. For the purpose of this study, only four of these isotherms were applicable,
namely: type I (for purely micro-porous adsorbent), type II (for non-porous or macro-
porous adsorbent), type IIB (i.e. type II adsorbent with inter-particle capillary
condensation) and IV (for purely meso-porous adsorbent) (Figure 5.3 (B)). These
isotherms, especially type IIB are frequently observed in mudstone samples (e.g. Kuila &
Prasad 2013b; Kuila et al. 2014; Liu et al. 2017). The appearance of hysteresis in isotherm

PhD Thesis | 2019
270
curves is an indication of multilayer adsorption and capillary condensation. Four
hysteresis pattern or loops are recognised by the IUPAC, namely, H1, H2, H3 and H4
(Figure 5.3 (C)) (Sing et al. 1985). A forced closure in the hysteresis loop observed mostly
at P/Po ~0.45 is attributed to “tensile strength effect” (TSE) which reflects the collapse of
the hemispherical meniscus during capillary evaporation in pores with <4 nm diameter
(Groen et al. 2003). Shape, size, and nature of closure within observed hysteresis loops
reveal predominant pore-size present in samples (Sing et al. 1985). A more
comprehensive description of isotherms and hysteresis classification is presented in Sing
(1985) and Rouquerol et al. (2013).
Pore classification adopted for this study follows the International Union of Pure and
Applied Chemistry (IUPAC) (Sing et al. 1985) and Rouquerol et al. (2013) classification.
Micropore is utilized for pore sizes <2 nm, mesopores for pore sizes between 2 – 50 nm
and macropores for >50 nm pore sizes. Loucks et al. (2012) pore size classification
however, considers <1nm as picopores, 1nm -1µm-sized pores as nanopores, 1µm-62.5
µm as micropores, 62.5 µm-4 mm as mesopores and 4 mm – 256 mm as macropore. For
this study, “nanometer-sized pores” refers to pores in the 1 nm to 1000 nm size range,
while the IUPAC nomenclature is used throughout to classify nm sized pores on the
following basis: micropore (<2 nm), mesopore (2 – 50 nm) and macropore (>50 nm).

PhD Thesis | 2019
271
Figure 5.3: A) An illustration of a typical isotherm plot with adsorption branch (red) and desorption branch (green). Regions (i) representing the onset of microporous filling, (ii) monolayer filling and (iii) multilayer filling of pores. Forced closure of the desorption branch onto the adsorption branch marks the limit of multilayer filling. A hysteresis loop is formed due to capillary condensation mostly in mesopores. (B) Referenced isotherm types I, II, IIB and IV, and (C) referenced hysteresis loops H1, H2, H3 and H4 as defined by IUPAC (F. Rouquerol et al. 2013). Desorption branch of isotherm may exhibit a complete forced closure and minor closure (dashed lines).

PhD Thesis | 2019
272
Results
5.2.1 Lithology description and sample mineralogy
Summary XRD mineral data for samples H-1 to H-10 is shown in Figure 5.4, superimposed
on the Lazar et al. (2015) classification scheme for the division of mudstones by mineral
compositions. This classification has end members of 100% clay, quartz and carbonates
to enable mudstone classification using compositional modifiers. Analysed Hodder
samples plot into three regions – calcareous mudstones, siliceous-argillaceous
mudstones and argillaceous-siliceous mudstones. This covers the lithological variability
of the Hodder Mudstone. A summary of hand specimen sample description is presented
in Table 8 and the micro-textural attributes are highlighted in Figures 5.5 and 5.6.
The compositional plot (Figure 5.4) and textural attributes (Table 8; Figure 5.5; Figure
5.6) from the sampled borehole show a spectrum of samples between calcareous
(bioclastic-rich) mudstones to clay-rich mudstones. Petrographic examination shows
grain-dominance of silt and clay-sized calcite, quartz and muscovite. Samples H-5, H-9
and H-10 are characterized by a high amount of sand- to gravel-sized fragmented
calcareous shells in mud matrix (Figure 5.5).
Sample matrix constitutes primarily of kaolinite and micrite, cemented by calcite and
dolomite with pyrite mineralization in all samples. Calcite ranges between 1.2% and
87.3% and quartz ranges from 1.9% and 47.9%. Ferroan dolomite is dominated by
ankerite. A positive relationship exists between the presence of lamina-parallel fractures
and high ankerite and siderite content in clay-rich samples. The amount of muscovite and
kaolinite is inversely correlated to grain size. Where detected by XRD, muscovite can be
up to 35.2% of total mineralogy. Generally, samples rich in coarser (mainly sand-sized)
calcareous fraction have limited clay minerals and relatively higher calcite content in

PhD Thesis | 2019
273
comparison to clay-rich samples. Apart from visible macro-skeletal components (e.g.
crinoids, gastropods and molluscs shells), calcareous microfossils (e.g. foraminifer,
calcified spicules and calcareous algae) are recognised in bioclastic-rich samples. All
sampled intervals contain a significant amount of pyrite, distributed as pyrite framboids
and disaggregated microcrystals.
Figure 5.4: Ternary plot of weighted fraction of minerals calculated from XRD data. Plotted to fit into the Lazar et al. (2015) mudstone classification
Sample ID
Depth (m)
Sample description
H-1 78.0 Dark grey, clay-rich, planar laminated mudstone with 2 mm thick horizontal cemented fracture
H-2 81.1 Dark grey, clay-rich fractured mudstone with 2 cm thick vuggy brown and white cemented horizontal fractures.
H-3 88.7 Dark grey, silt-rich unlaminated, bioclast-bearing mudstone H-4 90.4 Dark grey, clay-rich, unlaminated mudstone with <1mm cemented
veins H-5 91.6 Dark grey, gravel-sized bioclast-dominated mudstone with clay-
rich matrix H-6 121.6 Dark grey, clay-rich unlaminated mudstone

PhD Thesis | 2019
274
H-7 174.8 Medium grey unlaminated bioclast-bearing mudstone with fibrous cemented veins and sand-sized shell fragments
H-8 228.6 Dark grey, clay- and bioclast-rich bioturbated mudstone H-9 244.2 Dark to medium grey, wavy laminated, gravel sized bioclast-rich
mudstone H-10 262.2 Dark grey, silt- and sand-sized bioclast-dominated bioturbated
mudstone Table 8: Descriptive summary of core samples

PhD Thesis | 2019
275

PhD Thesis | 2019
276
Figure 5.5: Core photographs (CP), thin sections scans (TS) and microscope photographs in plane polarised light (PM) showing samples H-1 to H-5. H-1 characterised by planar laminations of silt- and clay-rich laminae with horizontal and vertical mineralised fractures.H-2 representing horizontally fractured clay-rich units. H-3 is a representative sample of calcareous silt-rich samples. H-4, a typical clay-rich sample with meandering mineralized fractures. H-5 represents an unlaminated bioclast-dominated (mostly crinoidal) mudstone.

PhD Thesis | 2019
277

PhD Thesis | 2019
278
Figure 5.6: Core photographs (CP), thin sections scans (TS) and microscope photographs in plane polarised light (PM) showing samples H-6 to H-10. H-6 showing clay-dominated sample. H-7 here representing dendritic-fractured silt-rich samples. H-8 represents a bioturbated calcareous silt-rich unit. H-9 shows images from the wavy laminated bioclast-dominated unit. H-10 represents bioturbated bioclast- and silt-dominated unit.
5.2.2 Pore types and morphology
Pores within the studied Hodder samples are classified here into two broad groups. These
are (i) matrix framework pores and (ii) organic matter pores. Framework pores
constitute inter-particle and intra-particle pores preserved around or hosted in,
inorganic grains of quartz, carbonates, pyrite and phyllosilicates. Organic-matter pores
are pore associated with amorphous kerogen or bitumen (Bohacs 2013). Careful
attention has been given in the study to exclude seemingly artificially-induced pores
which may be a product of grain “plucking” and grain-fracturing.
5.2.2.1 Inter-particle framework pores
Inter-particle framework pores occur as elongate, triangular (wedge-shaped) to
irregularly shaped pores between grains (inter-granular) and crystals (inter-crystalline).
They are observed between constituent grains of calcite, dolomite, quartz, phyllosilicates
and pyrite framboids. Elongate-shaped inter-particle pores are up to 13.6 µm in length,
preserved between phyllosilicate crystals of kaolinite especially in kaolinite-filled shelter
pores (Figure 5.7). The pore diameter is less than 2 µm. These pores are termed
framework shelter pores by Scheiber (2013). In some cases, inter-particle pores
appeared oblate when preserved between sheets of bent muscovite grains or when
wedged open by rigid grains (Figure 5.7 (B)). Some inter-particle framework pores are
also preserved within “pressure shadows” (Schieber 2010; Schieber 2013) caused by the
resistance in compaction around ductile phyllosilicate grains and adjacent compaction-
resistant rigid grains of calcite, quartz or pyrite (Figures 5.7 (A) & (C)) (e.g. Schieber
2013). Other occurrences of inter-particle pores are associated with fibrous illite cement
between larger quartz grains (Figure 5.7 (D)). Inter-particle framework pores constitute

PhD Thesis | 2019
279
the most abundant pore type within the studied samples. They are commonly isolated
and higher longitudinal dimension than other pore types (intra-particle and organic-
matter pores).
5.2.2.2 Intra-particle framework pores
Intra-particle pores are commonly associated with carbonate minerals. Carbonate intra-
particle pores occurred in the samples as isolated dissolution pores in shells of bioclastic
debris and in carbonate cements (Figure 5.8). They are circular to polygonal in shape and
rarely connected. In regions where carbonate cement shows replacement textures, slit-
shaped pores were developed within partially cemented patches (Figure 5.8 (A)). Intra-
particle pores associated with calcite are largely isolated and are not connected to the
surrounding inter-particle pores network. Nanometre-sized intra-particle pores are
abundant in shell skeletal parts, but larger (up to 5 µm diameter) pores can be observed
in cemented cavities of organisms. Micrometre-sized elongate pores can be preserved in
such cavities if initially cemented by kaolinite (Figure 5.8 (A)).

PhD Thesis | 2019
280
Figure 5.7: Inter-particle framework pores showing (A), inter-granular pores (arrows) in pressure shadows between calcite and kaolinite; (B) inter-granular elongate slit-like pores (arrows) occurring around a bent muscovite grain; (C), inter-crystalline slit-like pores in between kaolinite sheets and shadow pressure pores (arrow) preserved between grain; (D) inter-crystalline pores hosted by illite minerals between quartz grains. (E) and (F) show pores hosted in pyrite framboids

PhD Thesis | 2019
281
Figure 5.8: Examples of identified intra-particle pores in the studied samples. Calcite hosted dissolution intra-particle pores observed in calcite-cemented shells and cavities outlined in (A) & (B). SEM image (C) is a zoomed in section of calcareous shell magnifying the morphologies of intra-particle pores. Dolomite crystals are shown in (D) also host intra-particle pores
5.2.2.3 Organic-matter pores
Organic matter (OM) can be preserved in source rocks as structured kerogen,
unstructured (amorphous) kerogen or bitumen (Taylor et al. 1998; Schieber 2013).
Amorphous kerogen and bitumen are known to host a significant amount of pores in both
immature (Löhr et al. 2015) and mature organic-rich mudstones (Curtis et al. 2010;
Schieber 2010; Schieber 2013; Ma et al. 2017). Organic matter recognised within the
analysed Hodder Mudstone displayed 2 – 20 µm thick, mostly wavy-lamellar to sub-
angular dark particles (Figure 5.9). These morphologies are similar to lamellar bituminite
and irregular bituminous ground masses (e.g. Fishman et al. 2012). Such features have
also been interpreted as lamellar alginite and woody organic matter (Löhr et al. 2015).

PhD Thesis | 2019
282
Within the Hodder Mudstones there is lack of obvious pores in the OM components,
although irregularly shaped pores have been observed in most OM particles (e.g. Loucks
et al. 2009; Fishman et al. 2012; Milliken et al. 2013). However, OM-related pores in the
studied samples are present around the outer wall of organic matter (Figures 5.9 (E) &
(F)). These pores occurred at the boundaries of organic and inorganic particles and may
be artificial products of sample preparation (Löhr et al. 2015). An attempt made to
enhance visualization of organic matter-associated pores using argon-ion milled surfaces
yielded similar results (Figure 5.9 (F)). It is thus reported in this study that intra-particle
OM-related pores are not a common feature in the Hodder Mudstone.

PhD Thesis | 2019
283
Figure 5.9: High-resolution SEM showing non-porous organic matter occurrences (OM). (A) & (B) Wavy and elongate organic matter lamellar. (C) Bituminous patch under back-scatter emission and (D) same region under secondary emission. (E) & (F) shows pores around pore walls of organic matter both under the secondary emission with (F) taken from an ion-milled surface.
5.2.3 Pore size quantification
5.2.3.1 Isotherm profile analysis
The isotherm curves of analysed samples shown in Figure 5.10 reveal dominance of Type
IIB curves with H3 hysteresis loops of varied closure patterns. Type IIB profiles and

PhD Thesis | 2019
284
hysteresis loops indicate dominance of meso- to macropores (> 2 nm) with less obvious
micropores (<2 nm) (Kuila & Prasad 2013a; Rouquerol et al. 2013). H3 loops are also
reportedly associated with materials of platy particles pores (Rouquerol et al. 2013).
Micropore-filling is prevalent at P/P0 <0.01 (Kuila et al. 2014) represented by a steep
convex-shaped start in the adsorption curve(Figure 5.3 (A)) (Rouquerol et al. 2007).
However, as can be seen from the isotherm curves (Figure 5.10), there is limited evidence
in the isotherms for micropore filling in all samples. To estimate micropores values for
samples that likely contain no micropore volume, the t-plot model can be utilised (Section
2.3.4). The steeply convex-shaped end of the adsorption and desorption curves towards
higher P/P0 >0.8 indicates the presence of >200nm sized pores (e.g. Kuila et al. 2014). At
a relative pressure range of 0.05 – 0.1, multilayer adsorption began in all analysed
samples. Multilayer adsorption is usually typical of mesoporous and macroporous
materials (Kuila & Prasad 2013b; Liu et al. 2017). Tensile strength effect (TSE) of
hysteresis in the samples occurred at a relative pressure of 0.42 with the closure of the
desorption branch (Figure 5.10). The appearance of TSE on curves reflects a random
distribution of mostly interconnected mesopores with diameters <4 nm (Groen et al.
2003; Kuila & Prasad 2013b).

PhD Thesis | 2019
285
Figure 5.10: Low-pressure N2 (77K) adsorption-desorption isotherms of samples H-1 to H-10. Regions A1 and A2 demarcated at 0.5 P/Po, for calculating fractal dimensions of monolayer adsorption regions (A1) and multilayer adsorption regions (A2). Isotherm curves are apparently similar but significant variations can be observed in the volume of adsorbed gas by samples at corresponding relative pressures. Higher values of adsorption recorded in H-4 and lowest values in H-9 & H-10. Pie chart of bulk mineralogy indicate control of mineralogy on isotherm behaviour.

PhD Thesis | 2019
286
5.2.3.2 Pore volume (PV) and specific surface area (SSA)
The quantitative evaluation of pore volumes and surface area within the Hodder samples
in this study was based on the BJH approach and the BET specific surface area (SSA)
model. The BJH cumulative pore volume and surface area of analysed samples are shown
in Table 9. It is apparent from the table that the calcareous (bioclastic) samples (e.g. H-7
to H-10) contain pores with the low SSA (<7 m2/g) while pores hosted by argillaceous
samples (e.g. H-1, H-3 and H-6) have larger SSA values. Similarly, the largest recorded
cumulative pore volume is hosted by sample H-4 with other lesser-calcareous samples
(H-1, H-3 and H-6) having pore volumes c. 2.5 cm3/100g. Highly calcareous samples,
comparatively, hosts the smallest pore volumes (e.g. PV of 0.9 cm3/100g in H-9). The
average pore volume of calcareous samples is 1.6 cm3/100g while more argillaceous
samples have an average value of 2.5 cm3/100g. Assuming marl to shale bulk density of
2.25 to 2.75 g/cm3 (Schön 2015), the calculated average porosity (pore volume/bulk
volume) of calcareous samples is between 3.6 – 4.4 % while in more argillaceous samples
is 5.6 – 6.8 % porosity.
5.2.3.3 Pore sizes and pore size distribution (PSD)
Estimates of pore diameters and pore size distribution (PSD) were derived from the
adsorption branch of isotherms using the BJH model. Although the BJH model is
theoretically designed to be applied on the desorption branch and consequently limited
to pore sizes of 4-5 nm, it has been discovered that PSD derived from the adsorption
branch of the isotherms provide a more reliable representation of the actual pore system
(Kuila & Prasad 2013b). This is reportedly due to the effect of differential emptying of
encapsulated and open pores of similar sizes during desorption (Groen et al. 2003),
termed network-percolation effect (Figure 5.11) (Sing et al. 2013).

PhD Thesis | 2019
287
Figure 5.11: Graphic illustration of pore network effects in adsorption measurements of interconnected small (a, b), intermediate (c) and large pores (d) (adapted from Groen et al. (2013). Pores (a) and (b) will empty at their corresponding low pressure during desorption than needed for emptying pore (c). Since pore (d) can only empty via (c), it will accordingly empty at a lower pressure empirically required.
Average pore widths of samples using the BJH adsorption model can be seen in Table 9.
The average pore sizes of the Hodder samples vary between 7 nm to 15 nm. It is clear
from Table 9 and Figure 5.12 that clay-rich samples have smaller pore diameter while
calcareous samples host larger pores. This is seen the abundance of small pore sizes in
argillaceous samples H-4 and H-6 while highly calcareous H-9 recorded the largest pore
size (Table 9).
Pore size distribution plot for the Hodder samples shows a widely distributed bi-modal
volumetric maxima of the calculated pore sizes (Figure 5.12). Pore sizes within the ranges
of 2.5 – 3 nm and 20 – 40 nm are responsible for the maximum peak values of bulk volume
in all samples. Apart from sample H-4, all samples have peak pore volumes occupied by
>4 nm sized pores.

PhD Thesis | 2019
288
Samples
Pore volume (cm3/100g) Average
Pore diameter
(nm)
SSA (m2/g) Fractal
dimensions
BJH cumulative
PV
t-plot micropore
volume
BET SSA
BJH cumulative
SSA
t-plot micropore
SA D1 D2
H-1 2.5 0.046 10.61 10.34 8.27 0.96 2.561 2.67
H-2 1.3 0.041 12.59 5.31 3.99 0.81 2.598 2.665
H-3 2.5 0.094 9.2 14.03 10.07 2.10 2.601 2.776
H-4 3 0.144 7.45 21.1 14.35 2.87 2.591 2.725
H-5 1.9 0.008 9.49 8.71 7.91 0.22 2.536 2.711
H-6 2.5 0.071 7.98 14.77 11.05 1.50 2.58 2.754
H-7 1.2 - 12.92 3.2 3.14 - 2.476 2.58
H-8 2.1 - 12.56 6.84 6.24 0.06 2.508 2.64
H-9 0.9 - 15.35 2.59 2.48 - 2.505 2.595
H-10 1 0.015 15.33 2.63 2.22 0.30 2.55 2.571
Table 9: Pore quantitative analysis of samples H-1 to H-10
Figure 5.12: BJH pore size distribution (PSD) curves for samples H-1 to H-10 obtained from N2 isotherms, displaying the volume (amount of gas adsorbed) occupied by various pore sizes (pore diameter) using the BJH Model. Calculated porosity data of samples using bulk densities of quartz and calcite is also shown.
5.2.3.4 T-plot micropore analysis
Using the t-plot technique, micropore (pore <2 nm) volume and micropore surface were
estimated for the Hodder samples (Table 9). T-plot micropore volume varied from 0.008
to 0.144 cm3/100g and micropore surface area ranging between 0.06 to 2.87 m2/g. H-4,
H-3 and H-6 recorded the largest micropore volume >0.05 cm3/100g. T-plot micropore
volume has a strong positive correlation with the t-plot micropore surface area.

PhD Thesis | 2019
289
5.2.3.5 Fractal Analysis
Since pores are defined by pore walls (Milliken & Curtis 2016), it is imperative to
understand the character of pore walls in order to predict their behaviours. The geometry
of pores in mudstones are irregular and hence, qualify as non-Euclidean dimensions
(Mandelbrot 1982). Due to these surface irregularities and complexity of pore surfaces,
they are adequately defined by fractal dimensions (e.g. Mandelbrot 1982; Pfeifer & Avnir
1983). This fractal geometry of pores directly impacts their sorption and diffusion
behaviours (Naveen et al. 2018). Fractal Frenkel-Halsey-Hill (FHH) models have been
utilized in various studies for estimating the fractal dimensions or surface roughness of
micro- and mesopores from N2 adsorption isotherms (e.g. Yao et al. 2008; Liu et al. 2017;
Mahamud & García 2018; Naveen et al. 2018; Wang et al. 2018). The classical fractal FHH
equation is given by:
𝑙𝑛 {𝑉
𝑉0} = 𝑐𝑜𝑛𝑠𝑡𝑎𝑛𝑡 + (𝐴)𝑙𝑛 [ln (
𝑃0
𝑃)]
Where V is the gas molecular volume adsorbed at equilibrium pressure P; V0 is the
monolayer volume calculated by using the BET equation and P0 is the saturated vapour
pressure of gas adsorption. A is the slope of the regression line, 𝑙𝑛 {𝑉
𝑉0} versus 𝑙𝑛 [ln (
𝑃0
𝑃)]
Where 𝐴 = 𝐷 − 3 𝑜𝑟 (𝐷 − 3)/3
The degree of surface roughness or irregularity (fractal dimension) is expressed by the
parameter D. the expression 2 ≤ D ≥ 3 is given for non-intersecting surfaces where for
perfectly smooth, flat surface, D = 2; and for highly rough and irregular surface, D = 3
(Pfeifer & Avnir 1983; Avnir et al. 1983). During monolayer adsorption, attractive van der
Waal forces are dominant between gas and solid particles and gas interface replicates
surface roughness; A, in such case, takes the value of (D – 3)/3. At higher coverage

PhD Thesis | 2019
290
(mesopores), the interface is controlled by capillary condensation subsequently reducing
interface area, and A = D – 3 (Ismail & Pfeifer 1994). These two regions are demarcated
on the isotherm curve at P/P0 0.5 as shown in Figure 5.10, labelled A1 and A2. In practice,
adsorption forces in samples are considered to be a mixture of both Van der Waals forces
and capillary condensation (Wu 1996). In the case of mesoporous solids, the adsorption
process is dominated by capillary condensation (Sahouli et al. 1997). Since the pore size
distribution of pores in the samples are mesopores, A = (D – 3) is applied for both regions
A1 and A2. The resultant fractal dimensions (D1 and D2) derived from the slopes of the
regression lines, A1 and A2 are shown in Figure 5.13 and Table 9. D1 values reflect the
nature of pore surfaces during mono-multilayer adsorption and D2 values measure the
pore structure complexity (Liu et al. 2017; Wang et al. 2018). Linear plots of A1 and A2
have dissimilar slopes indicative of different gas adsorption mechanisms in the two
regions. Correlation coefficients (R2) of plotted data points are all higher than 0.99,
suggesting that there are fractal characteristics in the pores of the studied Hodder
Mudstone samples. It is evident from the data presented in Figure 5.13 and Table 9 that
the fractal dimensions D1 are lower than D2 values. D1 values range from 2.46 to 2.601
while D2 values vary between values are between 2.571 to 2.754. These results are
indicative of increased irregularities in pore structure and less complicated pore surfaces.
Similar trends have been observed in the Bakken Shale (e.g. Liu et al. 2017).
A correlation of pore volume and pore diameters with fractal dimensions show that pore
walls of larger pores contained in the Hodder samples are relatively smoother than
smaller sized pores (Figure 5.14). Figure 5.14 (A) shows negative correlations of D1 and
D2 values with pore diameter. However, as can be seen in Figure 5.14 (B), the total pore
volumes of analysed samples have a positive correlation with fractal dimensions. This

PhD Thesis | 2019
291
suggests that smaller pores with highly irregular dimensions constitute the bulk of pore
volume in the Hodder Mudstone.

PhD Thesis | 2019
292
Figure 5.13: Relationship between lnV and lnln(1/(P/Po) from the FHH fractal analysis based on N2 adsorption isotherms. D1 is the fractal dimension values derived from the slope (blue) of monolayer adsorption data (Region A1 of Figure 5.10), and D2 is the fractal dimension derived from the slope (red) of multilayer adsorption data (Region A2 of Figure 5.10).

PhD Thesis | 2019
293
Figure 5.14: FHH fractal dimension versus (A) average pore diameter and (B) total pore volume. D1 (blue) uses fractal values of Figure 5.13 for monolayer adsorption, and D2 uses fractal values of Figure 5.13 for multilayer adsorption.
Discussion
5.3.1 Sample composition and qualitative pore observations
Pores in the Hodder Mudstone samples show variation in occurrence based on
mineralogical and textural compositions. Inter-particle pores were dominant in more
argillaceous samples while intra-particle pores dominated carbonate-rich samples.
Framework wedge-shaped inter-particle pores are frequently observed in argillaceous-
siliceous and siliceous-argillaceous samples (e.g. H-4, H-6 and H-8) (Figure 5.7) due to
the arrangement of rigid and ductile grains. These samples are characterised by silt-
/clay-sized rigid calcite, dolomite, quartz and ductile muscovite and kaolinite minerals.
Secondly, elongate inter-particle pores between muscovite and kaolinite cleavage planes
were also abundant in most argillaceous samples (Figure 5.7). These pore occurrences
are typical of pore morphologies observed in some argillaceous mudstone samples (e.g.
Pommer & Milliken 2015). Framework inter-particle pores appear more irregular,
elongated and interconnected than dissolution intra-particle pores hosted in calcareous
shells and cements of calcareous mudstones. Furthermore, interconnected, inter-particle
pores hosted in pyrite framboids are also well preserved in argillaceous samples than in

PhD Thesis | 2019
294
calcareous samples, due to calcite-cementation of pyrite-hosted pores in the calcareous
samples. Argillaceous mudstones with pyrite framboids are known to have pores
preserved between individual microcrystals of the framboids (Loucks et al. 2010; Loucks
et al. 2012).
Conversely, intra-particle pores were mostly associated with carbonate grains and
cements. A number of Hodder Mudstone samples from this study, comprised calcite-
cemented debris of primary unstable magnesium-rich shells. Pervasive cementation of
inter-particle pores is observed especially in these bioclastic facies. The impact of calcite
cementation is evident across H-5 and H-9 bioclastic-rich samples where inter-particle
pores are mostly cemented by calcite (Figures 5.8 (A) & (B)). Pore-filling calcite and
dolomite cements are also observed replacing kaolinite sheets, thus occluding kaolinite-
hosted pores (Figure 5.8 (A)). Although shelter pores preserved by kaolinite are
significant in dissolved shells of most foraminifers in the samples, calcite cementation of
such pores are prevalent in highly calcareous samples. Framboidal pyrite is observed in
all analysed samples, however, calcite precipitation in highly calcareous samples resulted
in the occlusion of such pores. Carbonate-rich mudstones characterised by high primary
aragonitic shells exhibit increased levels of mineralogical instability and chemical
reactions that resulted in the loss of inter-particle pores (Milliken & Day-Stirrat 2013).
In accordance with present findings, previous studies have demonstrated that pore
structures and occurrences in mudstones are controlled by their mineralogical
composition (Kuila et al. 2012; Slatt & O’Brien 2013; Milliken & Curtis 2016). Due to
diagenetic processes, a large number of inter-particle pores are lost during burial. The
variations in mineralogical composition exert control on pore development during
mechanical and chemical diagenetic processes. For example, it is observed from studied

PhD Thesis | 2019
295
samples and other studies (Day-Stirrat et al. 2010; Schieber 2010; Milliken et al. 2012)
that rigid silt-sized quartz and carbonate grains tend to preserve inter-particle porosity
in part by sheltering more ductile clay-sized phyllosilicates from preferential alignment
due to the mechanical arrangement. Phyllosilicate minerals (e.g. authigenic kaolinite and
illite) are also known to host pores between crystalline cleavage planes (e.g. Sondergeld
et al. 2010; Anovitz & Cole 2015; Pommer & Milliken 2015). Phyllosilicate-associated
pores are rarely preserved in the more calcareous samples but they are largely present
within the argillaceous units. In calcareous samples, these pores are rarely preserved.
These observations indicate that pore development (occurrence and structure) in the
Hodder Mudstones is primarily controlled by the compositional variation of detrital and
biogenic grain assemblages. These variations subsequently controlled the preservation
and/or occlusion of pores during diagenesis. Hence, the types and shapes of pores
recognised in the studied samples were influenced and transformed by a combination of
primary sedimentary components and diagenetic mineral precipitation.
5.3.2 Mineral composition and pore quantification
Sample mineralogy reportedly exhibits a strong control on pore-size distributions in
mudstones (Kuila & Prasad 2013b). Based on the presented quantitative mineralogical
and pore data with the correlational analysis in Figure 5.14, samples are observed to be
influenced by variation in mineral compositions. Although samples are thermally mature,
organic matter pores were not readily observed. While their presence may significantly
contribute to pore volume, their correlation with pore results has not been discussed due
to limited evidence. Comparisons have been made using only inorganic (carbonate and
silicate) components.

PhD Thesis | 2019
296
5.3.2.1 Carbonate minerals and pore values in mudstone
Pore volume (PV) and pore surface area (PSA) decreases with high carbonate content
while the pore diameter is directly proportional to carbonate content. This increase in
pore diameter and the decrease in PV and PSA is due to the presence of intra-particle
mesopores in calcareous samples. Pores in calcareous samples are mostly dissolution
pores which may be few but exhibit large pore diameters. The lower values in PV and PSA
with the increase in carbonate fraction is likely due to the limited number of such pores
(Figure 5.14). For example, in the pore size distribution curve (Figure 5.11), samples with
more than 60% carbonate content (e.g. H-9, H-10) exhibit very low pore volume occupied
by >10 µm diameter pores. Large intra-particle dissolution pores have been identified to
contribute towards higher pore volumes subject to their abundance (e.g. Chalmers et al.
2012). The abundance of carbonate mineral may be due to the high volume of bioclast
content (e.g. H-9) or cemented fractures (e.g. H-2), however, their pore attributes are
largely similar.
5.3.2.2 Silicate minerals and pore values in mudstone
Quartz and clay-mineral content are observed to have similar effects on quantitative pore
values. As quartz fraction increases in samples, PV and PSA increases (Figure 5.14). This
trend is also similar to phyllosilicate content since PV and PSA increase with
phyllosilicate weight fraction. Conversely, pore diameters within these samples show a
negative correlation with quartz and phyllosilicate mineral fractions. This may mean that
the preservation of inter-particle pressure-shadow pores and slit-like elongate pores
caused by the interaction of rigid grains and clays minerals improved pore distribution
and abundance. These pores may have smaller diameters relative to the larger intra-
particle pores in calcareous lithologies. Their higher abundance, however, is responsible
for the associated high pore volume.

PhD Thesis | 2019
297
The combination of these findings provides some support for the premise that
siliciclastic, silt-rich argillaceous samples offer higher porosity than carbonate-rich
samples. Furthermore, drawing findings from chapter 4, it is evident that calcareous
samples experienced significant calcite cementation and pervasive pores occlusion.
Conversely, the precipitation of authigenic illite between silicate grains enhanced late
development of phyllosilicate-associated pores.

PhD Thesis | 2019
298
Figure 5.15: Comparative statistical analysis of sample mineralogy in relative weight percent (quartz:carbonate:phyllosilicate) and pore attributes

PhD Thesis | 2019
299
5.3.3 Implication for Bowland-Hodder unconventional shale gas exploration
Analyses of acquired well data and direct petrophysical measurements of the overlying
Bowland Shale provide an estimated (P50) amount of original gas-in-place as 1329 tcf
(Clarke et al. 2018). No direct porosity measurements have been obtained from the
deeply buried Hodder Mudstone in the explored area. By utilizing core data from the
uplifted fold belt of the Basin in this study, the geometric and estimated volumetric pore
results offer an understanding of pore properties in the Hodder Mudstone.
Notwithstanding the relatively limited sample, these findings provide a conceptual
representation of mudstone porosity within the understudied formation. These initial
results draw attention to the importance of understanding mineralogical variation within
the underexplored Hodder Mudstones. Taken together with other petrophysical
estimates, the data presented in this study is beneficial for the appraisal of the Bowland-
Hodder shale gas play. Furthermore, owing to its exploratory nature, it also lays a
groundwork towards future research in characterising the mechanical properties and
improving hydraulic fracture propagation of the formation.
The findings presented in this study are correspondingly significant in evaluating
mineralogical controls on mudstone pore attributes. The bulk of pore volume recorded
from the analysed Hodder Mudstone samples are due to the presence of meso- and
macropores. Comparatively, high pore volume has been attributed to increase in meso
and macropore surface area and pore volume in the Niobrara, Barnett, Marcellus,
Woodford and Haynesville shales (Chalmers et al. 2012; Kuila et al. 2012). Such mineral
framework-related pores as recognised in the analysed samples and from other active
shale reservoirs make up significant components of inter-particle mineral porosity. By
correlating pore size distribution in lithofacies and associated pore volumes, possible
lateral prediction across similar lithologies can be made.

PhD Thesis | 2019
300
This study has also raised important questions regarding the lack of OM-related intra-
particle pores within the Hodder Mudstone. Total porosity of most organic-rich
mudstone reservoirs of prominent shale gas plays are dominated by organic matter
related pores (Loucks et al. 2009; Ambrose et al. 2010; Curtis et al. 2011; Milliken et al.
2012) These pores may be primary or secondary, controlled by kerogen type, TOC
content and thermal maturity (Curtis & Ambrose 2011; Loucks et al. 2012; Milliken et al.
2013; Schieber 2013; Löhr et al. 2015; Ma et al. 2017). It is not clear from this study as to
the reason for the dominance of non-porous organic matter. While it is believed that OM-
hosted pores develop during thermal maturation, OM-hosted pores have been observed
in Devonian-Mississippian Woodford shales with vitrinite reflectance as low as 0.4 %Ro
(Löhr et al. 2015). RockEval data presented in Chapter 4 shows that the Hodder Mudstone
is thermally mature (oil + gas window) with calculated vitrinite reflectance between 0.83
%Ro to 1.12 %Ro. Both type II and III kerogen have also shown to host OM-related pore
development (e.g. Fishman et al. 2012). The Hodder Mudstone is comprised of admixed
type II and III kerogen (Chapter 4). Hence, there is to be expected some occurrence of
OM-hosted intra-particle pores. Since this study was inadequate in characterising OM
pores present within the samples, it did not explore this research question. Considerably
more work will need to be done to conclusively determine the cause for non-occurrence
of OM-related pores. The resultant output of the further study will offer a layer of
understanding into the relationship between organic matter porosity and organic-rich
mudstone reservoirs.

PhD Thesis | 2019
301
Conclusion
1. The studied Hodder Mudstone samples are predominantly carbonate-rich,
comprising of calcareous mudstones, siliceous-argillaceous mudstones and
argillaceous-siliceous mudstones.
2. Samples are characterised by varying mineralogical compositions of calcite,
dolomite, ankerite, quartz, muscovite, kaolinite and pyrite. Other accessory
minerals include siderite, phosphate, chlorite and marcasite.
3. Pore types include inter-particle mineral pores, intra-particle dissolution pore and
organic matter associated pores. SEM image data show that inter-particle pores
occurred between grains and matrix, and are associated with quartz, carbonate,
phyllosilicate minerals and in pyrite microcrystals. Intra-particle pores are
dominated by carbonate dissolution pores in replaced shell fragments. Organic
pores were observed within organic matter matrix.
4. Pore morphologies and dimensions are typical of pore types. Phyllosilicate-
associated pores are preserved as elongate to sub-angular pores while triangular
pores are seen preserved between rigid grains and clay minerals. Carbonate
dissolutions pores are mostly round
5. Quantitative pore values reveal strong control of sample mineralogy on pore
volume, surface area and roughness and pore size distribution.
References
Aitkenhead, N. et al., 1992. Geology of the Country around Garstang. British Geological
Survey Memoir for 1:50000 geological sheet 67 (England and Wales).
Ambrose, R.J. et al., 2010. New Pore-scale Considerations for Shale Gas in Place
Calculations. SPE Unconventional Gas Conference 2010, pp.167–183.

PhD Thesis | 2019
302
Andrews, I.J., 2013. The Carboniferous Bowland Shale gas study: geology and resource
estimation. British Geological Survey for Department of Energy and Climate
Change, London, UK.
Anovitz, L.M. & Cole, D.R., 2015. Characterization and Analysis of Porosity and Pore
Structures. Reviews in Mineralogy and Geochemistry, 80(1).
Aplin, A.C. & Macquaker, J.H.S., 2011. Mudstone diversity: Origin and implications for
source, seal, and reservoir properties in petroleum systems. AAPG Bulletin, 95,
pp.15–34.
Avnir, D., Farin, D. & Pfeifer, P., 1983. Chemistry in noninteger dimensions between two
and three. II. Fractal surfaces of adsorbents. The Journal of chemical physics,
79(7), pp.3566–3571.
Avnir, D. & Jaroniec, M., 1989. An Isotherm Equation for Adsorption on Fractal Surfaces
of Heterogeneous Porous Materials. Langmuir, 5(6), pp.1431–1433.
Barrett, E.P., Joyner, L.G. & Halenda, P.P., 1951. The Determination of Pore Volume and
Area Distributions in Porous Substances. I. Computations from Nitrogen
Isotherms. Journal of the American Chemical Society, 73(1), pp.373–380.
Bernard, S. & Brown, L., 2013. FIB-SEM and TEM Investigations of an Organic-rich Shale
Maturation Series from the Lower Toarcian Posidonia Shale, Germany: Nanoscale
Pore System and Fluid-rock Interactions. AAPG Memoir, 102, pp.53–66.
Bertoncello, A. & Honarpour, M.M., 2013. Standards for Characterization of Rock
Properties in Unconventional Reservoirs: Fluid Flow Mechanism, Quality Control,
and Uncertainties. SPE Annual Technical Conference and Exhibition.
Brandon, A. et al., 1998. Geology of the Country around Lancaster: Memoir for 1:50 000
Geological Sheet 59 (England and Wales) - Geological Memoirs & Sheet
Explanations. British Geological Survey Research Report.
Brindle, S. et al., 2015. An integrated approach to unconventional resource play
reservoir characterization, Thistleton-1 case study, NW England. First Break,
33(2), pp.79–86.
Brunauer, S., Emmett, P.H. & Teller, E., 1938. Adsorption of Gases in Multimolecular
Layers. Journal of the American Chemical Society, 60(1), pp.309–319.
Bustin, R. et al., 2008. Impact of shale properties on pore structure and storage
characteristics. SPE Shale Gas Production Conference, p.SPE 119892.
Chalmers, G.R., Bustin, R.M. & Power, I.M., 2012. Characterization of gas shale pore
systems by porosimetry, pycnometry surface area and field emission scanning
electron microscopy/ transmission electron microscopy image analyses: Examples
from the Barnett, Woodford, Haynesville, Marcellus and oig units. AAPG Bulletin,
96(6), pp.1099–1119.
Chalmers, G.R.L. & Bustin, R.M., 2015. Porosity and pore size distribution of deeply-
buried fine-grained rocks: Influence of diagenetic and metamorphic processes on

PhD Thesis | 2019
303
shale reservoir quality and exploration. Journal of Unconventional Oil and Gas
Resources, 12, pp.134–142.
Clarke, H. et al., 2018. Shale gas resources of the Bowland Basin, NW England: a holistic
study. Petroleum Geoscience, 066(Bushell 1986).
Clarke, H., Turner, P. & Bustin, R.M., 2014. Unlocking the resource potential of the
Bowland Basin, NW England. Society of Petroleum Engineers - European
Unconventional Resources Conference and Exhibition 2014: Unlocking European
Potential, 2(February), pp.25–27.
Clarkson, C.R. et al., 2012. Characterization of tight gas reservoir pore structure using
USANS/SANS and gas adsorption analysis. Fuel, 95, pp.371–385.
Clarkson, C.R. et al., 2013. Pore structure characterization of North American shale gas
reservoirs using USANS/SANS, gas adsorption, and mercury intrusion. In Fuel.
Clarkson, C.R., Jensen, J.L. & Blasingame, T.A., 2011. Reservoir Engineering for
Unconventional Gas Reservoirs: What Do We Have to Consider. Society of
Petroleum engineers, SPE 145080, pp.1–45.
Cnudde, V. & Boone, M.N., 2013. High-resolution X-ray computed tomography in
geosciences: A review of the current technology and applications. Earth-Science
Reviews, 123, pp.1–17.
Curtis, M.E. & Ambrose, R.J., 2011. Investigation of the relationship between organic
porosity and thermal maturity in the Marcellus Shale. SPE North American
unconventional Gas Conference, Woodlands, Texas, SPE 144370, p.4pp.
Curtis, M.E., Ambrose, R.J. & Sondergeld, C.H., 2010. Structural Characterization of Gas
Shales on the Micro- and Nano-Scales. Canadian Unconventional Resources and
International Petroleum Conference, (October), p.137693.
Curtis, M.E., Ambrose, R.J. & Sondergeld, C.H., 2011. Structural Characterization of Gas
Shales on the Micro- and Nano-Scales.
Day-Stirrat, R.J. et al., 2010. Open-system chemical behavior in deep Wilcox Group
mudstones, Texas Gulf Coast, USA. Marine and Petroleum Geology, 27(9),
pp.1804–1818.
Fishman, N.S. et al., 2012. The nature of porosity in organic-rich mudstones of the Upper
Jurassic Kimmeridge Clay Formation, North Sea, offshore United Kingdom.
International Journal of Coal Geology, 103, pp.32–50.
Gawthorpe, R.L., 1986. Sedimentation during carbonate ramp-to-slope evolution in a
tectonically active area: Bowland Basin (Dinantian), northern England.
Sedimentology, 33, pp.185–206.
Groen, J.C., Peffer, L.A.A. & Pérez-Ramírez, J., 2003. Pore size determination in modified
micro- and mesoporous materials. Pitfalls and limitations in gas adsorption data
analysis. Microporous and Mesoporous Materials, 60(1–3), pp.1–17.

PhD Thesis | 2019
304
Gupta, N., Fathi, E. & Belyadi, F., 2018. Effects of nano-pore wall confinements on
rarefied gas dynamics in organic rich shale reservoirs. Fuel, 220(February),
pp.120–129.
Harkins, W.D. & Jura, G., 1944. Surfaces of Solids. XIII. A Vapor Adsorption Method for
the Determination of the Area of a Solid without the Assumption of a Molecular
Area, and the Areas Occupied by Nitrogen and Other Molecules on the Surface of a
Solid. Journal of the American Chemical Society, 66(8), pp.1366–1373.
Hennissen, J.A.I. et al., 2017. The prospectivity of a potential shale gas play: An example
from the southern Pennine Basin (central England, UK). Marine and Petroleum
Geology, 86, pp.1047–1066.
Ismail, I.M.K. & Pfeifer, P., 1994. Fractal Analysis and Surface Roughness of Nonporous
Carbon Fibers and Carbon Blacks. Langmuir, 10(5), pp.1532–1538.
Javadpour, F., 2009. Nanopores and apparent permeability of gas flow in mudrocks
(shales and siltstone). Journal of Canadian Petroleum Technology, 48(8), pp.16–
21.
Javadpour, F., Fisher, D. & Unsworth, M., 2007. Nanoscale gas flow in shale gas
sediments. Journal of Canadian Petroleum Technology.
Jiao, K. et al., 2014. The characterization and quantitative analysis of nanopores in
unconventional gas reservoirs utilizing FESEM–FIB and image processing: An
example from the lower Silurian Longmaxi Shale, upper Yangtze region, China.
International Journal of Coal Geology, 128–129, pp.1–11.
Katsube, T.J., 2000. Shale permeability and pore-structure evolution characteristics.
Geological Survey of Canada, Current Re(2000-E15).
Kazemi, M. & Takbiri-Borujeni, A., 2017. Multiscale Modeling of Gas Transport in
Organic-Rich Shale: From Molecular Scale to Core Plug Scale.
Kelly, S. et al., 2016. Assessing the utility of FIB-SEM images for shale digital rock
physics. Advances in Water Resources, 95.
Klaver, J. et al., 2016. BIB-SEM pore characterization of mature and post mature
Posidonia Shale samples from the Hils area, Germany. International Journal of Coal
Geology, 158.
Kuila, U. et al., 2012. Compositional Controls on Mudrock Pore-Size Distribution: An
Example from Niobrara Formation. SPE Annual Technical Conference and
Exhibition, p.16.
Kuila, U. et al., 2014. Nano-scale texture and porosity of organic matter and clay
minerals in organic-rich mudrocks. Fuel, 135, pp.359–373.
Kuila, U. & Prasad, M., 2013a. Application of nitrogen gas-adsorption technique for
characterization of pore structure of mudrocks. The Leading Edge, 32(12),
pp.1478–1485.

PhD Thesis | 2019
305
Kuila, U. & Prasad, M., 2013b. Specific surface area and pore-size distribution in clays
and shales. Geophysical Prospecting, 61(2), pp.341–362.
Lazar, O.R. et al., 2015. Capturing key attributes of fine-grained sedimentary rocks in
outcrops, cores, and thin sections; nomenclature and description guidelines.
Journal of Sedimentary Research, 85(3), pp.230–246.
Liu, K. et al., 2017. Nanoscale pore structure characterization of the Bakken shale in the
USA. Fuel, 209.
Löhr, S.C. et al., 2015. Is organic pore development in gas shales influenced by the
primary porosity and structure of thermally immature organic matter? Organic
Geochemistry, 87, pp.119–132.
Loucks, R.G. et al., 2009. Morphology, Genesis, and Distribution of Nanometer-Scale
Pores in Siliceous Mudstones of the Mississippian Barnett Shale. Journal of
Sedimentary Research, 79(12), pp.848–861.
Loucks, R.G. et al., 2010. Preliminary Classification of Matrix Pores in Mudrocks. Gulf
Coast Association of Geological Societies Transactions, 60(2), pp.435–441.
Loucks, R.G. et al., 2012. Spectrum of pore types and networks in mudrocks and a
descriptive classification for matrix-related mudrock pores. AAPG Bulletin, 96(6),
pp.1071–1098.
Luffel, D.L. & Guidry, F.K., 1989. Reservoir rock properties of Devonian shale from core
and log analysis. In Society of Core Analysts Conference.
Ma, L., Fauchille, A.-L., et al., 2017. Correlative multi-scale imaging of shales: a review
and future perspectives. Geological Society, London, Special Publications, 454(1),
pp.175–199.
Ma, L., Taylor, K.G., et al., 2017. Multi-scale 3D characterisation of porosity and organic
matter in shales with variable TOC content and thermal maturity: Examples from
the Lublin and Baltic Basins, Poland and Lithuania. International Journal of Coal
Geology, 180(August), pp.100–112.
Ma, L. et al., 2016. Novel 3D centimetre-to nano-scale quantification of an organic-rich
mudstone: The Carboniferous Bowland Shale, Northern England. Marine and
Petroleum Geology, 72, pp.193–205.
Macquaker, J.H.S. et al., 2014. Compositional controls on early diagenetic pathways in
fine-grained sedimentary rocks: Implications for predicting unconventional
reservoir attributes of mudstones. AAPG Bulletin, 98(3), pp.587–603.
Mahamud, M.M. & García, V., 2018. Textural characterization of chars using fractal
analysis of N2 and CO2 adsorption. Fuel Processing Technology, 169(July 2017),
pp.269–279.
Mandelbrot, B.B., 1982. The fractal geometry of nature, WH freeman New York.

PhD Thesis | 2019
306
Milliken, K.L. et al., 2012. Grain assemblages and strong diagenetic overprinting in
siliceous mudrocks, Barnett Shale (Mississippian), Fort Worth Basin, Texas. AAPG
Bulletin, 96(8), pp.1553–1578.
Milliken, K.L. et al., 2013. Organic matter-hosted pore system, Marcellus Formation
(Devonian), Pennsylvania. AAPG Bulletin, 97(2), pp.177–200.
Milliken, K.L. & Curtis, M.E., 2016. Imaging pores in sedimentary rocks: Foundation of
porosity prediction. Marine and Petroleum Geology, 73, pp.590–608.
Milliken, K.L. & Day-Stirrat, R.J., 2013. Cementation in mudrocks: Brief review with
examples from cratonic basin mudrocks. AAPG Memoir, 103, pp.133–150.
Naveen, P., Asif, M. & Ojha, K., 2018. Integrated fractal description of nanopore structure
and its effect on CH4 adsorption on Jharia coals, India. Fuel, 232(June), pp.190–
204.
Nelson, P.H., 2009. Pore-throat sizes in sandstones, tight sandstones, and shales. AAPG
Bulletin, 93(3), pp.329–340.
Nole, M. et al., 2016. A method for estimating microporosity of fine-grained sediments
and sedimentary rocks via scanning electron microscope image analysis.
Sedimentology, pp.1507–1521.
O’Brien, N.R. & Slatt, R.M., 1990. Argillaceous rock atlas, New York: Springer-Verlag.
Passey, Q.R. et al., 2010. From Oil-Prone Source Rock to Gas-Producing Shale Reservoir –
Geologic and Petrophysical Characterization of Unconventional Shale-Gas
Reservoirs. CPS/SPE International Oil & Gas Conference and Exhibition in China
2010, pp.1707–1735.
Pfeifer, P. et al., 1989. Multilayer adsorption on a fractally rough surface. Physical
Review Letters, 62(17), pp.1997–2000.
Pfeifer, P. & Avnir, D., 1983. Chemistry in noninteger dimensions between two and
three. I. Fractal theory of heterogeneous surfaces. The Journal of Chemical Physics,
79(7), pp.3558–3565.
Pommer, M. & Milliken, K., 2015. Pore types and pore-size distributions across thermal
maturity, Eagle Ford Formation, southern Texas. AAPG Bulletin, 99(9).
Radlinski, A.P. et al., 2004. Application of SAXS and SANS in evaluation of porosity, pore
size distribution and surface area of coal. International Journal of Coal Geology.
Riley, N.J., 1993. Dinantian (Lower Carboniferous) biostratigraphy and
chronostratigraphy in the British Isles. Journal of the Geological Society London,
150(3), pp.427–446.
Riley, N.J., 1990. Stratigraphy of the Worston Shale Group (Dinantian), Craven Basin,
north-west England. Proceedings of the Yorkshire Geological Society, 48(2),
pp.163–187.

PhD Thesis | 2019
307
Ross, D.J.K. & Marc Bustin, R., 2009. The importance of shale composition and pore
structure upon gas storage potential of shale gas reservoirs. Marine and Petroleum
Geology, 26(6), pp.916–927.
Rouquerol, F. et al., 2013. Introduction. Adsorption by Powders and Porous Solids:
Principles, Methodology and Applications: Second Edition, pp.1–24.
Rouquerol, J. et al., 2013. Adsorption by Powders and Porous Solids: Principles,
Methodology and Applications: Second Edition,
Rouquerol, J., Llewellyn, P. & Rouquerol, F., 2007. Is the BET equation applicable to
microporous adsorbents? Studies in Surface Science and Catalysis, 160, pp.49–56.
Rybacki, E., Meier, T. & Dresen, G., 2016. What controls the mechanical properties of
shale rocks? - Part II: Brittleness. Journal of Petroleum Science and Engineering,
144, pp.39–58.
Sahouli, B., Blacher, S. & Brouers, F., 1997. Applicability of the fractal FHH equation.
Langmuir, 13(16), pp.4391–4394.
Schieber, J., 2010. Common Themes in the Formation and Preservation of Intrinsic
Porosity in Shales and Mudstones - Illustrated with Examples Across the
Phanerozoic.
Schieber, J., 2013. SEM Observations on Ion-milled Samples of Devonian Black Shales
from Indiana and New York: The Petrographic Context of Multiple Pore Types.
Electron microscopy of shale hydrocarbon reservoirs: AAPG Memoir 102, (April
2010), pp.153–172.
Schön, J.H., 2015. Physical properties of rocks: Fundamentals and principles of
petrophysics, Elsevier.
Sing, K.S.W. et al., 2013. Chapter 8. Assessment of Mesoporosity. In Adsorption by
Powders and Porous Solids: Principles, Methodology and Applications.
Sing, K.S.W. et al., 1985. International union of pure and applied chemistry physical
chemistry division reporting physisorption data for gas/soils systems with special
reference to the determination of surface area and porosity. Pure Appl. Chemistry,
57(4), pp.603–619.
Slatt, R.M., 2011. Important geological properties of unconventional resource shales.
Central European Journal of Geosciences, 3(4), pp.435–448.
Slatt, R.M. & O’Brien, N.R., 2013. Microfabrics Related to Porosity Development,
Sedimentary and Diagenetic Processes, and Composition of Unconventional
Resource Shale Reservoirs as Determined by Conventional Scanning Electron
Microscopy. In Electron microscopy of shale hydrocarbon reservoirs: AAPG
Memoir 102. pp. 37–44.
Slatt, R.M. & O’Brien, N.R., 2011. Pore types in the Barnett and Woodford gas shales:
Contribution to understanding gas storage and migration pathways in fine-grained
rocks. AAPG Bulletin, 95(12), pp.2017–2030.

PhD Thesis | 2019
308
Sondergeld, C.H. et al., 2010. Micro-structural studies of gas shales. Society of Petroleum
Engineers Unconventional Gas Conference, SPE Paper 131771, p.17.
Song, W. et al., 2018. Pore-scale numerical investigation into the impacts of the spatial
and pore-size distributions of organic matter on shale gas flow and their
implications on multiscale characterisation. Fuel.
Taylor, G.H. et al., 1998. Organic petrology.
Wang, Z. et al., 2018. Characteristics of microscopic pore structure and fractal
dimension of bituminous coal by cyclic gas adsorption/desorption: An
experimental study. Fuel, 232(June), pp.495–505.
Waters, C.N. et al., 2009. A lithostratigraphical framework for the Carboniferous
successions of northern Great Britain (onshore). British Geological Survey
Research Report RR/09/01.
Wu, M.K., 1996. The roughness of aerosol particles: Surface fractal dimension measured
using nitrogen adsorption. Aerosol Science and Technology, 25(4), pp.392–398.
Yao, Y. et al., 2008. Fractal characterization of adsorption-pores of coals from North
China: An investigation on CH4 adsorption capacity of coals. International Journal
of Coal Geology, 73(1), pp.27–42.
Abadi, M.S. et al., 2015. Lower Carboniferous ramp sedimentation of the Central Alborz Basin, northern Iran: integrated sedimentological and rock–magnetic studies. Geological Society, London, Special Publications, 414. Available at: http://sp.lyellcollection.org/content/early/2015/05/21/SP414.13.abstract [Accessed June 14, 2016].
Abanda, P.A. & Hannigan, R.E., 2006. Effect of diagenesis on trace element partitioning in shales. Chemical Geology, 230(1–2), pp.42–59.
Adams, A.E. & MacKenzie, W.S., 1999. A Colour Atlas of Carbonate Sediments and Rocks Under the-Microscope, Schweizerbart’sche Verlagsbuchhandlung.
Aitkenhead, N. et al., 1992. Geology of the Country Around Garstang. British Geological Survey Memoir for 1:50000 geological sheet 67 (England and Wales).
Alexander, C.R., DeMaster, D.J. & Nittrouer, C.A., 1991. Sediment accumulation in a modern epicontinental-shelf setting: The Yellow Sea. Marine Geology, 98(1), pp.51–72.
Algeo, T.J. & Maynard, J.B., 2004. Trace-element behavior and redox facies in core shales of Upper Pennsylvanian Kansas-type cyclothems. Chemical Geology, 206(3–4), pp.289–318.
Alldredge, A.L. & Silver, M.W., 1998. Characteristics, dynamics and significance of marine snow. Prog. Oceanography, 20, pp.41–82.
Alsop, G.I. & Marco, S., 2011. Soft-sediment deformation within seismogenic slumps of the Dead Sea Basin. Journal of Structural Geology, 33(4), pp.433–457. Available at:

PhD Thesis | 2019
309
http://dx.doi.org/10.1016/j.jsg.2011.02.003.
Alsop, G.I. & Marco, S., 2012. Tsunami and seiche-triggered deformation within offshore sediments. Sedimentary Geology, 261–262, pp.90–107. Available at: http://dx.doi.org/10.1016/j.sedgeo.2012.03.013.
Ambrose, R.J. et al., 2010. New Pore-scale Considerations for Shale Gas in Place Calculations. SPE Unconventional Gas Conference 2010, pp.167–183. Available at: http://www.scopus.com/inward/record.url?eid=2-s2.0-77954232797&partnerID=40&md5=a564a840c789be814a61ccda8a1a0450%5Cnhttp://www.onepetro.org/mslib/servlet/onepetropreview?id=SPE-131772-MS&soc=SPE.
Amy, L.A. et al., 2006. An experimental investigation of sand–mud suspension settling behaviour: implications for bimodal mud contents of submarine flow deposits. Sedimentology, 53(6), pp.1411–1434.
Andrews, I.J., 2013. The Carboniferous Bowland Shale gas study: geology and resource estimation. British Geological Survey for Department of Energy and Climate Change, London, UK.
Andrews, I.J., 2014. The Jurassic shales of the Weald Basin: geology and shale oil and shale gas resource estimation. British Geological Survey for Department of Energy and Climate Change, London, UK.
Anovitz, L.M. & Cole, D.R., 2015. Characterization and Analysis of Porosity and Pore Structures. Reviews in Mineralogy and Geochemistry, 80(1).
Aplin, A.C., Fleet, A.J. & Macquaker, J.H.S., 1999. Muds and mudstones: physical and fluid-flow properties. Geological Society, London, Special Publications, 158, pp.1–8.
Aplin, A.C. & Macquaker, J.H.S., 2011. Mudstone diversity: Origin and implications for source, seal, and reservoir properties in petroleum systems. AAPG Bulletin, 95, pp.15–34.
Armitage, P.J. et al., 2016. Permeability of the Mercia Mudstone: Suitability as caprock to carbon capture and storage sites. Geofluids, 16(1), pp.26–42.
Arostegui, J. et al., 2001. Microtextures and the origin of muscovite-kaolinite intergrowths in sandstones of the utrillas formation, Basque Cantabrian Basin, Spain. Clays and Clay Minerals, 49(6), pp.529–539.
Arthurton, R.S., 1984. The Ribblesdale fold belt, NW England—a Dinantian-early Namurian dextral shear zone. Geological Society, London, Special Publications, 14(1), p.131 LP-138. Available at: https://sp.lyellcollection.org/content/14/1/131.abstract.
Avnir, D., Farin, D. & Pfeifer, P., 1983. Chemistry in noninteger dimensions between two and three. II. Fractal surfaces of adsorbents. The Journal of chemical physics, 79(7), pp.3566–3571.
Avnir, D. & Jaroniec, M., 1989. An Isotherm Equation for Adsorption on Fractal Surfaces of Heterogeneous Porous Materials. Langmuir, 5(6), pp.1431–1433.
Baas, J.H. et al., 2009. A Phase Diagram for Turbulent, Transitional, and Laminar Clay

PhD Thesis | 2019
310
Suspension Flows. Journal of Sedimentary Research, 79(4), pp.162–183. Available at: http://jsedres.sepmonline.org/cgi/doi/10.2110/jsr.2009.025.
Baas, J.H. & Best, J.L., 2002. Turbulence Modulation in Clay-Rich Sediment-Laden Flows and Some Implications for Sediment Deposition. Journal of Sedimentary Research, 72(3), pp.336–340. Available at: http://jsedres.sepmonline.org/cgi/doi/10.1306/120601720336.
Bai, B. et al., 2013. Rock characterization of Fayetteville shale gas plays. Fuel, 105, pp.645–652. Available at: http://dx.doi.org/10.1016/j.fuel.2012.09.043.
Barrett, E.P., Joyner, L.G. & Halenda, P.P., 1951. The Determination of Pore Volume and Area Distributions in Porous Substances. I. Computations from Nitrogen Isotherms. Journal of the American Chemical Society, 73(1), pp.373–380. Available at: https://doi.org/10.1021/ja01145a126.
Basilone, L., 2017. Seismogenic rotational slumps and translational glides in pelagic deep-water carbonates. Upper Tithonian-Berriasian of Southern Tethyan margin (W Sicily, Italy). Sedimentary Geology, 356, pp.1–14. Available at: http://dx.doi.org/10.1016/j.sedgeo.2017.04.009.
Basilone, L., Sulli, A. & Gasparo Morticelli, M., 2016. The relationships between soft-sediment deformation structures and synsedimentary extensional tectonics in Upper Triassic deep-water carbonate succession (Southern Tethyan rifted continental margin — Central Sicily). Sedimentary Geology, 344, pp.310–322. Available at: http://dx.doi.org/10.1016/j.sedgeo.2016.01.010.
Bauluz, B. et al., 2008. Genesis of kaolinite from Albian sedimentary deposits of the Iberian Range (NE Spain): analysis by XRD, SEM and TEM. Clay Minerals, 43(3), pp.459–475. Available at: http://openurl.ingenta.com/content/xref?genre=article&issn=0009-8558&volume=43&issue=3&spage=459.
Beadle, L.C., 1981. The Inland Waters of Tropical Africa, 2nd edition 2nd ed., Longman, London.
Behl, R.J., 2011a. Chert spheroids of the Monterey Formation, California (USA): Early-diagenetic structures of bedded siliceous deposits. Sedimentology.
Behl, R.J., 2011b. Chert spheroids of the Monterey Formation, California (USA): Early-diagenetic structures of bedded siliceous deposits. Sedimentology, 58(2), pp.325–351.
Behl, R.J., 1998. RELATIONSHIPS BETWEEN SILICA DIAGENESIS, DEFORMATION, AND FLUID FLOW IN MONTEREY FORMATION CHERTS, SANTA MARIA BASIN, CALIFORNIA. SEPM Special Publication, 83.
Bennett, S.J. & Simon, A., 2004. Riparian vegetation and fluvial geomorphology, American Geophysical Union.
Bernard, S. & Brown, L., 2013. FIB-SEM and TEM Investigations of an Organic-rich Shale Maturation Series from the Lower Toarcian Posidonia Shale, Germany: Nanoscale Pore System and Fluid-rock Interactions. AAPG Memoir, 102, pp.53–66.
Berner, R.A., 1984. Sedimentary pyrite formation: An update. Geochimica et

PhD Thesis | 2019
311
Cosmochimica Acta, 48(4), pp.605–615.
Bertoncello, A. & Honarpour, M.M., 2013. Standards for Characterization of Rock Properties in Unconventional Reservoirs: Fluid Flow Mechanism, Quality Control, and Uncertainties. SPE Annual Technical Conference and Exhibition.
Betzler, C. et al., 1999. Sedimentary patterns and geometries of the Bahamian outer carbonate ramp (Miocene-Lower Pliocene, Great Bahama Bank). Sedimentology, 46(6), pp.1127–1143.
Bhattacharya, J.P. et al., 2014. Bedload Transport of Mud Across A Wide, Storm-Influenced Ramp: Cenomanian-Turonian Kaskapau Formation, Western Canada Foreland Basin--Discussion. Journal of Sedimentary Research, 83(12), pp.1198–1199. Available at: http://pygs.lyellcollection.org/cgi/doi/10.1144/pygs.52.1.1.
Bhattacharya, J.P. & MacEachern, J.A., 2009. Hyperpycnal Rivers and Prodeltaic Shelves in the Cretaceous Seaway of North America. Journal of Sedimentary Research, 79(4), pp.184–209.
Bjørlykke, K., 1998. Clay Mineral Diagenesis in Sedimentary Basins — A Key to the Prediction of Rock Properties. Examples from the North Sea Basin. Clay Minerals, 33(1), pp.15–34.
Bjørlykke, K., 2015a. Mudrocks, shales, silica deposits and evaporites. In Petroleum Geoscience: From Sedimentary Environments to Rock Physics, Second Edition.
Bjørlykke, K., 2011. Open-system chemical behaviour of Wilcox Group mudstones. How is large scale mass transfer at great burial depth in sedimentary basins possible? A discussion. Marine and Petroleum Geology, 28(7), pp.1381–1382. Available at: http://dx.doi.org/10.1016/j.marpetgeo.2011.01.009.
Bjørlykke, K., 2015b. Petroleum geoscience: From sedimentary environments to rock physics, second edition,
Bjørlykke, K., 1999. Principal aspects of compaction and fluid flow in mudstones. Geological Society, London, Special Publications, 158(1), pp.73–78. Available at: http://sp.lyellcollection.org/cgi/doi/10.1144/GSL.SP.1999.158.01.06.
Bjørlykke, K. & Aagaard, P., 1992. Clay Minerals in North Sea Sandstone. SEPM Special Publication, 47.
Bjørlykke, K. & Egeberg, P.K., 1993. Quartz cementation in sedimentary basins. American Association of Petroleum Geologists Bulletin, 77(9), pp.1538–1548.
Blatt, H., 1982. Sedimentary Petrology, Freeman, New York.
Blatt, H., Middleton, G. V. & Murray, R.C., 1980. Origin of sedimentary rocks. Englewood Cliffs, New Jersey, Prentice-Hall, xvii, p.782.
Blunt, M.J. et al., 2013. Pore-scale imaging and modelling. Advances in Water Resources, 51, pp.197–216. Available at: http://dx.doi.org/10.1016/j.advwatres.2012.03.003.
Boggs Jr., S., 2006. Principles of Sedimentology and Stratigraphy 4th ed., New Jersey: Prentice Hall.
Bohacs, K.M. et al., 2005. Production, destruction, and dilution— The many pathways to

PhD Thesis | 2019
312
source-rock development K. M. Bohacs et al., eds. The Deposition of Organic-Carbon-Rich Sediments: Models, Mechanisms, and Consequences, 82, pp.61–101.
Bohacs, K.M. & Fraticelli, C., 2008. Paleo-environmental reconstruction and analysis (paleogeography, paleoclimate, plaeo-oceanography, paleobiology) as part of integrated source rock prediction. International Petroleum Conference, IPTC, 2, pp.1130–1139.
Bohacs, K.M., Lazar, O.R. & Demko, T.M., 2014. Parasequence types in shelfal mudstone strata-Quantitative observations of lithofacies and stacking patterns, and conceptual link to modern depositional regimes. Geology, 42(2), pp.131–134.
Bond, D., Wignall, P.B. & Racki, G., 2004. Extent and duration of marine anoxia during the Frasnian-Famennian (Late Devonian) mass extinction in Poland, Germany, Austria and France. Geological Magazine, 141(2), pp.173–193.
Böning, P. et al., 2004. Geochemistry of Peruvian near-surface sediments. Geochimica et Cosmochimica Acta, 68(21), pp.4429–4451.
Borcovsky, D. et al., 2017. Sedimentology, facies architecture, and sequence stratigraphy of a Mississippian black mudstone succession-The upper member of the Bakken Formation, North Dakota, United States. AAPG Bulletin, 101(10).
Bott, M.H.P., 1967. Geophysical investigations of the Northern Pennine basement rocks. Proceedings of the Yorkshire Geological Society, 36, pp.139–168.
Boulesteix, K. et al., 2019. Transport and deposition of mud in deep‐water environments: Processes and stratigraphic implications. Sedimentology.
Bowker, K.A., 2007. Barnett shale gas production, Fort Worth Basin: Issues and discussion. AAPG Bulletin, 91, pp.523–533.
Boyer, C. et al., 2006. Producing Gas from Its Source. Oifield review, Autumn 200.
Brandon, A. et al., 1998. Geology of the Country Around Lancaster: Memoir for 1:50 000 Geological Sheet 59 (England and Wales ) - Geological Memoirs & Sheet Explanations. British Geological Survey Research Report.
Braunstein, J., 1961. Calciclastic and siliciclastic. AAPG Bulletin, 45(12), p.2017.
Bridge, J.S. & Demicco, R. V., 2008. Earth surface processes, landforms and sediment deposits, Cambridge, UK ; New York: Cambridge University Press.
Brindle, S. et al., 2015. An integrated approach to unconventional resource play reservoir characterization, Thistleton-1 case study, NW England. First Break, 33(2), pp.79–86.
Brunauer, S., Emmett, P.H. & Teller, E., 1938. Adsorption of Gases in Multimolecular Layers. Journal of the American Chemical Society, 60(1), pp.309–319. Available at: http://pubs.acs.org/doi/abs/10.1021/ja01269a023.
Burchette, T.P. & Wright, V.P., 1992. Carbonate ramp depositional systems. Sedimentary Geology, 79(1–4), pp.3–57.
Burley, S.D., 1993. Models of burial diagenesis for deep exploration plays in Jurassic fault traps of the Central and Northern North Sea J. R. Parker, ed. From Petroleum

PhD Thesis | 2019
313
Geology of Northwest Europe: Proceedings of the 4th Conference, pp.1353–1375.
Burton, J.H., Krinsley, D.H. & Eye, K., 1987. Texas Gulf Coast Sediments. , 35(4), pp.291–296.
Bush, R.T., McGrath, R. & Sullivan, L.A., 2004. Occurrence of marcasite in an organic-rich Holocene estuarine mud. Soil Research, 42(6), p.617. Available at: http://www.publish.csiro.au/?paper=SR03079.
Bust, V.K. et al., 2013. The petrophysics of shale gas reservoirs: Technical challenges and pragmatic solutions. Petroleum Geoscience, 19(2).
Bustin, R. et al., 2008. Impact of shale properties on pore structure and storage characteristics. SPE Shale Gas Production Conference, p.SPE 119892. Available at: http://www.onepetro.org/mslib/servlet/onepetropreview?id=SPE-119892-MS.
Calvert, S.E. & Pedersen, T.F., 1993. Geochemistry of Recent oxic and anoxic marine sediments: Implications for the geological record. Marine Geology, 113(1–2), pp.67–88.
Chabaud, L. et al., 2016. Sedimentary processes determining the modern carbonate periplatform drift of Little Bahama Bank. Marine Geology, 378, pp.213–229. Available at: http://dx.doi.org/10.1016/j.margeo.2015.11.006.
Chalmers, G.R., Bustin, R.M. & Power, I.M., 2012. Characterization of gas shale pore systems by porosimetry, pycnometry,surfacearea,andfield emission scanning electron microscopy/ transmission electron microscopy image analyses: Examples from the Barnett, Woodford, Haynesville, Marcellus,andDoig units. AAPG Bulletin, 96(6), pp.1099–1119.
Chalmers, G.R.L. & Bustin, R.M., 2015. Porosity and pore size distribution of deeply-buried fine-grained rocks: Influence of diagenetic and metamorphic processes on shale reservoir quality and exploration. Journal of Unconventional Oil and Gas Resources, 12, pp.134–142. Available at: http://dx.doi.org/10.1016/j.juogr.2015.09.005.
Charpentier, R.R. & Cook, T.A., 2011. USGS Methodology for Assessing Continuous Petroleum Resources. U. S. G. Survey, ed., U.S. Geological Survey Open-File Report.
Charsley, T.J., 1984. Early Carboniferous rocks of the Swinden No. 1 Borehole, west of Skipton, Yorkshire. Report of the British Geological Survey, 84(1), pp.5–12.
Choquette, P.W. & Pray, L.C., 1970. Geologic nomenclature and classification of porosity in sedimentary carbonates. America Association. Petroleum Geologists Bulletin, 54, pp.207–250.
Clarke, H. et al., 2018. Shale gas resources of the Bowland Basin, NW England: a holistic study. Petroleum Geoscience, 066(Bushell 1986). Available at: http://pg.lyellcollection.org/content/early/2018/05/04/petgeo2017-066.abstract.
Clarke, H., Turner, P. & Bustin, R.M., 2014. Unlocking the resource potential of the Bowland Basin, NW England. Society of Petroleum Engineers - European Unconventional Resources Conference and Exhibition 2014: Unlocking European Potential, 2(February), pp.25–27.

PhD Thesis | 2019
314
Clarkson, C.R., Freeman, M., et al., 2012. Characterization of tight gas reservoir pore structure using USANS/SANS and gas adsorption analysis. Fuel, 95, pp.371–385.
Clarkson, C.R., Wood, J.M., et al., 2012. Nanopore-structure analysis and permeability predictions for a tight gas siltstone reservoir by use of low-pressure adsorption and mercury-intrusion techniques. SPE Reservoir Evaluation & Engineering, 15(6), pp.648–661. Available at: https://www.onepetro.org/journal-paper/SPE-155537-PA.
Clarkson, C.R. et al., 2013. Pore structure characterization of North American shale gas reservoirs using USANS/SANS, gas adsorption, and mercury intrusion. In Fuel.
Clarkson, C.R., Jensen, J.L. & Blasingame, T.A., 2011. Reservoir Engineering for Unconventional Gas Reservoirs: What Do We Have to Consider. Society of Petroleum engineers, SPE 145080, pp.1–45.
Cnudde, V. & Boone, M.N., 2013. High-resolution X-ray computed tomography in geosciences: A review of the current technology and applications. Earth-Science Reviews, 123, pp.1–17. Available at: http://dx.doi.org/10.1016/j.earscirev.2013.04.003.
Cohen, A.S., 2003. Paleolimnology: the history and evolution of lake systems, Oxford University Press.
Collinson, J.D., 1996. Alluvial Sediments H. G. Reading, ed. Sedimentary Environments: Processes, Facies and Stratigraphy, 3rd edition, pp.37–82.
Cook, H.E. & Mullins, H.T., 1983. Basin Margin Environment. In P. A. Scholle, D. G. Bebout, & C. M. Moore, eds. Carbonate Depositinal Environments. AAPG Memoir, pp. 540–617.
Courjault, T. et al., 2011. Detailed anatomy of a deep-water carbonate breccia lobe (Upper Jurassic, French subalpine basin). Sedimentary Geology, 238(1–2), pp.156–171. Available at: http://dx.doi.org/10.1016/j.sedgeo.2011.04.010.
Curran, K.J. et al., 2004. Inferring the mass fraction of floc deposited mud: Application to fine-grained turbidites. Sedimentology, 51, pp.927–944.
Curran, K.J., Hill, P.S. & Milligan, T.G., 2002. Fine-grained suspended sediment dynamics in the Eel River flood plume. Continental Shelf Research, 22, pp.2537–2550.
Curtis, C.D., Burns, R.G. & Smith, J. V, 1977. Sedimentary Geochemistry: Environments and Processes Dominated by Involvement of an Aqueous Phase [and Discussion]. Philosophical Transactions of the Royal Society of London A: Mathematical, Physical and Engineering Sciences, 286(1336), pp.353–372. Available at: http://rsta.royalsocietypublishing.org/content/286/1336/353.abstract.
Curtis, C.D. & Coleman, M.L., 1986. Controls on the precipitation of early diagenetic calcite, dolomite and siderite concretions in complex depositional sequences D. L. Gautier, ed., SEPM Special Publication.
Curtis, C.D., Coleman, M.L. & Love, L.G., 1986. Pore water evolution during sediment burial from isotopic and mineral chemistry of calcite, dolomite and siderite concretions. Geochimica et Cosmochimica Acta, 50(10), pp.2321–2334.

PhD Thesis | 2019
315
Curtis, C.D. & Spears, D.A., 1971. Diagenetic development of kaolinite. Clays and Clay Minerals, 19(4), pp.219–227.
Curtis, M.E. & Ambrose, R.J., 2011. Investigation of the relationship between organic porosity and thermal maturity in the Marcellus Shale. SPE North American unconventional Gas Conference, Woodlands, Texas, SPE 144370, p.4pp.
Curtis, M.E., Ambrose, R.J. & Sondergeld, C.H., 2010. Structural Characterization of Gas Shales on the Micro- and Nano-Scales. Canadian Unconventional Resources and International Petroleum Conference, (October), p.137693. Available at: http://www.onepetro.org/doi/10.2118/137693-MS.
Curtis, M.E., Ambrose, R.J. & Sondergeld, C.H., 2011. Structural Characterization of Gas Shales on the Micro- and Nano-Scales.
Daigle, H. et al., 2013. Widespread deformation of basin-plain sediments in Aysén fjord (chile) due to impact by earthquake-triggered, onshore-generated mass movements. Marine Geology, 337(October), pp.67–79. Available at: http://dx.doi.org/10.1016/j.margeo.2013.01.006.
Day-Stirrat, R.J. et al., 2010. Open-system chemical behavior in deep Wilcox Group mudstones, Texas Gulf Coast, USA. Marine and Petroleum Geology, 27(9), pp.1804–1818. Available at: http://dx.doi.org/10.1016/j.marpetgeo.2010.08.006.
Dean, M.T. et al., 2011. A lithostratigraphical framework for the Carboniferous successions of northern Great Britain (onshore). British Geological Survey Research Report RR/09/01, p.174.
Dean, W.E., Leinen, M. & Stow, D.A. V, 1985. Classification of deep-sea, finegrained sediments. Journal of Sedimentary Petrology, 55, pp.250–256.
Dowey, P.J. & Taylor, K.G., 2017. Extensive authigenic quartz overgrowths in the gas-bearing Haynesville-Bossier Shale, USA. Sedimentary Geology, 356, pp.15–25. Available at: http://dx.doi.org/10.1016/j.sedgeo.2017.05.001.
Dunbar, C.O. & Rogers, J., 1957. Principles of Stratigraphy, John Wiley & Sons Inc., New York.
Dunham, R.J., 1962. Classification of carbonate rocks according to depositional texture W. E. Hamm, ed. Classification of Carbonate Rocks, pp.108–121.
Dunham, R.J., 1962. Classification of carbonate rocks according to depositional textures.
EAGE, 2019. Industry News. First Break, 37(3), p.28.
Earp, J.R. et al., 1961. Geology of the country around Clitheroe and Nelson. Memoir of the Geological Survey of Great Britain, Sheet 68 (.
Ebdon, C.C. et al., 1990. The Dinantian Stratigraphy of the East Midlands: A seismostratigraphic approach. Journal of the Geological Society London, 147, pp.519–536.
Eberli, G.P., 1991. Calcareous turbidites and their relationship to sea-level fluctuations and tectonism. Cycles and events in stratigraphy, pp.340–359.
Eberli, G.P. et al., 2004. Carbonate Platform to Basin Transitions on Seismic Data and in

PhD Thesis | 2019
316
Outcrops: Great Bahama Bank and the Maiella Platform Margin, Italy. Seismic Imaging of Carbonate Reservoirs and Systems: AAPG Memoir 81, pp.207–250. Available at: https://doi.org/10.1306/M81928.
Einsele, G., 2000. Sedimentary Basin: Evolution, Facies and Sediment Budget, 2nd edition, Springer.
Ekes, C., 1993. Bedload-transported pedogenic mud aggregates in the Lower Old Red Sandstone in Southwest wales. Geological Society (London), 150, pp.469–472.
Embry III, A.F. & Klovan, J.E., 1971. A late Devonian reef tract on northeastern Banks Island, NWT. Bulletin of Canadian Petroleum Geology, 19(4), pp.730–781.
Emmings, J.F. et al., 2017. Stream and slope weathering effects on organic-rich mudstone geochemistry and implications for hydrocarbon source rock assessment: A Bowland Shale case study. Chemical Geology, 471(February), pp.74–91. Available at: http://dx.doi.org/10.1016/j.chemgeo.2017.09.012.
Espitalié, J. et al., 1977. Source rock characterization method for petroleum exploration. Offshore Technology Conference, Houston.
Evans, D.J. & Kirby, G.A., 1999. The architecture of concealed Dinantian carbonate sequences over the Central Lancashire and Holme highs, northern England. Proceedings of the Yorkshire Geological Society, 52(3), pp.297–312. Available at: http://pygs.lyellcollection.org/cgi/doi/10.1144/pygs.52.3.297.
Feldkamp, L.A., Davis, L.C. & Kress, J.W., 1984. Practical cone-beam algorithm. Journal of the Optical Society of America A, 1(6), pp.612–619. Available at: http://josaa.osa.org/abstract.cfm?URI=josaa-1-6-612.
Ferry, S. et al., 2015. The base-of-slope carbonate breccia system of Céüse (Tithonian, S-E France): Occurrence of progradational stratification in the head plug of coarse granular flow deposits. Sedimentary Geology, 317, pp.71–86. Available at: http://dx.doi.org/10.1016/j.sedgeo.2014.07.001.
Fewtrell, M. & Smith, D., 1980. Revision of the Dinantian stratigraphy of the Craven Basin, N England. Geological Magazine, 117(01), pp.37–49.
Fishman, N.S. et al., 2012. The nature of porosity in organic-rich mudstones of the Upper Jurassic Kimmeridge Clay Formation, North Sea, offshore United Kingdom. International Journal of Coal Geology, 103, pp.32–50.
Flemming, B.W., 2000. A revised textural classification of gravel-free muddy sediments on the basis of ternary diagrams. Continental Shelf Research, 20(10), p.1125–1137(13).
Folk, R.L., 1968. Petrology of sedimentary rocks, Hemphills, Austin.
Fraser, A.J. et al., 1990. A regional assessment of the intra-Carboniferous play of northern England J. J. Brooks, ed. Classic Petroleum Provinces, 50, pp.417–440.
Fraser, A.J. & Gawthorpe, R.L., 2003. An atlas of Carboniferous basin evolution in Northern England. Geological Society Memoir, 28.
Fraser, A.J. & Gawthorpe, R.L., 1990. Tectono-stratigraphic development and hydrocarbon habitat of the Carboniferous in northern England. Geological Society,

PhD Thesis | 2019
317
London, Special Publications, 55(1), pp.49–86. Available at: http://sp.lyellcollection.org/content/55/1/49.abstract.
Friedrichs, C.T. & Wright, L.D., 2004. Gravity-driven sediment transport on the continental shelf: implications for equilibrium profiles near river mouths. Coastal Engineering, 51, pp.795–811.
Gale, J.F.W. et al., 2017. Natural fractures in shale: A review and new observations. AAPG Bulletin, 101(8), pp.2165–2216.
Garrels, R.M. & Mackenzie, F.T., 1971. Evolution of sedimentary rocks, New York: W. W. Norton.
Gawthorpe, R.L., 1987. Burial dolomitization and porosity development in a mixed carbonate-clastic sequence: an example from the Bowland Basin, northern England. Sedimentology, 34(4), pp.533–558. Available at: http://doi.wiley.com/10.1111/j.1365-3091.1987.tb00785.x.
Gawthorpe, R.L., 1986. Sedimentation during carbonate ramp-to-slope evolution in a tectonically active area: Bowland Basin (Dinantian), northern England. Sedimentology, 33, pp.185–206.
Gawthorpe, R.L., 1987. Tectono-sedimentary evolution of the Bowland Basin, northern England, during the Dinantian. Journal of the Geological Society London, 144, pp.59–71.
Gawthorpe, R.L. & Clemmey, H., 1985. Geometry of submarine slides in the Bowland Basin (Dinantian) and their relation to debris flows. Journal of the Geological Society, 142(3), pp.555–565.
Gawthorpe, R.L., Gutteridge, P. & Leeder, M.R., 1989. Late Devonian and Dinantian basin evolution in Northern England and North Wales R. S. Arthurton, P. Gutteridge, & S. C. Nolan, eds. The role of tectonics in Devonian and carboniferous sedimenration in the British isle., 6, pp.1–23.
Gradstein, F.M. et al., 2012. The Geologic Time Scale 2012 Vol. 2.
Grayson, R.F. & Oldham, L., 1987. A new structural framework for the northern British Dinantian as a basis for oil, gas and mineral exploration J. Miller, A. E. Adams, & V. P. Wright, eds. European Dinantian environments, pp.33–59.
Groen, J.C., Peffer, L.A.A. & Pérez-Ramírez, J., 2003. Pore size determination in modified micro- and mesoporous materials. Pitfalls and limitations in gas adsorption data analysis. Microporous and Mesoporous Materials, 60(1–3), pp.1–17.
Grosheny, D., Ferry, S. & Courjault, T., 2015. Progradational patterns at the head of single units of base-of-slope, submarine granular flow deposits (“Conglomérats des Gas”, Coniacian, SE France). Sedimentary Geology, 317, pp.102–115. Available at: http://dx.doi.org/10.1016/j.sedgeo.2014.10.007.
Gross, D. et al., 2015. Organic geochemistry of Mississippian shales (Bowland Shale Formation) in central Britain: Implications for depositional environment, source rock and gas shale potential. Marine and Petroleum Geology, 59, pp.1–21. Available at: http://dx.doi.org/10.1016/j.marpetgeo.2014.07.022.

PhD Thesis | 2019
318
Gupta, N., Fathi, E. & Belyadi, F., 2018. Effects of nano-pore wall confinements on rarefied gas dynamics in organic rich shale reservoirs. Fuel, 220(February), pp.120–129.
Haddad, E.E. et al., 2018. Ichnofabrics and chemostratigraphy argue against persistent anoxia during the Upper Kellwasser Event in New York State. Palaeogeography, Palaeoclimatology, Palaeoecology, 490.
Han, Y., Mahlstedt, N. & Horsfield, B., 2015. The Barnett Shale: Compositional fractionation associated with intraformational petroleum migration, retention, and expulsion. AAPG Bulletin, 99(12), pp.2173–2201.
Harkins, W.D. & Jura, G., 1944. Surfaces of Solids. XIII. A Vapor Adsorption Method for the Determination of the Area of a Solid without the Assumption of a Molecular Area, and the Areas Occupied by Nitrogen and Other Molecules on the Surface of a Solid. Journal of the American Chemical Society, 66(8), pp.1366–1373. Available at: https://doi.org/10.1021/ja01236a048.
Harrington, J.F. & Horseman, S.T., 1999. Gas transport properties of clays and mudrocks. Geological Society, London, Special Publications, 158(1–86239–030–4/99/$15.00), pp.107–124.
Hartmann, D.J. & Beaumont, E.A., 1999. Predicting Reservoir System Quality and Performance E. A. Beaumont & N. H. Forster, eds. AAPG treatise of petroleum geology, exploration for oil and gas traps, ch. 9, p.9.1-9.154.
Haszeldine, R.S., 1984. Carboniferous North Atlantic palaeogeography: stratigraphic evidence for rifting, not megashear or subduction. Geological Magazine, 121(5), pp.443–463. Available at: https://www.cambridge.org/core/article/carboniferous-north-atlantic-palaeogeography-stratigraphic-evidence-for-rifting-not-megashear-or-subduction/6A788998AF67A90532D7485D29FC6C2A.
Hatch, J.R. & Leventhal, J.S., 1992. Relationship between inferred redox potential of the depositional environment and geochemistry of the Upper Pennsylvanian (Missourian) Stark Shale Member of the Dennis Limestone, Wabaunsee County, Kansas, U.S.A. Chemical Geology, 99(1–3), pp.65–82.
Helz, G.R. et al., 2011. New model for molybdenum behavior in euxinic waters. Chemical Geology, 21(4), pp.1139–1146.
Hendry, M.J. et al., 2015. Can argillaceous formations isolate nuclear waste? Insights from isotopic, noble gas, and geochemical profiles. Geofluids, 15(3), pp.381–386.
Hennissen, J.A.I. et al., 2017. The prospectivity of a potential shale gas play: An example from the southern Pennine Basin (central England, UK). Marine and Petroleum Geology, 86, pp.1047–1066. Available at: http://dx.doi.org/10.1016/j.marpetgeo.2017.06.033.
Herbig, H.G. & Bender, P., 1992. A eustatically driven calciturbidite sequence from the Dinantian II of the Eastern Rheinisches Schiefergebirge. Facies, 27(1), pp.245–261.
Hilgers, C. & Urai, J.L., 2002. Experimental study of syntaxial vein growth during lateral fluid flow in transmitted light: First results. Journal of Structural Geology, 24(6–7), pp.1029–1043.

PhD Thesis | 2019
319
Hillier, S., 1995. Erosion, sedimentation and sedimentary origin of clays B. Velde, ed., Berlin, Germany: Springer-Verlag.
Hillier, S., 1993. Origin, diagenesis, and mineralogy of chlorite minerals in Devonian lacustrine mudrocks, Orcadian Basin, Scotland. Clays and Clay Minerals, 41, pp.240–259.
Holliday, D.W. & Molyneux, S.G., 2006. Editorial statement: new official names for the subsystems, series and stages of the Carboniferous System - some guidance for contributors to the Proceedings. Proceedings Of The Yorkshire Geological Society, 56, pp.57–58. Available at: http://apps.isiknowledge.com/InboundService.do?product=WOS&action=retrieve&SrcApp=Papers&UT=000238327500007&SID=Y2hOpKi@oMlo3CeIKgp&Init=Yes&SrcAuth=mekentosj&mode=FullRecord&customersID=mekentosj&DestFail=http://access.isiproducts.com/custom_images/wok_f.
Huang, J., Cavanaugh, T. & Nur, B., 2013. An Introduction to SEM Operational Principles and Geologic Applications for Shale Hydrocarbon Reservoirs. Electron microscopy of shale hydrocarbon reservoirs: AAPG Memoir 102, pp.1–6.
Hudson, R.G.S., 1933. The general geology and the Carboniferous Rocks: The geology of the country around Harrogate. Proceedings of the Geologists’ Association, 49, pp.295–352.
Huggett, J.M., 1994. Diagenesis of mudrocks and concretions from the London Clay Formation in the London Basin. Clay Minerals, 29, pp.693–707.
Huggett, J.M., Gale, A.S. & Wray, D.S., 2005. Diagenetic Clinoptilolite and Opal-CT from the Middle Eocene Wittering Formation, Isle of Wight, U.K. Journal of Sedimentary Research, 75(4), pp.585–595. Available at: http://jsedres.sepmonline.org/cgi/doi/10.2110/jsr.2005.048.
Ichaso, A.A. & Dalrymple, R.W., 2009. Tide- and wave-generated fluid mud deposits in the Tilje Formation (Jurassic), offshore Norway. Geology, 37(6), pp.539–542.
Ielpi, A. & Cornamusini, G., 2013. An outer ramp to basin plain transect: Interacting pelagic and calciturbidite deposition in the eocene-oligocene of the tuscan domain, adria microplate (italy). Sedimentary Geology, 294, pp.83–104.
Ingram, R.L., 1953. Fissility of mudrocks. Bulletin of the Geological Society of America, 64(8), pp.869–878.
Ismail, I.M.K. & Pfeifer, P., 1994. Fractal Analysis and Surface Roughness of Nonporous Carbon Fibers and Carbon Blacks. Langmuir, 10(5), pp.1532–1538.
Jarvie, D.M., 2014. Components and processes affecting producibility and commerciality of shale resource systems. Geologica Acta, 12(4), pp.307–325.
Jarvie, D.M., 2012a. Shale Resource Systems for Oil and Gas: Part 1—Shale-gas Resource Systems J. A. Breyer, ed. Shale reservoirs—Giant resources for the 21st century, 97, pp.69–87.
Jarvie, D.M., 2012b. Shale Resource Systems for Oil and Gas: Part 2—Shale-oil Resource Systems. in J. A. Breyer, ed., Shale reservoirs—Giant resources for the 21st century: AAPG Memoir, 97, pp.89–119.
PhD Thesis | 2019
320
Jarvie, D.M. et al., 2007. Unconventional shale-gas systems: The Mississippian Barnett Shale of north-central Texas as one model for thermogenic shale-gas assessment. AAPG Bulletin, 91(4), pp.475–499.
Javadpour, F., 2009. Nanopores and apparent permeability of gas flow in mudrocks (shales and siltstone). Journal of Canadian Petroleum Technology, 48(8), pp.16–21.
Javadpour, F., Fisher, D. & Unsworth, M., 2007. Nanoscale gas flow in shale gas sediments. Journal of Canadian Petroleum Technology.
Jiao, K. et al., 2014. The characterization and quantitative analysis of nanopores in unconventional gas reservoirs utilizing FESEM–FIB and image processing: An example from the lower Silurian Longmaxi Shale, upper Yangtze region, China. International Journal of Coal Geology, 128–129, pp.1–11.
Johnson, H.D. & Baldwin, C.T., 1996. Shallow clastic seas H. G. Reading, ed. Sedimentary Environments: Processes, Facies and Stratigraphy, 3rd edition, pp.232–280.
Jones, B. & Manning, D.A.C., 1994. A comparison and correlation of different geochemical indices used for the interpretation of depositional environments in ancient mudstones. Chemical Geology, 111(1–4), pp.111–129. Available at: http://dx.doi.org/10.1016/0009-2541(94)90085-X.
Kammer, T.W. & Ausich, W.I., 2007. New cladid and flexible crinoids from the Mississippian (Tournaisian, Ivorian) of England and Wales. Palaeontology, 50(5), pp.1039–1050.
Kase, Y. et al., 2016. The use of microstructures for discriminating turbiditic and hemipelagic muds and mudstones. Sedimentology. Available at: http://doi.wiley.com/10.1111/sed.12296.
Katsube, T.J., 2000. Shale permeability and pore-structure evolution characteristics. Geological Survey of Canada, Current Re(2000-E15). Available at: http://www.nrcan.gc.ca/ gsc/bookstore.
Kazemi, M. & Takbiri-Borujeni, A., 2017. Multiscale Modeling of Gas Transport in Organic-Rich Shale: From Molecular Scale to Core Plug Scale.
Kelly, S. et al., 2016. Assessing the utility of FIB-SEM images for shale digital rock physics. Advances in Water Resources, 95.
Kimbell, S.F. et al., 1989. The structure and evolution of the Northumberland Trough from new seismic reflection data and its bearing on modes of continental extension. Journal of the Geological Society London, 146, pp.775–787.
Kineke, G.C. et al., 1996. Fluid-mud processes on the Amazon continental shelf. Continental Shelf Research, 16, pp.667–696.
Klaver, J. et al., 2015. BIB-SEM characterization of pore space morphology and distribution in postmature to overmature samples from the Haynesville and Bossier Shales. Marine and Petroleum Geology, 59, pp.451–466. Available at: http://dx.doi.org/10.1016/j.marpetgeo.2014.09.020.
Klaver, J. et al., 2016. BIB-SEM pore characterization of mature and post mature Posidonia Shale samples from the Hils area, Germany. International Journal of Coal

PhD Thesis | 2019
321
Geology, 158.
Knapp, L.J., McMillan, J.M. & Harris, N.B., 2017. A depositional model for organic-rich Duvernay Formation mudstones. Sedimentary Geology, 347.
Ko, L.T. et al., 2016. Pore and pore netwrok evolution of Upper Cretaceous Boquillas (Eagle Ford-equivalent) mudrocks: Results from gold-tube pyrolysis experiments. AAPG Bulletin.
Kranck, K., 1973. Flocculation of suspended sediment in the sea. Nature, London, 246, pp.348–350.
Kranck, K., 1975. Sediment deposition from flocculated suspensions. Sedimentology, 22, pp.111–123.
Kuila, U. et al., 2012. Compositional Controls on Mudrock Pore-Size Distribution: An Example from Niobrara Formation. SPE Annual Technical Conference and Exhibition, p.16. Available at: http://www.onepetro.org/doi/10.2118/160141-MS.
Kuila, U. et al., 2014. Nano-scale texture and porosity of organic matter and clay minerals in organic-rich mudrocks. Fuel, 135, pp.359–373. Available at: http://dx.doi.org/10.1016/j.fuel.2014.06.036.
Kuila, U. & Prasad, M., 2013a. Application of nitrogen gas-adsorption technique for characterization of pore structure of mudrocks. The Leading Edge, 32(12), pp.1478–1485.
Kuila, U. & Prasad, M., 2013b. Specific surface area and pore-size distribution in clays and shales. Geophysical Prospecting, 61(2), pp.341–362.
van de Lageweg, W.I. et al., 2018. Controls on mud distribution and architecture along the fluvial-to-marine transition. Geology, 46(11), pp.971–974.
Lampitt, R.S., 1985. Evidence for the seasonal deposition of detritus to the deep-sea floor and its subsequent resuspension. Deep-Sea Research, 22(8A), pp.885–897.
Lazar, O.R. et al., 2015. Capturing key attributes of fine-grained sedimentary rocks in outcrops, cores, and thin sections; nomenclature and description guidelines. Journal of Sedimentary Research, 85(3), pp.230–246.
Lazar, O.R. et al., 2010. Fine-grained rocks in outcrops: classification and description guidelines J. Schieber, O. R. Lazar, & K. M. Bohacs, eds. Sedimentology and Stratigraphy of Shales: Expressions and Correlation of Depositional Sequences in the Devonian of Tennessee, Kentucky, and Indiana, pp.3–14.
Leeder, M.R., 1988. Recent developments in Carboniferous geology: a critical review with implications for the British Isles and NW Europe. Proceedings of the Geologists’ Association, 99, pp.73–100.
Leeder, M.R., 1982. Upper Palaeozoic basins of the British Isles-Caledonide inheritance versus Hercynian plate margin processes. Journal of the Geological Society, London, 139(1980), pp.479–491. Available at: http://jgs.lyellcollection.org/content/139/4/479.full.pdf+html.
Leeder, M.R. & Gawthorpe, R.L., 1987. Sedimentary models for extensional tilt-block/half-graben basins. Geological Society, London, Special Publications, 28(1),
PhD Thesis | 2019
322
pp.139–152.
Liang, C. et al., 2016. Deep-water depositional mechanisms and significance for unconventional hydrocarbon exploration: A case study from the lower Silurian Longmaxi shale in the southeastern Sichuan Basin. AAPG Bulletin, 100(05), pp.773–794. Available at: http://search.datapages.com/data/doi/10.1306/02031615002.
Liu, K. et al., 2017. Nanoscale pore structure characterization of the Bakken shale in the USA. Fuel, 209.
Lobza, V. & Schieber, J., 1999. Biogenic sedimentary structures produced by worms in soupy, soft muds: observations from the Chattanooga Shale (Upper Devonian) and Experiments. Journal of Sedimentary Research1, 69(5), pp.1041–1049.
Löhr, S.C. et al., 2015. Is organic pore development in gas shales influenced by the primary porosity and structure of thermally immature organic matter? Organic Geochemistry, 87, pp.119–132.
Loucks, R.G. et al., 2009. Morphology, Genesis, and Distribution of Nanometer-Scale Pores in Siliceous Mudstones of the Mississippian Barnett Shale. Journal of Sedimentary Research, 79(12), pp.848–861. Available at: http://jsedres.sepmonline.org/content/79/12/848.abstract.
Loucks, R.G. et al., 2010. Preliminary Classification of Matrix Pores in Mudrocks. Gulf Coast Association of Geological Societies Transactions, 60(2), pp.435–441.
Loucks, R.G. et al., 2012. Spectrum of pore types and networks in mudrocks and a descriptive classification for matrix-related mudrock pores. AAPG Bulletin, 96(6), pp.1071–1098.
Loucks, R.G. & Ruppel, S.C., 2007. Mississippian Barnett Shale: Lithofacies and depositional setting of a deep-water shale-gas succession in the Fort Worth Basin, Texas. AAPG Bulletin, 91(4), pp.579–601.
Lowe, D.R., 1982. Sediment gravity flows: II Depositional models with special reference to the deposits of high-density turbidity currents. Journal of Sedimentary Reseach, 52(1).
Luffel, D.L. & Guidry, F.K., 1989. Reservoir rock properties of Devonian shale from core and log analysis. In Society of Core Analysts Conference.
Lundegard, P.D. & Samuels, N.D., 1980. Field classification of fine-grained sedimentary rocks. Journal of Sedimentary Petrology, 50, pp.781–786.
Ma, L., Fauchille, A.-L., et al., 2017. Correlative multi-scale imaging of shales: a review and future perspectives. Geological Society, London, Special Publications, 454(1), pp.175–199.
Ma, L., Taylor, K.G., et al., 2017. Multi-scale 3D characterisation of porosity and organic matter in shales with variable TOC content and thermal maturity: Examples from the Lublin and Baltic Basins, Poland and Lithuania. International Journal of Coal Geology, 180(August), pp.100–112.
Ma, L. et al., 2016. Novel 3D centimetre-to nano-scale quantification of an organic-rich mudstone: The Carboniferous Bowland Shale, Northern England. Marine and

PhD Thesis | 2019
323
Petroleum Geology, 72, pp.193–205. Available at: http://dx.doi.org/10.1016/j.marpetgeo.2016.02.008.
Macquaker, J.H.S. et al., 2014. Compositional controls on early diagenetic pathways in fine-grained sedimentary rocks: Implications for predicting unconventional reservoir attributes of mudstones. AAPG Bulletin, 98(3), pp.587–603.
Macquaker, J.H.S. & Adams, A.E., 2003. Maximizing information from fine-grained sedimentary rocks: an inclusive nomenclature for mudstones. Journal of Sedimentary Research, 73, pp.735–744.
Macquaker, J.H.S. & Adams, A.E., 2003. Maximizing Information from Fine-Grained Sedimentary Rocks: An Inclusive Nomenclature for Mudstones. Journal of Sedimentary Research.
Macquaker, J.H.S., Bentley, S.J. & Bohacs, K.M., 2010. Wave-enhanced sediment-gravity flows and mud dispersal across continental shelves: Reappraising sediment transport processes operating in ancient mudstone successions. Geology, 38, pp.947–950.
Macquaker, J.H.S. & Bohacs, K.M., 2007. On the accumulation of mud. Science, 318, pp.1734–1735.
Macquaker, J.H.S., Curtis, C.D. & Coleman, M.L., 1997. The role of iron in mudstone diagenesis: Comparison of Kimmeridge Clay Formation mudstones from onshore and offshore (UKCS) localities. Journal of Sedimentary Research, 67(5), pp.871–878.
Macquaker, J.H.S. & Gawthorpe, R.L., 1993. Mudstone lithofacies in the Kimmeridge Clay Formation, Wessex Basin, southern England; implications for the origin and controls of the distribution of mudstones. Journal of Sedimentary Research, 63(6), pp.1129–1143.
Macquaker, J.H.S. & Howell, J.K., 1999. Small-scale (<5.0 m) vertical heterogeneity in mudstones: Implications for high-resolution stratigraphy in siliciclastic mudstone successions. Journal of the Geological Society of London, 156, pp.105–112.
Macquaker, J.H.S., Taylor, K.G. & Gawthorpe, R.L., 2007. High-resolution facies analyses of mudstones: Implication for paleoenvironmental and sequence stratigraphic interpretations of offshore ancient mud-dominated successions. Journal of Sedimentary Research, 77, pp.324–339.
Madhavaraju, J. et al., 2016. Paleoclimate, paleoweathering and paleoredox conditions of Lower Cretaceous shales from the Mural Limestone, Tuape section, northern Sonora, Mexico: Constraints from clay mineralogy and geochemistry. , pp.1–15.
Mahamud, M.M. & García, V., 2018. Textural characterization of chars using fractal analysis of N2and CO2adsorption. Fuel Processing Technology, 169(July 2017), pp.269–279. Available at: http://dx.doi.org/10.1016/j.fuproc.2017.10.013.
Mandelbrot, B.B., 1982. The fractal geometry of nature, WH freeman New York.
Martire, L. et al., 2014. Selective dolomitization by syntaxial overgrowth around detrital dolomite nuclei: A case from the Jurassic of the Marguareis Ligurian Briançonnais (Ligurian Alps). Journal of Sedimentary Reseach, 84(October), pp.40–50.

PhD Thesis | 2019
324
Mason, G., 1982. The Effect of Pore-Space Connectivity on the Hysteresis of Capillary Condensation in Adsorption Desorption Isotherms. Journal.of.Colloid and.Interface Science, 88(1), pp.36–46.
McCave, I.N., 1972. Transport and escape of fine-grained sediment from shelf areas D. J. P. Swift, ed. Shelf Transport: Process and Pattern. Dowden, pp.225–248.
McCave, I.N., 1975. Vertical flux of particles in the ocean. Deep Sea Res, 22, pp.491–502.
McCave, I.N. & Jones, K.P.N., 1988. Deposition of ungraded muds from high-density non-turbulent turbidity currents. Nature, 333, pp.250–252.
McGlade, C., Speirs, J. & Sorrell, S., 2013. Unconventional gas - A review of regional and global resource estimates. Energy, 55, pp.571–584.
McIlroy, D., 2004. Ichnology and facies model of a tidedominated delta: Jurassic upper Ror and Ile formations of Kristin field, Halten Terrace, offshore mid-Norway D. McIlroy, ed. The application of ichnology to paleoenvironmental and stratigraphic analysis, 228, pp.237–272.
Melikoglu, M., 2014. Shale gas: Analysis of its role in the global energy market. Renewable and Sustainable Energy Reviews, 37, pp.460–468. Available at: http://dx.doi.org/10.1016/j.rser.2014.05.002.
Menning, M. et al., 2006. Global time scale and regional stratigraphic reference scales of Central and West Europe, East Europe, Tethys, South China, and North America as used in the Devonian-Carboniferous-Permian Correlation Chart 2003 (DCP 2003). Palaeogeography, Palaeoclimatology, Palaeoecology, 240(1–2), pp.318–372.
Michalopoulos, P. & Aller, R.C., 2004. Early diagenesis of biogenic silica in the Amazon delta: Alteration, authigenic clay formation, and storage. Geochimica et Cosmochimica Acta, 68(5), pp.1061–1085.
Michalopoulos, P., Aller, R.C. & Reeder, R.J., 2000. Conversion of diatoms to clays during early diagenesis in tropical, continental shell muds. Geology, 28(12), pp.1095–1098.
Miller, J. & Grayson, R.F., 1982. The Regional Context of Waulsortian Facies in Northern England K. Bolton, R. H. Lane, & D. V Le Mone, eds. Symposium on the paleoenvironmental setting and distribution of the Waulsortian facies, pp.17–33.
Milliken, K., 2014. A Compositional Classification For Grain Assemblages In Fine-Grained Sediments and Sedimentary Rocks. Journal of Sedimentary Research , 84(12), pp.1185–1199. Available at: http://jsedres.sepmonline.org/content/84/12/1185.abstract.
Milliken, K. et al., 2007. “Cherty” stringers in the Barnett Shale are agglutinated foraminifera. Sedimentary Geology, 198(3–4), pp.221–232.
Milliken, K.L., 2003. Diagenesis G. V Middleton, ed. Encyclopedia of Sediments and Sedimentary Rocks.
Milliken, K.L. et al., 2012. Grain assemblages and strong diagenetic overprinting in siliceous mudrocks, Barnett Shale (Mississippian), Fort Worth Basin, Texas. AAPG Bulletin, 96(8), pp.1553–1578.
Milliken, K.L. et al., 2013. Organic matter-hosted pore system, Marcellus Formation

PhD Thesis | 2019
325
(Devonian), Pennsylvania. AAPG Bulletin, 97(2), pp.177–200.
Milliken, K.L., 2013. SEM-based cathodoluminescence imaging for discriminating quartz types in mudrocks. Unconventional Resources Technology Conference, 1582467.
Milliken, K.L. & Curtis, M.E., 2016. Imaging pores in sedimentary rocks: Foundation of porosity prediction. Marine and Petroleum Geology, 73, pp.590–608. Available at: http://dx.doi.org/10.1016/j.marpetgeo.2016.03.020.
Milliken, K.L. & Day-Stirrat, R.J., 2013. Cementation in mudrocks: Brief review with examples from cratonic basin mudrocks. AAPG Memoir, 103, pp.133–150. Available at: http://archives.datapages.com/data/specpubs/memoir103/data/133_aapg-sp1930133.htm.
Milliken, K.L., Ergene, S.M. & Ozkan, A., 2016. Quartz types, authigenic and detrital, in the Upper Cretaceous Eagle Ford Formation, South Texas, USA. Sedimentary Geology, 339, pp.273–288.
Milliken, K.L. & Reed, R.M., 2010. Multiple causes of diagenetic fabric anisotropy in weakly consolidated mud, Nankai accretionary prism, IODP Expedition 316. Journal of Structural Geology, 32(12), pp.1887–1898. Available at: http://dx.doi.org/10.1016/j.jsg.2010.03.008.
Mondol, N.H. et al., 2007. Experimental mechanical compaction of clay mineral aggregates—Changes in physical properties of mudstones during burial. Marine and Petroleum Geology, 24, pp.289–311.
Montgomery, S.L. et al., 2005. Mississippian Barnett Shale, Fort Worth Basin, north-central Texas: Gas-shale play with multitrillion cubic foot potential. AAPG Bulletin, 89, pp.155–175.
Mulder, T. et al., 2017. Carbonate slope morphology revealing sediment transfer from bank-to-slope (Little Bahama Bank, Bahamas). Marine and Petroleum Geology, 83, pp.26–34. Available at: http://dx.doi.org/10.1016/j.marpetgeo.2017.03.002.
Mulder, T. & Etienne, S., 2010. Lobes in deep-sea turbidite systems: State of the art. Sedimentary Geology, 229(3), pp.75–80.
Mullen, J., 2010. Petrophysical Characterization of the Eagle Ford Shale in South Texas. Canadian Unconventional Resources & International Petroleum Conference held in Calgary, (October), pp.19–21.
Mullins, H.T. & Cook, H.E., 1986. Carbonate apron models: Alternatives to the submarine fan model for paleoenvironmental analysis and hydrocarbon exploration. Sedimentary Geology, 48(1–2), pp.37–79.
Mutti, E. & Ricci Lucchi, F., 1972. Le torbiditi dell’Appennino Settentrionale: Introduzione all’analisi di facies: Memoria Società Geologica Italiana, v. 11.
Nadeau, P.H. et al., 2002. I-S precipitation in pore space as the cause of geopressuring in Mesozoic mudstones, Egersund Basin, Norwegian continental shelf. American Mineralogist, 87(11–12), pp.1580–1589.
Nathan, Y. et al., 1997. Geochemistry of cadmium in the negev phosphorites. Chemical Geology.
PhD Thesis | 2019
326
Naveen, P., Asif, M. & Ojha, K., 2018. Integrated fractal description of nanopore structure and its effect on CH4 adsorption on Jharia coals, India. Fuel, 232(June), pp.190–204. Available at: https://doi.org/10.1016/j.fuel.2018.05.124.
Nelson, P.H., 2009. Pore-throat sizes in sandstones, tight sandstones, and shales. AAPG Bulletin, 93(3), pp.329–340.
Neuzil, C.E., 2013a. Can Shale Safely Host U.S. Nuclear Waste? Trans. Am. Geophys. Union, 94(30), pp.261–262. Available at: http://doi.wiley.com/10.1002/2013EO300001.
Neuzil, C.E., 2013b. Can Shale Safely Host U . S . Nuclear Waste ? , 94(30).
Newport, S.M. et al., 2017. Sedimentology and microfacies of a mud-rich slope succession: in the Carboniferous Bowland Basin, NW England (UK). Journal of the Geological Society, London, (Gawthorpe 1987), p.16pp. Available at: http://jgs.lyellcollection.org/content/jgs/early/2017/11/09/jgs2017-036.full.pdf.
Nichols, G., 2009. Sedimentology and Stratigraphy 2nd ed., Wiley-Blackwell.
Nittrouer, C.A. & Sternberg, R.W., 1981. The formation of sedimentary strata in an allochthonous shelf environment: The Washington continental-shelf. Marine Geology, 42, pp.201–232.
Nole, M. et al., 2016. A method for estimating microporosity of fine-grained sediments and sedimentary rocks via scanning electron microscope image analysis. Sedimentology, pp.1507–1521.
Normark, W.R., 1970. Growth patterns of deep- sea fans. American Association of Petroleum Geologists Bulletin, 54(11), pp.2170–2195.
O’Brien, N.R. & Slatt, R.M., 1990. Argillaceous rock atlas, New York: Springer-Verlag.
Ogston, A.S. et al., 2000. Observations of storm and river flood-driven sediment transport on the northern California continental shelf. Continental Shelf Research, 20, pp.2141–2162.
Passey, Q.R. et al., 2010. From Oil-Prone Source Rock to Gas-Producing Shale Reservoir – Geologic and Petrophysical Characterization of Unconventional Shale-Gas Reservoirs. CPS/SPE International Oil & Gas Conference and Exhibition in China 2010, pp.1707–1735.
Payros, A. & Pujalte, V., 2008. Calciclastic submarine fans: An integrated overview. Earth-Science Reviews, 86(1–4), pp.203–246.
Payros, A., Pujalte, V. & Orue-etxebarria, X., 2007. A point-sourced calciclastic submarine fan complex (Eocene Anotz Formation, western Pyrenees): Facies architecture, evolution and controlling factors. Sedimentology, 54(1), pp.137–168.
Peltonen, C.B. et al., 2008. Clay mineral diagenesis and quartz cementation in mudstones: The effects of smectite to illite reaction on rock properties. Marine and Petroleum Geology, 26(6), pp.887–898.
Pettijohn, F.J., 1975. Sedimentary rocks, New York: Harper and Row.
Pfeifer, P. et al., 1989. Multilayer adsorption on a fractally rough surface. Physical Review Letters, 62(17), pp.1997–2000.

PhD Thesis | 2019
327
Pfeifer, P. & Avnir, D., 1983. Chemistry in noninteger dimensions between two and three. I. Fractal theory of heterogeneous surfaces. The Journal of Chemical Physics, 79(7), pp.3558–3565.
Piper, D.Z. & Dean, W.E., 2002. Trace-Element Deposition in the Cariaco Basin, Venezuela Shelf, under Sulfate-Reducing Conditions—a History of the Local Hydrography and Global Climate, 20 ka to the Present. USGS, Profession, pp.1–45. Available at: http://geopubs.wr.usgs.gov/prof-paper/pp1670/pp1670.pdf.
Piper, D.Z. & Perkins, R.B., 2004. A modern vs. Permian black shale - the hydrography, primary productivity, and water-column chemistry of deposition. Chemical Geology, 206(3–4), pp.177–197.
Plint, A.G., Macquaker, J.H.S. & Varban, B.L., 2012. Bedload Transport of Mud Across A Wide, Storm-Influenced Ramp: Cenomanian–Turonian Kaskapau Formation, Western Canada Foreland Basin. Journal of Sedimentary Research , 82(11), pp.801–822. Available at: http://jsedres.sepmonline.org/content/82/11/801.abstract.
Pollastro, R.M., 1981. Authigenic Kaolinite and Associated Pyrite in Chalk of the Cretaceous Niobrara Formation, Eastern Colorado. Journal of Sedimentary Research, Vol. 51(2), pp.553–562. Available at: http://jsedres.sepmonline.org/cgi/doi/10.1306/212F7CD4-2B24-11D7-8648000102C1865D.
Pomar, L., 2001. Types of carbonate platforms: a genetic approach. Basin Research, 13(3), pp.313–334.
Pomar, L., Brandano, M. & Westphal, H., 2004. Environmental factors influencing skeletal grain sediment associations: a critical review of Miocene examples from the western Mediterranean. Sedimentology, 51(3), pp.627–651.
Pommer, M. & Milliken, K., 2015. Pore types and pore-size distributions across thermal maturity, Eagle Ford Formation, southern Texas. AAPG Bulletin, 99(9).
Potter, P.E., 1998. Shale-rich basins: controls and origin J. Schieber, W. Zimmerle, & P. S. Sethi, eds. Shale and Mudstones I. Basin studies, Sedimentology and Palaeontology, pp.21–32.
Potter, P.E., Maynard, J.B. & Depetris, P.J., 2005. Mud and mudstones: Introduction and overview, Berlin, Germany: Springer.
Potter, P.E., Maynard, J.B. & Pryor, W.A., 1980. Sedimentology of shale, New York: Springer-Verlag.
Powell, J. et al., 2010. Managing radioactive waste safely: initial geological unsuitability screening of West Cumbria. British geological survey.
Principaud, M. et al., 2018. Recent morphology and sedimentary processes along the western slope of Great Bahama Bank (Bahamas). Sedimentology, 65(6), pp.2088–2116.
Quine, M. & Bosence, D., 1991. Stratal geometries, facies and sea-floor erosion in Upper Cretaceous Chalk, Normandy, France. Sedimentology, 38, pp.1113–1152.
Radlinski, A.P. et al., 2004. Application of SAXS and SANS in evaluation of porosity, pore

PhD Thesis | 2019
328
size distribution and surface area of coal. International Journal of Coal Geology.
Radwan, O., Bu Khamsin, A. & Al-Ramadan, K., 2017. Detrital dolomite: Characterization and characteristics. Geological Quarterly, 62(1), pp.81–89.
Raiswell, R., 1982. Pyrite texture, Isotopic Composition and the Availability of Iron. American Journal of Science, 282, pp.1244–1263.
Raiswell, R. & Canfield, D.E., 1998. Sources of iron for pyrite formation in marine sediments. American Journal of Science, 298(3), pp.219–245.
Reijmer, J.J. et al., 2002. Bahamian carbonate platform development in response to sea-level changes and the closure of the Isthmus of Panama. International Journal of Earth Sciences, 91(3), pp.482–489.
Reijmer, J.J.G. et al., 2015. Calciturbidites and calcidebrites: Sea-level variations or tectonic processes? Sedimentary Geology, 317, pp.53–70. Available at: http://dx.doi.org/10.1016/j.sedgeo.2014.10.013.
Rickard, D., 1997. Kinetics of pyrite formation by the H2S oxidation of iron (II) monosulfide in aqueous solutions between 25 and 125°C: The rate equation. Geochimica et Cosmochimica Acta, 61(1), pp.115–134.
Riley, N.J., 1993. Dinantian (Lower Carboniferous) biostratigraphy and chronostratigraphy in the British Isles. Journal of the Geological Society London, 150(3), pp.427–446.
Riley, N.J., 1990. Stratigraphy of the Worston Shale Group (Dinantian), Craven Basin, north-west England. Proceedings of the Yorkshire Geological Society, 48(2), pp.163–187.
Rimstidt, J.D., Chermak, J.A. & Schreiber, M.E., 2017. Processes that control mineral and element abundances in shales. Earth-Science Reviews, 171(September 2016), pp.383–399. Available at: http://linkinghub.elsevier.com/retrieve/pii/S0012825216302860.
Ross, D.J.K. & Marc Bustin, R., 2009. The importance of shale composition and pore structure upon gas storage potential of shale gas reservoirs. Marine and Petroleum Geology, 26(6), pp.916–927. Available at: http://dx.doi.org/10.1016/j.marpetgeo.2008.06.004.
Rouquerol, F. et al., 2013. Introduction. Adsorption by Powders and Porous Solids: Principles, Methodology and Applications: Second Edition, pp.1–24.
Rouquerol, F., Rouquerol, J. & Sing, K., 1999. Chapter 3 - Methodology of Adsorption at the Gas-Solid Interface. In Adsorption by Powders and Porous Solids. pp. 51–92. Available at: http://www.sciencedirect.com/science/article/pii/B978012598920650004X%5CnC:%5CUsers%5CFranta Pepa Jedni?ka%5CAppData%5CRoaming%5CMozilla%5CFirefox%5CProfiles%5C5vws6fbr.default%5Czotero%5Cstorage%5CD3GABSID%5CB978012598920650004X.html.
Rouquerol, J. et al., 2013. Adsorption by Powders and Porous Solids: Principles, Methodology and Applications: Second Edition,

PhD Thesis | 2019
329
Rouquerol, J., Avnir, D., Fairbridge, C.W., Everett, D.H., Haynes, J.H., Pernicone, N., Ramsay, J.D.F., et al., 1994. Recommendations for the characterization of porous solids. Pure and Applied Chemistry, 66(8), pp.1739–1758. Available at: http://iupac.org/publications/pac/66/8/1739/.
Rouquerol, J., Avnir, D., Fairbridge, C.W., Everett, D.H., Haynes, J.H., Pernicone, N., Sing, J.D.F., et al., 1994. Recommendations for the characterization of porous solids. Pure and Applied Chemistry, 66, pp.1739–1758.
Rouquerol, J., Llewellyn, P. & Rouquerol, F., 2007. Is the BET equation applicable to microporous adsorbents? Studies in Surface Science and Catalysis, 160, pp.49–56. Available at: http://www.sciencedirect.com/science/article/pii/S0167299107800085.
Rybacki, E., Meier, T. & Dresen, G., 2016. What controls the mechanical properties of shale rocks? - Part II: Brittleness. Journal of Petroleum Science and Engineering, 144, pp.39–58. Available at: http://dx.doi.org/10.1016/j.petrol.2016.02.022.
Sahouli, B., Blacher, S. & Brouers, F., 1997. Applicability of the fractal FHH equation. Langmuir, 13(16), pp.4391–4394.
Savary, B., 2005. Calcareous turbidity current emplacement as an initiation mechanism for substrate brecciation and deformation. Geological Society, London, Special Publications, 244(1), pp.207–220.
Savary, B. & Ferry, S., 2004. Geometry and petrophysical parameters of a calcarenitic turbidite lobe (Barremian-Aptian, Pas-de-la-Cluse, France). Sedimentary Geology, 168(3–4), pp.281–304.
Savary, B., Olivero, D. & Gaillard, C., 2004. Calciturbidite dynamics and endobenthic colonisation: Example from a late Barremian (Early Cretaceous) succession in southeastern France. Palaeogeography, Palaeoclimatology, Palaeoecology, 211(3–4), pp.221–239.
Sawlowicz, Z., 1993. Pyrite framboids and their development: a new conceptual mechanism. Geologische Rundschau, 82(1), pp.148–156.
Saxena, C.B.M.P.S., 2000. Carbonate shedding and sedimentary cyclicities of a distally.pdf. , pp.140–153.
Schepers, K.C. et al., 2009. Reservoir Modeling and Simulation of the Devonian Gas Shale of Eastern Kentucky for Enhanced Gas Recovery and CO 2 Storage. SPE Journal, pp.10–11.
Schieber, J., 2010. Common Themes in the Formation and Preservation of Intrinsic Porosity in Shales and Mudstones - Illustrated with Examples Across the Phanerozoic.
Schieber, J., 1999. Distribution and deposition of mudstone facies in the Upper Devonian Sonyea Group of New York. Journal of Sedimentary Research, 69(4), pp.909–925.
Schieber, J., 2016a. Experimental testing of the transport-durability of shale lithics and its implications for interpreting the rock record. Sedimentary Geology, 331, pp.162–169.

PhD Thesis | 2019
330
Schieber, J., 2011. Marcasite in Black Shales--a Mineral Proxy for Oxygenated Bottom Waters and Intermittent Oxidation of Carbonaceous Muds. Journal of Sedimentary Research, 81(7), pp.447–458. Available at: http://jsedres.sepmonline.org/cgi/doi/10.2110/jsr.2011.41.
Schieber, J., 2016b. Mud re-distribution in epicontinental basins - Exploring likely processes. Marine and Petroleum Geology, 71, pp.119–133. Available at: http://dx.doi.org/10.1016/j.marpetgeo.2015.12.014.
Schieber, J., 2013. SEM Observations on Ion-milled Samples of Devonian Black Shales from Indiana and New York: The Petrographic Context of Multiple Pore Types. Electron microscopy of shale hydrocarbon reservoirs: AAPG Memoir 102, (April 2010), pp.153–172.
Schieber, J. & Bennett, R., 2013. Bedload transport of mud across a wide, storm-influenced ramp: Cenomanian–Turonian Kaskapau Formation, western Canada foreland basin—Discussion. Journal of Sedimentary Research, 83(12), pp.1198–1199.
Schieber, J. & Riciputi, L., 2005. Pyrite and Marcasite Coated Grains in the Ordovician Winnipeg Formation, Canada: An Intertwined Record of Surface Conditions, Stratigraphic Condensation, Geochemical “Reworking,” and Microbial Activity. Journal of Sedimentary Research, 75(5), pp.907–920. Available at: http://jsedres.sepmonline.org/cgi/doi/10.2110/jsr.2005.070.
Schieber, J., Southard, J. & Thaisen, K., 2007. Accretion of mudstone beds from migrating floccule ripples. Science , 318, pp.1760–1763.
Schieber, J., Southard, J.B. & Schimmelmann, A., 2010. Lenticular Shale Fabrics Resulting from Intermittent Erosion of Water-Rich Muds--Interpreting the Rock Record in the Light of Recent Flume Experiments. Journal of Sedimentary Research, 80(1), pp.119–128. Available at: http://jsedres.sepmonline.org/cgi/doi/10.2110/jsr.2010.005.
Scholle, P.A. & Ulmer-Scholle, D.S., 2003. A Color Guide to the Petrography of Carbonate Rocks: Grains, textures, porosity, diagenesis. Aapg Memoir, 77, p.460.
Schön, J.H., 2015. Physical properties of rocks: Fundamentals and principles of petrophysics, Elsevier.
Schoonen, M.A.A. & Barnes, H.L., 1991. Reactions forming pyrite and marcasite from solution: I. Nucleation of FeS2below 100°C. Geochimica et Cosmochimica Acta, 55(6), pp.1495–1504.
Shanmugam, G., 2000. 50 Years of the Turbidite Paradigm (1950S-1990S): Deep Water Processes and Facies Models - a Critical Perspective. Mar. Pet. Geol., 17(2), pp.285–342.
Shanmugam, G., 2017. Global case studies of soft-sediment deformation structures (SSDS): Definitions, classifications, advances, origins, and problems. Journal of Palaeogeography, 6(4), pp.251–320.
Shanmugam, G., 1997. The Bouma sequence and the turbidite mind set. Earth-Science Reviews, 42(4), pp.201–229.

PhD Thesis | 2019
331
Shaw, H.F. & Primmer, T.J., 1991. Diagenesis of mudrocks from the Kimmeridge Clay Formation of the Brae Area, U.K. North Sea. Marine Petrology Geol, 8, pp.270–277.
Shepard, F.P., 1954. Nomenclature based on sand-silt-clay ratios: Journal Sedimentary Petrology. , 24, pp.151–158.
Silver, M.W., Shanks, a L. & Trent, J.D., 1978. Marine snow: microplankton habitat and source of small-scale patchiness in pelagic populations. Science (New York, N.Y.), 201(4353), pp.371–373. Available at: http://www.sciencemag.org/cgi/doi/10.1126/science.201.4353.371.
Sing, K.S.W. et al., 2013. Chapter 8. Assessment of Mesoporosity. In Adsorption by Powders and Porous Solids: Principles, Methodology and Applications.
Sing, K.S.W. et al., 1985. International union of pure and applied chemistry physical chemistry division reporting physisorption data for gas/soils systems with special reference to the determination of surface area and porosity. Pure Appl. Chemistry, 57(4), pp.603–619.
Slatt, R.M., 2011. Important geological properties of unconventional resource shales. Central European Journal of Geosciences, 3(4), pp.435–448. Available at: http://www.degruyter.com/view/j/geo.2011.3.issue-4/s13533-011-0042-2/s13533-011-0042-2.xml.
Slatt, R.M. et al., 2012. Pore-to-regional-scale integrated characterization workflow for unconventional gas shales J. A. Breyer, ed. Shale reservoirs-Giant resources for the 21st century, 97, pp.127–150.
Slatt, R.M. & O’Brien, N.R., 2011a. Geological properties of unconventional resource shales I: pore types. Report, (December), pp.1–17. Available at: http://shale-consortium.com/docs/Report_Eagle_Ford_Laluna_Woodford.pdf.
Slatt, R.M. & O’Brien, N.R., 2013. Microfabrics Related to Porosity Development, Sedimentary and Diagenetic Processes, and Composition of Unconventional Resource Shale Reservoirs as Determined by Conventional Scanning Electron Microscopy. In Electron microscopy of shale hydrocarbon reservoirs: AAPG Memoir 102. pp. 37–44.
Slatt, R.M. & O’Brien, N.R., 2011b. Pore types in the Barnett and Woodford gas shales: Contribution to understanding gas storage and migration pathways in fine-grained rocks. AAPG Bulletin, 95(12), pp.2017–2030.
Slaughter, M. & Hill, R.J., 1991. THE INFLUENCE OF ORGANIC MATTER IN ORGANOGENIC DOLOMITIZATION. Journal of Sedimentary Petrology, 61(2), pp.296–303.
Soeder, D.J., 2018. The successful development of gas and oil resources from shales in North America. Journal of Petroleum Science and Engineering, 163, pp.399–420.
Soeder, D.J., 2017. Unconventional: The Development of Natural Gas from the Marcellus Shale; Product Code: SPE527; Published: March 27, 2017; Author: Daniel J. Soeder; ISBN Number: 978-0-8137-2527-7, National Energy Technology Lab.(NETL), Pittsburgh, PA, and Morgantown, WV ….
Sondergeld, C.H. et al., 2010. Micro-structural studies of gas shales. Society of Petroleum

PhD Thesis | 2019
332
Engineers Unconventional Gas Conference, SPE Paper 131771, p.17.
Song, W. et al., 2018. Pore-scale numerical investigation into the impacts of the spatial and pore-size distributions of organic matter on shale gas flow and their implications on multiscale characterisation. Fuel.
Soper, N.J., Webb, B.C. & Woodcock, N.H., 1987. Late Caledonian (Acadian) transgression in North West England: timing, geometry and geotcctonic significance. Proceedings of the Yorkshire Geological Society, 46, pp.175–192.
Spinelli, G.A. et al., 2007. Diagenesis, sediment strength, and pore collapse in sediment approaching the Nankai Trough subduction zone. Bulletin of the Geological Society of America, 119(3–4), pp.377–390.
Stanjek, H. & Häusler, W., 2004. Basics of X-ray Diffraction. Hyperfine Interactions, 154(1–4), pp.107–119.
Stephenson, M., 2015. Shale gas and fracking: The science behind the controversy, Elsevier.
Stow, D.A. V. & Piper, D.J.W., 1984. Deep-water fine-grained sediments: facies models. Geological Society, London, Special Publications, 15(1), pp.611–646. Available at: http://sp.lyellcollection.org/lookup/doi/10.1144/GSL.SP.1984.015.01.38.
Stow, D.A. V, 1981. Fine-grained sediments: Terminology. Quarterly Journal of Engineering Geology, London, 14, pp.243–244.
Stow, D.A. V & Mayall, M., 2000. Deep-water sedimentary systems: new models for the 21st century. Marine and Petroleum Geology, 17(2), pp.125–135.
Stow, D.A. V, Reading, H.G. & Collinson, J.D., 1996. Deep Seas H. G. Reading, ed. Sedimentary Environments: Processes, Facies and Stratigraphy, 3rd edition, pp.395–453.
Stow, D.A. V & Shanmugam, G., 1980. Sequence of structures in fine-grained turbidites: Comparison of recent deep-sea and ancient flysch sediments. Sedimentary Geology, 25(1–2), pp.23–42.
Sumner, E.J., Talling, P.J. & Amy, L.A., 2009. Deposits of flows transitional between turbidity current and debris flow. Geology, 37(11), pp.991–994.
Swift, D.J.P. & Thorne, J.A., 1991. Sedimentation on continental margins, 1: a general model for shelf sedimentation D. J. Swift et al., eds. Shelf Sand and Sandstone Bodies; Geometry, Facies and Sequence Stratigraphy, pp.3–31.
Talbot, M.R. & Allen, P.A., 1996. Lakes H. G. Reading, ed. Sedimentary Environments: Processes, Facies and Stratigraphy, 3rd edition, pp.83–124.
Talling, P.J. et al., 2012. Subaqueous sediment density flows: Depositional processes and deposit types. Sedimentology, 59(7), pp.1937–2003.
Taylor, G.H. et al., 1998. Organic petrology.
Taylor, K.G. et al., 2000. Carbonate cementation in a sequence-stratigraphic framework: upper Cretaceous sandstones, Book Cliffs, Utah-Colorado. Journal of Sedimentary Research, 70, pp.360–372.

PhD Thesis | 2019
333
Taylor, K.G. et al., 2002. Stratigraphic significance of ooidal ironstones from the Cretaceous Western Interior Seaway: the Peace River Formation, Alberta and the Castlegate Sandstone, Utah. Journal of Sedimentary Research, 72, pp.345–356.
Taylor, K.G. & Gawthorpe, R.L., 2003. Basin-scale dolomite cementation of shoreface sandstones in response to sea-level fall. Bulletin of the Geological Society of America, 115(10), pp.1218–1229.
Taylor, K.G. & Macquaker, J.H.S., 2014. Diagenetic alterations in a silt- and clay- rich mudstone succession: an example from the Upper Cretaceous Mancos Shale of Utah, USA. Clay Minerals, 49, pp.245–259.
Taylor, K.G. & Macquaker, J.H.S., 2014. Diagenetic alterations in a silt- and clay-rich mudstone succession: An example from the Upper Cretaceous Mancos Shale of Utah, USA. Clay Minerals, 49, pp.213–227.
Taylor, K.G. & Macquaker, J.H.S., 2000. Early diagenetic pyrite morphology in a mudstone-dominated succession: The Lower Jurassic Cleveland Ironstone Formation, eastern England. Sedimentary Geology, 131(1–2), pp.77–86.
Thyberg, B. et al., 2010. Quartz cementation in Late Cretaceous mudstones, northern North Sea: Changes in rock properties due to dissolution of smectite and precipitation of micro-quartz crystals. Marine and Petroleum Geology, 27(8), pp.1752–1764. Available at: http://dx.doi.org/10.1016/j.marpetgeo.2009.07.005.
Thyberg, B. & Jahren, J., 2011. Quartz cementation in mudstones: sheet-like quartz cement from clay mineral reactions during burial. Petroleum Geoscience, 17(1), pp.53–63. Available at: http://pg.lyellcollection.org/cgi/doi/10.1144/1354-079310-028.
Tissot, B.P. & Welte, D.H., 1978. Petroleum Formation and Occurrence: a new approach to oil and gas exploration, New York: Springer-Verlag.
Tournadour, E. et al., 2015. Origin and architecture of a Mass Transport Complex on the northwest slope of Little Bahama Bank (Bahamas): Relations between off-bank transport, bottom current sedimentation and submarine landslides. Sedimentary Geology, 317, pp.9–26. Available at: http://dx.doi.org/10.1016/j.sedgeo.2014.10.003.
Tournadour, E. et al., 2017. Submarine canyon morphologies and evolution in modern carbonate settings: The northern slope of Little Bahama Bank, Bahamas. Marine Geology, 391(July), pp.76–97. Available at: http://dx.doi.org/10.1016/j.margeo.2017.07.014.
Tourtelot, H.A., 1960. Origin and use of the word “shale.” American Journal of Science, Bradley Volume, 258–A, pp.335–343.
Tribovillard, N. et al., 2004. Deep-water anoxia over the Frasnian-Famennian boundary (La Serre, France): A tectonically induced oceanic anoxic event? Terra Nova, 16(5), pp.288–295.
Tribovillard, N. et al., 2006. Trace metals as paleoredox and paleoproductivity proxies: An update. Chemical Geology, 232(1–2), pp.12–32.
Twenhofel, W.H., 1937. Terminology of the fine grained mechanical sediments. Report of
PhD Thesis | 2019
334
Committee on Sedimentation 1936-1937: National Research Council washington, D.C., 5, pp.81–104.
Tyson, R. V, 1995. Sedimentary organic matter: Organic facies and palynofacies, London: Chapman and Hall.
Uchman, A. & Wetzel, A., 2012. Deep-Sea Fans. Developments in Sedimentology, 64, pp.643–671.
Uchman, A. & Wetzel, A., 2011. Deep-sea ichnology: The relationships between depositional environment and endobenthic organisms 1st ed., Elsevier B.V. Available at: http://dx.doi.org/10.1016/B978-0-444-53000-4.00008-1.
Udden, J.A., 1898. The Mechanical Composition of Wind Deposits,
USEIA, 2013. Technically recoverable shale oil and shale gas resources: an assessment of 137 shale formations in 41 countries outside the United States. United States Energy Information Administration. Independent Statistics & Analysis, U.S. Department of Energy. Available at: http://www.eia.gov/analysis/studies/worldshalegas/.
Vigorito, M., Murru, M. & Simone, L., 2005. Anatomy of a submarine channel system and related fan in a foramol/rhodalgal carbonate sedimentary setting: A case history from the Miocene syn-rift Sardinia Basin, Italy. Sedimentary Geology, 174(1–2), pp.1–30.
Vigorito, M., Murru, M. & Simone, L., 2006. Architectural patterns in a multistorey mixed carbonate-siliciclastic submarine channel, Porto Torres Basin, Miocene, Sardinia, Italy. Sedimentary Geology, 186(3–4), pp.213–236.
Walderhaug, O. & Bjorkum, P.A., 2003. The Effect of Stylolite Spacing on Quartz Cementation in the Lower Jurassic Sto Formation, Southern Barents Sea. Journal of Sedimentary Research, 73(2), pp.146–156. Available at: https://pubs.geoscienceworld.org/jsedres/article/73/2/146-156/99285.
Wang, J., Ryan, D. & Anthony, E.J., 2011. Reducing the greenhouse gas footprint of shale gas. Energy Policy, 39(12), pp.8196–8199. Available at: http://dx.doi.org/10.1016/j.enpol.2011.10.013.
Wang, Z. et al., 2018. Characteristics of microscopic pore structure and fractal dimension of bituminous coal by cyclic gas adsorption/desorption: An experimental study. Fuel, 232(June), pp.495–505. Available at: https://doi.org/10.1016/j.fuel.2018.06.004.
Warrick, J.A. & Milliman, J.D., 2003. Hyperpycnal sediment discharge from semiarid southern California rivers: Implications for coastal sediment budgets. GSA Geology, 31(9), pp.781–784.
Waters, C.N. et al., 2009. A lithostratigraphical framework for the Carboniferous successions of northern Great Britain (onshore). British Geological Survey Research Report RR/09/01.
Waters, C.N. et al., 2011. Craven Basin and southern Pennines. In C. N. Waters, ed. A revised correlation of Carboniferous rocks in the British Isles. London: Geological Society (London) Special Report, pp. 74–81.

PhD Thesis | 2019
335
Waters, C.N. & Condon, D.J., 2013. Nature and timing of Late Mississippian to Mid-Pennsylvanian glacio-eustatic sea-level changes of the Pennine Basin, UK: Discussion Reply. Journal of the Geological Society, 170(5), pp.850–850. Available at: http://jgs.lyellcollection.org/lookup/doi/10.1144/jgs2013-055.
Weiss, H.M. et al., 2006. The Norwegian Industry Guide to Organic Geochemical Analyses [online]. Edition 4.0 Norsk Hydro Statoil, Geolab Nor. SINTEF Petroleum Research and the Norwegian Petroleum Directorate. Available at: http://www.npd.no/engelsk/nigoga/default.htm.
Welton, J.E., 2003. SEM petrology atlas,
Wentworth, C.K., 1922. A scale of grade and class terms for clastic sediments. Journal of Geology, Chicago, 30, pp.377–392.
Weser, O.E., 1974. Sediment classification based on Deep Sea Drilling Project drilling. Geological Society of America, Program with Abstract, 6, pp.1073–1074.
Wilkin, R.T., 2003. Sulfide minerals in sediments. In G. V. Middleton, ed. Encyclopedia of Sediments and Sedimentary Rocks. New York: Kluwer Academic Publishers, p. 701–703. Available at: https://doi.org/10.1007/978-1-4020-3609-5_228.
Wilkin, R.T., Arthur, M.A. & Dean, W.E., 1997. History of water-column anoxia in the Black Sea indicated pyrite framboid size distributions. Earth and Planetary Science Letters, 148, pp.517–525.
Wilkin, R.T., Barnes, H.L. & Brantley, S.L., 1996. The size distribution of framboidal pyrite in modern sediments: An indicator of redox conditions. Geochimica et Cosmochimica Acta, 60(20), pp.3897–3912.
Williams, K.E., 2012. The Permeability of Overpressure Shale Seals and of Source Rock Reservoirs is the Same.
Wilson, R.D. & Schieber, J., 2014. Muddy Prodeltaic Hyperpycnites In the Lower Genesee Group of Central New York, USA: Implications For Mud Transport In Epicontinental Seas. Journal of Sedimentary Research, 84(10).
Worden, R. & Morad, S., 2003. Clay mineral cements in sandstones,
Wright, A.M., Ratcliffe, K.T. & Spain, D., 2010. Application of Inorganic Whole Rock Geochemistry to Shale Resource Plays. Canadian Unconventional Resources & International Petroleum Conference, (October), pp.19–21.
Wright, J., 2001. Making loess-size quartz silt: Data from laboratory simulations and implications for sediment transport pathways and the formation of “desert” loess deposits associated with the Sahara. Quaternary International, 76/77, pp.7–19.
Wright, L.D. & Friedrichs, C.T., 2006. Gravity-driven sediment transport on continental shelves: A status report. Continental Shelf Research , 26, pp.2092–2107.
Wright, V.P., 1994. Early Carboniferous carbonate systems: an alternative to the Cainozoic paradigm. Sedimentary Geology, 93(1–2), pp.1–5.
Wright, V.P. & Burchette, T.P., 1996. Shallow-water Carbonate Environment. In H. G. Reading, ed. Sedimentary Environments: Processes, Facies and Stratigraphy, 3rd edition. Blackwell Publishing, p. 688.

PhD Thesis | 2019
336
Wright, V.P. & Faulkner, T.J., 1990. Sediment dynamics of Early Carboniferous ramps: a proposal. Geol. J., 25(051), pp.139–144.
Wu, M.K., 1996. The roughness of aerosol particles: Surface fractal dimension measured using nitrogen adsorption. Aerosol Science and Technology, 25(4), pp.392–398.
Wunsch, M. et al., 2017. Sedimentary dynamics along carbonate slopes (Bahamas archipelago). Sedimentology, 64(3), pp.631–657.
Wust, R.A.J. et al., 2013. Vitrinite reflectance versus pyrolysis Tmax data: Assessing thermal maturity in shale plays with special reference to the Duvernay shale play of the Western Canadian Sedimentary Basin, Alberta, Canada. SPE Unconventional Resources Conference and Exhibition-Asia Pacific, pp.1–11. Available at: http://www.onepetro.org/doi/10.2118/167031-MS.
Yao, Y. et al., 2008. Fractal characterization of adsorption-pores of coals from North China: An investigation on CH4 adsorption capacity of coals. International Journal of Coal Geology, 73(1), pp.27–42.
Yawar, Z. & Schieber, J., 2017. On the origin of silt laminae in laminated shales. Sedimentary Geology, 360.

PhD Thesis | 2019
337
Chapter 6 Summary, conclusion & future work

PhD Thesis | 2019
338
6 Summary, conclusion & future work
This chapter summarises the research findings and brings together the main ideas
presented in the preceding chapters. It documents how the project aims have been
addressed while drawing conclusions on the wider implication of the studies.
Recommendations for future research are also outlined that address unanswered
questions that were developed over the course of the study.
Summary of Results and Implications
This research was undertaken to examine the sedimentological variation, diagenetic
evolution and porosity characterisation of the carbonate- and siliciclastic-rich shale gas
reservoir prospect in the UK Bowland Basin. The overall research followed the workflow-
approach outlined in Chapter 1. After a comprehensive understanding of mudstones and
the study area from published literature, three questions were identified and developed
into three studies (Chapters 3, 4 and 5).
6.1.1 Study 1 (Chapter 3): A characterisation of sedimentary facies and
depositional controls of the studied succession
The overarching aim of the study presented in chapter 3 was to understand the lateral
and vertical sedimentological variations in the study area. It provided an insight into the
facies of the Hodder Mudstone and the facies variability of samples from the studied
borehole cores. Earlier studies had developed different depositional models for the
Bowland Basin (Gawthorpe 1986; Newport et al. 2017). However, due to recent advances
in the understanding of carbonate clastic (calciclastic) gravity flow deposition, the
controlling factors for the sedimentary processes involved in the deposition of the
studied mud-rich sediment needed to be re-evaluated. These processes have implications
in the understanding and prediction of laminae- to bed-scale facies variation.

PhD Thesis | 2019
339
Using core description and petrographic data, a series of research objectives were
developed to address the questions in Chapter 3. These objectives included (1)
highlighting sedimentological evidences for calciclastic deposition within the units; (2)
to review the depositional processes responsible for the distribution of facies in a current
context of calciclastic sediment gravity (density) flow deposits; and (3) to produce a
conceptual depositional model for the mud-rich calciclastic facies of the Lower
Carboniferous Bowland Basin. Since the understanding and documentation of ancient
calciclastic submarine fan systems are still lacking in comparison with siliciclastic
equivalents, this study documented evidence for a calciclastic submarine fan system.
Seven distinct facies were recognised with sedimentary features typical of submarine
gravity flow deposits. The facies included: F1- Wavy-laminated, gravel-to-sand
(bioclastic) and silt-rich limestone; F2- Poorly-laminated, bioturbated, silt-rich and sand
(bioclastic)-bearing limestone; F3- Unlaminated sand- and silt-rich arenite; F4-
Unlaminated clay-dominated mudstone; F5- Parallel, planar-laminated to convoluted
silt- and clay-rich mudstone; F6- Unlaminated silt- and bioclast-dominated limestone; F7-
Intraclastic, bioclast- and sand-rich limestone. These facies were grouped into three
carbonate turbidite members, namely: calciturbidites, densite mudstone and
calcidebrite. The calciturbidites and calcidebrites represent calciclastic deposits
comprising mainly of bioclasts and lithoclasts set in a muddy to a sandy matrix. Densite
mudstone included laminated and unlaminated mud deposits. Laminated sections within
the densite mudstone show evidence of soft sediment deformation from gravity flow
deposits.
Calciturbidites were dominated by products of high- to low-density flows. Densite
mudstone included deposits of waning, tail-end of turbulence and hemipelagic fallouts.

PhD Thesis | 2019
340
Calcidebrite were products of event slump and slide deposition of chaotic hyper-
concentrated to muddy debris flows. It was observed from this study that the
depositional sequence of high- to low-density turbidites and event debris flow beds were
controlled by synsedimentary tectonics. The tectonic activity resulted in asymmetric
subsidence and the tilting of half graben in a NW-SE direction, which enhanced carbonate
platform shedding. The surrounding highlands towards the north is considered
responsible for the delivery of terrigenous sediments in the basin. The mud-rich high- to
low-density calciturbidites (i.e. high-efficiency turbidity currents deposits) were
invariably overlain by basin plain and fluid mud sediments.
Strong evidence for a calciclastic submarine fan depositional system for the studied facies
was highlighted, which was supported by the presence of (i) facies architectural elements
typical of calciclastic floor fan setting; (ii) sediment interruption of siliciclastic to
calciclastic channel-like sand facies during mud deposition; (iii) calciclastic and
siliciclastic components suggestive of mixed terrigenous and upper carbonate slope
tributary channel feeding system. Sediment gravity flows may be triggered by deltaic
deposition. However, previous studies within the basin as referenced in the Chapter 3
report that deltaic processes in the Bowland Basin postdates the studied succession. It is
posited from this study that sedimentation process was mostly gravity controlled
involving carbonate platform shedding possibly during wave rebounds, the instability of
slope and slope failures, and fault was scarps sedimentation. This is evidenced by the
faunal remains of shallow marine origin deposited alongside deeper water algae. It was
further proposed in the study that multiple gullies may have developed along the shelf
break and the fault-controlled physiography influenced the formation and deposition of
channelized submarine fan complex.

PhD Thesis | 2019
341
The facies pattern produced in the studied basin are not cyclical and correlation is
problematic. Being considered as unconventional shale gas reservoir, there is a high risk
in predicting the lateral continuity of reservoir facies. This variability in sedimentary
facies will consequently affect the mechanical properties and ultimately reservoir
productivity.
6.1.2 Study 2 (Chapter 4): The diagenetic evolution of minerals in Hodder
Mudstone
This study focused on evaluating paragenetic sequences and understanding the
controlling factors of carbonate and silicate cementation. The study utilised evidence
from high-resolution petrography (ultra-violet light microscopy, SEM), mineralogy (XRD)
and geochemical data (XRF, EDS, EPMA, RockEval pyrolysis) to characterise the
diagenetic events of the Lower Carboniferous Hodder Mudstone succession. It firstly set
out to present a paragenetic sequence and the resulting minerals and textures within the
Hodder Mudstone. The second objective was to argue for the abundance of authigenic
quartz cement as an integral component in the Hodder Mudstone and to highlight the
likely origin, geological controls and timing of authigenic quartz.
Diagenetic processes significantly impact textural and compositional heterogeneity in
mudstones (Milliken et al. 2012; Milliken & Day-Stirrat 2013; Macquaker et al. 2014;
Taylor & Macquaker 2014). In order to evaluate the Hodder Mudstone as a potential
reservoir, an understanding of the mineralogical variability was imperative. More widely,
the understanding of diagenesis in mudstones still lags behind that of sandstones due to
the inherently small grain sizes of the former. Additionally, a significant broader question
regarding the origin and control on quartz authigenesis in mudstones was also addressed
in this study.

PhD Thesis | 2019
342
The elemental, mineralogical and organic matter distribution within the Hodder
Mudstones suggest a mix of primary sedimentary constituents. The most obvious finding
to emerge from this study was the overlaps in biogeochemical and geochemical processes
that characterised the paragenetic sequence. These processes were controlled by the
distribution of primary terrigenous and biogenic-derived constituents which
consequently impacted mudstone textural properties.
Another significant and more economic finding of this study was that the Hodder
Mudstone was composed of >70% brittle material largely due to authigenic processes.
This makes the Hodder Mudstone a highly brittle formation and potentially adequate for
hydraulic fracturing (Section 2.7.1). More significantly is the volumetric dominance
(>90%) of authigenic quartz in the silica fraction from thin section studies of the Hodder
Formation. A hypothesis from this study posits that diagenetic silica precipitation was
sourced from the transformation of opaline silica and further contribution from silicate
mineral reactions (e.g. kaolinite-illite transformation) that released aqueous silica during
burial.
The evidence from this study suggests that the Hodder Mudstone is enriched with
authigenic minerals and offers a significantly brittle unconventional reservoir. Studied
lithologies within the Hodder mudstones contain on average 50% of calcite (Clay-rich
units: 35%, silt-rich units: 45%; Bioclastic sand-rich units: 68%) and 24% quartz (Clay-
rich units: 27%, silt-rich units: 26%, Bioclastic sand-rich units: 19%) suggesting a bulk
mineralogical composition of favourable brittleness.

PhD Thesis | 2019
343
6.1.3 Study 3 (Chapter 5): Qualitative descriptions and quantitative analysis of
pores in the Hodder Mudstone
Following the understanding of facies and diagenesis of the studied formation, it was
crucial in evaluating the reservoir potential of the Hodder Mudstone to describe the pores
structure and quantitative attributes in Chapter 5. The final objective of this PhD research
was to characterise the pore structure, pore volume, surface area and roughness and pore
size distribution from representative facies of the Hodder Mudstone using nitrogen
adsorption data and SEM imaging. Drawing from preceding understanding of sample
mineralogy and diagenesis, it further explored the relationship between porosity
variability and mineral compositions.
This study clearly indicates that the types and shapes of pores recognised in the studied
samples were influenced and transformed by a combination of primary sedimentary
components and diagenetic mineral precipitation (Figure 6.1).
Based on quantitative mineralogical and pore data, pore attributes of samples were
observed to be influenced by variations in mineral compositions. Pore volume (PV) and
pore surface area (PSA) decrease with high carbonate content while pore diameter is
directly proportional to carbonate content. Comparatively as quartz fraction increases in
samples, PV and PSA increase (Section 5.2.3.2). This trend is also similar to phyllosilicate
content since PV and PSA increase with phyllosilicate weight fraction.
From this study, it seems that siliciclastic, silt-rich argillaceous samples offer higher
porosity than carbonate-rich samples. It is also evident that the calcareous samples
experienced significant calcite cementation and suffered pervasive pores occlusion. An
economic implication of these results is in the lateral prediction of porosity within the
hybrid Hodder Mudstone facies. When compared with a similar carbonate-rich hybrid

PhD Thesis | 2019
344
facies as the Eagle Ford Formation, it shows the difference in pore distribution due to
variation in allochems. The Eagle Ford is Cretaceous in age and comprises of coccoliths
with preserved intraparticle pores. Coccoliths are chiefly disc-shaped (10 – 100 µm
diameter) low Mg-calcareous plates whereas the primary bioclastic components of the
Hodder Mudstone are mostly unstable aragonitc shells subject to dissolution and re-
precipitation. Thus, pervasive cementation of intraparticle pore in highly likely in Hodder
Mudstone facies than the Eagle Ford. Consequently, the porosity of the Hodder Mudstone
facies is much lower than the Eagle Ford.
Conclusion
In conclusion, this research has found that the diagenetic minerals and pore attributes of
the Hodder Mudstones are controlled by the variability in primary depositional
components. These components originate from a mixed proportion of terrigenous and
biogenic grains. Their relative abundance, control the nature of mineral cements and pore
occurrences. Diagenetic minerals make up the bulk of constituent minerals, and older
bioclastic sediments are more likely to be calcite-cemented due to high bioclastic content
while younger sediments exhibit abundant silica cementation.
The Hodder Mudstone upon assessment presents an adequate shale gas reservoir due to
the following findings:
Thickly (0.5 to 30 m) bedded and laterally extensive (>5 km) calcareous to
argillaceous facies with abundant natural fractures (Chapter 3)
Mixed Type II/III organic matter with an average present-day TOC value of 1.13
wt% (Chapter 4)
Thermal maturity between oil window (pyrolysis Tmax >440°C) to wet gas zone
(pyrolysis Tmax <465°C) (Chapter 4)

PhD Thesis | 2019
345
A presence of rigid diagenetic quartz and carbonate grains over ductile clay
minerals to enhance brittleness (Chapter 4)
Adequate porosity of 3.6 to 6.8% hosted by intra- and inter-particle pores
(Chapter 5)
Facies Thickness (>0.5m)
TOC (>1.13)
Porosity (>3.6%)
Brittleness Lateral extent (>5 km)
Reservoir quality
F1 Poor
F2 Good
F3 ? Poor
F4 Good
F5 ? ?Good
F6 - ? Inconclusive F7 - ? Inconclusive
Table 10: Unconventional reservoir assessment for prospectivity of the Hodder Mudstone facies.
Based on these findings, there is a high risk associated with investing in the Carboniferous
Hodder Mudstone play. Although basic requirements for reservoir assessment are met,
the concerns mostly involves its vertical and lateral facies variability. More widely in the
basinal scale, the Bowland Basin is structurally complex with faults and fractures which
may present a difficulty in the placement of hydraulic fractures.

PhD Thesis | 2019
346
Figure 6.1: Summary diagram of Hodder Mudstone facies distribution and the correlative variation of reservoir properties. Bed thickness, porosity and TOC increases distally, while brittleness are more pronounced in proximal areas.
Recommendations for future work
A number of limitations were noted in the course of this study including several
methodological inadequacies. This research threw up possible research questions in need
of further investigation.

PhD Thesis | 2019
347
6.3.1 Sediment provenance analysis
The studied sections for this research presented evidence of a mixed terrigenous and
carbonate sediment sources. This study utilised only 11 borehole cores located towards
the northwest margin of the basin and does not cover a vast majority of the Bowland
Basin. Questions remain regarding the relative impact of sediment gravity flows from the
eroding platform to the west and the adjacent footwall scarp to the east of the study area
during the Carboniferous. The provenance of the quartz arenite sandstone bed
interbedded within mudstone facies is equally enigmatic. A further study could sample
more borehole cores in the area and possibly seek access to seismic data within the study
area to understand the contribution of sediments from the potential sediment sources.
Collated data will further provide a high degree of stratigraphic control for a modified
depositional model. This has an implication in predicting and understanding
uncertainties in the lateral distribution of facies.
6.3.2 Clay mineral diagenesis
A significant source for silica cement is from clay mineral transformation reaction
(Bjørlykke 1998; Thyberg & Jahren 2011). Although not detected from whole rock XRD
analysis, fibrous illite was petrographically evident within a few of the studied samples
occurring with microcrystalline quartz (Section 4.4.7.3). The suggestion that authigenic
silica may have resulted from kaolinite-to-illite clay mineral reaction was rather
inconclusive as there was no quantitative clay mineral XRD data. However, based on
direct photographic evidence of microcrystalline sheetlike quartz, a product of silica
released from clay mineral transformation, this interpretation was inferred. More
information on clay mineral content and diagenesis in the Hodder Mudstone would help
to establish a greater degree of accuracy on the subject of silica diagenesis.

PhD Thesis | 2019
348
6.3.3 Multi-scale high-resolution image-based pore characterisation
This study for the first time has provided data on pore distributions across the different
facies of the Hodder Mudstone. The research also recorded a failed attempt in resolving
pores in 3-dimension using the 3D micro-XCT technique (Figure 6.2). Additionally, the
absence of organic matter intra-particle pores within the Hodder Mudstone samples
needs to be validated. Further investigation and experimentation are strongly
recommended in exploring FIB-SEM and nano-XCT techniques for adequate
representation of pore distribution in the studied samples. Further research may focus
on integrating gas adsorption data and 3D imaging data for a multi-scale approach in
characterising the Hodder Mudstone pores. The findings from this study will have
practical implications in porosity evaluation and the resource estimation of the shale gas
play.

PhD Thesis | 2019
349
Figure 6.2: 3D XCT image of rock volume (a) from a representative sample. Statistical grey-scale pixel filtering is utilized to segment identified minerals as confirmed from SEM images and EDS spectra; (b) shows carbonate mineral distribution caused by the presence of skeletal debris in a fine-grained muddy matrix. Fragments are mostly from crinoids, bivalves, brachiopods, gastropods, foraminifers and calcareous algae. Intraparticle pores may exist within carbonate grains. (c) shows pyrite distribution. Framboidal pyrite hosts inter-crystalline pores between microcrysts. (d) represents organic matter particles which are mostly secondary or migrated residual hydrocarbon and bitumen. Pores in the samples could not be resolved from this data.

PhD Thesis | 2019
350
References
Bjørlykke, K., 1998. Clay Mineral Diagenesis in Sedimentary Basins — A Key to the Prediction of Rock Properties. Examples from the North Sea Basin. Clay Minerals, 33(1), pp.15–34.
Gawthorpe, R.L., 1986. Sedimentation during carbonate ramp-to-slope evolution in a tectonically active area: Bowland Basin (Dinantian), northern England. Sedimentology, 33, pp.185–206.
Macquaker, J.H.S. et al., 2014. Compositional controls on early diagenetic pathways in fine-grained sedimentary rocks: Implications for predicting unconventional reservoir attributes of mudstones. AAPG Bulletin, 98(3), pp.587–603.
Milliken, K.L. et al., 2012. Grain assemblages and strong diagenetic overprinting in siliceous mudrocks, Barnett Shale (Mississippian), Fort Worth Basin, Texas. AAPG Bulletin, 96(8), pp.1553–1578.
Milliken, K.L. & Day-Stirrat, R.J., 2013. Cementation in mudrocks: Brief review with examples from cratonic basin mudrocks. AAPG Memoir, 103, pp.133–150.
Newport, S.M. et al., 2017. Sedimentology and microfacies of a mud-rich slope succession: in the Carboniferous Bowland Basin, NW England (UK). Journal of the Geological Society, London, (Gawthorpe 1987), p.16pp.
Stow, D.A. V & Mayall, M., 2000. Deep-water sedimentary systems: new models for the 21st century. Marine and Petroleum Geology, 17(2), pp.125–135.
Taylor, K.G. & Macquaker, J.H.S., 2014. Diagenetic alterations in a silt- and clay-rich mudstone succession: An example from the Upper Cretaceous Mancos Shale of Utah, USA. Clay Minerals, 49, pp.213–227.
Thyberg, B. & Jahren, J., 2011. Quartz cementation in mudstones: sheet-like quartz cement from clay mineral reactions during burial. Petroleum Geoscience, 17(1), pp.53–63.

PhD Thesis | 2019
351
7 Appendix
Sample list and data acquired
Sample ID Hand specimen
description
Thin section
XRD XRF TOC Rock Eval
N2 gas adsorption
X-ray CT
MHD1/008.4 X X X
MHD1/010.6 X X X
MHD1/026.0 X X
MHD1/030.8 X X X X
MHD1/042.2 X
MHD1/050.1 X X
MHD1/060.3 X X X
MHD1/067.7 X
MHD1/068.8 X
MHD1/078.5 X X
MHD1/086.9 X X X X
MHD1/101.6 X X X
MHD1/115.1 X X X
MHD1/127.8 X
MHD1/137.9 X X X
MHD1/145.7 X
MHD1/151.5 X
MHD1/160.0 X X X
MHD2/031.7 X X X
MHD2/032 X X X
MHD2/038.1 X
MHD2/049.5 X X
MHD2/063.4 X X
MHD2/073.6 X
MHD2/089.3 X X X X
MHD2/101.9 X X
MHD2/108.5 X X
MHD2/119 X X X
MHD2/132.6 X X
MHD2/145.3 X X X
MHD2/165.4 X
MHD2/170.5 X
MHD2/180 X X X
MHD3/070.3 X X
MHD3/076.8 X X X
MHD3/088.4 X X
MHD3/100.2 X X X
MHD3/118.8 X X X X X
MHD3/124.9 X
MHD3/136.3 X X
MHD3/162.4 X X X
MHD3/179.8 X X X

PhD Thesis | 2019
352
MHD3/195.8 X X X
MHD3/203.6 X X
MHD3/214.3 X X X
MHD3/223.1 X X X
MHD3/230.1 X
MHD3/238.2 X X X X X
MHD4/069.2 X X X X X
MHD4/080.3 X X X X
MHD4/093.3 X X
MHD4/105 X X
MHD8/071.9 X X
MHD8/092.4 X X X
MHD8/100.2 X X
MHD8/115.2 X X X X
MHD8/132.4 X X
MHD8/154.6 X X X
MHD8/166.3 X X
MHD9/012.8 X X X
MHD9/035.6 X X
MHD9/047.5 X
MHD9/056.9 X X X
MHD9/064.2 X
MHD9/068.8 X X X
MHD9/086.9 X X X
MHD9/093 X
MHD9/096.1 X
MHD9/099.3 X X X
MHD9/120 X X
MHD11/086.4 X X X
MHD11/089.5 X X
MHD11/098 X X
MHD11/100.2 X X X X X
MHD11/106.2 X X
MHD11/111.4 X X X X
MHD11/114 X X X X
MHD11/148.9 X X
MHD11/164.3 X
MHD11/169.4 X X X
MHD11/177 X
MHD11/197.4 X
MHD11/200.1 X X X X X
MHD12/011.3 X X X
MHD12/014.9 X
MHD12/023 X X X
MHD12/028.1 X X X X
MHD12/036 X
MHD12/047.1 X X X
MHD12/056.4 X X
MHD12/066.6 X X X
MHD12/086.4 X X X

PhD Thesis | 2019
353
MHD12/103.3 X X X
MHD12/115.5 X X
MHD12/128.4 X
MHD12/140 X X
MHD13/067.4 X X X X X
MHD13/072.4 X X X X
MHD13/072.6 X X
MHD13/073.1 X X X X
MHD13/077.3 X X X
MHD13/077.7 X X X
MHD13/078.0 X X X
MHD13/078.6 X X X
MHD13/079.5 X X X
MHD13/081.1 X X X X
MHD13/082.6 X X X
MHD13/088.7 X X X X X X X
MHD13/090.4 X X X X X X X X
MHD13/091.6 X X X X X
MHD13/098.7 X X
MHD13/121.6 X X X X X X
MHD13/164.7 X X X
MHD13/174.8 X X X X X X
MHD13/228.6 X X X X X X X
MHD13/244.2 X X X X X
MHD13/261.5 X X X X
MHD13/262.2 X X X
MHD18/052.6 X X X
MHD18/078.78 X X
MHD18/090.18 X X
MHD18/109.5 X X X X X X
MHD18/134.9 X X
MHD18/139.5 X
MHD18/150.9 X X X
MHD18/159.26 X X X X
MHD18/172.7 X X X
MHD18/178.9 X X X
MHD18/180.3 X X
MHD18/185.8 X X X
MHD18/192.1 X X X X
MHD18/200.2 X X

PhD Thesis | 2019
354
Graphic logs
MHD1

PhD Thesis | 2019
355
MHD2

PhD Thesis | 2019
356
MHD3

PhD Thesis | 2019
357
MHD4
MHD5
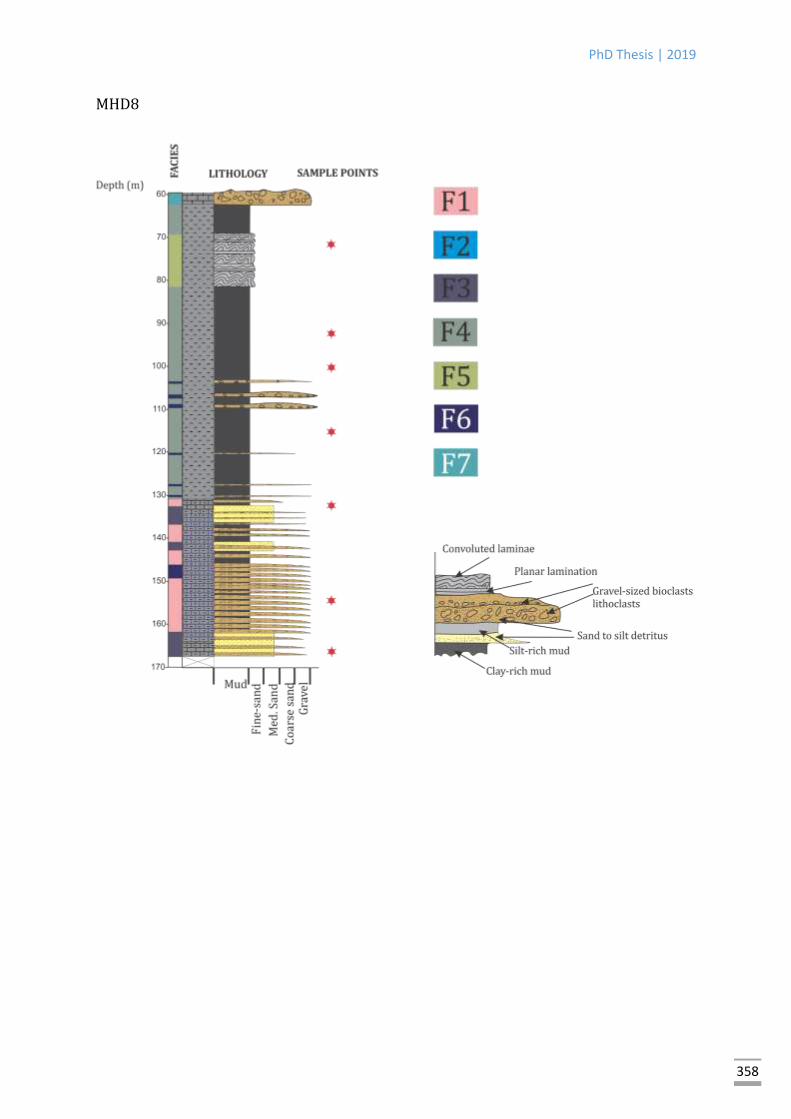
PhD Thesis | 2019
358
MHD8

PhD Thesis | 2019
359
MHD9

PhD Thesis | 2019
360
MHD11

PhD Thesis | 2019
361
MHD12

PhD Thesis | 2019
362
MHD 13

PhD Thesis | 2019
363
MHD18

PhD Thesis | 2019
364
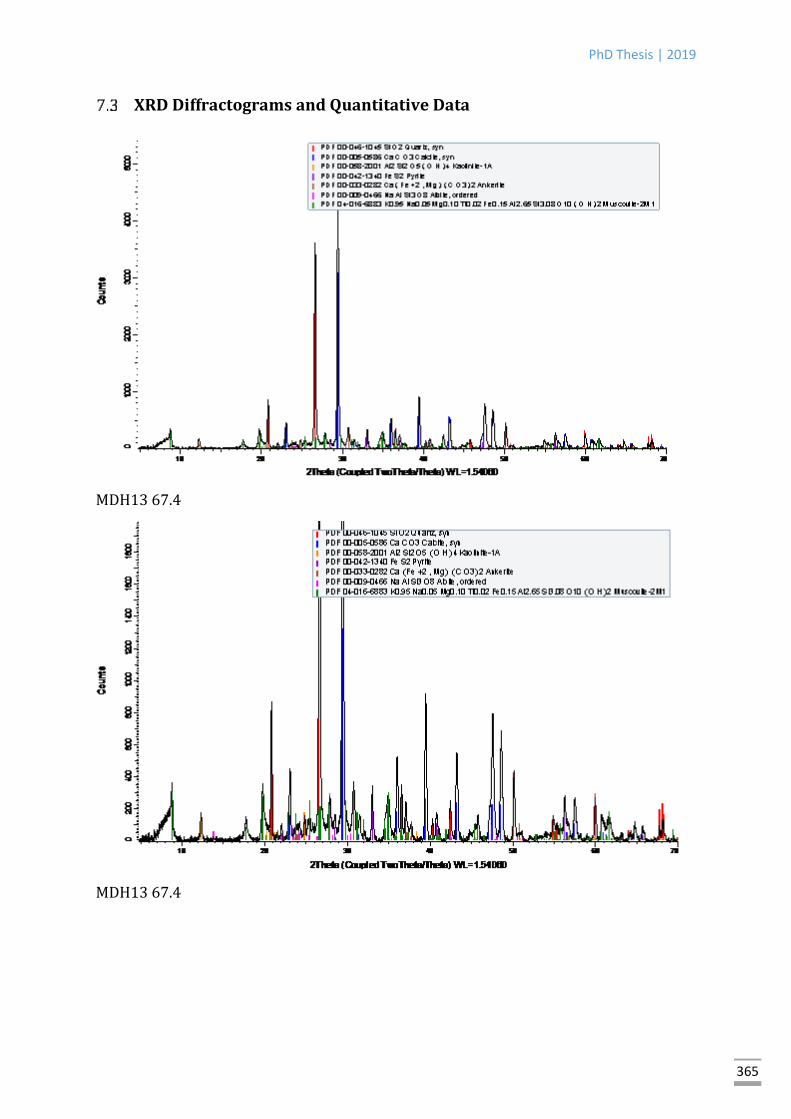
PhD Thesis | 2019
365
XRD Diffractograms and Quantitative Data
MDH13 67.4
MDH13 67.4
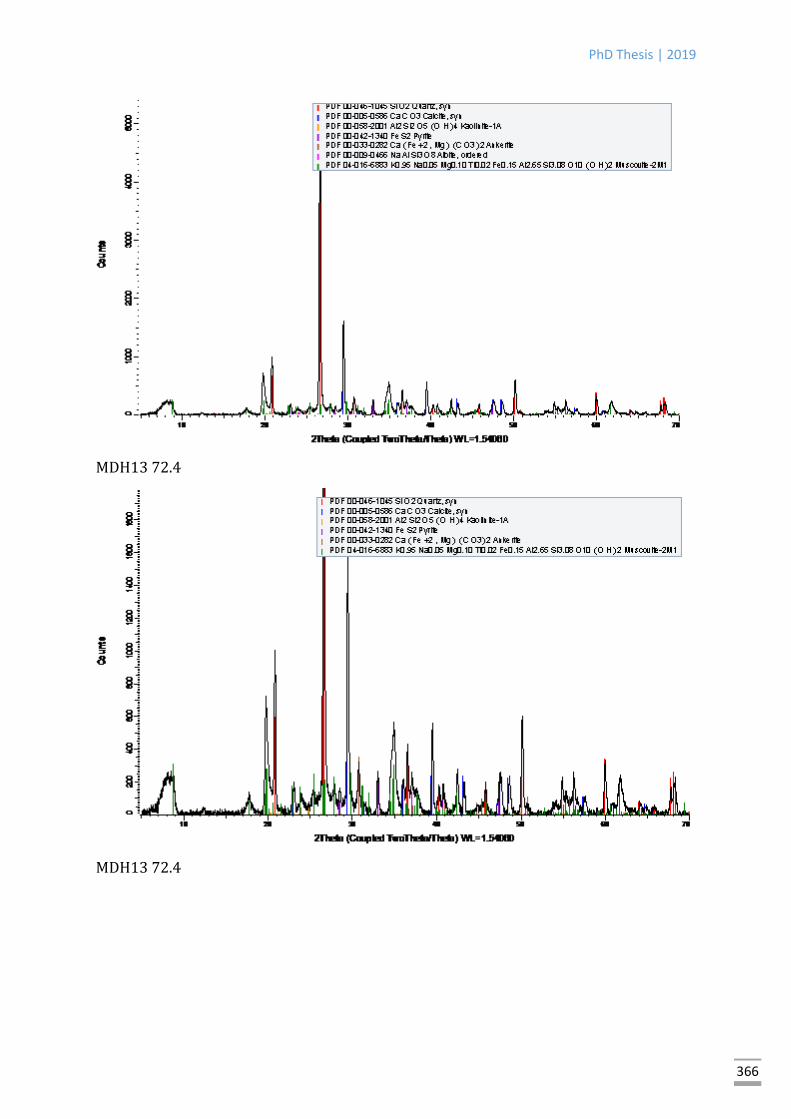
PhD Thesis | 2019
366
MDH13 72.4
MDH13 72.4

PhD Thesis | 2019
367
MDH13 72.6
MDH13 72.6

PhD Thesis | 2019
368
MDH13 73.1
MDH13 73.1

PhD Thesis | 2019
369
MDH13 77.3
MDH13 77.3

PhD Thesis | 2019
370
MDH13 78
MDH13 78

PhD Thesis | 2019
371
MDH13 78.6
MDH13 78.6

PhD Thesis | 2019
372
MDH13 79.5
MDH13 79.5

PhD Thesis | 2019
373
MDH13 81.1
MDH13 81.1

PhD Thesis | 2019
374
MDH13 82.6
MDH13 82.6

PhD Thesis | 2019
375
MDH13 88.7
MDH13 88.7
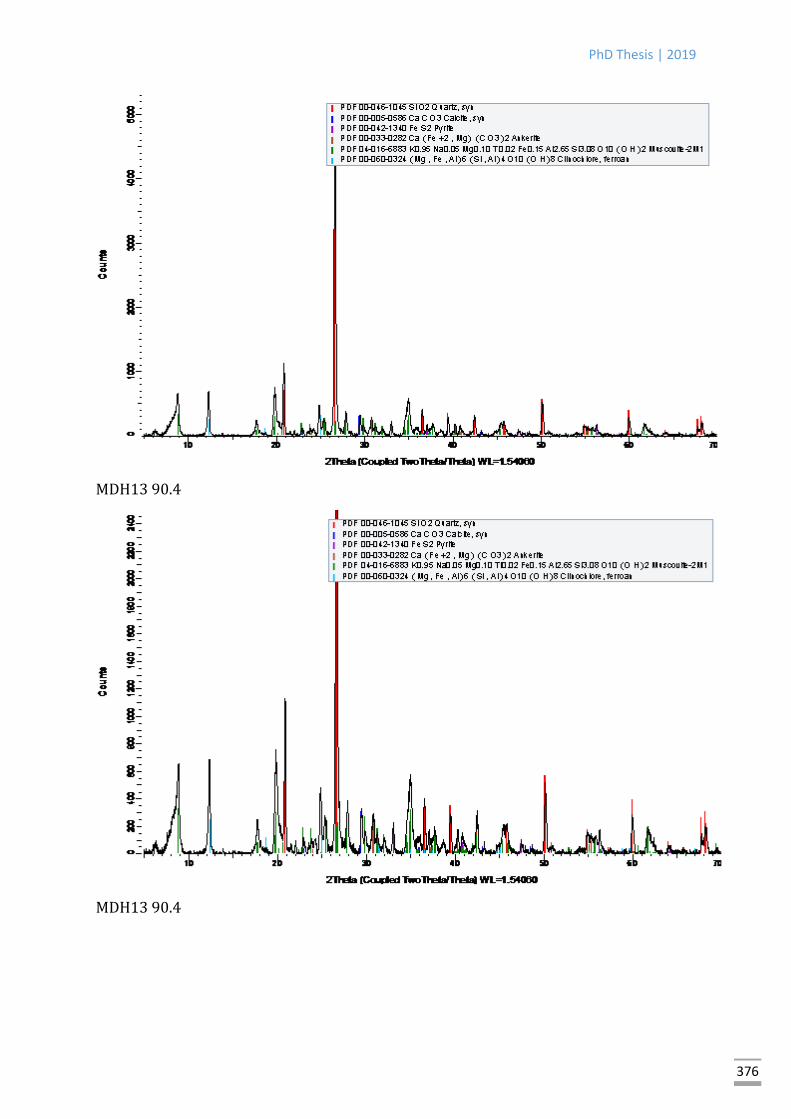
PhD Thesis | 2019
376
MDH13 90.4
MDH13 90.4

PhD Thesis | 2019
377
MDH13 91.6
MDH13 91.6

PhD Thesis | 2019
378
MDH13 121.6
MDH13 121.6

PhD Thesis | 2019
379
MDH13 164.7
MDH13 164.7

PhD Thesis | 2019
380
MDH13 174.8
MDH13 174.8

PhD Thesis | 2019
381
MDH13 228.6
MDH13 228.6

PhD Thesis | 2019
382
MDH13 244.2
MDH13 244.2

PhD Thesis | 2019
383
MDH13 261.8
MDH13 261.8

PhD Thesis | 2019
384
MHD1 137.9
MHD1 137.9

PhD Thesis | 2019
385
MHD1 60.3
MHD1 60.3

PhD Thesis | 2019
386
MHD1 30.4
MHD1 30.4

PhD Thesis | 2019
387
MHD1 160.0
MHD1 160.0

PhD Thesis | 2019
388
MHD1 115.1
MHD 115.1

PhD Thesis | 2019
389
MHD1 86.9
MHD1 86.9

PhD Thesis | 2019
390
MHD1 8.4
MHD1 8.4

PhD Thesis | 2019
391
MHD1 8.4
MHD2 31.7

PhD Thesis | 2019
392
MHD2 31.7
MHD2 180.0

PhD Thesis | 2019
393
MHD2 180.0
MHD1 145.3

PhD Thesis | 2019
394
MHD1 145.3
MHD3 223.1

PhD Thesis | 2019
395
MHD3 223.1
MHD3 162.4

PhD Thesis | 2019
396
MHD3 162.4
MHD3 118.8

PhD Thesis | 2019
397
MHD3 118.8
MHD3 195.6

PhD Thesis | 2019
398
MHD3 195.6
MHD4 69.2

PhD Thesis | 2019
399
MHD4 69.2
MHD3 076.8

PhD Thesis | 2019
400
MHD3 076.8
MHD4 080.3
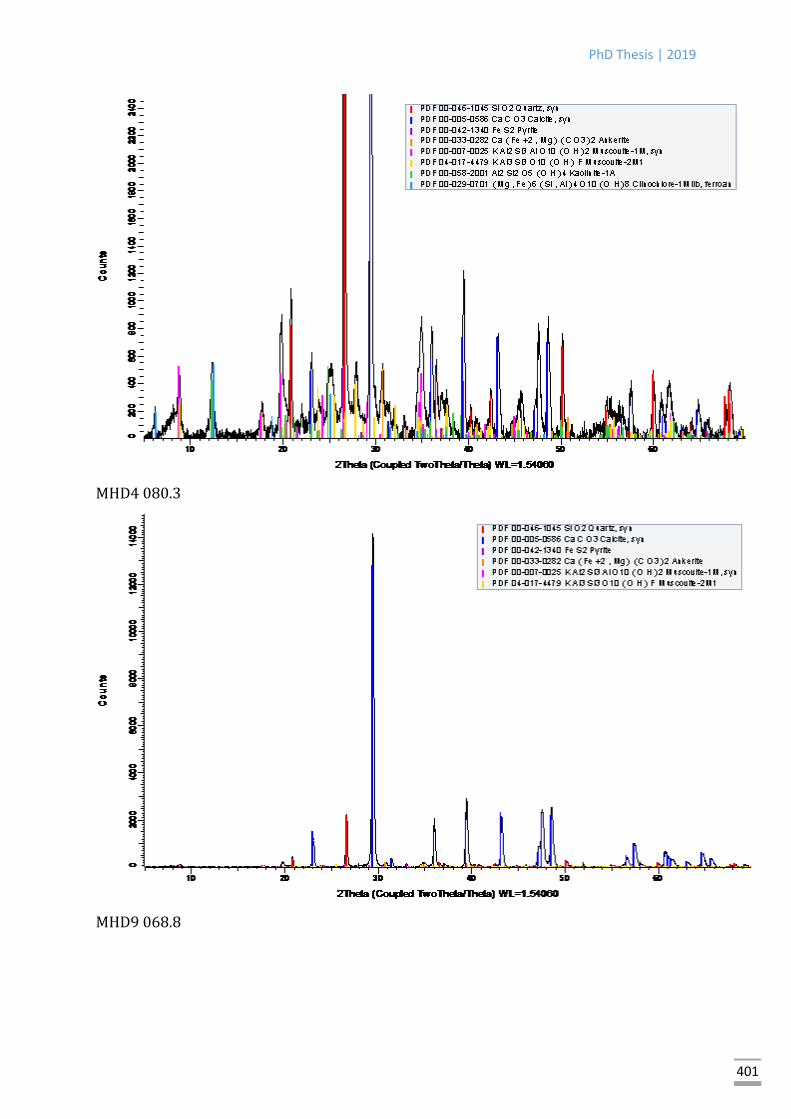
PhD Thesis | 2019
401
MHD4 080.3
MHD9 068.8

PhD Thesis | 2019
402
MHD9 068.8
MHD 8 154.6

PhD Thesis | 2019
403
MHD 8 154.6
MHD 8 115.2

PhD Thesis | 2019
404
MHD8 115.2
MHD8 092.4

PhD Thesis | 2019
405
MHD8 092.4
MHD9 086.9

PhD Thesis | 2019
406
MHD9 086.9
MHD9 056.9

PhD Thesis | 2019
407
MHD9 056.9
MHD11 086.4

PhD Thesis | 2019
408
MHD11 086.4
MHD11 100.2

PhD Thesis | 2019
409
MHD11 100.2
MHD11 114.0

PhD Thesis | 2019
410
MHD11 114.0
MHD11 169.4

PhD Thesis | 2019
411
MHD11 169.4
MHD1 10.6

PhD Thesis | 2019
412
MHD1 10.6
MHD1 26.0

PhD Thesis | 2019
413
MHD1 26.0
MHD1 101.6
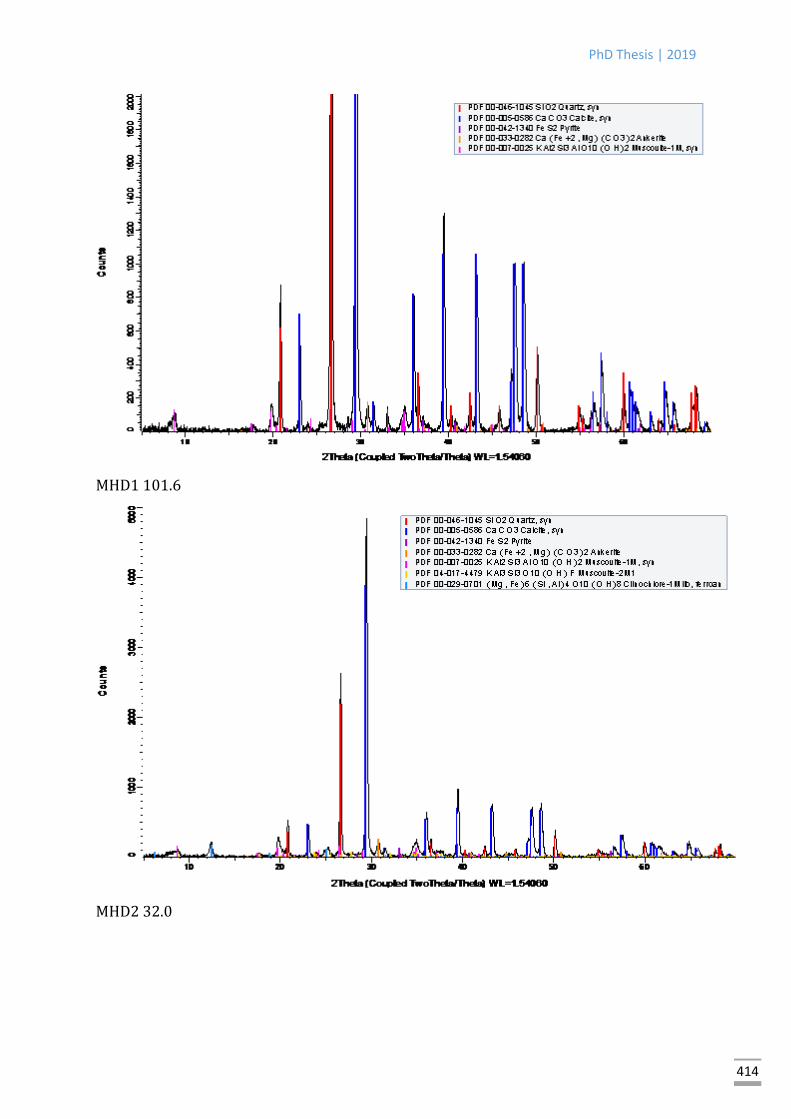
PhD Thesis | 2019
414
MHD1 101.6
MHD2 32.0

PhD Thesis | 2019
415
MHD2 32.0
MHD2 89.3
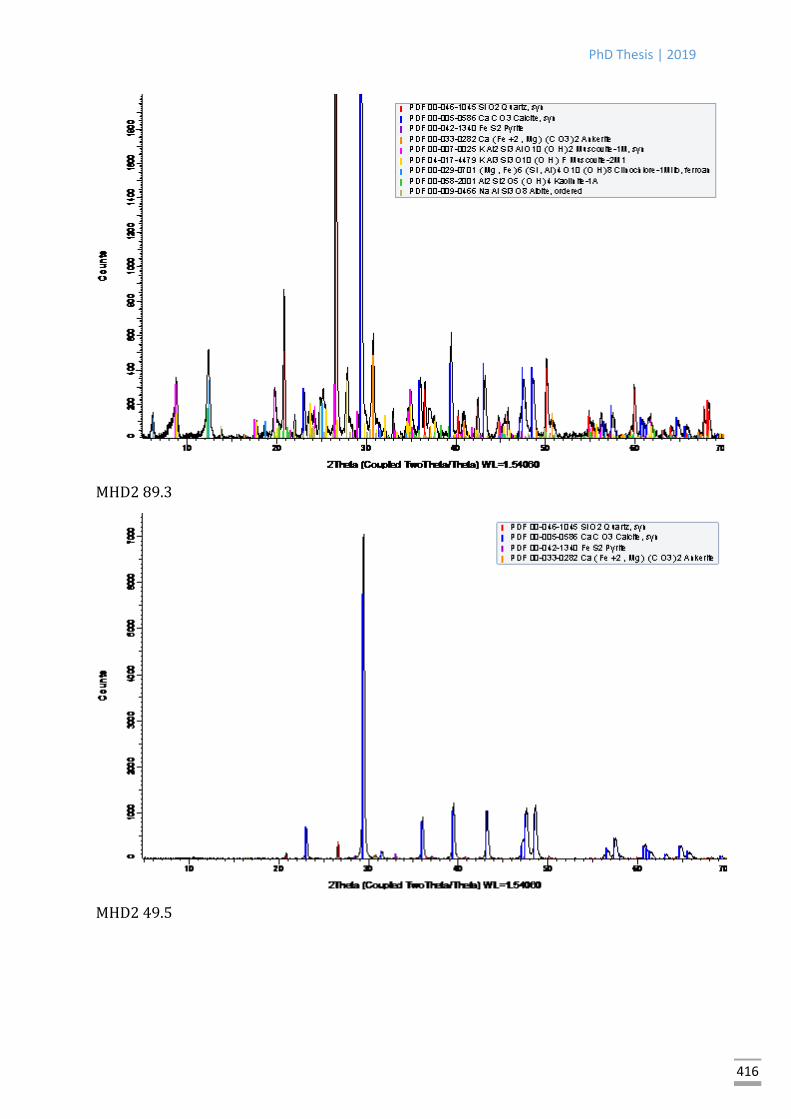
PhD Thesis | 2019
416
MHD2 89.3
MHD2 49.5

PhD Thesis | 2019
417
MHD2 49.5
MHD2 119.2

PhD Thesis | 2019
418
MHD2 119.2
MHD3 100.3

PhD Thesis | 2019
419
MHD3 100.3
MHD3 203.6

PhD Thesis | 2019
420
MHD3 203.6
MHD3 214.3

PhD Thesis | 2019
421
MHD3 214.3

PhD Thesis | 2019
422
MHD3 138.2
MHD3 138.2

PhD Thesis | 2019
423
MHD9 99.3
MHD9 99.3

PhD Thesis | 2019
424
MHD9 12.8
MHD9 12.8

PhD Thesis | 2019
425
MHD11 200.1
MHD11 200.1

PhD Thesis | 2019
426
MHD11 111.4
MHD11 111.4

PhD Thesis | 2019
427
MHD12 11.3
MHD12 11.3

PhD Thesis | 2019
428
MHD12 23.0
MHD12 23.0

PhD Thesis | 2019
429
MHD12 47.1
MHD12 47.1

PhD Thesis | 2019
430
MHD12 28.1
MHD12 28.1

PhD Thesis | 2019
431
MHD12 56.4
MHD12 56.4

PhD Thesis | 2019
432
MHD12 66.6
MHD12 66.6

PhD Thesis | 2019
433
MHD12 103.3
MHD12 103.3

PhD Thesis | 2019
434
MHD12 86.4
MHD12 86.4

PhD Thesis | 2019
435
MHD13 98.9
MHD13 98.9

PhD Thesis | 2019
436
MHD18 52.6
MHD18 52.6

PhD Thesis | 2019
437
MHD18 150.9
MHD18 150.9

PhD Thesis | 2019
438
MHD18 109.5
MHD18 109.5

PhD Thesis | 2019
439
MHD18 178.9
MHD18 178.9

PhD Thesis | 2019
440
MHD18 172_7
MHD18 172_7

PhD Thesis | 2019
441
MHD18 192_1
MHD18 185_8

PhD Thesis | 2019
442
MHD18 185_8

PhD Thesis | 2019
443
Sample ID Calcite Dol. Qrtz Musc Feld Kao Chlor Sid Ank Pyrt Mar Fluo Gyps Mont TOC
MHD1/10.6 3.762 0 83.21 3.851 3.319 0 0.664 0 5.059 0.135 0 0 0 0
MHD1/101.6 59.091 0 33.182 5.966 0 0 0 0 0.406 1.355 0 0 0 0 0.94
MHD1/115.1 67.063 0 27.464 4.081 0 0 0 0 0.216 1.176 0 0 0 0
MHD1/137.9 68.817 3.013 22.962 1.127 0 0 0.904 0 0 1.439 1.738 0 0 0
MHD1/160.0 71.228 13.206 12.787 2.129 0 0 0 0 0 0.65 0 0 0 0
MHD1/26.0 60.549 0 18.689 15.107 0 0 0 0 2.438 2.794 0 0 0.423 0
MHD1/30.8 38.682 0 30.029 24.664 0 2.561 1.631 0 0.065 2.368 0 0 0 0 1.17
MHD1/60.3 45.902 0 32.993 15.971 0 0 3.421 0 0 1.713 0 0 0 0
MHD1/8.4 84.046 0 6.237 3.624 0 0 0 0 5.407 0.686 0 0 0 0
MHD1/86.9 25.924 0 34.856 25.84 0 7.755 0 0.221 3.781 1.623 0 0 0 0 0.75
MHD11/100.2 10.902 0 29.804 40.155 4.96 10.101 0.506 0 0.061 3.511 0 0 0 0 1.87
MHD11/111.4 23.279 0 19.347 32.773 0 7.544 1.611 9.695 4.793 0.958 0 0 0 0 0.8
MHD11/114 13.319 0 28.755 44.149 4.847 1.203 0 0 7.166 0.561 0 0 0 0 0.86
MHD11/169.4 82.397 0 15.111 0.884 0 0 0 0 1.096 0.512 0 0 0 0
MHD11/200.1 37.567 0 36.629 26.783 0 3.073 0 0 3.521 2.427 0 0 0 0 1.1
MHD11/86.4 82.44 0 7.035 3.004 0 0 0 0 7.521 0 0 0 0 0
MHD12/103.3 80.519 3.573 12.973 1.939 0 0 0 0 0 0.996 0 0 0 0
MHD12/11.3 83.483 0 9.323 6.725 0 0 0 0 0 0.469 0 0 0 0
MHD12/23 81.53 0 13.295 1.428 0 0 0 0 3.361 0.386 0 0 0 0
MHD12/28.1 95.384 4.616 0 0 0 0 0 0 0 0 0 0 0 0
MHD12/47.1 67.374 0 21.823 6.627 0 0 0 0 2.093 1.685 0 0 0 0.398
MHD12/56.4 92.919 0.941 6.14 0 0 0 0 0 0 0 0 0 0 0
MHD12/66.6 84.433 0 7.605 1.63 0 0 0 0 6.332 0 0 0 0 0
MHD12/86.4 74.613 0 23.824 1.563 0 0 0 0 0 0 0 0 0 0
MHD13/121.6 1.173 0 39.633 22.728 0 19.876 5.915 0 9.698 0.977 0 0 0 0 1.19
MHD13/164.7 48.638 0 34.51 1.636 0 0 0 0 14.608 0.608 0 0 0 0
MHD13/174.8 48.534 22.316 21.982 5.214 0 0 0 0 0 1.954 0 0 0 0 0.85

PhD Thesis | 2019
444
MHD13/228.8 28.16 0 29.185 16.796 0 15.134 5.836 0 0 4.889 0 0 0 0 3.15
MHD13/244.2 87.294 0 8.362 0.975 0 0 0 0 2.855 0.514 0 0 0 0
MHD13/261.5 59.395 9.938 23.055 5.692 0 0.901 0 0 0 1.019 0 0 0 0
MHD13/67.4 44.626 0 28.116 10.816 6.846 2.544 0 0 2.566 4.486 0 0 0 0 0.66
MHD13/72.4 17.333 0 46.747 21.657 0 8.072 0 0 2.185 4.006 0 0 0 0 2.1
MHD13/72.6 23.324 0 36.327 19.962 0 6.619 0 0 11.354 2.414 0 0 0 0
MHD13/73.1 13.784 0 47.208 21.756 0 10.988 0 0 2.862 3.402 0 0 0 0 1.38
MHD13/77.3 9.552 0 46.777 30.887 0 6.437 0 0 0.081 6.266 0 0 0 0 2.15
MHD13/77.7 19.619 0 41.686 29.103 0 2.766 0 0 2.671 4.155 0 0 0 0
MHD13/78 38.513 0 32.023 12.941 0 1.95 0 0 11.413 3.16 0 0 0 0
MHD13/78.6 0 0 24.567 18.472 0 0 0 0 54.087 2.874 0 0 0 0
MHD13/79.5 37.609 0 42.927 10.008 0 0 0 0 2.857 5.464 0 1.135 0 0
MHD13/81.1 25.577 0 1.857 0 0 0 0 37.261 30.179 3.544 0 1.582 0 0
MHD13/82.6 22.756 0 35.656 27.691 0 0 7.672 0 1.994 3.928 0 0.303 0 0
MHD13/88.7 57.194 0 18.76 18.782 0 0 0 0 4.936 0.328 0 0 0 0 0.6
MHD13/90.4 2.652 0 47.854 35.177 0 0 10.562 0 1.194 2.561 0 0 0 0 0.92
MHD13/91.6 80.55 0 9.679 6.179 0 0 2.262 0 0.344 0.986 0 0 0 0
MHD18/109.5 25.048 0 28.003 32.067 5.949 5.722 0.612 0 0.275 2.324 0 0 0 0 2.14
MHD18/150.9 74.525 0 9.963 6.386 0 0.116 0 0 5.567 2.817 0 0 0.626 0
MHD18/172.7 9.083 0 24.077 36.597 7.263 10.27 2.04 0 8.134 2.536 0 0 0 0 0.98
MHD18/178.9 31.032 0 12.933 33.348 0 4.154 0.799 0 16.917 0.817 0 0 0 0
MHD18/185.8 2.818 0 27.726 43.66 5.947 9.993 0.825 0 8.287 0.744 0 0 0 0 0.85
MHD18/192.1 24.653 0 16.954 22.652 0 3.675 0 0 26.517 5.549 0 0 0 0 0.42
MHD18/52.6 80.026 0 6.138 5.929 0 1.211 1.233 0 5.221 0.242 0 0 0 0
MHD2/119 50.208 0 14.268 16.865 0 0 1.341 0 12.915 4.403 0 0 0 0
MHD2/145.3 85.245 0 10.385 2.629 0 0 0 0 0.28 0.804 0.657 0 0 0
MHD2/180.0 58.318 0 19.54 18.552 0 1.71 0 0 0.061 1.819 0 0 0 0
MHD2/31.7 63.885 0 17.094 14.1 0 1.658 0 0 3.263 0 0 0 0 0
MHD2/32 53.87 0 19.734 21.603 0 0 1.696 0 2.692 0.405 0 0 0 0 0.27

PhD Thesis | 2019
445
MHD2/49.5 94.4 0 3.294 0 0 0 0 0 0.984 1.322 0 0 0 0
MHD2/89.3 22.103 0 24.081 25.644 8.016 8.578 2.896 0 6.844 1.838 0 0 0 0 0.83
MHD3/100.2 45.749 0 32.523 16.773 0 0 1.501 0 0.891 2.563 0 0 0 0
MHD3/118.8 40.152 0 35.392 18.848 0 0 1.842 0 1.116 2.65 0 0 0 0 1.39
MHD3/162.4 61.453 0 13.493 20.407 0 0 2.939 0 0.989 0.719 0 0 0 0
MHD3/203.6 93.328 0 4.741 1.669 0 0 0 0 0.008 0.254 0 0 0 0
MHD3/214.3 94.141 0 1.518 0 0 0 0 0 0 4.341 0 0 0 0
MHD3/223.1 77.618 0 18.713 2.582 0 0 0 0 0.385 0.702 0 0 0 0
MHD3/238.2 37.661 0 39.117 20.574 0 0 0 0 0.499 1.515 0.634 0 0 0 0.58
MHD3/76.8 68.427 0 11.548 12.457 0 1.568 0 0 4.884 1.116 0 0 0 0
MHD4/69.2 42.028 0 25.68 19.801 0 0.815 1.924 0 5.925 3.827 0 0 0 0 1.56
MHD4/80.30 27.573 0 21.382 38.732 0 5.224 3.244 0 2.944 0.901 0 0 0 0 0.88
MHD8/115.2 11.564 0 25.656 40.015 6.608 8.847 0.26 0 7.05 0 0 0 0 0 0.99
MHD8/92.4 19.696 0 40.203 21.189 0 7.502 1.268 0 8.413 1.729 0 0 0 0
MHD9/12.8 99.443 0.557 0 0 0 0 0 0 0 0 0 0 0 0
MHD9/56.9 93.736 0 4.448 1.497 0 0 0 0 0.015 0.304 0 0 0 0
MHD9/68.8 82.251 0 8.386 7.204 0 0 0 0 1.214 0.945 0 0 0 0
MHD9/86.9 68.408 0 29.655 1.691 0 0 0 0 0 0.246 0 0 0 0
MHD9/99.3 98.06 1.94 0 0 0 0 0 0 0 0 0 0 0 0

PhD Thesis | 2019
446
XRF Major elemental data
Sample ID Na2
O MgO
Al2O3
SiO2 P2O5
SO3 Cl K2O CaO TiO2
Cr MnO
Fe2O3
Co Ni Cu Zn Rb Sr Pb H2
O CO2
(%) (%) (%) (%) (%) (%) (%) (%) (%) (%) (%) (%) (%) (%) (%) (%) (%) (%) (%) (%) (%)
(%)
MHD18/134.9
0.344
1.775
10.937
28.598
0.036
2.525
0.012
2.334
25.192
0.426
0.01
0.058
5.094
0.01
0.006
1.677
0.013
0.072
0.019
0.82
20.03
MHD13/91.6
0.182
1.42
8.169
19.181
0.06
3.054
0.036
1.646
33.641
0.311
0.008
0.081
4.511
0.009
0.011
0.742
0.009
0.079
0.01
0.64
26.2
MHD13/72.4
0.215
1.582
16.406
48.492
0.056
1.902
0.013
4.058
8.064
0.561
0.016
0.032
4.038
0.006
0.013
0.006
0.036
0.023
0.046
0.017
2 12.26
MHD4/80.3
0.383
2.143
17.843
39.519
0.109
1.01
0.009
3.622
12.946
0.729
0.014
0.044
4.649
0.006
0.011
0.003
0.005
0.021
0.065
1.52
15.19
MHD11/148.9
0.045
0.473
2.55 21.894
0.027
1.064
0.03
0.339
40.187
0.094
0.004
0.108
1.484
0.006
0.004
0.005
0.043
0.023
0.12
31.5
MHD12/47.1
0.977
8.783
26.492
0.116
1.391
0.015
1.542
30.397
0.316
0.008
0.061
2.106
0.008
0.004
0.042
0.009
0.036
0.004
0.54
26.89
MHD1/86.9
0.09
1.02
16.04
40.226
0.113
1.27
0.008
3.241
15.207
0.75
0.015
0.09
4.305
0.005
0.009
0.005
0.003
0.018
0.048
0.007
0.71
16.67
MHD11/100.2
0.361
1.531
20.501
46.828
0.082
2.501
0.017
3.798
5.66 0.783
0.027
0.026
5.083
0.007
0.017
0.006
0.012
0.023
0.044
0.011
1.77
10.76
MHD13/88.7
0.218
1.357
10.868
26.769
0.161
4.918
0.021
2.612
29.048
0.422
0.013
0.088
8.846
0.013
0.008
0.005
0.02
0.014
0.069
0.011
0.6 13.85
MHD11/114.0
0.429
1.618
20.162
43.428
0.107
0.635
0.011
3.474
7.865
0.83
0.018
0.053
5.838
0.007
0.01
0.004
0.011
0.018
0.035
1.03
14.28
MHD1/160.0
1.485
2.395
14.431
0.014
0.742
0.024
0.355
42.159
0.079
0.056
0.982
0.006
0.002
0.253
0.044
0.005
0.13
36.63
MHD18/90.2
0.479
2.13
20.04
42.224
0.098
1.223
0.014
3.147
9.402
0.77
0.014
0.04
6.302
0.009
0.013
0.006
0.009
0.018
0.042
0.006
1.26
12.66
MHD4/69.2
0.256
1.639
11.283
30.365
0.229
3.159
0.013
1.999
22.394
0.473
0.013
0.049
6.035
0.007
0.01
0.004
0.011
0.01
0.06
0.012
0.7 21.16
MHD13/121.6
0.364
1.368
23.594
48.039
0.115
0.596
0.009
4.302
3.626
0.914
0.02
0.04
4.317
0.006
0.009
0.003
0.015
0.025
0.034
1.16
11.27
MHD3/100.2
0.335
1.558
9.396
30.78
0.057
1.047
0.018
2.152
25.183
0.394
0.01
0.068
4.301
0.008
0.01
0.004
0.007
0.01
0.056
0.017
0.59
23.99

PhD Thesis | 2019
447
MHD18/192.1
0.31
2.179
13.209
28.236
0.106
4.938
0.018
2.556
20.347
0.467
0.009
0.143
10.623
0.016
0.016
0.006
0.008
0.012
0.045
0.014
0.65
16.01
MHD11/106.2
0.201
3.724
10.909
21.831
0.106
0.741
0.008
1.737
20.837
0.326
0.007
0.122
8.842
0.007
0.003
0.003
0.009
0.049
0.55
29.99
MHD13/228.6
0.111
0.861
18.914
36.875
0.05
4.049
0.018
3.252
15.618
0.813
0.016
0.096
4.194
0.008
0.01
0.006
0.027
0.019
0.026
0.015
0.91
13.95
MHD18/78.8
0.261
1.932
14.311
35.922
0.054
0.582
0.009
2.856
18.058
0.456
0.008
0.058
3.998
0.009
0.004
0.003
0.015
0.05
0.005
1.1 20.17
MHD1/30.8
0.109
0.914
14.317
38.635
0.067
2.049
0.011
2.913
18.532
0.636
0.012
0.06
3.036
0.006
0.008
0.003
0.018
0.015
0.043
0.01
0.75
17.63
MHD13/73.1
0.202
1.715
18.497
50.665
0.055
2.001
0.009
4.364
5.489
0.638
0.018
0.033
4.222
0.006
0.011
0.005
0.045
0.024
0.044
0.011
1.91
10.03
MHD1/60.3
0.074
0.646
9.222
37.552
0.068
1.621
0.017
1.733
24.128
0.409
0.01
0.07
1.971
0.006
0.008
0.005
0.05
0.009
0.043
0.009
0.55
21.65
MHD8/115.2
0.449
1.986
20.075
42.477
0.113
1.086
0.011
3.782
7.947
0.807
0.015
0.049
6.368
0.009
0.009
0.004
0.004
0.02
0.046
0.004
1.16
13.56
MHD9/56.9
0.054
0.581
2.199
6.751
0.026
0.334
0.024
0.497
49.388
0.085
0.05
0.615
0.005
0.002
0.004
0.002
0.025
0.18
39.17
MHD11/86.4
0.064
1.263
3.299
10.078
0.04
0.104
0.009
0.616
44.049
0.104
0.187
2.106
0.003
0.003
0.003
0.049
0.29
37.73
MHD8/71.9
0.094
0.954
6.431
14.711
1.776
1.373
0.012
1.197
38.274
0.235
0.008
0.065
2.51 0.003
0.01
0.07
0.007
0.101
0.008
0.31
31.61
MHD2/89.3
0.675
2.633
15.821
35.968
0.12
1.813
0.012
2.576
15.02
0.676
0.012
0.09
7.214
0.009
0.01
0.003
0.005
0.014
0.042
0.027
0.47
16.79
MHD3/223.1
0.074
0.626
2.992
17.175
0.031
0.878
0.031
0.559
42.254
0.1 0.091
1.12 0.003
0.002
0.004
0.043
0.015
0.17
33.83
MHD2/63.4
0.536
1.715
14.561
34.893
0.204
1.26
0.011
3.247
18.912
0.602
0.01
0.047
3.856
0.007
0.008
0.003
0.003
0.017
0.038
1.05
18.83
MHD3/136.3
0.724
2.816
16.385
39.185
0.101
1.21
0.012
2.988
13.543
0.776
0.015
0.048
6.132
0.009
0.007
0.003
0.006
0.016
0.036
0.003
1.14
14.77
MHD9/12.8
0.028
0.249
0.127
0.41 0.009
0.024
0.031
0.011
57.98
0.035
0.069
0.003
0.002
0.024
0.1 40.88
MHD2/31.7
0.175
1.496
8.318
23.966
0.102
0.334
0.01
1.593
31.415
0.339
0.009
0.175
3.224
0.006
0.004
0.003
0.009
0.076
0.57
28.15
MHD11/200.1
0.398
1.475
12.273
36.906
0.042
2.17
0.017
2.692
18.752
0.528
0.011
0.06
3.429
0.007
0.008
0.004
0.003
0.015
0.034
0.02
0.65
20.37

PhD Thesis | 2019
448
MHD1/115.1
0.06
0.69
4.194
26.02
0.04
1.343
0.022
0.94
34.285
0.183
0.005
0.045
1.426
0.005
0.002
0.015
0.006
0.036
0.007
0.22
30.34
MHD1/137.9
0.034
0.639
1.88 21.262
0.05
2.771
0.02
0.326
38.592
0.07
0.073
3.113
0.005
0.004
0.008
0.002
0.032
0.007
0.13
30.98
MHD12/86.4
0.049
0.448
1.364
21.097
0.046
0.102
0.023
0.232
42.606
0.052
0.031
0.535
0.003
0.012
0.052
0.2 33.09
MHD11/89.5
0.154
3.294
13.178
29.022
0.055
0.483
2.016
17.698
0.386
0.01
0.108
6.374
0.005
0.007
0.003
0.005
0.01
0.042
0.82
26.32
MHD3/76.8
0.163
1.432
7.388
18.882
0.068
0.92
0.01
1.383
34.858
0.275
0.007
0.112
2.676
0.008
0.003
0.007
0.068
0.36
31.38
MHD9/68.8
0.09
1.093
4.852
13.963
0.031
0.965
0.013
1.066
41.275
0.169
0.005
0.083
1.778
0.006
0.003
0.01
0.005
0.049
0.39
34.15
MHD4/105.0
0.021
0.48
0.311
6.608
0.015
0.172
0.015
0.03
56.446
0.102
0.364
0.006
0.004
0.033
0.067
0.014
0.06
35.23
MHD18/109.5
0.582
1.87
15.785
41.564
0.059
1.998
0.016
3.177
12.49
0.582
0.021
0.047
4.81 0.014
0.006
0.018
0.017
0.04
0.011
1.09
15.67
MHD12/103.3
0.119
0.873
2.291
13.869
0.041
0.975
0.027
0.467
44.645
0.091
0.088
1.797
0.005
0.004
0.002
0.003
0.102
0.17
34.43
MHD2/101.9
0.691
2.769
20.994
45.532
0.111
0.597
0.01
4.442
5.192
0.865
0.019
0.042
6.852
0.009
0.01
0.005
0.075
0.026
0.041
1.24
10.39
MHD9/86.9
0.033
0.459
1.265
17.158
0.018
0.425
0.016
0.286
48.758
0.047
0.075
0.83 0.004
0.003
0.011
0.063
0.13
30.36
MHD8/154.6
0.095
1.101
11.65
36.816
0.055
1.996
0.028
2.481
20.264
0.465
0.011
0.069
3.269
0.005
0.008
0.003
0.014
0.013
0.037
0.005
0.79
20.68
MHD12/11.3
0.041
0.454
4.301
12.26
0.106
0.368
0.019
0.836
44.586
0.158
0.004
0.094
0.703
0.003
0.005
0.001
0.005
0.027
0.24
35.62
MHD12/140.0
0.04
0.434
1.852
13.191
0.029
0.612
0.018
0.345
46.503
0.078
0.076
0.707
0.005
0.008
0.002
0.051
0.16
35.89
MHD3/162.4
0.392
1.969
10.316
25.633
0.047
0.751
0.012
2.167
27.792
0.383
0.008
0.034
2.9 0.007
0.004
0.009
0.01
0.061
0 0.56
26.81
MHD13/261.5
0.135
1.002
17.967
41.909
0.081
2.416
0.016
3.696
12.556
0.725
0.014
0.041
2.762
0.008
0.004
0.002
0.017
0.023
0.008
0.67
15.68
MHD13/90.4
0.418
1.527
22.242
45.534
0.108
1.057
0.011
4.192
5.545
0.878
0.02
0.035
4.149
0.007
0.002
0.007
0.022
0.029
0.004
1.16
12.9
MHD12/66.6
0.031
1.291
1.654
8.963
0.045
0.329
0.015
0.293
47.331
0.059
0.156
0.922
0.005
0.006
0.069
0.23
38.59

PhD Thesis | 2019
449
MHD12/28.1
0.023
0.415
0.987
3.931
0.013
0.115
0.011
0.136
53.333
0.026
0.066
0.288
0.004
0.005
0.012
0.108
0.1 40.42
MHD8/92.4
0.074
1.339
17.554
41.882
0.136
1.19
0.011
2.364
11.443
0.588
0.012
0.157
4.125
0.007
0.011
0.042
0.012
0.029
0.009
0.85
18
MHD2/180.0
0.135
0.792
10.124
26.515
0.063
1.771
0.018
2.145
28.228
0.424
0.009
0.048
2.47 0.003
0.007
0.003
0.013
0.036
0.01
0.38
26.61
MHD1/8.4 1.225
2.295
8.041
0.041
0.639
0.023
0.475
46.559
0.079
0.176
1.455
0.004
0.033
0.003
0.032
0.011
0.17
38.73
MHD13/174.8
1.97
7.522
21.194
0.022
1.858
0.02
0.965
30.9 0.275
0.005
0.235
2.724
0.005
0.006
0.004
0.087
0.005
0.025
0.072
0.27
31.72
MHD13/244.2
0.775
9.19 18.864
0.103
1.547
0.035
0.656
33.756
0.354
0.009
0.4 3.888
0.006
0.006
0.003
0.15
0.004
0.038
0.021
0.28
29.91
MHD18/178.9
0.397
2.487
14.94
29.086
0.094
0.706
0.012
3.351
18.716
0.573
0.009
0.119
5.921
0.011
0.007
0.003
0.022
0.017
0.035
0.003
0.76
22.71
MHD11/169.4
0.058
0.564
1.275
12.381
0.026
0.444
0.051
0.189
46.04
0.063
0.004
0.071
0.718
0.006
0.007
0.042
0.16
37.9
MHD18/150.9
0.237
1.596
4.526
12.431
0.049
2.674
0.026
0.794
40.082
0.193
0.006
0.108
4.82 0.007
0.01
0.004
0.004
0.103
0.007
0.32
31.99
MHD18/52.6
0.075
1.125
4.75 10.735
0.032
0.325
0.017
0.832
42.788
0.164
0.21
2.955
0.005
0.007
0.004
0.002
0.004
0.059
0.24
35.67
MHD3/195.8
0.2 6.784
6.373
14.552
0.068
0.334
0.033
1.081
23.204
0.207
0.006
0.241
12.004
0.004
0.002
0.006
0.027
0.23
34.56
MHD2/132.6
0.487
2.205
16.14
34.637
0.118
2.555
0.012
3.112
13.487
0.655
0.013
0.132
7.417
0.009
0.009
0.004
0.002
0.014
0.019
0.006
0.61
18.32
MHD3/118.8
0.389
1.373
8.963
41.267
0.04
2.313
0.015
1.737
19.447
0.3 0.007
0.049
3.947
0.007
0.014
0.005
0.015
0.009
0.052
0.025
0.63
19.38
MHD13/67.4
0.196
0 8.742
23.383
0.039
3.559
0.032
1.674
30.25
0.333
0.007
0.06
4.544
0.008
0.003
0.007
0.009
0.045
0.009
0.54
26.52
MHD2/145.3
0.065
0.545
2.86 12.842
0.085
1.313
0.017
0.654
44.14
0.108
0.09
1.962
0.004
0.003
0.007
0.003
0.047
0.16
35.08
MHD3/238.2
0.204
1.026
13.147
53.162
0.066
2.455
0.021
3.43
10.471
0.538
0.011
0.073
3.301
0.006
0.011
0.004
0.007
0.018
0.02
0.021
0.94
10.75

PhD Thesis | 2019
450
Carbonate Pore Systems of the Carboniferous Hodder Mudstone
Formation, Bowland Basin, UK*
Timothy M. Ohiara1, Kevin G. Taylor2, and Patrick J. Dowey2
Search and Discovery Article #51399 (2017)** Posted August 7, 2017
*Adapted from poster presentation given at AAPG 2017 Annual Convention and Exhibition, Houston, Texas, April 2-5, 2017 **Datapages © 2017 Serial rights given by author. For all other rights contact author directly.
1School of Earth and Environmental Science, The University of Manchester, Manchester, United Kingdom ([email protected])
2School of Earth and Environmental Science, The University of Manchester, Manchester, United Kingdom
Abstract
Pores in shales or mudstones are mostly submillimetre-scale pores hosted in and around inorganic constituents and in mature organic matter residues. Micrometre– and nanometer– scale pores between and within particles of carbonate-rich sequences are strongly influenced by carbonate mineral diagenesis. The Lower Carboniferous Hodder Mudstone Formation in the Bowland Basin is a potential UK shale-gas play and provides an opportunity to understand the compositional controls on porosity in an organic- and carbonate-rich mudstone. This is achieved through the characterisation of pore types and mineral components from a suite of wells along the northern margin of the Bowland Basin. The work utilises petrographic, XRD, X-ray CT, and N2 gas-adsorption techniques.
Samples were divided into nine lithofacies which provided a framework to establish compositions, textures, pore types, and depositional environments. Lithofacies were then grouped into associations: (A1) clay-rich mudstones – >50 % clay-sized particles; (A2) – calcareous siltrich mudstones, and (A3) Skeletal calcareous mudstones. A1 (~40% of samples) exhibited rare planar to convolute laminae, but were mostly unlaminated. A2 (~30 % of samples) were largely unlaminated, but where A2 lithofacies grade into A1 they formed discontinuous ripple laminations. A3 (~30 % of samples) exhibited ripple laminations except for the rare occurrences of storm-brecciated, crinoidal beds within mudstones. Within the cores, lithofacies fine upwards from coarse-grained bioclast-rich mudstones to medium grained silt-rich mudstones and then fine-grained organic-rich mudstones.
Pore types included interparticle, intercrystalline, and intraparticle forms. Macropores (>4mm) exhibited vuggy intercrystalline pore morphologies within veins localised in the calcisiltites; while micro- to nano-pores (<62.5μm) occurred within pyrite framboids (intraparticle), between clay minerals and grains (interparticle) and in organic matter particles. In the clay-rich mudstones, pores within pyrite framboids and clay minerals

PhD Thesis | 2019
451
were <300nm in diameter and comprised a large percentage of the pore volume. The skeletal calcareous mudstones exhibited <1μm sized-pores due to carbonate cementation and pore-filling kaolinite. Despite modifications made by early and late diagenesis, pore analysis show that porosity in the Hodder Mudstone is primarily controlled by compositional variation of detrital and biogenic grain.
Reference
Ohiara, T., Taylor, K. & Dowey, P., 2017. Complex Carbonate Pore Systems of the Carboniferous Hodder Mudstone Formation, Bowland Basin, UK. In AAPG Annual Convention and Exhibition. pp. 1–6.