fabrication, photocatalytic and adsorption of...
TRANSCRIPT

FABRICATION, PHOTOCATALYTIC AND
ADSORPTION OF IMMOBILIZED TiO2/CHITOSAN-
MONTMORILLONITE AND TiO2/POLYANILINE
BILAYER SYSTEMS FOR THE REMOVAL OF
METHYL ORANGE DYE FROM AQUEOUS
SOLUTIONS
NOOR NAZIHAH BINTI BAHRUDIN
UNIVERSITI SAINS MALAYSIA
2016

FABRICATION, PHOTOCATALYTIC AND
ADSORPTION OF IMMOBILIZED
TiO2/CHITOSAN-MONTMORILLONITE AND
TiO2/POLYANILINE BILAYER SYSTEMS FOR
THE REMOVAL OF METHYL ORANGE DYE
FROM AQUEOUS SOLUTIONS
by
NOOR NAZIHAH BINTI BAHRUDIN
Thesis submitted in fulfillment of the requirements
for the degree of
Doctor of Philosophy
September 2016

ii
ACKNOWLEDGEMENT
IN THE NAME OF ALLAH THE MOST GRACIOUS AND MOST MERCIFUL
First and foremost, all the praises and thanks are towards Allah, the Almighty,
Who had given me strength, health and courage to complete this thesis. Special
appreciation is dedicated to my research supervisor and mentor, Professor Dr Hj
Mohd Asri Nawi who has been coaching me, especially in research from nothing till
who I am today. Thank you, Prof, for your wise advice, patience, concern and
constructive guidance throughout these years.
Special thanks are also awarded to Ministry of Higher Education of Malaysia
for the sponsorship under My Phd program; FRGS grant; 203/PKIMIA/6711228 and
Universiti Sains Malaysia for all the facilities provided. This thesis would not be
completed without the help of these dedicated people; Mrs Nor Hayati, Mr Zamri,
Mr Sujay, Mr Siva, Mr Johari, Ms Jamilah, Mrs Arlita, Mr Ong, Mr Yushamdan,
SCS lecturers and supporting staff and to those whose names I didn’t mention here,
thanks a lot for your endless cooperation and patience during the period of my study.
Special thanks are also forwarded to my amazing and inspiring colleagues; Dr
Sumiyyah, Dr Wan Izhan, Dr Ali, Dr Lelifajri, Dr Sharin, Dr Karam, Dr Ngoh, soon
to be Dr; Nazrina, Fathanah, Salmiah, Sheilatina, Norlizawati and Wan Siti Azahayu
for their informative discussion and self-encouragement.
Last but not least, an endless appreciation is dedicated to my beloved family
members, my father, Hj. Bahrudin Daud, my mother, Hjh. Maimunah Yunus, my
sisters, Maisarah and Yuhanis for the everlasting love, support and encouragement
through the thick and thin moments of my life. Hopefully, all the experiences,
knowledge and practices that I gained throughout these years would make me a
better person for myself, family, religion and nation, insya Allah.
iii
TABLE OF CONTENTS
Acknowledgement
ii
Table of Contents
iii
List of Tables
xiv
List of Figures
xvii
List of Abbreviations
xxviii
Abstrak
xxx
Abstract
xxxii
CHAPTER ONE: INTRODUCTION
1.1 Photocatalysis: Historical Overview 1
1.2 Heterogeneous photocatalysis 4
1.3 Titanium dioxide 6
1.3.1 Ideal photocatalyst
1.3.2 Structure and properties
1.3.3 Mechanism of the TiO2 photocatalysis
1.3.4 Langmuir Hinshelwood kinetic model
1.3.5 Drawbacks and improvements
6
7
8
10
12
1.4 Chitosan (CS) 15
1.4.1 Origin of CS
1.4.2 Applications of CS
1.4.3 Modification of CS
15
16
17
1.5 Montmorillonite
1.5.1 Structure and properties
1.5.2 Applications of MT in environmental remediation
20
20
21

iv
1.6 Conducting polymer: Polyaniline 22
1.7 Adsorption
1.7.1 Kinetic models
1.7.2 Diffusion model
1.7.3 Isotherm models
25
25
26
27
1.8 Combination of TiO2 with polymers and clay
1.8.1 TiO2-CS
1.8.2 TiO2-MT
1.8.3 TiO2-conducting polymers
28
28
29
30
1.9 Immobilized photocatalysts 32
1.10 Immobilized layer by layer arrangements (bilayer system) 34
1.11 Mechanism of bilayer systems
1.11.1 Solid-state oxidation
1.11.2 Charge transfer
1.11.2(a) Dye-saturated
1.11.2(b) Incorporation of Fe3+
1.11.3 Photocatalytic-adsorptive removal processes
39
39
40
40
41
42
1.12 Water pollution from textile dyes: Methyl orange 43
1.13 Problem statements 46
1.14 Research objectives 47
CHAPTER TWO: MATERIALS AND METHODS
2.1 Chemicals and Reagents 49
2.2 Instruments and equipments 50
2.3 Reactor set-up 51
v
2.4 Preparation of CS and CS-MT casting solutions 52
2.5 Preparation of ENR50 solution 52
2.6 Preparation of ENR50-PVC polymer blend 53
2.7 Preparation of TiO2 formulation 53
2.8 Synthesis of PANI powder 53
2.9 Preparation of PANI formulation 54
2.10 Preparation of MO stock and standard solution 54
2.11 Fabrication of immobilized adsorbent and photocatalyst plates
2.11.1 Fabrication of CS/GP and CS-MT/GP
2.11.2 Fabrication of TiO2/CS-MT/GP
2.11.3 Fabrication of PANI/GP
2.11.4 Fabrication of TiO2/PANI/GP
55
55
55
55
56
2.12 Physical characterizations
2.12.1 Scanning electron microscopy-Energy dispersive X-Ray
2.12.2 Surface area and porosity
2.12.3 X-Ray diffraction
2.12.4 Photoluminescence
2.12.5 UV-Visible diffuse reflectance
2.12.6 Fourier transform infrared
56
56
56
57
57
57
58
2.13 Physical and chemical analyses
2.13.1 Adherence test
2.13.2 Point of zero charge (pHpzc)
2.13.3 Swelling index (SI)
2.13.4 Total organic carbon (TOC)
2.13.5 Detection of hydroxyl radicals
58
58
59
60
60
61
vi
2.13.6 Ion chromatography (IC) 61
2.14 Batch adsorption study
2.14.1 Optimization of CS loading within the CS-MT casting
solution
2.14.2 Optimization of MT loading within the CS-MT casting
solution
2.14.3 Optimization of CS-MT loading
2.14.4 The effect of initial pH of the MO solutions
2.14.5 Comparison on adsorption of MO by CS-MT powder and
CS-MT/GP
2.14.6 Thermodynamic study
62
63
64
64
64
65
65
2.15 Regeneration of spent CS-MT/GP
2.15.1 Effect of initial pH of ultra pure water on the desorption of
MO
2.15.2 Photocatalytic regeneration of CS-MT/GP
2.15.3 Reusability of the regenerated CS-MT/GP
66
66
66
67
2.16 Photocatalytic and adsorption experiments
2.16.1 Photocatalytic degradation experiment
2.16.2 Adsorption experiment
67
67
68
2.17 Evaluation on the photocatalytic activity and adsorption of the
systems
68
2.18 Fabrication of TiO2/CS-MT/GP bilayer system
2.18.1 Optimization of CS-MT/GP adsorbent sub-layer loading
2.18.2 Optimization of TiO2 top layer loading
69
69
69
2.19 Adsorption of MO by the TiO2/CS-MT/GP bilayer system
2.19.1 Effect of initial MO concentrations
2.19.2 Thermodynamic study
70
70
70

vii
2.20 The optimization of the operational parameters
2.20.1 Effect of initial pH of MO solution
2.20.2 Effect of initial MO concentrations
70
70
71
2.21 Detection of radical quenchers 71
2.22 Photo-etching of TiO2/CS-MT/GP 72
2.23 Oxidation of CS within the CS-MT composite 72
2.24 Optimization of the regeneration time of TiO2/CS-MT/GP
73
2.25 Evaluation on the reusability of TiO2/CS-MT/GP 73
2.26 Mineralization of MO
2.26.1 Dissolved organic carbon
2.26.2 Ion chromatography analysis
2.26.3 pH changes
73
73
74
74
2.27 Detection of intermediates during MO degradation 74
2.28 Preparation of PANI formulation
2.28.1 Optimization of the amount of PVC powder within PANI
formulation
2.28.2 Optimization of the amount of PANI powder within PANI
formulation
2.28.3 Optimization of PANI loading in PANI/GP
2.28.4 Effect of initial pH of MO solutions
2.28.5 Effect of aeration flow rate
2.28.6 Effect of initial MO concentrations
2.28.7 Thermodynamic study
75
75
75
76
76
76
76
77
2.29 Fabrication of TiO2/PANI/GP
2.29.1 Optimization of PANI sub-layer loading
2.29.2 Optimization of TiO2 loading
77
77
78

viii
2.30 Adsorption studies
2.30.1 Effect of the initial MO concentrations
2.30.2 Thermodynamic study
78
78
78
2.31 Photocatalytic-adsorptive removal of MO by TiO2/PANI/GP
2.31.1 Effect of initial pH of MO solutions
2.31.2 Effect of aeration flow rate
2.31.3 Effect of initial concentrations of MO
79
79
79
79
2.32 Photo-etching of TiO2/PANI/GP 80
2.33 Evaluation on the reusability of the TiO2/PANI/GP 80
2.34 Mineralization study
2.34.1 Dissolved organic carbon
2.34.2 Ion chromatography analysis
2.34.3 pH changes
81
81
81
81
2.35 Detection of intermediates 81
CHAPTER THREE: ADSORPTION OF METHYL ORANGE
ONTO IMMOBILIZED CHITOSAN-
MONTMORILLONITE (CS-MT/GP)
3.1 Introduction 83
3.2 Optimization of the CS:MT ratio in casting solution
3.2.1 Optimization of CS loading within the CS-MT casting
solution
3.2.2 Optimization of MT loading within the CS-MT casting
solution
84
84
87
3.3 Characterizations of CS-MT composite (1:0.12 ratio of CS:MT)
3.3.1 Scanning electron microscopy-Energy dispersive X-Ray
(SEM-EDX)
3.3.2 Surface area and porosity
90
90
93

ix
3.3.3 Fourier transform infrared (FT-IR)
3.3.4 X-Ray diffraction (XRD)
94
96
3.4 Effect of parameters on adsorption of MO
3.4.1 Effect of CS-MT/GP loading on contact time
3.4.2 Effect of initial pH of MO solutions
98
98
100
3.5 Adsorption studies
3.5.1 Effect of initial concentrations on contact time
3.5.2 Kinetic studies
3.5.2(a) Pseudo first and second order models
3.5.2(b) Intraparticle diffusion
3.5.3 Isotherm studies
103
103
107
107
112
115
3.6 Thermodynamic study 118
3.7 Regeneration of spent CS-MT/GP
3.7.1 Desorption study of MO from the spent CS-MT/GP
3.7.2 Photocatalytic regeneration of spent CS-MT/GP
120
121
123
3.8 Characterizations of regenerated CS-MT/GP
3.8.1 UV-Visible diffuse reflectance spectroscopy (UV-Vis DRS)
3.8.2 Surface area and Fourier transform infrared (FT-IR)
analyses
3.8.3 Reusability of the regenerated CS-MT/GP
124
124
126
127
CHAPTER FOUR: PHOTOCATALYTIC-ADSORPTIVE REMOVAL
OF METHYL ORANGE BY TiO2/CS-MT/GP
4.1 Introduction
130
4.2 Fabrication of TiO2/CS-MT/GP
4.2.1 Preliminary study
131
131

x
4.2.2 Optimization of CS-MT/GP sub-layer loading
4.2.3 Optimization of TiO2 loading
134
137
4.3 Adsorption studies
4.3.1 Effect of initial concentrations on contact time
4.3.2 Kinetic studies
4.3.3 Isotherm studies
4.3.4 Thermodynamic study
140
140
141
145
146
4.4 Characterizations of TiO2/CS-MT/GP
4.4.1 Photoluminiscense analysis
4.4.2 UV-Vis diffuse reflectance spectroscopy
147
147
148
4.5 Effect of operational parameters on the photocatalytic-adsorptive
removal of MO by TiO2/CS-MT/GP
4.5.1 Effect of initial pH of MO solutions
4.5.2 Effect of initial MO concentrations
151
151
154
4.6 Identification of main oxidants in photocatalytic-adsorptive removal
processes
4.6.1 Effect of N2 gas
4.6.2 Effect of radical quenchers
4.6.3 Detection of hydroxyl radicals
156
156
157
160
4.7 Photo-etching of TiO2/CS-MT/GP
161
4.8 Oxidation of CS within the CS-MT composite
165
4.9 Mechanism of TiO2/CS-MT/GP photocatalytic-adsorptive removal
processes
169
4.10 Reusability study
4.10.1 Effect of regeneration time of TiO2/CS-MT/GP
4.10.2 Evaluation on the reusability of TiO2/CS-MT/GP
171
171
173
4.11 Mineralization of MO 176

xi
4.11.1 Total organic carbon
4.11.2 Evolution of ions
4.11.3 pH changes
176
178
182
4.12 Detection of intermediates 183
CHAPTER FIVE: ADSORPTION OF METHYL ORANGE ONTO
PANI POWDER AND PANI/GP
5.1 Introduction
188
5.2 Preparation of PANI formulation
5.2.1 Optimization of the amount of PVC powder within PANI
formulation
5.2.2 Optimization of the amount of PANI powder within PANI
formulation
189
189
192
5.3 Characterizations of PANI powder and PANI-ENR50-PVC
composite
5.3.1 Scanning electron microscopy-Energy dispersive X-Ray
5.3.2 Surface area and porosity
5.3.3 Fourier transform infrared (FT-IR)
5.3.4 UV-Vis diffuse reflectance spectroscopy
194
194
197
199
201
5.4 Effect of parameters on adsorption of MO
5.4.1 Effect of PANI sub-layer loading of PANI/GP
5.4.2 Effect of initial pH of MO solutions
5.4.3 Effect of aeration flow rate
202
202
204
206
5.5 Adsorption studies
5.5.1 Effect of initial concentrations on contact time
5.5.2 Kinetic studies
5.5.2(a) Pseudo first and second order models
5.5.2(b) Intraparticle diffusion model
208
208
211
211
215

xii
5.5.3 Isotherm studies 218
5.6 Thermodynamic study 222
CHAPTER SIX: PHOTOCATALYTIC-ADSORPTIVE REMOVAL
OF METHYL ORANGE BY TiO2/PANI/GP
6.1 Introduction
225
6.2 Fabrication of TiO2/PANI/GP bilayer system
6.2.1 Preliminary study
6.2.2 Optimization of PANI sub-layer loading
6.2.3 Optimization of TiO2 loading
226
226
230
234
6.3 Adsorption studies
6.3.1 Effect of initial concentrations on contact time
6.3.2 Kinetic studies
6.3.3 Isotherm studies
6.3.4 Thermodynamic study
237
237
238
242
243
6.4 Characterizations of TiO2/PANI/GP
6.4.1 Photoluminescence analysis
6.4.2 UV-Vis diffuse reflectance spectroscopy
6.4.3 Detection of hydroxyl radicals
244
244
245
247
6.5 Operational parameters
6.5.1 Effect of initial pH of MO solutions
6.5.2 Effect of aeration flow rate
6.5.3 Effect of initial MO concentrations
249
249
251
253
6.6 Photo-etching of TiO2/PANI/GP
254
6.7 Mineralization studies
6.7.1 Dissolved organic carbon
257
257
xiii
CHAPTER SEVEN: COMPARISON ON THE PERFORMANCE
AND CHARACTERISTICS OF THE TiO2/CS-
MT/GP AND TiO2/PANI/GP BILAYER
SYSTEMS
7.1 Introduction
270
7.2 Evaluation on the reusability of the bilayer systems 270
7.3 Adsorption studies
7.3.1 Effect of initial concentrations on contact time
7.3.2 Kinetic and isotherm studies
7.3.3 Thermodynamic study
274
274
276
277
7.4 Physical characterizations
7.4.1 Photoluminescence analysis
7.4.2 UV-Vis diffuse reflectance analysis
7.4.3 Detection of hydroxyl radicals
280
280
281
283
7.5 Summary of the comparative study between TiO2/CS-MT/GP and
TiO2/PANI/GP bilayer systems
284
CHAPTER EIGHT: CONCLUSIONS AND FUTURE
RECOMMENDATIONS
8.1 Conclusions
286
8.2 Future recommendations 291
6.7.2 Evolution of ions
6.7.3 pH changes
258
261
6.8 Evaluation on the reusability of TiO2/PANI/GP 262
6.9 Detection of intermediates 265
REFERENCES
293
APPENDICES
319
ADDENDUM 326

xiv
LIST OF TABLES
Page
Table 1.1 The characteristics match of ideal and TiO2 photocatalyst
6
Table 1.2 Various methods for synthesization of PANI
24
Table 1.3 Combination of TiO2 and polymers and their preparation
method for the photocatalytic degradation of various
pollutants
31
Table 1.4 Properties of methyl orange (MO) dye
45
Table 3.1 Percentage of elements present in CS/GP and CS-MT/GP
92
Table 3.2 BET results for MT powder, CS flakes, CS film and different
ratios of CS-MT composites
94
Table 3.3 Summary of wavenumbers of the peaks present in CS and MT
and their respective peak assignments
95
Table 3.4 Mean basal spacing of MT and CS-MT composite
97
Table 3.5 Point of zero charge of CS and CS-MT composite
102
Table 3.6 Pseudo first and second order kinetic model parameters,
coefficient of determination and Chi square for the adsorption
of MO onto CS-MT powder and CS-MT/GP
111
Table 3.7 Intraparticle diffusion parameters and coefficient of
determination for the adsorption of MO onto CS-MT powder
and CS-MT/GP
114
Table 3.8 Isotherm parameters and coefficient of determination for the
adsorption of MO onto CS-MT powder and CS-MT/GP
117
Table 3.9 Thermodynamic parameters for the adsorption of MO onto
CS-MT powder and CS-MT /GP
120
Table 3.10 BET results for fresh and regenerated CS-MT/GP 127
Table 4.1 Cross section thickness of different CS-MT/GP loadings at a
fixed TiO2 top layer loading in TiO2/CS-MT/GP system
137
Table 4.2 Cross section area thickness of different TiO2 loadings at a
fixed CS-MT sub-layer loading in TiO2/CS-MT/GP system
140

xv
Table 4.3 Pseudo first order, pseudo second order and intraparticle
diffusion constants, coefficient of determination and Chi
square for the adsorption of MO at different initial
concentrations
144
Table 4.4 Langmuir and Freundlich isotherm constants and coefficient
of determination for the adsorption of MO onto TiO2/CS-
MT/GP
145
Table 4.5 Thermodynamic parameters for the adsorption of MO onto
TiO2/CS-MT/GP
147
Table 4.6 Band-gap energies and wavelength absorption edge of
TiO2/CS-MT/GP, TiO2/CS/GP and TiO2/GP
151
Table 4.7 The products of photocatalytic-adsorptive removal of MO by
TiO2/CS-MT/GP as identified by MS analysis
186
Table 5.1 Percentage of elements present in PANI powder and PANI-
ENR50-PVC composite
196
Table 5.2 BET results for PANI powder and PANI-ENR50-PVC
composite
197
Table 5.3 Summary of wavenumbers of the peaks present in PANI
powder and PANI-ENR50-PVC composite and their respective
peak assignments
200
Table 5.4 Point of zero charge of PANI powder and PANI/GP
206
Table 5.5 Pseudo first and second order kinetic model parameters,
coefficient of determination and Chi square for the adsorption
of MO onto PANI powder and PANI/GP
214
Table 5.6 Intraparticle diffusion parameters and coefficient of
determination for the adsorption of MO onto PANI powder
and PANI/GP
218
Table 5.7 Isotherm parameters and coefficient of determination for the
adsorption of MO onto PANI powder and PANI/GP
221
Table 5.8 Adsorption capacities of PANI and immobilized PANI
composites on adsorption of MO
221
Table 5.9 Thermodynamic parameters for the adsorption of MO onto
PANI powder and PANI/GP
224
Table 6.1 Cross section area thickness of PANI layer loadings at a fixed
TiO2 top layer loading
234
xvi
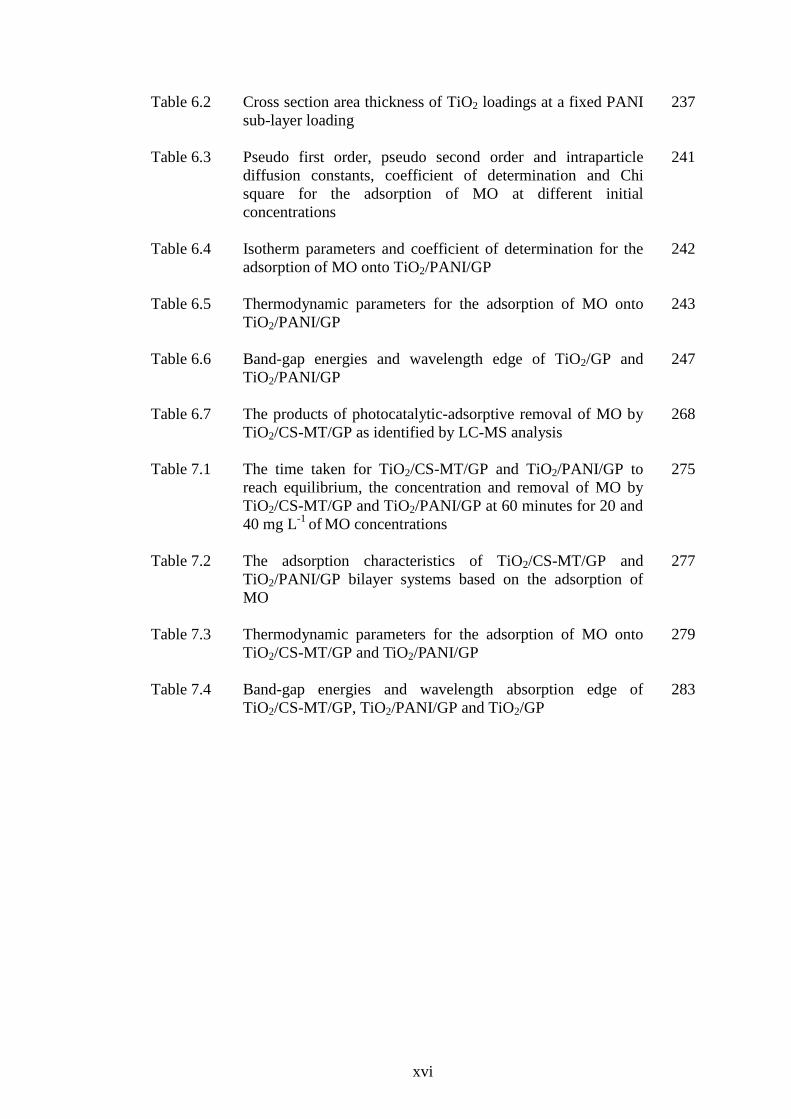
Table 6.2 Cross section area thickness of TiO2 loadings at a fixed PANI
sub-layer loading
237
Table 6.3 Pseudo first order, pseudo second order and intraparticle
diffusion constants, coefficient of determination and Chi
square for the adsorption of MO at different initial
concentrations
241
Table 6.4 Isotherm parameters and coefficient of determination for the
adsorption of MO onto TiO2/PANI/GP
242
Table 6.5 Thermodynamic parameters for the adsorption of MO onto
TiO2/PANI/GP
243
Table 6.6 Band-gap energies and wavelength edge of TiO2/GP and
TiO2/PANI/GP
247
Table 6.7 The products of photocatalytic-adsorptive removal of MO by
TiO2/CS-MT/GP as identified by LC-MS analysis
268
Table 7.1 The time taken for TiO2/CS-MT/GP and TiO2/PANI/GP to
reach equilibrium, the concentration and removal of MO by
TiO2/CS-MT/GP and TiO2/PANI/GP at 60 minutes for 20 and
40 mg L-1
of MO concentrations
275
Table 7.2 The adsorption characteristics of TiO2/CS-MT/GP and
TiO2/PANI/GP bilayer systems based on the adsorption of
MO
277
Table 7.3 Thermodynamic parameters for the adsorption of MO onto
TiO2/CS-MT/GP and TiO2/PANI/GP
279
Table 7.4 Band-gap energies and wavelength absorption edge of
TiO2/CS-MT/GP, TiO2/PANI/GP and TiO2/GP
283
xvii
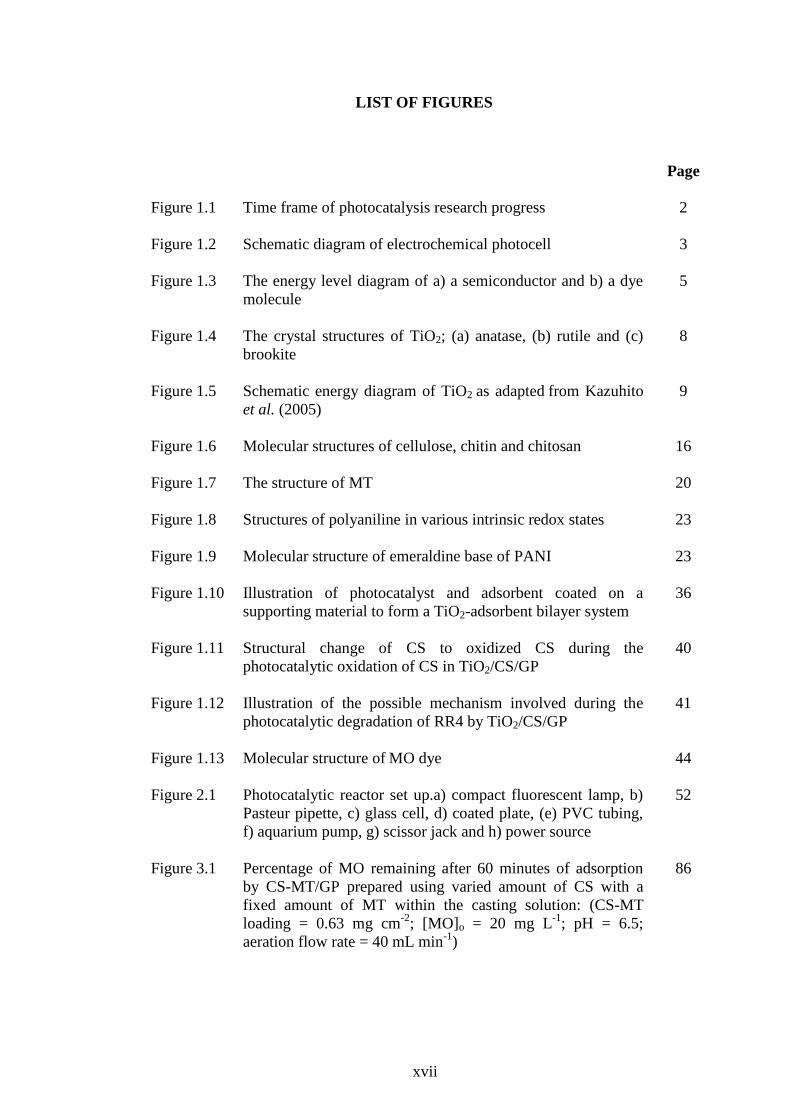
LIST OF FIGURES
Page
Figure 1.1 Time frame of photocatalysis research progress
2
Figure 1.2 Schematic diagram of electrochemical photocell 3
Figure 1.3 The energy level diagram of a) a semiconductor and b) a dye
molecule
5
Figure 1.4 The crystal structures of TiO2; (a) anatase, (b) rutile and (c)
brookite
8
Figure 1.5 Schematic energy diagram of TiO2 as adapted from Kazuhito
et al. (2005)
9
Figure 1.6 Molecular structures of cellulose, chitin and chitosan
16
Figure 1.7 The structure of MT
20
Figure 1.8 Structures of polyaniline in various intrinsic redox states
23
Figure 1.9 Molecular structure of emeraldine base of PANI
23
Figure 1.10 Illustration of photocatalyst and adsorbent coated on a
supporting material to form a TiO2-adsorbent bilayer system
36
Figure 1.11 Structural change of CS to oxidized CS during the
photocatalytic oxidation of CS in TiO2/CS/GP
40
Figure 1.12 Illustration of the possible mechanism involved during the
photocatalytic degradation of RR4 by TiO2/CS/GP
41
Figure 1.13 Molecular structure of MO dye
44
Figure 2.1 Photocatalytic reactor set up.a) compact fluorescent lamp, b)
Pasteur pipette, c) glass cell, d) coated plate, (e) PVC tubing,
f) aquarium pump, g) scissor jack and h) power source
52
Figure 3.1 Percentage of MO remaining after 60 minutes of adsorption
by CS-MT/GP prepared using varied amount of CS with a
fixed amount of MT within the casting solution: (CS-MT
loading = 0.63 mg cm-2
; [MO]o = 20 mg L-1
; pH = 6.5;
aeration flow rate = 40 mL min-1
)
86
xviii
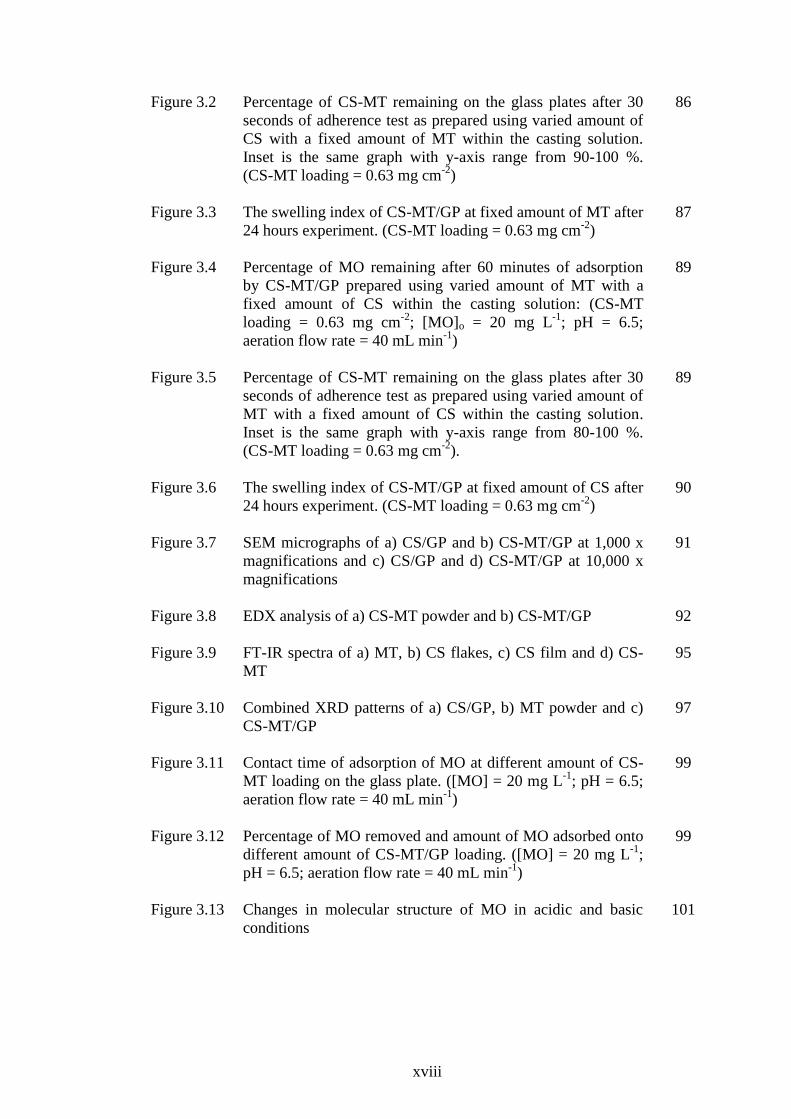
Figure 3.2 Percentage of CS-MT remaining on the glass plates after 30
seconds of adherence test as prepared using varied amount of
CS with a fixed amount of MT within the casting solution.
Inset is the same graph with y-axis range from 90-100 %.
(CS-MT loading = 0.63 mg cm-2
)
86
Figure 3.3 The swelling index of CS-MT/GP at fixed amount of MT after
24 hours experiment. (CS-MT loading = 0.63 mg cm-2
)
87
Figure 3.4 Percentage of MO remaining after 60 minutes of adsorption
by CS-MT/GP prepared using varied amount of MT with a
fixed amount of CS within the casting solution: (CS-MT
loading = 0.63 mg cm-2
; [MO]o = 20 mg L-1
; pH = 6.5;
aeration flow rate = 40 mL min-1
)
89
Figure 3.5 Percentage of CS-MT remaining on the glass plates after 30
seconds of adherence test as prepared using varied amount of
MT with a fixed amount of CS within the casting solution.
Inset is the same graph with y-axis range from 80-100 %.
(CS-MT loading = 0.63 mg cm-2
).
89
Figure 3.6 The swelling index of CS-MT/GP at fixed amount of CS after
24 hours experiment. (CS-MT loading = 0.63 mg cm-2
)
90
Figure 3.7 SEM micrographs of a) CS/GP and b) CS-MT/GP at 1,000 x
magnifications and c) CS/GP and d) CS-MT/GP at 10,000 x
magnifications
91
Figure 3.8 EDX analysis of a) CS-MT powder and b) CS-MT/GP
92
Figure 3.9 FT-IR spectra of a) MT, b) CS flakes, c) CS film and d) CS-
MT
95
Figure 3.10 Combined XRD patterns of a) CS/GP, b) MT powder and c)
CS-MT/GP
97
Figure 3.11 Contact time of adsorption of MO at different amount of CS-
MT loading on the glass plate. ([MO] = 20 mg L-1
; pH = 6.5;
aeration flow rate = 40 mL min-1
)
99
Figure 3.12 Percentage of MO removed and amount of MO adsorbed onto
different amount of CS-MT/GP loading. ([MO] = 20 mg L-1
;
pH = 6.5; aeration flow rate = 40 mL min-1
)
99
Figure 3.13 Changes in molecular structure of MO in acidic and basic
conditions
101

xix
Figure 3.14 Percentage of MO removed and the amount of MO adsorbed
by CS-MT/GP at different initial pH of MO solutions. (CS-
MT loading = 1.27 mg cm-2
; [MO] = 20 mg L-1
; aeration flow
rate = 40 mL min-1
)
103
Figure 3.15 The amount of MO adsorbed by a) CS-MT powder and b) CS-
MT/GP at different MO initial concentrations. (mass of CS-
MT powder = 40 mg; CS-MT/GP loading = 1.27 mg cm-2
; pH
= 6.5; aeration flow rate = 40 mL min-1
)
106
Figure 3.16 Pseudo first order kinetic plots for the adsorption of MO onto
a) CS-MT powder and b) CS-MT/GP
109
Figure 3.17 Pseudo second order kinetic plots for the adsorption of MO
onto (a) CS-MT powder and (b) CS-MT/GP
110
Figure 3.18 Intraparticle diffusion plots for the adsorption of MO onto a)
CS-MT powder and b) CS-MT/GP
114
Figure 3.19 Combined plots of CS-MT powder and CS-MT/GP for a)
Langmuir, b) Freundlich and c) Dubinin Radushkevich
isotherm model
117
Figure 3.20 van’t Hoff ‘s plots for adsorption of MO onto CS-MT powder
and CS-MT/GP
119
Figure 3.21 Percentage of MO desorbed from the spent CS-MT/GP in
UPW solution adjusted to pH 4, pH 7 and pH 11. (CS-MT
loading = 1.27 mg cm-2
)
122
Figure 3.22 TOC values and percentage of MO removed from the spent
CS-MT/GP during the photocatalytic regeneration in ultra
pure water adjusted to pH 4, pH 7 and pH 11. (CS-MT
loading = 1.27 mg cm-2
)
124
Figure 3.23 UV-Vis DRS of photocatalytic regeneration of spent CS-
MT/GP profile at a) pH 4, b) pH 7 and c) pH 11
126
Figure 3.24 FT-IR spectra for a) fresh and b) regenerated CS-MT/GP
127
Figure 3.25 The removal of MO for five cycles by fresh plate and after the
first, second and third photocatalytic regeneration of CS-
MT/GP.(CS-MT loading = 1.27 mg cm-2
; [MO]o = 20 mg L-1
;
pH = 6.5; aeration flow rate = 40 mL min-1
)
128
Figure 4.1 a) Percentage of MO removed and b) pseudo first order rate
constants after 60 minutes irradiation of different individual
systems in TiO2/CS-MT/GP. (TiO2 loading = 1.56 mg cm-2
;
CS loading, CS-MT= 1.27 mg cm-2
; [MO]o = 20 mg L-1
; pH =
6.5; aeration flow rate = 40 mL min-1
)
133
xx
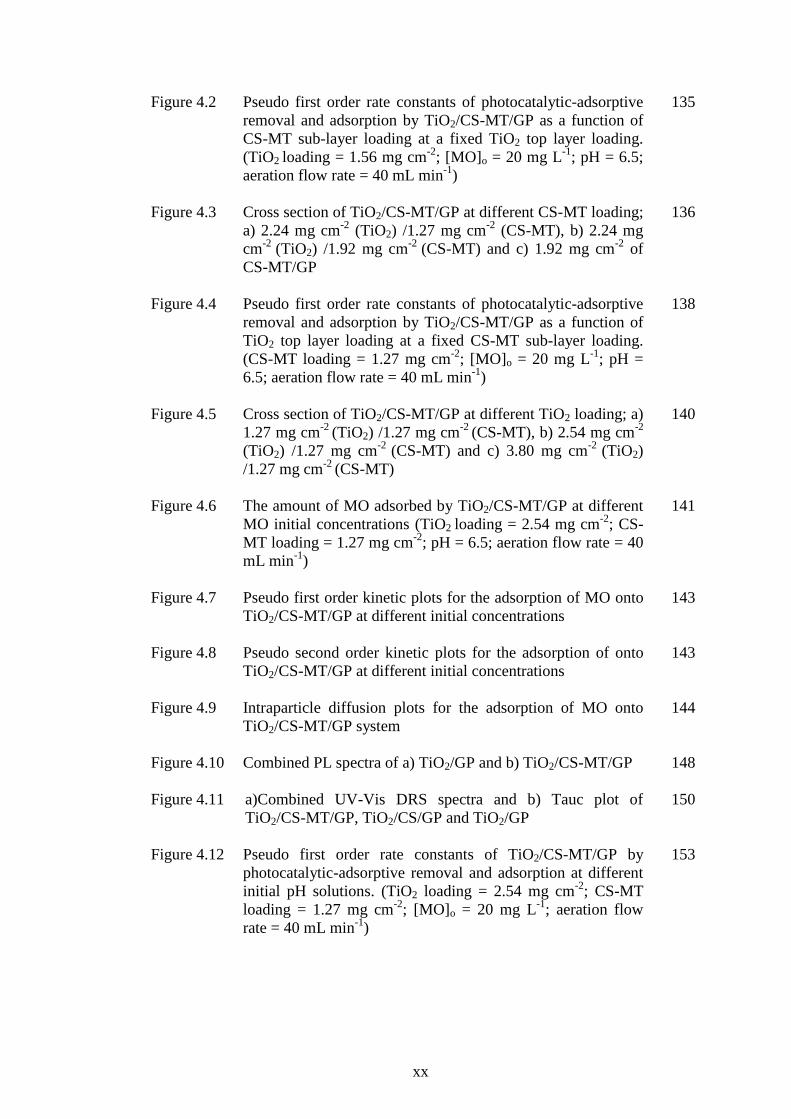
Figure 4.2 Pseudo first order rate constants of photocatalytic-adsorptive
removal and adsorption by TiO2/CS-MT/GP as a function of
CS-MT sub-layer loading at a fixed TiO2 top layer loading.
(TiO2 loading = 1.56 mg cm-2
; [MO]o = 20 mg L-1
; pH = 6.5;
aeration flow rate = 40 mL min-1
)
135
Figure 4.3 Cross section of TiO2/CS-MT/GP at different CS-MT loading;
a) 2.24 mg cm-2
(TiO2) /1.27 mg cm-2
(CS-MT), b) 2.24 mg
cm-2
(TiO2) /1.92 mg cm-2
(CS-MT) and c) 1.92 mg cm-2
of
CS-MT/GP
136
Figure 4.4 Pseudo first order rate constants of photocatalytic-adsorptive
removal and adsorption by TiO2/CS-MT/GP as a function of
TiO2 top layer loading at a fixed CS-MT sub-layer loading.
(CS-MT loading = 1.27 mg cm-2
; [MO]o = 20 mg L-1
; pH =
6.5; aeration flow rate = 40 mL min-1
)
138
Figure 4.5 Cross section of TiO2/CS-MT/GP at different TiO2 loading; a)
1.27 mg cm-2
(TiO2) /1.27 mg cm-2
(CS-MT), b) 2.54 mg cm-2
(TiO2) /1.27 mg cm-2
(CS-MT) and c) 3.80 mg cm-2
(TiO2)
/1.27 mg cm-2
(CS-MT)
140
Figure 4.6 The amount of MO adsorbed by TiO2/CS-MT/GP at different
MO initial concentrations (TiO2 loading = 2.54 mg cm-2
; CS-
MT loading = 1.27 mg cm-2
; pH = 6.5; aeration flow rate = 40
mL min-1
)
141
Figure 4.7 Pseudo first order kinetic plots for the adsorption of MO onto
TiO2/CS-MT/GP at different initial concentrations
143
Figure 4.8 Pseudo second order kinetic plots for the adsorption of onto
TiO2/CS-MT/GP at different initial concentrations
143
Figure 4.9 Intraparticle diffusion plots for the adsorption of MO onto
TiO2/CS-MT/GP system
144
Figure 4.10 Combined PL spectra of a) TiO2/GP and b) TiO2/CS-MT/GP
148
Figure 4.11 a)Combined UV-Vis DRS spectra and b) Tauc plot of
TiO2/CS-MT/GP, TiO2/CS/GP and TiO2/GP
150
Figure 4.12 Pseudo first order rate constants of TiO2/CS-MT/GP by
photocatalytic-adsorptive removal and adsorption at different
initial pH solutions. (TiO2 loading = 2.54 mg cm-2
; CS-MT
loading = 1.27 mg cm-2
; [MO]o = 20 mg L-1
; aeration flow
rate = 40 mL min-1
)
153

xxi
Figure 4.13 Pseudo first order rate constants of TiO2/CS-MT/GP by
photocatalytic-adsorptive removal and adsorption at different
MO initial concentrations. (TiO2 loading = 2.54 mg cm-2
; CS-
MT loading = 1.27 mg cm-2
; pH = 6.5; aeration flow rate = 40
mL min-1
)
155
Figure 4.14 a) Pseudo first order rate constants and b) percentage of MO
remaining after the treatment by TiO2/CS-MT/GP (control
plate) in the presence of quenchers’ solution, (EDTA and
1,4-BQ) and N2 gas. (TiO2 loading = 2.54 mg cm-2
; CS-MT
loading = 1.27 mg cm-2
; [MO]o = mg L-1
; pH = 6.5; aeration
flow rate = 40 mL min-1
)
159
Figure 4.15 Comparison between the individual systems in TiO2/CS-MT
on the production of hydroxyl radicals (•OH): a) TiO2/CS-
MT/GP, b) TiO2/CS/GP, c) TiO2/GP and d) TA solution.
(TiO2 loading = 2.54 mg cm-2
; CS, CS-MT loading = 1.27 mg
cm-2
; pH = 6.5; aeration flow rate = 40 mL min-1
)
161
Figure 4.16 TOC values during the photo-etching of TiO2/CS-MT/GP and
TiO2/GP for 12 hours of treatment. (TiO2 loading = 6.35 mg
cm-2
; CS-MT loading = 3.18 mg cm-; aeration flow rate = 40
mL min-1
)
162
Figure 4.17 Comparison on the production of hydroxyl radicals (•OH) by
TiO2/CS-MT/GP a) after, b) before photo-etching and
TiO2/GP c) after, d) before photo-etching and e) TA solution
164
Figure 4.18 Comparison of pseudo first order rate constants of MO
removal by TiO2/CS-MT/GP and TiO2/GP before and after
the photo-etching
164
Figure 4.19 UV-Vis DRS spectra of CS-MT/GP: (a) before and (b) after
photo-etching for 12 hours at different ratio of CS to MT
within CS-MT/GP; i) 1:0, ii) 1:0.12, iii) 1:0.33, iv) 1:1 and v)
MT powder
167
Figure 4.20 Proposed structure of the photocatalytically oxidized CS sub-
layer in the TiO2/CS/GP system
168
Figure 4.21 Pseudo first order rate constants of TiO2/CS-MT/GP for three
cycles with regeneration time of 0.5, 1, 2 and 3 hours between
cycles. (TiO2 loading = 2.54 mg cm-2
; CS-MT loading = 1.27
mg cm-2
; pH = 6.5; aeration flow rate = 40 mL min-1
)
172
Figure 4.22 Reusability of TiO2/CS-MT/GP (photocatalytic-adsorptive
removal), TiO2/CS-MT/GP (adsorption) and TiO2/GP
(photocatalysis) for ten cycles based on percentage of MO
remaining. (TiO2 loading = 2.54 mg cm-2
; CS-MT loading =
1.27 mg cm-2
; pH = 6.5; aeration flow rate = 40 mL min-1
)
175

xxii
Figure 4.23 Reusability of TiO2/CS-MT/GP (photocatalytic-adsorptive
removal), TiO2/CS-MT/GP (adsorption) and TiO2/GP
(photocatalysis) for ten cycles based on pseudo first order rate
constant. (TiO2 loading = = 2.54 mg cm-2
; CS-MT loading =
1.27 mg cm-2
; pH = 6.5; aeration flow rate = 40 mL min-1
)
175
Figure 4.24 Ratio of pseudo first order rate constant of TiO2/CS-MT/GP
(photocatalytic-adsorptive removal) to TiO2/CS-MT/GP
(adsorption) and TiO2/GP (photocatalysis). (TiO2 loading =
2.54 mg cm-2
; CS-MT loading = 1.27 mg cm-2
; pH = 6.5;
aeration flow rate = 40 mL min-1
)
176
Figure 4.25 TOC/TOCₒ values during the mineralization of MO by the
TiO2/CS-MT/GP and TiO2/GP systems for 12 hours of
treatment. (TiO2 loading = 6.35 mg cm-2
; CS-MT loading =
3.18 mg cm-2
; pH = 6.5; aeration flow rate = 40 mL min-1
)
177
Figure 4.26 The production of a) sulphate and b) nitrate ions, respectively
in treated MO solution for 12 hours of treatment by the
TiO2/CS-MT/GP and TiO2/GP systems. (TiO2 loading = 6.35
mg cm-2
; CS-MT loading = 3.18 mg cm-2
; pH = 6.5; aeration
flow rate = 40 mL min-1
)
181
Figure 4.27 pH changes of MO solution after treatment with TiO2/CS-
MT/GP and TiO2/GP systems for 12 hours. (TiO2 loading =
6.35 mg cm-2
; CS-MT loading = 3.18 mg cm-2
; pH = 6.5;
aeration flow rate = 40 mL min-1
)
182
Figure 4.28 The profile of LC-MS spectra of the identified MO and its
intermediates after 1 hour of photocatalytic-adsorptive
removal by the TiO2/CS-MT/GP system using a) phosphate
buffer: methanol and b) water: acetonitrile mobile phase
185
Figure 4.29 Proposed mechanism pathway during the photocatalytic-
adsorptive removal of MO by TiO2/CS-MT/GP
187
Figure 5.1 Percentage of MO removed from the solution after adsorption
by PANI/GP as prepared using different amount of PVC
powder at a fixed amount of 2 g of PANI powder and 4 g of
ENR50 within PANI formulation. (PANI loading = 0.63 mg
cm-2
; [MO]o = 20 mg L-1
; pH = 6.5; aeration flow rate= 40 mL
min-1
)
191
Figure 5.2 Percentage of PANI remaining after adherence test on the
PANI/GP as prepared using different amount of PVC powder
at a fixed amount of 2 g of PANI powder and 4 g of ENR50
within PANI formulation. (PANI loading = 0.63 mg cm-2
)
191
xxiii
Figure 5.3 Combined bar chart of the amount of MO adsorbed (qe) and
percentage of MO removed from the solution at different
amount of PANI powder in PANI formulation. (PANI loading
= 0.63 mg cm-2
; [MO]o = 20 mg L-1
; pH = 6.5; aeration flow
rate = 40 mL min-1
)
193
Figure 5.4 Percentage of PANI remaining on the PANI/GP after
adherence test by sonication. (PANI loading = 0.63 mg cm-2
)
193
Figure 5.5 SEM micrographs of PANI powder at a) 5 000 x and b) 50
000 x and PANI-ENR50-PVC composite at c) 5 000 x and d)
50 000 x of magnifications
195
`
Figure 5.6 EDX analysis of a) PANI powder and b) PANI-ENR50-PVC
composite
196
Figure 5.7 Nitrogen adsorption-desorption isotherm plot of a) PANI
powder and b) PANI-ENR50-PVC composite
198
Figure 5.8 FT-IR spectra of a) PANI powder and b) PANI-ENR50-PVC
composite
200
Figure 5.9 Combined UV-Vis DRS spectra of; (a) PANI powder and (b)
PANI/GP
201
Figure 5.10 Effect of the amount of PANI loadings on the glass plates on
the removal efficiency and the amount of MO adsorbed onto
PANI/GP. ([MO]o = 20 mg L-1
; pH = 6.5; aeration flow rate =
40 mL min-1
)
204
Figure 5.11 Effect of initial pH of MO solution on the amount of MO
adsorbed onto PANI/GP. (PANI loading = 0.63 mg cm-2
;
[MO]o = 20 mg L-1
; aeration flow rate = 40 mL min-1
)
206
Figure 5.12 Effect of aeration flow rate on the amount of MO adsorbed on
PANI/GP. (PANI loading = 0.63 mg cm-2
; [MO]o = 20 mg
L-1
; pH = 6.5)
208
Figure 5.13 The amount of MO adsorbed by a) PANI powder and b)
PANI/GP at different MO concentrations. (PANI loading =
0.63 mg cm-2
; pH = 6.5; aeration flow rate = 40 mL min-1
)
210
Figure 5.14 Pseudo first order kinetic plots for the adsorption of MO onto
a) PANI powder and b) PANI/GP
212
Figure 5.15 Pseudo second order kinetic plots for the adsorption of MO
onto a) PANI powder and b) PANI/GP
213
Figure 5.16 Intraparticle diffusion plots for the adsorption of MO onto; a)
PANI powder and b) PANI/GP
217

xxiv
Figure 5.17 Combined plots of PANI powder and PANI/GP for a)
Langmuir, b) Freundlich and c) Dubinin Radushkevich
isotherm model
221
Figure 5.18 Combined van’t Hoff’s plots for the adsorption of MO by
PANI powder and PANI/GP
223
Figure 6.1 a) Percentage of MO removed and b) pseudo first order rate
constants after 90 minutes irradiation of different individual
systems in TiO2/PANI/GP. (TiO2 loading =1.27 mg cm-2
;
PANI loading = 0.63 mg cm-2
; [MO]o = 20 mg L-1
; pH = 6.5;
aeration flow rate = 40 mL min-1
)
228
Figure 6.2 The changes in the color of MO solution during the
photocatalytic-adsorptive removal by TiO2/PANI/GP for 90
minutes of irradiation time
229
Figure 6.3 UV-Vis spectrum of decolorization profile of MO by
TiO2/PANI/GP for 90 minutes under light irradiation. a) 0, b)
30, c) 45, d) 60, e) 75 and f) 90 minutes
230
Figure 6.4 Pseudo first order rate constants of TiO2/PANI/GP
by photocatalytic-adsorptive removal and adsorption at
different PANI sub-layer loading and a fixed TiO2 loading.
(TiO2 loading = 1.27 mg cm-2
; [MO]o = 20 mg L-1
; pH = 6.5;
aeration flow rate = 40 mL min-1
)
232
Figure 6.5 Cross section of TiO2/PANI/GP at different PANI sub-layer
loadings; a) 1.27 mg cm-2
(TiO2) /0.32 mg cm-2
(PANI), b)
1.27 mg cm-2
(TiO2) /0.63 mg cm-2
(PANI), and c) 1.27 mg
cm-2
(TiO2) /1.27 mg cm-2
(PANI)
233
Figure 6.6 Pseudo first order rate constants of at different TiO2 loadings
TiO2/PANI/GP by photocatalytic-adsorptive removal and
adsorption at a fixed PANI/GP sub-layer loading. (PANI
loading = 0.63 mg cm-2
; [MO]o = 20 mg L-1
; pH = 6.5;
aeration flow rate = 40 mL min-1
)
235
Figure 6.7 Cross section area of TiO2/PANI/GP of different TiO2
loadings; a) ) 0.63 mg cm-2
(TiO2)/0.63 mg cm-2
(PANI), b)
1.27 mg cm-2
(TiO2)/0.63 mg cm-2
(PANI) and c) 2.24 mg
cm-2
(TiO2)/0.63 mg cm-2
(PANI)
237
Figure 6.8 The amount of MO adsorbed by TiO2/PANI/GP at different
MO initial concentrations. (TiO2 loading =1.27 mg cm-2
;
PANI loading = 0.63 mg cm-2
; pH = 6.5; aeration flow rate =
40 mL min-1
)
238
Figure 6.9 Pseudo first order kinetic plots for the adsorption of MO onto
TiO2/PANI/GP
240

xxv
Figure 6.10 Pseudo second order kinetic plots for the adsorption of MO
onto TiO2/PANI/GP
240
Figure 6.11 Intraparticle diffusion plots for the adsorption of MO onto
TiO2/PANI/GP
241
Figure 6.12 PL spectra of a) TiO2/GP and b) TiO2/PANI/GP
245
Figure 6.13 a) Combined UV-Vis DRS spectra of TiO2/PANI/GP,
TiO2/GP and PANI/GP and b) Tauc plot
246
Figure 6.14 The production of hydroxyl radicals (•OH) by; a)
TiO2/PANI/GP, b) TiO2/GP and c) TA solution
248
Figure 6.15 Pseudo first order rate constants of TiO2/PANI/GP by
photocatalytic-adsorptive removal and adsorption at different
initial pH of MO solutions. (TiO2 loading =1.27 mg cm-2
;
PANI loading = 0.63 mg cm-2
; [MO]o = 20 mg L-1
; aeration
flow rate = 40 mL min-1
)
250
Figure 6.16 Pseudo first order rate constants of TiO2/PANI/GP by
photocatalytic-adsorptive removal and adsorption at different
aeration flow rate. (TiO2 loading = 1.27 mg cm-2
; PANI
loading = 0.63 mg cm-2
; [MO]o = 20 mg L-1
; pH = 6.5)
252
Figure 6.17 Pseudo first order rate constants of TiO2/PANI/GP by
photocatalytic-adsorptive removal and adsorption at different
initial MO concentrations. (TiO2 loading = 1.27 mg cm-2
;
PANI loading = 0.63 mg cm-2
; pH = 6.5; aeration flow rate =
40 mL min-1
)
254
Figure 6.18 TOC values during the photo-etching of TiO2/PANI/GP and
TiO2/GP systems for 11 hours under light irradiation. (TiO2
loading = 1.27 mg cm-2
; PANI loading = 0.63 mg cm-2
;
aeration flow rate = 40 mL min-1
)
256
Figure 6.19 Pseudo first order rate constants of TiO2/PANI/GP and
TiO2/GP before and after photo-etching. (TiO2 loading = 1.27
mg cm-2
; PANI loading = 0.63 mg cm-2
; [MO]o = 20 mg L-1
;
pH = 6.5; aeration flow rate = 40 mL min-1
)
256
Figure 6.20 TOC/TOCo values during the mineralization of
TiO2/PANI/GP and TiO2/GP for 10 hours of irradiation. (TiO2
loading = 3.18 mg cm-2
; PANI loading = 1.58 mg cm-2
; [MO]o
= 20 mg L-1
; pH = 6.5; aeration flow rate = 40 mL min-1
)
258
Figure 6.21 Production of a) sulphate and b) nitrate ions in the treated MO
solution for 10 hours of treatment by TiO2/PANI/GP and
TiO2/GP system
260
xxvi
Figure 6.22 pH changes of MO solution during the treatment by
TiO2/PANI/GP and TiO2/GP systems
262
Figure 6.23 Reusability of TiO2/PANI/GP, TiO2/GP and PANI/GP
systems for ten cycles based on percentage of MO removed.
(TiO2 loading = 1.27 mg cm-2
; PANI loading = 0.63 mg cm-2
;
[MO]o = 20 mg L-1
; pH = 6.5; aeration flow rate = 40 mL
min-1
)
264
Figure 6.24 Reusability of TiO2/PANI/GP, TiO2/GP and PANI/GP
systems for ten cycles based on pseudo first order rate
constant. (TiO2 loading = 1.27 mg cm-2
; PANI loading = 0.63
mg cm-2
; [MO]o = 20 mg L-1
; pH = 6.5; aeration flow rate =
40 mL min-1
).
264
Figure 6.25 Ratio of pseudo first order rate constant of TiO2/CS-MT/GP
(photocatalytic-adsorptive removal) to TiO2/CS-MT/GP
(adsorption) and TiO2/GP (photocatalysis). (TiO2 loading =
1.27 mg cm-2
; PANI loading = 0.63 mg cm-2
; [MO]o = 20 mg
L-1
; pH = 6.5; aeration flow rate = 40 mL min-1
).
265
Figure 6.26 The profile of LC-MS spectra of the identified MO and its
intermediates after 1 hour of photocatalytic-adsorptive
removal by the TiO2/CS-MT/GP system using a) phosphate
buffer: methanol and b) water: acetonitrile mobile phase
267
Figure 6.27 Proposed mechanism pathway during the photocatalytic-
adsorptive removal of MO by TiO2/PANI/GP.
269
Figure 7.1 Reusability of TiO2/CS-MT/GP, TiO2/PANI/GP and TiO2/GP
systems for ten cycles based on percentage of MO remaining.
(TiO2 (CS-MT) loading = 2.54 mg cm-2
; CS-MT loading =
1.27 mg cm-2
; TiO2 (PANI) loading =1.27 mg cm-2
; PANI
loading= 0.63 mg cm-2
; pH = 6.5; aeration flow rate = 40 mL
min-1
)
272
Figure 7.2 Reusability of TiO2/CS-MT/GP, TiO2/PANI/GP and TiO2/GP
systems for ten cycles based on pseudo first order rate
constant. (TiO2 (CS-MT) loading = 2.54 mg cm-2
; CS-MT
loading = 1.27 mg cm-2
; TiO2 (PANI) loading = 1.27 mg
cm-2
; PANI loading = 0.63 mg cm-2
; pH = 6.5; aeration flow
rate = 40 mL min-1
)
272
Figure 7.3 Ratio of pseudo first order rate constant of photocatalytic-
adsorptive removal to adsorption of TiO2/CS-MT/GP and
TiO2/PANI/GP for ten cycles
273

xxvii
Figure 7.4 The amount of MO adsorbed by TiO2/CS-MT/GP and
TiO2/PANI/GP at different MO initial concentrations. (TiO2
(CS-MT) loading = 2.54 mg cm-2
; CS-MT loading = 1.27 mg
cm-2
; TiO2 (PANI) loading = 1.27 mg cm-2
; PANI loading =
0.63 mg cm-2
; aeration flow rate = 40 mL min-1
)
275
Figure 7.5 van’t Hoff’s plots for the adsorption of MO by TiO2/CS-
MT/GP and TiO2/PANI/GP
279
Figure 7.6 PL spectra of (a) TiO2/GP, (b) TiO2/PANI/GP and c)
TiO2/CS-MT/GP
281
Figure 7.7 a) UV-Vis DRS spectra and b) Tauc plot of TiO2/CS-MT/GP,
TiO2/PANI/GP and TiO2/GP
282
Figure 7.8 The production of hydroxyl radicals (•OH) by a) TiO2/CS-
MT/GP, b) TiO2/PANI/GP, c) TiO2/GP and d) TA solution
284

xxviii
LIST OF ABBREVIATIONS
1,4-BQ 1,4-benzoquinone
2,4-D 2,4-dichlorophenoxyacetic acid
AB1 acid black 1
APS ammonium persulfate
BET Brunauer-Emmet-Teller
BG brilliant green
CS chitosan
CS-MT/GP chitosan-montmorillonite/glass plate single layer
system
CR Congo red
DMSO dimethyl sulfoxide
EDX energy dispersive X-Ray
ENR50 epoxidized natural rubber of 50 % mole epoxidation
FTIR Fourier transform infrared
GP glass plate
HA humic acid
HOMO highest occupied molecular orbital
IUPAC International Union of Pure and Applied Chemistry
LUMO lowest occupied molecular orbital
MB methylene blue
MG malachite green
MO methyl orange
MT montmorillonite

xxix
PANI/ENR50/PVC polyaniline/epoxidized natural rubber/poly (vinyl)
chloride
PANI/GP polyaniline/glass plate single layer system
PL photoluminescence
PVA-GLA poly (vinyl) alcohol-glutaraldehyde
PVC poly (vinyl) chloride
PVP poly (vinyl) pyrrolidone
RB5 reactive black 5
SEM scanning electron micrograph
TBOT tetrabutyl orthotitanate
TiO2/CS-MT/GP titanium dioxide/chitosan-montmorillonite/glass
plate bilayer system
TiO2/GP titanium dioxide/glass plate single layer system
TiO2/PANI/GP titanium dioxide/polyaniline/glass plate bilayer system
TOC total organic carbon
UV-Vis DR ultraviolet-visible diffuse reflectance
XRD X-Ray diffraction

xxx
PEMFABRIKAN, FOTOMANGKINAN DAN PENJERAPAN SISTEM
DWILAPISAN TERPEGUN TiO2/KITOSAN-MONTMORILONIT DAN
TiO2/POLIANALINA UNTUK PENYINGKIRAN PEWARNA METIL
JINGGA DARIPADA LARUTAN AKUEUS
ABSTRAK
Kajian ini adalah usaha untuk membangunkan dua sistem dwilapisan
terpegun untuk penyingkiran secara fotomangkinan-penjerapan pewarna metil oren
(MO) daripada larutan akueus. Sistem dwilapisan terpegun melibatkan penjerap
spesifik dan TiO2 di atas plat kaca yang dinamakan TiO2/kitosan-montmorilonit
(TiO2/CS-MT/GP) dan TiO2/polianalina (TiO2/PANI/GP) masing-masing telah
difabrikasi melalui teknik pelitupan celup. Dalam kajian ini, CS-MT dan PANI
berfungsi sebagai lapisan bawah manakala fotomangkin TiO2 dijadikan sebagai
lapisan atas. Pada awalnya, lapisan bawah untuk kedua-dua sistem dioptimumkan
melalui kajian penjerapan dan dicirikan melalui mikroskop imbasan elektron (SEM),
spektroskopi transformasi inframerah Fourier (FT-IR) dan analisis penjerapan-
penyahjerapan N2. Penambahan serbuk MT kepada matrik CS menurunkan kadar
pembengkakan, menambahkan kekuatan mekanikal dan luas permukaan (SBET)
daripada 3.82 kepada 4.38 m2 g
-1 manakala penambahan ENR50-PVC menambahkan
kekuatan mekanikal tetapi menurunkan SBET serbuk PANI daripada 9.16 kepada 8.50
m2 g
-1. Penilaian aktiviti fotomangkinan oleh sistem dwilapisan dilakukan di bawah
pancaran lampu pendarfluor kompak 45 Watt. Berat optimum lapisan penjerap
adalah 1.27 dan 0.63 mg cm-2
untuk masing-masing TiO2/CS-MT/GP dan
TiO2/PANI/GP manakala berat TiO2 optimum untuk TiO2/CS-MT/GP dan
TiO2/PANI/GP masing-masing adalah 2.54 dan 1.27 mg cm-2
. Sistem TiO2/CS-
xxxi
MT/GP dan TiO2/PANI/GP masing-masing mematuhi model kinetik penjerapan
pseudo tertib pertama Lagergren dan pseudo tertib kedua Ho dan Mc Kay. Model
isoterma Freundlich pula berupaya untuk menerangkan mekanisma penjerapan pada
keseimbangan dan pembauran intra-zarah adalah salah satu kadar penghad untuk
kedua-dua sistem. Sistem dwilapisan menghasilkan lebih radikal •OH daripada
sistem monolapisan TiO2 kerana kadar pemisahan pasangan elektron-lubang yang
lebih baik manakala jurang tenaga jalur TiO2 dikurangkan dari 3.02 eV kepada 2.94
dan 2.95 eV, masing-masing untuk sistem TiO2/CS-MT/GP dan TiO2/PANI/GP.
Keadaan operasi optimum bagi aktiviti fotomangkinan-penjerapan sistem dwilapisan
adalah pH ambien (6.5), kadar aliran udara 40 mL min-1
dan kepekatan awal MO 20
mg L-1
. Sistem TiO2/CS-MT/GP boleh mengekalkan kebolehulangan guna dalam
purata penyingkiran sebanyak 97.7 ± 1.0 % dan kadar penyingkiran 0.088 ± 0.008
min-1
sepanjang 10 kitaran manakala aktiviti fotomangkinan TiO2/PANI/GP lebih
baik pada tiga kitaran yang pertama tetapi mula menurun pada kitaran keempat
dengan purata penyingkiran sebanyak 62.7 ± 10.2 % dan kadar penyingkiran adalah
0.017 ± 0.003 min-1
. Walau bagaimanapun, kadar penyingkiran sistem TiO2/CS-
MT/GP adalah 4 kali lebih baik dari TiO2/GP manakala ia adalah 2.5 kali bagi sistem
TiO2/PANI/GP. Mineralisasi MO mencapai 82.8 % bagi TiO2/CS-MT/GP dan
73.2 % bagi TiO2/PANI/GP selepas 10 jam rawatan. Dalam pada itu, laluan
penguraian menunjukkan spesis pertengahan utama yang terhasil adalah 4-{(E-[4-
(metilamino)fenil]diazenil benzenasulfonat dan 4-{(E-[4-aminofenil]diazenil}
benzenasulfonat. Secara perbandingan, sistem TiO2/CS-MT/GP menunjukkan
penyingkiran secara fotomangkinan-penjerapan pewarna MO yang lebih baik
daripada sistem TiO2/PANI/GP.

xxxii
FABRICATION, PHOTOCATALYTIC AND ADSORPTION OF
IMMOBILIZED TiO2/CHITOSAN-MONTMORILLONITE AND
TiO2/POLYANILINE BILAYER SYSTEMS FOR THE REMOVAL OF
METHYL ORANGE DYE FROM AQUEOUS SOLUTIONS
ABSTRACT
This study was an effort to develop two immobilized bilayer systems for the
photocatalytic-adsorptive removal of methyl orange (MO) dye from aqueous
solution. The immobilized bilayer systems involving specific adsorbents and TiO2 on
the glass plates namely TiO2/chitosan-montmorillonite (TiO2/CS-MT/GP) and
TiO2/polyaniline (TiO2/PANI/GP) systems had been fabricated via a dip coating
technique. In this study, CS-MT and PANI, respectively functioned as the sub-layer
while TiO2 photocatalyst was made as the top layer. Initially, the respective
adsorbent sub-layer of both systems was optimized via a batch adsorption study and
characterized by using scanning electron microscopy (SEM), Fourier transform infra-
red spectroscopy (FT-IR) and N2 adsorption-desorption analysis. The addition of MT
powder to CS matrix decreased the swelling degree, improved the mechanical
strength and surface area (SBET) of CS-MT from 3.82 to 4.38 m2 g
-1 while the
addition of ENR50-PVC decreased the SBET of PANI powder from 9.16 to 8.50 m2 g
-1
but improved its mechanical strength. The photocatalytic activity assessment of the
bilayer systems was performed under the irradiation of a 45 Watts compact
fluorescent lamp. The optimum adsorbent sub-layer loading was found to be 1.27
and 0.63 mg cm-2
for TiO2/CS-MT/GP and TiO2/PANI/GP, respectively, while the
optimum TiO2 loading for TiO2/CS-MT/GP and TiO2/PANI/GP was 2.54 and 1.27
mg cm-2
, respectively. The TiO2/CS-MT/GP and TiO2/PANI/GP systems obeyed the

xxxiii
Lagergren’s pseudo first order and Ho and Mc Kay’s pseudo second order adsorption
kinetic model, respectively. On the other hand, the Freundlich isotherm model could
explain the adsorption mechanism at equilibrium whereas intra-particle diffusion was
one of the rate limiting steps for both systems. The bilayer systems produced more
•OH radicals than the single layer TiO2 due to better charge separation rate of
electron-hole pairs while the band gap of TiO2 was reduced from 3.02 eV to 2.94 and
2.95 eV for TiO2/CS-MT/GP and TiO2/PANI/GP system, respectively. The optimum
operating conditions for the photocatalytic-adsorption activity of the bilayer systems
were at ambient pH (6.5), 40 mL min-1
of aeration flow rate and 20 mg L-1
of MO
initial concentration. The TiO2/CS-MT/GP could maintain the reusability on the
average removal of 97.7 ± 1.0 % and 0.088 ± 0.008 min-1
removal rate throughout
the 10 cycles, while the photocatalytic activity of TiO2/PANI/GP was better at the
first three cycles, but started to cease out at the 4th
cycle with the removal average of
62.7 ± 10.2 % and 0.017 ± 0.003 min-1
removal rate. Nevertheless, the removal rate
of the MO of the TiO2/CS-MT/GP system was 4 times better than TiO2/GP while it
was 2.5 times for the TiO2/PANI/GP system. The mineralization of MO attained
82.8 % by TiO2/CS-MT/GP and 73.2 % by TiO2/PANI/GP after 10 hours of
treatment. Meanwhile, the degradation pathways showed that the main intermediate
species produced were 4-{(E-[4-(methylamino)phenyl] diazenyl}benzenesulfonate
and 4-{(E-[4-aminophenyl] diazenyl}benzenesulfonate. Comparatively, the
TiO2/CS-MT/GP system showed better photocatalytic-adsorptive removal of the MO
dye than the TiO2/PANI/GP system.

1
CHAPTER ONE
INTRODUCTION
1.1 Photocatalysis: Historical Overview
Photocatalysis is defined as a photoreaction in the presence of a catalyst. This
photoreaction is activated by photons from the light by appropriate energy (Mills and
Le Hunte, 1997). According to Fujishima et al. (2008), the earlier work of
photocatalysis had been reported by Renz at University of Lugano whereby he
discovered that titania is partially reduced during the illumination of light in the
presence of an organic compound, in which the oxide turns to dark colors (gray, blue
and black) (Renz, 1921). Then, in 1924, Baur and Perret at the Swiss Federal
Institute of Technology reported the photocatalytic deposition of metallic silver by
ZnO. The studies were then continued for more years by different scientists and the
progressed of those studies are shown in time frame as in Figure 1.1.
Renz (1921) reported the partial reduction of titania
under the light illumination in the presence of
organic compound.
1921
1927
Baur and Neuweiler (1927) discovered the
photocatalytic deposition of a silver salt of metallic
silver by ZnO and proposed Baur redox mechanism
1927.
1938
Goodeve and Kitchener (1938) proposed titania
acted as the catalyst to accelerate the
photochemical oxidation, studied other
semiconductors and speculated on the precise
mechanism.
Years Research findings

2
Figure 1.1: Time frame of photocatalysis research progress (Fujishima et al., 2008).
1949
Jacobsen (1949) at the National Lead Company
(USA) attempted to explain the paint chalking in
terms of a redox mechanism.
1953
Markham and Laidler (1953) studied the
photocatalytic reaction of ZnO as the photoanode
for formation of H2O2 but neglected TiO2 due to
production of unmeasurable amount of H2O2.
1955
Stephens et al. (1955) at Wayne State University
studied the production of H2O2 on several
semiconductors and found that CdS is a more
active photocatalyst than ZnO.
1958
Kennedy et al. (1958) at the University of
Edinburgh found a correlation between the ability
of TiO2 sample to photocatalytically decompose
chlorazol sky blue.
1964
Filimonov (1964) compared the photocatalytic
oxidation of isopropanol to acetone on ZnO and
TiO2. They concluded that the mechanism of on
TiO2 involved reduction of O2 to H2O, while the O2
reduction on ZnO was only to H2O2.
1965
McLintock and Ritchie (1965) studied the
photocatalytic oxidation of ethylene and propylene
at TiO2 and proposed that it was possible to oxidize
the organic compounds completely to H2O and CO2
which involved the production of superoxide from
oxygen.
1967
Morrison and Freund (1967) found quantitatively
that the availability of electrons and holes at the
surface is dominant in the mechanism of a
heterogeneously catalyzed reaction.

3
The historical breakthrough of photocatalysis was catalyzed by the demand of
energy renewal and storage and the detoxification of harmful substances in water and
air especially in the late 1960s (Ibhadon and Fitzpatrick, 2013; Linsebigler et al.,
1995). In 1972, Akira Fujishima and his doctoral advisor, Kenichi Honda discovered
the splitting of water by TiO2 electrode in an electrochemical cell after an exposure
to light of 415 nm wavelength (Fujishima and Honda, 1972). In the experiment
(Figure 1.2), the photocurrent flowed from Pt counter electrode through the external
circuit to TiO2 electrode which was proven to cause the oxidation of water at the
TiO2 electrode with the evolution of oxygen while it was the reduction of water at the
Pt electrode with the evolution of hydrogen (Nakata et al., 2012). Since then, there
has been a growing interest in this discovery (oxidation and reduction potential of
TiO2) for numerous applications such as water splitting, hydrogen production,
electrode and water/air treatment especially in the field of heterogeneous
photocatalysis.
Figure 1.2: Schematic diagram of electrochemical photocell. (1) n-type TiO2
electrode; (2) platinum black counter electrode; (3) ionically conducting
separator; (4) gas buret; (5) load resistance; and (6) voltmeter
(Hashimoto et al., 2005).
Pt TiO2
4

4
1.2 Heterogeneous photocatalysis
Application of photocatalysis is generally divided into homogeneous and
heterogeneous photocatalysis. The homogeneous photocatalysis generally refers to
the reactants and the photocatalysts existing in the same phase while the
heterogeneous photocatalysis refers to photoreaction of a catalyst which is in a
different phase from the reactants. Common examples of homogeneous
photocatalysis are ozonation and photo-Fenton systems (Fe2+
and Fe2+
/H2O2)
(Kitsiou et al., 2009). Heterogeneous photocatalysis includes the process involving
light irradiation on semiconductors namely TiO2, ZnO, ZnS and CdS. Examples of
heterogeneous photocatalysis are mild/total oxidation, dehydrogenation, hydrogen
transfer, deuterium-alkane isotopic exchange, metal deposition, water detoxification
and gaseous pollutant removal (Herrmann, 1999). The basic components of
heterogeneous photocatalysis are (Teh and Mohamed, 2011);
1) An emitted photon of appropriate wavelength,
2) a strong oxidizing agent (O2) and
3) a catalyst surface of a semiconductor material.
A semiconductor can be a material with electrical resistivity between that of
an insulator and a conductor while a semiconductor photocatalyst is characterized by
an electronic band structure in which the highest occupied energy band, valence band
(VB) and conduction band (CB) are separated by a band gap (Ebg). The CB is the
energy level for the reduction potential of photoelectrons; VB is for the oxidizing
ability of photogenerated holes while the band gap defines the wavelength sensitivity
of the semiconductor to irradiation. The magnitude of the fixed energy gap between
the electron rich valence band and the largely vacant conduction band governs the
extent of the thermal population of the conduction band (Fox and Dulay, 1993). In

5
other words, the higher band gap of a semiconductor corresponds to shorter light
wavelength which eventually requires a higher energy for electron excitation from
the VB to CB. However, the electronic band of a semiconductor is often confused
with the electronic band of a dye molecule. The difference between the energy level
in a semiconductor photocatalyst and a dye molecule is shown in Figure 1.3.
(a) (b)
Figure 1.3: The energy level diagram of a) a semiconductor and b) a dye molecule.
According to Pankaj et al. (2013), a semiconductor must be non-toxic, stable
in aqueous solution containing toxic or reactive chemicals and resistant to
photocorrosion under sunlight. Numerous semiconductors have been tested for
heterogeneous photocatalysis especially for the purpose of environmental
remediation such as ZnO, ZnS and CdS. Unfortunately, these semiconductors suffer
from photocorrosion in which the former photocatalyst (ZnO and ZnS) releases
Zn(OH)2 and Zn2+
while the latter (CdS) releases Cd2+
ions upon irradiation in
aqueous media (Pankaj et al., 2013). Titanium dioxide (TiO2) on the other hand,
possesses several important characteristics such as stable, non-toxic, and inert and is
now considered an effective photocatalyst (Mills et al., 2015).
LUMO
HOMO
hv ≥ Eg
CB
VB
hv ≥ Eg

6
1.3 Titanium dioxide
1.3.1 Ideal photocatalyst
The successful application of TiO2 in water purification was firstly reported
in 1977 (Frank and Bard, 1977) on cyanide and sulfite. The specialty of TiO2 which
made it differs from other photocatalyst is in mixings of both of its anatase and rutile
forms (Li et al., 2006). With the attractive and successful degradation of many
organic pollutants, TiO2 has become the most chosen photocatalyst in the field of
photocatalysis. Table 1.1 lists the characteristics of TiO2 which closely matches the
ideal photocatalyst characteristics.
Table 1.1: The characteristics match of ideal and TiO2 photocatalyst (Hondow et al.,
2010; Ibhadon and Fitzpatrick, 2013).
Ideal photocatalyst TiO2 Remarks
Photoactive √ High photoactivity in the presence of
light.
Able to absorb visible and/or near
UV light
Only active for light irradiation of
wavelength λ ≤ 387 nm however, it
can be modified to adsorb light of λ
≥ 387 nm.
Biologically and chemically inert √ Does not take part in the reaction
whereby only acting as the mediator
for redox reactions.
Photostable (not liable to
photoanonic corrosion)
√ Practical for long term use and
applications
Inexpensive √ Naturally abundant resource of
titanium
Non-toxic √ Safe for human and environment
Able to oxidize and reduce water to
O2 and H2, respectively
√ The photogenerated electron-holes
can react with water via redox
reaction to produce O2 and H2 since
the band is larger than 1.23 eV.
7
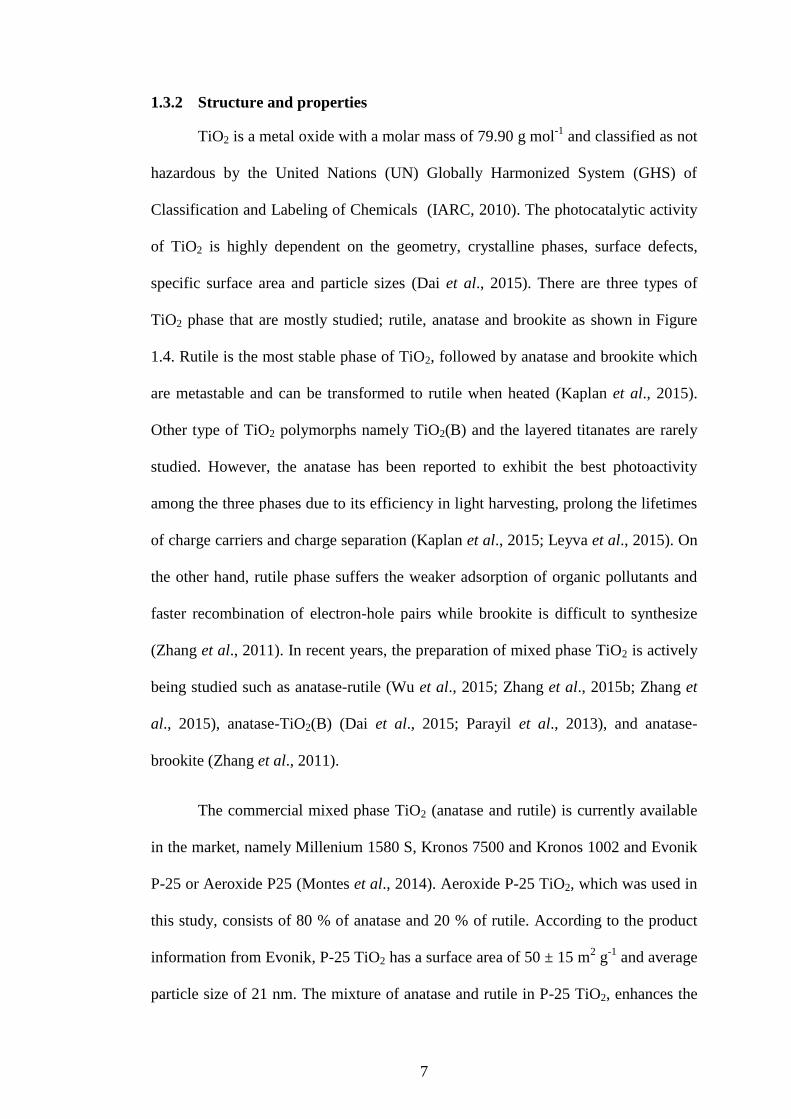
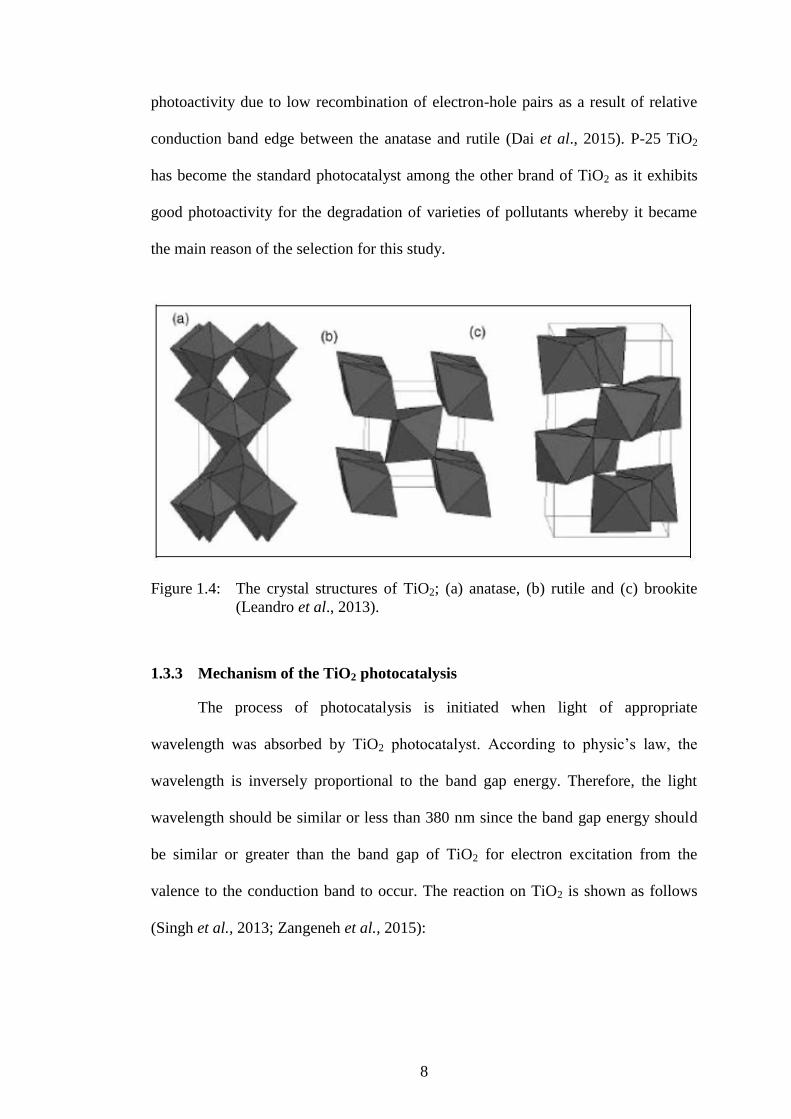
1.3.2 Structure and properties
TiO2 is a metal oxide with a molar mass of 79.90 g mol-1
and classified as not
hazardous by the United Nations (UN) Globally Harmonized System (GHS) of
Classification and Labeling of Chemicals (IARC, 2010). The photocatalytic activity
of TiO2 is highly dependent on the geometry, crystalline phases, surface defects,
specific surface area and particle sizes (Dai et al., 2015). There are three types of
TiO2 phase that are mostly studied; rutile, anatase and brookite as shown in Figure
1.4. Rutile is the most stable phase of TiO2, followed by anatase and brookite which
are metastable and can be transformed to rutile when heated (Kaplan et al., 2015).
Other type of TiO2 polymorphs namely TiO2(B) and the layered titanates are rarely
studied. However, the anatase has been reported to exhibit the best photoactivity
among the three phases due to its efficiency in light harvesting, prolong the lifetimes
of charge carriers and charge separation (Kaplan et al., 2015; Leyva et al., 2015). On
the other hand, rutile phase suffers the weaker adsorption of organic pollutants and
faster recombination of electron-hole pairs while brookite is difficult to synthesize
(Zhang et al., 2011). In recent years, the preparation of mixed phase TiO2 is actively
being studied such as anatase-rutile (Wu et al., 2015; Zhang et al., 2015b; Zhang et
al., 2015), anatase-TiO2(B) (Dai et al., 2015; Parayil et al., 2013), and anatase-
brookite (Zhang et al., 2011).
The commercial mixed phase TiO2 (anatase and rutile) is currently available
in the market, namely Millenium 1580 S, Kronos 7500 and Kronos 1002 and Evonik
P-25 or Aeroxide P25 (Montes et al., 2014). Aeroxide P-25 TiO2, which was used in
this study, consists of 80 % of anatase and 20 % of rutile. According to the product
information from Evonik, P-25 TiO2 has a surface area of 50 ± 15 m2 g
-1 and average
particle size of 21 nm. The mixture of anatase and rutile in P-25 TiO2, enhances the
8
photoactivity due to low recombination of electron-hole pairs as a result of relative
conduction band edge between the anatase and rutile (Dai et al., 2015). P-25 TiO2
has become the standard photocatalyst among the other brand of TiO2 as it exhibits
good photoactivity for the degradation of varieties of pollutants whereby it became
the main reason of the selection for this study.
Figure 1.4: The crystal structures of TiO2; (a) anatase, (b) rutile and (c) brookite
(Leandro et al., 2013).
1.3.3 Mechanism of the TiO2 photocatalysis
The process of photocatalysis is initiated when light of appropriate
wavelength was absorbed by TiO2 photocatalyst. According to physic’s law, the
wavelength is inversely proportional to the band gap energy. Therefore, the light
wavelength should be similar or less than 380 nm since the band gap energy should
be similar or greater than the band gap of TiO2 for electron excitation from the
valence to the conduction band to occur. The reaction on TiO2 is shown as follows
(Singh et al., 2013; Zangeneh et al., 2015):
9
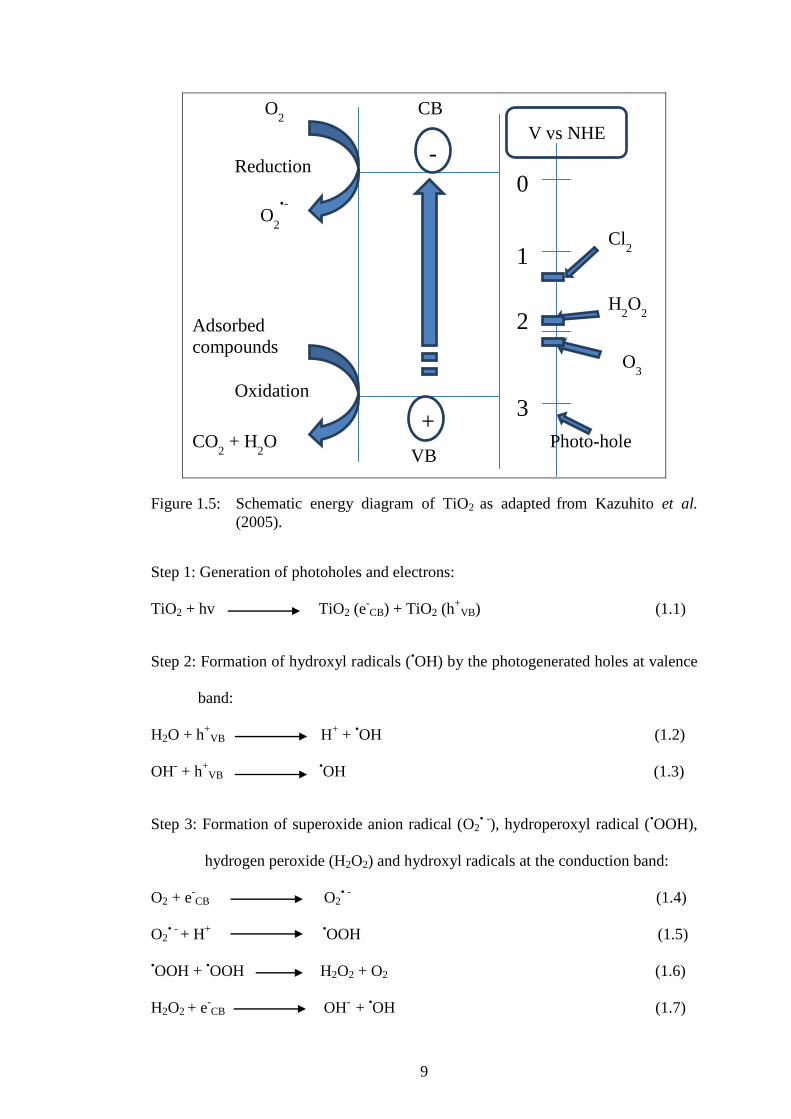
Figure 1.5: Schematic energy diagram of TiO2 as adapted from Kazuhito et al.
(2005).
Step 1: Generation of photoholes and electrons:
TiO2 + hv TiO2 (e-CB) + TiO2 (h
+VB) (1.1)
Step 2: Formation of hydroxyl radicals (•OH) by the photogenerated holes at valence
band:
H2O + h+
VB H+ +
•OH (1.2)
OH- + h
+VB
•OH (1.3)
Step 3: Formation of superoxide anion radical (O2• -
), hydroperoxyl radical (•OOH),
hydrogen peroxide (H2O2) and hydroxyl radicals at the conduction band:
O2 + e-CB
O2
• - (1.4)
O2• -
+ H+
•OOH (1.5)
•OOH +
•OOH H2O2 + O2 (1.6)
H2O2 + e-CB
OH
- +
•OH (1.7)
-
+
0
1
2
3
V vs NHE
CB
VB
O2
O2
•⁻
Adsorbed
compounds
CO2 + H
2O
Cl2
H2O
2
O3
Photo-hole
Reduction
Oxidation

10
H2O2 + O2• -
•OH + OH
- + O2 (1.8)
Step 4: Oxidation of organic contaminant (R):
R + •OH → → → CO2 + H2O (1.9)
R + O2• -
→ → → CO2 + H2O (1.10)
R + h+
VB → R• +
→ the degradation products (1.11)
R + e-CB → R
• - → the degradation products (1.12)
A successful photocatalytic oxidation of organic pollutants by TiO2 is highly
dependent on the production of •OH radicals at the VB of TiO2. However, the
generated •OH radical is unstable and must be continuously generated in situ, by
chemical or photochemical process (Leandro et al., 2013). Unless there are electron
acceptors at the CB of TiO2 after the excitation, the excited electrons could
recombine with the photogenerated holes at the VB. Moreover, the recombination of
electron-hole pairs would produce heat, which is unfavorable for the efficacy of the
photocatalyst activity.
1.3.4 Langmuir-Hinshelwood kinetic model
The Langmuir Hinshelwood equation was commonly used as to describe the
heterogeneous photocatalysis. The equation of the Langmuir Hinshelwood kinetic
model is given as in Equation 1.13 (Kumar et al., 2008a).
r = - dC
dt=
r C
C (1.13)
where r is the rate of reaction that changes with time.

11
The term r in Equation 1.13 was represented in terms of initial reaction rate, ro, as a
function of the initial dye concentration, Co, or in terms of Ce, where Ce is the
equilibrium dye concentration in solution. The initial rate of reaction as a function of
Co and Ce is given by Equations 1.14 and 1.15, respectively:
ro = r Co
C (1.14)
ro = r C
Ce
(1.15)
The parameter kr and K which is a function of Co or Ce can be predicted by
linearizing Equations 1.14 and 1.15 as follows:
=
r +
r Co
(1.16)
The constants kr and K can be calculated from the corresponding integrated
expression between the limits: C = Co at t = 0 and C = Ct at t = t. The integrated
expression is given by:
ln Co
Ct + K (Co − C)= krKt (1.17)
If the term KC << 1, the equation (1.13) is reduced to:
r = -dC
dt = krKC (1.18)
Integrating equation (1.18) with respect to limits: C = Co at t = 0 and C = Ct at t = t,
the Langmuir Hinshelwood expression reduces to a pseudo first order kinetic and is
given by:
ln Co
Ct = krKt = kt (1.19)
where the new constant k includes kr and K.
12
A plot of ln Co
Ct versus time (t) will give a straight line with the slope of k as the
pseudo first order rate constant. The coefficient of determination (R2) indicates the
degree of agreement of the reaction with the Langmuir-Hinshelwood kinetic model,
where;
r: the rate of degradation (mg L-1
min);
Ce: the equilibrium concentration of pollutant (mg L-1
);
Co: the initial concentration of pollutant (mg L-1
);
Ct: the concentration of pollutant at time t during degradation (mg L-1
);
K: equilibrium constant for adsorption of the substrate onto catalyst;
kr: limiting rate constant of reaction at maximum coverage under the given
experimental conditions;
ro: initial rate of reaction (min-1
);
t: the irradiation time (min);
k: the reaction rate constant (min-1
).
1.3.5 Drawbacks and improvements
Though many researchers had reported the excellent performance by TiO2
photocatalyst in water abatement, it suffers from several drawbacks such as high
recombination rate of electron-hole pairs and poor degradation rate for some organic
pollutants. Therefore, the research progress in photocatalysis field continues to grow
and new methods are being developed in order to overcome those obstacles.
The first intrinsic problem with TiO2 photocatalyst was its high
recombination rate of electron-hole pairs upon light irradiation. It was known that the
lifetime of charge carriers in TiO2 after excitation was very short which is 10-40 μs

13
(Colbeau et al., 2003). The short lifetime due to high recombination of charge
carriers could be overcome by surface sensitization using dye or metal complexes in
order to induce better charge separation. The dye is anchored on TiO2 surface by
covalent, or physical or chemical bonding which induced the charge injection of the
excited dye molecule into the CB of TiO2 leading to successive photocatalytic
degradation. This sensitization also increases the range of wavelength response
towards the natural sunlight (Gupta and Tripathi, 2011). However, the dyes
themselves can be photodegraded to form intermediates which need to be disposed.
On the other hand, transition metal complexes such as Ru-polypyridyl complexes
induce the charge separation by the excited electrons which participate in the charge
transfer of electrons to TiO2 conduction band (Kalyanasundaram and Grätzel, 1998).
The second drawback of TiO2 is the excitation of electron-hole pairs could be
only initiated in the presence of high UV light intensity. Therefore, the solution is to
change the band gap energy by coupling two semiconductors of suitable potential
energy such as CdS-TiO2, SnO2-TiO2 and ZnO-TiO2 whereby the holes produced in
smaller band gap semiconductor remain while the electrons are transferred to the
conduction band of TiO2 which induce charge separation (Jing and Guo, 2006).
Another way is to dope TiO2 with noble metals such as Ag (Albiter et al., 2015;
Gomathi and Mohan, 2010), Au (Subramanian et al., 2003; Tahir et al., 2006; Zhu et
al., 2009), Pt, Ni, Rh and Cu (Gupta and Tripathi, 2011) which can trap the electrons
and free holes and enhance the charge separation at the valence band to participate in
the photocatalytic oxidation reaction. This was due to the Fermi levels of these noble
metals which are lower than that of TiO2. Nevertheless, it was found that the
properties of these TiO2-noble metal composites are strongly dependent on the size
of metal particle, composition and dispersion as if the concentration of metal was too

14
high, the absorption of the light photon would be reduced and the metal can become
the electron-hole recombination centers which resulted in lower efficiency than the
TiO2. TiO2 can also be doped with non-metal such as C,N,B,F (Valentin and
Pacchioni, 2013) and carbon nano tube (CNT) (Ashkarran et al., 2015). The
composites could decrease the band gap which make it visible light active. In
addition, the TiO2 could be also modified by co-doping the metal-metal such as Fe3+
and Eu3+
(Vasiliu et al., 2009), metal-non-metal; Cu-N (Song et al., 2008) and non-
metal-non-metal; C-N (Nawawi and Nawi, 2014; Sabri et al., 2015). The TiO2 co-
doped system showed a red-shift in absorption spectrum and high photocatalytic
activity than the single doped TiO2 especially when exposed to total visible light.
Thirdly, the conventional TiO2 in suspended or slurry mode requires post
treatment due to its nanoparticle size, which is a tedious, time and money consuming
filtration process. Apart from filtration, the steps of recovering the photocatalyst
from the treated water solution involved the process of washing, filtering and drying,
which may result in the lost of an amount of the photocatalyst during the process. To
solve this drawback, different supports and immobilization techniques were used
whereby the common support materials and their immobilization modes were glass
beads; heat attachment (Daneshvar et al., 2005), granular activated carbon; dip
hydrothermal (Wang et al., 2009), stainless steel; coating (Souzanchi et al., 2013)
and glass plate; dip coating (Razak et al., 2014). However, the immobilization mode
of TiO2 might have some significant defects such as reducing the active sites
exposure to light, as the area is fixed and the mass transfer hindrance increases,
which lead to poor photocatalytic activity plus the need to seek for well-defined
procedures and equipment (Singh et al., 2013). Coupling the photocatalyst and
adsorbent in the immobilized form is another approach to enhance the overall

15
photocatalytic performance. TiO2 has been combined with various adsorbents such as
silica oxide (SiO2) (Rahman et al., 2014), montmorillonite (MT) (Bhattacharyya et
al., 2004), activated carbon (AC) (Muthirulan et al., 2013) and chitosan (CS)
nanofiber (Razzaz et al., 2016) whereby all systems showed enhanced photocatalytic
performance than the bare TiO2 in the removal of the organic contaminants.
1.4 Chitosan (CS)
1.4.1 Origin of CS
Chitin is firstly identified in 1884 and is originated from the main component
on shell of crustaceans such as shrimp and crab shell and cell walls of fungi and
yeast (Younes and Rinaudo, 2015). Chitin was the second most abundant
polysaccharides in nature after cellulose while CS is the derivation of chitin which
had undergone the deacetylation process using NaOH as the deacetylation agent
(Choi et al., 2016). Figure 1.6 provides the chemical structures of cellulose, chitin
and CS. Chitin with more than 75 % degree of deacetylation is known as CS while
cellulose only differs with chitin and CS based on the hydroxyl group in its C-2
position. The process of deacetylation removes acetyl groups from the molecular
chain of chitin and leaving behind a complete amino group (-NH2). The degree of
deacetylation depends on the content of the amino groups in the CS. Increasing
temperature and strength of NaOH enhances the acetyl group removal from chitin,
which then produces CS with different properties. CS was one of the main cationic
polymers which forms inter and intra-molecular hydrogen bonding due to amine and
hydroxyl groups which made the crystalline structure of CS rigid (Choi et al., 2016).

16
Figure 1.6: Molecular structures of cellulose, chitin and chitosan (Kirsch et al.,
2014).
1.4.2 Applications of CS
CS is biodegradable, biocompatible, bioadhesive, hydrophilic, able to
produce film and a good adsorbent (Zhao et al., 2015). The diverse properties of CS
made it usable in different applications and fields such as pharmaceutical,
biomedical, food, cosmetics (Rinaudo, 2006) and waste water remediation (Cárdenas
et al., 2002; Janaki et al., 2012; Ngah and Fatinathan, 2010). The functionality of CS
was based on the presence of hydroxyl and amino group which served as the
coordination and reaction sites for modification which could attract the positive and
negative chemical species to bound to its structure (Ngah and Fatinathan, 2010).
CS can also become bioadhesive since it offers a very good strength as
compared to synthetic adhesive without containing volatile organic carbon (VOC)
17
(Patel, 2015). However, the material suffers from low strength and large shrinkage
upon dehydration. Therefore, other materials such as clay when added into the CS
matrix can significantly improve its thermal stability and mechanical properties, and
may exert special behavior towards chemical species present in water (Wang et al.,
2006). Such a system can also be used to fasten flocculation and improve the flake's
textures (Shou et al., 2012).
1.4.3 Modification of CS
CS is not soluble in organic solvents and only dissolved in acidic aqueous
media (HCl and CH3COOH) whereby the solubility of CS is facilitated by the
protonation of its primary amino group on the C-2 position of the D-glucosamine.
The degree of protonation depends on the pKa of the acid and CS concentration
which only converts CS into the pseudonatural cationic polymer (García et al., 2015;
Rinaudo et al., 1999). Due to its excellent and vast properties, CS was modified
chemically in order to produce novel CS-based materials or biohybrid with specific
application properties which usually occurs at the –NH2 primary group and hydroxyl
group at the C-2 and C-6 position, respectively (García et al., 2015). However, due to
its poor solubility in organic solvents, researchers have focused on improving its
solubility and grafting process by attaching new functional groups. Garcia et al.
(2015) had reported a novel and simple method via nitroxide-mediated
polymerization (NMP) to modify well-defined molecular weight CS in homogeneous
media by utilizing CS-sodium dodecylbenzenesulfonate (SDBS)-glycidyl
methacrylate (GMA) as a precursor. The poly (styrene) (PS), poly (butyl acrylate)
(PBA), poly (acrylic acid) (PAA) respectively, are grafted onto the hydroxyl groups
of CS-SDBS-GMA in DMSO to produce CS-GMA-PS, CS-GMA-PBA and CS-
GMA-PAA as new CS based materials. Cai et al. (2009) prepared the soluble CS in

18
DMSO by grafting organo-soluble polymers, poly (ethyleneglycol) (PEG) and poly
(ε-caprolactone) (PCL) onto CS using the acidic CS and sodium dodecylsulfate
(SDS) solution as an intermediate. The authors found that the PEG and PCL became
conjugated to CS through the hydroxyl groups while maintaining the cationic density
of the amino groups intact on the surface of the CS. The SDS and SDBS which were
responsible for the dissolution of grafted CS in DMSO could be removed by
precipitation of the grafted polymer in DMSO into Tris aqueous solution or dialyzing
against Tris solution (Cai et al., 2009; García et al., 2015).
Meanwhile, the CS films, beads, gels and fibers which were prepared by
single CS solution suffer dehydration shrinkage in aqueous media and swelling
defects upon thermal treatment. In addition, the solubility of CS in acidic media can
be cumbersome, which eventually decrease the spectrum of its application (Ngah et
al., 2005). To overcome this, the CS was modified chemically by cross-linkers such
as epichlorohydrin (ECH), glutaraldehyde (GLA), glyoxal, ethylene glygol
diglycidyl ether (EDGE), tripolyphosphate (TPP) and genipin (Berger et al., 2004;
Obeid et al., 2013) basically to change the hydrophilicity of CS to be more
hydrophobic. The cross-linking occurs in the amine and hydroxyl groups in C-2 and
C-6 position that allows the formation of bridges between the polymer chains.
Among the cross-linking agents, the dialdehydes such as GLA and glyoxal bind
preferentially to the amino group of CS forming covalent imine bonds via a Shiff
reaction while the epoxides, such as ECH prefers to bind to the free hydroxyl group
(Berger et al., 2004). The cross-linked CS has an improved mechanical resistance,
strength and stability in acidic, alkaline and chemical solution as well as under
thermal treatment and compression (Azlan et al., 2009; Ngah et al., 2002). However,
cross-linking agents such as GLA is known to be neurotoxic while glyoxal is

19
mutagenic, which may not be a good choice for biomedical, medical, pharmaceutical
and tissue engineering applications (Berger et al., 2004).
Recently, the attention has been devoted to modifying the CS structure by
combining with other potential materials such as zeolite and MT. The hydrophilic CS
forms composite with clays which are alumino-silicates with a three-dimensional
framework structure containing AlO4 and SiO4. Such combination would avoid the
use of toxic and mutagenic chemicals which can harm human health. In addition, the
combination of the two different types of adsorbents could improve the pore size,
mechanical strength, chemical stability, hydrophilicity and biocompability of CS
(Ngah et al., 2012). Another approach in modification of CS was via photo
irradiation which causes changes in the polymeric structure of CS by inducing the
chain scission, reducing the average molecular weight, improving solubility in water,
changing the color intensity, optical and spectral sensitivity (Taei, 2011). CS has
been modified by different light sources such as UV light (Praxedes et al., 2012),
fluorescent lamp (Jawad and Nawi, 2012b), ultrasonic irradiation (Cravotto et al.,
2005; Kasaai et al., 2008) and gamma (γ) rays (Kang et al., 2007; Tahtat et al.,
2012). Nevertheless, until recently, the oxidative degradation are based on the
formation of reactive •OH radicals from H2O2 (Chang et al., 2001), TiO2 (Jawad and
Nawi, 2012b) and O3 (Yue et al., 2009) which are powerful oxidizing species. It
receives attention whereby modification occurs when the oxidative radical species
attack the 1,4 glycosidic linkages which result in the CS degradation (Kang et al.,
2007). Modification of CS by a combination of photon from light source and
oxidants could turn CS into the desired properties such as water-soluble, low
molecular weight with added specialty in biological, chemical and physical
properties than that of the ordinary CS (Kang et al., 2007).

20
1.5 Montmorillonite
1.5.1 Structure and properties
Montmorillonite (MT), the clay mineral is often confused with bentonite.
Both bentonite and MT belong to the smectite group which is built from 2:1
aluminosilicate whereby alumina octahedral is switched between two tetrahedral of
silica layers (Bhattacharyya and Gupta, 2008). In short, bentonite can be considered
as the family name while MT is the species name. MT is referred to as “swelling clay
minerals” due to the tendency for polar liquids to be ta en in the interlayer space
which makes MT a matrix for the preparation of functional composites in adsorbents,
catalyst and flame retardants (Sun et al., 2015).
Figure 1.7: The structure of MT. Source: http://sparc.fpv.umb.sk/ (accessed on 9.10
pm, 21st Feb 2016).
The clay layer is characterized by permanent negative charges due to
isomorphous substitution of Al3+
atoms of the octahedra for lower valent cations
(Mg2+
). Exchangeable cations (Na+) are present in the interlayer spaces to

21
compensate the negative charge. In addition to the permanent charge, pH-dependent
charge is present on the edges of clay layer; Al–OH (or Si–OH) groups at the edges
are present as different states depending on the pH of the solution: Al–OH2+
(at low
pH), Al–OH (at medium pH), and Al–O– (at high pH). Other than MT, there are
several kinds of smectite-type clay minerals (e.g., saponite, hectorite, beidelite, and
nontronite), which differ in chemical composition and the type of isomorphous
substitution. Most of these clay minerals occur naturally in earth soils, whereas the
composition, isomorphous substitution, impurity level, and crystallinity of the clays
differ depending on the production areas. Synthetic clay minerals, which are suitable
for chemical experiments due to lower impurity content, are also available (Nakato
and Miyamoto, 2009).
1.5.2 Applications of MT in environmental remediation
The interlayer of MT contains negative charges which are counterbalanced by
inorganic cations (e.g., Na+, Ca
2+) and exchangeable for adsorption of cationic
contaminants such as heavy metals, cationic dyes (methylene blue (MB), malachite
green (MG)) and cationic surfactants (Zhu et al., 2014). Since MT adsorbs cationic
surfactant, it can undergo ion-exchange with its negative charge counterpart which
the modified MT often called organo-MT was produced. Eventually, the
modification can promote the adsorption of anionic contaminants such as humic acid,
methyl orange (MO), 2-naphthol and neutral pollutant such as phenol (Jiang et al.,
2002). Beside organic pollutants, organo-clays can also adsorb heavy metals such as
Cu2+
and Zn2+
(Lin, 2002), Cr (VI) (Krishna et al., 2000) and Ni2+
(Ijagbemi et al.,
2009). The properties of clays specifically MT as good adsorbents are due to their
high specific surface area, high chemical and mechanical stability, cheap and vastly
available from nature. Thus, MT has the potential to be widely used in wastewater

22
treatment for removing many types of pollutants and heavy metals besides activated
carbon, a universal but costly adsorbent which restricts its wide application (Zhu et
al., 2014).
1.6 Conducting polymer: Polyaniline
The breakthrough discovery of intrinsically conducting polymer (ICP) was
initiated by MacDiarmid, Heeger and Shirakawa in 1977 whereby they discovered
the exposure of polyacetylene to iodine vapor yielding conducting material
(MacDiarmid, 2001). ICPs are completely different form the conducting polymers
which are merely a physical mixture of conducting material (eg; metal or carbon
powder) and a nonconductive polymer. ICPs on the other hand, are commonly
nown as a “synthetic metal” which possess the electrical, electronic, magnetic and
optical properties of a metal while retaining the mechanical properties and
processability (MacDiarmid, 2001). Recently, ICPs discovered were polypyrrole
(Ppy), polythiophene, polyparaphenylene (PPP) and polyparaphenylene vinylene
(PPV) (Bhadra et al., 2009).
Polyaniline (PANI), known as “aniline blac ” was rediscovered in 980s
(Ćirić, 20 3). PANI emerged as the promising material in the family of conducting
polymers which allow the construction of polymer modified electrodes to be used as
sensors, biosensors, and substrates for metallization (Ahmed, 2004). PANI has
controlled conductivity within 10-10
– 101 S cm
-1 range with ionic and proton
conductivity, redox activity, electro- and solvatochromism, electrical storage, stable
in extreme condition, high thermal stability and easy to synthesize (Ahmed, 2004;
Yu and Shishov, 2012). The synthesis of PANI has expanded over the years and it
became the most studied conducting polymer. Under different conditions, PANI can

23
exist in three main oxidation states as shown in Figure 1.8. The oxidation states on
the other hand, are denoted by the y values as shown in Figure 1.9 whereby y = 1, 0.5
and 0 corresponding to the fully reduced polyaniline (benzenoid diamine), the half
oxidized polyaniline (emeraldine), and the fully oxidized polyaniline (quinoid
diimine), respectively (Wang et al., 2013b). According to Bhadra et al. (2009), the
mode of synthesis was varied which were based on chemical, electrochemical,
template, enzymatic, plasma and photo approaches. The most common method,
chemical approach can be subdivided into the following modes as shown in Table
1.2.
Figure 1.8: Structures of polyaniline in various intrinsic redox states (Chen, 2007)
Figure 1.9: Molecular structure of emeraldine base of PANI (Zeng and Ko, 1998).
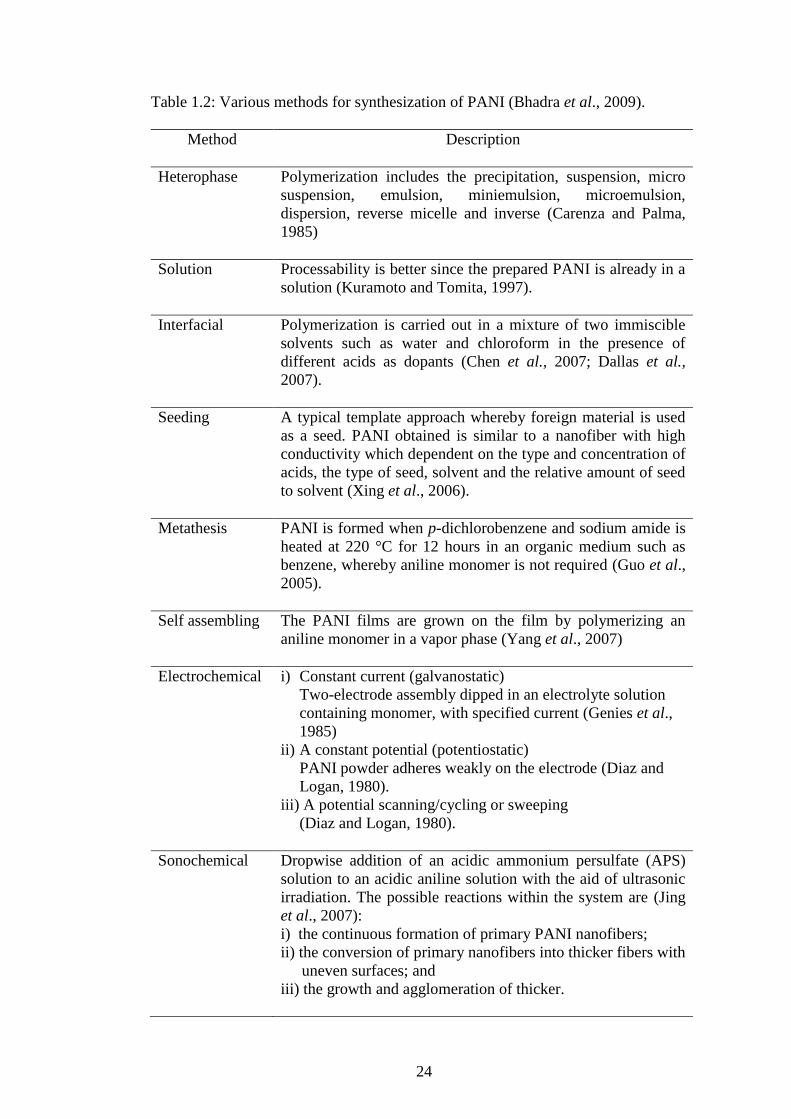
24
Table 1.2: Various methods for synthesization of PANI (Bhadra et al., 2009).
Method Description
Heterophase
Polymerization includes the precipitation, suspension, micro
suspension, emulsion, miniemulsion, microemulsion,
dispersion, reverse micelle and inverse (Carenza and Palma,
1985)
Solution Processability is better since the prepared PANI is already in a
solution (Kuramoto and Tomita, 1997).
Interfacial Polymerization is carried out in a mixture of two immiscible
solvents such as water and chloroform in the presence of
different acids as dopants (Chen et al., 2007; Dallas et al.,
2007).
Seeding A typical template approach whereby foreign material is used
as a seed. PANI obtained is similar to a nanofiber with high
conductivity which dependent on the type and concentration of
acids, the type of seed, solvent and the relative amount of seed
to solvent (Xing et al., 2006).
Metathesis
PANI is formed when p-dichlorobenzene and sodium amide is
heated at 220 °C for 12 hours in an organic medium such as
benzene, whereby aniline monomer is not required (Guo et al.,
2005).
Self assembling
The PANI films are grown on the film by polymerizing an
aniline monomer in a vapor phase (Yang et al., 2007)
Electrochemical
i) Constant current (galvanostatic)
Two-electrode assembly dipped in an electrolyte solution
containing monomer, with specified current (Genies et al.,
1985)
ii) A constant potential (potentiostatic)
PANI powder adheres weakly on the electrode (Diaz and
Logan, 1980).
iii) A potential scanning/cycling or sweeping
(Diaz and Logan, 1980).
Sonochemical
Dropwise addition of an acidic ammonium persulfate (APS)
solution to an acidic aniline solution with the aid of ultrasonic
irradiation. The possible reactions within the system are (Jing
et al., 2007):
i) the continuous formation of primary PANI nanofibers;
ii) the conversion of primary nanofibers into thicker fibers with
uneven surfaces; and
iii) the growth and agglomeration of thicker.