fabrication of stimuli responsive hyaluronic acid‑based
TRANSCRIPT
This document is downloaded from DR‑NTU (https://dr.ntu.edu.sg)Nanyang Technological University, Singapore.
Fabrication of stimuli responsive hyaluronicacid‑based nanoparticles for cancer treatment
Phua, Fiona Soo Zeng
2019
Phua, F. (2019). Fabrication of stimuli responsive hyaluronic acid‑based nanoparticles forcancer treatment. Doctoral thesis, Nanyang Technological University, Singapore.
https://hdl.handle.net/10356/83246
https://doi.org/10.32657/10356/83246
Downloaded on 26 Jan 2022 04:03:03 SGT

Fabrication of Stimuli Responsive Hyaluronic Acid-Based
Nanoparticles for Cancer Treatment
Phua Soo Zeng Fiona
SCHOOL OF PHYSICAL AND MATHEMATICAL SCIENCES
2019

Fabrication of Stimuli Responsive Hyaluronic Acid-Based
Nanoparticles for Cancer Treatment
Phua Soo Zeng Fiona
SCHOOL OF PHYSICAL AND MATHEMATICAL SCIENCES
A thesis submitted to the Nanyang Technological
University in partial fulfilment of the requirement for the
degree of Doctor of Philosophy
2019

Statement of Originality
I hereby certify that the work embodied in this thesis is the result of original
research done by me except where otherwise stated in this thesis. The thesis
work has not been submitted for a degree or professional qualification to any
other university or institution. I declare that this thesis is written by myself and
is free of plagiarism and of sufficient grammatical clarity to be examined. I
confirm that the investigations were conducted in accord with the ethics policies
and integrity standards of Nanyang Technological University and that the
research data are presented honestly and without prejudice.
10 Jul 2019
. . . . . . . . . . . . . . . . . . . . . . . . . . . . . . . . . . . . . . . . . . . .
Date Phua Soo Zeng Fiona

Supervisor Declaration Statement
I have reviewed the content and presentation style of this thesis and declare it of
sufficient grammatical clarity to be examined. To the best of my knowledge, the
thesis is free of plagiarism and the research and writing are those of the
candidate’s except as acknowledged in the Author Attribution Statement. I
confirm that the investigations were conducted in accord with the ethics policies
and integrity standards of Nanyang Technological University and that the
research data are presented honestly and without prejudice.
19 Jun 2019
. . . . . . . . . . . . . . . . . . . . . . . . . . . . . . . . . . . . . . . . . . . .
Date Prof Zhao Yanli
Authorship Attribution Statement
This thesis contains material from 2 paper(s) published in the following peer-reviewed
journal(s) where I was the first and/or corresponding author.
Chapter 2 is published as S. Z. F. Phua, C. Xue, W. Q. Lim, G. Yang, Y. Zhang, H.
Chen, C. F. Wijaya, Z. Luo, Y. Zhao. Light-Responsive Prodrug-Based Supramolecular
Nanosystems for Site-Specific Combination Therapy of Cancer. Chem. Mater. 31 (9),
3349-3358 (2019). DOI: 10.1021/acs.chemmater.9b00439
The contributions of the co-authors are as follows:
• Prof Zhao Yanli initiated the project and edited the manuscript drafts.
• Prof Luo Zhong provided advice on the in vivo studies.
• I did the synthesis, characterized the nanoparticles, carried out the in vitro
studies and prepared the manuscript.
• The manuscript was revised by Dr Yang Guangbao and Lim Wei Qi.
• Xue Chencheng did the in vivo studies.
• The synthesis of the molecules was advised by Dr Chen Hongzhong and Dr
Zhang Yuanyuan.
• Chintya Fransisca Wijaya assisted in the synthesis of the materials
Chapter 3 is published as S. Z. F. Phua, G. Yang, W. Q. Lim, A. Verma, H. Chen, T.
Thanabalu, Y. Zhao. Catalase Integrated Hyaluronic Acid as Nanocarriers for Enhanced
Photodynamic Therapy in Solid Tumour. ACS Nano, 13 (4), 4742–4751 (2019). DOI:
10.1021/acsnano.9b01087
The contributions of the co-authors are as follows:
• Prof Zhao Yanli provided the initial project idea, direction and edited the
manuscript drafts
• I did the synthesis, characterisations of the nanoparticles, carried out the in vitro
and in vivo studies and prepared the manuscript.

• Dr Yang Guangbao provided advice and helmed the in vivo studies
• Lim Wei Qi edited the manuscript
• Apoorva Verma and Prof Thirumaran Thanabalu provided advice on the H&E
staining
• Dr Chen Hongzhong provided the materials for the synthesis
Note: If published materials are not inserted as thesis chapters, students must
acknowledge co-worker contributions in the acknowledgement section of their
thesis.
10 Jul 2019
. . . . . . . . . . . . . . . . . . . . . . . . . . . . . . . . . . . . . . . . . . . .
Date Phua Soo Zeng Fiona

1
Abstract
Non-selective cancer treatment causes low treatment efficacy and severe side effects in
patients. Considering the current problem in oncology such as high systemic toxicity of
chemodrug and poor efficiency of photodynamic therapy, the focus of this thesis is to design,
fabricate and characterize hyaluronic acid based nanocarriers for stimuli-responsive targeted
cancer therapy by supramolecular means. Various hyaluronic acid-based nano-sized systems
have been designed and investigated for cancer treatment. Hyaluronic acid-based nanocarriers
have numerous advantages such as its biodegradability and non-immunogenetic. Multiple
functional groups on the hyaluronic acid also allows for facile modifications to allow for
greater functionality. Formation of micelles, direct conjugation and formation of nanogels
could be achieved. Hyaluronic acid could also target overly expressed receptors on cancer cells.
Different hyaluronic acid-based nanocarriers will be explored in this thesis to prove its
versatility as a polymer for delivery of cancer therapeutic agent. To further increase selectivity
of treatment, stimuli-responsive groups will be incorporated. To better control the amount of
therapeutic agents, supramolecular chemistry will be harnessed.
Chapter 1 describes the background of cancer, treatment modalities and current research
using nanocarrier, and more specifically, using hyaluronic acid as the polymer for drug delivery
of therapeutic agents. It also describes some current development in stimuli responsive drug
delivery system and lastly introduced supramolecular chemistry as a mean for nanoparticle
fabrication.
In Chapter 2, our primary objective was to design a hyaluronic acid-based nanocarrier
based on self-assembly after formation of inclusion complex between the cyclodextrin-
modified hyaluronic acid and adamantane-modified camptothecin drug and photosensitizers.
The nanocarrier HA-aPS-aCPT was able to target the overly expressed CD44 receptors on

2
cancer cells. Furthermore, upon internalization, light irradiation was applied so that the
photosensitizers produced reactive oxygen species. This was used for photodynamic therapy
as well as the release of the caged prodrug via the reaction with the reactive oxygen species
responsive linker. This resulted in cascaded release of active chemodrug. The system was
applied on mice model and had shown to inhibit tumour growth.
Beside using hyaluronic acid polymer for encapsulation of drugs and photosensitizers,
hyaluronic acid polymers could be used for direct conjugation with proteins or enzymes that
can improve therapeutic outcome. Hence, in Chapter 3, we explored the possibility of direct
conjugation of hyaluronic acid onto enzyme catalase. Direct conjugation of catalase increased
its stability in the presence of proteinase K, which was essential for long term blood circulation
in in vivo system. Photosensitizers was loaded into the nanocarrier by formation of inclusion
complex of cyclodextrin modified on hyaluronic acid and the adamantane-modified chlorin e6
to form HA-CAT@aCe6 NPs. Modification with catalase in the nanocarrier could relieve
hypoxia in cells. Because of the presence of hyaluronic acid, HA-CAT@aCe6 NPs was able to
target CD44+ cells selectively. Upon irradiation of light, HA-CAT@aCe6 NPs inhibited the
tumour growth in mice model as compared to hyaluronic acid with photosensitizers alone. This
shows that modification of hyaluronic acid with enzymes were effective in preserving its
activity and improve its biodistribution for application.
Beside using catalase to overcome the hypoxia in cells, another approach is to use
prodrug that is responsive to hypoxia environment for release of drug. In Chapter 4, glucose
oxidase, an enzyme that was able to convert glucose and oxygen to hydrogen peroxide was
encapsulated in hyaluronic acid-based nanogels. Tirapazamine, a hypoxia-responsive drug was
co-loaded into the HA nanogel to give HA@aCe6@GOD-TPZ. aCe6 in this case was the
hydrophobic component for self-assembly of the HA nanogel and to perform imaging. Glucose
oxidase can deplete the oxygen level in cells to release the prodrug. HA@aCe6@GOD-TPZ

3
was able to accumulate selectively in CD44+ cells. The NPs was shown to be able to exhibit
greater cytotoxicity under hypoxic condition than HA@aCe6@GOD and TPZ alone.
Chapter 5 concludes the usage of hyaluronic acid as a polymeric nanocarrier in terms
of formation of micelle, nanocarrier and nanogels. New insights for future research on
nanocarrier for treatment of cancer was also provided.

4
Acknowledgements
In a blink of time, I have completed my PhD studies. In these four years, I have met
many Good Samaritans who helped me in this tough journey. First, I would like to express my
sincerest gratitude to Professor Zhao Yanli for the invaluable chance to do research in his
laboratory. Towards the end of my undergraduate studies, he did not hesitate in accepting me
as a Final Year Student and allowed me to work in his laboratory which gave me the first taste
of what research is like. Under his supervision, I have developed technical and soft skills –
research, writing, experimental as well as management and interpersonal skills. In addition, he
gave me valuable suggestions and words of encouragement when I encounter problems in my
research. His presence was always comforting and gave me a great sense of security because I
know that I can rely on him for his advice whenever there is problem.
My heartfelt appreciations go to all the members in Prof Zhao’s group. They are selfless
in sharing their knowledge and extending their help. I thank Lim Wei Qi, my batchmate who
has been through thick and thin together with me. She was the greatest source of encouragement
and support in these four years. We had tough lessons and trainings together, discussion of
project details and provision of suggestions and advice to each other. I would like to thank Dr
Tham Huijun Phoebe for coaching me experiments such as cell studies, confocal microscopy,
flow cytometry and also in bad times, pulling me through with words of encouragement and
advice; Dr Wang Yang for his continual moral support; he was a friend, a mentor and someone
who brought me out of my comfort zone; Dr Chen Hongzhong for his kind advice and
encouragement, synthesis advice, exchange of ideas, he was selfless in providing ideas and
advices; Dr Yang Chaolong for his support and encouragement; Dr Yang Guangbao for
coaching me animal studies; Dr Nguyen Kim Truc for teaching me TEM; Dr Zheng Cunchuan
for his insights on projects and life; Dr Xiang Huijing for her advice on graduation; Dr Qu

5
Qiuyu for teaching me confocal microscope sample preparation; Dr Zhang Yuanyuan for
synthesis of hyaluronic acid polymer; Dr Shi Huifang who was my FYP mentor. I would also
like to express my heartfelt gratitude to Dr Xing Pengyao, Dr Wang Dongdong, Dr Qian Cheng,
Dr Liu Guofeng, Dr Zhou Weiqiang, Dr Zhao Lingzhi, Dr Sreejith Sivaramapanicker, Dr Quan
Hongping, Dr Tan Si Yu, Dr Ang Chung Yen, Dr Feng Tao, Dr Li Menghuan, Ms Anivind
Kuar Bindra, Mr Deblin Jana, Mr Ong Wee Kong, Mr Victor Xu Hesheng, Mr Eddy Wong
Mun Fei and Mr Teo Wei Liang. I would also like to thank Dr Eric Shim and his mentor Prof
Lee Soo Ying for his sharing of knowledge on gel electrophoresis. I would also like to thank
Dr Shu Zhiyu and Prof Chen Gang for coaching me on gel electrophoresis preparation.
I would also like to thank my collaborator Mr Xue Chencheng and his mentor Prof Luo
Zhong for the animal studies in my first project.
Last, I am grateful to my parents, sister and friends for their unconditional love and
support as well as understanding from time to time.
I would like to thank School of Physical and Mathematical Sciences for providing me
the research scholarship, facilities and services for pursuing my postgraduate studies. These
eight years in Nanyang Technological University has made me feel like it’s a second home to
me.

6
Table of Contents
Abstract .......................................................................................................................... 1
Acknowledgements ....................................................................................................... 4
Chapter 1: Introduction ............................................................................................. 12
1.1 Drug delivery for Cancer treatment ................................................................... 12
1.2 Role of nanotechnology in Cancer treatment ..................................................... 15
1.3 Hyaluronic acid – a potential active targeting ligand ........................................ 16
1.3.1 Current progress in using hyaluronic acid as a nanocarrier .......................... 17
1.3.2 Literature review on using hyaluronic acid for formation of micelle ........... 20
1.3.3 Literature review on using hyaluronic acid for formation of nanoparticle ... 22
1.3.4 Literature review on using hyaluronic acid for formation of nanogel .......... 24
1.4 Development of stimuli responsive nanoparticle system ................................... 27
1.5 Current development of using light in drug delivery ........................................ 30
1.5.1 Photodynamic therapy .................................................................................. 30
1.5.2 Light responsive drug delivery system (DDS) ............................................. 32
1.6 Current development of using ROS responsive drug delivery ......................... 35
1.6.1 Reactive oxygen species ............................................................................... 35
1.6.2 Literature review on ROS responsive system ............................................... 35
1.7 Current development of using Hypoxia responsive drug delivery ................... 38
1.8 Supramolecular Chemistry .................................................................................. 40
7
1.9 Objectives of this thesis ........................................................................................ 41
References .................................................................................................................... 43
Chapter 2: Light-Responsive Prodrug-Based Supramolecular Nanosystems for
Site-Specific Combination Therapy of Cancer ......................................................... 54
2.1 Introduction ........................................................................................................... 54
2.2 Materials and Methods ......................................................................................... 58
2.2.1 Materials ....................................................................................................... 58
2.2.2 Instruments ................................................................................................... 58
2.2.3 Synthesis of aCPT (adamantane modified prodrug) ..................................... 59
2.2.4 Synthesis of ada-THPP (aPS) ....................................................................... 61
2.2.5 Synthesis of β-cyclodextrin modified hyaluronic acid (HA-CD) ................. 62
2.2.6 Drug release using HPLC ............................................................................. 63
2.2.7 Stability constants as determined by Benesi-Hildebrand Plot ...................... 64
2.2.8 Determination of critical aggregation concentration (CAC) by pyrene probe
............................................................................................................................... 64
2.2.9 Preparation of HA-aPS-aCPT NPs ............................................................... 65
2.2.10 Singlet oxygen detection using singlet oxygen sensor green (SOSG) ....... 65
2.2.11 Cell culture ................................................................................................. 66
2.2.12 In vitro ROS detection ................................................................................ 66
2.2.13 Cellular uptake and in vitro targeting ability .............................................. 66
2.2.14 In vitro cytotoxicity tests of HA-PS-CPT NPs and apoptosis study .......... 67
2.2.15 Animal model ............................................................................................. 68

8
2.2.16 In vivo optical imaging ............................................................................... 68
2.2.17 In vivo combinational therapy .................................................................... 69
2.2.18 TUNEL and histological assay ................................................................... 70
2.3 Results and Discussions ........................................................................................ 70
2.3.1 Synthesis ....................................................................................................... 70
2.3.2 Cleavage of thioketal linker from aCPT. ...................................................... 70
2.3.3 Photophysical properties of aPS and ROS detection using singlet oxygen
sensor green. .......................................................................................................... 71
2.3.4 Self-assembly characterisations .................................................................... 73
2.3.5 Characterizations of NPs .............................................................................. 75
2.3.6 Cellular uptake and in vitro targeting ability ................................................ 79
2.3.7 In vitro ROS detection .................................................................................. 80
2.3.8 Cell viability and apoptosis study ................................................................. 81
2.3.9 In vivo biodistribution ................................................................................... 83
2.3.10 In vivo antitumour efficacy ......................................................................... 84
2.4 Conclusion ............................................................................................................. 87
References .................................................................................................................... 87
Chapter 3: Catalase Integrated Hyaluronic Acid as Nanocarriers for Enhanced
Photodynamic Therapy in Solid Tumour ................................................................. 94
3.1 Introduction ........................................................................................................... 94
3.2 Materials and Methods ......................................................................................... 97
3.2.1 Materials ....................................................................................................... 97

9
3.2.2 Instruments ................................................................................................... 98
3.2.3 Synthesis of aCe6 ......................................................................................... 98
3.2.4 Synthesis of β-cyclodextrin modified hyaluronic acid (HA-CD) ............... 100
3.2.5 Synthesis of HA-CAT NPs ......................................................................... 100
3.2.6 Synthesis of HA-CAT@aCe6 NPs ............................................................. 101
3.2.7 Generation of O2 from H2O2 and catalase activity assay ............................ 101
3.2.8 Detection of 1O2 .......................................................................................... 102
3.2.9 Immunofluorescence for detection of HIF-1α in cells................................ 102
3.2.10 Immunofluorescence for detection of CD44 receptors in different cells . 103
3.2.11 Cellular experiments ................................................................................. 104
3.2.12 Animal model ........................................................................................... 104
3.2.13 In vivo imaging ......................................................................................... 104
3.2.14 In vivo photodynamic therapy .................................................................. 105
3.3 Results and Discussions ...................................................................................... 106
3.3.1 Synthesis and characterizations .................................................................. 106
3.3.2 Evaluation of catalase activity .................................................................... 110
3.3.3 Verification of production of singlet oxygen using singlet oxygen sensor
green. ................................................................................................................... 111
3.3.4 Stability examination of conjugated catalase ............................................. 112
3.3.5 Cellular uptake and cytotoxicity of HA-CAT@Ce6 NPs ........................... 113
3.3.6 In vivo biodistribution of HA-CAT@aCe6 NPs. ........................................ 121
3.3.7 In vivo photodynamic therapy .................................................................... 123

10
3.4 Conclusion ........................................................................................................... 125
References .................................................................................................................. 125
Chapter 4: Hyaluronic acid based nanogels for encapsulation of glucose oxidase
and hypoxia responsive prodrug ............................................................................. 130
4.1 Introduction ......................................................................................................... 130
4.2 Materials and Methods ....................................................................................... 133
4.2.1 Materials ..................................................................................................... 133
4.2.2 Instruments ................................................................................................. 133
4.2.3 Synthesis of HA-Me-CD ............................................................................ 134
4.2.4 Synthesis of ada-Ce6 .................................................................................. 134
4.2.5 Synthesis of HA@aCe6@GOD-TPZ ......................................................... 135
4.2.6 Evaluation of GOD activity in NPs ............................................................ 135
4.2.7 Cellular experiments ................................................................................... 136
4.3 Results and discussions ....................................................................................... 136
4.3.1 Synthesis of HA-Me-CD ............................................................................ 136
4.3.2 Characterisations of HA@aCe6@GOD-TPZ ............................................. 137
4.3.3 Cellular uptake and targeting effect on CD44 receptors ............................ 139
4.3.4 ROS detection and In vitro cytotoxicity ..................................................... 140
4.4 Conclusion ........................................................................................................... 143
References .................................................................................................................. 144
Chapter 5 Conclusion ............................................................................................... 148
5.1 Conclusion ........................................................................................................... 148

11
5.2 Future Outlook .................................................................................................... 149
References .................................................................................................................. 150
List of publications .................................................................................................... 151

12
Chapter 1: Introduction
1.1 Drug delivery for Cancer treatment
Cancer resulted in high mortality rate despite advancement in medical
technology. In 2012, 8.2 million death was due to cancer and 14 million new cases has
been recorded.1 Numbers continue to be on the rise. In Singapore, death due to cancer
accounted for nearly 30% of the total deaths in 2015. Understanding of oncology is
important in order to derive feasible remedies for cure. Cancer is defined as the rapid
abnormal division of cells that could undergo continual proliferation, avoid growth
suppressors, activate invasion and spreading of cancer cells, cause angiogenesis and
resist apoptosis.2 Cancer cells are rapidly proliferating cells that require nutrients and
oxygen to grow.2 As tumours grow, the oxygen levels are invariably lower than normal
tissues, causing hypoxia in tumour.3 This leads to development of new blood vessels in
the process called angiogenesis around the tumour cells.4 The growth of the blood
vessels is often erratic, resulting in leaky vasculature in tumours with poor lymphatic
drainage.5 Proliferating tumour cells also display increased glucose uptake known as the
Warburg effect, whether is there excess or limiting amount of oxygen.6 As a
consequence, concentration of lactic acid, the product of glycolysis, increases, resulting
in an acidified cellular environment (~pH 5).7 Elevated amount of glutathione (GSH)
levels are also measured in cancer cells, scavenging on the excess amount of reactive
oxygen species (ROS) to resist cell death.8 Deregulations of receptors also elevate the
cancer receptor proteins such as folate receptor,9 human epidermal factor growth
receptor (HER2),10 CD (Cluster of Determinant) 4411 and αvβ3 integrins.12
Several therapeutic methods have been explored for treatment of cancer
including photodynamic therapy (PDT),13 radiation therapy,14 immunotherapy15 and

13
chemotherapy.16 Particularly, chemotherapy involves the administration of anti-cancer
drugs into the body via different modes such as oral, intravenous injection and topical
means. Some common chemotherapy drugs include doxorubicin,17 paclitaxel,18
gemcitabine19 and chlorambucil.9 For the reason that various anticancer drugs are non-
selective and possess high cytotoxicity, cells are killed indiscriminately. This not only
results in the apoptosis of cancer cells; normal cells are not spared. Side effects such as
fatigue, pain, numbness, blood count disorders and hair loss are thus experienced by
patients undergoing chemotherapy.
The emerging use of nanotechnology in cancer therapeutics is particularly
attractive. Nanomedicine as a strategy to reduce side effects of chemotherapy has
rendered better drug selectivity with reduced side effects at minimal dosage. Leaky
vasculatures in tumours allow easy accumulation of the nanoparticles (NPs), but prevent
the clearance of NPs from the interstitial space of tumours.20 NPs could thus accumulate
and retain for an extended duration in tumour site. This is known as the enhanced
permeability and retention (EPR) effect.20 Size of NPs could range from as small as 30
nm to 200 nm.21 NPs of diameter less than 30 nm would be cleared by the phagocytic
uptake and hepatic filtration easily while NPs of diameter greater than 200 nm could be
excreted by the spleen easily.21 One example of the earliest nanomedicine is the
liposome.22 Among the NP drug delivery system developed for encapsulation of
chemotherapy drugs (Figure 1), some organic nanomaterials include proteins,23
liposomes24 and polymers,25 and just recently, inorganic nanomaterials such as silica,26-
29 gold,30 iron oxide,31 copper sulfide,32 graphene33 and upconversion crystals NPs
(UCNPs)34 have been utilised. One major problem with most inorganic NPs is with its
clearance from body after administrating in account of their poor biodegradability. Silica
is biocompatible but non-biodegradable, resulting in accumulation in the body and could

14
not be excreted.35 Biocompatibility of gold NPs is questionable to date.36 On the other
hand, UCNPs made from lanthanide elements remain toxic.37 In recent times, a research
by Peng et al. demonstrated that TiO2, SiO2, Au and Ag induce endothelial leakiness
and unintentionally cause metastasis.38 Due to the toxicity of inorganic nanomaterials,
organic nanomaterial is preferred. Several NPs for anticancer treatment was approved
by the U.S. Food and Drug Administration (FDA) including doxil (liposomal
doxorubicin) and abraxane (albumin-paclitaxel).39 Emulsifier Cremophor El was
initially co-injected with the hydrophobic paclitaxel drugs for treating metastasized
breast cancer, which has inherent toxicity to human. Using albumin as a carrier in
abraxane eliminates such toxic emulsifier and thus increases the maximum tolerated
dosage in patients.
Figure 1. Organic and inorganic NPs used for drug delivery.
Increasingly attractive strategy is the use of active targeting in nanomedicine to
enable receptor-mediated endocytosis. Ligand–receptor interactions allow NPs to bind
to the surface receptors of various cells, and then after which, allow endocytosis into the
cells.40 Different ligands are able to target different overly-expressed receptors on the
cancer cells. Some common targeting ligands include folic acid, biotin, hyaluronic acid

15
(HA) and RGD peptide.41 As much as efforts were made, effectiveness of active
targeting remains debatable, with researchers arguing that passive targeting of NPs still
play the major role in accumulation.42
Effort in increasing the precision of administrating and targeting of
chemotherapy drugs to tumours does not discontinue with active targeting. Precise and
controlled release of chemotherapeutics remains an issue. Nanomedicine has been
constructed to be responsive to endogenous and exogenous stimuli. Endogenous stimuli
are often associated with the microenvironment of the cancer cells. These include pH,43
redox agents44, 45, hypoxia environment46 and enzymatic reactions while exogenous
stimuli include irradiation of light,24 ultrasound47 and heat. Comparing these two types
of stimuli in terms of selectivity, exogenous stimuli have an edge over their counterparts
because of their higher selectivity and better controlled drug release profile to achieve
non-invasive, on-demand treatment in desired targeted area in cells and in animal
model.30, 48 Systematic control over the rate and time of release after administrating the
drug is essential for targeted therapy. Most of the release mechanisms by endogenous
stimuli are passive and very much rely on the local cellular environment which is
essentially different for different cells.49
1.2 Role of nanotechnology in Cancer treatment
Use of nanotechnology is a crucial milestone in cancer treatment over the past
few decades. Some nanoparticulate drugs such as Doxil and Myocet were some of the
therapeutic nanoparticles that were clinically approved. These drugs are liposomal based,
which were found to improve pharmacokinetics and biodistribution.50 Nanomedicine
are developed for cancer treatment due to EPR effect of NPs in solid tumours as shown
in Figure 2. Most drug delivery nanocarriers for tumour treatment are administered
16
systemically via intravenous means, after which they accumulate in the tumour through
the EPR effect. Essentially, other than EPR effect, other factors could also be considered.
NPs must evade elimination by the immune system (Macrophages and T cells) and avoid
other macromolecules in the blood serum to selectively accumulate homogenously at
heterogenous tumour site. Thus, by only relying on EPR effect on accumulation of NPs
is overly simplified. Furthermore, in most studies, the assumption is that every system
takes on the same effect. We should recognise that no one system is suitable for all and
not all system is suitable for one. It is important to embrace the limitations of NPs and
at the same time work on improving current system for cancer therapeutics.
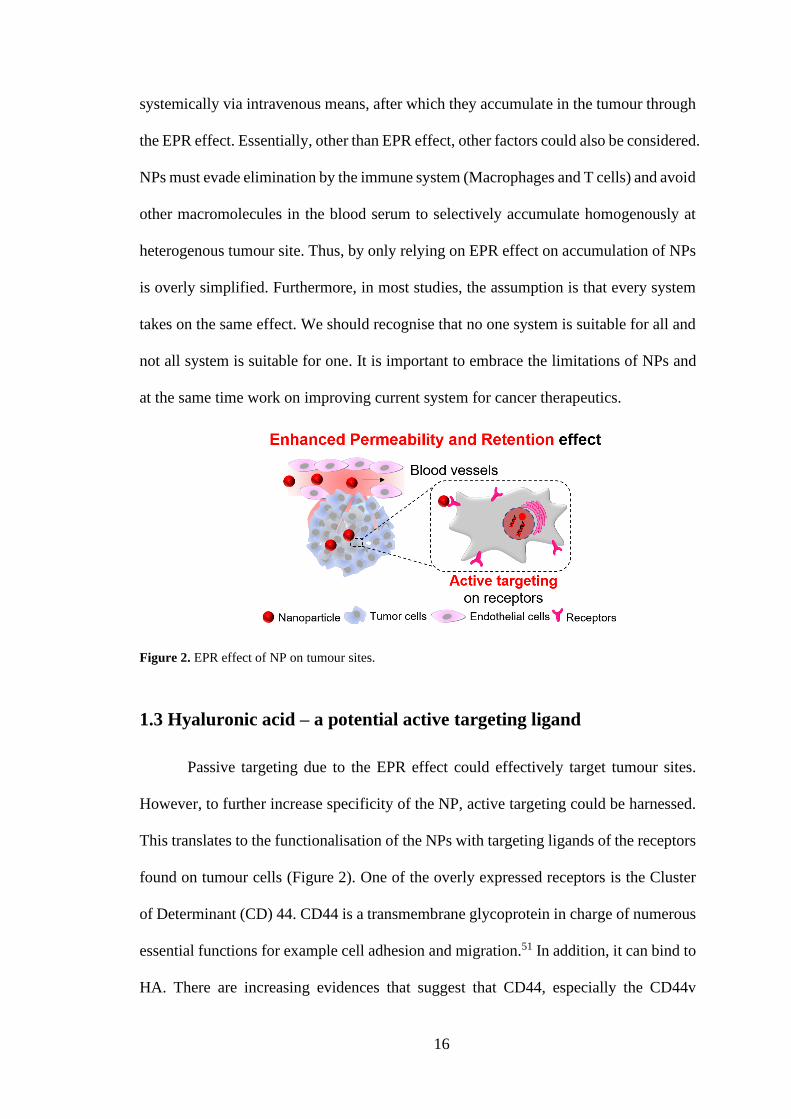
Figure 2. EPR effect of NP on tumour sites.
1.3 Hyaluronic acid – a potential active targeting ligand
Passive targeting due to the EPR effect could effectively target tumour sites.
However, to further increase specificity of the NP, active targeting could be harnessed.
This translates to the functionalisation of the NPs with targeting ligands of the receptors
found on tumour cells (Figure 2). One of the overly expressed receptors is the Cluster
of Determinant (CD) 44. CD44 is a transmembrane glycoprotein in charge of numerous
essential functions for example cell adhesion and migration.51 In addition, it can bind to
HA. There are increasing evidences that suggest that CD44, especially the CD44v

17
isoforms could be a potential biomarker and therapeutic target for breast cancers and
gastric cancers.52-54 CD44 also participates in many cellular functions such as tumour
metastasis of cancers. 55-57 Structure of CD44 proteins allows HA, an anionic, non-
sulfated glycosaminoglycan to be a ligand and binds selectively to it.58 HA was shown
to target CD44 receptors. Many researches have been done to investigate on targeting
capability of HA on CD44 receptors in oncology. One of the requirement for the binding
of HA with a single CD44 receptor is that the HA polymer should possess at least six to
ten monosaccharides conjugated consecutively.59, 60
1.3.1 Current progress in using hyaluronic acid as a nanocarrier
In choosing the targeting ligand, HA is the choice because of several advantages
such as its targeting ability to CD44 receptors,11, 61 hydrophilicity, biocompatible,
possess carboxylic groups and hydroxy for easy conjugation and easily purified after
conjugation.62 Internalisation of HA by cancer cells with overly expressed CD44
receptors enhances selectivity in drug delivery of siRNA, photosensitisers, proteins and
other therapeutic agents. HA is a natural negatively charged polysaccharide composed
of two moieties i.e. D-glucuronic acid and N-acetyl-D-glucosamine63 that possesses
inherent binding affinity with CD44 receptors.64, 65 Using HA can mediate endocytosis
and assists in cellular uptake. HA was first used in drug delivery in 1994 by Yerushalmi
and his group.66 HA can be used to fabricate polymeric micelle,67 conjugation on
nanoparticle or formation of nanogels68. It can also be chemically conjugated onto
liposomes, inorganic NPs and polymeric NPs. Figure 3 shows the NPs involving HA
that were used in drug delivery. Different types of HA NPs can be fabricated using
different methods, which is discussed in the following subsections.

18
Figure 3. Different types of HA NPs that can be synthesized.
HA has several functional groups for easy modifications. Structure of HA is as
shown in Figure 4 below. Functional groups such as carboxyl, hydroxyl and amine can
be used for various modifications. Table 1 below summarized the modifications,
conditions and reagents needed.
Figure 4. Structure of HA polymer and the functional groups identified.

19
Table 1. Summary of the HA target site, reaction type, activator, reagents and solvent needed for various
modification of HA. (Reproduced with permission,69 copyright 2011 Elsevier)
Purification of HA polymer can be done easily by dialysis to remove smaller
precursors.

20
1.3.2 Literature review on using hyaluronic acid for formation of micelle
NPs can be formed using HA polymer by introducing hydrophobic components
onto the polymer so that self-assembly can occur. Some researchers have used other
polymers such as the polyethylenimine conjugated to cyclodextrin (CD). Addition of
hydrophobic components with adamantane lead to self-assemble of NPs suitable for
drug delivery.70, 71
In earlier attempts to modify HA, HA was simply conjugated to hydrophobic
drug or photosensitizers to increase hydrophobicity. In a work by Lee and his group,72
paclitaxel was conjugated onto HA by different feed ratios to give polymer that could
self-assemble into NPs. Using HA of 64 kDa, they synthesized the polymer with 10%
degree of substitution of paclitaxel to give DLS size of 196 nm. The conjugation of
hydrophobic paclitaxel allowed self-assembly of the polymer into its nanosize.
In a work by Choi et al., the HA (2.344 x 10⁵ Da) was fabricated with different
degree of substitution of hydrophobic bile acid (5β-cholanic acid).73 The amphiphilic
polymer was then fabricated into NPs through self-assembly. The particle sizes
decreased when the degree of substitutions increased because a more hydrophobic core
was formed. The NPs size obtained were in range of 237 – 424 nm. This research
showed that the NPs can accumulate in tumour tissues by both passive and active
targeting where the latter was through CD44 receptors mediated endocytosis. In another
work by Yoon et al. (Figure 5), the HA was conjugated to cholanic acid, black hole
quencher 3 and PEG. Chlorin e6 (Ce6) was encapsulated within the core of this
amphiphilic polymer as the photosensitizer.74 PEG can increase the blood circulation of
the NPs while the black hole quencher 3 was used to elicit fluorescent quenching of Ce6
so that the photoactivity of the Ce6 was reduced. This work shows that it is possible to
encapsulate hydrophobic photosensitisers like Ce6 within the core of self-assembled

21
amphiphilic polymer. Conjugations of HA with hydrophobic components such as
octadecyl group, poly (D,L-lactideco-glycolide) (PLGA) polymer and catechin (-)-
Epigallocatechin-3-O-gallate (EGCG) could form NPs with core shell morphology of
suitable size upon self-assembly. 75-77
Figure 5. Schematic diagram of how hydrophobic components conjugated to HA can help in its self-
assembly. (Reproduced with permission,74 copyright 2012 Elsevier)

22
In another work by our research team as shown in Figure 6, the HA was
functionalised with β-CD. 67 A reduction sensitive prodrug with a fluorescence reporter
was fabricated as the hydrophobic component. When the inclusion complex was formed
between the β-CD and adamantane, it led to the formation of an amphiphilic polymer
that could self-assemble to give a hydrophobic core. IR825, a photothermal dye was
loaded within the hydrophobic core to carry out dual therapy of chemo and photothermal
therapy. This strategy enables easy purification of the prodrug and adjustable addition
of the adamantane moiety.
Figure 6. Schematic diagram of cyclodextrin conjugated HA polymer and hydrophobic prodrug used in
drug delivery for photothermal and chemotherapy. (Reproduced with permission from reference,67
copyright 2018 Elsevier)
1.3.3 Literature review on using hyaluronic acid for formation of nanoparticle
HA can be grafted or coated on to NPs so that the biocompatibility, stability and
the dispersity of the NPs can be improved. These NPs can be inorganic NPs such as gold

23
NP,78 CuS NP and silica NP and organic NPs like proteins. The method of conjugation
is important in enhancing the NPs for uptake into cellular or animal model.
Thiolated HA can be used for NPs that has affinity with sulfide group.
Modification of the HA polymer can be easily done by functionalisation with different
groups. Lee et al. developed a thiolated HA grafted gold NPs for delivery of IFNα. 78
For NPs that contain amine group, simple amidation of using zero cross-linker EDC and
NHS was used.79 In one work by Ma et al., HA was conjugated on to mesoporous silica
(MSN) via EDC/NHS method by amidation reaction of carboxyl group in HA and amino
group on the mesoporous silica.80 HA improved the dispersity of MSN and ensured
better selectivity to tumour site through active targeting. In another work by Yang and
his group as shown in Figure 7, a hybrid NPs of iron oxide core with Prussian blue, PEI
and quantum dot were conjugated with HA in the similar method of amidation using
EDC/NHS. 81 On the other hand, for NPs that contain functional group such as epoxy,
HA must be modified. One common modification is using adipic acid dihydrazide to
give hydrazido group for conjugation to the functional groups on NPs. Song et al.
modified HA with adipic acid dihydrazide (ADH) so as to provide pendant hydrazido
group for the binding with graphene oxide (GO). 82 Mild condition was used for binding
of HA to GO which is by simple stirring at pH 7.4 in the dark for 24 h. Direct conjugation
of HA by the means of chemical bond still enable targeting of HA to cells with over-
expression of CD44 receptors in all of the above examples.

24
Figure 7. Schematic diagram showing fabrication of HA-coated NPs for bimodal imaging guided therapy
in mice. (Reproduced from reference81)
HA can also be grafted on to NPs using electrostatic interaction through layer-
by-layer assembly. In a work by Dreaden et al.,83 a multilayer polyelectrolyte shell was
grafted on to the NPs because of the opposite charges. Carboxy-modified polystyrene
latex nanospheres were first coated with poly(L-lysine) which is positively charged.
After which, HA which has net negative charge was added on to the NPs for coating.
Such facile modification reduces the need for other chemicals precursor to be used for
functionalisation.
1.3.4 Literature review on using hyaluronic acid for formation of nanogel
One type of nanoparticle is the nanogel. Nanogels are composed of hydrophilic
or amphiphilic polymeric nanoparticles formed by crosslinking to keep the structure
intact.84 Such bonds can be chemical bonds such as covalent bonds or physical bonds
such as non-covalent bonds like electrostatic interactions, hydrogen bonding and
hydrophobic interactions. HA can be used to form nanogel due to its hydrophilicity.
25
Formation of such structure can be done by two approaches: “top-down” or “bottom up”
approaches.84, 85 The former is the fabrication of NPs from larger particles or clusters
while the latter is realized by designing smaller molecules or compounds and then
building the NPs by cross-linking using chemical or physical bonds. The nanogels
formation by crosslinking reactions can increase the nanocomplex’s stability in
physiological condition, which enabled minimal leakage of the encapsulated drugs.
In one work by Bian et al., cysteine was conjugated on to HA to give thiolated
HA.86. HA-SH can form hydrogel by simple oxidation reaction in the air after addition
of sodium hydroxide. The formed disulfide bond was responsive to huge concentration
of glutathione in cancer cells and thus resulted in controlled drug release. However, one
problem is the difficulty in controlling the rate of reaction and predictability of the
reaction. In another work by Singh and his group, they encapsulated proteins within
nanogel that was crosslinked by the enzymatic reaction of horse radish peroxidase
(HRP).87 Similar thiolated HA was used. However, in this case, HRP was introduced as
the catalyst to crosslink such that nanosized particles can be obtained. HRP can
enzymatically oxidise the cysteine terminated monomers to give disulfide without the
addition of H2O2 to give nanogel. They were used to load large proteins β-galactosidase
(β-Gal) of 464 kDa at encapsulation efficiency of 40-43% with retention of β-Gal of
slightly more than 80%. What was remarkable is the easy and mild conditions for the
formation of the nanogel by HRP.
Yang and his team88 developed a HA-based nanogels for drug delivery. The
methacrylate HA was formed into the nanogel by addition of diethylene glycol
diacrylate under 70oC with the addition of H2S2O8. Doxorubicin was then loaded by
stirring overnight. Hyaluronidase in cancer cells could release the drugs in the nanogel
for stimuli-responsive drug release. One disadvantage of this work is that elevated heat

26
is needed to form the nanogel. If the cargo is preloaded into the nanogel, heat sensitive
cargoes will not be able to withstand the heat. This is often in the case of proteins. HA
of 7 kDa was used and the size and zeta potential were appropriate for drug delivery into
tumour site as shown by the in vivo results.
In a work by Mo and his group as shown in Figure 8,89 a HA nanogel was
synthesized to load doxorubicin for anticancer drug delivery. HA was modified with
acrylamide and acrylate group. The crosslinking was achieved using UV irradiation.
The system is responsive to ATP and in presence of ATP, doxorubicin can be released.
Figure 8. Schematic diagram of an ATP responsive HA nanocarrier. (Reproduced from reference,89
copyright 2014 Springer Nature)
In a work by Zhu et al. as shown in Figure 9,68 they fabricated a HA nanogel by
conjugation of cholesterol (chol) on to HA using the “bottom up” approach. HA-chol
can self-assemble to form NPs and encapsulate the proteins due to hydrophobic-
hydrophobic interaction between chol and hydrophobic component of proteins. To
prevent leakage of protein, radical polymerization of methacrylic moiety of the HA was

27
carried out and results showed that leakage was reduced. Furthermore, this method of
crosslinking to form the nanogel preserve the protein activity due to the mild reaction
conditions.
Figure 9. Schematic diagram of a HA nanogel that is fabricated from bottom up approach. (Reproduced
from reference,68 copyright 2018 Wiley)
1.4 Development of stimuli responsive nanoparticle system
Other than making use of passive and possible active targeting using HA based
NPs, different components were incorporated into the NPs system to enable therapeutic
effects in the presence of a stimuli to further increase selectivity.90 Stimuli can be
classified as endogenous or exogenous.91 Endogenous stimuli usually depend on the
variances in the intrinsic properties of cancer cells and normal cells. Most cancer cells
have lower cellular pH, greater concentration of glutathione (GSH) level and a higher
level of certain enzymes such as matrix metalloproteinases (MMPs). In 1920s, Warburg
observed that cancer cells were taking up enormous amount of glucose for aerobic

28
glycolysis to give lactate by-product which thus caused cancer cells to be more acidic
than normal cells.6, 92, 93 Large amount of ROS has been detected in cancer. However,
as a mechanism to protect itself, cancer cells also express higher concentrations of
GSH.8 Many enzymes such as MMPs are also overly expressed.94 Endogenous stimuli
have been used in many NPs system for reduction mediated release of prodrug from its
disulfide linkage, acidic cleavage of chemical bonds such as hydrazone bond and also
cleavage of peptides sequence using MMPs. In a work from our group,67 we synthesized
a prodrug of camptothecin with adamantane via a redox-sensitive disulfide bond. When
the prodrug enters the reducing environment of the cancer cell, active drug is released
together with a recovery of the fluorescence emission. In another work by Rodrigues et
al., chemodrug doxorubicin was conjugated to polyethylene glycol(PEG) polymer via
acid-sensitive hydrazone bond and shown to be responsive to the tumour acidic pH. Zhu
and his group synthesized a nanocarrier that is responsive to MMP2 in tumour cells by
incorporation of MMP2-cleavable octapeptide.95 Cleavage of this octapeptide revealed
the cellular penetrating peptide for enhanced uptake of the NPs. Despite numerous
nanosystems incorporating internal stimuli, they are less reliable because cells have
varying amount of each stimuli and outcome of treatment is thus less predictable and
beyond control. Exogenous stimuli, on the other hand, is much more controllable and
can be used for spatiotemporal treatment. The therapeutic agent could first be
administered before exogenous stimuli is applied for therapy. Examples of exogenous
stimuli include ultrasound,96, 97 temperature, magnetic field and electromagnetic waves
such as visible light, near-infrared light,98-101 UV102 and X-ray.103 In a work by You et
al., ultrasound was used to generate ROS from the titanium dioxide NPs in sonodynamic
treatment.97 Ultrasound can penetrate deep into tissues and would not be absorbed by
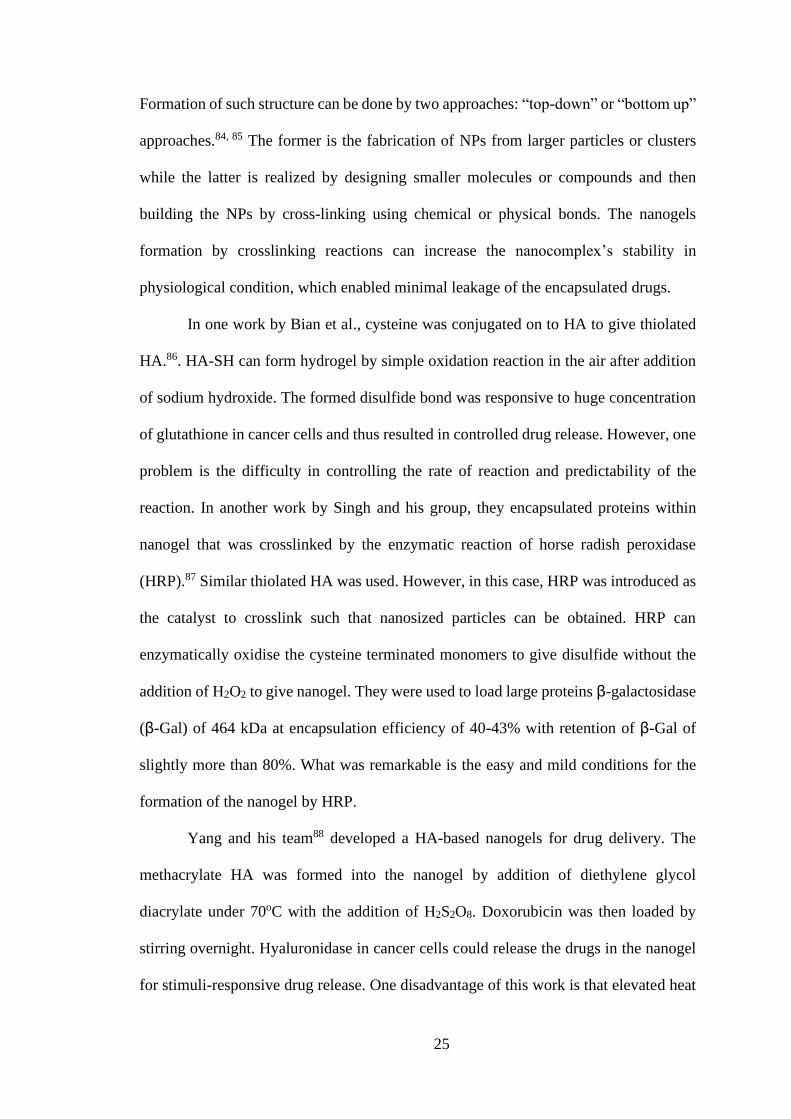
tissue to produce heat. In another work by our group as shown in Figure 10, adamantane
29
modified photosensitizer BODIPY together with adamantane modified paclitaxel (PTX)
drug was incorporated into PEG polymer functionalized with CD to form NP.101 Upon
intravenous injection of these NPs into the mice, the NP accumulated at the tumour site
but did not elicit any toxicity. With irradiation of NIR light on tumour site, tumour
growth was inhibited. In another work by Chen et al., X-ray was used to activate the
photosensitizers to produce ROS for killing of cells.103 All these examples have one
common advantage which is the possibility of activation of treatment upon irradiation
of the respective treatment modalities.
Figure 10. Schematic diagram of a light responsive NPs system that was fabricated from self-assembly
due to formation of cyclodextrin and adamantane inclusion complex. (Reproduced with permission,101
copyright 2019 Wiley)

30
1.5 Current development of using light in drug delivery
Exogenous stimuli such as light has caught attention of the researchers on
account of its orthogonality and reliability. Phototherapy is the use of light of various
wavelengths in treatment of a physical condition. In the 1890s, ultraviolet (UV) was
discovered to have strong anti-bacterial effects. In the 1903, treatment of lupus vulgaris
using concentrated light irradiation in medical field received recognition through Nobel
Prize award. Thereafter, light was recognised as essential treatment tool for many
diseases such as jaundice in newborns, autoimmune diseases, dermatologic and
oncologic diseases. Light-mediated controlled activation in various cancer therapy has
emerged as a hopeful means for precise control and activation of therapeutic reagents.102
Advantages of such phototherapy include its minimum invasive nature, high
spatiotemporal resolution and reliability as a stimuli. Thus, various nanotherapeutic
system has been developed for various phototherapy including PDT and light-
responsive drug delivery. It is important to relate these concepts to how cells are killed.
1.5.1 Photodynamic therapy
Currently in clinical oncology, PDT is used for skin cancer treatment. This
involves the applying of the therapeutic agents which in this case the photosensitizers
on to skin cancer lesions first. After which, light of appropriate wavelength is
irradiated.104, 105 PDT is defined as a way of cancer treatment using light of some
wavelength and photosensitizers. This therapy involves the administration of non-toxic
photodynamic agents that localise or accumulate at the tumour site. Activation of the
photosensitizers is done by the illumination of light of wavelength absorbed by the
photosensitizers to generate ROS from dissolved O2. With oxidative stress, cellular
structures are damaged and thus lead to cell death. There are two types of photodynamic
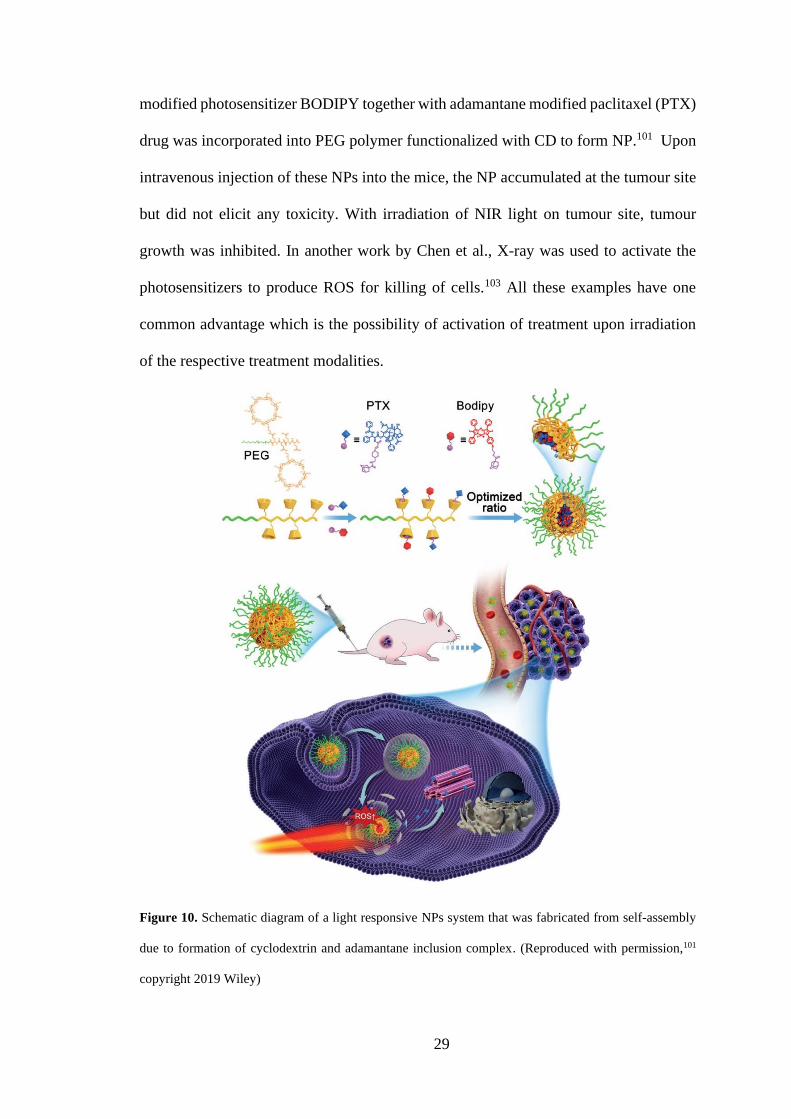
therapy. Upon absorption of light, the photosensitizers are excited to its triplet state from
31
ground state. The triplet can undergo either type I or II reaction pathways for achieve
PDT. Type I reaction is when the photosensitizer reacts to form radicals which produce
species such as H2O2, radicals and superoxide. Type II reaction is when singlet oxygen
is produced from triplet oxygen.106-108 Figure 11 shows the Jablonski diagram of the
photosensitizers to produce singlet oxygen.
Figure 11. Jablonski diagram depicting the process of how a photosensitizer generates singlet oxygen. IC
represents internal conversion. ISC represents intersystem crossing. VR represents vibrational relaxation.
In comparison to conventional cancer treatment method of cancer, PDT
possesses several main advantages.108-110 One of the main advantages is that the
therapeutic effect of PDT agents is activated by light which can thus minimized systemic
toxicity. Furthermore, PDT are usually allowed in multiple dosages as compared to
chemotherapy or surgery. Treatment by PDT is also non-invasive in nature in contrast
to surgical means. In addition, minimal or no resistance exists for PDT treatments.
Versatility in PDT treatment also enables it to be coupled with other treatment methods.
Most of the PDT photosensitizers possess a heterocyclic ring structure like that
of chlorophyll or heme in hemoglobin. Choice of photosensitizers affect the light needed
to irradiate the tumour site. Photosensitizers can be categorized by their chemical
structures and origins. In general, there are three different types of photosensitizers
namely porphyrin-based photosensitizer,111, 112 chlorophyll-based photosensitizer113 and

32
newly synthesized dyes such as phthalocyanine110 and BODIPY.114 One of the earliest
approved photosensitizers is photofrin which can be used for treatment of cervical,
bladder and gastric cancers and brain tumours.115 Photosensitizers were traditionally
applied on the skin for treatment of melanoma and other cancer that are on the surface
of the skin. Incorporation of photosensitizers in NPs was done in recent years for
treatment of tumours that were deeper in the body.
Photosensitizers are usually hydrophobic and could aggregate when dissolved in
water or solutions with high ionic strength.112 Attempts have made to incorporate
photosensitizers into nanocarriers. Lee and his group has incorporated Ce6 by
carbodiimide coupling with the acetylated HA polymer for release of doxorubicin
encapsulated and photoactivation of Ce6 for dual therapy as shown in Figure 12.116
Modification of the polymer backbone with photosensitizers enable hydrophobic
photosensitizers to be loaded and aided in the self-assembly of the NPs.
Figure 12. Schematic diagram showing the incorporation of Ce6 photosensitizers on to acetylated HA
polymers. (Reproduced with permission,116 copyright 2014 American Chemical Society)
1.5.2 Light responsive drug delivery system (DDS)
Light responsive DDS was developed for targeted cancer drug delivery. In the
infant stage of the development of such system, light responsive prodrugs were
fabricated by relying on the concept of photocages and release of such prodrug to its

33
active drug form was achieved with irradiation of light. These prodrugs usually do not
possess high toxicity unless activated. Photocages are the establishment of photolabile
bond in the molecule conjugates or NP system, in which light is needed in order to
release the “caged” prodrug, activating the therapeutic system.117 Release of parent drug
is only possible when light is irradiated in a controlled timely manner. Conjugation of
drug prevents premature leakage and better quantification of drugs. Examples of various
photocages that have been established over the years in the field of biology and
chemistry based on UV-light responsive aromatic ring including arylmethylcarbonyl
group,118 o-nitrobenzyl119-121 and coumarinyl ester34, 122, and established
spatiotemporally release of therapeutic molecules.
In a study by Tan and his group, DNA strand was conjugated to camptothecin
(CPT) through an o-nitrobenzyl photocage.123 Upon UV light irradiation, the self-
assembled NPs disassembled as the hydrophobic CPT was cleaved from the DNA,
releasing the CPT drug. Another class of photoremovable group is the simple arylmethyl
group.48 In fact, the primary application of such photosensitive protecting moiety was
back in 1962 where Schofield and his group successfully release glycine from its
benzyloxycarbonyl derivative.124 Arylmethyl are excellent protecting group for
carboxylates, carbonates, phosphates and other good leaving group.
Despite tremendous effort in designing photocages for light activated system,
disadvantages such as the lack of imaging capability of some photocages still renders
its disability for a real-time monitoring of endocytosis of NPs. Short wavelength (254
nm) used for photocleavage also resulted in photocytotoxicity and thus could not be
rendered for prolong usage. Production of toxic photolysis by-products also results in
unsuitability of the photocages.
34
In recent work, photochemically activated drug delivery were designed and
synthesized. These systems were light activated. However, instead of direct photolysis,
the nanostructures disassembled or ruptured due to the singlet oxygen or radical species
produced by photosensitizers when irradiated with light.
In a work by Rwei et al., photosensitizers were loaded into the liposomal
carrier.125 Reaction of 1O2 with the unsaturated lipids resulted in peroxidation, disrupting
the stability of the liposome and caused release of the hydrophilic drug loaded within
the aqueous core. In a separate work by Li et al., light sensitive liposome was
synthesized and photosensitizer ICG was loaded at the hydrophobic region of the
liposome.126 Upon light irradiation of the nanostructure, the photolabile bond could be
cleaved to dissemble the liposomes and release the doxorubicin encapsulated within the
core. These proved to be a feasible method of releasing of free drugs from the carrier.
Attempts were also made to harness near infrared light by using two photon technique.
The molecules that had large two photon cross-sections were conjugated on to the
polymer. With two photons irradiation, the molecules absorbed light and were cleaved
from the polymer. In a work by Kumar et al., coumarin was functionalised on to block
polymer poly(ethyleneoxide) and poly(L-glutamic acid).127 Irradiation of two photon
light to cleave the coumarin caused the nanocarrier destabilisation and released the
hydrophobic drug within the core. However, two photon irradiation has some
disadvantages such as the small focal point and the complex equipment which can
hinder its clinical applications. It is thus essential to develop system that can release
drugs from near infrared light in controlled manner.

35
1.6 Current development of using ROS responsive drug delivery
1.6.1 Reactive oxygen species
ROS are reactive radicals, ions or compounds containing oxygen that possess
singly unpaired electron in their outermost orbitals. Singlet oxygen,128 hydrogen
peroxide129 and hydroxyl radicals are some example of the common ROS in oncology.
ROS are commonly found in cells129 and are deemed double-edged sword. The amount
of ROS in cancer cells is higher because of oncogenic stimulation, greater metabolic
activity and malfunctional mitochondria.2 Low level of ROS in cells helps in the
regulation of biological pathways, which facilitates cell survival. Excessive ROS can
lead to non-specific damage of intracellular macromolecules i.e. cellular proteins, lipids
and DNA, causing cell death. Damage in DNA strands imparts repair of cellular
structures, leading to apoptosis. ROS can perform reaction with amino acids residues,
altering functions of proteins. ROS is also able to react with the double bond in lipid
structures in lipid peroxidation which lead to eventual cell death. Many of the
chemotherapy drugs and radioactive therapy agents increase the amount of ROS in
tumour in order to kill the cells. Some factors like dosage, time, type and site of ROS
productions determine if the cells will survive or die.
1.6.2 Literature review on ROS responsive system
ROS responsive system has been developed because of the intrinsic and extrinsic
ROS present in the tumour cells. Some functional groups that can react with ROS are as
shown in Figure 13 below. 130

36
Figure 13. Summary of the functional groups that are responsive to ROS. (Reproduced with
permission,130 copyright 2017 Wiley)
Some functional groups include diselenide,131, 132 monoselenide,133 telluride,134
arylboronic ester,135-137 thioether,138, 139 thioketal,140-142 vinyldithioether,143
aryloxalate144 and ferrocene.145 Reactions with endogenous or exogenous ROS can lead
to stimuli responsive drug release of the nanocarrier. In a work by Chen and his group
as shown in Figure 14, catalase was loaded into core of the NP together with methylene
blue as the photosensitizer. 146 The photosensitizer was quenched by black hole
quencher 3. When hydrogen peroxide diffused into the NP, catalase catalyzed the
production of O2. It ruptured the polymeric shell and decreased the FRET to recover
fluorescence of methylene blue and thus enhanced the singlet oxygen production when
light was irradiated.

37
Figure 14. Schematic diagram showing a H2O2 responsive system. (Reproduced with permission,146
copyright 2015 American Chemical Society)
In a separate work by Saravanakumar and his group, they fabricated a polymeric
carrier with vinyldithioether group in the polymeric backbone.143 Both the
photosensitizer Ce6 and doxorubicin were encapsulated in the core of the NPs. Light
irradiation of Ce6 depleted the O2 in the NPs and this generated 1O2 which was used to

38
react with the vinyldithioether functional group that was cleavable by 1O2. The
disassembly of the NPs released the encapsulated drug doxorubicin.
1.7 Current development of using Hypoxia responsive drug delivery
Prodrugs can also be stimulated by endogenous factors such as commonly
hypoxia conditions in tumour cells. Some of the more common hypoxic activated drugs
include Tirapazamine (TPZ), TH-302, TH-4000 and EO9.147 These hypoxic activated
drugs are activated when there is limiting amount of oxygen in the cells as this promotes
reduction to give their toxic counterparts.
Hypoxic environment also encourages bio reduction due to the lack of oxygen.
In a work by He and his group as shown in Figure 15, 2-nitroimidazole moiety was
incorporated into polyethylenimine as the polymeric NP.148 The hydrophobic 2-
nitroimidazole moiety could be reduced to give hydrophilic 2-aminoimidazole, which
enabled the disassembly of the NP. HA was conjugated with Ce6 and grafted on the PEI
NPs. Doxorubicin was encapsulated within the NP. This gave a hypoxia responsive NP
that released drugs after it was irradiated with light of 660 nm.
In a work by Kulkarni and his team, azobenzene was incorporated within the
polymer chain of the polymeric nanocarrier.149 Under hypoxia condition, azobenzene
was cleaved. This disassembled the nanocarrier which enabled the release of the two
drugs gemcitabine and erlotinib in the polymersomes. In another work by Wang et al.
as shown in Figure 16, they developed a nanocarrier that target tumour under both
hypoxic and normoxic condition.150 Both photosensitizers ICG and hypoxia activated
drug tirapazamine (TPZ) was incorporated into the system. When the NPs reached the
normoxic portion of the tumour, light could be irradiated to increase ROS in the system.
As the NP diffused into the hypoxic region, TPZ could be activated to give its toxic

39
radical species for therapeutic purpose. This enabled the killing of both normoxic and
hypoxic cancer cells. However, this would also mean that upon light irradiation, TPZ
could be activated before reaching the hypoxic cells.
Figure 15. Schematic diagram of a hypoxia responsive NPs system. (Reproduced with permission,148
copyright 2018 Royal Society of Chemistry)

40
Figure 16. Schematic diagram of a drug delivery system that delivers TPZ, a hypoxia responsive drug.
(Reproduced with permission,150 copyright 2017 American Chemical Society)
1.8 Supramolecular Chemistry
With the goal of fabrication of nanocarrier using polymers in mind, various
methods such as self-assembly, nanoprecipitation, emulsification and dialysis had been
explored.151, 152 Therapeutic agents can be loaded on to the nanocarriers using physical
encapsulation, hydrophobic-hydrophobic interaction, dipole-dipole interactions and
covalent bonding, depending on the type, size and material of the nanocarrier. However,
these methods lack specificity, tunability and flexibility in loading of the cargoes. One
possible method in which these therapeutic agents could be loaded is by supramolecular
means by formation of “host-guest” inclusion complex. 153 One class of molecules is the
CD that is commonly used for nanocarrier fabrication. CDs are made of sugar molecules
that are linked by α-1,4-glycosidic bonds, giving a hydrophilic exterior and
hydrophobic interior as shown in Figure 17.25, 154, 155 There are different CDs (α, β, γ)
that corresponds to 6,7 or 8 glucopyranoside monomers. This gives CD a hydrophobic

41
interior in which hydrophobic moieties can be encapsulated within CD to increase its
solubility in aqueous solution. CDs are “host” molecules. Hydrophobic components that
can fit into the cavity of the CDs are known as “guest” molecule. Some common
“guests” are adamantane, azobenzene, cholesterol and ferrocene (Figure 17).
Figure 17. Schematic diagram of a cyclodextrin (host, left) and its guests (right). (Reproduced with
permission,155 copyright 2014 American Chemical Society)
Namgung et al. designed a NP that contains poly-CD and poly-conjugated drug
for anti-cancer treatment.156 CD formed an inclusion complex with paclitaxel to self-
assemble and gave NPs. In a work by our group, β-CD modified polyacrylic acid (PAA)
was fabricated together with adamantane modified moieties.25 The moieties included
folic acid (targeting moiety), FITC (imaging moiety) and PEG (to increase
biocompatibility). The versatility of incorporation of different adamantane entities for
fabrication of NPs is an advantage. Furthermore, purification of individual adamantane
modified molecules was easier. Modifications of the different molar ratios could also be
done easily by mixing.
1.9 Objectives of this thesis
The aim of this dissertation is to fabricate HA based nanocarriers for stimuli
responsive cancer treatment by supramolecular means. Advantages of HA such as its

42
good biocompatibility, biodegradability, multiple functional groups for conjugation and
its active targeting properties render it a suitable candidate as the polymeric base for
DDS. Furthermore, it can be fabricated to give micelle or NPs and can be grafted on to
NPs easily give it an edge over other polymers or polysaccharides. This renders it
suitable loading of different entities such as hydrophobic therapeutic agents, protein and
hydrophilic drug. To further enhance the selectivity of our nanocarrier, stimuli
responsive system can be fabricated. These stimuli can be in a form of either exogenous
or endogenous. In the following chapter 2, camptothecin prodrug modified with
adamantane was synthesized together with adamantane modified photosensitiser
porphyrin. These two moieties were incorporated into a NPs by self-assembly with
hydrophilic CD modified HA polymer. When the cells were incubated with this NP,
light was shone which led to light activatable release of chemodrug camptothecin from
the prodrug via the ROS responsive linker. This increased selectivity of the chemodrug
and enabled dual therapy of both PDT and chemotherapy. In chapter 3, attempts were
made to incorporate catalase, a type of enzyme, in which it can produce O2 in the
presence of H2O2 to alleviate tumour hypoxia. CD modified HA was grafted on catalase.
Adamantane modified chlorin e6 was synthesized to be incorporated to form a catalase
integrated HA base nanocarrier to treat solid tumour. Encouraged by the positive result
of natural enzyme, in chapter 4, attempts were made to incorporate glucose oxidase, an
enzyme, in the HA nanogel, together with hypoxia activated prodrug tirapazamine to
give NPs that can induce apoptosis in MDA-MB-231 cells. Finally, conclusion on the
three studies done as well as some further insights are given in Chapter 5.
43
References
1. Lim, W. Q.; Phua, S. Z. F.; Xu, H. V.; Sreejith, S.; Zhao, Y. Nanoscale 2016, 8,
12510-12519.
2. Hanahan, D.; Weinberg, Robert A. Cell 2011, 144, 646-674.
3. Brown, J. M. in Methods Enzymol., Vol. Volume 435, Academic Press, 2007, pp.
295-321.
4. Nishida, N.; Yano, H.; Nishida, T.; Kamura, T.; Kojiro, M. Vasc. Health Risk
Manag. 2006, 2, 213-219.
5. Farrell, D.; Alper, J.; Ptak, K.; Panaro, N. J.; Grodzinski, P.; Barker, A. D. ACS
Nano 2010, 4, 589-594.
6. Warburg, O. Science 1956, 123, 309-314.
7. Griffiths, J. R. Br. J. Cancer 1991, 64, 425-427.
8. Traverso, N.; Ricciarelli, R.; Nitti, M.; Marengo, B.; Furfaro, A. L.; Pronzato,
M. A.; Marinari, U. M.; Domenicotti, C. Oxid. Med. Cell Longev. 2013, 2013,
10.
9. Guaragna, A.; Chiaviello, A.; Paolella, C.; D’Alonzo, D.; Palumbo, G.; Palumbo,
G. Bioconjug. Chem. 2012, 23, 84-96.
10. Piccart-Gebhart, M. J. N. Engl. J. Med. 2005, 353, 1659-1672.
11. Misra, S.; Heldin, P.; Hascall, V. C.; Karamanos, N. K.; Skandalis, S. S.;
Markwald, R. R.; Ghatak, S. FEBS J. 2011, 278, 1429-1443.
12. Danhier, F.; Breton, A. L.; Préat, V. Mol. Pharm. 2012, 9, 2961-2973.
13. Lucky, S. S.; Soo, K. C.; Zhang, Y. Chem. Rev. 2015, 115, 1990-2042.
14. Begg, A. C.; Stewart, F. A.; Vens, C. Nat. Rev. Cancer 2011, 11, 239-253.
15. Gravitz, L. Nature 2013, 504, S1-S1.
16. Chabner, B. A.; Roberts, T. G. Nat. Rev. Cancer 2005, 5, 65-72.

44
17. Pérez-Arnaiz, C.; Busto, N.; Leal, J. M.; García, B. J. Phys. Chem. B 2014, 118,
1288-1295.
18. Sparano , J. A.; Wang , M.; Martino , S.; Jones , V.; Perez , E. A.; Saphner , T.;
Wolff , A. C.; Sledge , G. W. J.; Wood , W. C.; Davidson , N. E. N. Engl. J. Med.
2008, 358, 1663-1671.
19. Oettle, H.; Neuhaus, P.; Hochhaus, A.; Hartmann, J. T.; Gellert, K.; Ridwelski,
K.; Niedergethmann, M.; Zülke, C.; Fahlke, J.; Arning, M. B.; Sinn, M.; Hinke,
A.; Riess, H. JAMA 2013, 310, 1473-1481.
20. Maeda, H. Adv. Enzyme Regul. 2001, 41, 189-207.
21. Sun, T.; Zhang, Y. S.; Pang, B.; Hyun, D. C.; Yang, M.; Xia, Y. Angew. Chem.
Int. Ed. 2014, 53, 12320-12364.
22. Park, J. W. Breast Cancer Res. 2002, 4, 95-99.
23. Chen, Q.; Wang, C.; Zhan, Z.; He, W.; Cheng, Z.; Li, Y.; Liu, Z. Biomaterials
2014, 35, 8206-8214.
24. Li, M.; Teh, C.; Ang, C. Y.; Tan, S. Y.; Luo, Z.; Qu, Q.; Zhang, Y.; Korzh, V.;
Zhao, Y. Adv. Funct. Mater. 2015, 25, 5602-5610.
25. Ang, C. Y.; Tan, S. Y.; Wang, X.; Zhang, Q.; Khan, M.; Bai, L.; Tamil Selvan,
S.; Ma, X.; Zhu, L.; Nguyen, K. T.; Tan, N. S.; Zhao, Y. J. Mater. Chem. B 2014,
2, 1879-1890.
26. Ma, X.; Ong, O. S.; Zhao, Y. Biomater. Sci. 2013, 1, 912-917.
27. Luo, Z.; Ding, X.; Hu, Y.; Wu, S.; Xiang, Y.; Zeng, Y.; Zhang, B.; Yan, H.;
Zhang, H.; Zhu, L.; Liu, J.; Li, J.; Cai, K.; Zhao, Y. ACS Nano 2013, 7, 10271-
10284.
28. Qu, Q.; Ma, X.; Zhao, Y. Nanoscale 2015, 7, 16677-16686.
29. Yanes, R. E.; Tamanoi, F. Ther. Deliv. 2012, 3, 389-404.

45
30. Li, M.; Yan, H.; Teh, C.; Korzh, V.; Zhao, Y. Chem. Commun. 2014, 50, 9745-
9748.
31. Gupta, A. K.; Gupta, M. Biomaterials 2005, 26, 3995-4021.
32. Zhang, L.; Gao, S.; Zhang, F.; Yang, K.; Ma, Q.; Zhu, L. ACS Nano 2014, 8,
12250-12258.
33. Liu, J.; Cui, L.; Losic, D. Acta Biomater. 2013, 9, 9243-9257.
34. Zhao, L.; Peng, J.; Huang, Q.; Li, C.; Chen, M.; Sun, Y.; Lin, Q.; Zhu, L.; Li, F.
Adv. Funct. Mater. 2014, 24, 363-371.
35. Nakamura, M.; Shono, M.; Ishimura, K. Anal. Chem. 2007, 79, 6507-6514.
36. Alkilany, A. M.; Murphy, C. J. J. Nanoparticle Res. 2010, 12, 2313-2333.
37. Chen, G.; Qiu, H.; Prasad, P. N.; Chen, X. Chem. Rev. 2014, 114, 5161-5214.
38. Peng, F.; Setyawati, M. I.; Tee, J. K.; Ding, X.; Wang, J.; Nga, M. E.; Ho, H. K.;
Leong, D. T. Nat. Nanotechnol. 2019.
39. Davis, M. E.; Chen, Z.; Shin, D. M. Nat. Rev. Drug Discov. 2008, 7, 771-782.
40. Allen, T. M. Nat. Rev. Cancer 2002, 2, 750-763.
41. Ang, C. Y.; Tan, S. Y.; Zhao, Y. Org. Biomol. Chem. 2014, 12, 4776-4806.
42. Pirollo, K. F.; Chang, E. H. Trends Biotechnol., 26, 552-558.
43. Sun, W.; Jiang, T.; Lu, Y.; Reiff, M.; Mo, R.; Gu, Z. J. Am. Chem. Soc. 2014,
136, 14722-14725.
44. Wu, X.; Li, Y.; Lin, C.; Hu, X.-Y.; Wang, L. Chem. Commun. 2015, 51, 6832-
6835.
45. Wang, T.; Ng, D. Y. W.; Wu, Y.; Thomas, J.; TamTran, T.; Weil, T. Chem.
Commun. 2014, 50, 1116-1118.
46. Palmer, B. D.; Wilson, W. R.; Cliffe, S.; Denny, W. A. J. Med. Chem. 1992, 35,
3214-3222.

46
47. Couture, O.; Foley, J.; Kassell, N. F.; Larrat, B.; Aubry, J.-F. Transl. Cancer Res.
2014, 3, 494-511.
48. Klán, P.; Šolomek, T.; Bochet, C. G.; Blanc, A.; Givens, R.; Rubina, M.; Popik,
V.; Kostikov, A.; Wirz, J. Chem. Rev. 2013, 113, 119-191.
49. Wong, P. T.; Choi, S. K. Chem. Rev. 2015, 115, 3388-3432.
50. Shi, J.; Kantoff, P. W.; Wooster, R.; Farokhzad, O. C. Nat. Rev. Cancer 2016,
17, 20.
51. Ponta, H.; Sherman, L.; Herrlich, P. A. Nat. Rev. Mol. Cell Biol. 2003, 4, 33.
52. Ishimoto, T.; Nagano, O.; Yae, T.; Tamada, M.; Motohara, T.; Oshima, H.;
Oshima, M.; Ikeda, T.; Asaba, R.; Yagi, H.; Masuko, T.; Shimizu, T.; Ishikawa,
T.; Kai, K.; Takahashi, E.; Imamura, Y.; Baba, Y.; Ohmura, M.; Suematsu, M.;
Baba, H.; Saya, H. Cancer Cell 2011, 19, 387-400.
53. Al-Hajj, M.; Wicha, M. S.; Benito-Hernandez, A.; Morrison, S. J.; Clarke, M. F.
Proc. Natl. Acad. Sci. U.S.A. 2003, 100, 3983-3988.
54. Takaishi, S.; Okumura, T.; Tu, S.; Wang, S. S. W.; Shibata, W.; Vigneshwaran,
R.; Gordon, S. A. K.; Shimada, Y.; Wang, T. C. Stem cells (Dayton, Ohio) 2009,
27, 1006-1020.
55. Avigdor, A.; Goichberg, P.; Shivtiel, S.; Dar, A.; Peled, A.; Samira, S.; Kollet,
O.; Hershkoviz, R.; Alon, R.; Hardan, I.; Ben-Hur, H.; Naor, D.; Nagler, A.;
Lapidot, T. Blood 2004, 103, 2981-2989.
56. Orian-Rousseau, V. Eur. J. Cancer, 46, 1271-1277.
57. Sun, H.; Benjaminsen, R. V.; Almdal, K.; Andresen, T. L. Bioconjug. Chem.
2012, 23, 2247-2255.
58. Yan, Y.; Zuo, X.; Wei, D. Stem Cells Transl. Med. 2015, 4, 1033-1043.
59. Lesley, J.; Hascall, V. C.; Tammi, M.; Hyman, R. J. Biol. Chem. 2000.

47
60. Misra, S.; Hascall, V. C.; Markwald, R. R.; Ghatak, S. Front. Immunol. 2015, 6,
201-201.
61. Culty, M.; Nguyen, H. A.; Underhill, C. B. J. Cell Biol. 1992, 116, 1055-1062.
62. Ponta, H.; Sherman, L.; Herrlich, P. A. Nat. Rev. Mol. Cell Biol. 2003, 4, 33-45.
63. Chanmee, T.; Ontong, P.; Itano, N. Cancer Lett. 2016, 375, 20-30.
64. Tham, H. P.; Chen, H.; Tan, Y. H.; Qu, Q.; Sreejith, S.; Zhao, L.; Venkatraman,
S. S.; Zhao, Y. Chem. Commun. 2016, 52, 8854-8857.
65. Chen, Z.; Li, Z.; Wang, J.; Ju, E.; Zhou, L.; Ren, J.; Qu, X. Adv. Funct. Mater.
2014, 24, 522-529.
66. Yerushalmi, N.; Arad, A.; Margalit, R. Arch. Biochem. Biophys. 1994, 313, 267-
273.
67. Zhang, Y.; Yang, D.; Chen, H.; Lim, W. Q.; Phua, F. S. Z.; An, G.; Yang, P.;
Zhao, Y. Biomaterials 2018, 163, 14-24.
68. Zhu, Q.; Chen, X.; Xu, X.; Zhang, Y.; Zhang, C.; Mo, R. Adv. Funct. Mater.
2018, 28, 1707371.
69. Schanté, C. E.; Zuber, G.; Herlin, C.; Vandamme, T. F. Carbohydr. Polym. 2011,
85, 469-489.
70. Hu, Q.; Li, W.; Hu, X.; Hu, Q.; Shen, J.; Jin, X.; Zhou, J.; Tang, G.; Chu, P. K.
Biomaterials 2012, 33, 6580-6591.
71. Fan, H.; Hu, Q.-D.; Xu, F.-J.; Liang, W.-Q.; Tang, G.-P.; Yang, W.-T.
Biomaterials 2012, 33, 1428-1436.
72. Lee, H.; Lee, K.; Park, T. G. Bioconjug. Chem. 2008, 19, 1319-1325.
73. Choi, K. Y.; Chung, H.; Min, K. H.; Yoon, H. Y.; Kim, K.; Park, J. H.; Kwon, I.
C.; Jeong, S. Y. Biomaterials 2010, 31, 106-114.

48
74. Yoon, H. Y.; Koo, H.; Choi, K. Y.; Lee, S. J.; Kim, K.; Kwon, I. C.; Leary, J. F.;
Park, K.; Yuk, S. H.; Park, J. H.; Choi, K. Biomaterials 2012, 33, 3980-3989.
75. Liu, Y.; Sun, J.; Cao, W.; Yang, J.; Lian, H.; Li, X.; Sun, Y.; Wang, Y.; Wang,
S.; He, Z. Int. J. Pharm. 2011, 421, 160-169.
76. Huang, J.; Zhang, H.; Yu, Y.; Chen, Y.; Wang, D.; Zhang, G.; Zhou, G.; Liu, J.;
Sun, Z.; Sun, D.; Lu, Y.; Zhong, Y. Biomaterials 2014, 35, 550-566.
77. Bae, K. H.; Tan, S.; Yamashita, A.; Ang, W. X.; Gao, S. J.; Wang, S.; Chung, J.
E.; Kurisawa, M. Biomaterials 2017, 148, 41-53.
78. Lee, M.-Y.; Yang, J.-A.; Jung, H. S.; Beack, S.; Choi, J. E.; Hur, W.; Koo, H.;
Kim, K.; Yoon, S. K.; Hahn, S. K. ACS Nano 2012, 6, 9522-9531.
79. Feng, Q.; Zhang, Y.; Zhang, W.; Shan, X.; Yuan, Y.; Zhang, H.; Hou, L.; Zhang,
Z. Acta Biomater. 2016, 38, 129-142.
80. Ma, M.; Chen, H.; Chen, Y.; Zhang, K.; Wang, X.; Cui, X.; Shi, J. J. Mater.
Chem. 2012, 22, 5615-5621.
81. Yang, Y.; Jing, L.; Li, X.; Lin, L.; Yue, X.; Dai, Z. Theranostics 2017, 7, 466-
481.
82. Song, E.; Han, W.; Li, C.; Cheng, D.; Li, L.; Liu, L.; Zhu, G.; Song, Y.; Tan, W.
ACS Appl. Mater. Interfaces 2014, 6, 11882-11890.
83. Dreaden, E. C.; Morton, S. W.; Shopsowitz, K. E.; Choi, J.-H.; Deng, Z. J.; Cho,
N.-J.; Hammond, P. T. ACS Nano 2014, 8, 8374-8382.
84. Neamtu, I.; Rusu, A. G.; Diaconu, A.; Nita, L. E.; Chiriac, A. P. Drug Deliv
2017, 24, 539-557.
85. Zhang, X.; Malhotra, S.; Molina, M.; Haag, R. Chem. Soc. Rev. 2015, 44, 1948-
1973.

49
86. Bian, S.; He, M.; Sui, J.; Cai, H.; Sun, Y.; Liang, J.; Fan, Y.; Zhang, X. Colloids
Surf. B Biointerfaces 2016, 140, 392-402.
87. Singh, S.; Topuz, F.; Hahn, K.; Albrecht, K.; Groll, J. Angew. Chem., Int. Ed.
Engl. 2013, 52, 3000-3003.
88. Yang, C.; Wang, X.; Yao, X.; Zhang, Y.; Wu, W.; Jiang, X. J. Control. Release
2015, 205, 206-217.
89. Mo, R.; Jiang, T.; DiSanto, R.; Tai, W.; Gu, Z. Nat. Commun. 2014, 5, 3364.
90. Mura, S.; Nicolas, J.; Couvreur, P. Nat. Mater. 2013, 12, 991.
91. Hatakeyama, H. Chem. Pharm. Bull. 2017, 65, 612-617.
92. Vander Heiden, M. G.; Cantley, L. C.; Thompson, C. B. Science 2009, 324,
1029-1033.
93. Liberti, M. V.; Locasale, J. W. Trends Biochem. Sci. 2016, 41, 211-218.
94. Gialeli, C.; Theocharis, A. D.; Karamanos, N. K. FEBS J. 2011, 278, 16-27.
95. Zhu, L.; Kate, P.; Torchilin, V. P. ACS nano 2012, 6, 3491-3498.
96. Wan, G.-Y.; Liu, Y.; Chen, B.-W.; Liu, Y.-Y.; Wang, Y.-S.; Zhang, N. Cancer
Biol. Med. 2016, 13, 325-338.
97. You, D. G.; Deepagan, V. G.; Um, W.; Jeon, S.; Son, S.; Chang, H.; Yoon, H.
I.; Cho, Y. W.; Swierczewska, M.; Lee, S.; Pomper, M. G.; Kwon, I. C.; Kim,
K.; Park, J. H. Sci. Rep. 2016, 6, 23200-23200.
98. Kim, H.; Chung, K.; Lee, S.; Kim, D. H.; Lee, H. Wiley Interdiscip. Rev.
Nanomed. Nanobiotechnol. 2016, 8, 23-45.
99. Thomas, A. P.; Palanikumar, L.; Jeena, M. T.; Kim, K.; Ryu, J. H. Chem. Sci.
2017, 8, 8351-8356.
100. Ai, X.; Hu, M.; Wang, Z.; Lyu, L.; Zhang, W.; Li, J.; Yang, H.; Lin, J.; Xing, B.
Bioconjug. Chem. 2018, 29, 928-938.

50
101. Chen, H.; Zeng, X.; Tham, H. P.; Phua, S. Z. F.; Cheng, W.; Zeng, W.; Shi, H.;
Mei, L.; Zhao, Y. Angew. Chem. Int. Ed. 2019, 58, 7641-7646.
102. Ai, X.; Mu, J.; Xing, B. Theranostics 2016, 6, 2439-2457.
103. Chen, H.; Wang, G. D.; Chuang, Y.-J.; Zhen, Z.; Chen, X.; Biddinger, P.; Hao,
Z.; Liu, F.; Shen, B.; Pan, Z.; Xie, J. Nano Lett. 2015, 15, 2249-2256.
104. Tschen, E. H.; Wong, D. S.; Pariser, D. M.; Dunlap, F. E.; Houlihan, A.; Ferdon,
M. B.; the Phase, I. V. A. P. A. K. S. G. Br. J. Dermatol. 2006, 155, 1262-1269.
105. Ericson, M. B.; Wennberg, A.-M.; Larkö, O. Ther. Clin. Risk. Manag. 2008, 4,
1-9.
106. Dolmans, D. E. J. G. J.; Fukumura, D.; Jain, R. K. Nat. Rev. Cancer 2003, 3,
380.
107. Castano, A. P.; Mroz, P.; Hamblin, M. R. Nat. Rev. Cancer 2006, 6, 535.
108. Juarranz, Á.; Jaén, P.; Sanz-Rodríguez, F.; Cuevas, J.; González, S. Clin. Transl.
Oncol. 2008, 10, 148-154.
109. Li, X.; Lee, S.; Yoon, J. Chem. Soc. Rev. 2018, 47, 1174-1188.
110. Li, X.; Zheng, B.-D.; Peng, X.-H.; Li, S.-Z.; Ying, J.-W.; Zhao, Y.; Huang, J.-
D.; Yoon, J. Coord. Chem. Rev. 2019, 379, 147-160.
111. Srivatsan, A.; Missert, J. R.; Upadhyay, S. K.; Pandey, R. K. J. Porphyr.
Phthalocyanines 2015, 19, 109-134.
112. Lambert, C. R.; Reddi, E.; Spikes, J. D.; Rodgers, M. A. J.; Jori, G. Photochem.
Photobiol. 1986, 44, 595-601.
113. Guo, X.; Wang, L.; Wang, S.; Li, Y.; Cao, L.; Cai, R.; Zhao, W. Bioorg. Med.
Chem. Lett. 2017, 27, 4548-4551.
114. Kamkaew, A.; Lim, S. H.; Lee, H. B.; Kiew, L. V.; Chung, L. Y.; Burgess, K.
Chem. Soc. Rev. 2013, 42, 77-88.

51
115. Schweitzer, V. G. The Laryngoscope 2001, 111, 1091-1098.
116. Lee, C.-S.; Na, K. Biomacromolecules 2014, 15, 4228-4238.
117. Jana, A.; Nguyen, K. T.; Li, X.; Zhu, P.; Tan, N. S.; Ågren, H.; Zhao, Y. ACS
Nano 2014, 8, 5939-5952.
118. Sheehan, J. C.; Umezawa, K. J. Org. Chem. 1973, 38, 3771-3774.
119. Fan, N.-C.; Cheng, F.-Y.; Ho, J.-a. A.; Yeh, C.-S. Angew. Chem. Int. Ed. 2012,
51, 8806-8810.
120. Brown, P. K.; Qureshi, A. T.; Moll, A. N.; Hayes, D. J.; Monroe, W. T. ACS
Nano 2013, 7, 2948-2959.
121. Shao, Q.; Jiang, T.; Ren, G.; Cheng, Z.; Xing, B. Chem. Commun. 2009, 4028-
4030.
122. Skwarczynski, M.; Noguchi, M.; Hirota, S.; Sohma, Y.; Kimura, T.; Hayashi,
Y.; Kiso, Y. Bioorg. Med. Chem. Lett. 2006, 16, 4492.
123. Tan, X.; Li, B. B.; Lu, X.; Jia, F.; Santori, C.; Menon, P.; Li, H.; Zhang, B.; Zhao,
J. J.; Zhang, K. J. Am. Chem. Soc. 2015, 137, 6112-6115.
124. Barltrop, J. A.; Schofield, P. Tetrahedron Lett. 1962, 16, 697.
125. Rwei, A. Y.; Lee, J.-J.; Zhan, C.; Liu, Q.; Ok, M. T.; Shankarappa, S. A.; Langer,
R.; Kohane, D. S. Proc. Natl. Acad. Sci. U.S.A. 2015, 112, 15719-15724.
126. Li, Q.; Li, W.; Di, H.; Luo, L.; Zhu, C.; Yang, J.; Yin, X.; Yin, H.; Gao, J.; Du,
Y.; You, J. J. Control. Release 2018, 277, 114-125.
127. Kumar, S.; Allard, J.-F.; Morris, D.; Dory, Y. L.; Lepage, M.; Zhao, Y. J. Mater.
Chem. 2012, 22, 7252-7257.
128. Klaper, M.; Fudickar, W.; Linker, T. J. Am. Chem. Soc. 2016, 138, 7024-7029.
129. Halliwell, B.; Clement, M. V.; Long, L. H. FEBS Lett. 2000, 486, 10-13.
130. Saravanakumar, G.; Kim, J.; Kim, W. J. Adv. Sci. 2017, 4, 1600124.

52
131. Ma, N.; Xu, H.; An, L.; Li, J.; Sun, Z.; Zhang, X. Langmuir 2011, 27, 5874-5878.
132. Ma, N.; Li, Y.; Xu, H.; Wang, Z.; Zhang, X. J. Am. Chem. Soc. 2010, 132, 442-
443.
133. Liu, J.; Pang, Y.; Zhu, Z.; Wang, D.; Li, C.; Huang, W.; Zhu, X.; Yan, D.
Biomacromolecules 2013, 14, 1627-1636.
134. Cao, W.; Gu, Y.; Li, T.; Xu, H. Chem. Commun. 2015, 51, 7069-7071.
135. Broaders, K. E.; Grandhe, S.; Fréchet, J. M. J. J. Am. Chem. Soc. 2011, 133, 756-
758.
136. de Gracia Lux, C.; Joshi-Barr, S.; Nguyen, T.; Mahmoud, E.; Schopf, E.; Fomina,
N.; Almutairi, A. J. Am. Chem. Soc. 2012, 134, 15758-15764.
137. Song, C.-C.; Ji, R.; Du, F.-S.; Liang, D.-H.; Li, Z.-C. ACS Macro Lett. 2013, 2,
273-277.
138. Allen, B. L.; Johnson, J. D.; Walker, J. P. ACS Nano 2011, 5, 5263-5272.
139. Chiang, Y.-T.; Yen, Y.-W.; Lo, C.-L. Biomaterials 2015, 61, 150-161.
140. Wilson, D. S.; Dalmasso, G.; Wang, L.; Sitaraman, S. V.; Merlin, D.; Murthy,
N. Nat. Mater. 2010, 9, 923.
141. Yue, C.; Yang, Y.; Zhang, C.; Alfranca, G.; Cheng, S.; Ma, L.; Liu, Y.; Zhi, X.;
Ni, J.; Jiang, W.; Song, J.; de la Fuente, J. M.; Cui, D. Theranostics 2016, 6,
2352-2366.
142. Yue, C.; Zhang, C.; Alfranca, G.; Yang, Y.; Jiang, X.; Yang, Y.; Pan, F.; de la
Fuente, J. M.; Cui, D. Theranostics 2016, 6, 456-469.
143. Saravanakumar, G.; Lee, J.; Kim, J.; Kim, W. J. Chem. Commun. 2015, 51,
9995-9998.
144. Wu, Y.; Zhou, D.; Qi, Y.; Xie, Z.; Chen, X.; Jing, X.; Huang, Y. RSC Advances
2015, 5, 31972-31983.

53
145. Power-Billard, K. N.; Spontak, R. J.; Manners, I. Angew. Chem. Int. Ed. 2004,
43, 1260-1264.
146. Chen, H.; Tian, J.; He, W.; Guo, Z. J. Am. Chem. Soc. 2015, 137, 1539-1547.
147. Baran, N.; Konopleva, M. Clin. Cancer Res. 2017, 23, 2382-2390.
148. He, H.; Zhu, R.; Sun, W.; Cai, K.; Chen, Y.; Yin, L. Nanoscale 2018, 10, 2856-
2865.
149. Kulkarni, P.; Haldar, M. K.; You, S.; Choi, Y.; Mallik, S. Biomacromolecules
2016, 17, 2507-2513.
150. Wang, Y.; Xie, Y.; Li, J.; Peng, Z.-H.; Sheinin, Y.; Zhou, J.; Oupický, D. ACS
Nano 2017, 11, 2227-2238.
151. Prabhu, R. H.; Patravale, V. B.; Joshi, M. D. Int. J. Nanomedicine 2015, 10,
1001-1018.
152. Crucho, C. I. C.; Barros, M. T. Mater. Sci. Eng. C 2017, 80, 771-784.
153. Webber, M. J.; Langer, R. Chem. Soc. Rev. 2017, 46, 6600-6620.
154. Chen, G.; Jiang, M. Chem. Soc. Rev. 2011, 40, 2254-2266.
155. Hu, Q.-D.; Tang, G.-P.; Chu, P. K. Acc. Chem. Res. 2014, 47, 2017-2025.
156. Namgung, R.; Mi Lee, Y.; Kim, J.; Jang, Y.; Lee, B.-H.; Kim, I.-S.; Sokkar, P.;
Rhee, Y. M.; Hoffman, A. S.; Kim, W. J. Nat. Commun. 2014, 5, 3702.

54
Chapter 2: Light-Responsive Prodrug-Based
Supramolecular Nanosystems for Site-Specific Combination
Therapy of Cancer
2.1 Introduction
Many of the anticancer drugs have high systemic toxicity when administrated
into patients, which leads to the development of prodrugs that does not exhibit toxicity.1
Such systemic toxicity could be alleviated by the design of on-demand release stimuli.2,
3 Some of the common endogenous stimuli4 include acidic cellular pH,5-7 highly
reducing environment due to overly expressed amount of glutathione,8-10 various tumour
microenvironment enzymes,11, 12 and lower oxygen partial pressure,13, 14 as well as
stimuli introduced externally such as elevated heat,15 irradiated light,13, 16-20 and
ultrasound21, 22 have been used for release of biologically active chemotherapeutic drugs
from the inactive prodrugs. In particular, external stimuli have an edge over their
endogenous stimuli because they do not depend on varying tumour microenvironment,
neither does it exhibit non-invasiveness nor excellent spatiotemporal control.23 One of
the widely used exogenous stimulus for controlled release of photocaged prodrugs20, 24
including o-nitrophenyl25, 26 and coumarinyl ester27 is light. However, the current design
of prodrugs has to be released from low wavelength light which possessed inherent
phototoxicity when administrated and low tissue penetration depth which rendered low
treatment efficacy in solid tumours.25, 26, 28-30 As such, development of near infrared
(NIR)-photoactivated prodrugs requires greater attention.31 Some recent progress has
been made. Gorka and his group conjugated an anticancer drug with antibody to form
heptamethine cyanine adducts that were cleaved selectively by NIR light.32-34 Another
strategy involves the use of NIR light absorbing photosensitizers to harvest reactive

55
oxygen species (ROS) for cleavage of prodrugs for combinational therapy i.e.
photodynamic therapy (PDT) and subsequent release of free drugs upon light irradiation.
Some common examples of ROS-responsive linkers include thioether,35, 36 diselenide,37
thioketal,17 arylboronic ester,38 aminoacrylate39 and peroxalate ester.40 Liu et al.
developed photosensitizer based prodrug where biological activities of the gemcitabine
were inhibited by porphyrin via a singlet oxygen (1O2) responsive thioketal linker.17
However, such system has its disadvantage such as its difficult synthesis procedure,
difficulty in purifications, inherently poor solubility for in vivo applications, as well as
difficult storage because of its unexpected release of drugs when exposed to stray light.
As such, nanoparticles (NPs) responsive to ROS were also fabricated to enhance tumour
accumulation and better therapeutic outcome.18, 19, 41, 42 For instance, Yue et al.
synthesized a NPs system that comprised of photosensitizer and camptothecin prodrug
through a thioketal linker. 18 Similarly, Pei et al. designed a red-blood cell membrane
containing prodrug of paclitaxel and photosensitizers.43 Although such systems showed
enhanced solubility of prodrugs, the inability of adjustment of the ratio of
photosensitizers and drugs hindered its applications greatly. There has been an
increasing attention on precise control of the drugs is to photosensitizers ratio for better
therapeutic outcomes, as such systems allow autonomy in drug prescriptions for
different patients.
Development of NIR activated prodrug has also lead to the development of
inorganic nanomaterials31 such as upconversion crystals19 and gold NPs44, 45 that were
used as a tool to facilitate release of prodrugs. However, various important
pharmacokinetics of the drugs such as metabolism and biodistributions in the body still
require much investigations.46 Biodegradable polymer such as HA (HA) with high
biocompatibility should be harnessed. It is type of natural occurring polysaccharide that

56
could also be found in various extraceullar matrix of our body.47-50 Some of the
advantages of HA include its high biocompatibility in vivo and multiple functional group
for modifications and conjugations.51 Another excellent property of HA is that it is able
to act as a targeting ligand to the overly expressed receptors on cancer cells i.e. the
cluster determinant 44 (CD44) receptors which is often connected to tumour progression
and metastasis.52-55 On account of over expression of the CD44 receptor on primary and
metastatic tumour cells as compared to normal cells, NPs modified with HA would attain
preferential uptake into cancer tissues via the receptor-mediated endocytosis.44, 48, 50, 54-
56
Having these considerations, we herein design a NP system through
supramolecular means using a hydrophilic polymer encapsulated with hydrophobic
prodrug and photosensitizer in a controllable ratio to realize PDT and controlled release
of chemotherapeutic drugs (Scheme 1). In this system, HA is conjugated with β-
cyclodextrin (CD) to give HA-CD, in which CD could form the inclusion complex with
adamantane conjugated photosensitizer and prodrug for effective encapsulation and
formation of NPs. When inclusion complex is formed by CD and adamantane, it gives
the polymers amphiphilicity which then enables self-assembly into a NPs.10, 56-58 The
two therapeutic components encapsulated include adamantane conjugated camptothecin
(aCPT) as the prodrug via ROS-responsive thioketal bond and adamantane-conjugated
5,10,15,20-tetrakis(4-hydroxyphenyl)-21H,23H-porphine (aPS) as the photosensitizer.
The supramolecular assembly of the three components (i.e., HA-CD, aCPT and aPS)
gives HA-aPS-aCPT NPs as shown in Scheme 1. To fulfil combinational therapy, the
NPs synthesized should first be internalized via the EPR effect and CD44 mediated
endocytosis.59, 60 Following which, the irradiation of NPs with light led to the generation
of 1O2 by aPS for PDT. The produced 1O2 can also react with thioketal linker on the

57
prodrug of camptothecin (aCPT) to result in a cascaded release of free camptothecin
(CPT). The advantages of this system are (1) passive targeting due to its nanoscale size
and active targeting by HA via overly expressed CD44 receptor on cancer cells, (2) light
activatable on-demand release of active drugs from prodrugs for spatiotemporal
chemotherapy combined with photodynamic therapy, (3) easy purifications of individual
molecules (aCPT and aPS) as opposed to some amphiphilic prodrugs, and (4) high
tunability in controllable dosage and ratio of photosensitizer and prodrug for
personalized cancer treatment. Thus, this superior NP system presented selective and
higher killing efficacy of cancer cells via combined PDT and chemotherapy after
systemic administration, reducing side effects of conventional chemotherapeutics.
Scheme 1. Schematic representation illustrating the treatment process using HA-aPS-aCPT NPs. The
formation of HA-aPS-aCPT NPs was first achieved through self-assembly of HA-CD, aCPT and aPS (A).
After which, the therapeutic efficacy was tested on mice model. Accumulation of HA-aPS-aCPT NPs was
achieved after intravenous injection of NPs (B). Light of suitable wavelength i.e. 660 nm was then
irradiated. The combinational therapy of photodynamic therapy (PDT) and chemotherapy is then achieved
58
after CD44 mediated endocytosis of HA-aPS-aCPT NPs coupled with light irradiation in five steps (C).
Mechanism for the drug release was illustrated in A.
2.2 Materials and Methods
2.2.1 Materials
Sodium hyaluronate (Mw = 8 to 12 kDa), Camptothecin (CPT), 4-
nitrophenylchloroformate and 1-adamantanecarbonyl chloride were purchased from
Aaron Pharmatech Ltd (Shanghai, China). Dimethylaminopyridine (DMAP), anhydrous
thioglycolic acid, triethylamine (TEA), 4-hydroxybenzaldehyde, 1-
Hydroxybenzotriazole hydrate (HOBt), pyrrole and Amberlite® IR120 hydrogen form
were purchased from Sigma Aldrich. N-(3-Dimethylaminopropyl)-N’-
ethylcarbodiimide hydrochloride (EDC.HCl), propionic acid and lithium aluminium
hydride (LiAlH4), β-CD, thiazolyl blue tetrazolium hydrate (MTT) were purchased from
Tokyo Chemical Industry. Dry HCl gas was produced in situ by adding concentrated
sulfuric acid to sodium chloride and then drying via concentrated sulfuric acid.
Anhydrous THF and acetone were obtained by distilling over CaH2 overnight. MDA-
MB-231 and MCF-7 cells were obtained from American Type Culture Collection
(ATCC). Dialysis membrane Spectra/Por 6 (MWCO:2 kDa) was purchased from
Thermo Fisher Scientific Pte Ltd. All chemicals were of analytical grade and used
without further purification if not indicated otherwise.
2.2.2 Instruments
1H NMR spectra were probed on a Bruker BBFO400 spectrometer, and D2O,
DMSO CDCl3 was used as the deuterated solvent. The UV-vis-NIR absorption and
fluorescence emission spectra were measured using Shimadzu UV-3600 and Shimadzu
RF5301PC spectrophotometer, respectively. Transmission electron microscopy (TEM)

59
images were taken at an acceleration voltage of 100 kV on JEOL JEM-1400.
Hydrodynamic diameters and zeta potential values were measured at 25oC by a Malvern
Zetasizer Nano-S system. HPLC analysis was performed with Shimadzu LC20AP with
the Waters XSelectTM HSS C18 5 μm (4.6 x 250 mm) column at detection wavelength
of 254 nm. ACN/water binary system containing 0.5% trifluoroacetic acid was used as
the mobile phase with flow rate at 1 mL/min. Confocal laser scanning microscopy
(CLSM) images were acquired by ZEISS LSM 800 Confocal Laser Scanning
Microscope.
2.2.3 Synthesis of aCPT (adamantane modified prodrug)
Scheme 2. Synthesis procedure of prodrug Ada-TL-CPT (aCPT). Conditions: (a) DMAP, DCM, 0oC,
yield: 88% (b) anhydrous acetone, HCl (g), yield: 56% (c) LiAlH4 in dry THF, yield: (d) pyridine in
anhydrous diethyl ether, yield: 34% (e) DMAP reflux in dry DCM, yield: 24%.
Synthesis of Compound 1. The synthesis was reported in previous literature.61
Briefly, camptothecin (CPT) (300 mg, 861 μmol) and 4-nitrophenylchloroformate (608
mg, 3.01 mmol) were dissolved in dry DCM (45 mL) at 0°C. Dimethylaminopyridine
(DMAP, 631 mg, 5.17 mmol) was added. The solution was then stirred for 6 h at 0°C.
The mixture was washed with water (60 ml). The organic layer was dried over sodium
sulfate, filtered and excess solvents were removed in vacuo. Purification was done by

60
silica column chromatography, DCM (100 mL) was first used, follow by 50%
DCM/EtOAc (300 mL) and then EtOAc (200 mL) to give product as a pale yellow solid
(1, 265 mg, 88%). 1H NMR (400 MHz, CDCl3): δ 8.42 (1H, s), 8.22 (3H, m), 7.96 (1H,
m), 7.86 (1H, m), 7.69 (1H, m), 7.38-7.41 (3H, m), 5.71 (1H, d, J1,2 17.3), 5.42 (1H,d,
J1,2 17.3), 5.31 (2H, d) 2.21-2.41 (2H, m), 1.07 (3H, t, J 7.5 Hz).
Synthesis of Compound 2. The synthesis was reported in previous literature.17
Anhydrous thioglycolic acid (9.21g, 100 mmol) and anhydrous acetone (11.6g, 200
mmol) was purged with dry HCl gas with stirring at r.t.p. for 6 h. The mixture was then
cooled in an ice bath. The mixture was filtered, washed with ice cold hexane and cold
water to give white solid (2, 6.24 g, 56%). 1H NMR (400 MHz, DMSO-d6): δ 12.6 (2H,
s, br), 3.37 (4H, s), 1.54 (6H, s).
Synthesis of Compound 3. The synthesis was reported in previous literature
with minor modification.17 2 (1.5 g, 6.69 mmol) was dissolved in anhydrous THF (150
mL) and cooled at 0oC. LiAlH4 (1.52 g, 40.1 mmol) was slowly added over 30 min,
purging with N2 to prevent built up of hydrogen gas. After addition was done, mixture
was stirred at r.t.p. for 4 h. The reaction was quenched by addition of water (1 mL).
After which, mixture was filtered. The filtrate was evaporated to dryness. DCM was
added followed by Na2SO4 to remove water. The mixture was filtered and evaporate to
obtain an orange liquid. Purification was done by silica column chromatography at 5%
MeOH/DCM to give product as a yellow liquid (0.774 g, 59%). 1H NMR (400 MHz,
CDCl3): δ 3.73 (4H, t, J 6.4 Hz), 3.33 (2H, s), 2.81 (4H, t, J 6 Hz), 1.574 (6H, s).
Synthesis of Compound 4 (TL). 1-Adamantanecarbonyl chloride (1.04 g, 5.24
mmol) and 3 (0.858 g, 4.37 mmol) were added to 100 mL of anhydrous diethyl ether
and anhydrous pyridine (0.415 g, 5.24 mmol). The reaction was stirred at 23-25°C for 3
days. The organic layer was extracted with DCM and brine. Purification was done by

61
silica column chromatography using 10% EA/Hexane to give 4 as an orange liquid
(0.530 g, 34%). 1H NMR (400 MHz, CDCl3): δ 4.21 (2H, t, 6.8 Hz), 3.79 (2H, t, 5.4
Hz), 2.86 (4H, m), 2.01 (3H, s), 1.89 (6H, s), 1.71 (6H, s), 1.62 (6H, s). HR-MS (ESI+):
m/z C18H30O3S2Na, [M+Na]+ calcd. 381.1534, found 381.1541.
Synthesis of Compound 5 (aCPT). 1 (265 mg, 516 μmol) and 4 (278 mg, 775
μmol) were dissolved in dry DCM (60 mL). DMAP (95 mg, 775 μmol) was then added
and the mixture was left to reflux overnight at 75 °C. The mixture was then allowed to
cool to r.t.p.. Purification was done by flash chromatography with DCM (100 mL), 5%
EtOAc/DCM (100 mL), 10% EtOAc/DCM (100 mL), 15% EtOAc/DCM (300 mL) to
give 5 which was abbreviated as Ada-TL-CPT as a pale yellow solid. 1H NMR (400
MHz, CDCl3): δ 8.39 (1H, s), 8.21 (1H, d, J 8.4 Hz), 7.93 (1H, d, J 8.4 Hz), 7.83 (1H, t,
J 7.6), 7.67 (1H, t, J 7.6), 7.33(1H, s), 5.71 (1H, d, J 17.2), 5.42 (1H,d, J 17.2), 5.29 (2H,
s) 4.30-4.19 (2H, m), 4.15-4.08 (2H, m), HR-MS (ESI+): m/z C39H45N2O8S2, [M+H]+
calcd. 733.2617, found 733.2631.
2.2.4 Synthesis of ada-THPP (aPS)
Scheme 3. Synthesis of aPS. Conditions: (a) TEA at 0oC in THF (b) propionic acid, reflux 1 h.
Synthesis of 6. Triethylamine (1.53 mL) and 4-hydroxybenzaldehyde (1.24 g,
10.2 mmol) in THF (10 mL) was first cooled in ice bath before dropwise addition of 1-
adamantanecarbonyl chloride (3.03 g, 15.2 mmol) in THF (10 mL) into the solution.
The mixture was left to stir for 12 h at r.t.p. before THF was removed under vacuo. The

62
residue was dissolved in ether (50 mL), followed by washing with 1M Na2CO3 (3x 50
mL), followed by brine (50 mL). The resultant solution was dried over Na2SO4, filtered
and excess solvents were removed in vacuo to yield 6 as a white solid (1.42 g, 50%). 1H
NMR (400 MHz, CDCl3): δ 9.99 (1 H, s), 7.91 (2 H, m), 7.24 (2 H, m), 2.10 (3 H, s),
2.60 (6 H, s), 1.75 (6 H, m).
Synthesis of 7 (aPS). 6 (1.42 g, 5.00 mmol) and 4-hydroxybenzaldehyde (1.83
g, 15.0 mmol) first underwent reflux in propionic acid (150 mL). Upon the addition of
pyrrole (1.34 g, 20.0 mmol), reaction mixture was refluxed for another 1 h. Reaction
mixture was cooled to r.t.p. and then cooled further to 0°C for 15 mins. The cooled
mixture was filtered, and purple solid residue was obtained. The solid was dissolved in
DCM (250 mL) and filtered to remove impurities. The organic solution was washed
with 1 M NaHCO3 (50 mL), follow by brine (50 mL) and then dried over Na2SO4.
Purification was done by flash chromatography with 2 % MeOH/DCM to gives Ada-
THPP as a purple solid. 1H NMR (400 MHz, CDCl3): δ 8.86 (8 H, s), 8.20 (2 H, m),
8.05 (6 H, m), 7.45 (2 H, m), 7.19 (6 H, m), 2.38 (3 H, s), 2.24 (6 H, s), 2.18 (6 H, s).
HR-MS (ESI+): m/z C55H45N4O5, [M+H]+ calcd. 841.3390, found 841.3378.
2.2.5 Synthesis of β-cyclodextrin modified hyaluronic acid (HA-CD)
Scheme 4. Synthesis procedure of HA-CD polymer. Condition: (a) NaOH, TsCl. (b) ethylenediamine,
reflux in DMF under N2 (c) EDC.HCl, HOBt for 2 days.
Sodium hyaluronate was pretreated with cationic exchange resin (Amberlite®
IR120 hydrogen form) to give HA in the following procedure. Sodium hyaluronate (1

63
g) in deionized water (300 mL) was passed through the cationic exchange resin slowly
and then lyophilized to give HA. EDC.HCl (0.232 g, 1.21 mmol) and HOBT (0.162 g,
1.05 mmol) were added into a solution of HA (0.1384 g, 14.6 μmol) in DMSO (10 mL).
The mixture was then stirred at 25°C for 30 min. Mono-6-deoxy-6-ethylenediamino-β-
CD (0.8139 g, 0.69 mmol) in DMSO (10 mL) was added into the mixture and it was
stirred for another 24 h at r.t.p.. The resulting mixture was dialyzed against DMSO (4 x
100 mL) and then with deionized water for 3 days (2 L x 10) and freeze-dried to give
HA-CD as white solid. The degree of substitution of β-CD on to HA is defined as the
no. of β-CD molecules per hundred sugar residues of HA was computed using 1H NMR
in D2O. The degree of substitution (defined as the no. of β-CD per hundred sugar
residues of HA polymer) value was around 6.56% for HA-CD. The concentration of CD
in 1 mg/mL of HA-CD was calculated to be 135 µM.
2.2.6 Drug release using HPLC
A reverse phase HPLC was used. Buffer A was 0.5% trifluoroacetic acid (TFA)
in H2O while buffer B was 0.5% TFA in ACN. Analysis was carried out at 25oC with
elution gradient. Briefly, the mixture of molecules was separated using condition as
follows: 5% buffer B for 5 minutes, ramping of 5% buffer B to 95% buffer B in 30
minutes, followed by a decrease of 95% buffer B to 5% in 2 minutes. Retention times
of CPT, aPS and aCPT were first determined to be 12.0, 15.3 and 16.1 min. 45 µM of
aCPT with different concentrations of aPS (0, 45, 90, 135 µM) were prepared and
illuminated with light of 660 nm (100 mW/cm2). The amount of free CPT released were
then calculated from the standard calibration curve obtained from different CPT
concentrations (0, 6.25, 12.5, 25, 50 and 100 µM) in 10% DMSO/H2O using the external
standard method whereby the area under the curve of peak corresponding to CPT was
directly proportionate to the concentrations of CPT prepared.

64
2.2.7 Stability constants as determined by Benesi-Hildebrand Plot
For determination of the stability constants of aPS, the Benesi-Hildebrand
method was employed. UV vis spectrum of aPS (2 x 10⁻⁵ M) were measured in the dark.
After which, β-CD (20.0 mg mL-1, 5 μL) in water was added to the aPS solution. After
which, the absorbance spectrum of the resulting solution was obtained. The process was
repeated systematically by addition of β-CD (20.0 mg/mL) in water into the same
solution. The absorbance at 435 nm was noted down. Bensi-Hildbrand plot was then
illustrated taking 1
∆𝐴 against
1
[𝐻]0 by following equation (1):
1
∆𝐴=
1
𝑏∆𝜀[𝐺]0[𝐻]0𝐾𝑎+
1
∆𝜀[𝐺]0 (1)
Where ∆A is the change in absorbance of the aCPT at the respective concentration of β-
CD, b is the path length, ∆𝜀 is the change in molar absorptivity of the guest (in this case
aPS), [𝐺]0 is the concentration of the guest (in this case aPS), [𝐻]0 is the concentration
of the host (in this case β-CD) and 𝐾𝑎 is the association or stability constant.
The experiment was repeated for aCPT (4 x 10⁻⁵ M) and 10 μL of 20.0 mg mL-1
of β-CD was added instead. The absorbance were taken at 370 nm.
The association or stability constant can be calculated by the following equation
(2):
𝐾𝑎 =𝑦 𝑖𝑛𝑡𝑒𝑟𝑐𝑒𝑝𝑡
𝑠𝑙𝑜𝑝𝑒 (2)
2.2.8 Determination of critical aggregation concentration (CAC) by pyrene probe
Pyrene (1 mg) was first dissolved in acetone (4 mL) to yield a concentration of
1.24 mM. 1.6 µL of this pyrene solution was added to 4 mL glass vial and it was left to
evaporate overnight in dark. Subsequently, the solution of HA-aPs-aCPT of different

65
concentrations (0.02 mg/mL to 1 mg/mL) were then prepared and added to the vials to
stir overnight to give final concentration of 1 μM of pyrene. The solutions were left to
stir overnight in dark. Fluorescences of pyrene were then measured from 350 to 450 nm
by excitation at 335 nm. The pyrene emission wavelengths at 373 nm and 383 nm were
recorded for different concentrations. Pyrene 1:3 ratios were calculated to determine the
critical micelle concentration.
2.2.9 Preparation of HA-aPS-aCPT NPs
HA-CD (1 mg) was first dissolved in DI water (0.948 mL). A separate aliquot
of aPS (0.0755 mg, 90 µM) and aCPT (0.0324 mg, 45 µM) in 52.6 µL of DMSO (5 %)
was prepared and mixed well. Under sonication, the aliquot of aPS and aCPT in DMSO
was added dropwise into the HA-CD suspension. The mixture was then dialyzed against
500 mL of phosphate buffer saline (PBS) to give HA-aPS-aCPT NPs. The loading
capacity was computed by using the following:
𝐿𝑜𝑎𝑑𝑖𝑛𝑔 𝑐𝑎𝑝𝑎𝑐𝑖𝑡𝑦 𝑜𝑓 𝑎𝐶𝑃𝑇(%) =𝑀𝑎𝑠𝑠 𝑜𝑓 𝑎𝐶𝑃𝑇
𝑀𝑎𝑠𝑠 𝑜𝑓 𝑛𝑎𝑛𝑜𝑝𝑎𝑟𝑡𝑖𝑐𝑙𝑒𝑠 × 100%
𝐿𝑜𝑎𝑑𝑖𝑛𝑔 𝑐𝑎𝑝𝑎𝑐𝑖𝑡𝑦 𝑜𝑓 𝑎𝑃𝑆(%) =𝑀𝑎𝑠𝑠 𝑜𝑓 𝑎𝑃𝑆
𝑀𝑎𝑠𝑠 𝑜𝑓 𝑛𝑎𝑛𝑜𝑝𝑎𝑟𝑡𝑖𝑐𝑙𝑒𝑠 × 100%
2.2.10 Singlet oxygen detection using singlet oxygen sensor green (SOSG)
Singlet oxygen detection was determined by following previously reported
protocol with slight modification.62 Briefly, SOSG dissolved in methanol was incubated
with different samples ([SOSG] = 2.5 μM, [aPS] = 4.5, 9 and 13.5 μM) to measure 1O2
generation after irradiation of 660 nm light (65 mW/cm2). The solution was diluted 5
times with DI water and then 150 µL of the diluted solution was pipetted into 96 well
66
plate and then measurement was taken. The generated 1O2 was determined by measuring
SOSG fluorescence maximum at 530 nm under 494 nm excitation.
2.2.11 Cell culture
MDA-MB-231 (CD44+) and MCF-7 (CD44-) human breast carcinoma cells
were cultured in cell incubator with high glucose DMEM containing 10% fetal bovine
serum and 1% penicillin-streptomycin under 5% CO2 at 37oC.
2.2.12 In vitro ROS detection
The generation of 1O2 from aPS was qualitatively determined using 2’,7’-
dichlorofluorescin diacetate (carboxy-H2DCFDA). HA-aPS-aCPT NPs (50 µg/mL) in
deionized water were first incubated with MDA-MB-231 cells for 4 h. Following which,
the sample was irradiated with light of 660 nm (65 mW/cm2) for 30 mins. The cells were
then dyed with carboxy-H2DCFDA (25 µM) in PBS for 30 mins at 37oC, protected from
light. At the 25th minutes, Hoechst 33342 dye was added to stain the nucleus. The dyes
were then removed, and excess dyes were washed away with phosphate buffer saline
(PBS) and cells were visualized under the confocal microscope immediately. The
excitation/emission of carboxy-H2DCFDA was taken as 495/592 nm. The
excitation/emission of Hoechst 33342 was taken as 350/461 nm.
2.2.13 Cellular uptake and in vitro targeting ability
MDA-MB-231 cells were seeded on to 6-well plate with coverslips at the bottom
at the density of 2 x 10⁵ cells/ well and left to adhere for 12 h. To determine cellular
uptake by confocal laser scanning microscope (CLSM), HA-aPS-aCPT NPs (100
µg/mL) in deionized water was incubated at different duration of 2 h and 4 h. The cells
were then washed thrice with PBS and fixed with 4% formaldehyde for visualization
under the CLSM. To validate targeting ability of the HA-aPS-aCPT NPs, MDA-MB-
231 (CD44+) and MCF-7 (CD44-) cells were cultured and seeded on to 6-well plates at
67
a density of 5 x 10⁵ cells/ well and left to adhere for 12 hours. After which, equivalent
concentrations of HA-aPS-aCPT NPs (100 µg/mL) in deionized water were added to
both MDA-MB-231 and MCF-7 cells for two different durations of 2 h and 4 h. The
cells were then washed thrice with PBS and trypsinized for flow cytometry analysis
using em/ex 633/730 nm. Both flow cytometric analysis and CLSM imaging were done
for HA competitive assays to test the targeting ability of the HA-aPS-aCPT NPs to CD44
receptors in MDA-MB-231 cells. In both experiments, MDA-MB-231 cells of 2 x
105/well were pretreated with 5 mg/mL of free HA for 2 h. HA-aPS-aCPT NPs (100
µg/mL) were then incubated for 2 h. The treated cells were then washed thrice with PBS.
To do flow cytometry analysis, the cells were trypsinized and collected. For CLSM
imaging, cells were fixed with 4% formaldehyde, mounted and visualized under
excitation/emission 640/730 nm.
2.2.14 In vitro cytotoxicity tests of HA-PS-CPT NPs and apoptosis study
The cytotoxicity of the various materials was investigated with MDA-MB-231
cells by MTT assay. MDA-MB-231 cells (1 x 10⁴ cells per well) were seeded onto 96-
well plates and incubated for 12 h. After cell confluency reached 60 - 70%, culture
medium was replaced with 100 µL of medium containing CPT drug, aCPT prodrug,
HA-aPS-TL NPs (6.25, 12.5, 25, 50, 100 and 200 µg/mL) and HA-aPS-aCPT NPs (6.25,
12.5, 25, 50, 100 and 200 µg/mL) followed by incubation for 48 h at 37oC in the dark.
The cell viability was evaluated by MTT assay. The MTT dye dissolved in DMEM high
glucose (5 mg/mL) was incubated for four hours to form the formazan crystals. DMSO
(100 µL) was then added. Measurements of the absorbance in each well were then taken
at 570 nm with reference to 630 nm. The percentage cell viabilities of each sample at
different concentrations were calculated using the following formula:

68
𝐴𝑏𝑠570 𝑛𝑚 (𝑠𝑎𝑚𝑝𝑙𝑒) − 𝐴𝑏𝑠630 𝑛𝑚(𝑠𝑎𝑚𝑝𝑙𝑒)
𝐴𝑏𝑠570 𝑛𝑚 (𝑐𝑜𝑛𝑡𝑟𝑜𝑙) − 𝐴𝑏𝑠630 𝑛𝑚(𝑐𝑜𝑛𝑡𝑟𝑜𝑙)× 100
To test for the cytotoxicity of HA-aPS-aCPT NPs under light irradiation, the
above procedure was repeated with the same concentrations of NPs added. However,
instead of incubation of 48 h in the dark, light of 660 nm at 70 mW/cm2 were irradiated
on the cells for 30 mins. After incubation for another 44 h in the dark, the cell viability
was measured in like previous procedure.
To visualize the phototoxicity using CLSM, MDA-MB-231 cells were seeded
on to petric dish (2 x 10⁵) and incubated for 48 h. The medium was replaced with fresh
medium containing HA-aPS-aCPT (50 µg/mL) and incubated in dark for 6 h. After
which, light of 660 nm (110 mW/cm2) is used. After 18 h of incubation in dark, the cells
were washed with PBS and stained with calcein-AM (3 µM, ex/em: 488/515 nm) and
propidium iodide (PI) (8 µM, ex/em: 488/610 nm) for 2 h before visualizing under the
microscope.
2.2.15 Animal model
Female BALB/c nude mice (6 weeks old) were obtained from the Animal
laboratory of Xinqiao Hospital (Chongqing). To develop the MDA-MB-231 tumour
xenograft model, 5 × 10⁵ MDA-MB-231 cells suspended in 100 μL of 3:2
Matrigel:phosphate buffered saline (PBS) were subcutaneously injected on to the mice.
The tumours were left to grow to about 60 to 80 mm3. The tumour volumes were
computed following this formula: (width2 × length)/ 2
2.2.16 In vivo optical imaging
Female BALB/c nude mice were intravenously injected with 200 μL of mixture
of free aPS and aCPT as well as HA-aPS-aCPT NPs ([aPS] = 4.0 mg/kg, [aCPT] = 2.0
mg/kg) via their tail vein. At 2, 6 and 24 h interval, the mice were anesthetized and

69
visualized using in vivo imaging system (IVIS) under the excitation wavelength of 670
nm and emission wavelength of 740 nm. To visualize the bioaccumulation, after 24 h,
the mice were sacrificed and major organs such as heart, liver, spleen, lung, kidney,
brain as well as tumour were collected and imaged using the same excitation/emission
wavelength.
2.2.17 In vivo combinational therapy
BALB/c nude mice bearing subcutaneous MDA-MB-231 tumours (~80 mm3)
were randomly divided into five groups (n=6 per group). The respective groups were:
(I): Saline (II): HA-aPS-aCPT (III): CPT (IV): THPP (V): HA-aPS-aCPT + Light
irradiation. Intravenously injections were used on all mice with volume of 100 μL
administrated each time. Mice in group I were treated with saline, group II were treated
with HA-aPS-aCPT NPs in the dark, group III were treated with camptothecin drugs,
group IV were treated with THPP and group V were treated with HA-aPS-aCPT NPs
and irradiated by the 660-nm light (100 mW/cm2 for 30 minutes) 24 h after
administration. Concentrations of different moieties administrated each time are as
following: [HA-CD] = 0.5 mg/kg, [aPS]=[THPP]=0.375 mg/kg and
[CPT]=[aCPT]=0.16 mg/kg of mice. The mice were administrated with its respective
treatment once every three days for a total of six times in 21 days period. The tumour
sizes were recorded every 2-3 days for 21 days, with their widths as well as lengths
measured by a digital vernier caliper. The weight of the mice was also recorded using a
digital weighing balance every 2-3 days for 21 days. The tumour volumes were
computed according to the following formula: (width2 × length)/ 2. On the 21st day, all
the mice were euthanized and major organs such as heart, liver, spleen, lung, kidney
were harvested and fixed by 10% formalin for two days at 4oC. Subsequently, these
fixed tissues were embedded with paraffin and then sectioned for histological studies.

70
2.2.18 TUNEL and histological assay
To investigate the tumour apoptosis in BALB/c nude mice, tumour biopsies were
performed using a TUNEL apoptosis detection kit (Beyotime biotechnology, China).
The samples were stained using Hoechst 33258 to mark the nuclei for CLSM
observation. Standard protocol was followed for hematoxylin and eosin (H&E) staining
and observed under an optical microscope.
2.3 Results and Discussions
2.3.1 Synthesis
The synthetic procedures of HA-CD, aCPT and aPS are illustrated in Schemes 2
to 4. The successful synthesis of aCPT and aPS was confirmed by 1H NMR spectra and
ESI-MS. HA-CD polymer was characterized via 1H NMR spectrum. The conjugation
degree of CD was determined to be 6.56%, which is equivalent to 15.2 HA monomer
per 1 CD. This observation indicates that HA-CD is ideal for targeting purpose, as some
reports showed that at least 6 consecutive HA sugar monomers are required for targeting
CD44 receptor.63, 64
2.3.2 Cleavage of thioketal linker from aCPT.
The cleavage of the thioketal linker on aCPT was investigated using 1H NMR
spectra and high performance liquid chromatography (HPLC). When 1O2 reacts with the
thioketal linker, the intermediate product could undergo nucleophilic attacking and
release acetone as one of the by-products (Scheme 1). Upon irradiation of the mixture
of aPS and aCPT with light, the formation of acetone was indicated by the presence of
the resonance at 2.17 ppm in the NMR spectrum as shown in Figure 1a. Under longer
irradiation time, the integral of this resonance increased. Concurrently, the integral of
the resonance at 1.55 ppm assigned to the methyl group on the thioketal unit decreased,

71
indicating that the degradation of the thioketal linker by the generated 1O2 occurred. To
further confirm that free CPT could be released under light irradiation, the HPLC study
of the reaction was performed (Figure 1b). The amount of CPT was quantified by
external standard calibration method as presented in Figure 1c, showing linear
dependence of the area with respect to the concentration of CPT. Under longer
irradiation time, the released amount of CPT increased as indicated by greater area at
the retention time of 12.0 min. This result shows that the amount of free CPT released
was dependent on the irradiation time as shown in Figure 1d. When the photosensitizer
with higher concentrations was co-doped in the mixture, the amount of free CPT
released under the same irradiation time and light power density was higher, revealing
that the release of free CPT was also dependent on the amount of photosensitizer. The
generated CPT was further proven using high-resolution mass spectrometry (HRMS)
(calculated [M+H+] = 349.1188 m/z, found = 349.1189). These results indicated that the
synthesized prodrug was indeed capable of releasing free CPT in ROS-responsive
release manner.
2.3.3 Photophysical properties of aPS and ROS detection using singlet oxygen
sensor green.
The photophysical properties of aPS were investigated through UV-vis-NIR
spectroscopy as shown in Figure 1f. Porphyrins are known to contain a Soret band and
four Q bands in their absorbance.65 In the case of aPS, the absorbance maximum
obtained was at 431 nm assigned as the Soret band, and four Q bands at 530, 572, 603
and 657 nm were also observed. This indicated that the photophysical properties of
porphyrins were generally well preserved despite functionalization of adamantane done.
To investigate the ROS generation ability of aPS, SOSG was utilized for capturing the
1O2 generated upon irradiation of light on aPS, where the amount of 1O2 produced was

72
correlated to the increase in SOSG fluorescence. HA-aPS samples with three
concentrations ([aPS] = 4.5, 9.0, and 13.5 µM) were examined for the singlet oxygen
generation. HA-aPS with [aPS] = 9.0 µM showed the highest increase in fluorescence
as compared to the other two samples (Figure 1h). This could be because, at lower
concentration of aPS (4.5 µM), the singlet oxygen generated was limited, while at higher
concentration (13.5 µM), the quenching of the photosensitizer led to a decrease in the
1O2 generation. Thus, the amount of aPS chosen in the final NPs was 9.0 µM. After
which, 1O2 generated by free aPS, HA-aPS-TL, and HA-aPS-aCPT ([aPS] = 9.0 µM)
was investigated in aqueous solution. TL is a control linker with the thioketal bond but
has no CPT drug attached. The amount of 1O2 generated follows this sequence: free aPS
> HA-aPS > HA-aPS-TL HA-aPS-aCPT. HA-aPS had lower 1O2 generation yield than
free aPS, because aPS was encapsulated within the HA-aPS NPs having possible
aggregation effect.66 Comparing HA-aPS, HA-aPS-TL and HA-aPS-aCPT, HA-aPS-TL
and HA-aPS-aCPT had lower 1O2 yield than HA-aPS, because some of the 1O2 generated
was utilized for the cleavage of thioketal linker. Since the same molar ratio of TL linker
and aCPT ([TL] = [aCPT]) was added in HA-aPS-TL and HA-aPS-aCPT, they gave
similar 1O2 yield. Despite some of the 1O2 was used for the cleavage of thioketal bond,
the generated 1O2 was still high enough for possible PDT of cancer, fulfilling the dual
therapeutic treatment.

73
Figure 1. (a) 1H NMR analysis for the cleavage of thioketal linker after irradiation for 30 min and 1 h.
(b) HPLC analysis for CPT release from aCPT (retention time of CPT, aPS and aCPT were 12.0, 15.3
and 16.1 min respectively). (c) Calibration curve of CPT obtained from corresponding HPLC curve. (d)
Drug release profile determined by HPLC when 45 µM aCPT was co-incubated with aPS with
concentrations of 45, 90 and 135 µM.
2.3.4 Self-assembly characterisations
Employment of CD and adamantane was due to the high association constant of
approximately 1 x 10⁵ mol/L in water.67, 68 We hypothesized that the adamantane of aPS
and aCPT would form an inclusion complex with CD of the HA-CD to give an
ampliphilic polymer. NPs were then formed by self assembly of this ampliphilic
polymer to give a HA-aPS-aCPT NPs with hydrophobic core (aPS and aCPT) and
hydrophilic shell (HA). The association constant of the adamantane moieties
synthesized were calculated from Hildebrand-Benesi plot69 with β-CD as the reference

74
host. aPS and aCPT were found to have association constants of 3.58 x 10³ L/mol and
2.55 x 10³ L/mol respectively (Figure 2), which shows their capability to bind to β-CD.
After which, the critical aggregation concentration (CAC) of HA-aPS-aCPT was
determined by pyrene probe. 10, 70 Table S1 revealed that the CAC was lower as the
amount of hydrophobic components increased. The CAC was found to be lower with
increased hydrophobic component indicating stronger hydrophobic interactions within
the hydrophobic core (Figure 3).56, 58, 71 Furthermore, as the amount of hydrophobic
adamantane moieties increased, the size measured by dynamic light scattering (DLS)
decreased because of the more compact hydrophobic core56 which also in turns give
better distribution as shown by the lower polydispersity index (PDI).
Figure 2. Hildebrand-Benesi plot for (a) aPS and (b) aCPT.
Figure 3. Critical aggregation concentration (CAC) determination using pyrene probe by taking the ratio
of fluorescence at 373 nm and 383 nm at different concentration of hydrophobic components and keeping
HA-CD polymer constant.
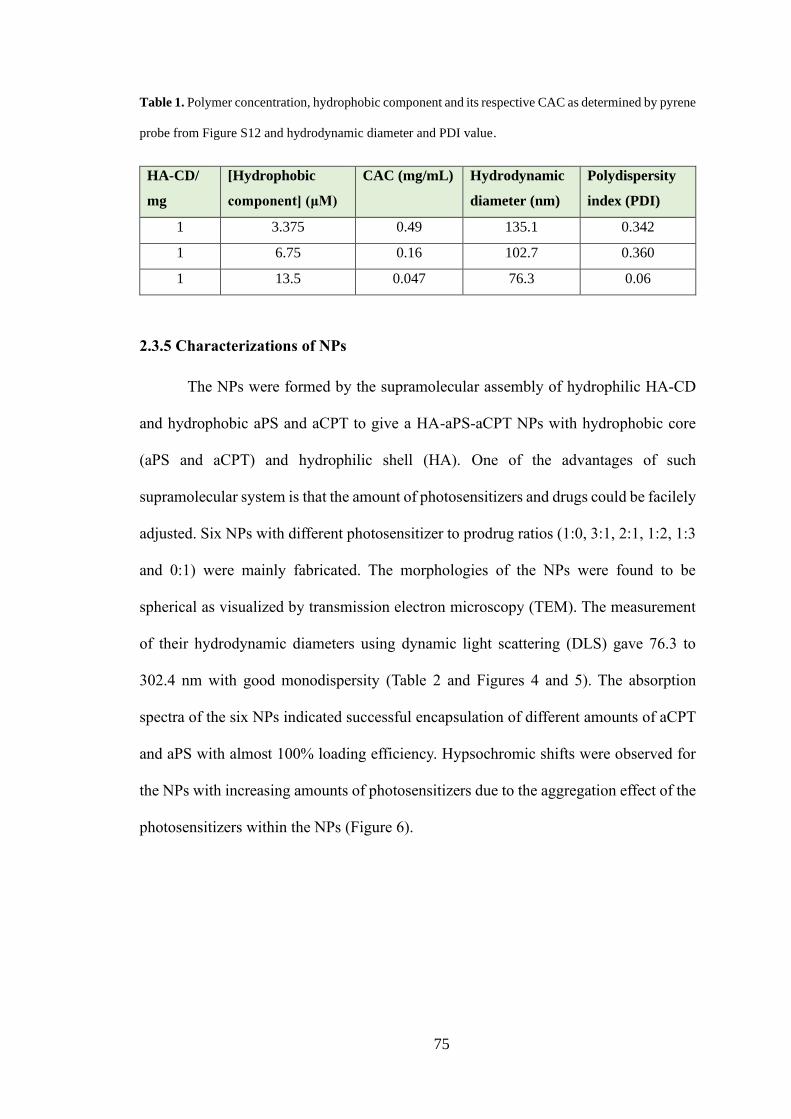
75
Table 1. Polymer concentration, hydrophobic component and its respective CAC as determined by pyrene
probe from Figure S12 and hydrodynamic diameter and PDI value.
HA-CD/
mg
[Hydrophobic
component] (μM)
CAC (mg/mL) Hydrodynamic
diameter (nm)
Polydispersity
index (PDI)
1 3.375 0.49 135.1 0.342
1 6.75 0.16 102.7 0.360
1 13.5 0.047 76.3 0.06
2.3.5 Characterizations of NPs
The NPs were formed by the supramolecular assembly of hydrophilic HA-CD
and hydrophobic aPS and aCPT to give a HA-aPS-aCPT NPs with hydrophobic core
(aPS and aCPT) and hydrophilic shell (HA). One of the advantages of such
supramolecular system is that the amount of photosensitizers and drugs could be facilely
adjusted. Six NPs with different photosensitizer to prodrug ratios (1:0, 3:1, 2:1, 1:2, 1:3
and 0:1) were mainly fabricated. The morphologies of the NPs were found to be
spherical as visualized by transmission electron microscopy (TEM). The measurement
of their hydrodynamic diameters using dynamic light scattering (DLS) gave 76.3 to
302.4 nm with good monodispersity (Table 2 and Figures 4 and 5). The absorption
spectra of the six NPs indicated successful encapsulation of different amounts of aCPT
and aPS with almost 100% loading efficiency. Hypsochromic shifts were observed for
the NPs with increasing amounts of photosensitizers due to the aggregation effect of the
photosensitizers within the NPs (Figure 6).

76
Table 2. Compilation of the NP labelled, ratio of photosensitizer and camptothecin prodrug, and
corresponding hydrodynamic size and polydispersity index.
Name Ratio of aPS :
aCPT
Hydrodynamic size
(nm)
Polydispersity index
(PDI)
NP1 1:0 81.82 0.074
NP2 3:1 78.09 0.083
NP3 2:1 76.32 0.056
NP4 1:2 100.9 0.088
NP5 1:3 95.13 0.062
NP6 0:1 302.4 0.567
Figure 4. TEM images of (a) NP1, (b) NP2, (c) NP3, (d) NP4, (e) NP5, and (f) NP6. Scale bar: 200 nm.
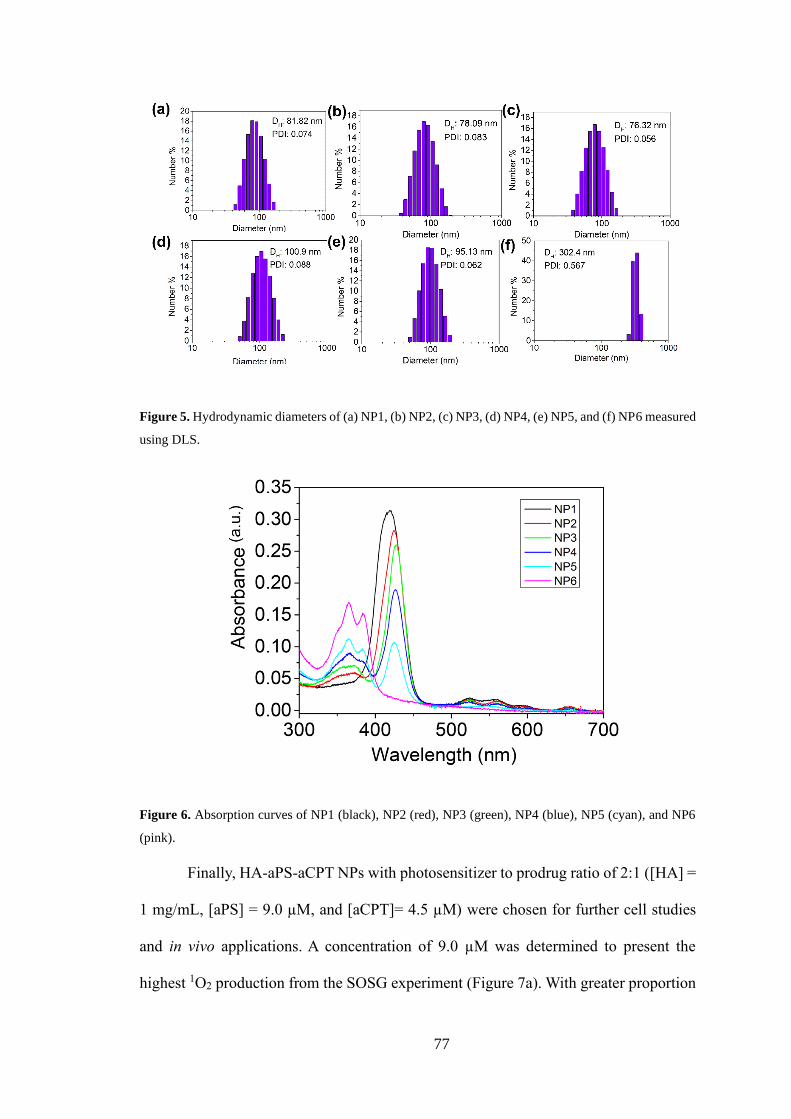
77
Figure 5. Hydrodynamic diameters of (a) NP1, (b) NP2, (c) NP3, (d) NP4, (e) NP5, and (f) NP6 measured
using DLS.
Figure 6. Absorption curves of NP1 (black), NP2 (red), NP3 (green), NP4 (blue), NP5 (cyan), and NP6
(pink).
Finally, HA-aPS-aCPT NPs with photosensitizer to prodrug ratio of 2:1 ([HA] =
1 mg/mL, [aPS] = 9.0 µM, and [aCPT]= 4.5 µM) were chosen for further cell studies
and in vivo applications. A concentration of 9.0 µM was determined to present the
highest 1O2 production from the SOSG experiment (Figure 7a). With greater proportion
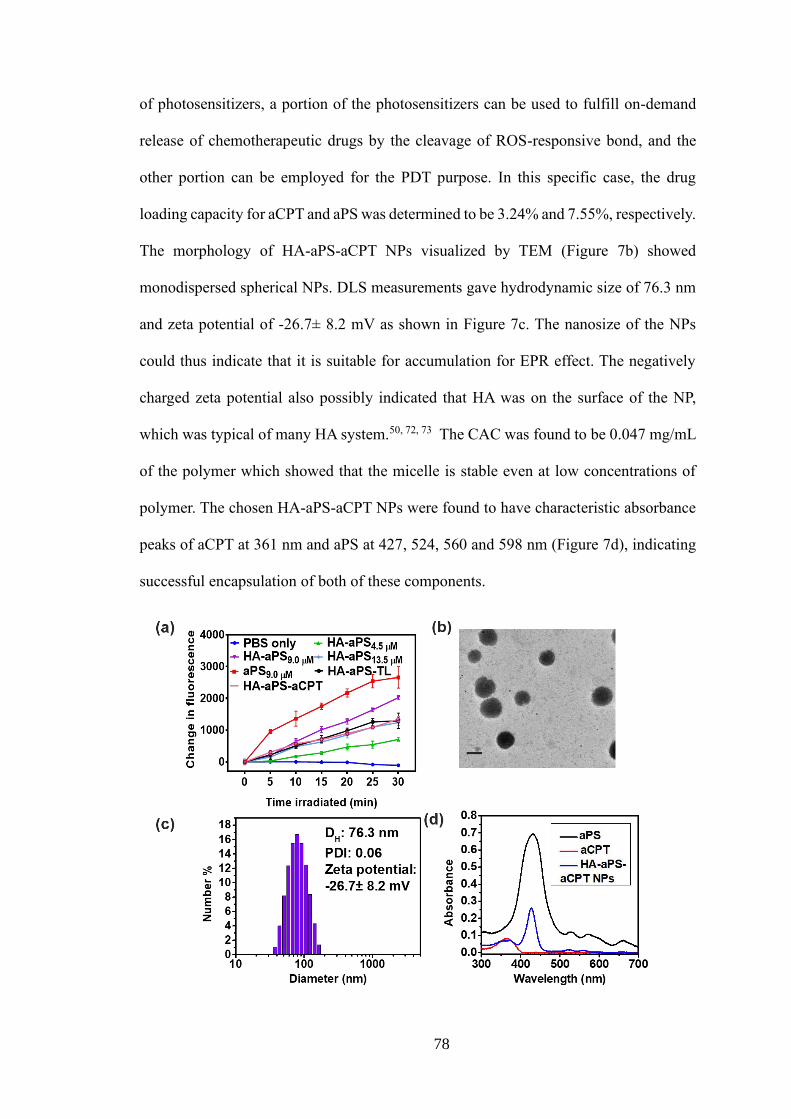
78
of photosensitizers, a portion of the photosensitizers can be used to fulfill on-demand
release of chemotherapeutic drugs by the cleavage of ROS-responsive bond, and the
other portion can be employed for the PDT purpose. In this specific case, the drug
loading capacity for aCPT and aPS was determined to be 3.24% and 7.55%, respectively.
The morphology of HA-aPS-aCPT NPs visualized by TEM (Figure 7b) showed
monodispersed spherical NPs. DLS measurements gave hydrodynamic size of 76.3 nm
and zeta potential of -26.7± 8.2 mV as shown in Figure 7c. The nanosize of the NPs
could thus indicate that it is suitable for accumulation for EPR effect. The negatively
charged zeta potential also possibly indicated that HA was on the surface of the NP,
which was typical of many HA system.50, 72, 73 The CAC was found to be 0.047 mg/mL
of the polymer which showed that the micelle is stable even at low concentrations of
polymer. The chosen HA-aPS-aCPT NPs were found to have characteristic absorbance
peaks of aCPT at 361 nm and aPS at 427, 524, 560 and 598 nm (Figure 7d), indicating
successful encapsulation of both of these components.

79
Figure 7. (a) SOSG results obtained for different samples (HA-aPS at different concentrations of 4.5, 9.0
and 13.5 µM; aPS, HA-aPS-TL and HA-aPS-aCPT NPs with an equivalent aPS concentration of 9.0 µM)
after irradiation of light (65 mW/cm2) at different time intervals measured at 530 nm when excited at 494
nm. (b) TEM image of HA-aPS-aCPT NPs. Scale bar: 100 nm. (c) Hydrodynamic diameter of HA-aPS-
aCPT NPs using DLS. (d) Absorbance of aPS, aCPT and HA-aPS-aCPT NPs.
2.3.6 Cellular uptake and in vitro targeting ability
MDA-MB-231 were chosen as the cell line because their overly expressed CD44
could be targeted by HA.47 The accumulation of HA-aPS-aCPT NPs in cells was
visualized using confocal laser scanning microscope (CLSM) and measured using flow
cytometry. Confocal images showed time-dependent uptake, i.e., greater fluorescence
with longer incubation time (Figure 8a). To determine the capability of the HA-aPS-
aCPT NPs for targeting CD44 receptors, MDA-MB-231 (CD44-rich: CD44+) and MCF-
7 (CD44-poor: CD44–) cells were selected for cellular comparative studies. Using flow
cytometry analysis (Figure 8b,c) after the incubation of HA-aPS-aCPT NPs at 2 h and 4
h, the mean fluorescence intensity (MFI) of MDA-MB-231 cells was 1.93-folds and
2.05-folds higher than that of MCF-7 cells respectively, indicating higher uptake of HA-
aPS-aCPT NPs by MDA-MB-231 cells possibly due to the rich presence of CD44
receptors for efficient receptor-mediated cellular uptake. In addition, competitive
inhibition study was executed to confirm the cellular uptake of HA-aPS-aCPT NPs via
CD44-mediated endocytosis using confocal imaging (Figure 8d) and flow cytometric
analysis. The MDA-MB-231 cells pretreated with excess serum-free HA polymer
showed 1.90-folds lower uptake of HA-aPS-aCPT NPs than untreated ones (Figure
8e,f). This observation suggested that both free HA and HA-aPS-aCPT NPs could
competitively bind to CD44 receptors, confirming that the internalization pathway of
HA-aPS-aCPT NPs was through CD44 receptor-mediated endocytosis.

80
Figure 8. (a) Fluorescence images of MDA-MB-231 (CD44+ cells) when incubated with HA-aPS-aCPT
NPs (100 μg/mL) for 2 h and 4 h. (b) Representative plots of cell populations determined by flow
cytometric analysis for MDA-MB-231 (CD44+) and MCF-7 (CD44-) cells internalized by HA-aPS-aCPT
NPs at different incubation time (2 h and 4 h). (c) MFI of HA-aPS-aCPT NPs in different cells at different
incubation times. (d) Fluorescence images of MDA-MB-231 (CD44+ cells) incubated with HA-aPS-aCPT
NPs (100 μg/mL) for 2 h when pretreated without and with free HA (5 mg/mL). (e) Representative plots
and (f) MFI of cell populations determined by flow cytometric analysis for cellular uptake of HA-aPS-
aCPT NPs pretreated without and with free HA. Scale bar: 50 μm.
2.3.7 In vitro ROS detection
After confirming the internalization pathway of the NPs, we evaluated whether
ROS could be produced in vitro when HA-aPS-aCPT NPs were illuminated with light.
The intracellular ROS production induced by HA-aPS-aCPT NPs was determined in
MDA-MB-231 cells using a general oxidative stress indicator, carboxy-DCFDA (Figure
9a). The fluorescence intensity of cells incubated with NPs and irradiated with light was

81
the highest amongst other control groups, indicating the successful production of ROS
by HA-aPS-aCPT NPs in vitro. The produced ROS from HA-aPS-aCPT NPs is
important for subsequent cleavage of the thioketal linker for the drug release as
previously discussed. Cleavage of the prodrug into its active form allows chemotherapy
to then take place and lead to combinational therapy.
2.3.8 Cell viability and apoptosis study
The cytotoxicity of the NPs was evaluated using MTT assays (Figure 9c). At the
same equivalent molar concentrations, aCPT was found to be less toxic than free CPT
due to the functionalization of the hydroxy group on the lactone ring that is important
in the topoisomerase inhibition to result in the apoptosis in cells.74, 75 At high
concentrations of NPs ([NPs] = 200 µg/mL), HA-aPS-aCPT displayed low cellular
toxicity in the dark, showing high cell viability of 74.4%. Comparing HA-aPS-TL and
HA-aPS-aCPT NPs under light irradiation, at low concentrations of 0 to 100 µg/mL,
HA-aPS-aCPT NPs displayed higher cytotoxicity because the contained aCPT could be
released as free CPT upon light irradiation, leading to synergistic PDT and
chemotherapy. At the concentration of 200 µg/mL, however, HA-aPS-aCPT and HA-
aPS-TL NPs showed similar high cytotoxicity possibly because PDT predominated.
Flow cytometric analysis was used to quantify the amount of apoptotic MDA-MB-231
cells when treated with HA-aPS-aCPT NPs. When cells were incubated with HA-aPS-
TL and HA-aPS-aCPT NPs in the dark, the total amounts of apoptotic cells were low at
3.0% and 4.9%, respectively (Figure 9d). The numbers of apoptotic cells for both HA-
aPS-TL and HA-aPS-aCPT NPs under light irradiation were significantly more than that
in the dark. These results showed that the NPs displayed minimal dark cytotoxicity and
light irradiation was essential to induce their cellular toxicity.

82
According to the cellular apoptosis results, there was higher percentage of
apoptotic cells incubated with HA-aPS-aCPT (72.8%) as compared to that of HA-aPS-
TL NPs (27.8%), validating that CPT was released upon light irradiation to result in
higher cellular toxicity. Live/dead confocal images of the cells irradiated with HA-aPS-
aCPT NPs under light irradiation also showed higher amount of red cells (propidium
iodide (PI) stained cells) indicative of higher cellular toxicity (Figure 9b).
Figure 9. (a) Detection of ROS using carboxy-DCFDA (green). Nuclei were stained with DAPI (blue).
Scale bar: 50 μm. (b) Live/dead assay on MDA-MB-231 (CD44+ cells) with and without NPs as well as
with and without light irradiation (IRR), where + means related treatment was done, and - means no such
treatment was done. Scale bar: 100 μm. (c) Cell viability of MDA-MB-231 cells when incubated with

83
free CPT, aCPT, HA-aPS-TL with and without light irradiation, and HA-aPS-aCPT with and without
light irradiation at different concentrations. (d) Quantitative numbers of different cells obtained from
apoptotic study using Annexin V FITC and PI.
2.3.9 In vivo biodistribution
Encouraged by the in vitro therapeutic results, the biodistribution and treatment
efficiency of mixture of free aPS and aCPT as well as HA-aPS-aCPT NPs were assessed
in vivo using xenografted nude mouse models with MDA-MB-231. After HA-aPS-aCPT
NPs were intravenously injected into the nude mice bearing tumours, it was visualized
(Figure 10a) using the in vivo imaging system (IVIS) at the wavelength corresponding
to aPS under different time intervals. Accumulation was observed in both treatments
initially. A progressive accumulation of the HA-aPS-aCPT NPs in tumours was observed
over time. In contrast, free aPS was not accumulated in tumour at the end of the 24 h.
After 24 h, the mice were euthanized, and major organs and tumours were removed and
visualized. The NPs were accumulated in tumours, liver and spleen but free aPS does
not accumulate in tumours (Figure 10b) indicating accumulation of HA-aPS-aCPT in
tumours via EPR effect. Free aPS accumulated in liver and spleen for excretion because
its high hydrophobicity causes large aggregates to be formed when dissolved in PBS.76
HA-aPS-aCPT NPs, despite having the ability to target tumour, also could not escape
the fate of being excreted and thus also shown accumulation in organs such as liver and
spleen. (Figure 10c)

84
Figure 10. In vivo studies on anti-tumour therapeutic effect. (a) Biodistribution of free aPS and aCPT and
HA-aPS-aCPT NPs at different time intervals after intravenous injection into mice. The tumours were
circled. (b) Ex vivo fluorescence image of major organs and tumour excised from mice injected with free
aPS and aCPT and HA-aPS-aCPT NPs. H, L, S, Lu, K, B and T stands for heart, liver, spleen, lung,
kidney, brain and tumour, respectively. (c) Biodistribution of HA-aPS-aCPT NPs in various organs
determined from (b).
2.3.10 In vivo antitumour efficacy
The antitumour efficacy of the NPs was examined by using similar nude mice
model. Five groups of mice were monitored over a period of 21 days after treated with
different conditions (I: saline; II: HA-aPS-aCPT NPs; III: CPT; IV: tris(3-
hydroxypropyl)phosphine (THPP); V: HA-aPS-aCPT + Light irradiation). THPP is the
free photosensitizer that was not modified by adamantane. As shown in Figure 11a,b,
HA-aPS-aCPT NPs with light irradiation could largely suppress tumour growth as
compared to the saline as well as THPP groups. The mean tumour volume (253.09 ±
50.27 mm3) resulted from HA-aPS-aCPT NPs with light irradiation was significantly
smaller than the saline (902.35 ± 178.48 mm3) and THPP (939.98 ± 131.02 mm3) groups.
Although the administration of free CPT also delayed the growth of tumour (561.08 ±
85
67.43 mm3), it exhibited obvious systemic toxicity as indicated by the lowest average
body weight (Figure 5c). HA-aPS-aCPT NPs in the dark also exhibited certain toxicity
as shown by smaller mean tumour size (429.68 ± 54.01 mm3). This observation could
be explained by its better passive accumulation in tumour and high amount ROS already
in cancer cells for releasing free CPT from aCPT.
In addition to the significant inhibition of tumour growth, HA-aPS-aCPT NPs
accumulated mostly at tumour sites did not cause as much systemic toxicity as free CPT,
indicated by the increased body weight of mice and Hematoxylin and Eosin (H&E)
staining from various mouse organs treated with HA-aPS-aCPT NPs (Figures 11c and
10). H&E staining of tumours was conducted on all five groups of mice. Some minor
damages in the tumour tissues when treated with HA-aPS-aCPT NPs and free CPT were
observed, while serious damage was observed when mice were treated with HA-aPS-
aCPT NPs under light irradiation (Figure 11d). This difference indicated that there was
an enhancement of PDT with cascaded chemotherapy as compared to free CPT. Similar
conclusion was drawn from TUNEL assay that detected apoptotic cells. After various
treatments, the amount of TUNEL-positive cells was found to be in this order: V > II >
III > IV > I. More red fluorescence from Cyanine 3 observed for tumour tissues of mice
treated with HA-aPS-aCPT NPs under light irradiation indicated the greatest number of
apoptotic cells in these groups. After treatment with HA-aPS-aCPT NPs, the H&E
staining on major organs in different mice showed no noticeable systematic toxicity
(Figure 12). All these results demonstrated the feasibility of HA-aPS-aCPT NPs for
combinational PDT and chemotherapy by inducing the tumour cell death, showing high
potency of HA-aPS-aCPT NPs as a therapeutic protocol for tumour treatment.
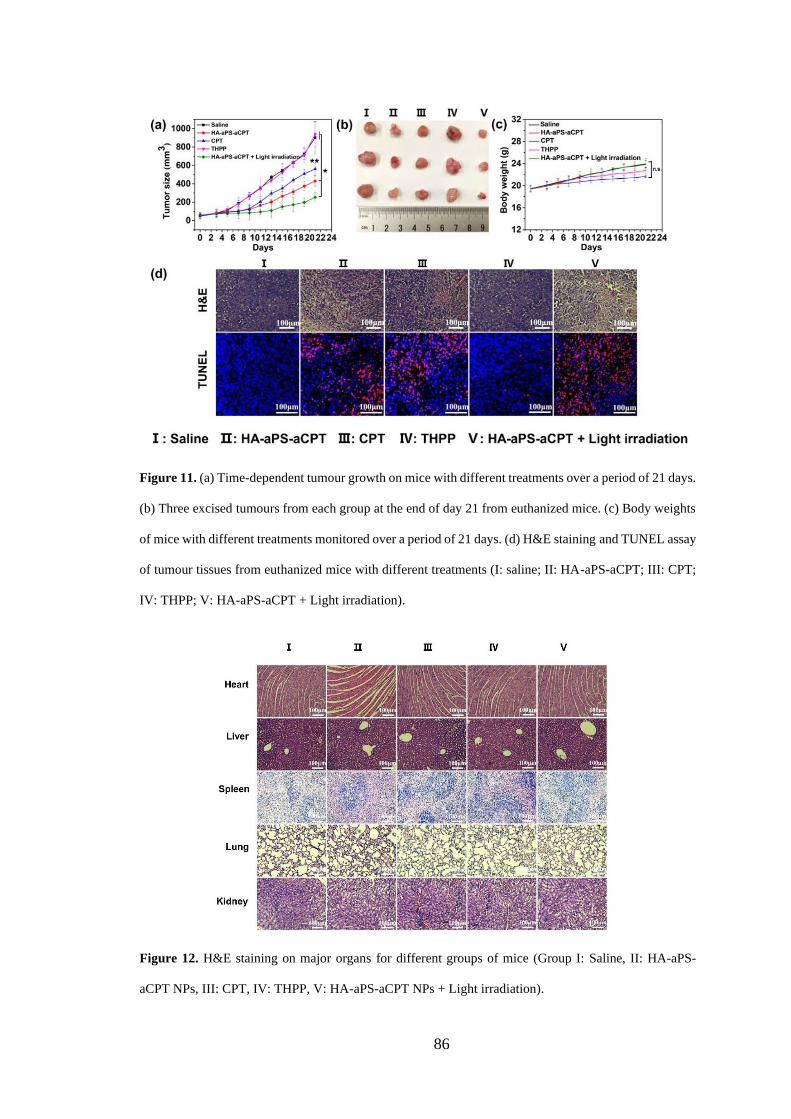
86
Figure 11. (a) Time-dependent tumour growth on mice with different treatments over a period of 21 days.
(b) Three excised tumours from each group at the end of day 21 from euthanized mice. (c) Body weights
of mice with different treatments monitored over a period of 21 days. (d) H&E staining and TUNEL assay
of tumour tissues from euthanized mice with different treatments (I: saline; II: HA-aPS-aCPT; III: CPT;
IV: THPP; V: HA-aPS-aCPT + Light irradiation).
Figure 12. H&E staining on major organs for different groups of mice (Group I: Saline, II: HA-aPS-
aCPT NPs, III: CPT, IV: THPP, V: HA-aPS-aCPT NPs + Light irradiation).
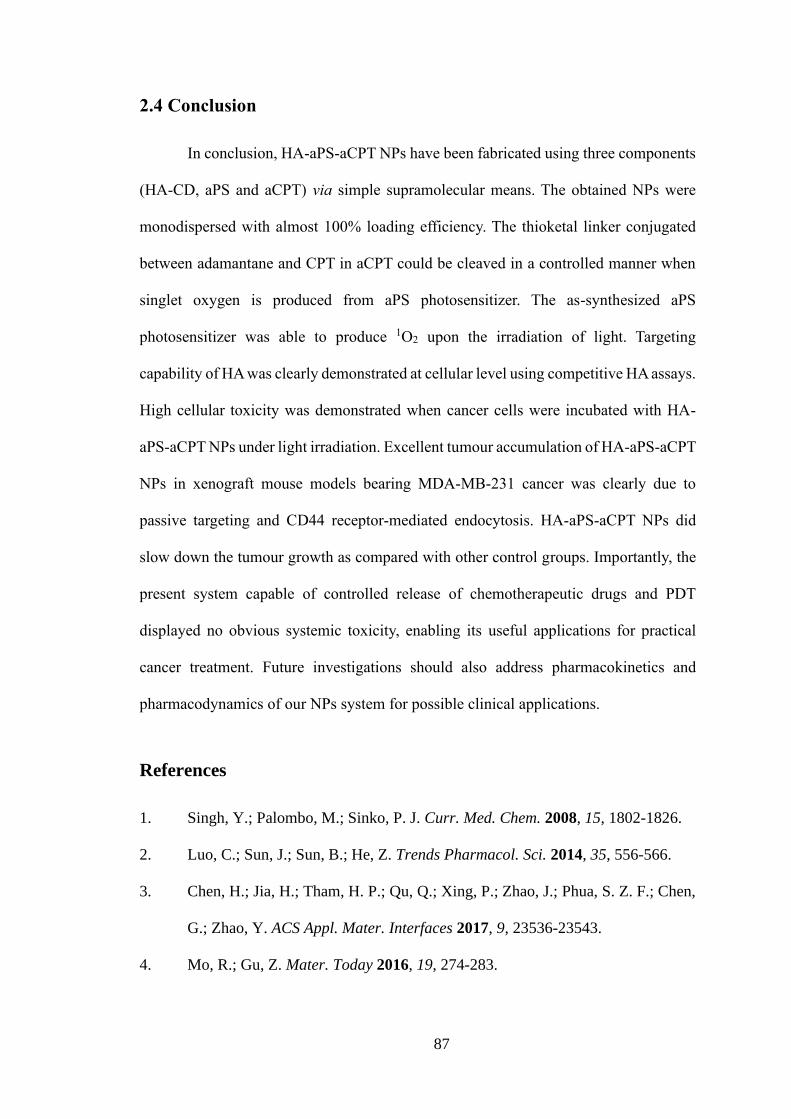
87
2.4 Conclusion
In conclusion, HA-aPS-aCPT NPs have been fabricated using three components
(HA-CD, aPS and aCPT) via simple supramolecular means. The obtained NPs were
monodispersed with almost 100% loading efficiency. The thioketal linker conjugated
between adamantane and CPT in aCPT could be cleaved in a controlled manner when
singlet oxygen is produced from aPS photosensitizer. The as-synthesized aPS
photosensitizer was able to produce 1O2 upon the irradiation of light. Targeting
capability of HA was clearly demonstrated at cellular level using competitive HA assays.
High cellular toxicity was demonstrated when cancer cells were incubated with HA-
aPS-aCPT NPs under light irradiation. Excellent tumour accumulation of HA-aPS-aCPT
NPs in xenograft mouse models bearing MDA-MB-231 cancer was clearly due to
passive targeting and CD44 receptor-mediated endocytosis. HA-aPS-aCPT NPs did
slow down the tumour growth as compared with other control groups. Importantly, the
present system capable of controlled release of chemotherapeutic drugs and PDT
displayed no obvious systemic toxicity, enabling its useful applications for practical
cancer treatment. Future investigations should also address pharmacokinetics and
pharmacodynamics of our NPs system for possible clinical applications.
References
1. Singh, Y.; Palombo, M.; Sinko, P. J. Curr. Med. Chem. 2008, 15, 1802-1826.
2. Luo, C.; Sun, J.; Sun, B.; He, Z. Trends Pharmacol. Sci. 2014, 35, 556-566.
3. Chen, H.; Jia, H.; Tham, H. P.; Qu, Q.; Xing, P.; Zhao, J.; Phua, S. Z. F.; Chen,
G.; Zhao, Y. ACS Appl. Mater. Interfaces 2017, 9, 23536-23543.
4. Mo, R.; Gu, Z. Mater. Today 2016, 19, 274-283.

88
5. Sun, W.; Jiang, T.; Lu, Y.; Reiff, M.; Mo, R.; Gu, Z. J. Am. Chem. Soc. 2014,
136, 14722-14725.
6. Yang, G.; Xu, L.; Chao, Y.; Xu, J.; Sun, X.; Wu, Y.; Peng, R.; Liu, Z. Nat.
Commun. 2017, 8, 902.
7. Zhang, Y.; Teh, C.; Li, M.; Ang, C. Y.; Tan, S. Y.; Qu, Q.; Korzh, V.; Zhao, Y.
Chem. Mater. 2016, 28, 7039-7050.
8. Wang, X.; Cai, X.; Hu, J.; Shao, N.; Wang, F.; Zhang, Q.; Xiao, J.; Cheng, Y. J.
Am. Chem. Soc. 2013, 135, 9805-9810.
9. Xiang, H.; Chen, H.; Tham, H. P.; Phua, S. Z. F.; Liu, J.-G.; Zhao, Y. ACS Appl.
Mater. Interfaces 2017, 9, 27553-27562.
10. Zhang, Y.; Yang, D.; Chen, H.; Lim, W. Q.; Phua, F. S. Z.; An, G.; Yang, P.;
Zhao, Y. Biomaterials 2018, 163, 14-24.
11. Zhang, H.; Fei, J.; Yan, X.; Wang, A.; Li, J. Adv. Funct. Mater. 2015, 25, 1193-
1204.
12. Ortiz de Montellano, P. R. Future Med. Chem. 2013, 5, 213-228.
13. Feng, L.; Cheng, L.; Dong, Z.; Tao, D.; Barnhart, T. E.; Cai, W.; Chen, M.; Liu,
Z. ACS Nano 2017, 11, 927-937.
14. Qian, C.; Yu, J.; Chen, Y.; Hu, Q.; Xiao, X.; Sun, W.; Wang, C.; Feng, P.; Shen,
Q.-D.; Gu, Z. Adv. Mater. 2016, 28, 3313-3320.
15. Shirakura, T.; Kelson, T. J.; Ray, A.; Malyarenko, A. E.; Kopelman, R. ACS
Macro Lett. 2014, 3, 602-606.
16. Yang, G.; Liu, J.; Wu, Y.; Feng, L.; Liu, Z. Coord. Chem. Rev. 2016, 320–321,
100-117.
17. Liu, L.-H.; Qiu, W.-X.; Li, B.; Zhang, C.; Sun, L.-F.; Wan, S.-S.; Rong, L.;
Zhang, X.-Z. Adv. Funct. Mater. 2016, 26, 6257-6269.

89
18. Yue, C.; Yang, Y.; Zhang, C.; Alfranca, G.; Cheng, S.; Ma, L.; Liu, Y.; Zhi, X.;
Ni, J.; Jiang, W.; Song, J.; de la Fuente, J. M.; Cui, D. Theranostics 2016, 6,
2352-2366.
19. Yue, C.; Zhang, C.; Alfranca, G.; Yang, Y.; Jiang, X.; Yang, Y.; Pan, F.; de la
Fuente, J. M.; Cui, D. Theranostics 2016, 6, 456-469.
20. Chen, H.; Zhao, Y. ACS Appl. Mater. Interfaces 2018, 10, 21021-21034.
21. Schroeder, A.; Honen, R.; Turjeman, K.; Gabizon, A.; Kost, J.; Barenholz, Y. J.
Control. Release 2009, 137, 63-68.
22. Couture, O.; Foley, J.; Kassell, N. F.; Larrat, B.; Aubry, J.-F. Transl. Cancer Res.
2014, 3, 494-511.
23. Ai, X.; Mu, J.; Xing, B. Theranostics 2016, 6, 2439-2457.
24. Jiang, M. Y.; Dolphin, D. J. Am. Chem. Soc. 2008, 130, 4236-4237.
25. Fan, N.-C.; Cheng, F.-Y.; Ho, J.-a. A.; Yeh, C.-S. Angew. Chem. Int. Ed. 2012,
51, 8806-8810.
26. Brown, P. K.; Qureshi, A. T.; Moll, A. N.; Hayes, D. J.; Monroe, W. T. ACS
Nano 2013, 7, 2948-2959.
27. Hossion, A. M. L.; Bio, M.; Nkepang, G.; Awuah, S. G.; You, Y. ACS Med.
Chem. Lett. 2013, 4, 124-127.
28. Sheehan, J. C.; Umezawa, K. J. Org. Chem. 1973, 38, 3771-3774.
29. Shao, Q.; Jiang, T.; Ren, G.; Cheng, Z.; Xing, B. Chem. Commun. 2009, 4028-
4030.
30. Zhao, L.; Peng, J.; Huang, Q.; Li, C.; Chen, M.; Sun, Y.; Lin, Q.; Zhu, L.; Li, F.
Adv. Funct. Mater. 2014, 24, 363-371.
31. Kim, H.; Chung, K.; Lee, S.; Kim, D. H.; Lee, H. Wiley Interdiscip. Rev.
Nanomed. Nanobiotechnol. 2016, 8, 23-45.

90
32. Gorka, A. P.; Nani, R. R.; Zhu, J.; Mackem, S.; Schnermann, M. J. J. Am. Chem.
Soc. 2014, 136, 14153-14159.
33. Nani, R. R.; Gorka, A. P.; Nagaya, T.; Kobayashi, H.; Schnermann, M. J. Angew.
Chem. Int. Ed. 2015, 54, 13635-13638.
34. Nani, R. R.; Gorka, A. P.; Nagaya, T.; Yamamoto, T.; Ivanic, J.; Kobayashi, H.;
Schnermann, M. J. ACS Cent. Sci. 2017, 3, 329-337.
35. Wang, J.; Sun, X.; Mao, W.; Sun, W.; Tang, J.; Sui, M.; Shen, Y.; Gu, Z. Adv.
Mater. 2013, 25, 3670-3676.
36. Luo, C.; Sun, J.; Liu, D.; Sun, B.; Miao, L.; Musetti, S.; Li, J.; Han, X.; Du, Y.;
Li, L.; Huang, L.; He, Z. Nano Lett. 2016, 16, 5401-5408.
37. Deepagan, V. G.; Kwon, S.; You, D. G.; Nguyen, V. Q.; Um, W.; Ko, H.; Lee,
H.; Jo, D.-G.; Kang, Y. M.; Park, J. H. Biomaterials 2016, 103, 56-66.
38. Kim, E.-J.; Bhuniya, S.; Lee, H.; Kim, H. M.; Cheong, C.; Maiti, S.; Hong, K.
S.; Kim, J. S. J. Am. Chem. Soc. 2014, 136, 13888-13894.
39. Rajaputra, P.; Bio, M.; Nkepang, G.; Thapa, P.; Woo, S.; You, Y. Bioorg. Med.
Chem. 2016, 24, 1540-1549.
40. Kwon, J.; Kim, J.; Park, S.; Khang, G.; Kang, P. M.; Lee, D. Biomacromolecules
2013, 14, 1618-1626.
41. Shim, M. S.; Xia, Y. Angew. Chem. Int. Ed. 2013, 52, 6926-6929.
42. Xu, Q.; He, C.; Xiao, C.; Chen, X. Macromol. Biosci. 2016, 16, 635-646.
43. Pei, Q.; Hu, X.; Zheng, X.; Liu, S.; Li, Y.; Jing, X.; Xie, Z. ACS Nano 2018, 12,
1630-1641.
44. Tham, H. P.; Chen, H.; Tan, Y. H.; Qu, Q.; Sreejith, S.; Zhao, L.; Venkatraman,
S. S.; Zhao, Y. Chem. Commun. 2016, 52, 8854-8857.

91
45. Dreaden, E. C.; Mackey, M. A.; Huang, X.; Kang, B.; El-Sayed, M. A. Chem.
Soc. Rev. 2011, 40, 3391-3404.
46. Fadeel, B.; Garcia-Bennett, A. E. Adv. Drug Delivery Rev. 2010, 62, 362-374.
47. Mattheolabakis, G.; Milane, L.; Singh, A.; Amiji, M. M. J. Drug Targeting 2015,
23, 605-618.
48. Bae, K. H.; Tan, S.; Yamashita, A.; Ang, W. X.; Gao, S. J.; Wang, S.; Chung, J.
E.; Kurisawa, M. Biomaterials 2017, 148, 41-53.
49. Lin, W. J.; Lee, W. C.; Shieh, M. J. Carbohydr. Polym. 2017, 155, 101-108.
50. Zhu, Q.; Chen, X.; Xu, X.; Zhang, Y.; Zhang, C.; Mo, R. Adv. Funct. Mater.
2018, 28, 1707371.
51. Kim, H.; Jeong, H.; Han, S.; Beack, S.; Hwang, B. W.; Shin, M.; Oh, S. S.; Hahn,
S. K. Biomaterials 2017, 123, 155-171.
52. Mo, R.; Jiang, T.; DiSanto, R.; Tai, W.; Gu, Z. Nat. Commun. 2014, 5, 3364.
53. Götte, M.; Yip, G. W. Cancer Res. 2006, 66, 10233-10237.
54. Naor, D.; Sionov, R. V.; Ish-Shalom, D. in Advances in Cancer Research, Vol.
71 (Eds.: Vande Woude, G. F. Klein, G.), Academic Press, 1997, pp. 241-319.
55. Ponta, H.; Sherman, L.; Herrlich, P. A. Nat. Rev. Mol. Cell Biol. 2003, 4, 33-45.
56. Choi, K. Y.; Chung, H.; Min, K. H.; Yoon, H. Y.; Kim, K.; Park, J. H.; Kwon, I.
C.; Jeong, S. Y. Biomaterials 2010, 31, 106-114.
57. Fan, H.; Hu, Q.-D.; Xu, F.-J.; Liang, W.-Q.; Tang, G.-P.; Yang, W.-T.
Biomaterials 2012, 33, 1428-1436.
58. Hu, Q.; Li, W.; Hu, X.; Hu, Q.; Shen, J.; Jin, X.; Zhou, J.; Tang, G.; Chu, P. K.
Biomaterials 2012, 33, 6580-6591.
59. Sun, T.; Zhang, Y. S.; Pang, B.; Hyun, D. C.; Yang, M.; Xia, Y. Angew. Chem.
Int. Ed. 2014, 53, 12320-12364.

92
60. Maeda, H. Adv. Enzyme Regul. 2001, 41, 189-207.
61. Cheetham, A. G.; Ou, Y.-C.; Zhang, P.; Cui, H. Chem. Commun. 2014, 50, 6039-
6042.
62. Chen, Q.; Chen, J.; Liang, C.; Feng, L.; Dong, Z.; Song, X.; Song, G.; Liu, Z. J.
Control. Release 2017, 263, 79-89.
63. Yang, Y.; Zhang, Y.-M.; Chen, Y.; Chen, J.-T.; Liu, Y. Sci. Rep. 2016, 6, 19212.
64. Jaracz, S.; Chen, J.; Kuznetsova, L. V.; Ojima, I. Bioorg. Med. Chem. 2005, 13,
5043-5054.
65. Huang, X.; Nakanishi, K.; Berova, N. Chirality 2000, 12, 237-255.
66. Lambert, C. R.; Reddi, E.; Spikes, J. D.; Rodgers, M. A. J.; Jori, G. Photochem.
Photobiol. 1986, 44, 595-601.
67. Hu, Q.-D.; Tang, G.-P.; Chu, P. K. Acc. Chem. Res. 2014, 47, 2017-2025.
68. Chen, G.; Jiang, M. Chem. Soc. Rev. 2011, 40, 2254-2266.
69. Ang, C. Y.; Tan, S. Y.; Wang, X.; Zhang, Q.; Khan, M.; Bai, L.; Tamil Selvan,
S.; Ma, X.; Zhu, L.; Nguyen, K. T.; Tan, N. S.; Zhao, Y. J. Mater. Chem. B 2014,
2, 1879-1890.
70. Aguiar, J.; Carpena, P.; Molina-Bolı́var, J. A.; Carnero Ruiz, C. J. Colloid
Interface Sci. 2003, 258, 116-122.
71. Owen, S. C.; Chan, D. P. Y.; Shoichet, M. S. Nano Today 2012, 7, 53-65.
72. Sun, Q.; Kang, Z.; Xue, L.; Shang, Y.; Su, Z.; Sun, H.; Ping, Q.; Mo, R.; Zhang,
C. J. Am. Chem. Soc. 2015, 137, 6000-6010.
73. Beldman, T. J.; Senders, M. L.; Alaarg, A.; Pérez-Medina, C.; Tang, J.; Zhao,
Y.; Fay, F.; Deichmöller, J.; Born, B.; Desclos, E.; van der Wel, N. N.; Hoebe,
R. A.; Kohen, F.; Kartvelishvily, E.; Neeman, M.; Reiner, T.; Calcagno, C.;

93
Fayad, Z. A.; de Winther, M. P. J.; Lutgens, E.; Mulder, W. J. M.; Kluza, E. ACS
Nano 2017, 11, 5785-5799.
74. Potmesil, M. Cancer Res. 1994, 54, 1431-1439.
75. Adams, D. J.; Wahl, M. L.; Flowers, J. L.; Sen, B.; Colvin, M.; Dewhirst, M. W.;
Manikumar, G.; Wani, M. C. Cancer Chemother. Pharmacol. 2006, 57, 145-154.
76. Yang, G.; Phua, S. Z. F.; Bindra, A. K.; Zhao, Y. Adv. Mater. 2019, 31, 1805730.

94
Chapter 3: Catalase Integrated Hyaluronic Acid as
Nanocarriers for Enhanced Photodynamic Therapy in Solid
Tumour
3.1 Introduction
Photodynamic therapy (PDT) involves light illumination of appropriate
wavelength on photosensitizers at the tumour site, converting endogenous molecular
oxygen to singlet oxygen (1O2) in vivo for inhibition of tumour growth.1-3 It has been
investigated in different cancer treatment such as skin tumours,4, 5 head and neck
cancer,6 prostate,2 non-small cell lung and other cancers.7 Advantages of PDT in cancer
treatment includes its minimal invasiveness in comparison to chemotherapy and
radiotherapy, possible repeatable dose, and low systematic toxicity to the body.1, 8-10
Despite its extensive use in cancer treatment, the efficacy of PDT is reduced due to issue
such as the low penetration depth of lower wavelength light in deep-situated tumour,
non-specific accumulation of photosensitizers and the lack of endogenous oxygen in
tumours.11 Hypoxia, a term used to describe the lack of oxygen,12 arises in many
tumours, especially in areas that are at a distant from the blood vessels in tumours.13
Many research has been done on imaging14 as well as therapy in hypoxic tumour.11
Hypoxic tumours are often resistant to drug which thus limit chemotherapy efficacy.15
PDT as a treatment modality has limitations due to the lack of oxygen which thus
impeded PDT efficacy.
To date, different methods have been used for overcoming the limited supply of
oxygen in tumours such as direct delivery of oxygen,16, 17 in situ generation of oxygen18-
22 and improving blood flow.11, 23 Specifically, in situ generation of oxygen using

95
catalase as an enzyme is attractive because it is self-responsive to hydrogen peroxide
(H2O2) and does not require pre-treatment with oxygen (3O2).18, 19, 24 It has been shown
that excessive reactive oxygen species (ROS) such as H2O2 are produced in cancer
cells.25 Catalase could catalyze H2O2 to 3O2 for relieving hypoxia in tumours.26
Production of oxygen could ameliorate tumour hypoxia, leading to better PDT efficacy.
Delivery of proteins such as catalase raises a few concerns such as its instability in vivo
due to the presence of numerous physiological proteases, unpredictable protein
immunogenicity, and poor in vivo half-life.27, 28 Thus, design of suitable nanocarriers
that can overcome these problems is highly needed.
Many researchers have tried to improve the protein stability by encapsulation
them within inorganic NPs (NPs).29-31 These methods often involved complicated
synthesis procedures and the inorganic materials used often have issues being
metabolized. In contrast, using organic materials as nanocarriers lead to good
biodistribution, easy metabolism and better biodegradablility.32-35 PEGylation is widely
used in such modification for the delivery of proteins/peptides into the human body.36
Numerous advantages of such polymer modification include the improved stability,
solubility and pharmacokinetics.37, 38 An example of the US FDA approved PEG-protein
conjugates is Oncaspar (mPEG-L-asparaginase).39 However, high molecular weight
PEGylation has its disadvantage of poor biodegradability.37 In light of this,
polysaccharides such as dextran and hyaluronic acid (HA) as biodegradable polymers37,
40 have been explored for modifications on proteins. HA, a natural polysaccharide
composed of alternate units of two sugar monomers i.e., glucuronic acid and N-
acetylglucosamine,41 is biodegradable and biocompatible with excellent biosafety. HA
is known to target the overly expressed CD44 receptors in several tumours including
MDA-MB-231 human breast cancer42 and A549 lung cancer.43, 44 In addition, HA is

96
highly amenable to functionalization due to the availability of reactive chemical groups
such as acetamide, carboxyl, hydroxyl and aldehyde groups.38 Many studies have been
reported on using HA as a therapeutic carrier with covalently attached photosensitizers
for targeted therapy.45-47 On the other hand, such direct conjugation onto the polymer
results in the difficulties in controlling the amount of photosensitizers delivered and
prolonging the storage of light sensitive photosensitizers. Therefore, an alternative
strategy as opposed to direct conjugation of photosensitizers should be devised.
Herein, we report a therapeutic system (HA-CAT@aCe6) consisting of (1)
CD44-targeting HA, (2) catalase (CAT) as an enzyme to catalyze the production of H2O
and O2 from endogenous H2O2, and (3) adamantane modified Chlorin e6 (aCe6)
photosensitizer to produce 1O2 from the ground state 3O2 (Scheme 1). In this system, -
CD was first functionalized onto HA, followed by conjugation with catalase to form
HA-CAT NPs. It was hypothesized that the integration of HA with CAT improves
physiological stability of the system in presence of body proteases, and at the same time,
enables active targeting to tumour. aCe6 photosensitizer is loaded into HA-CAT by
supramolecular means between -CD and adamantane to give HA-CAT@aCe6 that can
target tumours possessing overly expressed CD44 receptors. Such supramolecular
loading of drugs enable separation storage of different components and easy adjustment
of photosensitizers is to catalase ratio, is highly tunable and predictable.48 Upon light
irradiation, aCe6 in HA-CAT@aCe6 produces 1O2 for PDT, even in hypoxic tumour.
Some advantages of this system are (1) active targeting capability, (2) suitable nanosize
for accumulation in tumour, (3) presence of catalase to produce oxygen for overcoming
hypoxia in solid tumour, and (4) facile and controlled loading of photosensitizers using
supramolecular means, all of which affording the enhanced PDT efficacy in mice model.
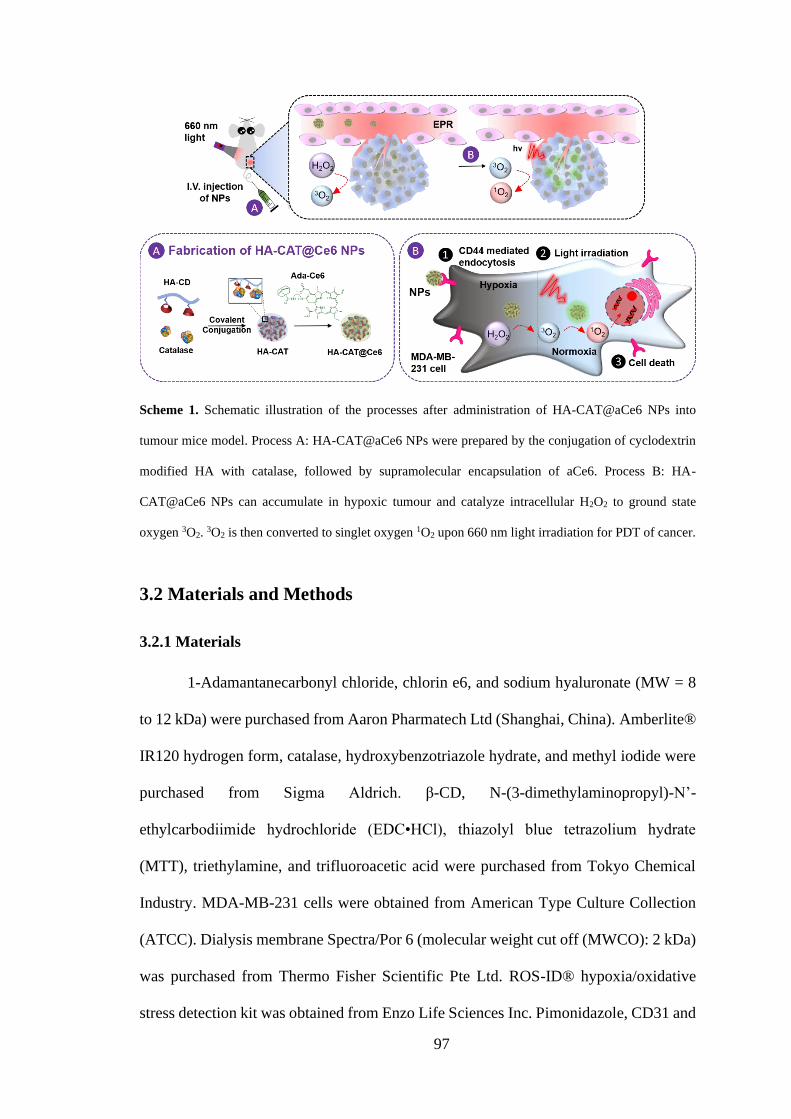
97
Scheme 1. Schematic illustration of the processes after administration of HA-CAT@aCe6 NPs into
tumour mice model. Process A: HA-CAT@aCe6 NPs were prepared by the conjugation of cyclodextrin
modified HA with catalase, followed by supramolecular encapsulation of aCe6. Process B: HA-
CAT@aCe6 NPs can accumulate in hypoxic tumour and catalyze intracellular H2O2 to ground state
oxygen 3O2. 3O2 is then converted to singlet oxygen 1O2 upon 660 nm light irradiation for PDT of cancer.
3.2 Materials and Methods
3.2.1 Materials
1-Adamantanecarbonyl chloride, chlorin e6, and sodium hyaluronate (MW = 8
to 12 kDa) were purchased from Aaron Pharmatech Ltd (Shanghai, China). Amberlite®
IR120 hydrogen form, catalase, hydroxybenzotriazole hydrate, and methyl iodide were
purchased from Sigma Aldrich. β-CD, N-(3-dimethylaminopropyl)-N’-
ethylcarbodiimide hydrochloride (EDC•HCl), thiazolyl blue tetrazolium hydrate
(MTT), triethylamine, and trifluoroacetic acid were purchased from Tokyo Chemical
Industry. MDA-MB-231 cells were obtained from American Type Culture Collection
(ATCC). Dialysis membrane Spectra/Por 6 (molecular weight cut off (MWCO): 2 kDa)
was purchased from Thermo Fisher Scientific Pte Ltd. ROS-ID® hypoxia/oxidative
stress detection kit was obtained from Enzo Life Sciences Inc. Pimonidazole, CD31 and

98
HIF-1α antibodies were from Hypoxyprobe, Inc. In situ BrdU-Red DNA Fragmentation
(TUNEL) Assay Kit were obtained from Abcam. All chemicals were of analytical grade
and used without further purification if not indicated otherwise.
3.2.2 Instruments
1H NMR spectra were probed on a Bruker BBFO400 spectrometer, and D2O,
DMSO-d6, and CDCl3 were used as the deuterated solvents. The UV-vis-NIR absorption
and fluorescence emission spectra were measured using Shimadzu UV-3600 and
Shimadzu RF5301PC spectrophotometer, respectively. Transmission electron
microscopy (TEM) images were taken at an acceleration voltage of 100 kV on JEOL
JEM-1400. Hydrodynamic diameters and zeta potential were measured at 25 °C by a
Malvern Zetasizer Nano-S system. Confocal laser scanning microscopy (CLSM) images
were acquired by ZEISS LSM 800 Confocal Laser Scanning Microscope. Flow
cytometry were taken on BD LSRFortessa™ X-20 cell analyzer. H&E staining images
were taken by Leica DM5500B upright widefield fluorescence and BF microscope.
3.2.3 Synthesis of aCe6
Scheme 2. Synthesis procedure of ada-Ce6. Conditions: (a) TEA in anhydrous DCM, 0oC (b) TFA in
anhydrous DCM, 3 h at r.t.p. (c) EDC, TEA, 2 h follow by CH3I and K2CO3, 2 h.
Synthesis of 1. 0.735 mL of anhydrous triethylamine (TEA) (0.533 g, 5.30 mmol)
was added to N-Boc-ethylenediamine (0.850 g, 3.31 mmol) and to 20 mL of anhydrous
dichloromethane (DCM) at 0°C. Subsequently, 1-adamantanecarbonyl chloride (0.630
g, 3.17 mmol) in 10 mL of anhydrous DCM was added dropwise for 30 mins. The

99
reaction mixture was stirred overnight at r.t.p. Extraction was carried out with dilute
HCl, brine and water and the organic layer was collected. Purification was done using
column chromatography with 50% ethyl acetate (EA)/hexane to obtain a white solid as
product (0.834 g, 82 %) 1H NMR (CDCl3, 400 MHz): δ 1.45 (s, 9H), 1.72 (m, 6H), 1.85
(s, 6H), 2.03 (s, 3H), 3.32 (m, 4H), 4.88 (s, 1H), 6.35 (s, 1H).
Synthesis of 2. Trifluoroacetic acid (TFA) (1.061 g, 9.30 mmol) in 10 mL of
anhydrous DCM was added to 1 (0.30 g, 0.90 mmol) and stirred at r.t.p. for 3 h.
Subsequently, the reaction mixture was evaporated to dryness to obtain the product as
white solid. The product was used without further purification. 1H NMR (DMSO-d6,
400 MHz): δ 1.66 (m, 6H), 1.77 (m, 6H), 1.97 (s, 3H), 2.83 (m, 2H), 3.26 (m, 2H), 7.54
(t, 1H, J=5.6 Hz), 7.69 (s, 2H).
Synthesis of aCe6.The reaction was carried out in the dark and under N2
atmosphere. EDC.HCl (0.039 g, 0.201 mmol, 1.2 equivalent) was added to Chlorin e6
(0.100 g, 0.168 mmol, 1 equivalent) dissolved in 5mL DMF. Reaction mixture was then
stirred for 2 h at 25oC. 2 (0.045 g, 0.201 mmol) and 28 μl TEA in 1 mL of DMF was
then added and stirred for 30 mins. Then, anhydrous potassium carbonate (K2CO3)
(0.070 g, 0.504 mmol, 3 equivalent) and CH3I (1.189 g, 8.38 mmol, 50 equivalent) was
added and stirred for another 2 h at 25oC. The reaction mixture was then diluted with
CH2Cl2 and washed with water and brine. The organic layer was dried over anhydrous
Na2SO4 and evaporated. The residue was then purified using the silica column
chromatography, eluting at 10% MeOH/DCM to give the product aCe6 as a green solid
(0.035 mg, 25%). 1H NMR (CDCl3, 300 MHz): δ 1.10 (d, 3H, J=14.4 Hz), 1.22 (d, 6H,
J=6.12 Hz), 1.31 (s, 2H), 1.35 (s, 1H), 1.50 (s, 3H), 1.59 (s, 9H), 1.71 (t, 6H, J=6.3Hz),
2.14 (m, 2H), 2.46 (m, 1H), 3.01 (s, 1H), 3.28 (t, 7H, J= 6.6Hz), 3.48 (s, 4H), 3.56 (s,
3H), 3.78 (q, 2H, J=7.7Hz), 4.33 (s, 3H), 4.43 (m, 2H), 5.22 (t, 2H, J=21 Hz), 5.93 (t,
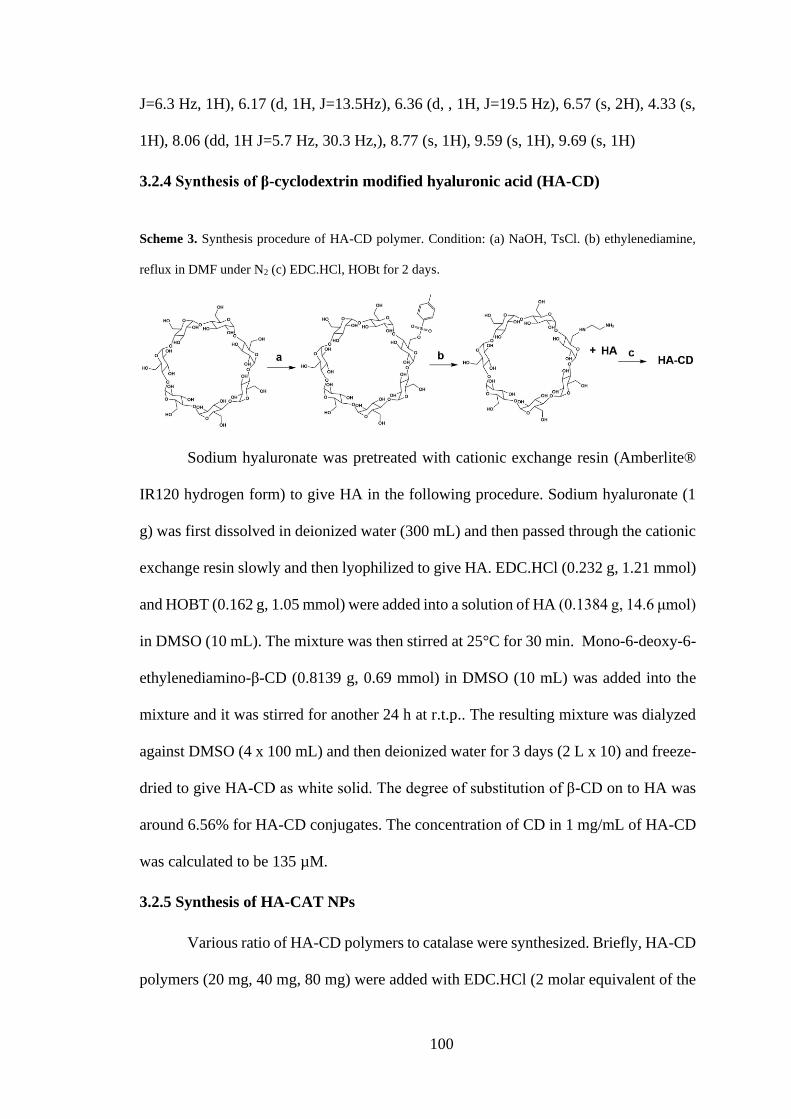
100
J=6.3 Hz, 1H), 6.17 (d, 1H, J=13.5Hz), 6.36 (d, , 1H, J=19.5 Hz), 6.57 (s, 2H), 4.33 (s,
1H), 8.06 (dd, 1H J=5.7 Hz, 30.3 Hz,), 8.77 (s, 1H), 9.59 (s, 1H), 9.69 (s, 1H)
3.2.4 Synthesis of β-cyclodextrin modified hyaluronic acid (HA-CD)
Scheme 3. Synthesis procedure of HA-CD polymer. Condition: (a) NaOH, TsCl. (b) ethylenediamine,
reflux in DMF under N2 (c) EDC.HCl, HOBt for 2 days.
Sodium hyaluronate was pretreated with cationic exchange resin (Amberlite®
IR120 hydrogen form) to give HA in the following procedure. Sodium hyaluronate (1
g) was first dissolved in deionized water (300 mL) and then passed through the cationic
exchange resin slowly and then lyophilized to give HA. EDC.HCl (0.232 g, 1.21 mmol)
and HOBT (0.162 g, 1.05 mmol) were added into a solution of HA (0.1384 g, 14.6 μmol)
in DMSO (10 mL). The mixture was then stirred at 25°C for 30 min. Mono-6-deoxy-6-
ethylenediamino-β-CD (0.8139 g, 0.69 mmol) in DMSO (10 mL) was added into the
mixture and it was stirred for another 24 h at r.t.p.. The resulting mixture was dialyzed
against DMSO (4 x 100 mL) and then deionized water for 3 days (2 L x 10) and freeze-
dried to give HA-CD as white solid. The degree of substitution of β-CD on to HA was
around 6.56% for HA-CD conjugates. The concentration of CD in 1 mg/mL of HA-CD
was calculated to be 135 µM.
3.2.5 Synthesis of HA-CAT NPs
Various ratio of HA-CD polymers to catalase were synthesized. Briefly, HA-CD
polymers (20 mg, 40 mg, 80 mg) were added with EDC.HCl (2 molar equivalent of the
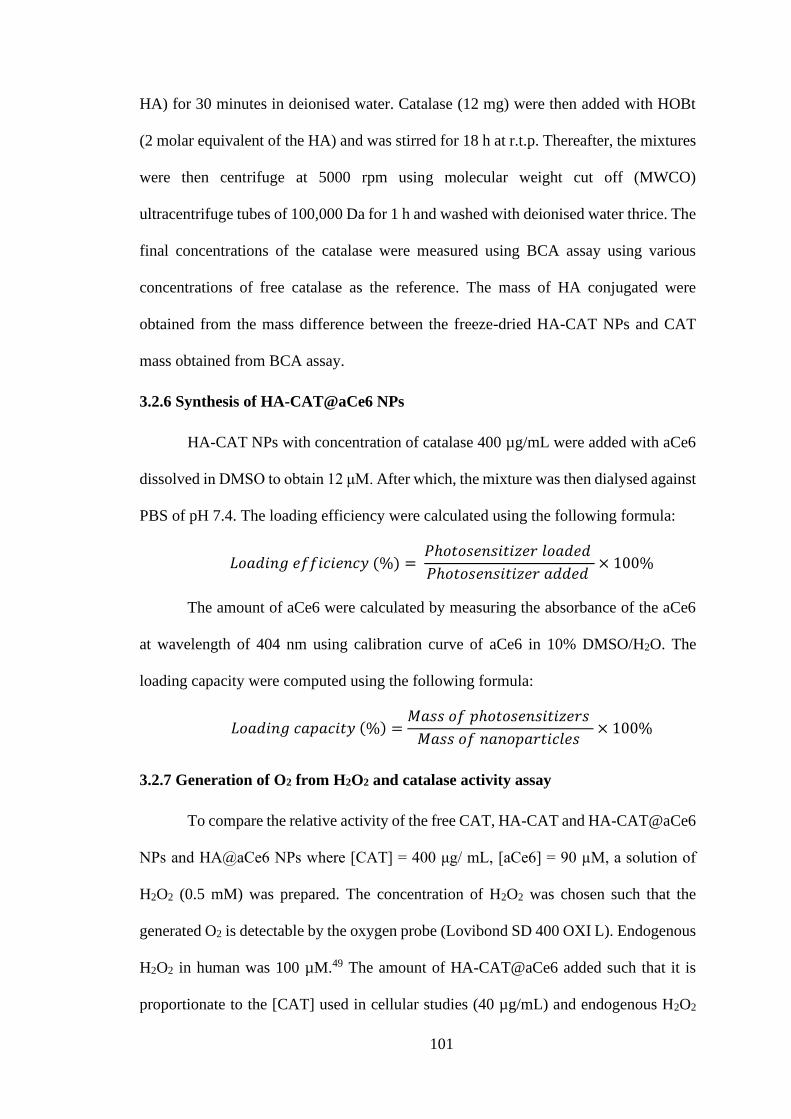
101
HA) for 30 minutes in deionised water. Catalase (12 mg) were then added with HOBt
(2 molar equivalent of the HA) and was stirred for 18 h at r.t.p. Thereafter, the mixtures
were then centrifuge at 5000 rpm using molecular weight cut off (MWCO)
ultracentrifuge tubes of 100,000 Da for 1 h and washed with deionised water thrice. The
final concentrations of the catalase were measured using BCA assay using various
concentrations of free catalase as the reference. The mass of HA conjugated were
obtained from the mass difference between the freeze-dried HA-CAT NPs and CAT
mass obtained from BCA assay.
3.2.6 Synthesis of HA-CAT@aCe6 NPs
HA-CAT NPs with concentration of catalase 400 µg/mL were added with aCe6
dissolved in DMSO to obtain 12 μM. After which, the mixture was then dialysed against
PBS of pH 7.4. The loading efficiency were calculated using the following formula:
𝐿𝑜𝑎𝑑𝑖𝑛𝑔 𝑒𝑓𝑓𝑖𝑐𝑖𝑒𝑛𝑐𝑦 (%) = 𝑃ℎ𝑜𝑡𝑜𝑠𝑒𝑛𝑠𝑖𝑡𝑖𝑧𝑒𝑟 𝑙𝑜𝑎𝑑𝑒𝑑
𝑃ℎ𝑜𝑡𝑜𝑠𝑒𝑛𝑠𝑖𝑡𝑖𝑧𝑒𝑟 𝑎𝑑𝑑𝑒𝑑 × 100%
The amount of aCe6 were calculated by measuring the absorbance of the aCe6
at wavelength of 404 nm using calibration curve of aCe6 in 10% DMSO/H2O. The
loading capacity were computed using the following formula:
𝐿𝑜𝑎𝑑𝑖𝑛𝑔 𝑐𝑎𝑝𝑎𝑐𝑖𝑡𝑦 (%) =𝑀𝑎𝑠𝑠 𝑜𝑓 𝑝ℎ𝑜𝑡𝑜𝑠𝑒𝑛𝑠𝑖𝑡𝑖𝑧𝑒𝑟𝑠
𝑀𝑎𝑠𝑠 𝑜𝑓 𝑛𝑎𝑛𝑜𝑝𝑎𝑟𝑡𝑖𝑐𝑙𝑒𝑠 × 100%
3.2.7 Generation of O2 from H2O2 and catalase activity assay
To compare the relative activity of the free CAT, HA-CAT and HA-CAT@aCe6
NPs and HA@aCe6 NPs where [CAT] = 400 μg/ mL, [aCe6] = 90 µM, a solution of
H2O2 (0.5 mM) was prepared. The concentration of H2O2 was chosen such that the
generated O2 is detectable by the oxygen probe (Lovibond SD 400 OXI L). Endogenous
H2O2 in human was 100 µM.49 The amount of HA-CAT@aCe6 added such that it is
proportionate to the [CAT] used in cellular studies (40 µg/mL) and endogenous H2O2

102
(approximately 100 µM). The increased in the O2 concentration with respect to the initial
O2 concentration was calculated.
To measure and compare the stability of free catalase and HA-CAT, the Góth
method was used.24 Both free catalase and HA-CAT with the final concentration of 300
μg/mL were incubated with Proteinase K (60 μg/mL) at 37 °C. At 0, 0.5, 1, 2, 3, 4 and
5 h, aliquots of sample were used for immediate catalase activity assay. To determine
the catalase activity, H2O2 (50 mM, 1 mL) was added with free catalase or HA-CAT
(300 μg/mL, 0.2 mL) at 37 °C for 60 s, and then ammonium molybdate (32.4 mM, 1
mL) was added to terminate the reaction. The relative catalase activity could be
determined by the absorbance of the solution at 405 nm.
3.2.8 Detection of 1O2
1O2 was determined by the following protocol.24 In brief, SOSG dissolved in
methanol was incubated with different samples ([SOSG] = 2.5 μM, [aCe6] = 4.9 μM,
[H2O2] = 0.25 mM) to measure singlet oxygen generation after light irradiation (630 nm,
15 mW/cm2) purged under nitrogen. The amount of H2O2 was chosen such that the
generated 1O2 can be detected by SOSG and that the fluorescence of SOSG falls in the
detection limit of our spectrometer. The generated 1O2 was determined by measuring
SOSG fluorescence signal at 528 nm under 494 nm excitation.
3.2.9 Immunofluorescence for detection of HIF-1α in cells
The MDA-MB-231 cells were seeded onto 6 well plates with cover slip and
incubated at normoxic (21% O2) and hypoxic conditions (1% O2) for 24 h. HA-
CAT@aCe6 NPs ([CAT]= 40 μg/mL, [aCe6] = 10 μM) were first incubated with the
cells for 4 h. They were then quickly fixed with 4% paraformaldehyde for 10 mins at
rtp. It is then washed with PBS thrice. After which, the cells were permeabilised using
0.1% Triton X-100 in PBS for 10 mins and washed thrice with 0.1% Tween-20 in PBS.

103
After which blocking buffer was added and incubated for 1 h at r.t.p.. Primary anti-HIF-
1α antibody was diluted in blocking buffer (2:1000) to yield a 2 μg/mL and incubated
for 1.5 h at r.t.p. After which the cells were washed thrice with 0.1% Tween-20 in PBS.
It is then incubated with the secondary Alexa Fluor®488-conjugated Goat Anti-Rabbit
IgG H&L antibody diluted in blocking buffer (5:1000) with final concentration of 5
μg/mL for 1 h at r.t.p. in the dark. It is then washed thrice with 0.1% Tween-20 in PBS.
Finally, DAPI with working concentration of 300 mM was used to stain the nucleus for
three min. The cells were washed again and then visualised using the confocal
microscopy with excitation wavelength of 488 nm and emission max at 525 nm.
3.2.10 Immunofluorescence for detection of CD44 receptors in different cells
The MDA-MB-231 and MCF-7 cells were seeded onto six well plates with cover
slip for 24 h at cell density of 200000 cells/well separately. The cells were then fixed
with 4% paraformaldehyde for ten mins at r.t.p.. It is then washed with PBS thrice. After
which, the cells were permeabilized using 0.1% Triton X-100 in PBS for 10 mins and
washed thrice with 0.1% Tween-20 in PBS. After which blocking buffer was added and
incubated for 1 h at r.t.p.. The primary anti-CD44 antibody was diluted in blocking
buffer (1:1000) to yield a final concentration of 1 μg/mL and incubated for 1 h at rtp.
After which the cells were washed thrice with 0.1% Tween-20 in PBS. It is then
incubated with the secondary Alexa Fluor®488-conjugated Goat Anti-Rabbit IgG H&L
antibody diluted in blocking buffer (1:1000) with final concentration of 2 μg/mL for 1
h at r.t.p. in the dark. It is then washed thrice with 0.1% Tween-20 in PBS. Finally,
DAPI with working concentration of 300 mM was used to stain the nucleus for 3 min.
The cells were washed again and then visualised using the confocal microscopy with
excitation wavelength of 488 nm and emission max at 525 nm.
104
3.2.11 Cellular experiments
MDA-MB-231 cells were cultured in high glucose DMEM containing 10% fetal
bovine serum (FBS) and 1% penicillin/streptomycin at 37 °C under 5% CO2. To study
the dark cytotoxicity of HA@aCe6 and HA-CAT@aCe6 NPs with different
concentrations at both normoxic (74% N2, 5% CO2, 21% O2) and hypoxic (94% N2, 5%
CO2, 1% O2) conditions, the cells were seeded into 96-well cell culture plates at cell
density of 10,000/well until adherent and incubated with respective normoxic and
hypoxic conditions for 24 h. The cells were then incubated with various concentrations
of HA@aCe6 and HA-CAT@aCe6 NPs for 24 h before cell viability in dark conditions
was determined. To study the photodynamic efficacy, the cells were seeded until
adherent and incubated at various conditions for 24 h. The cells were then incubated
with different concentrations of HA@aCe6 and HA-CAT@aCe6 NPs for 4 h before
irradiated with light (630 nm, 3.1 mW/cm2) for 5 min. The standard MTT assay was
used to determine the cell viability relative to untreated control cells.
3.2.12 Animal model
Female BALB/c nude mice were purchased from InVivos Pte Ltd and used under
protocol approved by Institutional Animal Care and Use Committee (IACUC). To
develop the tumour model, 2 × 10⁶ MDA-MB-231 cells suspended in 3:2 matrigel:PBS
(60 μL) were subcutaneously injected onto the back of each mouse. Experiments on the
mice commenced when tumour volumes reached about 50 – 60 mm3.
3.2.13 In vivo imaging
For animal imaging, HA@aCe6 and HA-CAT@aCe6 NPs (200 μL) with
equivalent concentration of aCe6 (0.4 mg/mL) were intravenously injected into the mice
(aCe6 dose: 4 mg/kg). In vivo fluorescence imaging (IVIS) was conducted at wavelength
of 675 nm and emission of 735 nm using an in vivo optical imaging system. The mice

105
were sacrificed at 24 h after intravenous injection, with their major organs including
tumour, liver, heart, lung, spleen, and kidney collected for imaging. The fluorescence
intensity was analyzed by ImageJ. To evaluate the tumour hypoxia post treatment,
BALB/c nude mice bearing MDA-MB-231 tumour were intravenously injected with
HA-CAT@aCe6 NPs. After 24 h, each mouse was injected with pimonidazole
hydrochloride (30 mg kg-1, hypoxyprobe-1 plus kit, Hypoxyprobe Inc). The mice were
sacrificed after 90 mins for the collection of tumour slices for immunofluorescence
staining. Finally, the slices were observed using CLSM.
3.2.14 In vivo photodynamic therapy
For in vivo therapy, 25 tumour-bearing nude mice were divided into five groups
(five mice per group): I) control group with saline injection only, II) free Ce6 with light
irradiation, III) HA@aCe6 NPs with light irradiation, IV) HA-CAT@aCe6 NPs in the
dark, and V) HA-CAT@aCe6 NPs with light irradiation. Then, the mice were injected
with the materials, and after 24 h, group II, III and V received light irradiation (50
mW/cm2) on the tumour for 30 min. The doses of aCe6, catalase and Ce6 were 4 mg/kg,
18.4 mg/kg and 2.9 mg/kg, respectively. The lengths and widths of the tumour were
measured using a digital caliper for fourteen days. Volumes of the tumour were
computed using the standard formula where volume = ½ x width2 x height. The tumour
growth curve was processed by comparing tumour volumes from each day to the initial
tumour volumes at day 0. Evaluation of the treatment efficacies for each group was done
by sacrificing mouse at day 4 for the collection of the tumours for H&E staining.

106
3.3 Results and Discussions
3.3.1 Synthesis and characterizations
CD-modified HA was synthesized by using 1-ethyl-3-(3-
dimethylaminopropyl)carbodiimide (EDC) and N-hydroxybenzotriazole (HOBt)
coupling. Low molecular weight HA (8 – 15 kDa) was conjugated to β-CD to produce
HA-CD with a conjugation degree of 6.56%. The photosensitizer Ce6 was modified
with adamantane for easy loading with HA-CD via supramolecular means. The
compounds synthesized were all characterized by 1H NMR spectra. Following which,
HA-CD was reacted with catalase via the EDC and HOBt coupling to produce HA-CAT
in different mass ratios (1:1, 3:1 and 6:1) of HA-CD:catalase. Catalase, an enzyme that
catalyzes the production of O2 from H2O2, was introduced for promoting the PDT
efficiency in hypoxic tumour. HA-CD:catalase mass ratio of 3:1 was eventually chosen
for further studies, since the obtained HA-CAT has a reasonable hydrodynamic diameter
suitable for the accumulation in tumour50 and better retained activity of catalase (Figure
1 and Table 1). The concentrations of catalase in all catalase-containing NPs were
determined by the bicinchoninic acid protein assay. The mass amount of HA-CD to
catalase was approximately 1.4:1 as determined by the subtraction of the CAT mass
(measured by the BCA protein assay) from the known dried mass of HA-CAT. For the
same concentration of catalase in HA-CAT and free catalase, the activity of HA-CAT
was estimated to be 15.3% of free catalase, determined using the Amplex Red Catalase
Kit. For controlled loading of photosensitizer, ada-Ce6 was loaded into HA-CAT via
the formation of inclusion complex between adamantane on aCe6 and β-CD modified
on HA to give HA-CAT@aCe6.
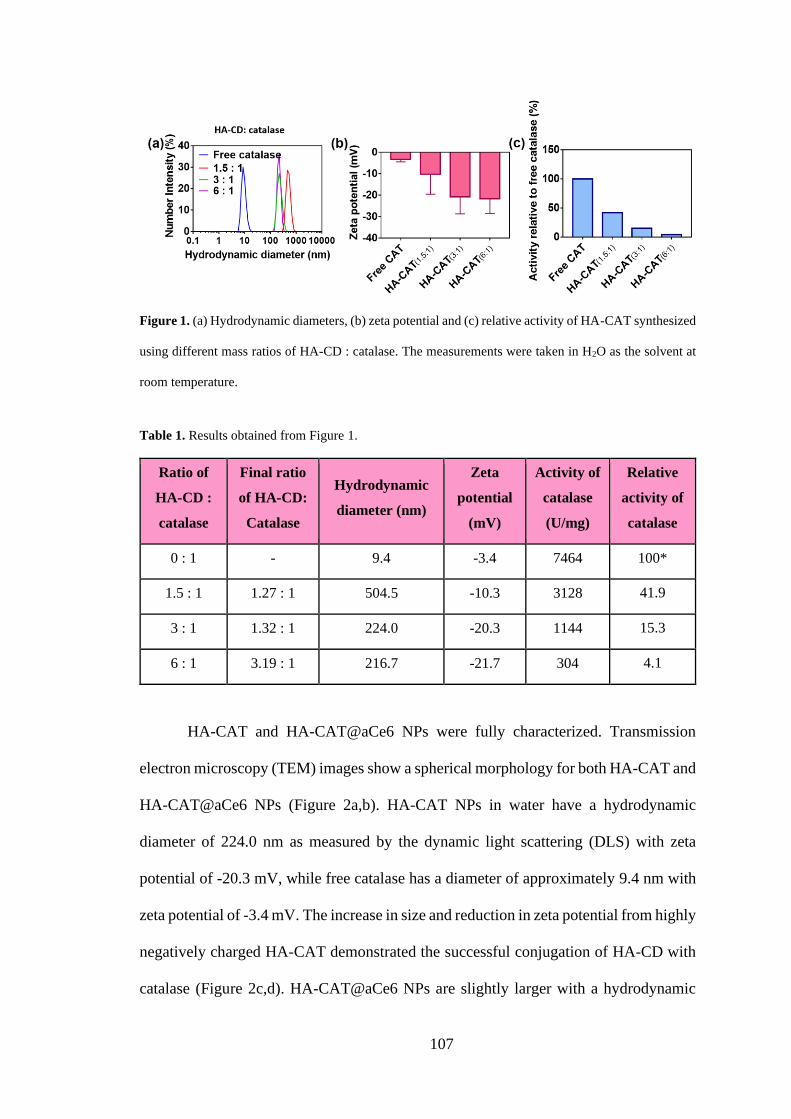
107
Figure 1. (a) Hydrodynamic diameters, (b) zeta potential and (c) relative activity of HA-CAT synthesized
using different mass ratios of HA-CD : catalase. The measurements were taken in H2O as the solvent at
room temperature.
Table 1. Results obtained from Figure 1.
Ratio of
HA-CD :
catalase
Final ratio
of HA-CD:
Catalase
Hydrodynamic
diameter (nm)
Zeta
potential
(mV)
Activity of
catalase
(U/mg)
Relative
activity of
catalase
0 : 1 - 9.4 -3.4 7464 100*
1.5 : 1 1.27 : 1 504.5 -10.3 3128 41.9
3 : 1 1.32 : 1 224.0 -20.3 1144 15.3
6 : 1 3.19 : 1 216.7 -21.7 304 4.1
HA-CAT and HA-CAT@aCe6 NPs were fully characterized. Transmission
electron microscopy (TEM) images show a spherical morphology for both HA-CAT and
HA-CAT@aCe6 NPs (Figure 2a,b). HA-CAT NPs in water have a hydrodynamic
diameter of 224.0 nm as measured by the dynamic light scattering (DLS) with zeta
potential of -20.3 mV, while free catalase has a diameter of approximately 9.4 nm with
zeta potential of -3.4 mV. The increase in size and reduction in zeta potential from highly
negatively charged HA-CAT demonstrated the successful conjugation of HA-CD with
catalase (Figure 2c,d). HA-CAT@aCe6 NPs are slightly larger with a hydrodynamic
108
diameter of 233.6 nm and zeta potential of -13.6 mV (Figure 2c,d). Vertical gel
electrophoresis was used to verify the successful synthesis of HA-CAT (Figure 2e).
Catalase is made up of 4 monomeric proteins and gives a single 66 kDa band on sodium
dodecyl sulfate polyacrylamide gel electrophoresis (SDS-PAGE) by taking the
reference with the known mass of protein in lane 1 where lane 1 is the protein ladder.
After the conjugation of HA-CD onto catalase to form HA-CAT, a trailing band was
observed in the SDS-PAGE lane (lane 3), which was a result of the increased molecular
weight of HA-CAT. After the photosensitizer loading, the presence of characteristic
absorbance bands of aCe6 at around 400 nm and 660 nm and the aggregation induced
blue shift of aCe6 confirmed the successful entrapment of aCe6 in HA-CAT@aCe6 NPs
(Figure 2f). The entrapment efficiency of aCe6 by HA-CAT NPs ([CAT] = 40 μg/mL)
was found to be 80.1 %. The final concentration of aCe6 was determined to be 9.7 µM
(Figure 3b) by referencing to the standard calibration curve of aCe6 (Figure 3c). The
photosensitizer loading efficiency was found to be 2.0 % (w/w), with reference to the
mass of HA-CAT.

109
Figure 2. Characterisations of HA-CAT@aCe6 NPs. TEM images of (a) HA-CAT NPs and (b) HA-
CAT@aCe6 NPs. The scale bar is 50 nm. (c) The hydrodynamic diameter measured from dynamic light
scattering of free catalase, HA-CAT NPs and HA-CAT@aCe6. (d) Zeta potential of various materials. (e)
Gel obtained from running HA-CAT NPs. Lane 1 is the protein ladder which contains protein of known
mass. (f) The absorbance of HA-CAT NPs, aCe6 and the HA-CAT@aCe6 NPs.
Figure 3. (a) Absorbance curve of Ce6 and aCe6 (b) Absorbance of HA-CAT@aCe6 NPs before (black)
and after (red) dialysis. (b) Calibration curve of aCe6. Amount of aCe6 was calculated based on the Beer-
Lambert law.

110
3.3.2 Evaluation of catalase activity
Following the preparation of HA-CD and HA-CAT@aCe6 NPs, their abilities
to generate O2 when incubated with H2O2 were investigated. As shown in Figure 4, H2O2
and HA@aCe6 NPs (control group without CAT loaded) did not have a significant
effect on the generation of O2 in the solution. The slight increase of the O2 concentration
in the H2O2 sample was probably caused by inherent decomposition of H2O2. On the
other hand, HA-CAT and HA-CAT@aCe6 NPs produced significantly higher amounts
of O2 when incubated with H2O2. Comparatively, free catalases produced O2 at the
fastest rate, reaching the maximum concentration of O2 at 90 s. HA-CAT and HA-
CAT@aCe6 showed a steady increase in the O2 concentration upon time. They did not
show obvious differences in the production of O2 from H2O2, suggesting that the
photosensitizer loading did not affect the activity of catalase. The activities of HA-CAT
and HA-CAT@aCe6 NPs were lower than that of free catalase, since the conjugation of
HA-CD onto catalase made it less available for the catalytic reaction. Nonetheless, the
capacity of HA-CAT and HA-CAT@aCe6 NPs is high enough for catalytic production
of O2 from H2O2.
Figure 4. Change in oxygen concentration when different samples (H2O2 only, free catalase, HA-CAT,
HA@aCe6 and HA-CAT@aCe6 NPs were incubated with H2O2.

111
3.3.3 Verification of production of singlet oxygen using singlet oxygen sensor green.
After the verification that O2 could be produced from HA-CAT and HA-
CAT@aCe6 NPs upon the addition of H2O2, we tested their efficiency in the generation
of 1O2 using SOSG. SOSG has weak fluorescence, but when it reacts with 1O2, the
fluorescence increases at 530 nm under the excitation at 494 nm. Modification of Ce6
with adamantane to give aCe6 and verification is needed to ensure that aCe6 is also able
to produce 1O2. When only H2O2 was present in the solution, no fluorescence was
observed. Obvious fluorescence increase was measured for HA-CAT@aCe6 or aCe6
with H2O2 when irradiated under light, indicating their comparable 1O2 production
capability. Considering effective generation of oxygen via the catalysis of loaded
catalase on H2O2, the production of 1O2 by HA-CAT@aCe6 with H2O2 presented the
highest fluorescence change at 530 nm at all irradiation time (Figure 5). This observation
indicates that the production of 1O2 was enhanced in the presence of both catalase and
H2O2, which could possibly promote the PDT efficacy of HA-CAT@aCe6 NPs in
cellular and animal studies.
Figure 5. Change in fluorescence of SOSG over irradiation time for different samples such as H2O2 only,
free Ce6 with H2O2, HA-CAT@aCe6 only and HA-CAT@aCe6 with H2O2.

112
3.3.4 Stability examination of conjugated catalase
Catalase might rapidly lose its stability and activity in vivo during the blood
circulation owing to the degradation by other enzymes especially the proteases. The
conjugation of enzymes to polymers was known to improve the stability of the enzymes
due to the polymer protection from the proteases.38 To verify that the present
modification could lead to better protein stability, free catalase or HA-CAT was
incubated with proteinase K for a specific duration and their corresponding ability to
decompose H2O2 was verified using the Gòth method.51 As shown in Figure 6a, the
activity of free catalase quickly decreased to near zero within 2 h after the incubation
with proteinase K. In contrast, HA-CAT was still able to retain more than 90% of its
activity after 2 h, and the activity remained high even after 4 h. Therefore, the
conjugation of catalase with HA-CD polymer did improve its stability in the presence
of proteinase K, which is important for tumour targeted delivery in vivo. The minimal
change in size of the HA-CAT@aCe6 in different solution (PBS, cell culture medium
and water) over three days also indicated good physiological stabilities (Figure 6b).
Figure 6. (a) The relative enzymatic activity of free catalase and HA-CAT@aCe6 NPs after proteinase
K digestion over 5 h. (b) Hydrodynamic size of HA-CAT@aCe6 NPs monitored over three days in three
different solutions.
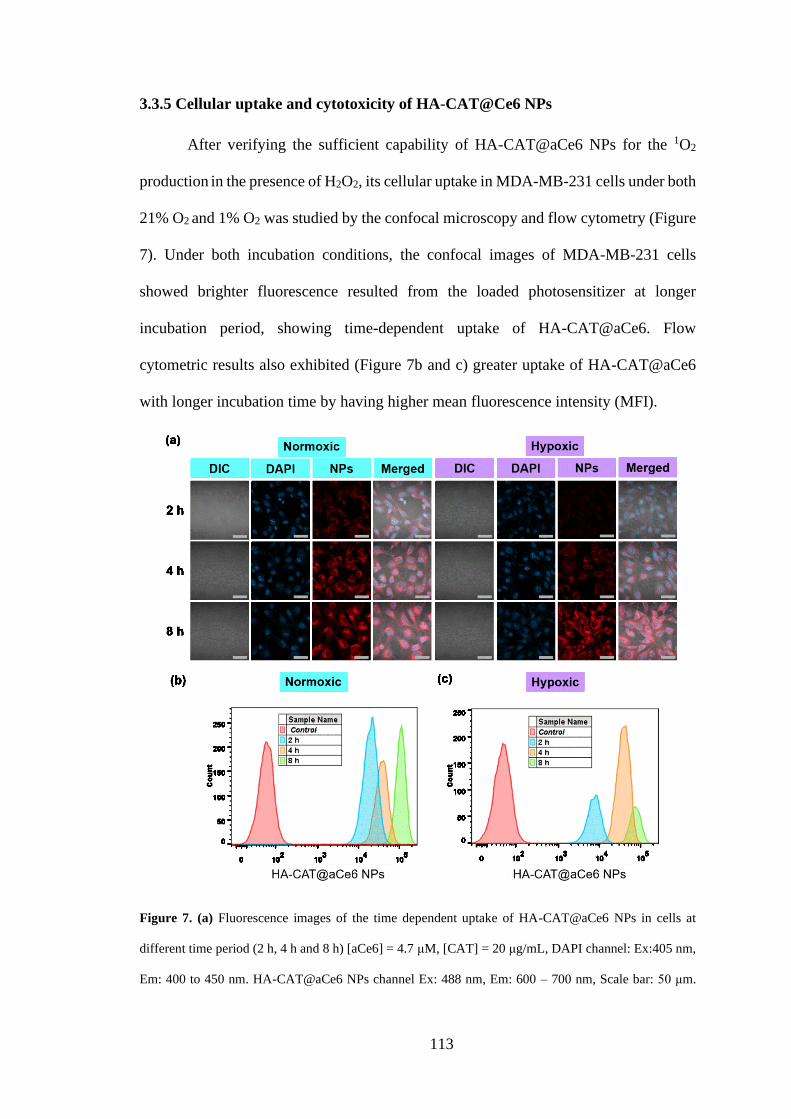
113
3.3.5 Cellular uptake and cytotoxicity of HA-CAT@Ce6 NPs
After verifying the sufficient capability of HA-CAT@aCe6 NPs for the 1O2
production in the presence of H2O2, its cellular uptake in MDA-MB-231 cells under both
21% O2 and 1% O2 was studied by the confocal microscopy and flow cytometry (Figure
7). Under both incubation conditions, the confocal images of MDA-MB-231 cells
showed brighter fluorescence resulted from the loaded photosensitizer at longer
incubation period, showing time-dependent uptake of HA-CAT@aCe6. Flow
cytometric results also exhibited (Figure 7b and c) greater uptake of HA-CAT@aCe6
with longer incubation time by having higher mean fluorescence intensity (MFI).
Figure 7. (a) Fluorescence images of the time dependent uptake of HA-CAT@aCe6 NPs in cells at
different time period (2 h, 4 h and 8 h) [aCe6] = 4.7 μM, [CAT] = 20 μg/mL, DAPI channel: Ex:405 nm,
Em: 400 to 450 nm. HA-CAT@aCe6 NPs channel Ex: 488 nm, Em: 600 – 700 nm, Scale bar: 50 μm.

114
Uptake of NPs at different incubation time point (2 h, 4 h and 8 h) in (b) normoxic and (c) hypoxic
condition. [aCe6] = 2.5 μM, [CAT] = 10 μg/mL and ex/ em: 488/710 nm.
As HA was known to target CD44 receptors over expressed on some cancer
cells, the targeting ability of HA-CAT@Ce6 was verified by using CD44+ MDA-MB-
231 and CD44- MCF-7 cell lines. The levels of CD44 receptors on these cell lines were
first evaluated, and CD44+ MDA-MB-231 cells expressed greater amount of CD44
receptors as compared to CD44- MCF-7 cells (Figure 8a). Following the incubation of
HA-CAT@aCe6 NPs with CD44+ MDA-MB-231 and CD44- MCF-7 cells respectively
(Figure 8b), the fluorescence from MDA-MB-231 cells was brighter as compared to that
of MCF-7 cells at incubation times of both 2 h and 4 h. This result indicates that the
uptake of HA-CAT@aCe6 by MDA-MB-231 cells was greater, probably through CD44
receptor-mediated endocytosis. Furthermore, competitive assay of HA was used to
further support the targeting capability of HA-CAT@aCe6 (Figure 8c). Free HA with
different concentrations (0, 5, 15, and 30 mg/mL) was incubated with MDA-MB-231
cells for 4 h before the addition of HA-CAT@aCe6. This process allowed the CD44
receptors on the cells to be occupied by free HA, and thus they were less available to
facilitate the endocytosis of HA-CAT@aCe6. Indeed, with an increasing amount of free
HA preincubated, the uptake of HA-CAT@aCe6 by both normoxic and hypoxic cells
decreased, confirming that the HA component in HA-CAT@aCe6 provides targeting
property, enabling specific accumulation to CD44 receptor-overexpressed cancer cells
(Figure 8d and e).
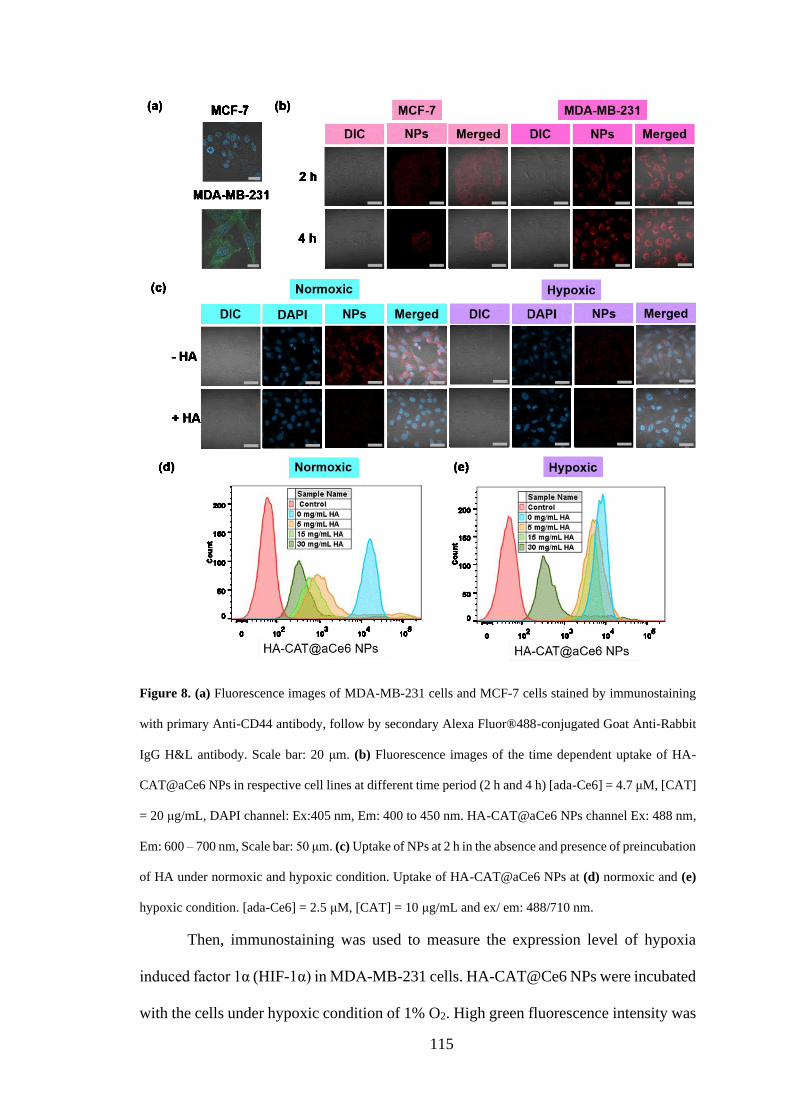
115
Figure 8. (a) Fluorescence images of MDA-MB-231 cells and MCF-7 cells stained by immunostaining
with primary Anti-CD44 antibody, follow by secondary Alexa Fluor®488-conjugated Goat Anti-Rabbit
IgG H&L antibody. Scale bar: 20 μm. (b) Fluorescence images of the time dependent uptake of HA-
CAT@aCe6 NPs in respective cell lines at different time period (2 h and 4 h) [ada-Ce6] = 4.7 μM, [CAT]
= 20 μg/mL, DAPI channel: Ex:405 nm, Em: 400 to 450 nm. HA-CAT@aCe6 NPs channel Ex: 488 nm,
Em: 600 – 700 nm, Scale bar: 50 μm. (c) Uptake of NPs at 2 h in the absence and presence of preincubation
of HA under normoxic and hypoxic condition. Uptake of HA-CAT@aCe6 NPs at (d) normoxic and (e)
hypoxic condition. [ada-Ce6] = 2.5 μM, [CAT] = 10 μg/mL and ex/ em: 488/710 nm.
Then, immunostaining was used to measure the expression level of hypoxia
induced factor 1α (HIF-1α) in MDA-MB-231 cells. HA-CAT@Ce6 NPs were incubated
with the cells under hypoxic condition of 1% O2. High green fluorescence intensity was
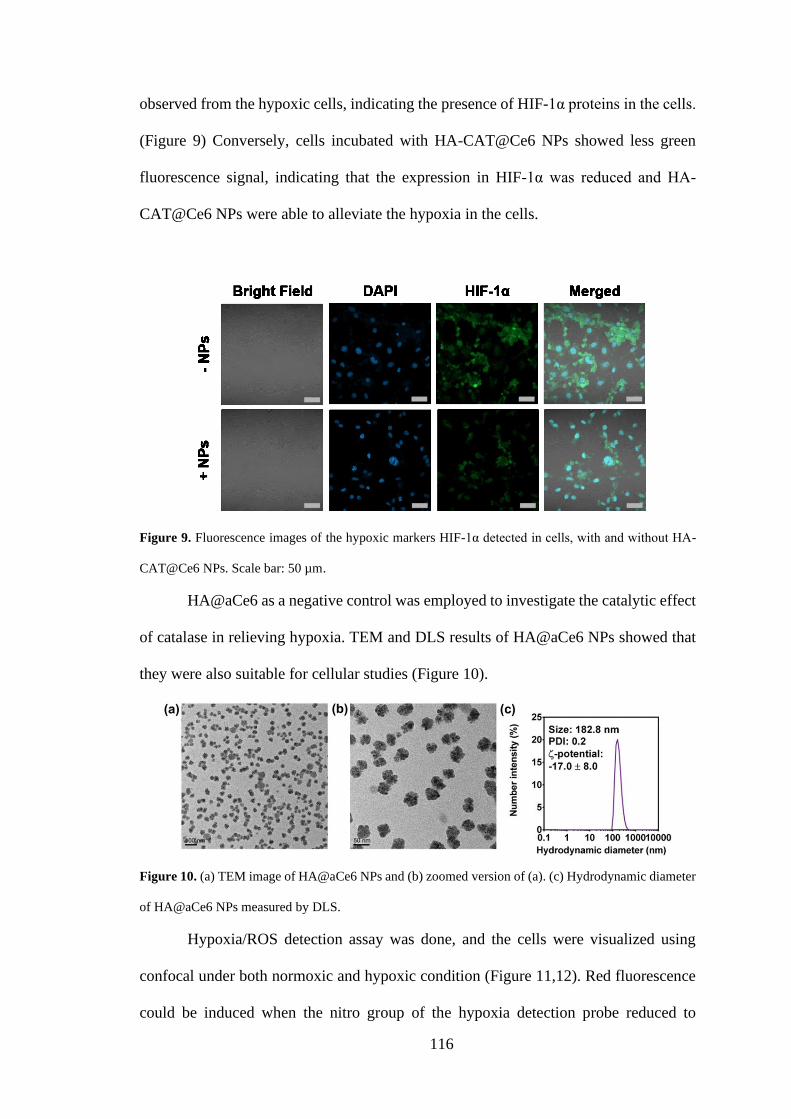
116
observed from the hypoxic cells, indicating the presence of HIF-1α proteins in the cells.
(Figure 9) Conversely, cells incubated with HA-CAT@Ce6 NPs showed less green
fluorescence signal, indicating that the expression in HIF-1α was reduced and HA-
CAT@Ce6 NPs were able to alleviate the hypoxia in the cells.
Figure 9. Fluorescence images of the hypoxic markers HIF-1α detected in cells, with and without HA-
CAT@Ce6 NPs. Scale bar: 50 µm.
HA@aCe6 as a negative control was employed to investigate the catalytic effect
of catalase in relieving hypoxia. TEM and DLS results of HA@aCe6 NPs showed that
they were also suitable for cellular studies (Figure 10).
Figure 10. (a) TEM image of HA@aCe6 NPs and (b) zoomed version of (a). (c) Hydrodynamic diameter
of HA@aCe6 NPs measured by DLS.
Hypoxia/ROS detection assay was done, and the cells were visualized using
confocal under both normoxic and hypoxic condition (Figure 11,12). Red fluorescence
could be induced when the nitro group of the hypoxia detection probe reduced to

117
hydroxylamine and amino groups while green fluorescence was induced from DCFH-
DA when ROS was present to produce DCF. Results show that hypoxia could be
relieved using HA-CAT and HA-CAT@aCe6 NPs and upon irradiation of light under
both normoxic and hypoxic condition, the HA-CAT@aCe6 NPs were able to induce the
greatest amount of ROS due to the highest intensity of green fluorescence from DCF.
Figure 11. Fluorescence images of cells with different treatments as monitored by the ROS-Hypoxia Kit
under normoxic condition. Red fluorescence indicates that the cells were hypoxic, while green
fluorescence indicates the presence of ROS. Scale bar: 100 µm.
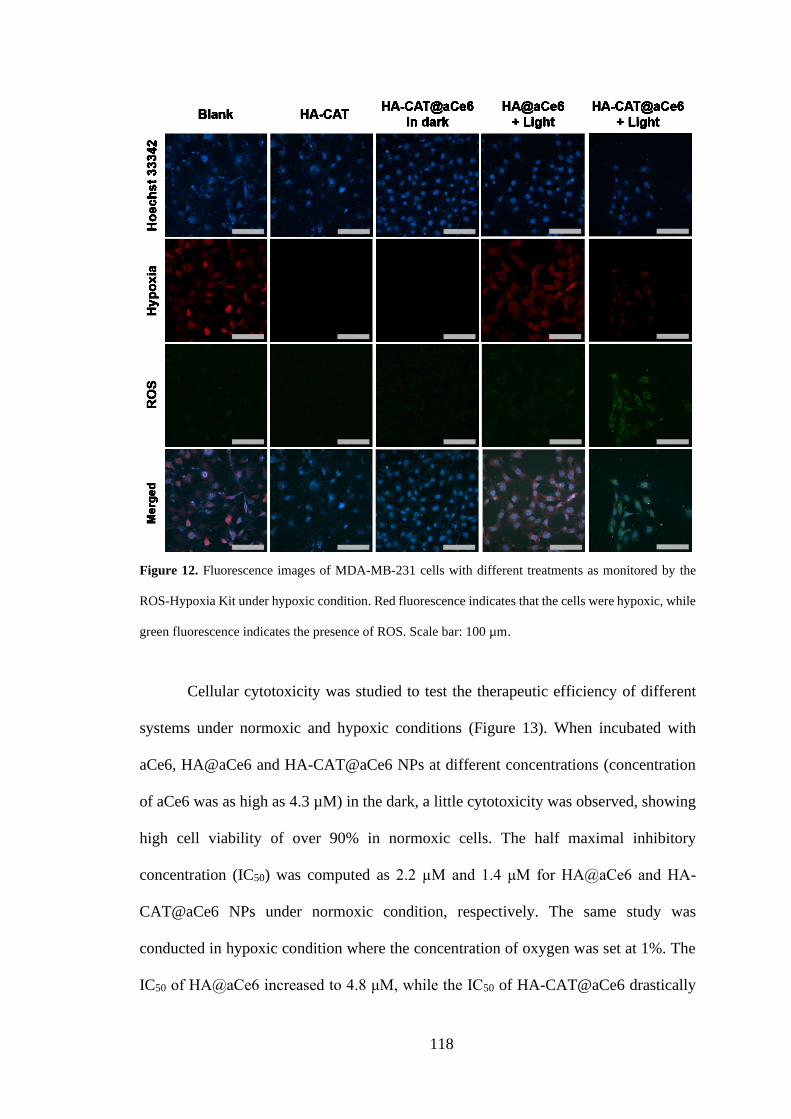
118
Figure 12. Fluorescence images of MDA-MB-231 cells with different treatments as monitored by the
ROS-Hypoxia Kit under hypoxic condition. Red fluorescence indicates that the cells were hypoxic, while
green fluorescence indicates the presence of ROS. Scale bar: 100 µm.
Cellular cytotoxicity was studied to test the therapeutic efficiency of different
systems under normoxic and hypoxic conditions (Figure 13). When incubated with
aCe6, HA@aCe6 and HA-CAT@aCe6 NPs at different concentrations (concentration
of aCe6 was as high as 4.3 µM) in the dark, a little cytotoxicity was observed, showing
high cell viability of over 90% in normoxic cells. The half maximal inhibitory
concentration (IC50) was computed as 2.2 µM and 1.4 μM for HA@aCe6 and HA-
CAT@aCe6 NPs under normoxic condition, respectively. The same study was
conducted in hypoxic condition where the concentration of oxygen was set at 1%. The
IC50 of HA@aCe6 increased to 4.8 μM, while the IC50 of HA-CAT@aCe6 drastically
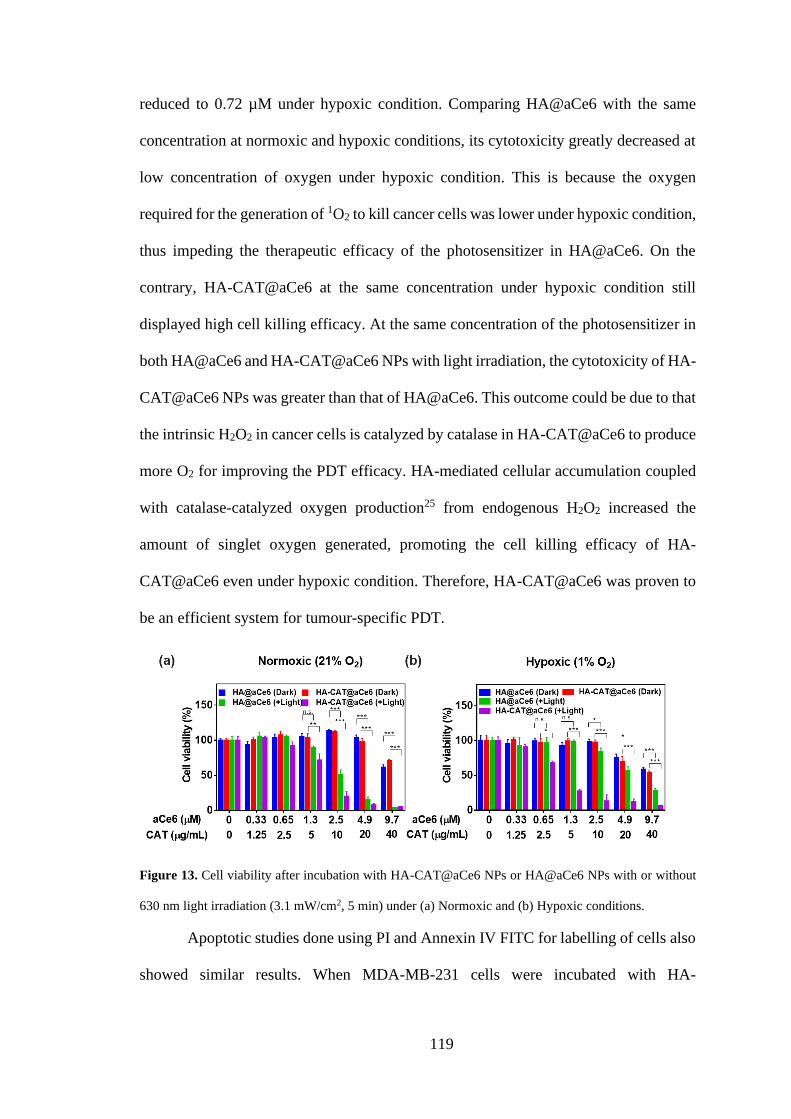
119
reduced to 0.72 µM under hypoxic condition. Comparing HA@aCe6 with the same
concentration at normoxic and hypoxic conditions, its cytotoxicity greatly decreased at
low concentration of oxygen under hypoxic condition. This is because the oxygen
required for the generation of 1O2 to kill cancer cells was lower under hypoxic condition,
thus impeding the therapeutic efficacy of the photosensitizer in HA@aCe6. On the
contrary, HA-CAT@aCe6 at the same concentration under hypoxic condition still
displayed high cell killing efficacy. At the same concentration of the photosensitizer in
both HA@aCe6 and HA-CAT@aCe6 NPs with light irradiation, the cytotoxicity of HA-
CAT@aCe6 NPs was greater than that of HA@aCe6. This outcome could be due to that
the intrinsic H2O2 in cancer cells is catalyzed by catalase in HA-CAT@aCe6 to produce
more O2 for improving the PDT efficacy. HA-mediated cellular accumulation coupled
with catalase-catalyzed oxygen production25 from endogenous H2O2 increased the
amount of singlet oxygen generated, promoting the cell killing efficacy of HA-
CAT@aCe6 even under hypoxic condition. Therefore, HA-CAT@aCe6 was proven to
be an efficient system for tumour-specific PDT.
Figure 13. Cell viability after incubation with HA-CAT@aCe6 NPs or HA@aCe6 NPs with or without
630 nm light irradiation (3.1 mW/cm2, 5 min) under (a) Normoxic and (b) Hypoxic conditions.
Apoptotic studies done using PI and Annexin IV FITC for labelling of cells also
showed similar results. When MDA-MB-231 cells were incubated with HA-

120
CAT@aCe6 NPs, with light irradiation, the apoptotic cells detected were the highest
(Figure 14).
Figure 14. Apoptosis assay by flow cytometry under normoxic (first row) and hypoxic (second row)
conditions: HA@aCe6 NPs and HA-CAT@aCe6 NPs in the dark and with light irradiation with
concentrations of [CAT] = 1.25 μg/mL, [aCe6] = 0.33 μM and [CAT] = 2.5 μg/mL, [aCe6] = 0.65 μM.

121
3.3.6 In vivo biodistribution of HA-CAT@aCe6 NPs.
Before the application of HA-CAT@aCe6 NPs for in vivo PDT, its
biodistribution was first investigated. aCe6, HA@aCe6 and HA-CAT@aCe6 NPs were
individually injected into MBA-MD-231 tumour-bearing nude mice intravenously. The
fluorescence signal at the tumour sites was monitored using IVIS (Figure 15a). At 2 h,
the tumours of all treated mice showed similar fluorescence intensity. Upon time, the
fluorescence intensity from aCe6 group decreased, while HA@aCe6 and HA-
CAT@aCe6 groups showed an enhancement in fluorescence at 24 h time point (Figure
15a, b). After 24 h, the mice treated with HA-CAT@aCe6 NPs were sacrificed for ex
vivo imaging of their major organs (Figure 15c). The tumours were found to have the
highest average radiant efficiency, translating to highest accumulation of HA-
CAT@aCe6 NPs in tumours (Figure 15d). However, the liver showed weaker
fluorescence, and other major organs such as spleen, kidney, heart and lungs exhibited
minimal fluorescence signal. Free Ce6 were not able to accumulate in the tumour site
since it is a small molecule and could diffuse in and out of the tumour freely, resulting
in being metabolized.52 On the other hand, both HA@aCe6 and HA-CAT@aCe6 NPs
could accumulate in tumour due to the EPR effect. 53 In addition, the ability of HA-
CAT@aCe6 NPs to overcome hypoxia in tumours was also evaluated using fluorescent
tagged antibody that binds to endogenous HIF-1α (green) and CD31 (red) on blood
vessels.54 Typically, downregulation of both HIF-1α and CD31 indicates the relief of
hypoxia in solid tumours. MDA-MB-231 tumours were sectioned and stained by
fluorescent tagged antibody and visualized under the microscope. The tumours treated
with HA-CAT@aCe6 NPs showed remarkably alleviated hypoxia as compared to those
without the treatment, as indicated by less intense fluorescence by HIF-1α and CD31.

122
These immunofluorescence staining results indicate that HA-CAT@aCe6 NPs are
indeed capable of overcoming hypoxia associated tumours for the PDT treatment.
Figure 15. (a) Biodistribution of HA-CAT@aCe6 NPs in mice at time interval of 2 h, 8 h and 24 h after
IV injection (b) Relative mean fluorescence intensity obtained from the tumours of the mice using ImageJ
(c) Ex vivo fluorescence image of various important organs as well as the tumour dissected from mice 24
h after an intravenous injection of HA-CAT@aCe6s. T, Li, S, H, K and Lu stand for tumour, liver, spleen,
heart, kidney and lung, respectively. (d) Average radiant efficiency of the organs compiled from (c). (e)
Immunofluorescence staining of tumour sections excised from mice with treatment with PBS and HA-

123
CAT@aCe6 NPs. Nuclei was stained blue with Hoechst 33342, blood vessels were stained red with anti-
CD31 antibody and hypoxic tumour areas stained green with HIF-1α antibody. Scale bar: 100 μm.
3.3.7 In vivo photodynamic therapy
Because of the remarkable accumulation of HA-CAT@aCe6 in tumour sites, its
efficacy in the eradication of tumours was evaluated in vivo using nude mice bearing
MDA-MB-231 tumours. Five distinct therapeutic groups comprising of five mice per
group were monitored for 14 days. The five groups include I: control in which only PBS
was injected, II: Free Ce6 with light irradiation, III: HA-CAT@aCe6 NPs in the dark,
IV: HA@aCe6 with light irradiation, and V: HA-CAT@aCe6 NPs with light irradiation.
The relative tumour growth curve was obtained (Figure 16a). The growth of tumour
from group V was the most inhibited one among all groups, indicating the highest anti-
tumour efficacy of HA-CAT@aCe6. On the other hand, HA@aCe6 NPs showed
moderate inhibition of tumour growth because the accumulated NPs at the tumour site
were not able to exhibit enough toxicity to ablate the whole tumour. This led to the
continual growth of the tumour. On account of the non-accumulation of free Ce6 at
tumour site, the irradiation of light did not result in the inhibition of tumour growth.
HA-CAT@aCe6 NPs in the dark also showed little therapeutic efficacy. In general, all
the systems administrated did not show any major systemic toxicity as the weights of
the mice all maintained at a healthy level (Figure 16b). The tumours from all treatment
groups were excised and weighed at the end of day 14. Group V had the lowest tumour
mass, followed by groups IV, III, II and I (Figure 16c). The tumours in group V were
the smallest among all the tumours (Figure 16d).
To further evaluate the anti-tumour efficacy of PDT using HA-CAT@aCe6 NPs,
H&E stain and TUNEL were utilized to stain the tumours from groups I to V for
histological analysis. Based on obtained results (Figure 16e), the most severe

124
morphological change and necrosis for tumour slices were observed in group V, while
moderate damages were observed from group IV and minimal damages from groups I-
III. For studying the systemic toxicity of HA-CAT@aCe6, healthy nude mice were
injected with HA-CAT@aCe6 NPs and the major organs were harvested for similar
histological analysis. No major organ damage was observed (Figure 17), indicating good
biocompatibility of HA-CAT@aCe6. All in all, HA-CAT@aCe6 NPs displayed
excellent ability to target the tumour and reduce hypoxia in solid tumour to ensure
effective anti-tumour PDT.
Figure 16. Relative tumour volume of MDA-MB-231 tumour-bearing mice for the five groups in 14 days.
(b) Average weight of the different group (I-V) of mice (c) Mean tumour weight of mice excised on the
14th day. (d) Excised tumours from the five mice 14 days after treatment (e) Histological section of
tumours stained with hematoxylin and eosin and TUNEL of tumours sectioned from different groups of
mice where DAPI (blue) and TUNEL (red) are stained. Scale bar: 100 μm Light of 660 nm was irradiated
for 20 mins at 50 mW cm-2. Data are presented as mean ± standard error mean (SEM). *, p ≤ 0.05; **, p
≤ 0.01, ***, p ≤ 0.001 as calculated by Student’s t test.

125
Figure 17. Histological section of various organs stained with H&E after different treatments. Scale bar:
100 µm.
3.4 Conclusion
In all, we have successfully fabricated HA-CAT@aCe6 NPs capable of targeting
CD44 overexpressed cancer cells and tumours as well as reducing the hypoxia to ensure
high efficacy of PDT both in cells and animal model. This method of catalase
conjugation is feasible in protecting the catalase from the action of proteinase K. The
protein stability was greatly enhanced through the conjugation with HA polymer. Thus,
the loaded catalase was able to efficiently catalyze H2O2 to generate additional O2
toward the production of ROS for PDT. Systemically administered HA-CAT@aCe6
NPs could accumulate in the tumour and attenuate the tumour hypoxia for improved
PDT. Therefore, HA-CAT@aCe6 NPs displayed a potential for tumour-targeted
treatment. The present approach could be extended to other protein-based therapeutics
or enzymes.
References
1. Dolmans, D. E. J. G. J.; Fukumura, D.; Jain, R. K. Nat. Rev. Cancer 2003, 3,
380.
2. Moore, C. M.; Pendse, D.; Emberton, M. Nat. Clin. Pract. Urol. 2009, 6, 18.

126
3. Horrobin, D. F. New Approaches to Cancer Treatment: Unsaturated Lipids and
Photodynamic Therapy, 1994.
4. Ericson, M. B.; Wennberg, A.-M.; Larkö, O. Ther. Clin. Risk. Manag. 2008, 4,
1-9.
5. Tham, H. P.; Xu, K.; Lim, W. Q.; Chen, H.; Zheng, M.; Thng, T. G. S.;
Venkatraman, S. S.; Xu, C.; Zhao, Y. ACS Nano 2018, 12, 11936-11948.
6. Beasley, N. J. Cancer Res. 2002, 62, 2493-2497.
7. Agostinis, P.; Berg, K.; Cengel, K. A.; Foster, T. H.; Girotti, A. W.; Gollnick, S.
O.; Hahn, S. M.; Hamblin, M. R.; Juzeniene, A.; Kessel, D.; Korbelik, M.; Moan,
J.; Mroz, P.; Nowis, D.; Piette, J.; Wilson, B. C.; Golab, J. CA Cancer J. Clin.
2011, 61, 250-281.
8. Celli, J. P.; Spring, B. Q.; Rizvi, I.; Evans, C. L.; Samkoe, K. S.; Verma, S.;
Pogue, B. W.; Hasan, T. Chem. Rev. 2010, 110, 2795-2838.
9. Li, X.; Lee, S.; Yoon, J. Chem. Soc. Rev. 2018, 47, 1174-1188.
10. Castano, A. P.; Mroz, P.; Hamblin, M. R. Nat. Rev. Cancer 2006, 6, 535.
11. Li, X.; Kwon, N.; Guo, T.; Liu, Z.; Yoon, J. Angew. Chem. Int. Ed. 2018, 57,
11522-11531.
12. Wilson, W. R.; Hay, M. P. Nat. Rev. Cancer 2011, 11, 393.
13. Thomas, S.; Harding, M. A.; Smith, S. C.; Overdevest, J. B.; Nitz, M. D.;
Frierson, H. F.; Tomlins, S. A.; Kristiansen, G.; Theodorescu, D. Cancer Res.
2012, 72, 5600-5612.
14. Wang, S.; Gu, K.; Guo, Z.; Yan, C.; Yang, T.; Chen, Z.; Tian, H.; Zhu, W.-H.
Adv. Mater. 2019, 31, 1805735.
15. Teicher, B. A. Cancer Metastasis Rev. 1994, 13, 139-168.

127
16. Song, G.; Ji, C.; Liang, C.; Song, X.; Yi, X.; Dong, Z.; Yang, K.; Liu, Z.
Biomaterials 2017, 112, 257-263.
17. Zhou, J.; Xue, C.; Hou, Y.; Li, M.; Hu, Y.; Chen, Q.; Li, Y.; Li, K.; Song, G.;
Cai, K.; Luo, Z. Biomaterials 2019, 197, 129-145.
18. Huang, C. C.; Chia, W. T.; Chung, M. F.; Lin, K. J.; Hsiao, C. W.; Jin, C.; Lim,
W. H.; Chen, C. C.; Sung, H. W. J. Am. Chem. Soc. 2016, 138, 5222-5225.
19. Zhang, R.; Song, X.; Liang, C.; Yi, X.; Song, G.; Chao, Y.; Yang, Y.; Yang, K.;
Feng, L.; Liu, Z. Biomaterials 2017, 138, 13-21.
20. Song, G.; Chen, Y.; Liang, C.; Yi, X.; Liu, J.; Sun, X.; Shen, S.; Yang, K.; Liu,
Z. Adv. Mater. 2016, 28, 7143-7148.
21. Liu, C. P.; Wu, T. H.; Liu, C. Y.; Chen, K. C.; Chen, Y. X.; Chen, G. S.; Lin, S.
Y. Small 2017, 13.
22. Yang, G.; Zhang, R.; Liang, C.; Zhao, H.; Yi, X.; Shen, S.; Yang, K.; Cheng, L.;
Liu, Z. Small 2018, 14, 1702664.
23. Gong, H.; Chao, Y.; Xiang, J.; Han, X.; Song, G.; Feng, L.; Liu, J.; Yang, G.;
Chen, Q.; Liu, Z. Nano Lett. 2016, 16, 2512-2521.
24. Chen, Q.; Chen, J.; Liang, C.; Feng, L.; Dong, Z.; Song, X.; Song, G.; Liu, Z. J.
Control. Release 2017, 263, 79-89.
25. Szatrowski, T. P.; Nathan, C. F. Cancer Res. 1991, 51, 794-798.
26. Muz, B.; de la Puente, P.; Azab, F.; Azab, A. K. Hypoxia (Auckland, N.Z.) 2015,
3, 83-92.
27. Yu, M.; Wu, J.; Shi, J.; Farokhzad, O. C. J. Control. Release 2016, 240, 24-37.
28. Gu, Z.; Biswas, A.; Zhao, M.; Tang, Y. Chem. Soc. Rev. 2011, 40, 3638-3655.
29. Scaletti, F.; Hardie, J.; Lee, Y.-W.; Luther, D. C.; Ray, M.; Rotello, V. M. Chem.
Soc. Rev. 2018, 47, 3421-3432.

128
30. Tu, J.; Boyle, A. L.; Friedrich, H.; Bomans, P. H. H.; Bussmann, J.; Sommerdijk,
N. A. J. M.; Jiskoot, W.; Kros, A. ACS Appl. Mater. Interfaces 2016, 8, 32211-
32219.
31. Song, G.; Chen, Y.; Liang, C.; Yi, X.; Liu, J.; Sun, X.; Shen, S.; Yang, K.; Liu,
Z. Adv. Mater. 2016, 28, 7143-7148.
32. Yang, J.-A.; Park, K.; Jung, H.; Kim, H.; Hong, S. W.; Yoon, S. K.; Hahn, S. K.
Biomaterials 2011, 32, 8722-8729.
33. Zhang, N.; Zhao, F.; Zou, Q.; Li, Y.; Ma, G.; Yan, X. Small 2016, 12, 5936-
5943.
34. Liu, K.; Xing, R.; Zou, Q.; Ma, G.; Möhwald, H.; Yan, X. Angew. Chem. Int.
Ed. 2016, 55, 3036-3039.
35. Li, S.; Zou, Q.; Li, Y.; Yuan, C.; Xing, R.; Yan, X. J. Am. Chem. Soc. 2018, 140,
10794-10802.
36. Pisal, D. S.; Kosloski, M. P.; Balu-Iyer, S. V. J. Pharm. Sci. 2010, 99, 2557-
2575.
37. Qi, Y.; Chilkoti, A. Curr. Opin. Chem. Biol. 2015, 28, 181-193.
38. Mero, A.; Pasqualin, M.; Campisi, M.; Renier, D.; Pasut, G. Carbohydr. Polym.
2013, 92, 2163-2170.
39. Alconcel, S. N. S.; Baas, A. S.; Maynard, H. D. Polym. Chem. 2011, 2, 1442-
1448.
40. Misra, S.; Heldin, P.; Hascall, V. C.; Karamanos, N. K.; Skandalis, S. S.;
Markwald, R. R.; Ghatak, S. FEBS J. 2011, 278, 1429-1443.
41. Kim, H.; Jeong, H.; Han, S.; Beack, S.; Hwang, B. W.; Shin, M.; Oh, S. S.; Hahn,
S. K. Biomaterials 2017, 123, 155-171.
42. Götte, M.; Yip, G. W. Cancer Res. 2006, 66, 10233-10237.

129
43. Mattheolabakis, G.; Milane, L.; Singh, A.; Amiji, M. M. J. Drug Targeting 2015,
23, 605-618.
44. Zhu, Q.; Chen, X.; Xu, X.; Zhang, Y.; Zhang, C.; Mo, R. Adv. Funct. Mater.
2018, 28, 1707371.
45. Wang, H.; Chao, Y.; Liu, J.; Zhu, W.; Wang, G.; Xu, L.; Liu, Z. Biomaterials
2018, 181, 310-317.
46. Bae, K. H.; Tan, S.; Yamashita, A.; Ang, W. X.; Gao, S. J.; Wang, S.; Chung, J.
E.; Kurisawa, M. Biomaterials 2017, 148, 41-53.
47. Lin, W. J.; Lee, W. C.; Shieh, M. J. Carbohydr. Polym. 2017, 155, 101-108.
48. Webber, M. J.; Langer, R. Chem. Soc. Rev. 2017, 46, 6600-6620.
49. Halliwell, B.; Clement, M. V.; Long, L. H. FEBS Lett. 2000, 486, 10-13.
50. Maeda, H. Adv. Enzyme Regul. 2001, 41, 189-207.
51. Góth, L. Clin. Chim. Acta 1991, 196, 143-151.
52. Allen, T. M.; Cullis, P. R. Science 2004, 303, 1818-1822.
53. Matsumura, Y.; Maeda, H. Cancer Res. 1986, 46, 6387-6392.
54. Xu, S.; Zhu, X.; Zhang, C.; Huang, W.; Zhou, Y.; Yan, D. Nat. Commun. 2018,
9, 2053.

130
Chapter 4: Hyaluronic acid based nanogels for encapsulation
of glucose oxidase and hypoxia responsive prodrug
4.1 Introduction
Tumour hypoxia is a phenomenon linked to solid tumour, as it describes an
inadequate supply of O2 in neoplasm. 1-7 When tumour grew, blood vessels were further
from the center of the tumour, causing a limiting amount of O2 in the tumour. Tumour
hypoxia can affect tumourigenesis as well as treatment efficacy. Tumour hypoxia is
related to increased expression of hypoxia-induced factors (HIF), a transcription factor
that mediates angiogenesis, metabolism, cell proliferation and differentiation.8-16 Many
hypoxic tumours are resistant to chemotherapy drugs due to several reasons like drug
efflux,17, 18 apoptosis inhibition19, 20 and autophagy induction.21 Furthermore, some
therapeutic methods such as photodynamic therapy and radiotherapy that require oxygen
to generate reactive oxygen species (ROS) led to consumption of O2 in cancer cells,
which further exacerbates tumour hypoxia. 2, 22-24 This further translates to low efficacy
of such therapeutic methods. It is thus crucial to develop methods to either overcome
hypoxia or to increase therapeutic performance in hypoxic tumour models. Attempts
have been made to overcome hypoxia by reoxygenation of the tumour using materials
such as perfluorocarbon25, 26 and artificial red blood cell27 or introduce materials that can
generate oxygen endogenously such as catalase28-33 and MnO2.34-38 Some problem faced
include its dependence on the endogenous environment, unknown toxicity or
immunogenic effect from inorganic material as well as the need for stimuli or precursors
for reaction to proceed. Another approach is to harness the hypoxic environment and
design a hypoxia activated drug delivery system for cancer treatment. Hypoxia activated
prodrugs (HAP) has been designed to undergo oxygen-inhibited enzymatic reduction.39

131
Upon bio reduction of the HAP, it would generate toxic radicals.40-43 Such HAP is
hydrophilic and selective to hypoxic cells. Many researches have combined oxygen
consuming photodynamic therapy (PDT) with hypoxia activated prodrug for fabrication
of such system. In a work by Liu et al.,44 a nanosystem that contains upconversion
nanoparticle (UCNP), photosensitizer and tirapazamine (TPZ) was developed. The
UCNP was able to convert near infrared (NIR) light to uv-visible light to activate the
photosensitizer which resulted in a depletion of oxygen. TPZ could then undergo a bio
reduction to give its toxic radical. However, the efficiency of UCNP in light conversion
and the depth of penetration of light remain a problem. Furthermore, UCNP being made
of rare earth metal, could induce unknown toxicity and thus must be reconsidered when
used.
In recent years, protein therapeutics is preferred over small therapeutic cargoes
because of its numerous advantages such as high selectivity and less side effects due to
low immunogenicity. 45 Proteins can be in a form of therapeutics, diagnostics or vaccine
type. Because of the Warburg effect in cancer, there is a large uptake of glucose in
cancer cells. 46-48 Glucose oxidase (GOD) enzyme, a natural enzyme found in fungi and
insects is able to catalyze the D-glucose into gluconic acid and H2O2 in the presence of
O2 as an electron acceptor.49 GOD as a therapeutic enzyme can lead to glucose
consumption which in turn produce reactive oxygen species in this case H2O2.50-53 By
reducing the glucose consumption of cancer cells, tumour growth can be impeded.
Furthermore, it depletes the oxygen in the cells. However, such treatment needs to be
enhanced by combination with another form of therapy. The reduction in oxygen due to
the application of GOD can lead to a tumour hypoxia. In a work by Zhang et al.,52
liposome loaded GOD was applied to deplete the glucose and oxygen in tumour. After
which, a hypoxia drug AQ4N was loaded into the liposome and the drug can be activated
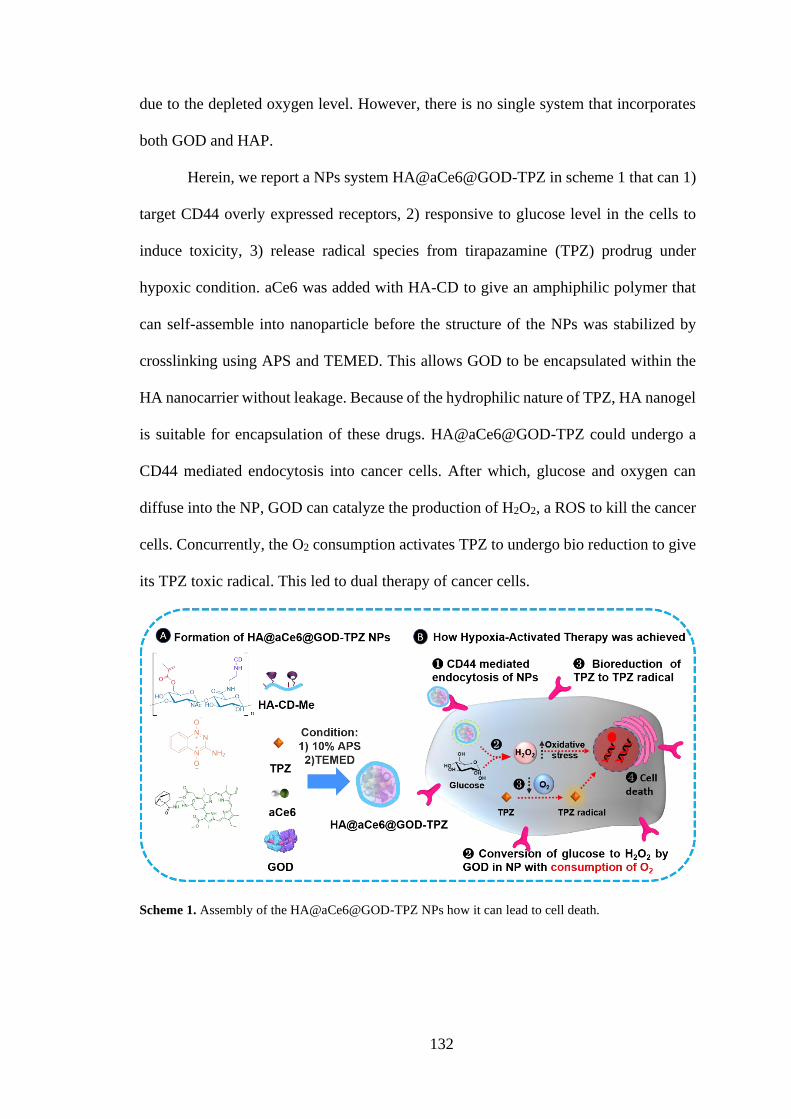
132
due to the depleted oxygen level. However, there is no single system that incorporates
both GOD and HAP.
Herein, we report a NPs system HA@aCe6@GOD-TPZ in scheme 1 that can 1)
target CD44 overly expressed receptors, 2) responsive to glucose level in the cells to
induce toxicity, 3) release radical species from tirapazamine (TPZ) prodrug under
hypoxic condition. aCe6 was added with HA-CD to give an amphiphilic polymer that
can self-assemble into nanoparticle before the structure of the NPs was stabilized by
crosslinking using APS and TEMED. This allows GOD to be encapsulated within the
HA nanocarrier without leakage. Because of the hydrophilic nature of TPZ, HA nanogel
is suitable for encapsulation of these drugs. HA@aCe6@GOD-TPZ could undergo a
CD44 mediated endocytosis into cancer cells. After which, glucose and oxygen can
diffuse into the NP, GOD can catalyze the production of H2O2, a ROS to kill the cancer
cells. Concurrently, the O2 consumption activates TPZ to undergo bio reduction to give
its TPZ toxic radical. This led to dual therapy of cancer cells.
Scheme 1. Assembly of the HA@aCe6@GOD-TPZ NPs how it can lead to cell death.

133
4.2 Materials and Methods
4.2.1 Materials
Sodium hyaluronate (Mw = 8 to 12 kDa), 1-adamantanecarbonyl chloride and
chlorin e6 were purchased from Aaron Pharmatech Ltd (Shanghai, China). Methyl
iodide, Amberlite® IR120 hydrogen form, Hydroxybenzotriazole hydrate, Methacrylic
acid and Glucose oxidase (GOD) were purchased from Sigma Aldrich. N-(3-
Dimethylaminopropyl)-N’-ethylcarbodiimide hydrochloride (EDC.HCl),
Triethylamine, trifluoroacetic acid β-cyclodextrin (β-CD), N,N,N',N'-
tetramethylethane-1,2-diamine (TEMED), ammonium persulfate (APS) and thiazolyl
blue tetrazolium hydrate (MTT) were purchased from Tokyo Chemical Industry. MDA-
MB-231cells were obtained from American Type Culture Collection (ATCC). Dialysis
membrane Spectra/Por 6 (MWCO:1 kDa) was purchased from Thermo Fisher Scientific
Pte Ltd. All chemicals were of analytical grade and used without further purification if
not indicated otherwise.
4.2.2 Instruments
1H NMR spectra were probed on a Bruker BBFO400 spectrometer, and D2O, d-
DMSO, CDCl3 were used as the deuterated solvent. The UV-vis-NIR absorption and
fluorescence emission spectra were measured using Shimadzu UV-3600 and Shimadzu
RF5301PC spectrophotometer, respectively. Transmission electron microscopy (TEM)
images were taken at an acceleration voltage of 100 kV on JEOL JEM-1400.
Hydrodynamic diameters and zeta potential values were measured at 25oC by a Malvern
Zetasizer Nano-S system. Confocal laser scanning microscopy (CLSM) images were
acquired by ZEISS LSM 800 Confocal Laser Scanning Microscope. Flow cytometry
were taken on BD LSRFortessa™ X-20 cell analyzer.

134
4.2.3 Synthesis of HA-Me-CD
Scheme 2. Synthesis procedure of HA-Me-CD polymer.
Methacrylated HA was prepared by following previous protocol. HA (8 to 15
kDa, 2.5 g) was dissolved in 100 mL of DI water and stirred in ice bath. The pH of the
solution was adjusted to 8.5 using 5.0 NaOH. Methacrylic acid (MA, 5.6 mL was added)
and the pH was adjusted repeated to 8.0 to 8.5 using a syringe pump for at least 4 h. The
reaction was then stirred at 4oC overnight. After which, acetone was added to precipitate
to give HA-Me, washed with ethanol, and dissolve in water. The solution was dialyzed
against DI water for 3 days and lyophilized to give HA-Me. After which HA-Me (100
mg) was dissolved in DMSO (10 mL) and EDC.HCl (0.232 g) was added in and stirred
for 2 h. After which, HOBt (0.162 g) and CD-NH2 (0.8139 g) was added. Reaction was
left to stir for 24 h before it was dialyzed against DI water using MWCO 2 kDa to yield
HA-Me-CD. The polymer was characterized by NMR.
4.2.4 Synthesis of ada-Ce6
Scheme 3. Synthesis procedure of aCe6. Conditions: (a) TEA in anhydrous DCM, 0oC (b) TFA in
anhydrous DCM, 3 h at r.t.p. (c) 1.EDC, TEA, 2 h follow by CH3I and K2CO3, 2 h.
Synthesis procedure of this molecule can be found in Chapter 3, Section 3.2.3.

135
4.2.5 Synthesis of HA@aCe6@GOD-TPZ
HA-Me-CD (1 mg/ mL, 5 mL) in PBS was gently ultrasonicated for ten min
under an ice bath by an ultrasonicator then filtered through a 0.22 μm microfilter and
store at 4oC until further use. In order to fabricate HA@aCe6@GOD-TPZ, HA-Me-CD
(800 μL) dissolved in PBS was added to GOD (10 U/ mL in DI water, 100 μL) and TPZ
(1 mg/mL in DMSO, 32 μL) and then stirred in ice bath for 1 h. After which, aCe6 (1000
μM, 16 μL) was added and stirred for 1 h in the ice bath. Then 10% APS and TEMED
(10 μL and 1 μL) was added to react for another 1 h at r.t.p.. After which, mixture was
dialyzed against PBS for 4 h to give HA@aCe6@GOD-TPZ.
The loading efficiency of HA@aCe6@GOD-TPZ can be calculated using the
following equation:
𝐿𝑜𝑎𝑑𝑖𝑛𝑔 𝑒𝑓𝑓𝑖𝑐𝑖𝑒𝑛𝑐𝑦 𝑜𝑓 𝑇𝑃𝑍 (%) =𝑇𝑃𝑍 𝑙𝑜𝑎𝑑𝑒𝑑
𝑇𝑃𝑍 𝑎𝑑𝑑𝑒𝑑 × 100
The amount of TPZ was calculated by taking the absorbance at 460 nm and
substituting it into the linear regression line from the standard calibration curve of TPZ.
The loading capacity of TPZ was calculated using the following equation:
𝐿𝑜𝑎𝑑𝑖𝑛𝑔 𝑐𝑎𝑝𝑎𝑐𝑖𝑡𝑦 (%) =𝑀𝑎𝑠𝑠 𝑜𝑓 𝑇𝑃𝑍
𝑀𝑎𝑠𝑠 𝑜𝑓 𝑁𝑎𝑛𝑜𝑝𝑎𝑟𝑡𝑖𝑐𝑙𝑒𝑠 × 100
HA@aCe6@GOD was synthesized using same procedure as
HA@aCe6@GOD-TPZ but DMSO (32 μL) was added in replace of TPZ.
4.2.6 Evaluation of GOD activity in NPs
The change in concentration of oxygen was measured by incubating different
sample GOD, HA@aCe6@GOD and HA@aCe6@GOD-TPZ where ([GOD]=100
mU/mL) with glucose (4 mg/mL) and the oxygen was recorded every thirty seconds.

136
The change in H2O2 was measured using hydrogen peroxide kit. Fix
concentration of GOD was incubated with different concentrations of glucose. The H2O2
was measured 5 minutes after incubation.
4.2.7 Cellular experiments
Breast cancer MDA-MB-231 cells were obtained from American Type Culture
Collection (ATCC) and cultured in DMEM High glucose containing 10% fetal bovine
serum (FBS) and 1% penicillin/ streptomycin at 37 °C under 5% CO2. To study the
cytotoxicity of cells incubated with cell killing efficacy of those different concentrations
HA@aCe6@GOD-TPZ, HA@aCe6@GOD NPs and free TPZ at both normoxic (74%
N2, 5% CO2, 21% O2) and hypoxic (94% N2, 5% CO2, 1% O2) conditions, MDA-MB-
231 cells were seeded into 96-well cell culture plates at cell density of 10000/ well until
adherent and incubated with the respective normoxic and hypoxic conditions for 24 h.
The cells were then incubated with various concentrations of HA@Ce6@GOD-TPZ,
HA@Ce6@GOD NPs and free TPZ for 24 h before cell viabilities are determined. The
standard thiazolyl tetrazolium (MTT, Sigma Aldrich) assay was carried out in both
experiments to determine the cell viabilities relative to control untreated cells.
4.3 Results and discussions
4.3.1 Synthesis of HA-Me-CD
The synthesis of HA-Me-CD was successful as characterized by 1H NMR in
Figure 1. The degree of conjugation was calculated by taking integration of the anomeric
proton of β-CD (δ = ∼ 5.10 ppm [7H, -CH-]) and the ethylene proton of Me (δ = ∼ 5.77
ppm [1H, =CH]) with the characteristic peak of the N-acetyl group in HA (δ =∼ 2.03
ppm [3H, -COCH3-]) to give 12.4% and 46% of conjugation respectively.
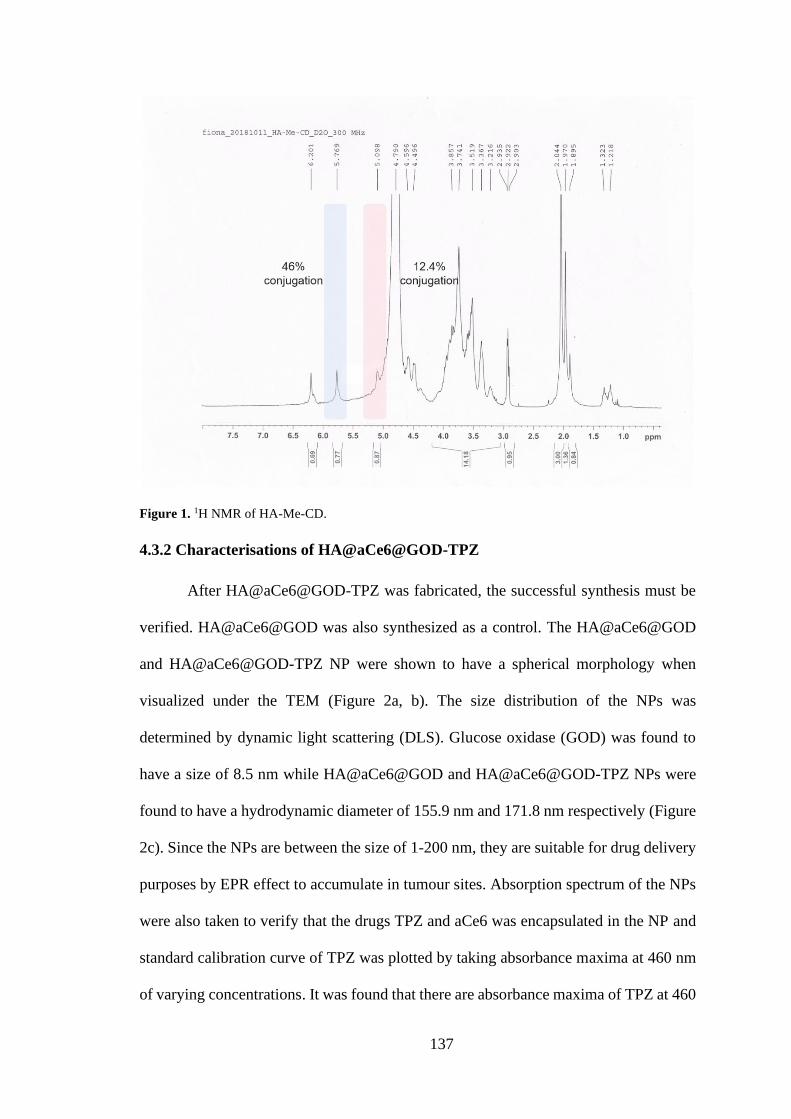
137
Figure 1. 1H NMR of HA-Me-CD.
4.3.2 Characterisations of HA@aCe6@GOD-TPZ
After HA@aCe6@GOD-TPZ was fabricated, the successful synthesis must be
verified. HA@aCe6@GOD was also synthesized as a control. The HA@aCe6@GOD
and HA@aCe6@GOD-TPZ NP were shown to have a spherical morphology when
visualized under the TEM (Figure 2a, b). The size distribution of the NPs was
determined by dynamic light scattering (DLS). Glucose oxidase (GOD) was found to
have a size of 8.5 nm while HA@aCe6@GOD and HA@aCe6@GOD-TPZ NPs were
found to have a hydrodynamic diameter of 155.9 nm and 171.8 nm respectively (Figure
2c). Since the NPs are between the size of 1-200 nm, they are suitable for drug delivery
purposes by EPR effect to accumulate in tumour sites. Absorption spectrum of the NPs
were also taken to verify that the drugs TPZ and aCe6 was encapsulated in the NP and
standard calibration curve of TPZ was plotted by taking absorbance maxima at 460 nm
of varying concentrations. It was found that there are absorbance maxima of TPZ at 460
138
nm and aCe6 at 400 nm (Figure 2e). This shows that both TPZ and aCe6 were present
in the NP. The loading efficiency of TPZ was found to be 63.3% and the loading
capacity of TPZ was 2.0%. After the successful fabrication of the NPs were confirmed,
the abilities to produce H2O2 as the ROS species must be verified. Glucose and oxygen
in the cells are catalyzed by GOD to produce ROS. This process thus depletes the
amount of O2 in the cells. Fixed amount of glucose was incubated with the same [GOD]
and the amount of dissolved O2 was measured. It was found that the [O2] decreases with
increasing incubation concentration. After the encapsulation of GOD in
HA@aCe6@GOD and HA@aCe6@GOD-TPZ NP, there is no obvious decrease in
GOD activity as shown by the similar decreasing O2 concentration trend. The depletion
of O2 is important as it means that the drug TPZ can be activated in presence of low
oxygen level. Similarly, the concentration of H2O2 produced was measured using
Pierce™ Quantitative Peroxide Assay Kit. The free GOD, HA@aCe6@GOD and
HA@aCe6@GOD-TPZ was incubated with glucose at varying concentration for five
minutes. The amount of H2O2 were calculated from the standard calibration curve
obtained from known concentration of H2O2 (Figure 2g). It was found that there was an
increasing trend in the H2O2 produced with no significant difference in the two different
samples (Figure 2h). This shows that with glucose and oxygen, depletion of glucose and
oxygen by GOD does produce H2O2 and that it is dependent on glucose concentrations.
Encapsulation of GOD in NP does not affect the capability of GOD for catalysis.

139
Figure 2. Characterisations of HA@aCe6@GOD and HA@aCe6@GOD-TPZ. TEM images of (a)
HA@aCe6@GOD and (b) HA@aCe6@GOD-TPZ. (c) Dynamic Light Scattering (DLS) of GOD and
NPs. (d) Standard calibration curve of TPZ (e) Absorbance curves of TPZ and the NPs. (f) The change in
oxygen when glucose (4 mg/mL) is incubated with free GOD and the NPs over 5 minutes. (g) Standard
calibration curve of H2O2. (h) The change in H2O2 concentrations with GOD and the NPs are incubated
with increasing glucose concentration (0, 0.156, 0.0313, 0.0625, 0.125, 0.25 mg/mL).
4.3.3 Cellular uptake and targeting effect on CD44 receptors
The HA@aCe6@GOD-TPZ NPs were then incubated with MDA-MB-231 cells
under both normoxic as well as hypoxic conditions for different time intervals and
visualized using the confocal microscope at the excitation wavelength of aCe6. It was

140
found to have a time dependent cellular uptake (Figure 3). Comparing the cells at 2 h
and 4 h interval, the fluorescence intensities of the cells at 4 h incubation is greater than
that of 2 h. HA competitive assay was also used to verify the targeting effect of
HA@aCe6@GOD-TPZ in CD44+ MDA-MB-231 cells. Free HA (10 mg/mL) was first
incubated for 2 h and then the NP was added. The fluorescence of cells preincubated
with HA was much less than as compared to cells incubated with NP for the same
incubation time. This shows that CD44 mediated endocytosis has increased the cellular
uptake of NPs.
Figure 3. Fluorescence images of cellular uptake of HA@aCe6@GOD-TPZ at different time interval of
2 h and 4 h. A separate set of cells were pre incubated with free HA and then incubated with NP for 2 h
for targeting effect. Scale bar: 100 μm.
4.3.4 ROS detection and In vitro cytotoxicity
When incubating the cells with HA@aCe6@GOD and HA@aCe6@GOD-TPZ,
they should be able to produce H2O2 which is a type of ROS. ROS can be detected by
general ROS indicator carboxy-H2DCFDA, where the nonfluorescent molecule is
converted to a green-fluorescent form in presence of ROS. The results showed that ROS
was produced when the cells were incubated with HA@aCe6@GOD and
HA@aCe6@GOD-TPZ at both normoxic and hypoxic conditions (Figure 4a).
Live/dead assay was also carried out. Live cells were stained using calcein-AM to give

141
green fluorescence while dead cells were stained using propidium iodide to give red
fluorescence. The results indicated that the greatest cellular apoptosis was detected when
incubated with the NPs at normoxic conditions (Figure 4b). When the cells were in
hypoxic condition, HA@aCe6@GOD-TPZ NPs possessed more cytotoxicity as
compared to HA@aCe6@GOD as shown in Figure 4c. This is because the TPZ is also
able to convert into radical under hypoxic condition. This causes the amount of ROS in
the cells to exceed the threshold in which the cells can take and thus leading to apoptosis.
Figure 4. (a) Detection of ROS using carboxy-DCFDA (green). Scale bar: 100 μm. (b) Live/dead assay
of MDA-MB-231 cells with different treatments (i.e. PBS, HA@aCe6@GOD and HA@aCe6@GOD-
TPZ. Scale bar: 200 μm.
The NPs were then incubated with MDA-MB-231 cells to test its cytotoxicity as
shown in Figure 5. In general, TPZ gave low cytotoxicity even at high concentration of
9 μM under normoxic conditions. This is because the reduction of the drug can reverse
to its non-toxic form when there is O2 in the cells and thus TPZ is unable to convert into
its toxic radical form to induce much apoptosis.
Comparing both HA@aCe6@GOD and HA@aCe6@GOD-TPZ NPs under
normoxic condition (Figure 5a), low concentration of GOD (6.25 mU/mL) was needed
to induce high cytotoxicity, giving low cell viability of less than 20%. This is because
both glucose and oxygen are in excess amount, which drives the catalytic reaction

142
between glucose and oxygen in the medium as well as the GOD in these NPs to produce
sufficient H2O2, which killed the MDA-MB-231 cells. In contrast, under hypoxic
condition, even high concentration of GOD (25 mU/mL) were not enough to induce
high cytotoxicity (Figure 5b). Cell viability remained high above 80%. When the system
is coupled with TPZ (2.3 μM), the cytotoxicity was increased as evident by the drastic
decrease in cell viability to be less than 20%. Free TPZ at this concentration gave a high
cell viability of more than 80%. This is because even though the cells are hypoxic (1%
O2), it is not low enough to induce toxicity in the cells with solely TPZ. This shows that
GOD is needed to deplete the amount of oxygen in cells in order for TPZ to be reduced
to its toxic radical, killing the cancer cells.
Figure 5. Cell viabilities of MDA-MB-231 when treated with different NPs at various concentrations for
24 h under (a) normoxic and (b) hypoxic conditions.
Apoptotic studies done using PI and Annexin IV FITC for labelling of cells also
showed similar results as shown in Figure 6 below. When cells were incubated with
HA@aCe6@GOD-TPZ NPs, the apoptotic cells detected were the highest for both
normoxic and hypoxic conditions. At normoxic condition, HA@aCe6@GOD and
HA@aCe6@GOD-TPZ NPs were able to cause similar amount of apoptotic cells. At
hypoxic condition, the HA@aCe6@GOD-TPZ performed better than
HA@aCe6@GOD which shows that TPZ was effective in causing apoptosis in cells.

143
Figure 6. Apoptosis assay by flow cytometry under normoxic (first row) and hypoxic (second row)
conditions. [GOD] = 6.25 mU/mL.
4.4 Conclusion
In conclusion, HA@aCe6@GOD-TPZ NPs was fabricated successfully and
shown to produce H2O2 from glucose and oxygen. This depleted the oxygen within the
cells. The nanocarrier is also able to encapsulate hydrophilic TPZ for hypoxia activated
treatment. Activation of TPZ drug to give TPZ radical was toxic to the cells and
selectively when O2 was depleted in the cells by GOD. This resulted in high cytotoxicity
in MDA-MB-231 cells.

144
References
1. Thomlinson, R. H. J. Clin. Pathol. Suppl (R. Coll. Pathol.) 1977, 11, 105-113.
2. Chaplin, D. J.; Durand, R. E.; Olive, P. L. Int. J. Radiat. Oncol. Biol. Phys. 1986,
12, 1279-1282.
3. Brown, J. M.; Giaccia, A. J. Int. J. Radiat. Biol. 1994, 65, 95-102.
4. Ryan, H. E. Cancer Res. 2000, 60, 4010-4015.
5. Movsas, B. Am. J. Clin. Oncol. 2001, 24, 458-461.
6. Höckel, M.; Vaupel, P. J. Natl. Cancer Inst. 2001, 93, 266-276.
7. Bussink, J.; Kaanders, J. H. A. M.; van der Kogel, A. J. Radiother. Oncol. 2003,
67, 3-15.
8. Talks, K. L. Am. J. Pathol. 2000, 157, 411-421.
9. Kamura, T. Proc. Natl. Acad. Sci. U.S.A. 2000, 97, 10430-10435.
10. Volm, M.; Koomagi, R. Anticancer Res. 2000, 20, 1527-1533.
11. Maxwell, P. H.; Pugh, C. W.; Ratcliffe, P. J. Curr. Opin. Genet. Dev. 2001, 11,
293-299.
12. Semenza, G. L. Nature Rev. Cancer 2003, 3, 721-732.
13. Cramer, T. Cell 2003, 112, 645-657.
14. Koshiji, M. EMBO J. 2004, 23, 1949-1956.
15. Denko, N. C. Nature Rev. Cancer 2008, 8, 705-713.
16. Ji, R.-C. Cancer Lett. 2014, 346, 6-16.
17. Nardinocchi, L.; Puca, R.; Sacchi, A.; D'Orazi, G. Mol. Cancer 2009, 8, 1.
18. Li, J.; Shi, M.; Cao, Y.; Yuan, W.; Pang, T.; Li, B.; Sun, Z.; Chen, L.; Zhao, R.
C. Biochem. Biophys. Res. Commun. 2006, 342, 1341-1351.
19. Rohwer, N.; Cramer, T. Drug Resist. Updat. 2011, 14, 191-201.

145
20. Flamant, L.; Notte, A.; Ninane, N.; Raes, M.; Michiels, C. Mol. Cancer 2010, 9,
191-191.
21. Liu, X.-W.; Su, Y.; Zhu, H.; Cao, J.; Ding, W.-J.; Zhao, Y.-C.; He, Q.-J.; Yang,
B. Pharmacol. Res. 2010, 62, 416-425.
22. Teicher, B. A. Cancer Metastasis Rev. 1994, 13, 139-168.
23. Henderson, B. W.; Fingar, V. H. Cancer Res. 1987, 47, 3110-3114.
24. Chapman, J. D.; McPhee, M. S.; Walz, N.; Chetner, M. P.; Stobbe, C. C.;
Soderlind, K.; Arnfield, M.; Meeker, B. E.; Trimble, L.; Allen, P. S. J. Natl.
Cancer Inst. 1991, 83, 1650-1659.
25. Song, G.; Ji, C.; Liang, C.; Song, X.; Yi, X.; Dong, Z.; Yang, K.; Liu, Z.
Biomaterials 2017, 112, 257-263.
26. Zhou, J.; Xue, C.; Hou, Y.; Li, M.; Hu, Y.; Chen, Q.; Li, Y.; Li, K.; Song, G.;
Cai, K.; Luo, Z. Biomaterials 2019, 197, 129-145.
27. Tang, W.; Zhen, Z.; Wang, M.; Wang, H.; Chuang, Y.-J.; Zhang, W.; Wang, G.
D.; Todd, T.; Cowger, T.; Chen, H.; Liu, L.; Li, Z.; Xie, J. Adv. Funct. Mater.
2016, 26, 1757-1768.
28. Song, G.; Chen, Y.; Liang, C.; Yi, X.; Liu, J.; Sun, X.; Shen, S.; Yang, K.; Liu,
Z. Adv. Mater. 2016, 28, 7143-7148.
29. Zhang, R.; Song, X.; Liang, C.; Yi, X.; Song, G.; Chao, Y.; Yang, Y.; Yang, K.;
Feng, L.; Liu, Z. Biomaterials 2017, 138, 13-21.
30. Chen, Q.; Chen, J.; Liang, C.; Feng, L.; Dong, Z.; Song, X.; Song, G.; Liu, Z. J.
Control. Release 2017, 263, 79-89.
31. Liu, C. P.; Wu, T. H.; Liu, C. Y.; Chen, K. C.; Chen, Y. X.; Chen, G. S.; Lin, S.
Y. Small 2017, 13.

146
32. Wang, H.; Chao, Y.; Liu, J.; Zhu, W.; Wang, G.; Xu, L.; Liu, Z. Biomaterials
2018, 181, 310-317.
33. Phua, S. Z. F.; Yang, G.; Lim, W. Q.; Verma, A.; Chen, H.; Thanabalu, T.; Zhao,
Y. ACS Nano 2019, 13, 4742-4751.
34. Fan, W.; Bu, W.; Shen, B.; He, Q.; Cui, Z.; Liu, Y.; Zheng, X.; Zhao, K.; Shi, J.
Adv. Mater. 2015, 27, 4155-4161.
35. Gordijo, C. R.; Abbasi, A. Z.; Amini, M. A.; Lip, H. Y.; Maeda, A.; Cai, P.;
O'Brien, P. J.; DaCosta, R. S.; Rauth, A. M.; Wu, X. Y. Adv. Funct. Mater. 2015,
25, 1858-1872.
36. Yang, G.; Xu, L.; Chao, Y.; Xu, J.; Sun, X.; Wu, Y.; Peng, R.; Liu, Z. Nat.
Commun. 2017, 8, 902.
37. Ai, X.; Hu, M.; Wang, Z.; Lyu, L.; Zhang, W.; Li, J.; Yang, H.; Lin, J.; Xing, B.
Bioconjug. Chem. 2018, 29, 928-938.
38. Yang, G.; Zhang, R.; Liang, C.; Zhao, H.; Yi, X.; Shen, S.; Yang, K.; Cheng, L.;
Liu, Z. Small 2018, 14, 1702664.
39. Hunter, F. W.; Wouters, B. G.; Wilson, W. R. Br. J. Cancer 2016, 114, 1071.
40. Brown, J. M. Br. J. Cancer 1993, 67, 1163-1170.
41. Dorie, M. J.; Brown, J. M. Cancer Res. 1993, 53, 4633-4636.
42. Peters, K. B.; Brown, J. M. Cancer Res. 2002, 62, 5248-5253.
43. Reddy, S. B.; Williamson, S. K. Expert Opin. Invest. Drugs 2009, 18, 77-87.
44. Liu, Y.; Liu, Y.; Bu, W.; Cheng, C.; Zuo, C.; Xiao, Q.; Sun, Y.; Ni, D.; Zhang,
C.; Liu, J.; Shi, J. Angew. Chem. Int. Ed. 2015, 54, 8105-8109.
45. Leader, B.; Baca, Q. J.; Golan, D. E. Nat. Rev. Drug Discovery 2008, 7, 21.
46. Warburg, O. Science 1956, 123, 309-314.
47. Liberti, M. V.; Locasale, J. W. Trends Biochem. Sci. 2016, 41, 211-218.

147
48. Vander Heiden, M. G.; Cantley, L. C.; Thompson, C. B. Science 2009, 324,
1029-1033.
49. Fu, L.-H.; Qi, C.; Lin, J.; Huang, P. Chem. Soc. Rev. 2018, 47, 6454-6472.
50. Li, J.; Dirisala, A.; Ge, Z.; Wang, Y.; Yin, W.; Ke, W.; Toh, K.; Xie, J.;
Matsumoto, Y.; Anraku, Y.; Osada, K.; Kataoka, K. Angew. Chem., Int. Ed. Engl.
2017, 56, 14025-14030.
51. Zhao, W.; Hu, J.; Gao, W. ACS Appl. Mater. Interfaces 2017, 9, 23528-23535.
52. Zhang, R.; Feng, L.; Dong, Z.; Wang, L.; Liang, C.; Chen, J.; Ma, Q.; Zhang, R.;
Chen, Q.; Wang, Y.; Liu, Z. Biomaterials 2018, 162, 123-131.
53. Fan, W.; Lu, N.; Huang, P.; Liu, Y.; Yang, Z.; Wang, S.; Yu, G.; Liu, Y.; Hu, J.;
He, Q.; Qu, J.; Wang, T.; Chen, X. Angew. Chem. Int. Ed. 2017, 56, 1229-1233.

148
Chapter 5 Conclusion
5.1 Conclusion
This dissertation describes the progresses and results of the work that were done
on usage of HA for various modality of cancer treatment which included the
chemotherapy and photodynamic therapy. In all three works, the usage of passive
targeting was harnessed by fabrication of polymeric NPs of suitable sizes for
accumulation at tumour site by enhanced permeation and retention effect. Furthermore,
active targeting of CD44 receptors was done by the utilization of HA. These systems
rendered efficient accumulation of NPs in MDA-MB-231 cells and tumour model in
BALB/c nude mice. Furthermore, in all three chapters, reactive oxygen species (ROS)
was harnessed. In the first work, HA-aPS-aCPT was fabricated for dual therapy in
tumours. HA was proven to be CD44 targeting. The singlet oxygen produced from the
adamantane modified porphyrin was used for both photodynamic therapy and the
cascaded release of chemotherapy drugs from the prodrug synthesized from
camptothecin. This system enabled multimodal therapy which led to ablation of tumour.
Subsequently, in the second work, HA-CAT@Ce6 NP was harnessed for overcoming
hypoxia in solid tumours. With the help of catalase for generation of in situ oxygen for
photodynamic therapy, hypoxia in tumours was alleviated which led to better
therapeutic efficacy. In the third project, HA@aCe6@GOD-TPZ NP was synthesized.
It was able to also target MDA-MB-231 cells. It was responsive to endogenous glucose
to cause hypoxia in the cells. When there was excessive glucose in the cells, H2O2 was
produced to cause an elevated amount of ROS. In the process, O2 was consumed leading
to hypoxia in the tumour. This activated the TPZ drug which was hypoxia responsive.

149
Production of TPZ toxic radical further increased the cytotoxicity of the NP. This led to
dual modal killing of the cells.
5.2 Future Outlook
Despite much work being done for investigation of HA as a polymer in oncology,
it is still far from clinical application. The biosafety and biodistribution of NPs still need
to be evaluated in clinical settings. Furthermore, the long-term side effects of such
system must be evaluated. The effect of HA should be further evaluated. Studies on HA
found that with HA polymers of a size of higher molecular weight (e.g. 107 kDa)
generally have anti-angiogenic and immunosuppressive properties while the lower
molecular weight (e.g. 20 kDa) counterparts are angiogenic, immune-stimulatory and
inflammatory material.1 Since different molecular weights of HA polymers have
different effects on its bioactivity in vivo, we suspect that other factors such as shape
and size should also affect their bioactivity and safety.
In all study, HA nanocarriers were able to selectively accumulate at the tumour
site due to the overly expressed CD44 receptors on tumour. The accumulation of HA
thus may be a double edge sword. While the utilisation of HA allowed therapeutic agents
to be successfully delivered into the tumour site, it may induce other unknown or
unexplored immune response. Thus, the effect of HA-aPS-aCPT NPs, HA-CAT@aCe6
NPs and HA@aCe6@GOD-TPZ NPs on metastasis as well as its effect on angiogenesis
and immune response of the biological system must be done systematically. This should
be an area for future exploration in development of HA-based NPs.

150
References
1. Swierczewska, M.; Han, H. S.; Kim, K.; Park, J. H.; Lee, S. Adv. Drug Delivery
Rev. 2016, 99, 70-84.
151
List of publications
1. Phua, S. Z. F.; Chen, X.; Lim, W. Q.; Yang, G.; Chen, H.; Zhang, Y.; Wijaya, C.
F.; Luo, Z.; Zhao, Y. Chem. Mater. 2019, 31 (9), 3349-3358.
2. Phua, S. Z. F.; Yang, G.; Lim, W. Q.; Verma, A.; Chen, H.; Thanabalu, T.; Zhao,
Y. ACS Nano 2019, 13 (4), 4742-4751.
3. Bai, L.; Phua, S. Z. F.; Lim, W. Q.; Jana, A.; Luo, Z.; Tham, H. P.; Zhao, L.; Gao,
Q.; Zhao, Y. Chem. Commun. 2016, 52 (22), 4128-4131.
4. He, T.; Gao, Y.; Sreejith, S.; Tian, X.; Liu, L.; Wang, Y.; Joshi, H.; Phua, S. Z. F.;
Yao, S.; Lin, X.; Zhao, Y.; Grimsdale, A. C.; Sun, H. Adv. Opt. Mater. 2016, 4 (5),
746-755.
5. Lim, W. Q.; Phua, S. Z. F.; Xu, H. V.; Sreejith, S.; Zhao, Y. Nanoscale 2016, 8
(25), 12510-12519.
6. Zheng, C.; Wang, Y.; Phua, S. Z. F.; Lim, W. Q.; Zhao, Y. ACS Biomater. Sci. Eng.
2017, 3 (10), 2223-2229.
7. Thomas, R.; Phua, S. Z. F.; Sreejith, S.; Zhao, Y.; Soh, C. B. Nanoscale 2017, 9
(40), 15356-15361.
8. Xiang, H.; Chen, H.; Tham, H. P.; Phua, S. Z. F.; Liu, J.-G.; Zhao, Y. ACS Appl.
Mater. Interfaces 2017, 9 (33), 27553-27562.
9. Xiang, H.-J.; Tham, H. P.; Nguyen, M. D.; Fiona Phua, S. Z.; Lim, W. Q.; Liu, J.-
G.; Zhao, Y. Chem. Commun. 2017, 53 (37), 5220-5223.
10. Liu, G.; Li, X.; Sheng, J.; Li, P.-Z.; Ong, W. K.; Phua, S. Z. F.; Ågren, H.; Zhu, L.;
Zhao, Y. ACS Nano 2017, 11 (12), 11880-11889.
11. Chen, H.; Jia, H.; Tham, H. P.; Qu, Q.; Xing, P.; Zhao, J.; Phua, S. Z. F.; Chen, G.;
Zhao, Y. ACS Appl. Mater. Interfaces 2017, 9 (28), 23536-23543.
152
12. Zhang, Y.; Yang, D.; Chen, H.; Lim, W. Q.; Phua, F. S. Z.; An, G.; Yang, P.; Zhao,
Y. Biomaterials 2018, 163, 14-24.
13. Zhou, J.; Li, M.; Lim, W. Q.; Luo, Z.; Phua, S. Z. F.; Huo, R.; Li, L.; Li, K.; Dai,
L.; Liu, J.; Cai, K.; Zhao, Y. Theranostics 2018, 8 (2), 518-532.
14. Su, Y.; Phua, S. Z. F.; Li, Y.; Zhou, X.; Jana, D.; Liu, G.; Lim, W. Q.; Ong, W. K.;
Yang, C.; Zhao, Y. Sci. Adv. 2018, 4(5), eaas9732. doi:10.1126/sciadv.aas9732
15. Su, Y.; Yu, J.; Li, Y.; Phua, S. F. Z.; Liu, G.; Lim, W. Q.; Yang, X.; Ganguly, R.;
Dang, C.; Yang, C.; Zhao, Y. Commun. Chem. 2018, 1 (1), 12.
16. Lim, W. Q.; Phua, S. Z. F.; Chen, H.; Zhao, Y. Chem. Commun. 2018, 54 (90),
12762-12765.
17. Xing, P.; Phua. S. Z. F.; Wei, X.; Zhao, Y. Adv. Mater. 2018, 1805175.
18. Xing, P.; Yang, C.; Wang, Y.; Phua, S. Z. F.; Zhao, Y. Adv. Funct. Mater. 2018, 28
(34), 1802859.
19. Xing, P.; Li, Y.; Wang, Y.; Li, P.-Z.; Chen, H.; Phua, S. Z. F.; Zhao, Y. Angew.
Chem. Int. Ed. 2018, 57 (26), 7774-7779.
20. Yang, G.; Phua, S. Z. F.; Bindra, A. K.; Zhao, Y. Adv. Mater. 2019, 31 (10),
1805730.
21. Chen, H.; Zeng, X.; Tham, H. P.; Phua, S. Z. F.; Cheng, W.; Zeng, W.; Shi, H.; Mei,
L.; Zhao, Y. Angew. Chem. Int. Ed. 2019, 58 (23), 7641-7646
22. Yang G.; Phua, S. Z. F.; Lim, W. Q.; Zhang, R.; Feng, L.; Liu, G.; Wu, H.; Bindra,
A. K.; Jana, D.; Liu, Z.; Zhao Y. L. Adv. Mater. 2019, 1901513.
23. Wang, D.; Wu, H.; Lim, W. Q.; Phua, S. Z. F.; Xu, P.; Chen, Q.; Guo, Z.; Zhao, Y.
L. Adv. Mater. 2019, 1901893
24. Xing, P.; Li, Y.; Xue, S.; Phua, S. Z. F.; Ding, C.; Chen, H.; Zhao, Y. J. Am. Chem.
Soc. 2019, 141 (25), 9946-9954

153
25. Lim, W. Q.; Phua, S. Z. F.; Zhao, Y. ACS Appl. Mater. Interfaces 2019, 1135,
31638-31648
26. Wang, Y.; Phua, S. Z. F.; Dong, G.; Liu, X.; He, B.; Zhai, Q.; Li, Y.; Zheng, C.; Quan,
H.; Li, Z.; Zhao, Y. L. Chem 2019, https://doi.org/10.1016/j.chempr.2019.07.019