faa safety briefing - may june 2012 · the may/june 2012 issue of faa safety briefing ... or use...
TRANSCRIPT

Your source for general aviation news and information
FAA SafetyBrieFingMay/June 2012
Federal AviationAdministration www.faa.gov/news/safety_briefing/

FeaturesWIND OVER THE BEACH
The Dawn of Aviation Weather 4
BY DAV ID HUGHES
H2-OH! How Water and Heat Create Haze, Humidity, and Hurricanes 8
BY JA MES W IL L I A MS
THE TERRIBLE Ts
Turbulence, Thunderstorms, and Tornadoes 12
BY JA MES W IL L I A MS
ROCKY MOUNTAIN HIGH
The Zen of Mountain Flying 16
BY SUSA N PA RSON
HIGHER THAN YOU THINK
The Deadly Cocktail of Density Altitude 19
BY JIM RE Y NOLDS
FEARSOMELY FOUL
Dealing with Fog, Freezing Precip, and Other Nasties from the North 22
BY TOM HOF F M A NN
DepartmentsJumpseat 1
ATIS 2
Aeromedical Advisory 6
Ask Medical Certification 7
Checklist 26
Nuts, Bolts, and Electrons 27
Angle of Attack 28
Vertically Speaking 29
Flight Forum 31
Postflight 32
FAA Faces Inside Back Cover
The May/June 2012 issue of FAA Safety Briefing focuses on
extreme weather Articles provide important tips on how
to detect, prepare, and avoid some of the more extreme
varieties of weather conditions you may encounter in your
region of the country as well as offer tools and resources for
improving general aviation safety
U.S. Departmentof Transportation
Federal Aviation Administration
ISSN: 1057-9648FAA Safety BriefingMay/June 2012 Volume 51/Number 3
Raymond H. LaHood Secretary of TransportationMichael Huerta Acting AdministratorMargaret Gilligan Associate Administrator for Aviation SafetyJohn M. Allen Director, Flight Standards ServiceMel O. Cintron Manager, General Aviation and Commercial DivisionSusan Parson EditorTom Hoffmann Managing EditorJames Williams Associate EditorMarco Marchegiani Art Director
Published six times a year, FAA Safety Briefing, formerly FAA Aviation News, promotes aviation safety by discussing current technical, regulatory, and procedural aspects affecting the safe operation and maintenance of aircraft. Although based on current FAA policy and rule interpretations, all material is advisory or informational in nature and should not be construed to have regulatory effect. Certain details of accidents described herein may have been altered to protect the privacy of those involved.
The FAA does not officially endorse any goods, services, materials, or prod-ucts of manufacturers that may be referred to in an article. All brands, product names, company names, trademarks, and service marks are the properties of their respective owners. All rights reserved.
The Office of Management and Budget has approved the use of public funds for printing FAA Safety Briefing.
CONTACT INFORMATIONThe magazine is available on the Internet at: http://www.faa.gov/news/safety_briefing/
Comments or questions should be directed to the staff by:
• E-mailing: [email protected]
• Writing: Editor, FAA Safety Briefing, Federal Aviation Administration, AFS-805, 800 Independence Avenue, SW, Washington, DC 20591
• Calling: (202) 385-9600
SUBSCRIPTION INFORMATIONThe Superintendent of Documents, U.S. Government Printing Office, sells FAA Safety Briefing on subscription and mails up to four renewal notices.
For New Orders: Subscribe via the Internet at http://bookstore.gpo.gov, tele-phone (202) 512-1800 or toll-free 1-866-512-1800, or use the self-mailer form in the center of this magazine and send to Superintendent of Documents, U.S. Government Printing Office, Washington, DC 20402-9371.
Subscription Problems/Change of Address: Send your mailing label with your comments/request to Superintendent of Documents, U.S. Government Printing Office, Contact Center, Washington, DC 20408-9375. You can also call (202) 512-1800 or 1-866-512-1800 and ask for Customer Service, or fax your information to (202) 512-2104.

May/June 2012 FAA Safety Briefing 1
JOH N M. A L L e Ndir ect or , f ligh t sta n da r ds serv ice
Don’t Dither with WeatherWe pilots pride ourselves on being decisive,
take-charge kind of people. And, for the most part, that’s exactly who we are. That’s why it’s so ironic to see how much many of us dither with decisions on weather, especially since that is so obviously an area where clear, take-charge decisions are both necessary and appropriate.
Over the years, I have had the privilege of flying over a wide range of places. The kind of wide-ranging weather that is the focus of this issue of FAA Safety Briefing naturally comes with wide-ranging terrain. I have vivid memories, for instance, of towering tropical thunderstorms that often popped up over and around Panama. The dry desert heat of the American Southwest introduced me to the perils of density altitude, and reinforced the importance of proper performance planning. I have rocked my way through terribly turbulent air, and warily kept watch for signs of ice accumulation on the airframe. No aviator could ever presume to have seen everything, but I have been privileged to see and experience a broad range of weather conditions.
What Makes Us Dally?So why do we aviators still come to grief in
weather? Based on my experience as a pilot, including many years of flying as an instructor and evaluator, I believe there are elements of the pilot personality profile that conspire to lead us astray.
First, we do tend to be decisive and take-charge people. We don’t like to admit there’s something we can’t handle. What to do? Remember that Mother Nature always wins weather arguments. As the editor has previously preached in these pages (see the July/August 2010 FAA Safety Briefing), an important part of weather decision-making is to consider whether, and then how, any given set of weather conditions matches with not just the experience and skill of the pilot, but also the performance capability of the specific aircraft to be flown that day. There are some conditions – icing is one – that are very likely to be beyond the capabilities of both pilot and aircraft. If you still don’t like saying that conditions are beyond
you, blame the airplane!A related element of the pilot personality is
pride. There’s nothing wrong with pride in being a pilot, and it is appropriate to be proud of what you’ve accomplished. But pride can slide into ego and, with apologies to Sigmund Freud, ego can degrade into id – the unconscious part of the mind that houses instinctive and sometimes unhealthy impulses.
Here’s an example of how pride and ego can get you into weather trouble. Your weather briefing reports one of the many hazardous conditions described in this issue. You know it ought to be a no-go decision. But then you watch another pilot blithely launch into those conditions. Thus begins the dither. Does a no-go decision make you a weather wimp? Didn’t you spend thousands on an instrument rating and new equipment for your airplane? And so it goes, until the pilot too often drifts into the wrong course of action.
Defeating the DitherHere are two ways to defeat the dither. First, use
established, written personal minimums to make the decision well in advance. If your personal minimums call for at least five miles visibility and the METAR gives you just three miles in haze, you already know it’s a no-go. The same principle applies to in-flight diversion decisions. If conditions fall below established personal minimums, it’s time to land and make a new plan.
A second anti-dithering tool is KARMA: Know the environment that affects your flight and ground operation; Analyze those conditions in terms of your personal minimums; Respect the reality of the weather; Make a decision based on informed and rational thinking; and Act decisively in accordance with that decision (and don’t overthink or second-guess).
In the spirit of promoting solid aviation citizenship, consider this benefit as well: Instead of being the pilot who leads others astray, you can be the one who provides a potentially life-saving example to others. And that’s good karma!
2 FAA Safety Briefing May/June 2012
A T I S Aviation News Roundup
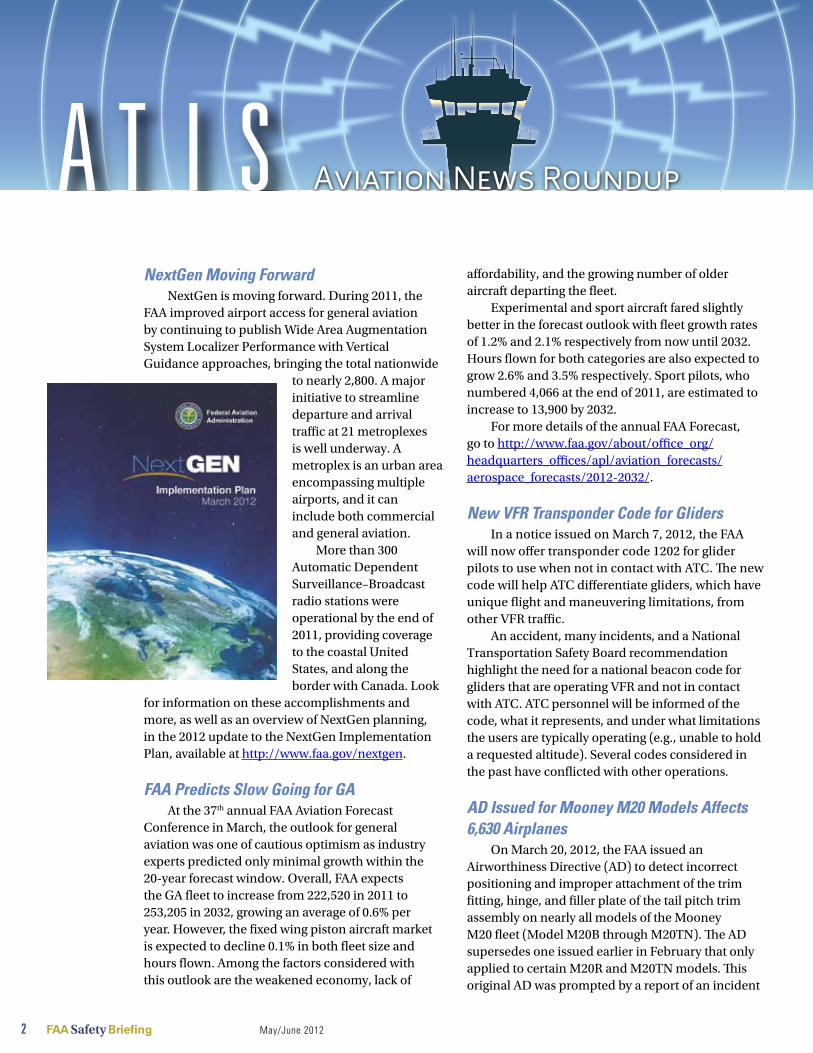
NextGen Moving Forward NextGen is moving forward. During 2011, the
FAA improved airport access for general aviation by continuing to publish Wide Area Augmentation System Localizer Performance with Vertical Guidance approaches, bringing the total nationwide
to nearly 2,800. A major initiative to streamline departure and arrival traffic at 21 metroplexes is well underway. A metroplex is an urban area encompassing multiple airports, and it can include both commercial and general aviation.
More than 300 Automatic Dependent Surveillance–Broadcast radio stations were operational by the end of 2011, providing coverage to the coastal United States, and along the border with Canada. Look
for information on these accomplishments and more, as well as an overview of NextGen planning, in the 2012 update to the NextGen Implementation Plan, available at http://www.faa.gov/nextgen.
FAA Predicts Slow Going for GAAt the 37th annual FAA Aviation Forecast
Conference in March, the outlook for general aviation was one of cautious optimism as industry experts predicted only minimal growth within the 20-year forecast window. Overall, FAA expects the GA fleet to increase from 222,520 in 2011 to 253,205 in 2032, growing an average of 0.6% per year. However, the fixed wing piston aircraft market is expected to decline 0.1% in both fleet size and hours flown. Among the factors considered with this outlook are the weakened economy, lack of
affordability, and the growing number of older aircraft departing the fleet.
Experimental and sport aircraft fared slightly better in the forecast outlook with fleet growth rates of 1.2% and 2.1% respectively from now until 2032. Hours flown for both categories are also expected to grow 2.6% and 3.5% respectively. Sport pilots, who numbered 4,066 at the end of 2011, are estimated to increase to 13,900 by 2032.
For more details of the annual FAA Forecast, go to http://www.faa.gov/about/office_org/headquarters_offices/apl/aviation_forecasts/aerospace_forecasts/2012-2032/.
New VFR Transponder Code for Gliders In a notice issued on March 7, 2012, the FAA
will now offer transponder code 1202 for glider pilots to use when not in contact with ATC. The new code will help ATC differentiate gliders, which have unique flight and maneuvering limitations, from other VFR traffic.
An accident, many incidents, and a National Transportation Safety Board recommendation highlight the need for a national beacon code for gliders that are operating VFR and not in contact with ATC. ATC personnel will be informed of the code, what it represents, and under what limitations the users are typically operating (e.g., unable to hold a requested altitude). Several codes considered in the past have conflicted with other operations.
AD Issued for Mooney M20 Models Affects 6,630 Airplanes
On March 20, 2012, the FAA issued an Airworthiness Directive (AD) to detect incorrect positioning and improper attachment of the trim fitting, hinge, and filler plate of the tail pitch trim assembly on nearly all models of the Mooney M20 fleet (Model M20B through M20TN). The AD supersedes one issued earlier in February that only applied to certain M20R and M20TN models. This original AD was prompted by a report of an incident

May/June 2012 FAA Safety Briefing 3
A T I S Aviation News Roundup
where the pilot of a Mooney M20TN experienced a significant pitch up attitude after take off due to an incorrectly installed filler plate on the tail trim assembly. To combat the pitch up forces, both the pilot and co-pilot had to use their knees to maintain proper forward pressure. Descent was only possible through a series of turns.
The revised AD was prompted by a similar unsafe condition found on a Mooney M20J model. The FAA then decided to expand the applicability of the AD to ensure the unsafe condition is addressed on all airplanes of the same type design.
The AD requires owners/operators to inspect the trim fitting, hinge, and filler plate of the tail pitch trim assembly for correct positioning and proper attachment, and inspect the Huck Bolt fasteners for proper security. Mooney has published new service information that includes the expanded airplane applicability and instructions for installing replacement fasteners, if necessary. With the revised AD, the FAA no longer requires you to report the results of your inspection. To view the AD, go to www.faa.gov and click the AD link from the Regulations and Policies menu. Search for AD 2012-05-09.
Revised Pilot Test Standards and New Airman Handbooks Available
The FAA’s Airman Testing Standards Branch released the following revised Practical Test Standards (PTS) and new aviation training handbooks:
• FAA-S-8081-14B, Private PTS for Airplane (Effective June 1, 2012)
• FAA-S-8081-12C, Commercial Pilot PTS for Airplane (Effective June 1, 2012)
• FAA-S-8081-25B, Parachute Rigger PTS (Effective July 1, 2012)
• FAA-H-8083-31, Aviation Maintenance Technician Handbook—Powerplant, Volumes 1 and 2 (This handbook replaces AC 65-12A, Airframe and Powerplant Mechanics Powerplant Handbook dated 1971.)
• FAA-H-8083-32, Aviation Maintenance Technician Handbook—Airframe, Volumes 1 and 2 (This handbook replaces AC 65-12A, Airframe and Powerplant Mechanics Airframe Handbook dated 1972.)
• FAA-H-8083-18, Flight Navigator Handbook
All publications are available on www.faa.gov under the Training and Testing menu. For PTS
guides, select Airman Testing, and for handbooks, select Training Resources and Guides. Printed copies should be available through the Government Printing Office (GPO) in May 2012. Also, be on the lookout for FAA publications to be made available in a downloadable eBook format later this year
Please email any questions or comments to: [email protected].
New General Aviation Center of ExcellenceThe FAA is planning to establish a new center
of excellence (COE) to focus on general aviation and its technological needs over the short and long term. The current COE for GA, led by Embry-Riddle Aeronautical University and comprising a team that includes the University of Alaska, the University of North Dakota and Wichita State University, is completing the requirements of its 10-year COE agreement.
The COE would be expected to research such GA-related topics as flight safety, communications, navigation, human factors, propulsion and structures, weather, airport technology, continued airworthiness, and system safety management. The winning team will perform various types of research, ranging from basic to applied, through a variety of analyses, development, and prototyping. The research will focus on anticipated issues, as well as existing ones.
Solicitations have been requested from colleges and universities with the administrator’s goal of selecting a team of research institutions by mid-May.
The FAA has a long and successful history of advancing safety, technology and other aviation issues in cooperation with institutions of higher learning through the formation of COEs. The agency works with more than 75 U.S. colleges and universities to foster important research.
Photo courtesy of Mooney Airplane Company

itty Hawk owes its place in aviation history to a weatherman stationed there. Though
the Wright Brothers were considering several locations on the East and West Coasts
for flying, they chose this particular spot because of a letter from an employee of
the U.S. Weather Bureau (the precursor to NOAA’s National Weather Service) reporting the
presence of steady wind over this mile-wide stretch of North Carolina beach.
What a difference a century makes. Today’s pilots can obtain accurate and dependable graphical weather information instantaneously on the Internet, thanks to a collaborative research effort involving the FAA, the National Center for Atmospheric Research (NCAR), and the National Weather Service (NWS). Using the NWS Aviation Digital Data Service (ADDS) platform, pilots can analyze weather along a route, using data available for various cruising altitudes at one hour intervals
over 12 hours. ADDS also offers information on current and forecast icing, turbulence, convection, wind, temperature and
other conditions. Better yet, today’s graphics reduce massive amounts of complex weather data into an easy-to-interpret visual format.
For example, ADDS can display icing and turbulence data with a map showing the type and severity of these phenomena at various altitudes along a planned route of flight. NCAR periodically updates these automated tools with funding and direction from the FAA’s Aviation Weather Research Program, which is also directing most NextGen weather research. (For more on these tools, see pages 15 and 25.)
These automated tools keep getting better as NCAR researchers work in conjunction with FAA NextGen efforts to transform weather information delivery over the next decade. A key objective of NextGen weather research is to provide weather information in four dimensions (4D), including time. Speaking of time, weather forecasting models supporting ADDS now update data hourly instead of every six hours.
One new addition to the ADDS tool is icing severity information. “This is a significant advance, because it includes not just the possible occurrence of icing but also the level of icing severity,” says Steve Abelman, Manager of the FAA’s Aviation Weather Research Team. Another fundamental improvement is turbulence forecasting. The FAA and NCAR have been working with several airlines to gather measurements of the effects of turbulence at jet cruising altitudes. NCAR project scientist Robert D. Sharman says the availability of turbulence data from airline aircraft coincided with the advent of computer models vast enough to mimic atmospheric behavior on super computers. “It’s been a major breakthrough to have a reliable data source for verification and tuning,” notes Sharman.
Some newly developed tools are being evaluated on an ADDS experimental website, available at
4 FAA Safety Briefing May/June 2012
Today’s graphics reduce massive amounts of complex weather data into an easy-to-interpret visual format.

http://weather.aero. Among them is the Helicopter Emergency Management System (HEMS). It has been published on the ADDS experimental website to gather comments from prospective users. HEMS could eventually be used by anyone who flies under VFR. The advantage for helicopter operators and aerial application is that HEMS provides an automated forecast of ceiling, visibility, wind, icing and turbulence conditions for off-airport locations such as an interstate, a farmer’s field, or an offshore oil rig. Researchers are using a combination of new algorithms and extrapolation from nearby airport observations and forecasts to produce this gridded information at high resolution.
The FAA’s planned transformation of aviation weather tools for this decade will bring even more accurate information to pilots and controllers. The FAA’s NextGen weather research effort aims to incorporate the use of web-enabled aviation weather information directly into decision making by pilots, controllers and others who manage air traffic by tailoring the data to what they need to know for a particular type of aircraft on a specific flight path. The idea is to provide instant access to an up-to-date snapshot of current and forecast conditions so everyone is on the same page in deciding how to deal with the current weather situation.
Like aviation itself, aviation weather has truly come a long way.
David Hughes is a writer/editor with the FAA’s Office of NextGen Performance and Outreach.
Learn More
NWS Aviation Digital Data Service (ADDS) http://www.aviationweather.gov/adds/
May/June 2012 FAA Safety Briefing 5
The first aviation weather briefing from J.J. Dosher of the Weather Bureau in Kitty Hawk, N.C., to the Wright brothers.

6 FAA Safety Briefing May/June 2012
Getting Into a Good RhythmDespite the many instances of sophomoric
humor, everyone has a biological clock. It’s called our circadian rhythm. Our circadian rhythms may have originated in the very early days of single-cell life to protect replicating DNA from high ultraviolet radiation during daytime. However they started, our circadian rhythm is best described as an internal biological clock that regulates our body functions based on our wake/sleep cycle.
Circadian rhythms are not only important in determining sleep cycles, but also in feeding patterns. There are clear patterns of brain wave activity, hormone production, cell regeneration, and other biological activities linked to these daily cycles.
These activities mostly work together like a finely-tuned watch that must be maintained to operate within normal working parameters. But we often bring disruptions on ourselves with such things as self-imposed stress. Though we scramble to get everything back to normal, the act of disturbing the body’s intricate clockwork can start a chain of reactions that disrupt its daily functions. A variety of negative effects can occur and some can pose safety-of-flight issues for pilots.
Circadian Rhythm DisruptionThe exact duration of our circadian rhythm
varies and can be slightly altered. However, recent research suggests that the ideal rhythm is actually 25 hours. Normal circadian rhythms are naturally altered as one ages, including changes in sleep patterns with respect to earlier onset of sleepiness, early-morning awakenings, and increased need for daytime napping.
Any time alteration, interruption, or disruption of the normal 25-hour circadian rhythm is likely to create some kind of physiological and/or behavioral impacts. The medical and scientific community uses the term “circadian rhythm disruption,” or CRD to describe this phenomenon.
People suffering from CRD may experience one or more of the following symptoms:
• Difficulty falling and staying asleep
• Late-night insomnia
• Increased daytime sleepiness
• A general lack of energy in the morning
• An increase of energy at night
• Difficulty concentrating, being alert, or accomplishing mental tasks
• Oversleeping and trouble getting up
• Increased negative moods
CRD-induced fatigue that goes untreated or ignored will almost inevitably have both physiological and psychological ramifications that not only can jeopardize your personal health, but can also become a safety-of-flight issue. To understand what that means, consider just a few of the better-known issues that can adversely affect flight safety. The list includes: increased reaction time; decreased attention span; impaired memory; and sense of personal isolation.
Coping with CRDHere are a few tips for dealing with CRD during
your aviation activities.
• Always attempt to sleep well before any flight.
• When you’re away from home, try to get as much sleep as you would normally.
• If you’re changing time zones, try to stay on your original time zone for shorter stays, and try to get more sleep when possible.
• Use caffeine strategically to combat circadian rhythm sleepiness.
You can also employ the technique of strategic napping – just not while at the controls, of course. A better plan may be to just reschedule the flight if you feel tired.
Frederick E. Tilton, M.D., M.P.H., received both an M.S. and an M.D. degree from the University of New Mexico and an M.P.H. from the University of Texas. During a 26-year career with the U.S. Air Force, Dr. Tilton logged more than 4,000 hours as a command pilot and senior flight surgeon flying a variety of aircraft. He currently flies the Cessna Citation 560 XL.
F R e de R ICk e . T I LTON, M.d.fa a f eder a l a ir su rgeon

May/June 2012 FAA Safety Briefing 7
HypoglycemiaQ: From 1983 to 1991 I was an air traffic controller and private pilot. I never had a problem getting a medical certification. From 1991 to the present, I did not fly as pilot in command or control traffic. I did not apply for a medical. My kids have grown and I now have grandchildren. I want to start flying again. I applied for a medical in August 2011, but was denied in October 2011 because of a medicine combination of metformin, glyburide and januvia. My physician stopped the glyburide, but as of January 2012, the FAA has still not granted me a special issuance. Why the delay?
A: Diabetes mellitus requiring use of medications which may cause hypoglycemia is a serious aeromedical problem. Hypoglycemia is well known as a cause of sudden incapacitation. Combinations of medications can be even more complex since certain medications may potentiate hypoglycemia. We also require airmen to be on the prescribed medications for a minimum of 60 days before evaluating for special issuance. I do not have your case to evaluate, but the fact you had to change medications would have created a delay in your evaluation. If all goes well with your current regimen of metformin plus januvia, this should be an acceptable combination of medications for aeromedical purposes.
Known Coronary Artery DiseaseQ: I am a 49-year-old male single-engine VFR pilot who recently purchased a Skyhawk for our small flying club. I had a minor heart attack requiring two stents at the age of 43. I fly now with a special issuance that must be renewed annually. My health is excellent, according to my cardiologist, and I exercise and take my medications religiously. I’d like to teach, so my question is whether medical qualification necessary for me to be a CFI is possible.
A: The short answer is yes, it is possible. Known Coronary Artery Disease is specifically disqualifying for flying. However, with proper treatment and good results, most airmen are able to return to flying. In
order to do so, you must work with your treating physicians to demonstrate that there are no areas of heart muscle that currently do not receive enough oxygen. The class of medical certificate determines what level of testing must be done. You can find details on this topic at: http://www.faa.gov/licenses_certificates/medical_certification/specialissuance/coronary/
AnomaliesQ: In 2004 I had an exercise EKG for a UK CAA first class medical, which revealed an anomaly. I went to our local hospital for a follow up examination and was found to have a narrowing of my left descending atrium. A stent was installed in 2004 and I now take one 2.5 mg Bisoprolol tablet per day. I had no indications of any heart problem before, and I have had none since. I have also recently been diagnosed with type 2 diabetes mellitus and so I am taking one 500mg metformin tablet per day. I haven’t flown since 2004, but I now want to renew my Class 2 or Class 3 medical, in order to regain the privileges of my flight instructor certificate. Can you please advise if this is possible?
A: We very frequently find that the routine testing we ask airmen to submit to does, in fact, reveal life-threatening conditions. In most cases, these conditions can be successfully treated. In your case, it is possible to regain a medical certificate, but you will have to work with your treating physician(s) to demonstrate that you do not have a residual problem with any area of your heart muscle that does not get enough oxygen. The link cited for the question above will provide you with appropriate details.
Send your questions to [email protected]. We’ll forward them to the Aerospace Medical Certification Division without your name and publish the answer in an upcoming issue.
Ask Medical Certification

8 FAA Safety Briefing May/June 2012
How Water and Heat Create Haze,
Humidity, and Hurricanes By JA M eS W I L L I A MS
8 FAA Safety Briefing May/June 2012

May/June 2012 FAA Safety Briefing 9
W hat comes to mind when you think of water? Chances are good that it conjures
up images of something like a placid lake, or memories of how good a glass of
fresh water can taste when you are really tired and thirsty.
Now think about heat – an especially appealing idea as we collectively emerge from the dark and dreary cold of winter. As with placid water, the notion of heat’s soothing warmth conveys calm and cozy comfort.
Now put them together. Oops. Different story. Like certain binary compounds, water and heat each have an individual set of known characteristics. When these elements combine, though, results can range from the dreariness of haze to the discomfort of humidity to the deadliness of hurricanes – a truly explosive combination of water and heat. And, as I learned from spending a decade in this nation’s hot, hazy, and humid southeast, all three have implications for the safety of flight.
The Nebulous Nature of HazeThe dictionary definition for haze makes it sound
almost pretty. In one instance, haze is defined as “an aggregation in the atmosphere of very fine, widely dispersed, solid or liquid particles, or both, giving the
air an opalescent appearance that subdues colors.” It forms from microscopic particles in the air that can either act on their own, or as condensation nuclei for atmospheric moisture. In other words, haze can be similar to a cloud, but is far less organized.
When there is a combination of stagnant air and heat, the haze thickens. That is because heat increases the amount of water vapor a given mass of air can hold. Every 20º F increase in temperature doubles the amount of moisture that an air mass can hold. So an 80º F air mass would have double the moisture carrying capacity of a 60º F air mass. Adding stagnant air to the mix simply allows a haze layer to form more easily.
In many parts of the country, haze is a common condition during the summer. While it is not outright deadly, haze is perhaps the most insidious of the weather villains in this piece. Opalescence may be beautiful and desirable in jewelry, but in the atmosphere, not so much. It creates conditions
May/June 2012 FAA Safety Briefing 9

that can be as relatively benign as the lack of a clear horizon or as bad as visibility more suited to an IFR flight plan.
Here’s the real challenge. The nebulous and subtle nature of haze makes it painfully easy to drift into conditions that we neither expect nor intend to enter. Unlike clouds or precipitation, haze is hard to spot – which is why it is hazardous. We humans much prefer hard and fast decisions. Haze often produces very subtle changes we may not notice until our circumstances have worsened considerably.
I write from experience, having seen this progression during a human factors experiment in graduate school. The goal was to determine whether a properly calibrated display would keep pilots from venturing into adverse weather conditions while flying under VFR. We set up the simulator to offer deteriorating visibility. There were two runs, one with and one without a second display that would show the visibility decreasing in an overhead view similar to a radar display. In both sessions, the pilots could clearly see the visibility decreasing on the visual display of our simulated outside conditions. It was an eye-opening experience to see how consistently they continued into the worsening conditions when they lacked the second display to validate their actual visual observations.
Awareness is one key defense, but it involves more than the necessary weather briefings and updates. Consider adopting the checkpoint strategy.
There is no regulatory requirement for distance between VFR checkpoints, but a good rule of thumb is to ensure that they are close enough that you can see the next one on your list. Assuming that you have established checkpoints that are 2 to 4 nm apart, you should start hearing the mental alarm bells go off when visibility is too poor to let you spot the next one. That’s when you know it is time to divert: Get on the ground and get a new plan.
Speaking of planning, another defense against the hazards of haze is to have personal minimums for weather, as well as operational factors (e.g., short runway). For tips on how to make and maintain truly personal minimums, see “Getting the Maximum from Personal Minimums” in the May/June 2006 issue of FAA Safety Briefing magazine.
The High Cost of HumidityThe same elements that create haze – water and
heat – also create humidity. And don’t think that the discomfort it creates is limited to human beings. As Jim Reynolds explains in “Higher Than You Think” on page 19, humidity increases density altitude, which has adverse impacts on both your airframe (e.g., airfoils) and your powerplant.
Here’s why. Remember high school science? A basic concept is that air density decreases as temperature increases. Humidity further decreases air density. Just like human beings, airfoils and airplane engines suffer “discomfort” – and decreased performance – in these conditions. Planning, to
10 FAA Safety Briefing May/June 2012
Pho
to c
ourt
esy
of t
he U
.S. A
ir Fo
rce

include careful performance calculations for both the human and mechanical participants in the flight, is essential to flight safety in high humidity conditions.
The Horror of HurricanesThe most powerful – and potentially destructive
– combination of water, heat, and humidity is more commonly called a hurricane. Having experienced several during the years I lived in the Sunshine State, I came to think of these events as a giant, incredibly destructive, warm car wash for a city. Imagine the peak intensity of a bad thunderstorm that normally lasts 20 to 45 minutes…only it continues for many hours. Depending on the forward speed of the storm, it could even last a day from initial onset to final clearance.
Along with the deluge of water, hurricanes unleash very destructive winds. Did you ever wonder how fast the wind has to blow before you can’t stand up any more? Your mileage may vary, but in my experience, it takes somewhere between 75 and 100 mph to force a normal-sized human being to the ground. And if that wind can make bipedal locomotion a problem, just imagine what it could do to an airplane. In a hurricane, by the way, the hurricane-strength gusts are typically not as damaging as the event’s sustained high winds. Over a long period of time, sustained high winds will impose lengthy periods of high stress on structures …including airframes. So what to do?
Because hurricanes and airplanes don’t play
well together, even when the latter lives in a so-called “storm-proof hangar,” the best defense for planes and their pilots is to fly out of harm’s way. That means having a good evacuation plan which, in turn, requires careful and thorough advance planning. It may be hard to do while the sun is shining, but good weather provides a good time to develop the detailed disaster-avoidance template you need to have. For general guidance please visit: http://www.nhc.noaa.gov/prepare/ or http://www.ready.gov/. Even though they are under no obligation to do so, it’s worth checking with your insurance company to see if they will help pay for your evacuation. Some companies might view a small payout to subsidize your evacuation beforehand as preferable to a much larger one to cover the damage after the fact.
As a veteran of the hurricane experience, I firmly believe that timely and accurate information is one of the most important considerations. For this activity, make sure you know how to obtain and use information developed through the National Hurricane Center (NHC) in Miami, Fla (http://www.nhc.noaa.gov/). The NHC normally issues advisories every six hours at 5:00 AM EDT, 11:00 AM EDT, 5:00 PM EDT, and 11:00 PM EDT (or 4:00 AM EST, 10:00 AM EST, 4:00 PM EST, and 10:00 PM EST). NHC sometimes issues mid-point updates when coastal watches or warnings are issued.
It also pays to pay attention to the forecast issued with the advisories. Keeping track of the storm’s track – or at least the pros’ best guess-timate of what that track might be – will help your preparation and evacuation planning.
As with any other part of flying, you can mitigate the consequences of H2-Oh! type phenomena by learning as much as you can, planning as carefully as you can, and consistently doing the right thing for flight safety.
James Williams is FAA Safety Briefing’s assistant editor and photo editor. He is also a pilot and ground instructor.
As with certain binary compounds, the result of combining water and heat can range from the dreariness of haze to the discomfort of humidity to the deadliness of hurricanes.
Learn More
Pilot’s Handbook of Aeronautical Knowledge, Chapter 10, p. 10-5http://www.faa.gov/library/manuals/aviation/pilot_handbook/
May/June 2012 FAA Safety Briefing 11
Pho
to c
ourt
esy
of t
he U
.S. A
ir Fo
rce

12 FAA Safety Briefing May/June 2012
W hether or not you are a parent,
you have no doubt witnessed
some toddler’s force-of-
nature temper tantrum. It’s actually quite
amazing to see how quickly a sweet little
person can spin into a stomping, shrieking,
swirling mass of destructive energy.
Mother Nature is capable of a similar metamorphosis, shifting from serene to stormy in surprisingly short order. Though her fury mimics the “Terrible Twos,” Mother Nature’s version takes the form of the Terrible Ts: turbulence, thunderstorms, and tornadoes. As I learned from many years spent in Florida, all three can unleash enormous amounts of destructive energy that is perilous for pilots and their planes.
Unlike parents, pilots do not enjoy the option of sending the miscreant to a corner for time out. Since
The Terrible
Ts:Turbulence, Thunderstorms, & Tornadoes
By JA M e S W I L L I A MS
Pho
to b
y Ju
stin
156
9 at
en.
wik
iped
ia
May/June 2012 FAA Safety Briefing 13
we are the ones obliged to take time out, it behooves us to accurately read the signs of an approaching meteorological meltdown and take cover until the fury of Mother Nature’s Terrible Ts subsides.
Things that Go Bump in the FlightTurbulence varies significantly, ranging
from minor nuisance to wing-shearing intensity. Avoidance of the worst conditions requires awareness of the sources of turbulence which, like other weather conditions, often arise from a variety of disruptions and imbalances. Let’s take a look.
All pilots are familiar with the tamer varieties of bumpy air, and I quickly learned that it was not possible to fly in Florida without becoming accustomed to being bounced by the ubiquitous pockets of rising air. In Florida, as in similar areas, the mixture of surfaces includes roofs, open grass, water, trees and, of course, pavement. All absorb and radiate heat at different rates, resulting in varying levels of rising air and the rows of small puffy clouds that are a trademark of Florida afternoons. Those clouds are a good indicator to pilots of a ride that is likely to feel a lot like driving down a bumpy, well rutted road.
Shifting winds aloft are another turbulence generator, potentially more dangerous than the bumps under so-called fair weather cumulus. If your
weather briefing shows that winds aloft vary more than 90 degrees in direction, or if there are significant changes in velocity from one reporting altitude to the next, you can expect to experience turbulence at the boundary where those differing conditions collide.
A third source of turbulence, one pilots must note and carefully accommodate, is the movement of air over and around man-made or natural obstacles. This level of such turbulence usually depends on the size of the obstacle and the amount of air moving over/around it. Logically enough, the level of such turbulence will intensify with any increase in wind speed. The size of the obstacle has an effect as well: Both the intensity and the size of the turbulence field on the leeward side are higher with larger obstacles, such as mountains.
Even if there is not enough moisture to create the lenticular clouds that are the surest signpost of this turbulence, you can “see” it by visualizing the rapid flow of water over and around rocks in a stream. Like water flowing over rocks, the air flow over an obstacle such as a mountain is smooth on the windward side. As it clears the obstruction, however, the flow becomes turbulent. That alone is bad enough, but it can be deadly when it occurs in areas of rising terrain. As noted in Rocky Mountain High on page 16, that’s why mountain flying experts
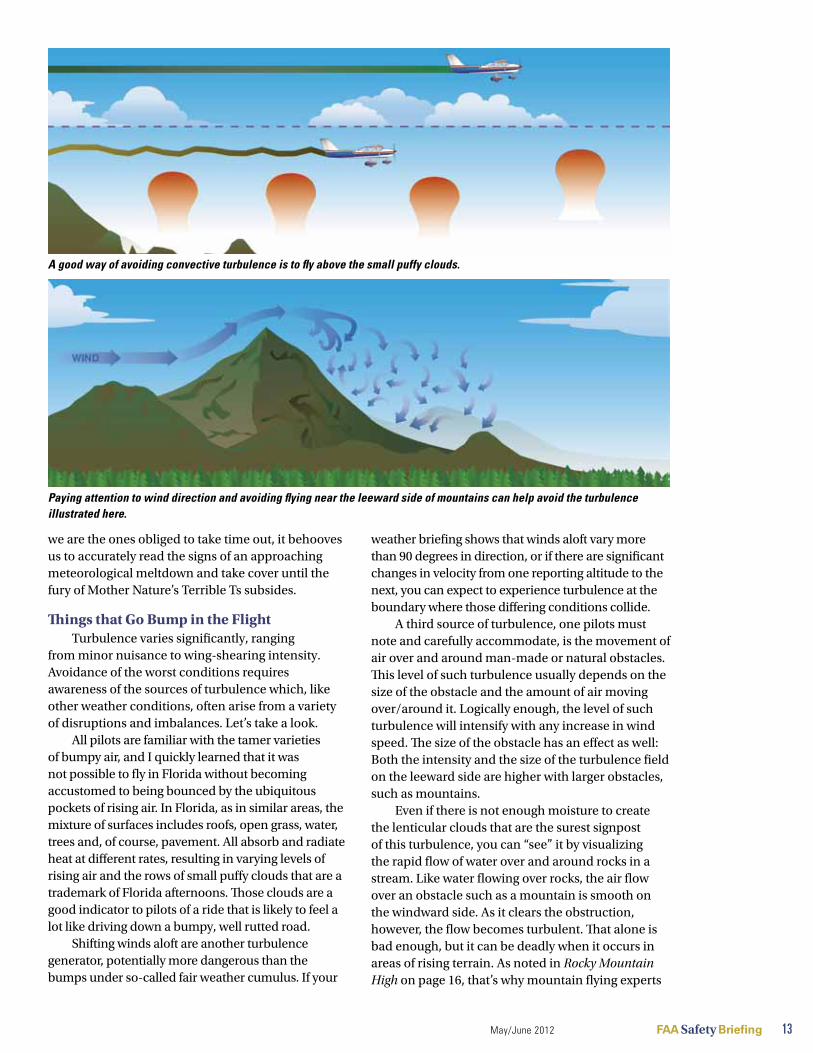
A good way of avoiding convective turbulence is to fly above the small puffy clouds.
Paying attention to wind direction and avoiding flying near the leeward side of mountains can help avoid the turbulence illustrated here.

14 FAA Safety Briefing May/June 2012
recommend special training before you attempt to operate in this environment.
A Towering RageWhen retreating glaciers formed the generally
flat expanse of the Midwest and Great Plains, they didn’t just leave fertile farm land in their wake. They created a perfect stage to funnel cold dry air from the north into warm moist air from the Gulf of Mexico. That’s why the United States has the dubious distinction of being a world leader in the number and intensity of severe thunderstorms.
Let’s review the life cycle of a typical thunderstorm. Thunderstorms start life as happy and often harmless-looking cumulus clouds, giving rise to the term “cumulus stage.” Though many stop there, ingredients such as heat, moisture, and instability (i.e., tendency of air to rise) are a recipe for a truly Terrible T – the thunderstorm.
When the atmosphere is unstable, as can happen during frontal movement, the puffy, happy little cloud climbs further and further into the sky. Small updrafts start combining to form the large updrafts that lift the cloud, along with all its moisture, into the upper atmosphere. The harmless cumulus cloud becomes a dark and threatening cumulonimbus, noted in weather abbreviations as “CB.”
When the cloud can no longer support the weight of its accumulated moisture, that moisture begins to fall as rain or, if temperatures are sufficiently low, as hail. This stage, called the “mature” phase, is the most violent point of the
storm because there is a violent and unpredictable combination of updrafts and downdrafts.
Non-aviators often assume the danger in a thunderstorm is lightning, but pilots know that thunderstorm-level turbulence is the real killer. No airplane, least of all a light GA aircraft, is designed to withstand such stress.
The storm reaches its dissipating stage at the point where downdrafts outnumber updrafts. Like a toddler whose fury has finally exhausted the ready supply of tears and energy, the thunderstorm literally rains out its energy and begins to subside.
A word about lightning: Lightning is created by an imbalance in the electrical charge between the ground and the clouds. Thunder is the sound made by the rapidly expanding air super heated by a lightning bolt – which is hot enough to turn sand into glass. Aircraft are built to absorb and dissipate lightning, which follows the path of least resistance to the ground. By design, that path is usually the metal skin of the aircraft or the protection systems built into composite aircraft. Still, it’s a good idea to avoid situations that would expose your aircraft to lightning … especially since lightning lurks in the same neighborhood as the big bully cumulonimbus. As you probably remember, the FAA recommends keeping at least 20 nautical miles from these storms.
The Vicious VortexA tornado, one of the most intense manifestations
of extreme weather, is also one of the most destructive forces of nature. Because tornadoes are usually
Life cycle of a thunderstorm.

May/June 2012 FAA Safety Briefing 15
generated by massive severe thunderstorms, the United States again tops the charts in terms of the number and severity of tornadoes it experiences in any given year. In fact, the high incidence of tornadoes in certain parts of the country have given a large swath of land from Texas to the Dakotas the “Tornado Alley” nickname. Another clue is the location of the National Weather Service Storm Prediction Center in Norman, Oklahoma.
Let’s start with the basics. A tornado is a spinning column of high winds that descend from the base of a cloud to the surface of the earth. Usually, but not always, a tornado has a condensate cloud appearance that makes it more visible.
Many reports put the top wind speed of the most powerful tornados at above 300 mph. The severity of a tornado is defined by the Enhanced Fujita Scale (EF), with wind speeds calculated on the basis of how much damage was done. The scale ranges from EF-0 on the low end to EF-5 on the high end. An EF-0 tornado has winds between 65 and 85 mph and generally only damages trees and non-permanent structures. On the high end, EF-5 tornadoes have wind speeds exceeding 200 mph and can obliterate virtually any structure short of a concrete bunker.
Just to be clear, though: Every tornado is a vicious vortex capable of wreaking havoc with life and property. If you happened to be in Lakeland for Sun ‘n Fun 2011, you will have a clear memory of the tornado, along with an appreciation for the damage that even an EF-0 can do.
By now it should also be clear that there are no real strategies for dealing with a tornado other than avoiding them at all costs. The best idea is to avoid thunderstorms by a wide margin, which should also allow you to avoid encountering a tornado. And with respect to preparations on the ground, the best thing you can do is to secure your aircraft and find safe shelter for yourself. Your aircraft can be replaced.
Just as parents hope to avoid the tantrums of the toddler’s Terrible Twos, pilots hope to evade the fury of Mother Nature’s Terrible Ts. Take time out to be sure your avoidance strategies are in place before you need them.
James Williams is FAA Safety Briefing’s assistant editor and photo editor. He is also a pilot and ground instructor.
ADDS Weather Avoidance Tools - TurbulenceLate next year, pilots will be able to access auto-
mated turbulence forecasts below 10,000 ft. for the first time when visiting the National Weather Service’s Aviation Digital Data Service (ADDS) website.
The FAA, the National Center for Atmospheric Research (NCAR) and NOAA are improving the Graphical Turbulence Guidance (GTG) forecast, an automated online tool that is already available to pilots. GTG currently provides turbulence forecasts from above 10,000 MSL to FL 460 over the contiguous U.S., coastal waters and parts of Mexico and Canada. To predict clear air turbulence (though not turbulence due to mountain waves or convection), GTG pulls weather model forecast grids as they become available, then computes a series of turbulence diagnostics on a grid point by grid point basis and combines them to provide reliable turbulence forecasts out to 12 hours.
Pilots can access GTG through the ADDS website, aviationweather.gov/adds/turbulence/turb_nav.php. ADDS displays are color contour maps of turbulence intensity in three categories: none, light, and moderate or greater.
A new and improved GTG numerical weather prediction model will be available online soon. This new weather prediction model is expected to improve diagnosis and forecasting of turbulence. Another update is expected in late 2013, which will add turbulence forecasts below 10,000 MSL, as well as specific mountain wave forecasts.
The Graphical Turbulence Guidance available on the ADDS website uses color contour maps to depict turbulence intensity in three categories: none, light, and moderate or greater.

16 FAA Safety Briefing May/June 2012
Zen: A total state of focus that involves dropping illusion and seeing things without distortion created by your own thoughts.
Rocky Mountain High:
The Zen ofMountain Flying
16 FAA Safety Briefing May/June 2012
May/June 2012 FAA Safety Briefing 17
I f perchance you have a yen to
visit mountains in their own lofty
neighborhood without the footwear
and perspiration required to get there
under your own steam, a GA airplane is a
wonderful way to travel. I will never forget
the thrill of flying over Arizona’s famous
Four Peaks mountain in my friends’ Cessna
T-206 stationair a few springs ago. Being
a regular on the dCA-PHX run, I had
certainly seen it from the lofty heights of an
airliner. But nothing compared to the closer
view we got courtesy of general aviation.
There were no particularly difficult conditions on the day we flew in, but believe me, all three of us made a careful analysis of the weather before departing Santa Fe (KSAF) for Mesa (KFFZ). We weren’t crossing the Rockies; still, we recognized that for pilots unaccustomed to operating at higher elevations, the flight environment can be very unforgiving of poor planning.
Knowing the NeighborhoodLet’s start with a quick survey of hazards
common to the mountain flying environment. Please note that “quick survey” carries a caveat: If you’re serious about mountain flying, you need a lot more in-depth knowledge and understanding than we can provide in a short article.
Density altitude: As Jim Reynolds explains on p. 19, density altitude is the pressure altitude corrected for temperature. Since increasing temperature makes the air less dense, an airplane will perform as if it is at a higher altitude. The combination of high elevation and high temperature creates high density altitude, which has an adverse impact on aircraft performance.
Winds: Mountains create a wide-ranging menu of wind conditions. Mountain wave turbulence occurs when the wind speed is above about 25 knots and flowing perpendicular to the ridge lines. The air flow can form waves that are much like water flowing over rocks in a stream. The waves forming downwind from the ridge line are composed of strong up and down drafts, and there can also be dangerous rotor
action under the crests of the waves. Mountain waves can be visible when enough moisture is present to create those beautiful and (very!) deceptively serene-looking lenticular clouds.
Another hazard is wind flowing through mountain passes. Remember the ground school discussion of carburetors? Just as the flow through a carburetor speeds up in the restriction of the throat, air moving through the narrow restriction of a mountain pass will accelerate and likely create turbulence and up- or down-drafts.
A third element of wind awareness for mountain flying is “orographic lifting,” which is the term for what happens when the wind blows moist air upslope. If the temperatures are lower, the moist air will cool and form visible precipitation in the form of clouds. A cap cloud close to the mountain communicates stable air. However, with summer’s unstable air, orographic lifting can easily launch the formation of thunderstorms.
Still another wind awareness item is the microburst. If you aren’t familiar with mountain flying, you may not be familiar with the dry microburst, which occurs with little or no warning in the clear air beneath virga. Dry microbursts are common in and near the Rockies and other mountainous areas of the western United States during the summer. Dry microbursts are most likely to form around thunderstorms with bases above about 3,000 to 5,000 feet AGL and a temperature/dew point spread greater than 40 degrees. They can be indicated by blowing dust underneath a high-base thunderstorm … but of course you should stay well clear of thunderstorms in all circumstances.
Visibility: Temperature inversions often create fog in mountain valleys during the night. Valley fog can be very thick and, since it may require several hours to dissipate, it’s definitely an item to factor into mountain area arrival and departure planning.
Acquiring the ZenPresented in terms of the PAVE (pilot, aircraft,
enVironment, external pressures) risk mitigation checklist, here are a few tips to start acquiring the distortion-free zen you need for safe mountain flying.
Pilot: Mountain flying will challenge your abilities to fly the airplane proficiently, navigate, and deal with weather. Take a clear-eyed look at your experience and background. Unless you learned to fly in such an area or have extensive mountain flying experience, safety demands that you consider taking a recognized mountain flying course to give
May/June 2012 FAA Safety Briefing 17
you the knowledge and skills you will need in this environment. The Internet provides information on the many courses available.
Aircraft: The mountain flying environment will also challenge your aircraft and, in circumstances like high density altitude combined with high elevation, conditions may demand greater performance than a GA aircraft can offer. Some experts recommend that 160 horsepower should be considered the absolute minimum for the airplane, especially when the pilot lacks significant mountain flying experience.
enVironment: Here’s where the homework is critical. In addition to knowing what the pilot/aircraft team is capable of doing, you need to acquire a thorough understanding of not only the weather hazards described above, but also practical mitigation strategies. A few basic tips:
Altitudes: Plan to cross mountain passes at an altitude at least 1,000 feet above the pass elevation. This altitude could result in flying at or above 10,000 MSL, which means that you need to be sure you can meet VFR cloud clearance requirements if you are not on an IFR flight plan. Since the dearth
of mountain weather reporting stations might complicate the task of fathering accurate information, be sure you have a viable escape route at all times. It’s a good idea to call some of the airports along your route, and pilot reports can be as valuable
as gold. Also, plan to cross ridges at a 45-degree angle. This technique allows you to turn away from the ridge more quickly if you encounter a severe downdraft or turbulence. After crossing a ridge, turn directly away from it at a 90-degree angle to depart the most likely area of turbulence.
Visibility: Many experienced mountain pilots recommend having at least 15 miles of visibility before attempting mountain flights. Since your navigating will be primarily by pilotage and dead reckoning, good visibility will help keep you oriented in a sometimes confusing array of geographical cues. By the way, experienced mountain pilots generally caution against IFR and night flying in the mountains for novices. Instrument approaches and departure procedures often require a higher level of pilot skill and aircraft performance, and night obscures important visual navigation cues needed for terrain clearance.
Winds: Don’t attempt to operate in mountainous terrain if the winds aloft forecast at mountain top levels is higher than 25 knots. During preflight, experts recommend that you pay close attention to forecasts at and above the mountain ridges. When flying in the west, that means checking the 9,000 and 12,000 foot forecasts. Also, the position of high and low pressure areas can offer clues to wind speed potential.
Routes: Flying in the mountains demands a lot more care than just drawing a straight line or following the magenta line on your GPS moving map navigator. The safer path in mountain areas is to follow features such as highways, river drainages, and valleys. In addition to being at a lower elevation, these routes offer better emergency landing options. Also, consider using pilot groups or Internet forums to find local pilots who have knowledge and experience to offer. And this point bears repeating: Always have a fly-able alternative!
Survival: The mountain flying environment can be very harsh, and survival equipment is a must. Do the research needed to assemble a good survival kit. At a minimum, you should have a three-day supply of food and water for each occupant, winter clothing, a medical kit, and signaling devices.
External factors: This one is easy to say, but very hard to do. As John Allen notes in his article on p. 1, elements of the pilot personality can sometimes cause us to attempt things we know we should not do. Take the time to ferret out the factors that might be pushing you into a poor position, whether in the go/no-go decision or deciding whether diversion is necessary once you are underway.
Done properly, mountain flying can significantly add to your repertoire of aviation skills and memorable adventures. Acquire the zen, and enjoy the view.
Susan Parson is a Special Assistant in the FAA’s Flight Standards Service and editor of FAA Safety Briefing. She is an active general aviation pilot and flight instructor.
Unless you learned to fly in the mountains or possess extensive mountain flying experience, safety demands that you consider taking a recognized mountain flying course to give you the knowledge and skills you need in this environment.
18 FAA Safety Briefing May/June 2012

May/June 2012 FAA Safety Briefing 19
For most people, it is easy for us to believe in things we can see. Pilots are no exception. Just about any pilot can tell you in detail about the impacts that
such visible weather phenomena as thick haze, a solid low ceiling, or a wall of rain under black thunderstorm clouds will have on a flight. But for many pilots, and especially those new to flying, it is often difficult to muster as much respect for the negative effects that density altitude can have on a flight because this condition is invisible to the eye. Density altitude can really be “seen” – or, more accurately, experienced – only through the performance of the aircraft. Unfortunately, by the time the pilot does perceive this condition through degradation in aircraft performance, the adverse consequences of density altitude have already appeared. And they can be deadly.
What It IsBy definition, density altitude is “the pressure
altitude adjusted for non-standard temperature.” Simply put, increasing temperature at a particular atmospheric pressure causes the density of air at that pressure to appear as though it resides at a higher physical altitude.
The problem of density altitude for pilots begins with the fact that aircraft fly through an atmosphere of air that is composed of invisible gases. Only when there is an excess of particulate matter or water vapor in the air can anything actually be seen in the flight environment. Because air is otherwise invisible, it is not possible to see that air becomes thinner due to the increased spacing between air molecules when an air mass is raised in elevation (high), when it is warmed (hot), or when water vapor is added to it (humid).
Photo by Claudio Bellotto
Higher Than You Think:
The Deadly Cocktail of Density Altitude
By JIM ReyNOLdS

20 FAA Safety Briefing May/June 2012
What It DoesWhether due to height, heat, or humidity, the
increased spacing between air molecules and the resulting thinner air, has the following three effects on aircraft performance:
• Aircraft accelerate more slowly on takeoff or go-around because the thinner air adversely affects combustion, and thus results in a power production reduction.
• To produce the same lift associated with a lower density altitude condition, aircraft need a higher true airspeed, which generally requires a longer takeoff roll to achieve.
• The reduction in both power production and lift means that aircraft climb more slowly.
Any mix of high, hot, or humid atmospheric conditions creates what we call “high density altitude” situations. Density altitude can be quite dangerous, especially if the aircraft is operating at, or close to, its maximum gross weight.
How to Spot ItThough it is inevitable that a pilot will be unable
to literally see developing high density altitude situations, there are a number of other cues to its existence. First, it is easy to get a general sense of the temperature just by noting what we experience when we step outside. Similarly, we are very likely to sense an increase of humidity, or “mugginess,”
in our surroundings, and we can observe the hazy conditions that sometimes accompany the hot and humid characteristics of density altitude.
At higher elevations, we might also have clues from the physiological impact of altitude. For instance, we find ourselves catching our breath when undertaking physical tasks that don’t usually cause us to breathe deeply. However, these physical signs are not enough for pilots to gain a true understanding of how their aircraft will perform under their given current conditions. The only way to truly ascertain how an aircraft will perform is to first compute density altitude according to a chart or a calculator, and then correlate this information with aircraft performance data in the aircraft’s operating handbook. If you don’t have a physical copy of a density altitude chart in an aviation book of some sort, these charts can easily be found on the Internet by doing a search for a “density altitude computation chart” (Fig. 1).
An even easier way to determine density altitude is to use an online calculator. The National Weather Service office in El Paso, Texas, has a handy calculator that can be found at: www.srh.noaa.gov/epz/?n=wxcalc_densityaltitude.
While most density altitude effects are experienced at higher elevations, it is important to note that extremely high temperatures at lower elevations can lead to equally negative aircraft performance problems. Case in point: high
Pho
to b
y H
. Dea
n C
ham
berla
in

May/June 2012 FAA Safety Briefing 21
temperatures across portions of the U. S. desert southwest can easily exceed 115 F throughout the summer months. Chris Kesler, Operations Support Manager for the Terminal Radar Control facility at the Phoenix Sky Harbor Airport observes that “while high density altitude situations do not officially cause the closure of the airport, a temperature of 120 F will generally cause most pilots to choose not to fly into or out of the airport until temperatures cool down.” The fact that the elevation of Phoenix Sky Harbor Airport is only 1,124 feet above sea level provides a good indication of just how severe the impact of high temperatures can be on density altitude.
What To DoWhile the effects of density altitude can be
insidious, there are ways to beat this foe. Here are a few tactics and techniques.
If at all possible, fly early or late in the day when it is typically cooler. Any reduction in temperature may add some flexibility with regards to your
functional elevation – i.e., the altitude the airplane “feels” when it flies.
Fly as light as possible. Leave behind all of the baggage you don’t really need. Ask yourself - will you actually play golf with the clubs you’re planning to bring? Lastly, bring along only those passengers that are necessary for the trip. High density altitude situations are bad ones for those individuals that just want to “tag along.”
Know before you go - take the time to calculate aircraft performance. If the conditions are beyond the aircraft’s performance envelope, you want to discover that fact before you launch, not while you’re struggling to launch and climb.
In short, don’t let the cocktail of “hot, high and heavy” be hazardous to your health!
Jim Reynolds is the Meteorologist in Charge at the Center Weather Service Unit in Albuquerque, NM. He has been a private pilot since 1992.
Fig. 1 – Density Altitude Computation Chart Photo by James Williams

22 FAA Safety Briefing May/June 2012
Fearsomely Fouldealing with Fog, Freezing Precip,
and other Nasties from the NorthBy TOM HOF F M A N N
W hen it comes to weather extremes in the northern part of the United States, there’s a lot to consider. While headline-grabbing
hurricanes and tornadoes aren’t completely out of the question in some areas, it’s often the more elusive variety of winter weather hazards that gives pause to a pilot’s flight plans. In the north, pilots must deal with such perils as blinding fog, blowing snow, freezing rain, and ice-laden clouds, not to mention the treacherous terrain often lurking behind the veil of these icy dangers. Unplanned encounters
with any of these conditions can spell disaster faster than you can say Jack Frost.
The key to being prepared for these hazards relies largely on understanding how and why they develop. Despite the wide range of environments found in the north, there are many common factors at play in determining weather. Among them are wind, moisture and topography, all of which intertwine in different ways to give each area of the north its own unique flavor of weather patterns and idiosyncrasies. From the constant onshore flow of moisture in

May/June 2012 FAA Safety Briefing 23
the Pacific Northwest, to the frigid and blustery conditions of the Great Plains, there’s definitely no shortage of winter weather phenomena that can impact flying safety. And while no region is off limits to another’s more prevalent dangers, understanding the microclimatic conditions predominant in your neck of the woods will go a long way in keeping you prepared for whatever Mother Nature dishes out.
Some Wicked Harsh WeatherA pilot unprepared for a run-in with New
England winter weather can be as terrified as a baseball rookie facing Fenway Park’s infamous Green Monster for the first time. Confronted with the left field wall’s quirky dimensions, a player must quickly develop a strategy—both offensive and defensive—to not get caught off guard and have a better chance of success.
A similar approach would be well advised to a pilot facing the mixed bag of wintry precipitation all too common in the Northeast. Proactive strategies are a must since almost every type of extreme weather can occur in this area – blizzards, severe cold snaps, icing, and high winds. It’s a buffet of all things ice and snow, but one which pilots would certainly find unappetizing.
So what makes New England weather so unique? For starters, the topography of the region has a tremendous influence on how weather forms. Upper-level low pressure systems from the west and the south commonly converge in a coastal stretch surrounded by mountains on one side, and moist ocean air on the other. In the winter, this means prime conditions for Instrument Meteorological Conditions (IMC) and icing. When you mix that with the region’s challenging mountainous terrain, risk factors can quickly skyrocket, demanding a pilot’s tight grip on situational awareness.
Moving slightly more west brings another influential winter weather factor into the mix: the Great Lakes. Cold, dry air drifting over the Great Lakes can pick up large amounts of moisture and then deposit it on the surrounding land areas in the form of lake effect snow. This Midwest phenomenon creates some of the heaviest annual snowfall rates in the country. According to a study by NOAA’s National Climatic Data Center (NCDC), the towns of Marquette and Sault Ste. Marie, Mich., were among the top five snowiest cities over a 30-year period, averaging an incredible 144 and 117 annual inches of the white stuff, respectively.
The Great Lakes region also lies in another critical convergence zone where moist air masses
from the Gulf meet up with systems moving out of the Rockies, further fueling its massive winter storm potential. And where there is cold air and moisture aloft, there is potential for icing. Fig. 1 illustrates this region’s vast icing potential, evidenced by the hard-to-miss red bull’s-eye right over the Great Lakes.
In addition to the local area forecasts, pilots should consider getting a good long range forecast and a big picture of the nation’s frontal activity to help determine what type of weather to expect on a flight. Knowing where the fronts are and where they are moving are key parts to planning a safe flight as well as an exit strategy if needed. Keep in mind also that weather charts only depict frontal boundaries on the surface. The hazardous effects of an encroaching warm front, like supercooled rain, can be felt more than 100 miles ahead of what’s depicted on a weather chart.
Oh Yah, It’s Cold - You BetchaAlthough somewhat protected by the moisture-
stripping Rockies to the west, and devoid of any significant natural terrain obstructions, the Great Plains states of the north central United States still have their share of cold weather calamities to deal with. Frigid cold temperatures and blustery winds top the list.
In the same NCDC study mentioned earlier, five of the top 10 coldest cities in the country are in North Dakota and Minnesota, predominantly along the Red River Valley that borders both states. In Fargo, ND, the temperature averages only 9.8 F between December and February. And that doesn’t even take into consideration wind chill factors, an unfortunate byproduct of being in one of the gustiest areas of the United States. Vast open areas can channel Chinook winds from the Rockies with wind speeds occasionally exceeding 100 mph.
Fig. 1 – Icing prone areas Nov - Mar

24 FAA Safety Briefing May/June 2012
“With the amount of strong wind we get, it’s not impossible for us to have wind chill factors of -60 F,” says Jay Flowers, FAASTeam Program Manager and Safety Inspector at the Flight Standards District Office in Fargo, ND. “You won’t fall short of finding a flat place to land in an emergency, but surviving the cold before help arrives is a whole different story.” With the extreme cold conditions in these areas, Flowers recommends pilots be mindful of the proper clothing and survival gear before stepping inside the aircraft. “If there are below-freezing temperatures and any wind at all, survival times can go from hours to mere minutes.”
Flowers also points out another dangerous side effect of high winds: white-out conditions caused by blowing snow. “Icy runways, mixed with blowing snow and stiff crosswinds combine for some pretty risky flying conditions,” says Flowers. To stay connected with conditions at your destination, always have the latest weather data on hand. Flowers also suggests contacting the local airport manager before your flight for an update on any problem areas a weather briefer may not be aware of.
Seattle’s Best (…and Worst)Washington State may be famous for its coffee,
but it’s also well known for its extraordinary ability to produce fog, icing, and every pilot’s favorite—freezing rain. It all starts with the sustained onshore flow of abundant moisture from the Pacific Ocean. Mix in upslope flow along the Cascade Mountains, low level cloud cover, and the freezing levels frequently below Minimum Enroute Altitudes (MEA) most of the year, and you have one the country’s most reliable areas for visibility restrictions and icing hazards.
“The Washington Cascades are a veritable icing factory,” says National Weather Service (NWS) Meteorologist Allen Kam, who’s spent the last 20 years preparing public, aviation, and marine forecasts at the Seattle National Weather Service Forecast Office. “Low level westerly flow that develops behind a frontal system and impacts the north-south oriented Cascade mountain range can frequently get up to 40 to 60 knots.” says Kam. “The upslope flow caused by those strong winds flowing up over the Cascades can translate to some pretty severe icing conditions.” The reliability of icing conditions is a big reason why the Cascades are a popular location to conduct aircraft icing certification tests.
Freezing rain is another nemesis for pilots in the Pacific Northwest, especially for those trying to fly over eastern Washington, or those trying to avoid the ‘icing factory’ over the Cascades by crossing at lower levels through mountain passes (see Fig. 2). These Cascade passes and the Columbia River Gorge can become a freezing rain trap. The overall freezing level may be above pass level (3000-4000 feet for the Washington Cascades and near sea level for the Columbia Gorge) but still below the MEA levels (7,000 to 12,000 feet) over the Cascades. However, sub-freezing air can collect at the lowest levels near the surface in the passes and the gorge, below the layer of warmer air just above. With that, the stage is set perfectly to allow precipitation falling through the warmer air aloft (just below the main freezing level) to turn into freezing rain in the shallow layer of
Learn More
GA Pilot’s Guide to Preflight Planning, Weather Self-Briefings, and Weather Decision Makinghttp://www.faa.gov/pilots/safety/media/ga_weather_decision_making.pdf
AOPA Air Safety Institute Online Course: Air Masses and Frontshttp://flash.aopa.org/asf/wxwise_fronts/wxwise_fronts.cfm?WT.mc_id=120120epilot&WT.mc_sect=sap
A Pilot’s Guide to Inflight Icing: NASA http://aircrafticing.grc.nasa.gov/courses_inflight.html#
AC 00-45, Aviation Weather Serviceshttp://www.faa.gov/documentLibrary/media/Advisory_Circular/AC-0045G_chg1_fullDocument.pdf
Fig. 2 – Favored locations for freezing rain in Seattle Center’s airspace.
Cou
rtes
y of
Joh
n W
erth
, Met
eoro
logi
st-in
-Cha
rge,
Nat
iona
l Wea
ther
Ser
vice
Cen
ter

May/June 2012 FAA Safety Briefing 25
sub-freezing air near the surface of the passes; right where pilots who are trying to avoid the higher level ‘icing factory’ may be flying.
These sub-freezing liquid rain drops can freeze on impact and cause dangerously rapid ice accretion. Often the best course of action for pilots caught in this predicament would be to attempt an immediate climb to the shallow layer of warmer air just above. Over eastern Washington, cold sub-freezing air often collects at the surface and just above in the Columbia Basin (the area between the Cascades and Spokane, Wash. and Pendleton, Ore.). Pacific frontal systems crossing the area often bring a layer of warmer air aloft even across the Cascades. As with the Cascade passes, precipitation falling through that lower level warm air can turn into freezing rain when it hits the sub-freezing air at the surface and can produce dangerous icing conditions.
Although icing and freezing rain might be more common in the winter, the visibility-robbing dangers of fog and low stratus clouds are a more persistent threat. According to the NWS, the foggiest place in the United States (excluding mountaintops) is the aptly named Cape Disappointment at the mouth of Washington’s Columbia River. It averages 106 days of dense fog a year. The nearby area of Willapa Bay was reported as having a whopping 7,613 hours of fog in a year – that’s about 317 days! According to Kam, the peak fog period for the northern Pacific Coast
is between November and January, with November being the worst.
Needless to say, it’s best to keep an eye on the temperature/dew point spread, no matter where you fly. Fog and low clouds can form rapidly, turning a VFR pleasure trip into an IFR nightmare in minutes.
To help prevent these types of scenarios from occurring, Kam recommends pilots make more use of the Aviation Forecast Discussion, a blog-like product on the NWS’ website that allows forecasters to explain in plain detail what he/she thinks are the problem areas with the forecast that day. “It provides a more insightful look at what the forecaster’s thought processes are and allows pilots to ‘read between the lines’ about why certain events can be expected,” says Kam. You can find out more on the Aviation Forecast Discussion tool in this issue’s Checklist department on page 26.
Fearsomely Foul FoesWeathering the extremes of northern U.S.
climates can be a challenging prospect for any pilot. However, once you begin to unlock the mystery behind where and why these conditions occur, you’ll soon see the fog lift and reveal a path to safer weather strategies.
Tom Hoffmann is associate editor of FAA Safety Briefing. He is a commercial pilot and holds an A&P certificate.
ADDS Weather Avoidance Tools - IcingIt’s easy to see ice when it’s forming on your
aircraft, but “seeing” the probability of ice during the all-important preflight planning process has long been a challenge for pilots. Happily, help is at hand through fea-tures on the National Weather Service’s popular Aviation Digital Data Service (ADDS) website. Specifically, the Current Icing Potential (CIP) and Forecast Icing Potential (FIP) tools allow pilots to see current and forecast icing conditions mapped along the route of flight at hourly intervals and at multiple selectable altitudes for 12-hour periods. There is a separate map to show the probability of icing. While pilots should always review the primary data on AIRMETs and SIGMETs, they should also be aware of the valuable supplemental information that the CIP and FIP tools can provide.
And it’s getting even better. With funding from the FAA’s Aviation Weather Research Program, a small team of weather researchers led by Marcia Politovich at the National Center for Atmospheric Research in Boulder, Colorado, is actively working to improve the icing forecasting capability and diagnosis techniques behind the ADDS website. The way CIP and FIP graphics present information to pilots isn’t changing, but this year the team will link these icing tools to an improved weather forecast computer model. “This step should improve the diagnosis and forecasting of icing,” Politovich says. The team in Boulder is also developing advanced radar techniques for observing actual icing conditions, which will help validate current icing conditions.
CIP depiction of icing conditions at 8,000 ft MSL from the Aviation Data Display System (ADDS) Flight Path Tool. Severity is depicted with varying shades of blue.
Pho
to c
ourt
esy
NA
SA

26 FAA Safety Briefing May/June 2012
Easter EggsIt’s amazing to discover – again – just how much
information is available to us these days through the marvel of the World Wide Web. Before we started working on this issue of FAA Safety Briefing, I thought I had a fairly good sense of the major weather products that a prudent pilot should pick up, and then pick through, in preparation for a flight. And maybe most of us do have a reasonable understanding of the more obvious ones, such as ADDS, AFSS, and DUAT/DUATS.
But then a colleague clued me in to a little gem of a weather product, one tucked away behind a sidebar menu on the National Weather Service (NWS) Aviation Weather page. Though not deliberately hidden, like the playful “Easter egg” mini-apps that software engineers sometimes embed to amuse those clever enough to find them, the discovery of this particular treasure was every bit as delightful. And the site’s appearance made me think of real Easter eggs: as you see from the screen shot, the map’s cheery color scheme is reminiscent of a freshly-filled basket of Easter eggs.
Aviation Forecast DiscussionSo what’s in the basket? The official name for
this cool little tool is the TAF Forecast Discussion. Here’s a step-by-step guide to getting there.
First, go to the NWS Aviation Weather Center’s home page (http://www.aviationweather.gov/). On the left side is a Java-type menu with several items and sub-items. The last item under the “Forecasts” menu is labeled “TAF/FA.” When you mouse over “TAF/FA,” a previously hidden pop-up menu appears. Hop down to the last item, “TAF Forecast Discussion” and, voilà! The multi-hued meteorological map magically appears, with an invitation to click on the map in order to see the forecast discussion.
Clicking on any given colored part of the map produces a short, mostly plain text description of the expected weather conditions within its boundaries. Here’s the official product description, taken straight
from the “FYI” section of the Aviation Forecast Discussion page:
Aviation Forecast Discussions are taken from the AVIATION section of local National Weather Service forecast office Area Forecast Discussions This section provides the local office forecaster’s thoughts, reasoning, and uncertainty factors considered for aviation weather, ceiling, and visibility information contained in the TAFs.
From my perspective, the key to the utility of this tool lies in the second sentence: It provides the local office forecaster’s thoughts, reasons, and uncertainty factors considered in the process of developing the material in the official forecast.
Many of those who remember the days of visiting an on-airport Flight Service Station cherished being able to get the real scoop, one flavored by the staff’s encyclopedic knowledge of local weather idiosyncrasies. Though it doesn’t make up for the lack of face-to-face contact, the Aviation Weather Discussion tool does provide a bit more flavor and context to season your understanding of the standard terminal area forecast (TAF) and area forecast (FA).
Try it out, and tell us what you think. And by all means, please be sure to share the news of any other “Easter eggs” you find hidden in cyberspace. We’re all ears.
Susan Parson is a Special Assistant in the FAA’s Flight Standards Service and editor of FAA Safety Briefing. She is an active general aviation pilot and flight instructor.
S U S A N PA R S O N
Checklist

May/June 2012 FAA Safety Briefing 27
AMT Handbooks Receive Major OverhaulOn March 20, 2012, the FAA released brand
new revisions to both the Airframe and Powerplant Aviation Maintenance Technician Handbooks, adding over 400 pages of fresh content as well as hundreds of new full-color photos and detailed illustrations. The amount of new information required both the Airframe (FAA-H-8083-31) and Powerplant (FAA-H-8083-32) handbooks to be published as two-volume sets.
The extensive update was due in part to the last revision being more than 35 years ago. “We did a complete overhaul,” says Barry Watson, an Airworthiness Inspector with the FAA’s Regulatory Support Division in Oklahoma City, Okla. “There were several changes and improvements to airframe and powerplant technologies since our last revision, so we had our work cut out for us.”
Among some of the topics that were added or updated include advanced composites, plasma arc and tungsten inert gas (TIG) welding, light-sport aircraft engines, and a more comprehensive coverage of fuel systems. “We still kept a quite a bit of the information from the original handbooks, but made corrections and updates where needed and added several new color diagrams and photos,” says Watson. And to enable more efficient access to specific items, both a glossary and an index were added.
The revision also brings these important safety publications more in line with other industry handbooks and manuals currently available. According to Watson, several Part 147 aviation maintenance schools are already in the process of converting over to the new handbooks, and they are becoming the go-to reference guide for many Designated Maintenance Examiners (DME).
The Airframe and Powerplant handbook revisions complement the release of the General Handbook (FAA-H-8083-30) back in 2008. “Together, these three handbook revisions represent a vital step forward with regards to advancing AMT training and education,” says Watson. Watson also credits
the hard work of all those involved in the revision process. “We had several members of government, industry, and academia, who all pitched in to help this to be a successful product.”
The Airframe, Powerplant, and General handbooks are all currently available on the FAA website at http://www.faa.gov/library/manuals/aircraft/. Printed copies will be available through the Government Printing Office (GPO) beginning in May 2012. Also, be on the lookout for these and other FAA publications to be made available in a downloadable eBook format later this year.
If you have any questions or comments regarding the new handbooks, please email them to: [email protected].
Tom Hoffmann is associate editor of FAA Safety Briefing. He is a commercial pilot and holds an A&P certificate.
TOM HOF F M A N N
Nuts, Bolts, and Electrons
These handbook revisions represent a vital step forward with regards to advancing AMT training and education.
28 FAA Safety Briefing May/June 2012
“Weather” or Not To Go Why Extreme Weather Doesn’t Respect Experience
There’s a simple but practical quote about weather commonly heard in aviation circles; “A thunderstorm is never as bad on the inside as it appears on the outside. It’s worse.” Given the unpredictable nature of extreme weather events like thunderstorms, that’s a pretty accurate assessment. Unfortunately, weather-related accidents continue to be a common occurrence in general aviation, especially the variety that is often preceded by a breakdown in the decision-making process.
Although the 2010 Nall Report indicates a downward trend for overall weather related GA accidents from 2000 to 2009, the accident category VFR into IMC continues to lead the pack. It’s also worth noting in the report that although weather accidents are down, the lethality rate of these accidents are the highest among all major accident categories. The lethality rates for accidents which occurred during Day IMC and Night IMC conditions were 89 percent and 83 percent respectively. And of the 14 VFR-into-IMC accidents in 2009, 12 were fatal.
A similar lethality rate was seen with thunderstorm encounters where six of seven accidents in this category were fatal, along with all seven accidents attributed to deficient execution of instrument procedures by appropriately rated pilots on instrument flight plans. The common link in many of these accidents was simply a matter of extending pilot and plane beyond their capabilities.
Many pilots may remember the famed aviator Scott Crossfield, a rival of Chuck Yeager and the first man to fly twice the speed of sound. On the morning of April 19, 2006, Crossfield came face to face with a ferocious thunderstorm while piloting his Cessna 201A over Ludville, Georgia. Unfortunately, Crossfield did not survive this ugly encounter with Mother Nature. According to the NTSB report, the accident was caused by “the pilot’s failure to obtain updated en route weather information, which resulted in his continued instrument flight into a widespread area of severe convective activity, and
the air traffic controller’s failure to provide adverse weather avoidance assistance, as required by FAA directives, both of which led to the airplane’s encounter with a severe thunderstorm and subsequent loss of control.”
Despite Crossfield’s vast wealth of aeronautical experience, he was clearly no match for the violent thunderstorm. This accident also demonstrates how weather does not discriminate; Being unprepared for a weather event like this can have the same result whether you have 10 or 10,000 hours. Thunderstorms don’t stop to check your logbooks before unleashing their fury, nor will they indicate where and when the peak of their destructive power will occur.
Would the outcome of this accident been different had Crossfield obtained updated weather? Quite possibly. But even without that knowledge, the signs of impending bad weather should be enough of a cue for a pilot to safely alter his/her flight plan to avert danger. This becomes even more critical as we head into the warmer summer months where pop-up thunderstorms can regularly catch pilots off guard. In this kind of environment, escape plans are a must.
One tool that can help you sharpen your plan of action and make safe weather decisions either before or during a flight is the General Aviation Pilot’s Guide to Preflight Weather Planning, Weather Self-Briefings, and Weather Decision Making. You might also try the Flight Risk Analysis Tool or FRAT, a newly developed tool to help pilots identify potential flight hazards. Pilots are asked a series of questions regarding their airport and operating environment, their pilot experience, and their aircraft. Once the information is analyzed, pilots receive a flight risk analysis score, which may suggest you review and/or reconsider some of your operational choices. FRAT is accessible from any computer or smart phone and can be accessed at www.aircraftmerchants.com/FRAT.
Tom Hoffmann is associate editor of FAA Safety Briefing. He is a commercial pilot and holds an A&P certificate.
TOM HOF F M A N N
Angle of Attack

May/June 2012 FAA Safety Briefing 29
JA M e S W I L L I A MS
Vertically SpeakingHow Low Can You Go?
If you ask a fixed wing pilot about visibility requirements, minimum safe altitudes, and other topics, he or she is likely to rattle off a well-rehearsed set of numbers. But you’re flying a helicopter. Do the same numbers apply? Or are the rules different for aircraft in the rotorcraft category?
To quote a favorite phrase of regulators, engineers, and lawyers: It depends.
Minimum Safe AltitudesLet’s start with a quick review of the rules. Title
14 Code of Federal Regulations (14 CFR) part 91.119, Minimum Safe Altitudes, outlines the basics.
• Paragraph (a) requires that you fly at an altitude from which you could successfully land in the event of a power failure without causing an undue hazard to persons or property on the surface.
• Paragraph (b) covers congested areas and says you must maintain at least 1,000 feet above the highest obstacle within 2,000 feet of the aircraft.
• Paragraph (c) covers other than congested areas and requires a 500-foot clearance from the surface, or in the case of open water or sparsely populated areas, a 500-foot clearance (in any direction) from any person, vessel, vehicle, or structure.
But next comes paragraph (d), which removes the restrictions listed in paragraphs (b) and (c) for rotorcraft. So is the helicopter pilot home free? Since it does not relieve helicopter pilots from the provisions of paragraph (a), the minimum safe altitude requirement with respect to possible loss of power does apply. As is the case for fixed wing aircraft, the regulation leaves the exact altitude to the pilot’s discretion. Bear in mind, though, that flying at a very low altitude over a congested area is likely to result in noise complaints. And, should the unthinkable happen with power loss that results in injury or damage to persons and/or property on the ground, paragraph (a) will be the least of your worries.
VFR Weather MinimumsHow about minimums for weather? For this
answer, look in 14 CFR 91.155, Basic VFR weather minimums; and 14 CFR 91.157, Special VFR weather minimums.
For basic VFR, 14 CFR 91.155 (b) (1) removes the restriction of one mile visibility from the weather minimums for Class G airspace. It simply states a helicopter may be operated “clear of clouds if operated at a speed that allows the pilot adequate opportunity to see any air traffic or obstruction in time to avoid a collision.”
With respect to special VFR operations, 14 CFR 91.157 (b) (3) and (4) remove helicopters from many of the requirements of a special VFR clearance. Specifically, section (3) relieves helicopters from the one statue mile visibility requirement; section (4) relieves helicopter operators from the instrument rating and equipment requirements; and paragraph (c) relieves rotorcraft from the take off and landing minimums.
A final area of difference to explore on this topic arises from 14 CFR 97.3. Rotorcraft pilots should be aware that the copter procedures definition includes some interesting information. Specifically, it states that for other than “copter-only” approaches, the required visibility minimum for Category I approaches may be reduced to one-half of the published visibility minimum for Category A aircraft but not less than one-quarter mile prevailing visibility or, if reported, 1,200 feet runway visual range (RVR).
It’s important to know the numbers, but even more important to apply them in a responsible way. Though the nature of rotorcraft operations prompts the rules that give helicopter pilots a bit more leeway to operate at lower altitudes, the higher duty – always – is to operate in a safe manner.
James Williams is FAA Safety Briefing’s assistant editor and photo editor. He is also a pilot and ground instructor.
30 FAA Safety Briefing May/June 2012
Fast-track Your Medical CertificateWith FAA MedXPress, you can get your medical certificate faster than ever before.
Here’s how: Before your appointment with your Aviation Medical Examiner (AME) simply go online to FAA MedXPress at https://medxpress.faa.gov/ and electronically complete FAA Form 8500-8. Information entered into MedXPress is immediately transmitted to the FAA and forwarded to your AME before your medical examination.
With this online option you can complete FAA Form 8500-8 in the privacy and comfort of your home and submit it before your appointment.
The service is free and can be found at:
https://medxpress.faa.gov/
ATTENTION:
Beginning Oct. 1, 2012,
pilots must use MedXpress
to apply for a
Medical Certificate.

May/June 2012 FAA Safety Briefing 31
Flight Forum
Checkride PrepI’m writing in reference to the January/February
2012 issue, for the story, “Know the Score”. In this story it is stated, “...If you have failed a maneuver, the DPE must tell you that and give you the option of terminating the flight or continuing...” This is not entirely correct, and this misunderstanding sometimes results in complaints about the DPE’s conduct of the test.
FAA Order 8900.2, Chapter 7, Item 16. e. 2. states, “The examiner or the applicant may discontinue the test at any time when the failure of a required Area of Operation makes the applicant ineligible for the certificate or rating sought.”
Continuation of a practical test after failure must be a mutual decision between the examiner and the applicant. If the examiner is not comfortable continuing the test, they do not have to provide that continuation option to the applicant.
Greg Smith
You are absolutely correct in stating that an examiner may discontinue the test if he or she is not comfortable The point I was trying to make was that an examiner has the responsibility to inform an applicant of a failure, which means that the absence of feedback does not mean failure Therefore, the applicant can assume that if the examiner continues the test without comment, his or her performance up to that point is most likely satisfactory
Advanced PreflightJust read the March/April 2012 edition of FAA
Safety Briefing and as a full-time flight instructor, I frequently refer students and pilots I train to take advantage of your excellent publication.
One comment on Tom Hoffman’s thoughtful article, “Advanced Preflight.” In addition to becoming familiar with aircraft maintenance logs, airworthiness directives and service bulletins, don’t forget another valuable FAA resource - Special Airworthiness Information Bulletins (SAIB).
In particular, one photograph accompanying the article shows a fuel sample taken from what appears to be high-wing Cessna. Many pilots and
instructors are unaware of SAIB CE-10-40R1 - “Aircraft Fuel System; water contamination of fuel tank systems on Cessna single engine airplanes.” One recommendation contained in this SAIB is to “Drain at least one cup of fuel (using a clear sampler cup) from each drain location.”
The GATTS jar shown in the photo is a great tool for the job, but clearly more fuel needed to be drained. Some Cessnas have as many as five fuel sumps under each wing and by the time you’ve sumped just one wing tank, your GATTS jar may well be full.
John Ewing
Thanks for your comments on the Advanced Preflight article in our Mar/Apr 2012 issue You bring up a great point regarding the Cessna fuel system SAIB issued July 30, 2010(CE-10-40R1) The SAIB was actually something we ran in one of our bi-weekly FAAST Blast messages back in August 2010, but we agree a link or mention of it here would have been helpful SAIB CE-12-06 is another good reference for fuel systems
And yes, although the fuel sample photo we used was mainly to illustrate the need to use a contrasting background, the photo clearly does not show enough sample fuel in the cup We plan on getting some new photos of fuel samples for future use
FAA Safety Briefing welcomes comments. We may edit letters for style and/or length. If we have more than one letter on a topic, we will select a representative letter to publish. Because of publishing schedule, responses may not appear for several issues. While we do not print anonymous letters, we will withhold names or send personal replies upon request. If you have a concern with an immediate FAA operational issue, contact your local Flight Standards District Office or air traffic facility. Send letters to: Editor, FAA Safety Briefing, AFS-805, 800 Independence Avenue, SW, Washington, DC 20591, or e-mail [email protected].
Let us hear from you—comments, suggestions, and questions: e-mail [email protected]
OR
Use a smartphone QR reader to go “VFR-direct” to our mailbox.
32 FAA Safety Briefing May/June 2012
S U S A N PA R S O N
PostflightIn Defense of Weather Code
Like any modern aviatrix and technology buff, I have stocked my iPad and my iPhone with a full suite of aviation apps that offer everything you could possibly want in terms of weather data and nifty color graphics. And I don’t leave home without my electronic assistants. In this era and certainly in this airspace at the heart of Washington’s Special Flight Rules Area (SFRA), no gadget means no go.
But here’s where it gets weird: I am an avid fan of traditional weather code. My coterie of code-o-phobic flying friends regard my taste for raw meteorological data with the same kind of shocked aversion that I might have if they served me a plate of, say, raw steak: plenty of potential, but a tad too hard to digest.
Since today’s technology gives you the option to wave ta-ta to weather tartare, why bother mastering outmoded abbreviations that look too much like a vowel-deficient puzzle from the Wheel of Fortune® game show? Here’s why I like it so much.
Code Packs a PunchI don’t do home brew – either for beverages
or approaches – but I know enough about the distillation process to think of weather code as the meteorological equivalent of spirits. An example from my home airport, KJYO, illustrates the point. First, take a look at the ADDS-generated plain language version of a recent hourly meteorological observation (METAR):
Conditions at: KJYO (LEESBURG/GODFREY, VA, US) observed 1635 UTC 15 March 2012 Temperature: 26.0°C (79°F) Dewpoint: 9.0°C (48°F) [RH = 34%] Pressure (altimeter): 30.18 inches Hg (1022.1 mb) Winds: from the WSW (240 degrees) at 6 MPH (5 knots; 2.6 m/s) Visibility: 10 or more miles (16+ km) Ceiling: at least 12,000 feet AGL Clouds: sky clear below 12,000 feet AGL Weather: automated observation with no human augmentation; there may or may not be significant weather present at this time.
Now let’s look at the raw or, as ADDS calls it, “undecoded” version of the same hourly observation:
KJYO 151635Z AUTO 24005KT 10SM CLR 26/09 A3018 RMK AO2.
The coded METAR packs multiple lines of information into a much tighter presentation. And that leads to a second advantage that raw data has over plain English: Code is a quick read.
Code is QuickBefore you hoot me down, let me hasten to
acknowledge that, yes, learning to read weather code requires an up-front intellectual investment. You do have to spend some time, and you do have to make some effort to learn the truncated terms of weather code. But consider that it’s a one-time investment. Once you’ve mastered it, you can routinely absorb weather information much more quickly than someone who is reading the same data in plain English format.
To reinforce the point, here’s one of my favorite tips about raw weather code. As illustrated by the example given earlier, the shorter the code, the better the weather. After all, it doesn’t take a lot of letters to convey calm winds and clear skies. When I see a longer weather code entry, though, I know that I’m going to have to spend more time understanding which weather hazards lurk along my route.
And finally…
Code is CoolEver stop to ponder why some people give their
ultra-modern smartphones the ultra-retro ringtone of an old-timey telephone? If retro-ringtones can be cool, I contend that retro weather code can be cool too. The nice thing is that today’s technology gives us choices for both.
Susan Parson ([email protected], or @avi8rix for Twitter fans) is editor of FAA Safety Briefing. She is an active general aviation pilot and flight instructor.
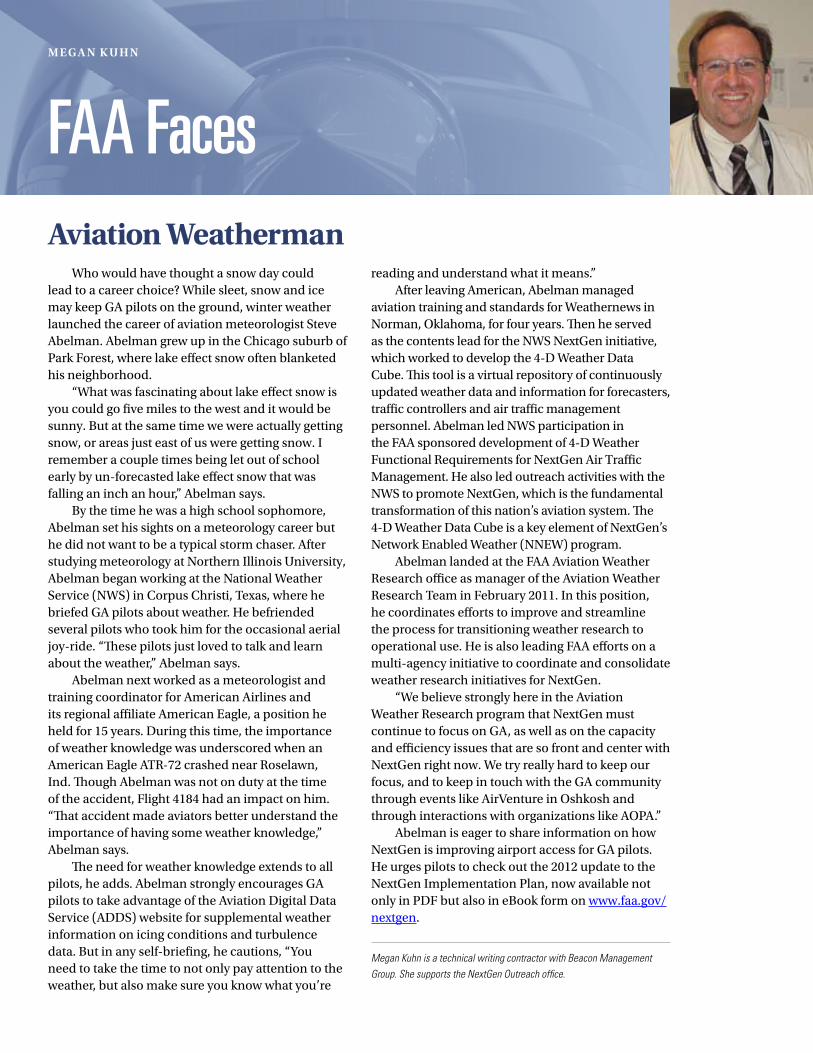
M eG A N k U H N
FAA FacesAviation Weatherman
Who would have thought a snow day could lead to a career choice? While sleet, snow and ice may keep GA pilots on the ground, winter weather launched the career of aviation meteorologist Steve Abelman. Abelman grew up in the Chicago suburb of Park Forest, where lake effect snow often blanketed his neighborhood.
“What was fascinating about lake effect snow is you could go five miles to the west and it would be sunny. But at the same time we were actually getting snow, or areas just east of us were getting snow. I remember a couple times being let out of school early by un-forecasted lake effect snow that was falling an inch an hour,” Abelman says.
By the time he was a high school sophomore, Abelman set his sights on a meteorology career but he did not want to be a typical storm chaser. After studying meteorology at Northern Illinois University, Abelman began working at the National Weather Service (NWS) in Corpus Christi, Texas, where he briefed GA pilots about weather. He befriended several pilots who took him for the occasional aerial joy-ride. “These pilots just loved to talk and learn about the weather,” Abelman says.
Abelman next worked as a meteorologist and training coordinator for American Airlines and its regional affiliate American Eagle, a position he held for 15 years. During this time, the importance of weather knowledge was underscored when an American Eagle ATR-72 crashed near Roselawn, Ind. Though Abelman was not on duty at the time of the accident, Flight 4184 had an impact on him. “That accident made aviators better understand the importance of having some weather knowledge,” Abelman says.
The need for weather knowledge extends to all pilots, he adds. Abelman strongly encourages GA pilots to take advantage of the Aviation Digital Data Service (ADDS) website for supplemental weather information on icing conditions and turbulence data. But in any self-briefing, he cautions, “You need to take the time to not only pay attention to the weather, but also make sure you know what you’re
reading and understand what it means.”After leaving American, Abelman managed
aviation training and standards for Weathernews in Norman, Oklahoma, for four years. Then he served as the contents lead for the NWS NextGen initiative, which worked to develop the 4-D Weather Data Cube. This tool is a virtual repository of continuously updated weather data and information for forecasters, traffic controllers and air traffic management personnel. Abelman led NWS participation in the FAA sponsored development of 4-D Weather Functional Requirements for NextGen Air Traffic Management. He also led outreach activities with the NWS to promote NextGen, which is the fundamental transformation of this nation’s aviation system. The 4-D Weather Data Cube is a key element of NextGen’s Network Enabled Weather (NNEW) program.
Abelman landed at the FAA Aviation Weather Research office as manager of the Aviation Weather Research Team in February 2011. In this position, he coordinates efforts to improve and streamline the process for transitioning weather research to operational use. He is also leading FAA efforts on a multi-agency initiative to coordinate and consolidate weather research initiatives for NextGen.
“We believe strongly here in the Aviation Weather Research program that NextGen must continue to focus on GA, as well as on the capacity and efficiency issues that are so front and center with NextGen right now. We try really hard to keep our focus, and to keep in touch with the GA community through events like AirVenture in Oshkosh and through interactions with organizations like AOPA.”
Abelman is eager to share information on how NextGen is improving airport access for GA pilots. He urges pilots to check out the 2012 update to the NextGen Implementation Plan, now available not only in PDF but also in eBook form on www.faa.gov/nextgen.
Megan Kuhn is a technical writing contractor with Beacon Management Group. She supports the NextGen Outreach office.
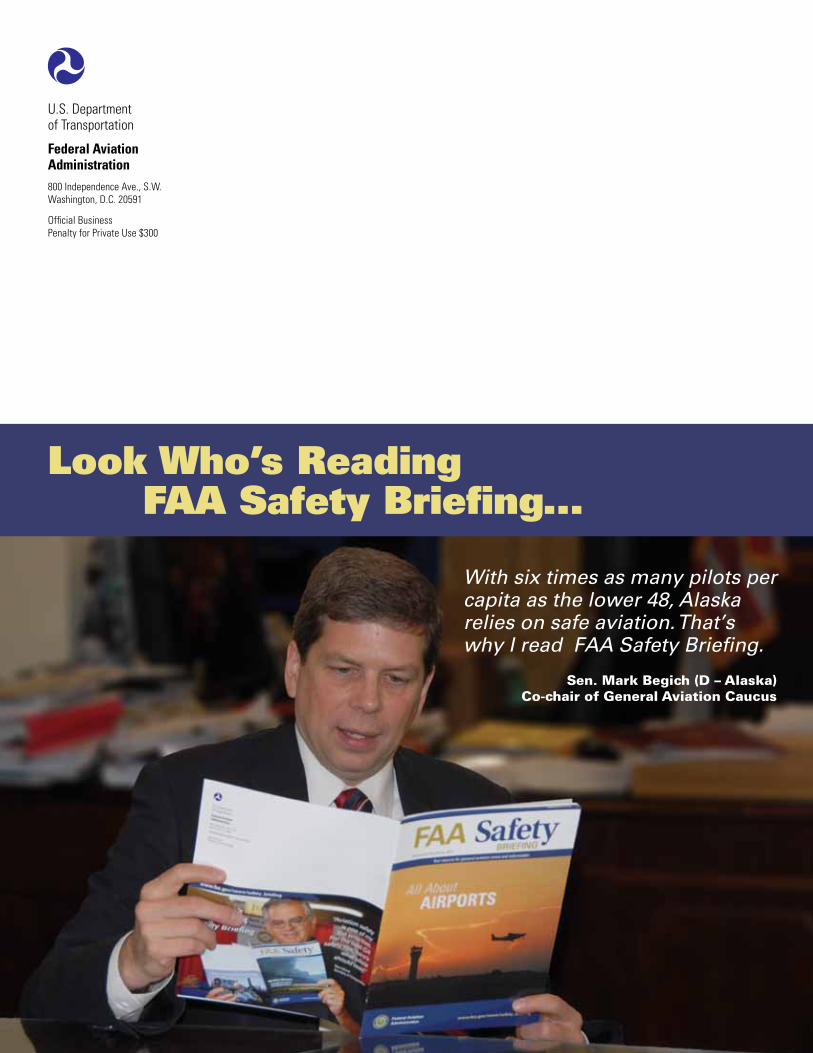
Look Who’s Reading FAA Safety Briefing...
U.S. Departmentof Transportation
Federal Aviation Administration800 Independence Ave., S.W.Washington, D.C. 20591
Official BusinessPenalty for Private Use $300
With six times as many pilots per capita as the lower 48, Alaska relies on safe aviation. That’s why I read FAA Safety Briefing.
Sen. Mark Begich (D – Alaska)Co-chair of General Aviation Caucus