fa milies of s chools - birmingham education partnership · 1 this document has been produced by...
TRANSCRIPT

FaBirmi
2016
amingham
iliem Prim
es oary Sc
of Schools
Sch- Key
hoostage
ols2
s

1
This document has been produced by the Intelligence and Analysis Team, Commissioning Centre of Excellence, Birmingham City Council
Contact Details
Richard Browne Intelligence Manager
James Killan Intelligence Officer
Brenda Henry Intelligence Officer
Email: [email protected]
Tel: 0121 303 8846
December 2016
2
Contents
Foreword ............................................................................................................................................................................... 4
Introduction ........................................................................................................................................................................... 5
Background ....................................................................................................................................................................... 5
How have the schools been grouped? ......................................................................................................................... 5
Schools Included .............................................................................................................................................................. 5
Notes on data ................................................................................................................................................................... 6
Definition of terminology relating to Attainment and contextual data ....................................................................... 6
Contextual Families ......................................................................................................................................................... 7
Using the Families of Schools document ......................................................................................................................... 8
Finding a school ............................................................................................................................................................... 8
Making comparisons with other schools ....................................................................................................................... 8
How Families of Schools was used in London .............................................................................................................. 12
Case Study - Family 9 - London Families of Schools ............................................................................................... 12
Birmingham in context ....................................................................................................................................................... 13
Characteristics sheet ..................................................................................................................................................... 14
Attainment sheet ............................................................................................................................................................ 15
District breakdown charts for expected standard, ethnicity and disadvantaged/FSM ......................................... 16
Family Groups .................................................................................................................................................................... 18
Contextual Family pages ................................................................................................................................................ 106
Appendices ....................................................................................................................................................................... 114
How have the schools been grouped? ..................................................................................................................... 114
Included Measures (for definitions see section at beginning of document) ........................................................ 114
Standardisation Methodology ..................................................................................................................................... 114
Family Group Weightings............................................................................................................................................ 115
Income deprivation affecting children ....................................................................................................................... 116
Data quality ................................................................................................................................................................... 117
School and Family Group List ........................................................................................................................................ 117
Map of Birmingham showing location of schools by family group ............................................................................ 124

3

4
Foreword
I am delighted to introduce the first edition of Families of Schools for Birmingham as part of BEP’s mission to support schools working together. Its purpose is to help schools see how others with similar intakes serve their pupils. Headteachers in London, the Black country and Manchester were provided with similar resources as part of the London/City Challenge programmes; they really valued these as helpful so I hope you take the time to familiarise yourself with this resource.
Schools in Birmingham face a number of challenges. They also boast an enormous collective pool of expert leaders and teachers. The purpose of this document is to point you towards similar schools facing similar circumstances with whom you can share practice and experiences. Whatever the problem, this document shows there are always schools to whom you can turn and this is a very important and powerful school improvement tool.
We have grouped all Birmingham Primary schools into families according to prior attainment and context data. You will find your school in one of these 22 families. We have included a good practice example of how schools across London used this document to improve results. There are also additional families based on EAL and mobility indicators at the back of the document.
We are also releasing a video which you can access via the BEP website to give you further information. We are hoping that should you find it useful we can provide the document again following the 2017 results.
I hope you use this edition to develop and further strengthen your collaboration with other schools, and with your colleagues internally to bring about improvements for your pupils. Families of Schools played an integral part of the positive London story in recent years and I am confident it will help do the same for Birmingham. The successes we are trying to facilitate through BEP lie ultimately in your hands. I hope that this document will help contribute to that.
Tracy Ruddle
Director of Continuous School Improvement
Birmingham Education Partnership
5
Introduction
Background
In 2008 the DFE published the first edition of Families of Schools reports for primary and secondary schools in the Black Country, London and Greater Manchester. Schools were allocated to families based on a number of factors including key stage 1 Average Points Score, measures of deprivation and the proportion of children with English as an additional language. This enabled schools with statistically similar intakes to understand the size and nature of their attainment gap and provided the opportunity for schools to learn from the best performing school in each family. The reports were well received and subsequent reports were published in 2009, 2010 and 2011. The DFE has recently confirmed that there are no plans to produce further editions.
This is the first edition of “Families of Schools” for Birmingham. This edition includes key stage 2 results and a Value Added measure.
How have the schools been grouped?
Schools are grouped into families on the basis of a combination of an average of their key stage 2 children’s prior attainment and contextual data obtained from the January census.
The measures include:
Prior attainment Income deprivation affecting children index (IDACI) Free school meal eligibility (FSM) English as an additional language (EAL) Mobility
Using the methodology described at the end of this document an overall score for each school has been determined based on a specific weighting and the schools allocated to family groups.
Schools Included
All open establishments as of November 2016 which are mainstream state funded schools or academies within Birmingham that had a year 6 class for the academic year 2015 – 2016. Schools closing since submitting their 2016 key stage 2 or census data have been matched to the new establishment.

6
Notes on data
All data used within this document has been obtained from the 2016 January school census and provisional pupil level performance tables files.
Only schools that are included within the family groups remit are referenced throughout this document.
Characteristics of Birmingham constituencies - This information is populated from school census and includes all pupils living in indicated areas, within the year groups reception to year 6 and who are attending a state funded school within Birmingham.
Characteristics of schools and their pupils - This information is populated from school census and includes all pupils who are in reception to year 6 who are not classed as a subsidiary dual registration for the indicated school.
Characteristics of Year 6 pupils – Populated from pupil level performance table files matched to the contextual information held within the school census. It is representative of children within schools upon submission of end of key stage 2 results rather than census day.
Attainment Data and Key stage 2 subject information - Populated from pupil level performance table files. It is representative of school outcomes at key stage 2 for the end of 2016.
Definition of terminology relating to Attainment and contextual data
Prior Attainment – This is defined by the progress measures within the current DfE performance tables. It is the average key stage 1 point score of all pupils that make up the key stage 2 results for each school.
Prior attainment decile – The prior attainment measure for each school is ranked, then grouped into deciles 1-10, where 1 is the lowest and 10 the highest.
Contextual decile – Equally weighted combination of the proportion of children who; live in income deprived households, have English as an additional language, are eligible for free school meals and are defined as ‘Mobile’. This is ranked then grouped into deciles 1-10, where 1 is the lowest and 10 the highest.
IDACI – Income deprivation affecting children index. This represents the proportion of children under the age of 16 that live in low income households within the local area.
Pupils defined as mobile (Mobility) - A pupil is classed as being mobile if their entry date into the current school is within the previous 3 academic years and whose start month was not in August or September. If the pupil started in Reception then start months August, September or January will not be counted. Pupils who started in nursery classes are not mobile. For academies pupils with an entry date the same as the school open date are not counted as mobile.

7
FSM - Known to be eligible for and claiming free school meals on census day.
Disadvantaged - All children who have been eligible for free school meals (FSM) within the last 6 academic years, have been looked after continuously for 1 day or have been adopted from care.
EAL - Pupil's first language is defined as any language other than English or is believed not to be English.
SEN – Special Educational Needs, SEN Support and EHC (Education, Health and Care) Plans being the two basic tiers of status.
All attainment data within this document relate to key stage 2 outcomes for the academic year ending 2016.
The new primary school accountability system was introduced for all state funded schools for the academic year 2015 – 2016. As this new system differs substantially from the old level based structure, the decision has been made not to take into account previous years key stage 2 outcomes into the grouping of schools or in any displayed tables or graphs. The previous key stage 1 attainment measures used relate directly to the new key stage 1 to key stage 2 progress measures and are therefore pupil rather than school centric.
For further reading regarding Primary school accountability please refer to: https://www.gov.uk/government/publications/primary-school-accountability
Contextual Families
These bring together schools in Birmingham with the highest proportion of mobile pupils and pupils with EAL, enabling schools to compare themselves and share their experiences with others, in a similar way to the main families. The creation of these families simply recognises the schools providing for large proportions of pupils with these characteristics are likely to share some issues and experiences and may benefit from making links with other similar schools.
8
Using the Families of Schools document
The data presented here enables you to compare the outputs of your school against the outputs of other Birmingham schools with statistically similar pupil intakes. There are many ways in which you can analyse and use the data. Case studies showing how schools in London used Families of Schools data can be found further on in this document.
Finding a school
To locate your school you should refer to the list of schools at the back of this document. All schools are listed in alphabetical order in a grid that shows which family the school belongs to. Data for your school will be shown on the appropriate family pages.
Making comparisons with other schools
The Families of Schools document is designed to enable you to compare data about your school’s characteristics, improvement and performance with that for other schools. When making comparisons, you are encouraged to look at schools within your family and also at neighbouring families. This is particularly relevant to schools appearing in the middle families.
What does the data show me?
CHARACTERISTICS OF SCHOOLS AND THEIR PUPILS*
School Ty pe LA A A LA LA LA LA A
School Designation CS AC AS CS CS CS CS AS
Number of full time pupils 322 211 410 434 232 813 210 354
Boy s as a percentage of full time pupils 52 53 47 50 46 50 59 53
Girls as a percentage of full time pupils 48 47 53 50 54 50 41 47
Prior Attainment Decile 2 2 2 3 3 3 3 3
Contex tual Decile 7 5 3 7 6 4 5 4
White British 33 6 0 41 69 0 6 9
Irish 0 0 0 0 0 0 0 0
Trav eller of Irish Heritage 0 0 0 0 0 0 0 0
White Other 6 1 1 6 2 0 2 9
Gy psy / Roma 0 0 2 0 0 3 3 0
White and Black Caribbean 8 6 1 8 5 0 5 0
White and Black African 1 0 0 1 3 0 1 0
White and Asian 2 4 0 2 2 1 2 0
Any Other Mix ed Background 3 12 1 3 2 1 1 5
Indian 2 5 3 2 0 1 3 2
Pakistani 15 4 69 11 0 73 50 49
Bangladeshi 2 2 1 0 1 8 19 5
Any Other Asian Background 1 2 1 0 1 2 0 1
Black Caribbean 10 19 1 10 4 0 1 2
Black African 6 14 5 8 4 4 2 6
Any Other Black Background 3 7 1 1 3 0 1 7
Chinese 0 5 0 1 0 0 0 1
Any other ethnic group 4 13 12 2 3 8 3 2
Unclassified 2 1 1 2 0 0 1 0
IDACI rate for school 33.2 32.1 29.9 31.1 34.7 31.1 34.0 34.1
% of pupils defined as mobile 11 19 17 10 10 7 9 17
% of pupils know n to be eligible for FSM 21 27 15 36 45 23 17 26
% of pupils that are disadv antaged 38 49 29 51 69 35 30 35
% of pupils w ith EAL 24 43 93 17 9 92 64 56
% of pupils on SEN Support 9 16 20 14 15 11 28 8
% of pupils w ith ECH Plan 1 0 1 1 1 1 0 1
Percentage authorised absence 3 2 3 4 4 3 2 4
Percentage unauthorised absence 2 2 2 2 1 1 1 1
Perc
enta
ge o
f all
pupi
ls Y
ear 1
to Y
ear 6
Whi
teM
ixed
Asia
nBl
ack
Oth
er
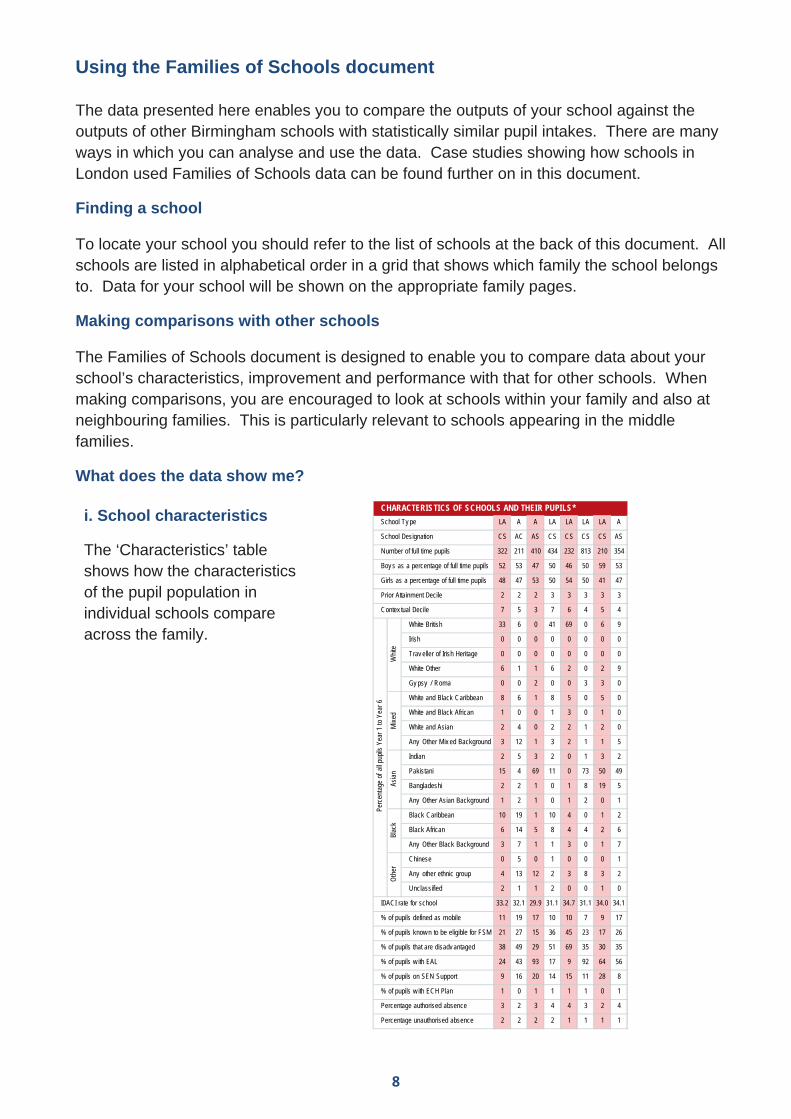
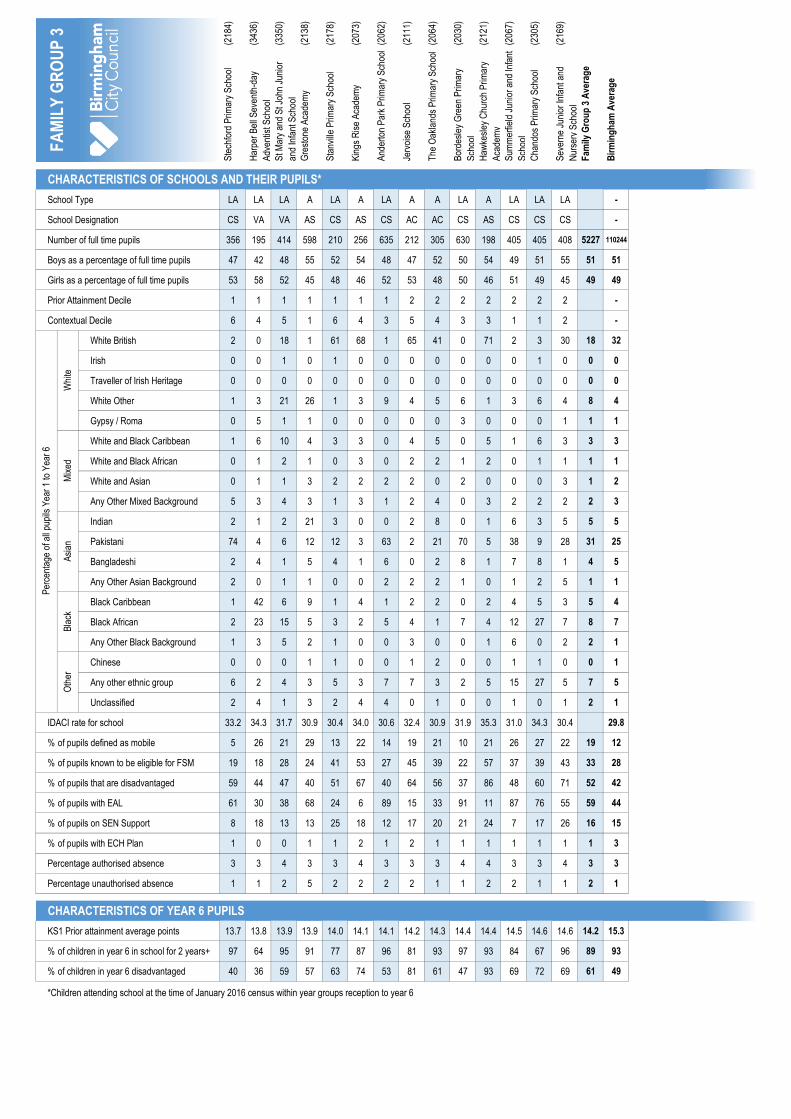
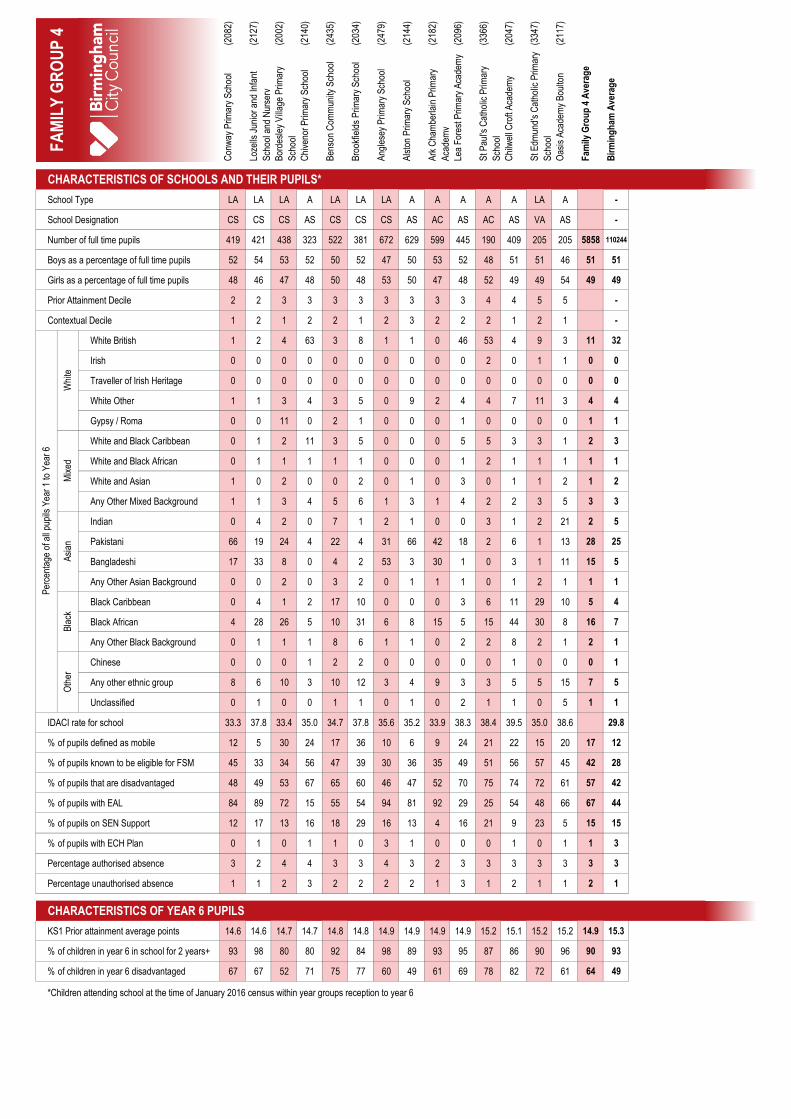
i. School characteristics
The ‘Characteristics’ table shows how the characteristics of the pupil population in individual schools compare across the family.
9
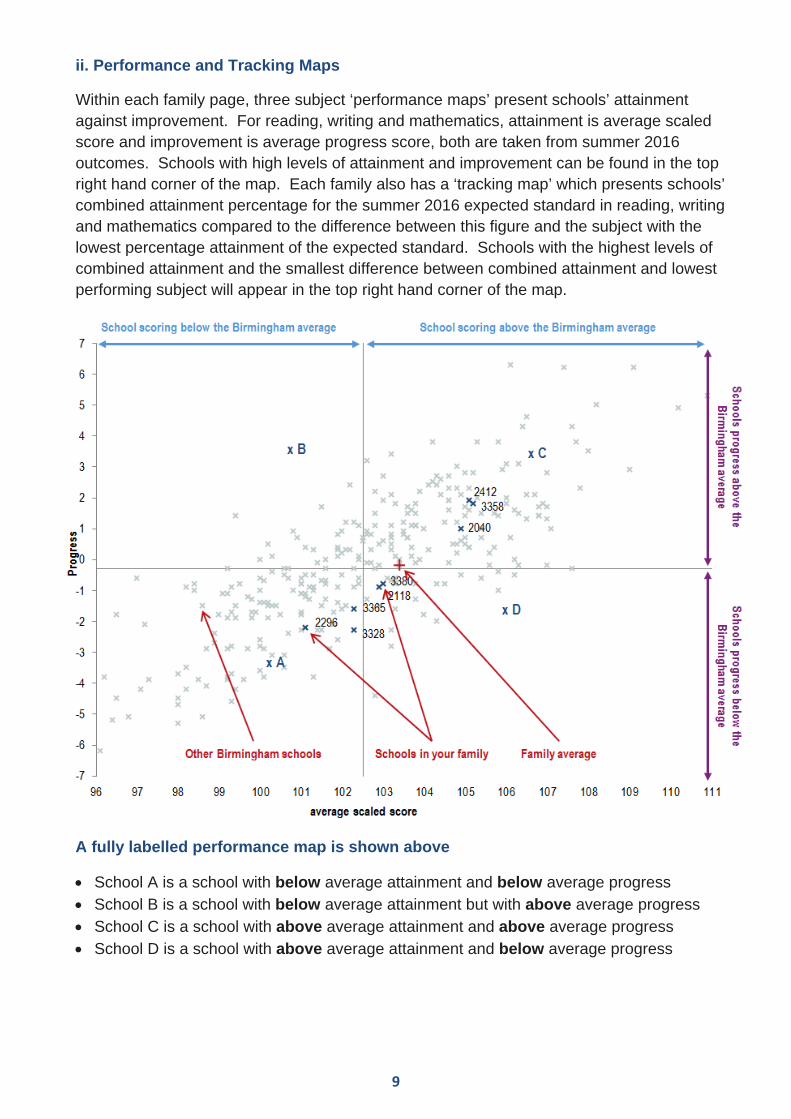
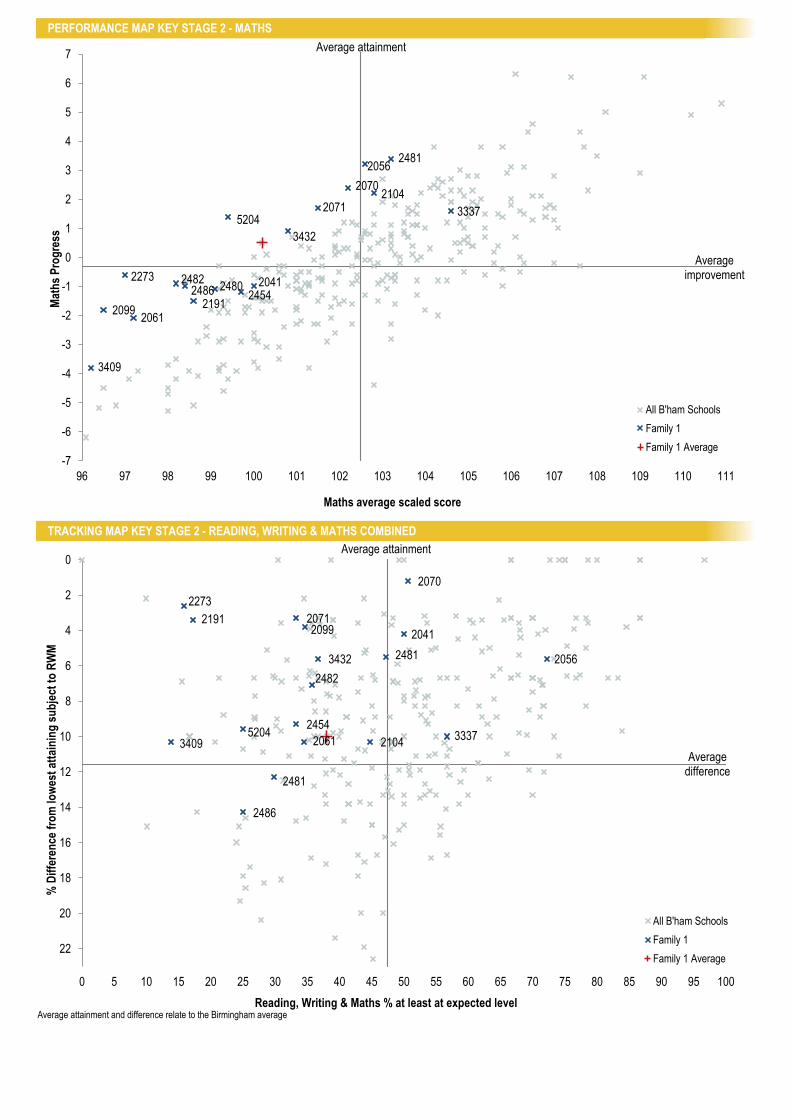
ii. Performance and Tracking Maps
Within each family page, three subject ‘performance maps’ present schools’ attainment against improvement. For reading, writing and mathematics, attainment is average scaled score and improvement is average progress score, both are taken from summer 2016 outcomes. Schools with high levels of attainment and improvement can be found in the top right hand corner of the map. Each family also has a ‘tracking map’ which presents schools’ combined attainment percentage for the summer 2016 expected standard in reading, writing and mathematics compared to the difference between this figure and the subject with the lowest percentage attainment of the expected standard. Schools with the highest levels of combined attainment and the smallest difference between combined attainment and lowest performing subject will appear in the top right hand corner of the map.
A fully labelled performance map is shown above
School A is a school with below average attainment and below average progress School B is a school with below average attainment but with above average progress School C is a school with above average attainment and above average progress School D is a school with above average attainment and below average progress
10
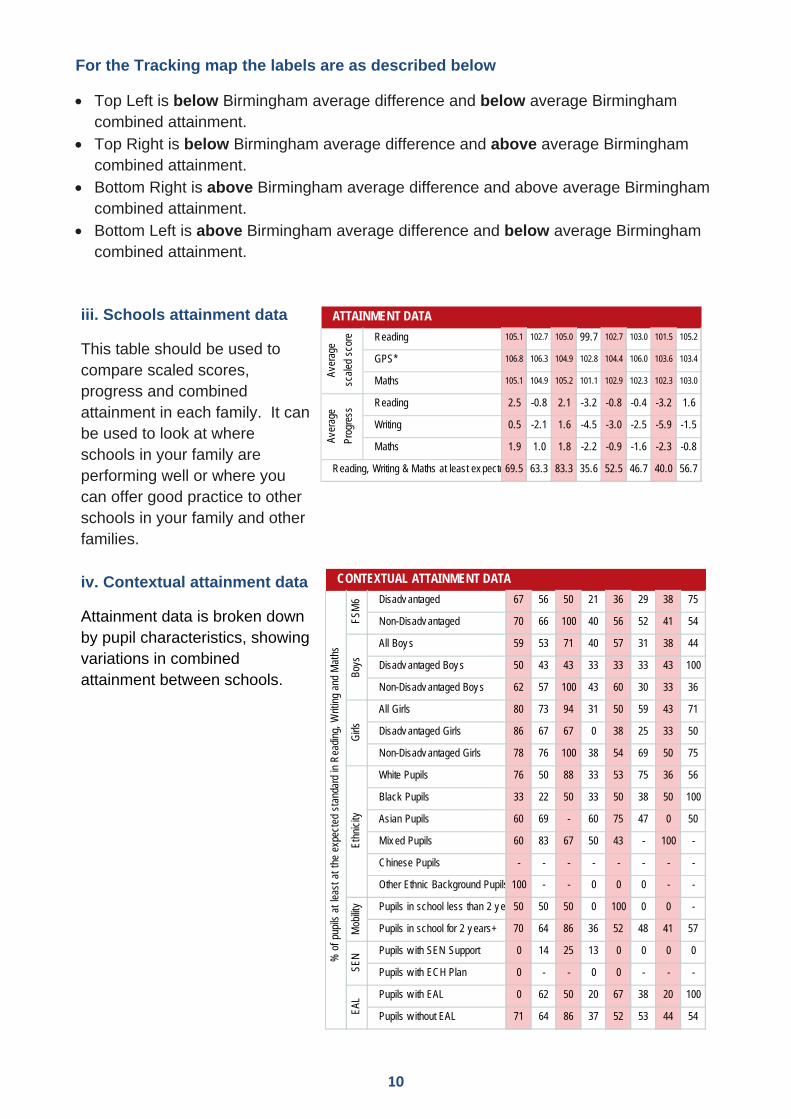
For the Tracking map the labels are as described below
Top Left is below Birmingham average difference and below average Birmingham combined attainment.
Top Right is below Birmingham average difference and above average Birmingham combined attainment.
Bottom Right is above Birmingham average difference and above average Birmingham combined attainment.
Bottom Left is above Birmingham average difference and below average Birmingham combined attainment.
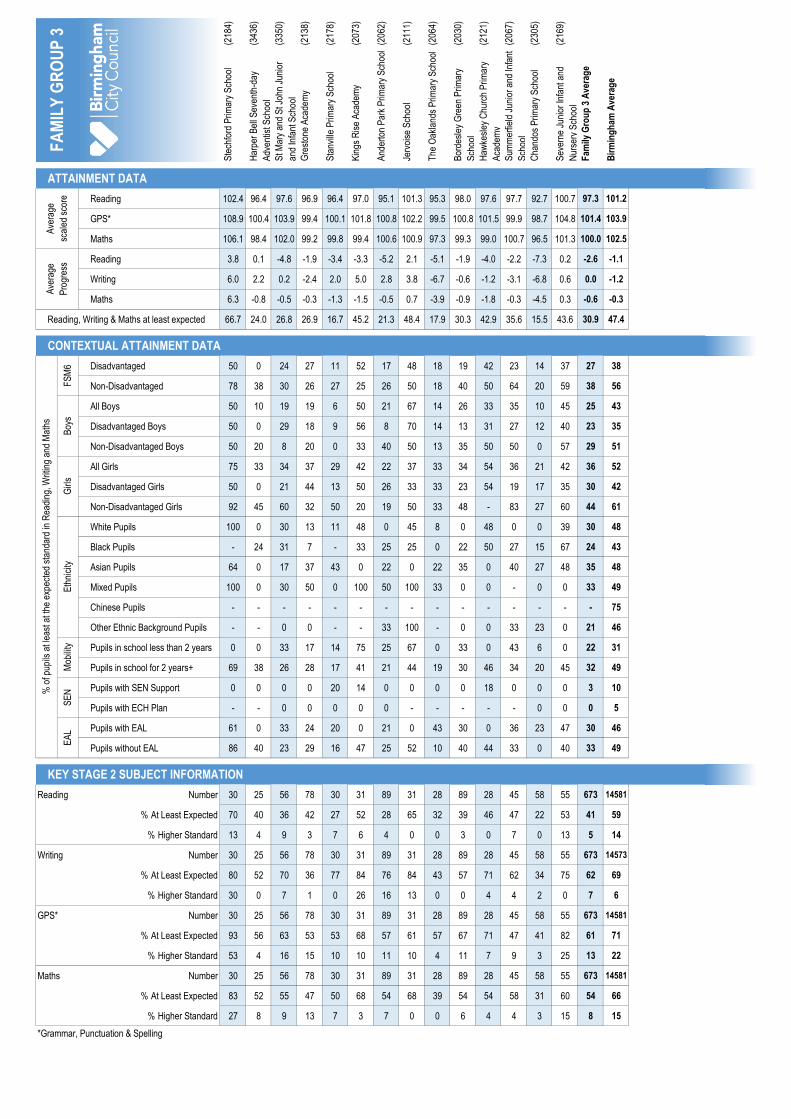
ATTAINMENT DATA
Reading 105.1 102.7 105.0 99.7 102.7 103.0 101.5 105.2
GPS* 106.8 106.3 104.9 102.8 104.4 106.0 103.6 103.4
Maths 105.1 104.9 105.2 101.1 102.9 102.3 102.3 103.0
Reading 2.5 -0.8 2.1 -3.2 -0.8 -0.4 -3.2 1.6
Writing 0.5 -2.1 1.6 -4.5 -3.0 -2.5 -5.9 -1.5
Maths 1.9 1.0 1.8 -2.2 -0.9 -1.6 -2.3 -0.8
Reading, Writing & Maths at least ex pecte69.5 63.3 83.3 35.6 52.5 46.7 40.0 56.7
Aver
age
scal
ed s
core
Aver
age
Prog
ress
CONTEXTUAL ATTAINMENT DATA
Disadv antaged 67 56 50 21 36 29 38 75
Non-Disadv antaged 70 66 100 40 56 52 41 54
All Boy s 59 53 71 40 57 31 38 44
Disadv antaged Boy s 50 43 43 33 33 33 43 100
Non-Disadv antaged Boy s 62 57 100 43 60 30 33 36
All Girls 80 73 94 31 50 59 43 71
Disadv antaged Girls 86 67 67 0 38 25 33 50
Non-Disadv antaged Girls 78 76 100 38 54 69 50 75
White Pupils 76 50 88 33 53 75 36 56
Black Pupils 33 22 50 33 50 38 50 100
Asian Pupils 60 69 - 60 75 47 0 50
Mix ed Pupils 60 83 67 50 43 - 100 -
Chinese Pupils - - - - - - - -
Other Ethnic Background Pupils 100 - - 0 0 0 - -
Pupils in school less than 2 y e 50 50 50 0 100 0 0 -
Pupils in school for 2 y ears+ 70 64 86 36 52 48 41 57
Pupils w ith SEN Support 0 14 25 13 0 0 0 0
Pupils w ith ECH Plan 0 - - 0 0 - - -
Pupils w ith EAL 0 62 50 20 67 38 20 100
Pupils w ithout EAL 71 64 86 37 52 53 44 54EAL
FSM
6Bo
ysG
irls
Ethn
icity
% o
f pup
ils a
t lea
st a
t the
exp
ecte
d st
anda
rd in
Rea
ding
, Writ
ing
and
Mat
hs
Mob
ility
SEN
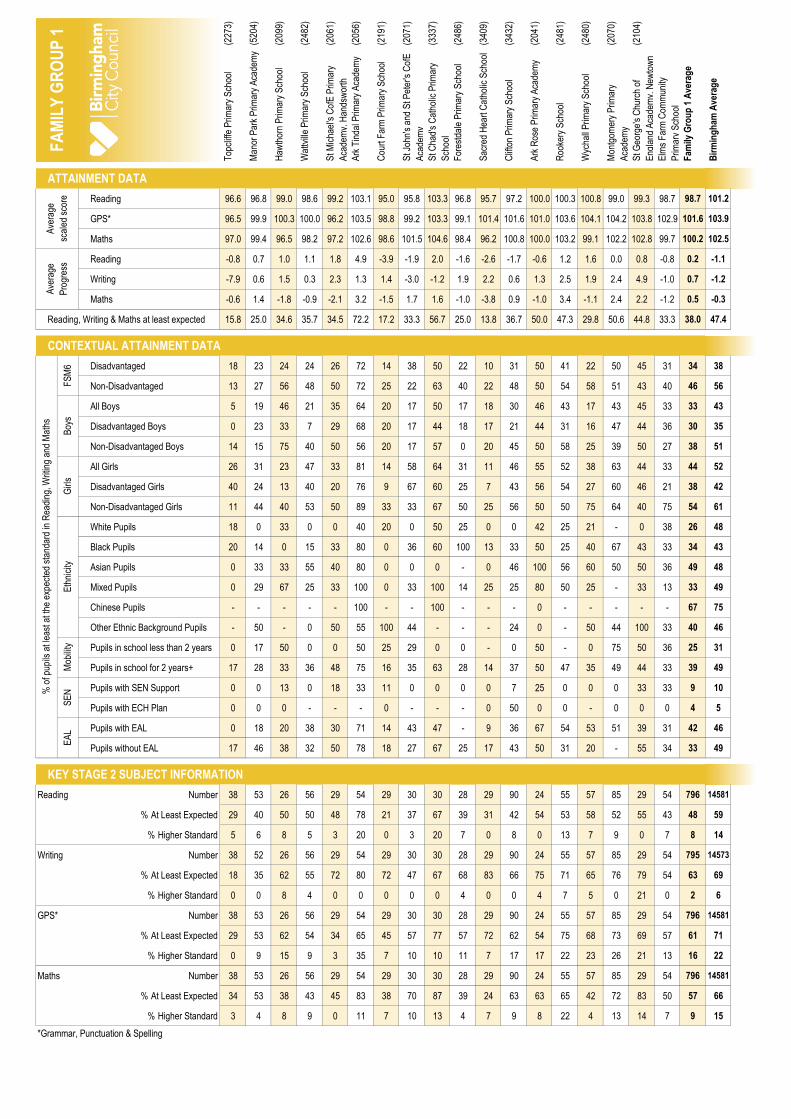
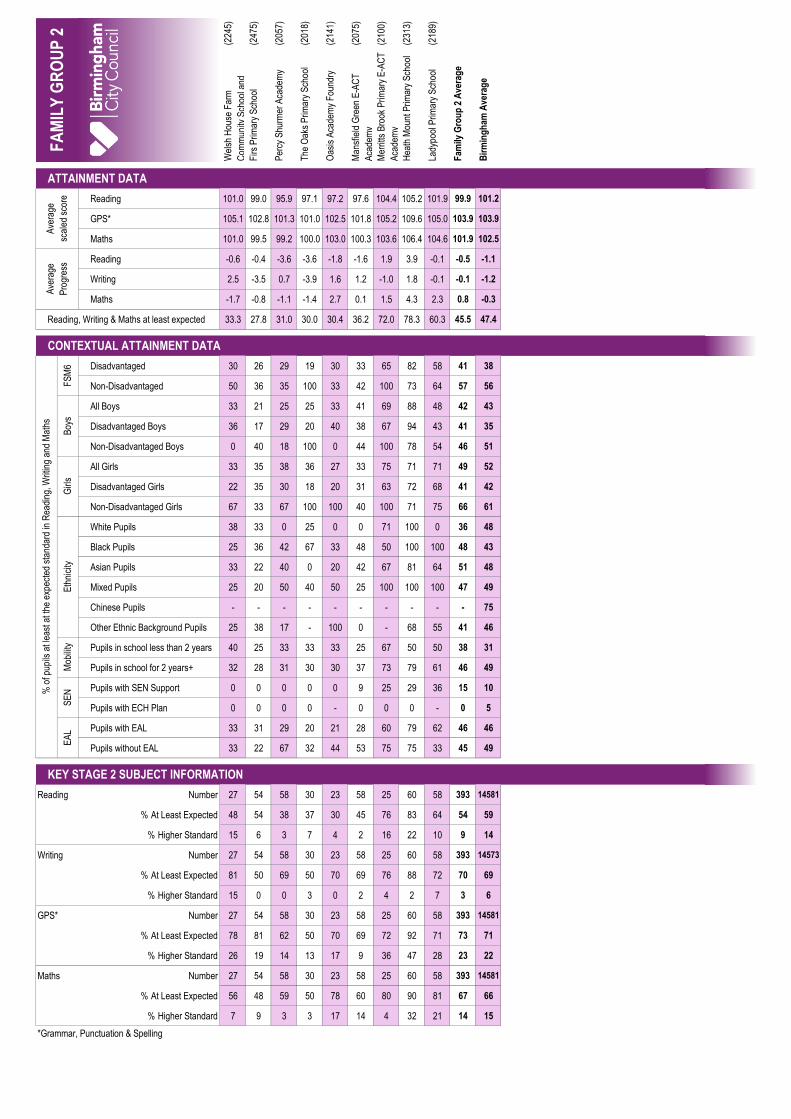
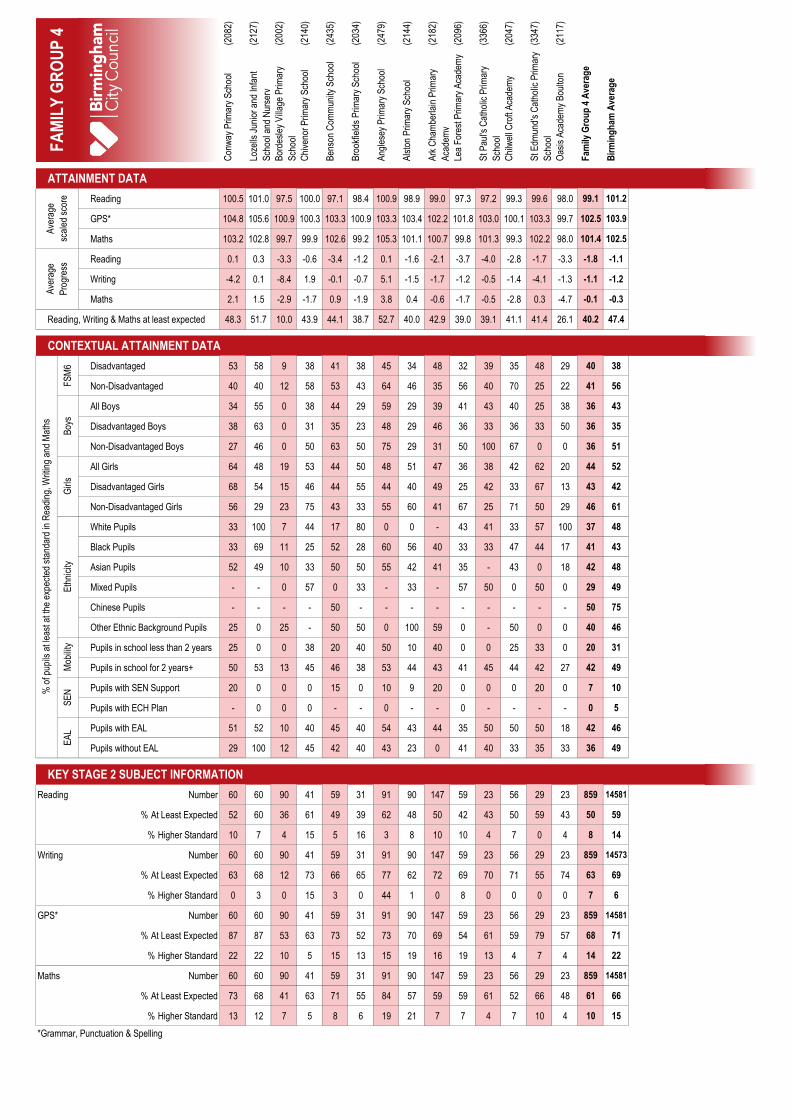
iii. Schools attainment data
This table should be used to compare scaled scores, progress and combined attainment in each family. It can be used to look at where schools in your family are performing well or where you can offer good practice to other schools in your family and other families.
iv. Contextual attainment data
Attainment data is broken down by pupil characteristics, showing variations in combined attainment between schools.
11
KEY STAGE 2 SUBJECT INFORMATION
Reading Number 59 60 30 59 59 30 30 30
% At Least Ex pected 78 68 90 53 78 77 50 80
% Higher Standard 32 17 17 8 12 10 13 30
Writing Number 59 60 30 59 59 30 30 30
% At Least Ex pected 81 77 93 54 64 73 63 77
% Higher Standard 14 5 13 2 7 3 0 7
GPS* Number 59 60 30 59 59 30 30 30
% At Least Ex pected 86 87 80 75 83 87 70 83
% Higher Standard 41 30 17 17 19 27 17 13
Maths Number 59 60 30 59 59 30 30 30
% At Least Ex pected 88 82 93 64 68 67 63 73
% Higher Standard 22 22 17 8 15 10 10 13
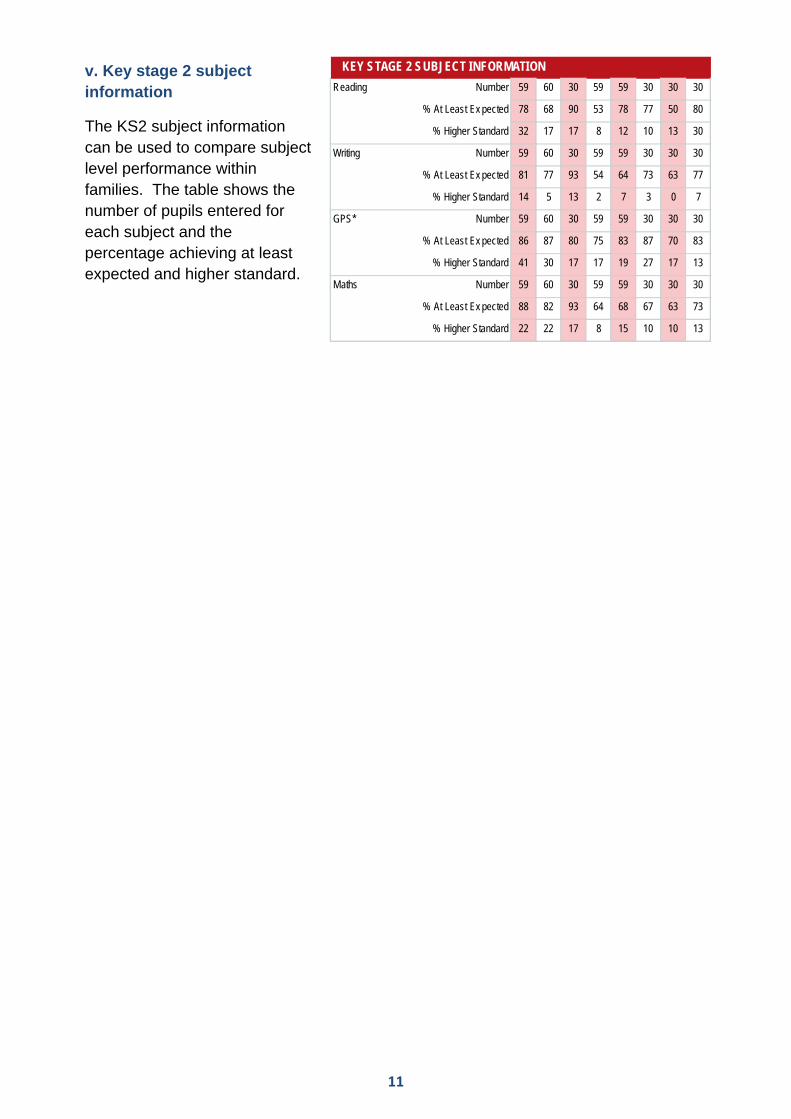
v. Key stage 2 subject information
The KS2 subject information can be used to compare subject level performance within families. The table shows the number of pupils entered for each subject and the percentage achieving at least expected and higher standard.

12
How Families of Schools was used in London
The Families of Schools data was used by headteachers and wider school staff in London schools as a key driver for collaborative approaches to school improvement. Families networks were initiated, and developed as a vehicle for sharing effective practice and for mutual school to school support, both within and across local authority boundaries.
These Families networks were also used as a tool for the development of bespoke initiatives specific to family groupings. As the Families began to develop their shared priorities, they further developed collaborative approaches. For example, cross school visits within and across Families were developed, career shadowing opportunities explored, resources pooled and shared, and joint CPD opportunities planned.
We hope that primary schools across Birmingham will see the benefit of this approach, and will begin to form their own Family networks. As schools develop this approach, we will then have some excellent case studies from our own City to share with you in later versions of this document. In the meantime however, here is a case study from London.
Case Study - Family 9 - London Families of Schools
Collaboration based on Similarities and Differences
You know the way it works…………. Another pile of papers passes your desk pleading to be read! On the occasion in question I am glad that I found some time to look at The Families of Schools document.
It was refreshing to see schools grouped by broad similarities in a non-judgmental way. A few weeks’ later and following a speculative letter to the other Head Teachers in the Family, we found ourselves sitting around a table describing our schools and asking was there room for collaboration within this group?
The answer was Yes! Despite being involved in other collaboratives/partnerships, this one, based on a Family of Similar Schools, did not have predefined objectives or accountability frameworks. This could be a collaboration designed by the schools involved and not externally driven.
The collaboration remained strong. We have met a number of times and shared experiences, information and knowledge about the common issues that affect the school in our family. This sharing of ‘knowledge capital’ has been very useful on a number of levels.
Although the schools share similarities there is a great deal of diversity in the group: 11-16; 11-18; single sex, mixed and faith schools all bring different solutions to common challenges in a non-competitive environment.
The richness and variety of approaches to common issues has been a major outcome of the collaboration.

13
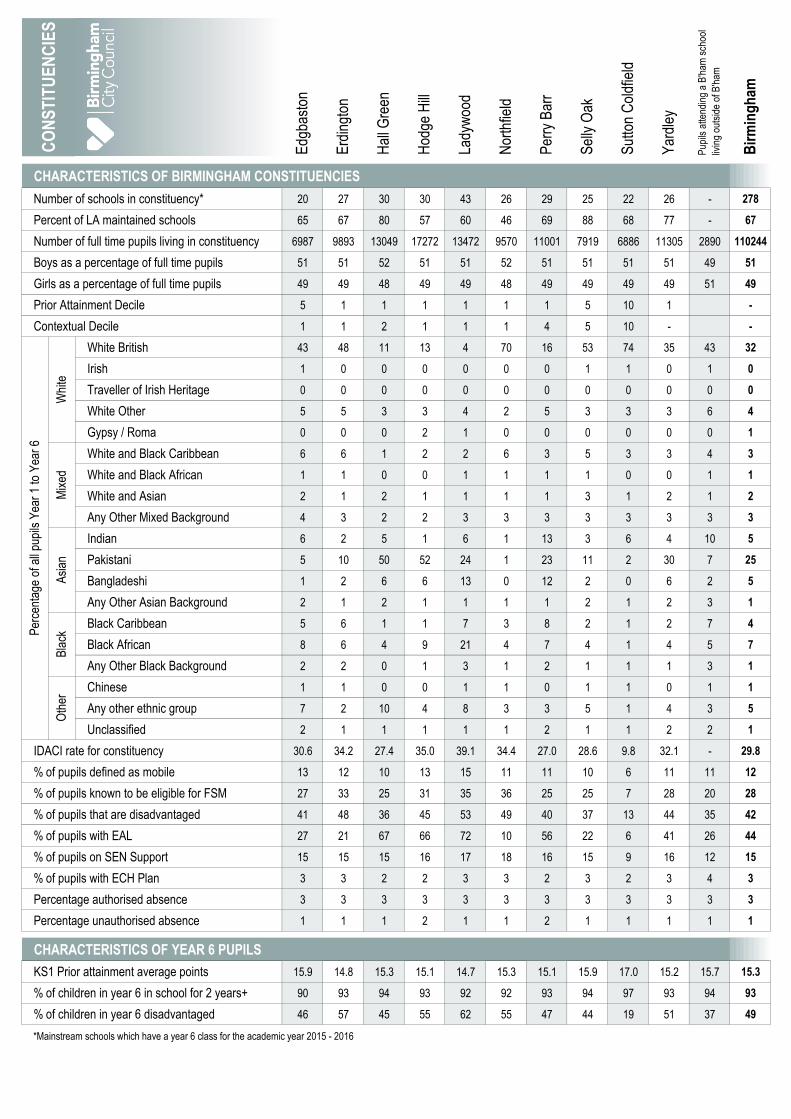
Birmingham in context
The tables and charts on the following pages show how the individual constituencies within Birmingham compare. This data helps set the information presented about each school and each family to a wider context.
To populate each constituency, children have been grouped using their home address as captured in the January 2016 school census irrespective of the location of attending school.
For completeness of picture we have also included children attending a school in Birmingham but are living outside of the authority. In this specific context as an authority we do not have access to the details of children living within Birmingham but who attend a school elsewhere and are not represented in this document.
Family Groups
Following on from the Birmingham contextual graphs you will find the 22 school families and then the Contextual EAL and Mobility Families. Each family displays across four pages.
You can find your school using the listing at the end of this document. Each school only appears in one of the main Family Groups, however it may also be included in one of the Contextual Families. If this is the case then it will be signified by either (EAL) or (Mobility) featuring after the name of your school.
Edg
bast
on
Erd
ingt
on
Hal
l Gre
en
Hod
ge H
ill
Lady
woo
d
Nor
thfie
ld
Per
ry B
arr
Sel
ly O
ak
Sut
ton
Col
dfie
ld
Yar
dley
Pup
ils a
ttend
ing
a B
'ham
sch
ool
livin
g ou
tsid
e of
B'h
am
Bir
min
gh
am
CHARACTERISTICS OF BIRMINGHAM CONSTITUENCIES
Number of schools in constituency* 20 27 30 30 43 26 29 25 22 26 - 278
Percent of LA maintained schools 65 67 80 57 60 46 69 88 68 77 - 67
Number of full time pupils living in constituency 6987 9893 13049 17272 13472 9570 11001 7919 6886 11305 2890 110244
Boys as a percentage of full time pupils 51 51 52 51 51 52 51 51 51 51 49 51
Girls as a percentage of full time pupils 49 49 48 49 49 48 49 49 49 49 51 49
Prior Attainment Decile 5 1 1 1 1 1 1 5 10 1 -
Contextual Decile 1 1 2 1 1 1 4 5 10 - -
White British 43 48 11 13 4 70 16 53 74 35 43 32
Irish 1 0 0 0 0 0 0 1 1 0 1 0
Traveller of Irish Heritage 0 0 0 0 0 0 0 0 0 0 0 0
White Other 5 5 3 3 4 2 5 3 3 3 6 4
Gypsy / Roma 0 0 0 2 1 0 0 0 0 0 0 1
White and Black Caribbean 6 6 1 2 2 6 3 5 3 3 4 3
White and Black African 1 1 0 0 1 1 1 1 0 0 1 1
White and Asian 2 1 2 1 1 1 1 3 1 2 1 2
Any Other Mixed Background 4 3 2 2 3 3 3 3 3 3 3 3
Indian 6 2 5 1 6 1 13 3 6 4 10 5
Pakistani 5 10 50 52 24 1 23 11 2 30 7 25
Bangladeshi 1 2 6 6 13 0 12 2 0 6 2 5
Any Other Asian Background 2 1 2 1 1 1 1 2 1 2 3 1
Black Caribbean 5 6 1 1 7 3 8 2 1 2 7 4
Black African 8 6 4 9 21 4 7 4 1 4 5 7
Any Other Black Background 2 2 0 1 3 1 2 1 1 1 3 1
Chinese 1 1 0 0 1 1 0 1 1 0 1 1
Any other ethnic group 7 2 10 4 8 3 3 5 1 4 3 5
Unclassified 2 1 1 1 1 1 2 1 1 2 2 1
IDACI rate for constituency 30.6 34.2 27.4 35.0 39.1 34.4 27.0 28.6 9.8 32.1 - 29.8
% of pupils defined as mobile 13 12 10 13 15 11 11 10 6 11 11 12
% of pupils known to be eligible for FSM 27 33 25 31 35 36 25 25 7 28 20 28
% of pupils that are disadvantaged 41 48 36 45 53 49 40 37 13 44 35 42
% of pupils with EAL 27 21 67 66 72 10 56 22 6 41 26 44
% of pupils on SEN Support 15 15 15 16 17 18 16 15 9 16 12 15
% of pupils with ECH Plan 3 3 2 2 3 3 2 3 2 3 4 3
Percentage authorised absence 3 3 3 3 3 3 3 3 3 3 3 3
Percentage unauthorised absence 1 1 1 2 1 1 2 1 1 1 1 1
CHARACTERISTICS OF YEAR 6 PUPILS
KS1 Prior attainment average points 15.9 14.8 15.3 15.1 14.7 15.3 15.1 15.9 17.0 15.2 15.7 15.3
% of children in year 6 in school for 2 years+ 90 93 94 93 92 92 93 94 97 93 94 93
% of children in year 6 disadvantaged 46 57 45 55 62 55 47 44 19 51 37 49
*Mainstream schools which have a year 6 class for the academic year 2015 - 2016
CO
NS
TIT
UE
NC
IES
Per
cent
age
of a
ll pu
pils
Yea
r 1
to Y
ear
6
Whi
teM
ixed
Asi
anB
lack
Oth
er

Edg
bast
on
Erd
ingt
on
Hal
l Gre
en
Hod
ge H
ill
Lady
woo
d
Nor
thfie
ld
Per
ry B
arr
Sel
ly O
ak
Sut
ton
Col
dfie
ld
Yar
dley
Pup
ils a
ttend
ing
a B
'ham
sch
ool
livin
g ou
tsid
e of
B'h
am
Bir
min
gh
am
ATTAINMENT DATA
Reading 102.1 100.7 101.6 99.7 99.6 101.4 100.5 103.9 105.5 100.3 101.8 101.2
Grammar, Punctuation & Spelling 104.5 103.1 104.8 102.6 103.0 103.4 104.1 105.6 106.8 103.2 104.2 103.9
Maths 102.8 102.0 103.4 101.1 101.9 102.0 102.5 103.8 105.9 101.6 102.9 102.5
Reading -1.3 -1.2 -0.3 -1.8 -1.5 -1.1 -1.3 0.1 0.5 -1.8 -1.2 -1.1
Writing -1.5 -0.8 -0.7 -1.6 -0.6 -1.8 0.1 -1.8 -1.6 -1.9 -1.4 -1.2
Maths -1.0 -0.4 1.0 -1.1 -0.3 -0.9 0.2 -0.1 0.8 -1.1 -0.6 -0.3
Reading, Writing & Maths at least expected 49.3 45.1 51.8 38.2 43.1 46.3 47.4 57.0 68.1 42.3 50.6 47.4
CONTEXTUAL ATTAINMENT DATA
Disadvantaged 35 38 45 35 39 36 41 46 43 35 36 38
Non-Disadvantaged 62 54 57 43 50 59 53 66 74 50 59 56
All Boys 44 42 49 34 37 42 44 52 64 37 47 43
Disadvantaged Boys 33 35 42 31 35 33 35 39 35 31 32 35
Non-Disadvantaged Boys 55 50 55 37 40 53 52 60 71 44 55 51
All Girls 54 48 55 43 49 50 50 62 72 48 54 52
Disadvantaged Girls 36 41 48 38 42 39 47 52 50 38 40 42
Non-Disadvantaged Girls 67 58 60 49 61 65 54 71 77 58 63 61
White Pupils 44 44 54 34 27 46 45 56 68 36 52 48
Black Pupils 44 43 53 36 44 45 39 55 58 44 39 43
Asian Pupils 60 44 52 40 45 49 51 59 76 47 63 48
Mixed Pupils 56 55 61 34 43 47 48 61 61 41 40 49
Chinese Pupils 67 67 100 - 67 71 100 80 67 100 67 75
Other Ethnic Background Pupils 60 58 45 39 41 46 46 45 88 56 0 46
Pupils in school for less than 2 years 36 33 38 20 28 28 29 62 57 27 14 31
Pupils in school for more than 2 years 51 46 53 40 44 48 49 57 68 43 53 49
Pupils with SEN Support 9 11 15 5 10 10 10 11 21 8 4 10
Pupils with ECH Plan 7 7 6 8 2 5 5 9 0 0 5 5
Pupils with EAL 55 45 49 38 44 60 47 58 71 48 48 46
Pupils without EAL 48 45 59 38 41 45 48 57 68 38 51 49
KEY STAGE 2 SUBJECT INFORMATION
Reading Number 811 1260 1742 2349 1709 1259 1505 1051 956 1485 454 14581
% At Least Expected 61 57 61 52 52 62 56 70 79 55 62 59
% Higher Standard 18 12 16 10 9 14 11 22 30 10 14 14
Writing Number 811 1260 1741 2346 1708 1259 1505 1051 955 1484 453 14573
% At Least Expected 72 68 72 64 67 66 72 73 83 66 72 69
% Higher Standard 9 8 5 4 5 6 10 5 8 5 8 6
Grammar, Punctuation & Spelling Number 811 1260 1742 2349 1709 1259 1505 1051 956 1485 454 14581
% At Least Expected 74 70 75 64 67 70 74 78 86 68 74 71
% Higher Standard 27 18 28 16 18 20 23 29 36 20 22 22
Maths Number 811 1260 1742 2349 1709 1259 1505 1051 956 1485 454 14581
% At Least Expected 66 64 73 56 64 64 68 73 83 61 68 66
% Higher Standard 19 14 18 12 12 13 14 21 30 12 19 15
*Attainment data includes all state-funded schools within Birmingham (including special schools and academies)
% o
f pup
ils a
t lea
st a
t the
exp
ecte
d st
anda
rd in
Rea
ding
, Writ
ing
and
Mat
hs FS
M6
Boy
sG
irls
Eth
nici
tyM
obili
tyS
EN
EA
LC
ON
ST
ITU
EN
CIE
SA
vera
ge
scal
ed
scor
e
Ave
rage
Pro
gres
s
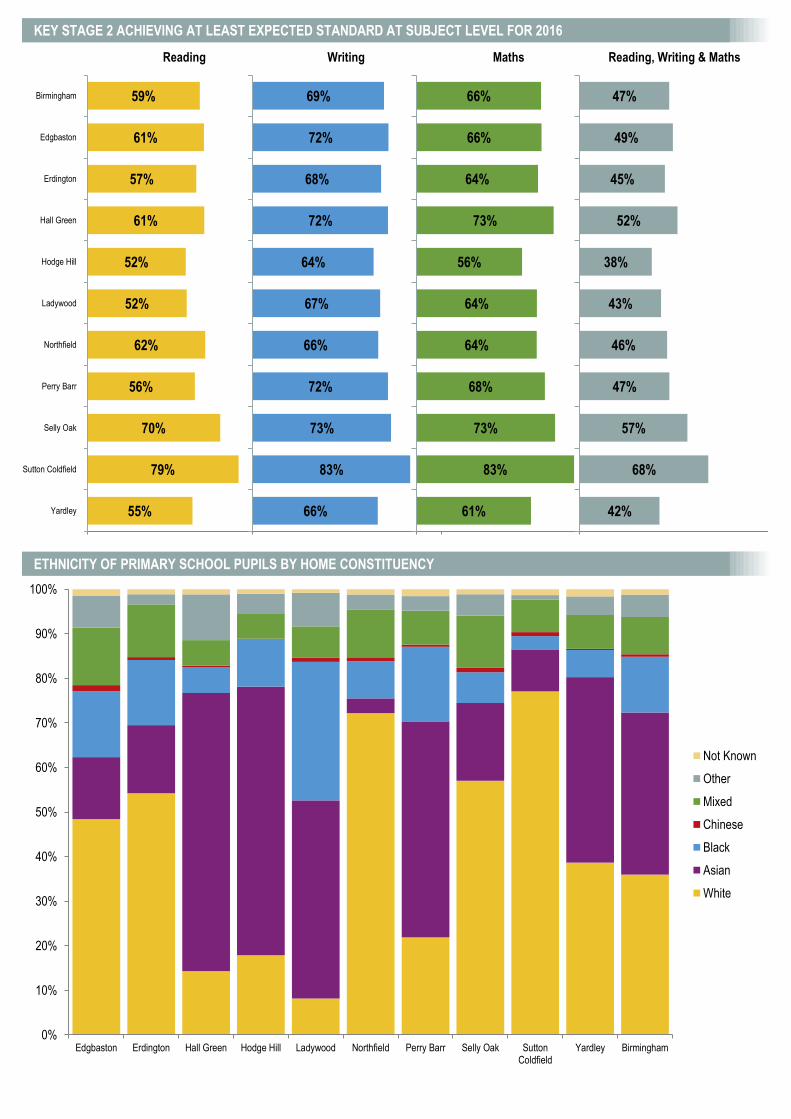
KEY STAGE 2 ACHIEVING AT LEAST EXPECTED STANDARD AT SUBJECT LEVEL FOR 2016
ETHNICITY OF PRIMARY SCHOOL PUPILS BY HOME CONSTITUENCY
0%
10%
20%
30%
40%
50%
60%
70%
80%
90%
100%
Edgbaston Erdington Hall Green Hodge Hill Ladywood Northfield Perry Barr Selly Oak SuttonColdfield
Yardley Birmingham
Not Known
Other
Mixed
Chinese
Black
Asian
White
55%
79%
70%
56%
62%
52%
52%
61%
57%
61%
59%
Reading
66%
83%
73%
72%
66%
67%
64%
72%
68%
72%
69%
Writing
61%
83%
73%
68%
64%
64%
56%
73%
64%
66%
66%
Maths
42%
68%
57%
47%
46%
43%
38%
52%
45%
49%
47%
Reading, Writing & Maths
Yardley
Sutton Coldfield
Selly Oak
Perry Barr
Northfield
Ladywood
Hodge Hill
Hall Green
Erdington
Edgbaston
Birmingham
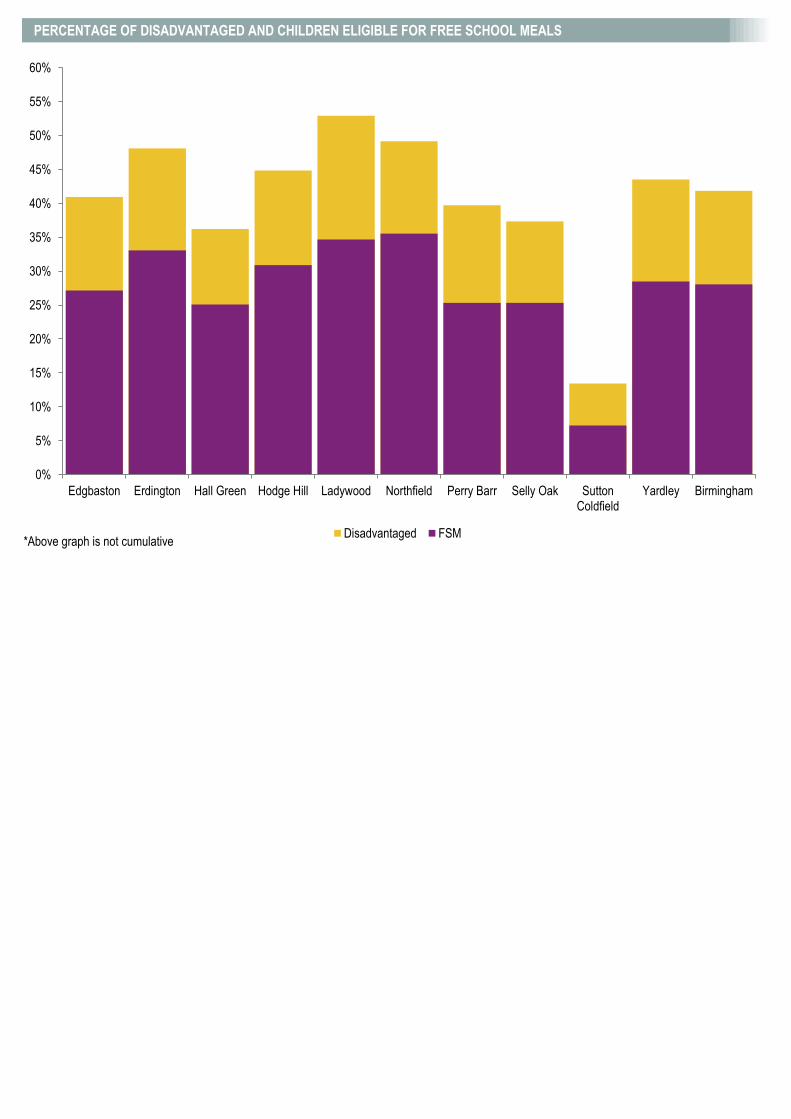
PERCENTAGE OF DISADVANTAGED AND CHILDREN ELIGIBLE FOR FREE SCHOOL MEALS
*Above graph is not cumulative
0%
5%
10%
15%
20%
25%
30%
35%
40%
45%
50%
55%
60%
Edgbaston Erdington Hall Green Hodge Hill Ladywood Northfield Perry Barr Selly Oak SuttonColdfield
Yardley Birmingham
Disadvantaged FSM

(227
3)
(520
4)
(209
9)
(248
2)
(206
1)
(205
6)
(219
1)
(207
1)
(333
7)
(248
6)
(340
9)
(343
2)
(204
1)
(248
1)
(248
0)
(207
0)
(210
4)
(245
4)
Top
cliff
e P
rimar
y S
choo
l
Man
or P
ark
Prim
ary
Aca
dem
y
Haw
thor
n P
rimar
y S
choo
l
Wat
tvill
e P
rimar
y S
choo
l
St M
icha
el's
Cof
E P
rimar
y
Aca
dem
y, H
ands
wor
th
Ark
Tin
dal P
rimar
y A
cade
my
Cou
rt F
arm
Prim
ary
Sch
ool
St J
ohn'
s an
d S
t Pet
er's
Cof
E
Aca
dem
y
St C
had'
s C
atho
lic P
rimar
y
Sch
ool
For
estd
ale
Prim
ary
Sch
ool
Sac
red
Hea
rt C
atho
lic S
choo
l
Clif
ton
Prim
ary
Sch
ool
Ark
Ros
e P
rimar
y A
cade
my
Roo
kery
Sch
ool
Wyc
hall
Prim
ary
Sch
ool
Mon
tgom
ery
Prim
ary
Aca
dem
y
St G
eorg
e's
Chu
rch
of
Eng
land
Aca
dem
y, N
ewto
wn
Elm
s F
arm
Com
mun
ity
Prim
ary
Sch
ool
Fam
ily G
rou
p 1
Ave
rag
e
Bir
min
gh
am A
vera
ge
CHARACTERISTICS OF SCHOOLS AND THEIR PUPILS*
School Type LA A LA LA A A LA A LA LA LA LA A A A A A LA -
School Designation CS AS CS CS AS AS CS AS VA CS VA CS AS AC AC AS AS CS -
Number of full time pupils 254 402 207 421 164 408 197 204 210 207 205 778 213 429 415 617 240 405 5976 110244
Boys as a percentage of full time pupils 58 51 57 51 57 50 45 50 48 57 52 53 48 49 52 54 46 53 52 51
Girls as a percentage of full time pupils 42 49 43 49 43 50 55 50 52 43 48 47 52 51 48 46 54 47 48 49
Prior Attainment Decile 1 1 1 1 1 1 1 1 1 1 1 1 1 1 1 1 1 1 -
Contextual Decile 7 1 6 2 2 1 4 1 3 3 4 3 1 4 3 1 2 3 -
White British 71 2 48 2 0 2 47 3 8 80 1 1 46 2 54 0 3 51 19 32
Irish 0 0 0 0 0 0 0 0 3 0 0 0 1 1 0 0 0 1 0 0
Traveller of Irish Heritage 0 0 0 0 0 0 0 0 0 0 0 0 2 0 0 0 0 0 0 0
White Other 0 2 3 14 6 2 7 3 6 1 6 1 4 6 2 1 2 5 4 4
Gypsy / Roma 0 3 0 0 5 4 0 0 0 0 0 0 0 1 0 0 1 2 1 1
White and Black Caribbean 11 5 7 3 3 0 2 7 6 8 6 1 8 2 9 0 2 5 4 3
White and Black African 0 0 2 1 1 0 1 1 1 0 1 0 2 1 1 0 1 0 1 1
White and Asian 1 3 1 0 3 0 2 0 0 2 0 1 1 1 2 0 0 2 1 2
Any Other Mixed Background 1 4 3 5 8 2 2 3 2 2 6 2 9 5 2 2 1 4 3 3
Indian 1 2 2 19 3 1 1 3 2 1 2 2 1 33 0 2 2 1 5 5
Pakistani 3 24 10 13 19 38 7 5 1 1 3 38 3 17 2 60 1 13 20 25
Bangladeshi 0 18 8 22 8 4 0 1 0 0 0 13 0 11 1 11 10 1 8 5
Any Other Asian Background 0 1 1 1 0 3 1 3 1 1 3 2 0 1 1 3 0 2 1 1
Black Caribbean 3 4 6 8 15 1 7 16 15 1 28 0 3 10 8 0 13 0 6 4
Black African 4 22 4 8 20 12 9 30 40 3 38 7 8 4 10 8 56 4 13 7
Any Other Black Background 1 2 1 1 3 2 7 6 5 1 5 0 3 1 1 1 4 0 2 1
Chinese 0 0 0 1 0 1 1 2 5 0 0 0 2 0 0 0 0 1 1 1
Any other ethnic group 1 7 3 3 7 29 5 17 5 1 2 31 2 4 5 12 6 6 11 5
Unclassified 0 1 1 0 1 0 1 1 0 0 1 1 5 1 2 0 0 2 1 1
IDACI rate for school 31.8 36.9 30.2 35.6 33.8 32.2 33.2 35.3 35.9 41.4 34.8 32.1 36.8 32.1 34.0 35.0 39.1 32.1 29.8
% of pupils defined as mobile 11 31 9 19 15 27 19 27 12 21 10 9 31 9 18 14 11 23 17 12
% of pupils known to be eligible for FSM 35 38 36 25 30 40 37 60 33 48 46 39 76 30 54 33 36 52 40 28
% of pupils that are disadvantaged 52 53 62 45 50 52 63 70 57 67 57 48 82 44 72 46 62 64 56 42
% of pupils with EAL 5 65 26 65 73 86 30 56 59 5 45 85 19 73 22 99 67 26 58 44
% of pupils on SEN Support 21 13 20 26 23 6 14 18 15 15 12 19 12 15 21 10 11 24 16 15
% of pupils with ECH Plan 22 0 13 0 1 1 1 1 1 1 1 1 0 3 0 1 0 1 2 3
Percentage authorised absence 3 2 4 4 5 2 4 2 2 4 2 4 1 2 3 2 3 3 3 3
Percentage unauthorised absence 1 3 1 2 1 3 2 2 1 1 0 1 5 2 2 2 0 3 2 1
CHARACTERISTICS OF YEAR 6 PUPILS
KS1 Prior attainment average points 11.2 12.3 12.7 13.1 13.1 13.2 13.2 13.3 13.5 13.6 13.6 13.7 13.7 13.8 13.8 13.8 13.8 13.9 13.4 15.3
% of children in year 6 in school for 2 years+ 95 77 92 98 72 89 86 77 90 89 100 99 75 100 86 95 93 74 90 93 #VALUE!
% of children in year 6 disadvantaged 58 57 65 52 66 67 72 70 47 82 69 68 75 53 79 47 76 72 64 49
*Children attending school at the time of January 2016 census within year groups reception to year 6
FA
MIL
Y G
RO
UP
1P
erce
ntag
e of
all
pupi
ls Y
ear
1 to
Yea
r 6
Whi
teM
ixed
Asi
anB
lack
Oth
er
(227
3)
(520
4)
(209
9)
(248
2)
(206
1)
(205
6)
(219
1)
(207
1)
(333
7)
(248
6)
(340
9)
(343
2)
(204
1)
(248
1)
(248
0)
(207
0)
(210
4)
Top
cliff
e P
rimar
y S
choo
l
Man
or P
ark
Prim
ary
Aca
dem
y
Haw
thor
n P
rimar
y S
choo
l
Wat
tvill
e P
rimar
y S
choo
l
St M
icha
el's
Cof
E P
rimar
y
Aca
dem
y, H
ands
wor
th
Ark
Tin
dal P
rimar
y A
cade
my
Cou
rt F
arm
Prim
ary
Sch
ool
St J
ohn'
s an
d S
t Pet
er's
Cof
E
Aca
dem
y
St C
had'
s C
atho
lic P
rimar
y
Sch
ool
For
estd
ale
Prim
ary
Sch
ool
Sac
red
Hea
rt C
atho
lic S
choo
l
Clif
ton
Prim
ary
Sch
ool
Ark
Ros
e P
rimar
y A
cade
my
Roo
kery
Sch
ool
Wyc
hall
Prim
ary
Sch
ool
Mon
tgom
ery
Prim
ary
Aca
dem
y
St G
eorg
e's
Chu
rch
of
Eng
land
Aca
dem
y, N
ewto
wn
Elm
s F
arm
Com
mun
ity
Prim
ary
Sch
ool
Fam
ily G
rou
p 1
Ave
rag
e
Bir
min
gh
am A
vera
ge
ATTAINMENT DATA
Reading 96.6 96.8 99.0 98.6 99.2 103.1 95.0 95.8 103.3 96.8 95.7 97.2 100.0 100.3 100.8 99.0 99.3 98.7 98.7 101.2
GPS* 96.5 99.9 100.3 100.0 96.2 103.5 98.8 99.2 103.3 99.1 101.4 101.6 101.0 103.6 104.1 104.2 103.8 102.9 101.6 103.9
Maths 97.0 99.4 96.5 98.2 97.2 102.6 98.6 101.5 104.6 98.4 96.2 100.8 100.0 103.2 99.1 102.2 102.8 99.7 100.2 102.5
Reading -0.8 0.7 1.0 1.1 1.8 4.9 -3.9 -1.9 2.0 -1.6 -2.6 -1.7 -0.6 1.2 1.6 0.0 0.8 -0.8 0.2 -1.1
Writing -7.9 0.6 1.5 0.3 2.3 1.3 1.4 -3.0 -1.2 1.9 2.2 0.6 1.3 2.5 1.9 2.4 4.9 -1.0 0.7 -1.2
Maths -0.6 1.4 -1.8 -0.9 -2.1 3.2 -1.5 1.7 1.6 -1.0 -3.8 0.9 -1.0 3.4 -1.1 2.4 2.2 -1.2 0.5 -0.3
Reading, Writing & Maths at least expected 15.8 25.0 34.6 35.7 34.5 72.2 17.2 33.3 56.7 25.0 13.8 36.7 50.0 47.3 29.8 50.6 44.8 33.3 38.0 47.4
CONTEXTUAL ATTAINMENT DATA
Disadvantaged 18 23 24 24 26 72 14 38 50 22 10 31 50 41 22 50 45 31 34 38
Non-Disadvantaged 13 27 56 48 50 72 25 22 63 40 22 48 50 54 58 51 43 40 46 56
All Boys 5 19 46 21 35 64 20 17 50 17 18 30 46 43 17 43 45 33 33 43
Disadvantaged Boys 0 23 33 7 29 68 20 17 44 18 17 21 44 31 16 47 44 36 30 35
Non-Disadvantaged Boys 14 15 75 40 50 56 20 17 57 0 20 45 50 58 25 39 50 27 38 51
All Girls 26 31 23 47 33 81 14 58 64 31 11 46 55 52 38 63 44 33 44 52
Disadvantaged Girls 40 24 13 40 20 76 9 67 60 25 7 43 56 54 27 60 46 21 38 42
Non-Disadvantaged Girls 11 44 40 53 50 89 33 33 67 50 25 56 50 50 75 64 40 75 54 61
White Pupils 18 0 33 0 0 40 20 0 50 25 0 0 42 25 21 - 0 38 26 48
Black Pupils 20 14 0 15 33 80 0 36 60 100 13 33 50 25 40 67 43 33 34 43
Asian Pupils 0 33 33 55 40 80 0 0 0 - 0 46 100 56 60 50 50 36 49 48
Mixed Pupils 0 29 67 25 33 100 0 33 100 14 25 25 80 50 25 - 33 13 33 49
Chinese Pupils - - - - - 100 - - 100 - - - 0 - - - - - 67 75
Other Ethnic Background Pupils - 50 - 0 50 55 100 44 - - - 24 0 - 50 44 100 33 40 46
Pupils in school less than 2 years 0 17 50 0 0 50 25 29 0 0 - 0 50 - 0 75 50 36 25 31
Pupils in school for 2 years+ 17 28 33 36 48 75 16 35 63 28 14 37 50 47 35 49 44 33 39 49
Pupils with SEN Support 0 0 13 0 18 33 11 0 0 0 0 7 25 0 0 0 33 33 9 10
Pupils with ECH Plan 0 0 0 - - - 0 - - - 0 50 0 0 - 0 0 0 4 5
Pupils with EAL 0 18 20 38 30 71 14 43 47 - 9 36 67 54 53 51 39 31 42 46
Pupils without EAL 17 46 38 32 50 78 18 27 67 25 17 43 50 31 20 - 55 34 33 49
KEY STAGE 2 SUBJECT INFORMATION
Reading Number 38 53 26 56 29 54 29 30 30 28 29 90 24 55 57 85 29 54 796 14581
% At Least Expected 29 40 50 50 48 78 21 37 67 39 31 42 54 53 58 52 55 43 48 59
% Higher Standard 5 6 8 5 3 20 0 3 20 7 0 8 0 13 7 9 0 7 8 14
Writing Number 38 52 26 56 29 54 29 30 30 28 29 90 24 55 57 85 29 54 795 14573
% At Least Expected 18 35 62 55 72 80 72 47 67 68 83 66 75 71 65 76 79 54 63 69
% Higher Standard 0 0 8 4 0 0 0 0 0 4 0 0 4 7 5 0 21 0 2 6
GPS* Number 38 53 26 56 29 54 29 30 30 28 29 90 24 55 57 85 29 54 796 14581
% At Least Expected 29 53 62 54 34 65 45 57 77 57 72 62 54 75 68 73 69 57 61 71
% Higher Standard 0 9 15 9 3 35 7 10 10 11 7 17 17 22 23 26 21 13 16 22
Maths Number 38 53 26 56 29 54 29 30 30 28 29 90 24 55 57 85 29 54 796 14581
% At Least Expected 34 53 38 43 45 83 38 70 87 39 24 63 63 65 42 72 83 50 57 66
% Higher Standard 3 4 8 9 0 11 7 10 13 4 7 9 8 22 4 13 14 7 9 15
*Grammar, Punctuation & Spelling
FA
MIL
Y G
RO
UP
1M
obili
tyS
EN
EA
L
Ave
rage
scal
ed s
core
Ave
rage
Pro
gres
sF
SM
6B
oys
Girl
sE
thni
city
% o
f pup
ils a
t lea
st a
t the
exp
ecte
d st
anda
rd in
Rea
ding
, Writ
ing
and
Mat
hs

PERFORMANCE MAP KEY STAGE 2 - READING
PERFORMANCE MAP KEY STAGE 2 - WRITING
Average attainment and improvement relate to the Birmingham average
2273
5204 2099
2482 2061
2056
2191
2071
3337
2486
3409
3432
2041
2481 2480
2070
2104
2454
-8
-7
-6
-5
-4
-3
-2
-1
0
1
2
3
4
5
6
7
8
9
10
92 93 94 95 96 97 98 99 100 101 102 103 104 105 106 107 108 109 110 111 112
Rea
din
g P
rog
ress
Reading average scaled score
All B'ham Schools
Family 1
Family 1 Average
2273
5204
2099
2482
2061
2056 2191
2071
3337
2486 3409
3432
2041
2481
2480 2070
2104
2454
-9
-8
-7
-6
-5
-4
-3
-2
-1
0
1
2
3
4
5
6
12 17 22 27 32 37 42 47 52 57 62 67 72 77 82 87 92 97
Wri
tin
g P
rog
ress
Writing % at least expected attainment
All B'ham Schools
Family 1
Family 1 Average
Average attainment
Average improvement
Average attainment
Average improvement
PERFORMANCE MAP KEY STAGE 2 - MATHS
TRACKING MAP KEY STAGE 2 - READING, WRITING & MATHS COMBINED
Average attainment and difference relate to the Birmingham average
2273
5204
2099
2482
2061
2056
2191
2071 3337
2486
3409
3432
2041
2481
2480
2070 2104
2454
-7
-6
-5
-4
-3
-2
-1
0
1
2
3
4
5
6
7
96 97 98 99 100 101 102 103 104 105 106 107 108 109 110 111
Mat
hs
Pro
gre
ss
Maths average scaled score
All B'ham Schools
Family 1
Family 1 Average
2273
5204
2099
2482
2061
2056
2191 2071
3337
2486
3409
3432
2041
2481
2481
2070
2104
2454
0
2
4
6
8
10
12
14
16
18
20
22
0 5 10 15 20 25 30 35 40 45 50 55 60 65 70 75 80 85 90 95 100
% D
iffe
ren
ce f
rom
low
est
atta
inin
g s
ub
ject
to
RW
M
Reading, Writing & Maths % at least at expected level
All B'ham Schools
Family 1
Family 1 Average
Average difference
Average attainment
Average improvement
Average attainment

(224
5)
(247
5)
(205
7)
(201
8)
(214
1)
(207
5)
(210
0)
(231
3)
(218
9)
Wel
sh H
ouse
Far
m
Com
mun
ity S
choo
l and
Firs
Prim
ary
Sch
ool
Per
cy S
hurm
er A
cade
my
The
Oak
s P
rimar
y S
choo
l
Oas
is A
cade
my
Fou
ndry
Man
sfie
ld G
reen
E-A
CT
Aca
dem
y
Mer
ritts
Bro
ok P
rimar
y E
-AC
T
Aca
dem
y
Hea
th M
ount
Prim
ary
Sch
ool
Lady
pool
Prim
ary
Sch
ool
Fam
ily G
rou
p 2
Ave
rag
e
Bir
min
gh
am A
vera
ge
CHARACTERISTICS OF SCHOOLS AND THEIR PUPILS*
School Type LA LA A LA A A A LA LA -
School Designation CS CS AS CS AS AS AS CS CS -
Number of full time pupils 218 404 414 285 206 417 195 419 411 2969 110244
Boys as a percentage of full time pupils 50 51 53 51 48 48 54 51 50 50 51
Girls as a percentage of full time pupils 50 49 47 49 52 52 46 49 50 50 49
Prior Attainment Decile 1 2 2 2 2 2 2 2 3 -
Contextual Decile 2 1 1 1 1 1 2 2 1 -
White British 27 18 1 59 1 3 56 1 0 14 32
Irish 1 1 0 0 0 0 0 0 0 0 0
Traveller of Irish Heritage 0 0 0 0 0 0 0 0 0 0 0
White Other 5 7 1 4 21 3 5 0 0 4 4
Gypsy / Roma 0 1 0 0 14 1 0 0 4 2 1
White and Black Caribbean 7 6 0 9 5 2 7 0 0 3 3
White and Black African 3 0 0 0 0 0 4 0 0 1 1
White and Asian 2 2 1 2 3 3 2 0 1 2 2
Any Other Mixed Background 2 2 2 1 2 1 2 1 2 2 3
Indian 2 0 1 1 2 1 1 2 1 1 5
Pakistani 8 25 24 8 10 23 1 44 48 25 25
Bangladeshi 0 3 3 0 7 30 0 2 10 7 5
Any Other Asian Background 1 1 5 0 1 1 1 1 1 1 1
Black Caribbean 9 2 2 4 0 5 2 1 0 3 4
Black African 19 19 17 5 14 21 9 8 6 13 7
Any Other Black Background 4 3 1 0 14 4 2 0 0 2 1
Chinese 0 0 0 0 0 0 1 0 0 0 1
Any other ethnic group 7 7 43 4 6 2 2 41 23 18 5
Unclassified 2 4 0 0 1 1 4 0 3 2 1
IDACI rate for school 32.1 36.0 35.2 33.6 35.7 35.7 37.8 37.3 33.8 29.8
% of pupils defined as mobile 19 16 10 24 29 20 20 6 14 16 12
% of pupils known to be eligible for FSM 60 52 38 71 48 42 58 38 48 49 28
% of pupils that are disadvantaged 78 66 55 84 74 59 70 46 57 63 42
% of pupils with EAL 36 56 92 21 70 75 17 95 91 68 44
% of pupils on SEN Support 18 17 12 32 14 16 19 26 20 19 15
% of pupils with ECH Plan 7 1 4 1 0 1 1 1 2 2 3
Percentage authorised absence 3 3 2 4 3 3 2 3 4 3 3
Percentage unauthorised absence 1 2 1 1 2 2 2 1 2 1 1
CHARACTERISTICS OF YEAR 6 PUPILS
KS1 Prior attainment average points 14.0 14.2 14.3 14.4 14.4 14.5 14.6 14.7 14.7 14.4 15.3
% of children in year 6 in school for 2 years+ 81 93 90 90 87 93 88 97 97 92 93 #VALUE! #VALUE! #VALUE! #VALUE! #VALUE! #VALUE! #VALUE! #VALUE! #VALUE! #VALUE!
% of children in year 6 disadvantaged 85 80 71 87 87 67 80 57 58 71 49
*Children attending school at the time of January 2016 census within year groups reception to year 6
FA
MIL
Y G
RO
UP
2P
erce
ntag
e of
all
pupi
ls Y
ear
1 to
Yea
r 6
Whi
teM
ixed
Asi
anB
lack
Oth
er
(224
5)
(247
5)
(205
7)
(201
8)
(214
1)
(207
5)
(210
0)
(231
3)
(218
9)
Wel
sh H
ouse
Far
m
Com
mun
ity S
choo
l and
Firs
Prim
ary
Sch
ool
Per
cy S
hurm
er A
cade
my
The
Oak
s P
rimar
y S
choo
l
Oas
is A
cade
my
Fou
ndry
Man
sfie
ld G
reen
E-A
CT
Aca
dem
y
Mer
ritts
Bro
ok P
rimar
y E
-AC
T
Aca
dem
y
Hea
th M
ount
Prim
ary
Sch
ool
Lady
pool
Prim
ary
Sch
ool
Fam
ily G
rou
p 2
Ave
rag
e
Bir
min
gh
am A
vera
ge
ATTAINMENT DATA
Reading 101.0 99.0 95.9 97.1 97.2 97.6 104.4 105.2 101.9 99.9 101.2
GPS* 105.1 102.8 101.3 101.0 102.5 101.8 105.2 109.6 105.0 103.9 103.9
Maths 101.0 99.5 99.2 100.0 103.0 100.3 103.6 106.4 104.6 101.9 102.5
Reading -0.6 -0.4 -3.6 -3.6 -1.8 -1.6 1.9 3.9 -0.1 -0.5 -1.1
Writing 2.5 -3.5 0.7 -3.9 1.6 1.2 -1.0 1.8 -0.1 -0.1 -1.2
Maths -1.7 -0.8 -1.1 -1.4 2.7 0.1 1.5 4.3 2.3 0.8 -0.3
Reading, Writing & Maths at least expected 33.3 27.8 31.0 30.0 30.4 36.2 72.0 78.3 60.3 45.5 47.4
CONTEXTUAL ATTAINMENT DATA
Disadvantaged 30 26 29 19 30 33 65 82 58 41 38
Non-Disadvantaged 50 36 35 100 33 42 100 73 64 57 56
All Boys 33 21 25 25 33 41 69 88 48 42 43
Disadvantaged Boys 36 17 29 20 40 38 67 94 43 41 35
Non-Disadvantaged Boys 0 40 18 100 0 44 100 78 54 46 51
All Girls 33 35 38 36 27 33 75 71 71 49 52
Disadvantaged Girls 22 35 30 18 20 31 63 72 68 41 42
Non-Disadvantaged Girls 67 33 67 100 100 40 100 71 75 66 61
White Pupils 38 33 0 25 0 0 71 100 0 36 48
Black Pupils 25 36 42 67 33 48 50 100 100 48 43
Asian Pupils 33 22 40 0 20 42 67 81 64 51 48
Mixed Pupils 25 20 50 40 50 25 100 100 100 47 49
Chinese Pupils - - - - - - - - - - 75
Other Ethnic Background Pupils 25 38 17 - 100 0 - 68 55 41 46
Pupils in school less than 2 years 40 25 33 33 33 25 67 50 50 38 31
Pupils in school for 2 years+ 32 28 31 30 30 37 73 79 61 46 49
Pupils with SEN Support 0 0 0 0 0 9 25 29 36 15 10
Pupils with ECH Plan 0 0 0 0 - 0 0 0 - 0 5
Pupils with EAL 33 31 29 20 21 28 60 79 62 46 46
Pupils without EAL 33 22 67 32 44 53 75 75 33 45 49
KEY STAGE 2 SUBJECT INFORMATION
Reading Number 27 54 58 30 23 58 25 60 58 393 14581
% At Least Expected 48 54 38 37 30 45 76 83 64 54 59
% Higher Standard 15 6 3 7 4 2 16 22 10 9 14
Writing Number 27 54 58 30 23 58 25 60 58 393 14573
% At Least Expected 81 50 69 50 70 69 76 88 72 70 69
% Higher Standard 15 0 0 3 0 2 4 2 7 3 6
GPS* Number 27 54 58 30 23 58 25 60 58 393 14581
% At Least Expected 78 81 62 50 70 69 72 92 71 73 71
% Higher Standard 26 19 14 13 17 9 36 47 28 23 22
Maths Number 27 54 58 30 23 58 25 60 58 393 14581
% At Least Expected 56 48 59 50 78 60 80 90 81 67 66
% Higher Standard 7 9 3 3 17 14 4 32 21 14 15
*Grammar, Punctuation & Spelling
FA
MIL
Y G
RO
UP
2M
obili
tyS
EN
EA
L
Ave
rage
scal
ed s
core
Ave
rage
Pro
gres
sF
SM
6B
oys
Girl
sE
thni
city
% o
f pup
ils a
t lea
st a
t the
exp
ecte
d st
anda
rd in
Rea
ding
, Writ
ing
and
Mat
hs
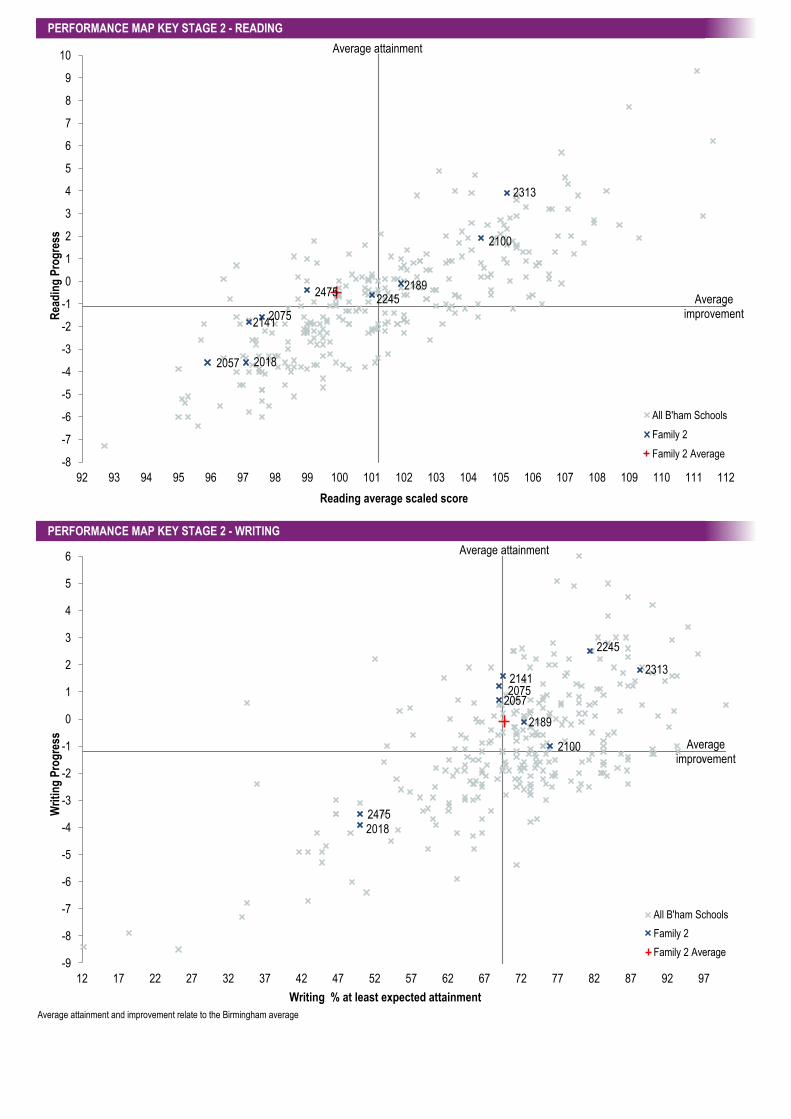
PERFORMANCE MAP KEY STAGE 2 - READING
PERFORMANCE MAP KEY STAGE 2 - WRITING
Average attainment and improvement relate to the Birmingham average
2245 2475
2057 2018
2141 2075
2100
2313
2189
-8
-7
-6
-5
-4
-3
-2
-1
0
1
2
3
4
5
6
7
8
9
10
92 93 94 95 96 97 98 99 100 101 102 103 104 105 106 107 108 109 110 111 112
Rea
din
g P
rog
ress
Reading average scaled score
All B'ham Schools
Family 2
Family 2 Average
2245
2475
2057
2018
2141 2075
2100
2313
2189
-9
-8
-7
-6
-5
-4
-3
-2
-1
0
1
2
3
4
5
6
12 17 22 27 32 37 42 47 52 57 62 67 72 77 82 87 92 97
Wri
tin
g P
rog
ress
Writing % at least expected attainment
All B'ham Schools
Family 2
Family 2 Average
Average attainment
Average improvement
Average attainment
Average improvement
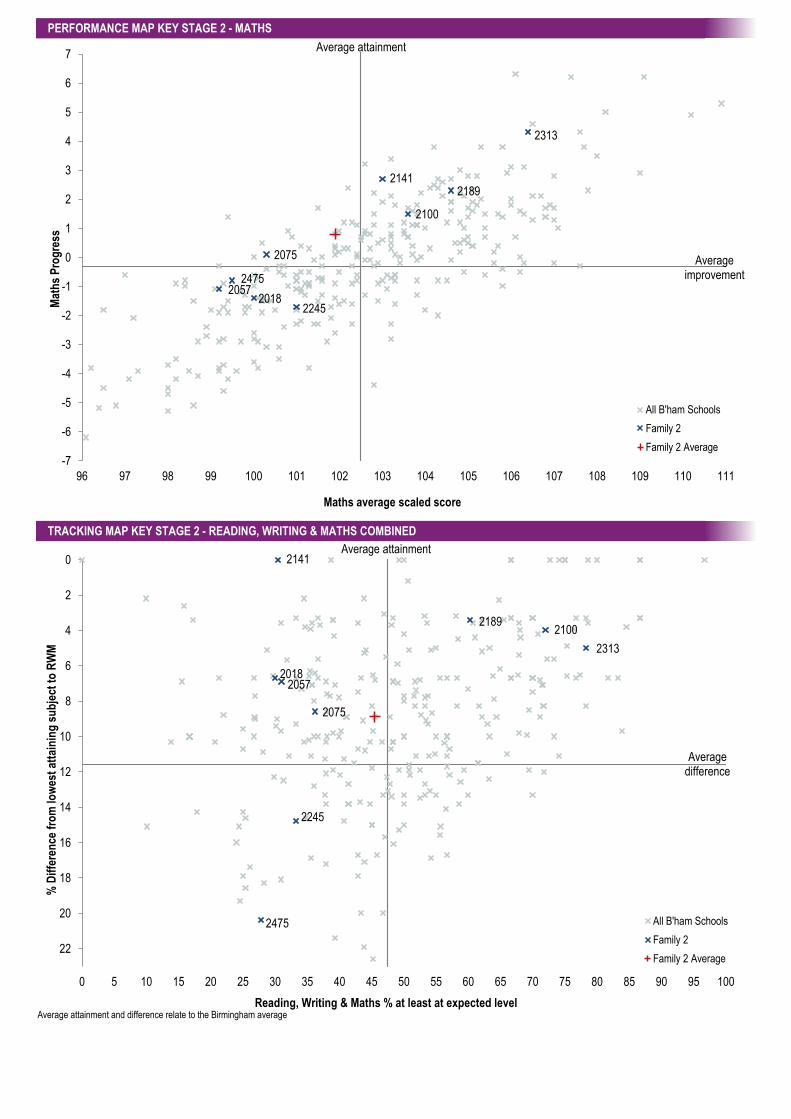
PERFORMANCE MAP KEY STAGE 2 - MATHS
TRACKING MAP KEY STAGE 2 - READING, WRITING & MATHS COMBINED
Average attainment and difference relate to the Birmingham average
2245
2475 2057
2018
2141
2075
2100
2313
2189
-7
-6
-5
-4
-3
-2
-1
0
1
2
3
4
5
6
7
96 97 98 99 100 101 102 103 104 105 106 107 108 109 110 111
Mat
hs
Pro
gre
ss
Maths average scaled score
All B'ham Schools
Family 2
Family 2 Average
2245
2475
2057 2018
2141
2075
2100
2313
2189
0
2
4
6
8
10
12
14
16
18
20
22
0 5 10 15 20 25 30 35 40 45 50 55 60 65 70 75 80 85 90 95 100
% D
iffe
ren
ce f
rom
low
est
atta
inin
g s
ub
ject
to
RW
M
Reading, Writing & Maths % at least at expected level
All B'ham Schools
Family 2
Family 2 Average
Average difference
Average attainment
Average improvement
Average attainment
(218
4)
(343
6)
(335
0)
(213
8)
(217
8)
(207
3)
(206
2)
(211
1)
(206
4)
(203
0)
(212
1)
(206
7)
(230
5)
(216
9)
Ste
chfo
rd P
rimar
y S
choo
l
Har
per
Bel
l Sev
enth
-day
Adv
entis
t Sch
ool
St M
ary
and
St J
ohn
Juni
or
and
Infa
nt S
choo
l
Gre
ston
e A
cade
my
Sta
nvill
e P
rimar
y S
choo
l
Kin
gs R
ise
Aca
dem
y
And
erto
n P
ark
Prim
ary
Sch
ool
Jerv
oise
Sch
ool
The
Oak
land
s P
rimar
y S
choo
l
Bor
desl
ey G
reen
Prim
ary
Sch
ool
Haw
kesl
ey C
hurc
h P
rimar
y
Aca
dem
y
Sum
mer
field
Jun
ior
and
Infa
nt
Sch
ool
Cha
ndos
Prim
ary
Sch
ool
Sev
erne
Jun
ior
Infa
nt a
nd
Nur
sery
Sch
ool
Fam
ily G
rou
p 3
Ave
rag
e
Bir
min
gh
am A
vera
ge
CHARACTERISTICS OF SCHOOLS AND THEIR PUPILS*
School Type LA LA LA A LA A LA A A LA A LA LA LA -
School Designation CS VA VA AS CS AS CS AC AC CS AS CS CS CS -
Number of full time pupils 356 195 414 598 210 256 635 212 305 630 198 405 405 408 5227 110244
Boys as a percentage of full time pupils 47 42 48 55 52 54 48 47 52 50 54 49 51 55 51 51
Girls as a percentage of full time pupils 53 58 52 45 48 46 52 53 48 50 46 51 49 45 49 49
Prior Attainment Decile 1 1 1 1 1 1 1 2 2 2 2 2 2 2 -
Contextual Decile 6 4 5 1 6 4 3 5 4 3 3 1 1 2 -
White British 2 0 18 1 61 68 1 65 41 0 71 2 3 30 18 32
Irish 0 0 1 0 1 0 0 0 0 0 0 0 1 0 0 0
Traveller of Irish Heritage 0 0 0 0 0 0 0 0 0 0 0 0 0 0 0 0
White Other 1 3 21 26 1 3 9 4 5 6 1 3 6 4 8 4
Gypsy / Roma 0 5 1 1 0 0 0 0 0 3 0 0 0 1 1 1
White and Black Caribbean 1 6 10 4 3 3 0 4 5 0 5 1 6 3 3 3
White and Black African 0 1 2 1 0 3 0 2 2 1 2 0 1 1 1 1
White and Asian 0 1 1 3 2 2 2 2 0 2 0 0 0 3 1 2
Any Other Mixed Background 5 3 4 3 1 3 1 2 4 0 3 2 2 2 2 3
Indian 2 1 2 21 3 0 0 2 8 0 1 6 3 5 5 5
Pakistani 74 4 6 12 12 3 63 2 21 70 5 38 9 28 31 25
Bangladeshi 2 4 1 5 4 1 6 0 2 8 1 7 8 1 4 5
Any Other Asian Background 2 0 1 1 0 0 2 2 2 1 0 1 2 5 1 1
Black Caribbean 1 42 6 9 1 4 1 2 2 0 2 4 5 3 5 4
Black African 2 23 15 5 3 2 5 4 1 7 4 12 27 7 8 7
Any Other Black Background 1 3 5 2 1 0 0 3 0 0 1 6 0 2 2 1
Chinese 0 0 0 1 1 0 0 1 2 0 0 1 1 0 0 1
Any other ethnic group 6 2 4 3 5 3 7 7 3 2 5 15 27 5 7 5
Unclassified 2 4 1 3 2 4 4 0 1 0 0 1 0 1 2 1
IDACI rate for school 33.2 34.3 31.7 30.9 30.4 34.0 30.6 32.4 30.9 31.9 35.3 31.0 34.3 30.4 29.8
% of pupils defined as mobile 5 26 21 29 13 22 14 19 21 10 21 26 27 22 19 12
% of pupils known to be eligible for FSM 19 18 28 24 41 53 27 45 39 22 57 37 39 43 33 28
% of pupils that are disadvantaged 59 44 47 40 51 67 40 64 56 37 86 48 60 71 52 42
% of pupils with EAL 61 30 38 68 24 6 89 15 33 91 11 87 76 55 59 44
% of pupils on SEN Support 8 18 13 13 25 18 12 17 20 21 24 7 17 26 16 15
% of pupils with ECH Plan 1 0 0 1 1 2 1 2 1 1 1 1 1 1 1 3
Percentage authorised absence 3 3 4 3 3 4 3 3 3 4 4 3 3 4 3 3
Percentage unauthorised absence 1 1 2 5 2 2 2 2 1 1 2 2 1 1 2 1
CHARACTERISTICS OF YEAR 6 PUPILS
KS1 Prior attainment average points 13.7 13.8 13.9 13.9 14.0 14.1 14.1 14.2 14.3 14.4 14.4 14.5 14.6 14.6 14.2 15.3
% of children in year 6 in school for 2 years+ 97 64 95 91 77 87 96 81 93 97 93 84 67 96 89 93 #VALUE! #VALUE! #VALUE! #VALUE! #VALUE!
% of children in year 6 disadvantaged 40 36 59 57 63 74 53 81 61 47 93 69 72 69 61 49
*Children attending school at the time of January 2016 census within year groups reception to year 6
Asi
anB
lack
Oth
erF
AM
ILY
GR
OU
P 3
Per
cent
age
of a
ll pu
pils
Yea
r 1
to Y
ear
6
Whi
teM
ixed
(218
4)
(343
6)
(335
0)
(213
8)
(217
8)
(207
3)
(206
2)
(211
1)
(206
4)
(203
0)
(212
1)
(206
7)
(230
5)
(216
9)
Ste
chfo
rd P
rimar
y S
choo
l
Har
per
Bel
l Sev
enth
-day
Adv
entis
t Sch
ool
St M
ary
and
St J
ohn
Juni
or
and
Infa
nt S
choo
l
Gre
ston
e A
cade
my
Sta
nvill
e P
rimar
y S
choo
l
Kin
gs R
ise
Aca
dem
y
And
erto
n P
ark
Prim
ary
Sch
ool
Jerv
oise
Sch
ool
The
Oak
land
s P
rimar
y S
choo
l
Bor
desl
ey G
reen
Prim
ary
Sch
ool
Haw
kesl
ey C
hurc
h P
rimar
y
Aca
dem
y
Sum
mer
field
Jun
ior
and
Infa
nt
Sch
ool
Cha
ndos
Prim
ary
Sch
ool
Sev
erne
Jun
ior
Infa
nt a
nd
Nur
sery
Sch
ool
Fam
ily G
rou
p 3
Ave
rag
e
Bir
min
gh
am A
vera
ge
ATTAINMENT DATA
Reading 102.4 96.4 97.6 96.9 96.4 97.0 95.1 101.3 95.3 98.0 97.6 97.7 92.7 100.7 97.3 101.2
GPS* 108.9 100.4 103.9 99.4 100.1 101.8 100.8 102.2 99.5 100.8 101.5 99.9 98.7 104.8 101.4 103.9
Maths 106.1 98.4 102.0 99.2 99.8 99.4 100.6 100.9 97.3 99.3 99.0 100.7 96.5 101.3 100.0 102.5
Reading 3.8 0.1 -4.8 -1.9 -3.4 -3.3 -5.2 2.1 -5.1 -1.9 -4.0 -2.2 -7.3 0.2 -2.6 -1.1
Writing 6.0 2.2 0.2 -2.4 2.0 5.0 2.8 3.8 -6.7 -0.6 -1.2 -3.1 -6.8 0.6 0.0 -1.2
Maths 6.3 -0.8 -0.5 -0.3 -1.3 -1.5 -0.5 0.7 -3.9 -0.9 -1.8 -0.3 -4.5 0.3 -0.6 -0.3
Reading, Writing & Maths at least expected 66.7 24.0 26.8 26.9 16.7 45.2 21.3 48.4 17.9 30.3 42.9 35.6 15.5 43.6 30.9 47.4
CONTEXTUAL ATTAINMENT DATA
Disadvantaged 50 0 24 27 11 52 17 48 18 19 42 23 14 37 27 38
Non-Disadvantaged 78 38 30 26 27 25 26 50 18 40 50 64 20 59 38 56
All Boys 50 10 19 19 6 50 21 67 14 26 33 35 10 45 25 43
Disadvantaged Boys 50 0 29 18 9 56 8 70 14 13 31 27 12 40 23 35
Non-Disadvantaged Boys 50 20 8 20 0 33 40 50 13 35 50 50 0 57 29 51
All Girls 75 33 34 37 29 42 22 37 33 34 54 36 21 42 36 52
Disadvantaged Girls 50 0 21 44 13 50 26 33 33 23 54 19 17 35 30 42
Non-Disadvantaged Girls 92 45 60 32 50 20 19 50 33 48 - 83 27 60 44 61
White Pupils 100 0 30 13 11 48 0 45 8 0 48 0 0 39 30 48
Black Pupils - 24 31 7 - 33 25 25 0 22 50 27 15 67 24 43
Asian Pupils 64 0 17 37 43 0 22 0 22 35 0 40 27 48 35 48
Mixed Pupils 100 0 30 50 0 100 50 100 33 0 0 - 0 0 33 49
Chinese Pupils - - - - - - - - - - - - - - - 75
Other Ethnic Background Pupils - - 0 0 - - 33 100 - 0 0 33 23 0 21 46
Pupils in school less than 2 years 0 0 33 17 14 75 25 67 0 33 0 43 6 0 22 31
Pupils in school for 2 years+ 69 38 26 28 17 41 21 44 19 30 46 34 20 45 32 49
Pupils with SEN Support 0 0 0 0 20 14 0 0 0 0 18 0 0 0 3 10
Pupils with ECH Plan - - 0 0 0 0 0 - - - - - 0 0 0 5
Pupils with EAL 61 0 33 24 20 0 21 0 43 30 0 36 23 47 30 46
Pupils without EAL 86 40 23 29 16 47 25 52 10 40 44 33 0 40 33 49
KEY STAGE 2 SUBJECT INFORMATION
Reading Number 30 25 56 78 30 31 89 31 28 89 28 45 58 55 673 14581
% At Least Expected 70 40 36 42 27 52 28 65 32 39 46 47 22 53 41 59
% Higher Standard 13 4 9 3 7 6 4 0 0 3 0 7 0 13 5 14
Writing Number 30 25 56 78 30 31 89 31 28 89 28 45 58 55 673 14573
% At Least Expected 80 52 70 36 77 84 76 84 43 57 71 62 34 75 62 69
% Higher Standard 30 0 7 1 0 26 16 13 0 0 4 4 2 0 7 6
GPS* Number 30 25 56 78 30 31 89 31 28 89 28 45 58 55 673 14581
% At Least Expected 93 56 63 53 53 68 57 61 57 67 71 47 41 82 61 71
% Higher Standard 53 4 16 15 10 10 11 10 4 11 7 9 3 25 13 22
Maths Number 30 25 56 78 30 31 89 31 28 89 28 45 58 55 673 14581
% At Least Expected 83 52 55 47 50 68 54 68 39 54 54 58 31 60 54 66
% Higher Standard 27 8 9 13 7 3 7 0 0 6 4 4 3 15 8 15
*Grammar, Punctuation & Spelling
EA
L
Ave
rage
scal
ed s
core
Ave
rage
Pro
gres
sF
SM
6B
oys
Girl
sE
thni
city
% o
f pup
ils a
t lea
st a
t the
exp
ecte
d st
anda
rd in
Rea
ding
, Writ
ing
and
Mat
hs
Mob
ility
SE
NF
AM
ILY
GR
OU
P 3
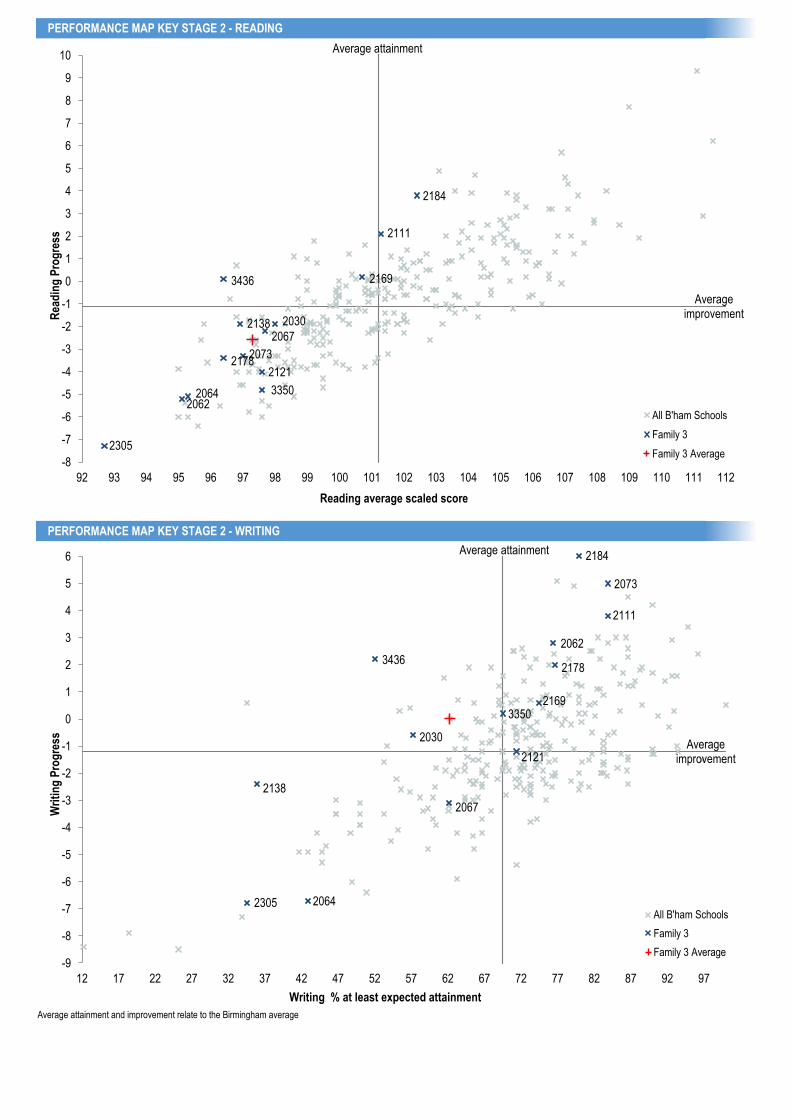
PERFORMANCE MAP KEY STAGE 2 - READING
PERFORMANCE MAP KEY STAGE 2 - WRITING
Average attainment and improvement relate to the Birmingham average
2184
3436
3350
2138
2178 2073
2062
2111
2064
2030
2121
2067
2305
2169
-8
-7
-6
-5
-4
-3
-2
-1
0
1
2
3
4
5
6
7
8
9
10
92 93 94 95 96 97 98 99 100 101 102 103 104 105 106 107 108 109 110 111 112
Rea
din
g P
rog
ress
Reading average scaled score
All B'ham Schools
Family 3
Family 3 Average
2184
3436
3350
2138
2178
2073
2062
2111
2064
2030
2121
2067
2305
2169
-9
-8
-7
-6
-5
-4
-3
-2
-1
0
1
2
3
4
5
6
12 17 22 27 32 37 42 47 52 57 62 67 72 77 82 87 92 97
Wri
tin
g P
rog
ress
Writing % at least expected attainment
All B'ham Schools
Family 3
Family 3 Average
Average attainment
Average improvement
Average attainment
Average improvement
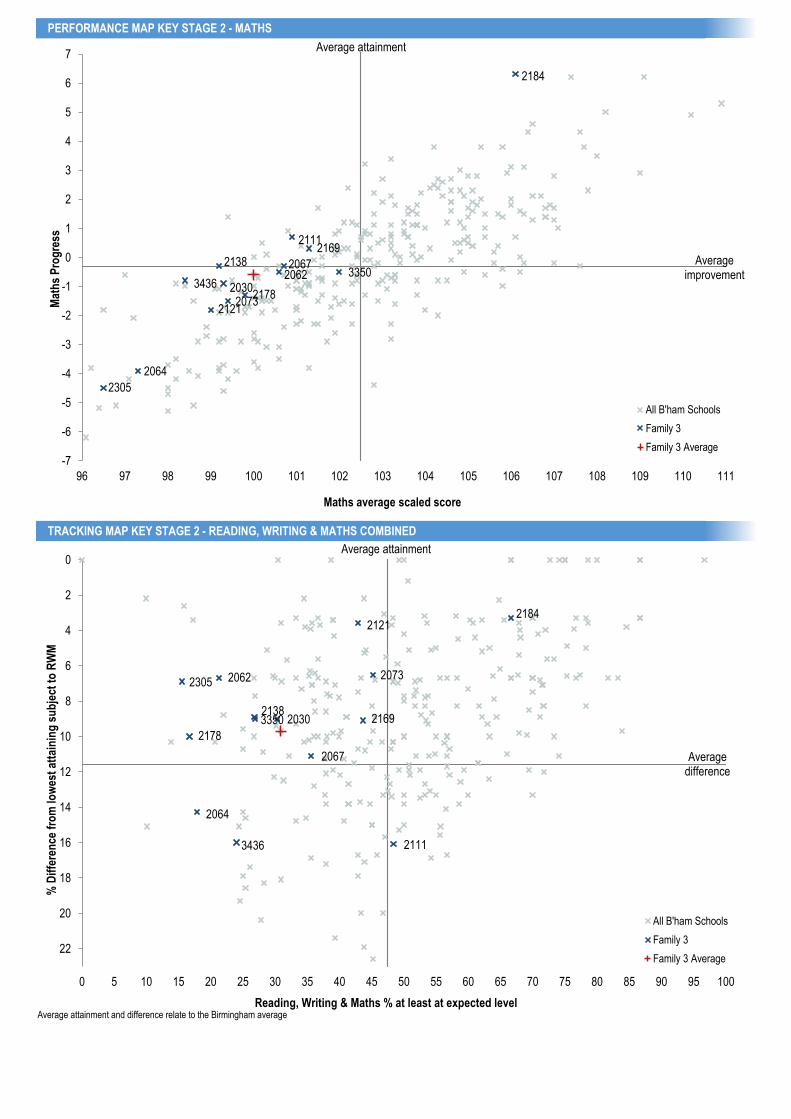
PERFORMANCE MAP KEY STAGE 2 - MATHS
TRACKING MAP KEY STAGE 2 - READING, WRITING & MATHS COMBINED
Average attainment and difference relate to the Birmingham average
2184
3436 3350
2138
2178 2073
2062
2111
2064
2030
2121
2067
2305
2169
-7
-6
-5
-4
-3
-2
-1
0
1
2
3
4
5
6
7
96 97 98 99 100 101 102 103 104 105 106 107 108 109 110 111
Mat
hs
Pro
gre
ss
Maths average scaled score
All B'ham Schools
Family 3
Family 3 Average
2184
3436
3350 2138
2178
2073 2062
2111
2064
2030
2121
2067
2305
2169
0
2
4
6
8
10
12
14
16
18
20
22
0 5 10 15 20 25 30 35 40 45 50 55 60 65 70 75 80 85 90 95 100
% D
iffe
ren
ce f
rom
low
est
atta
inin
g s
ub
ject
to
RW
M
Reading, Writing & Maths % at least at expected level
All B'ham Schools
Family 3
Family 3 Average
Average difference
Average attainment
Average improvement
Average attainment
(208
2)
(212
7)
(200
2)
(214
0)
(243
5)
(203
4)
(247
9)
(214
4)
(218
2)
(209
6)
(336
6)
(204
7)
(334
7)
(211
7)
Con
way
Prim
ary
Sch
ool
Loze
lls J
unio
r an
d In
fant
Sch
ool a
nd N
urse
ry
Bor
desl
ey V
illag
e P
rimar
y
Sch
ool
Chi
veno
r P
rimar
y S
choo
l
Ben
son
Com
mun
ity S
choo
l
Bro
okfie
lds
Prim
ary
Sch
ool
Ang
lese
y P
rimar
y S
choo
l
Als
ton
Prim
ary
Sch
ool
Ark
Cha
mbe
rlain
Prim
ary
Aca
dem
y
Lea
For
est P
rimar
y A
cade
my
St P
aul's
Cat
holic
Prim
ary
Sch
ool
Chi
lwel
l Cro
ft A
cade
my
St E
dmun
d's
Cat
holic
Prim
ary
Sch
ool
Oas
is A
cade
my
Bou
lton
Fam
ily G
rou
p 4
Ave
rag
e
Bir
min
gh
am A
vera
ge
CHARACTERISTICS OF SCHOOLS AND THEIR PUPILS*
School Type LA LA LA A LA LA LA A A A A A LA A -
School Designation CS CS CS AS CS CS CS AS AC AS AC AS VA AS -
Number of full time pupils 419 421 438 323 522 381 672 629 599 445 190 409 205 205 5858 110244
Boys as a percentage of full time pupils 52 54 53 52 50 52 47 50 53 52 48 51 51 46 51 51
Girls as a percentage of full time pupils 48 46 47 48 50 48 53 50 47 48 52 49 49 54 49 49
Prior Attainment Decile 2 2 3 3 3 3 3 3 3 3 4 4 5 5 -
Contextual Decile 1 2 1 2 2 1 2 3 2 2 2 1 2 1 -
White British 1 2 4 63 3 8 1 1 0 46 53 4 9 3 11 32
Irish 0 0 0 0 0 0 0 0 0 0 2 0 1 1 0 0
Traveller of Irish Heritage 0 0 0 0 0 0 0 0 0 0 0 0 0 0 0 0
White Other 1 1 3 4 3 5 0 9 2 4 4 7 11 3 4 4
Gypsy / Roma 0 0 11 0 2 1 0 0 0 1 0 0 0 0 1 1
White and Black Caribbean 0 1 2 11 3 5 0 0 0 5 5 3 3 1 2 3
White and Black African 0 1 1 1 1 1 0 0 0 1 2 1 1 1 1 1
White and Asian 1 0 2 0 0 2 0 1 0 3 0 1 1 2 1 2
Any Other Mixed Background 1 1 3 4 5 6 1 3 1 4 2 2 3 5 3 3
Indian 0 4 2 0 7 1 2 1 0 0 3 1 2 21 2 5
Pakistani 66 19 24 4 22 4 31 66 42 18 2 6 1 13 28 25
Bangladeshi 17 33 8 0 4 2 53 3 30 1 0 3 1 11 15 5
Any Other Asian Background 0 0 2 0 3 2 0 1 1 1 0 1 2 1 1 1
Black Caribbean 0 4 1 2 17 10 0 0 0 3 6 11 29 10 5 4
Black African 4 28 26 5 10 31 6 8 15 5 15 44 30 8 16 7
Any Other Black Background 0 1 1 1 8 6 1 1 0 2 2 8 2 1 2 1
Chinese 0 0 0 1 2 2 0 0 0 0 0 1 0 0 0 1
Any other ethnic group 8 6 10 3 10 12 3 4 9 3 3 5 5 15 7 5
Unclassified 0 1 0 0 1 1 0 1 0 2 1 1 0 5 1 1
IDACI rate for school 33.3 37.8 33.4 35.0 34.7 37.8 35.6 35.2 33.9 38.3 38.4 39.5 35.0 38.6 29.8
% of pupils defined as mobile 12 5 30 24 17 36 10 6 9 24 21 22 15 20 17 12
% of pupils known to be eligible for FSM 45 33 34 56 47 39 30 36 35 49 51 56 57 45 42 28
% of pupils that are disadvantaged 48 49 53 67 65 60 46 47 52 70 75 74 72 61 57 42
% of pupils with EAL 84 89 72 15 55 54 94 81 92 29 25 54 48 66 67 44
% of pupils on SEN Support 12 17 13 16 18 29 16 13 4 16 21 9 23 5 15 15
% of pupils with ECH Plan 0 1 0 1 1 0 3 1 0 0 0 1 0 1 1 3
Percentage authorised absence 3 2 4 4 3 3 4 3 2 3 3 3 3 3 3 3
Percentage unauthorised absence 1 1 2 3 2 2 2 2 1 3 1 2 1 1 2 1
CHARACTERISTICS OF YEAR 6 PUPILS
KS1 Prior attainment average points 14.6 14.6 14.7 14.7 14.8 14.8 14.9 14.9 14.9 14.9 15.2 15.1 15.2 15.2 14.9 15.3
% of children in year 6 in school for 2 years+ 93 98 80 80 92 84 98 89 93 95 87 86 90 96 90 93 #VALUE! #VALUE! #VALUE! #VALUE! #VALUE!
% of children in year 6 disadvantaged 67 67 52 71 75 77 60 49 61 69 78 82 72 61 64 49
*Children attending school at the time of January 2016 census within year groups reception to year 6
FA
MIL
Y G
RO
UP
4P
erce
ntag
e of
all
pupi
ls Y
ear
1 to
Yea
r 6
Whi
teM
ixed
Asi
anB
lack
Oth
er
(208
2)
(212
7)
(200
2)
(214
0)
(243
5)
(203
4)
(247
9)
(214
4)
(218
2)
(209
6)
(336
6)
(204
7)
(334
7)
(211
7)
Con
way
Prim
ary
Sch
ool
Loze
lls J
unio
r an
d In
fant
Sch
ool a
nd N
urse
ry
Bor
desl
ey V
illag
e P
rimar
y
Sch
ool
Chi
veno
r P
rimar
y S
choo
l
Ben
son
Com
mun
ity S
choo
l
Bro
okfie
lds
Prim
ary
Sch
ool
Ang
lese
y P
rimar
y S
choo
l
Als
ton
Prim
ary
Sch
ool
Ark
Cha
mbe
rlain
Prim
ary
Aca
dem
y
Lea
For
est P
rimar
y A
cade
my
St P
aul's
Cat
holic
Prim
ary
Sch
ool
Chi
lwel
l Cro
ft A
cade
my
St E
dmun
d's
Cat
holic
Prim
ary
Sch
ool
Oas
is A
cade
my
Bou
lton
Fam
ily G
rou
p 4
Ave
rag
e
Bir
min
gh
am A
vera
ge
ATTAINMENT DATA
Reading 100.5 101.0 97.5 100.0 97.1 98.4 100.9 98.9 99.0 97.3 97.2 99.3 99.6 98.0 99.1 101.2
GPS* 104.8 105.6 100.9 100.3 103.3 100.9 103.3 103.4 102.2 101.8 103.0 100.1 103.3 99.7 102.5 103.9
Maths 103.2 102.8 99.7 99.9 102.6 99.2 105.3 101.1 100.7 99.8 101.3 99.3 102.2 98.0 101.4 102.5
Reading 0.1 0.3 -3.3 -0.6 -3.4 -1.2 0.1 -1.6 -2.1 -3.7 -4.0 -2.8 -1.7 -3.3 -1.8 -1.1
Writing -4.2 0.1 -8.4 1.9 -0.1 -0.7 5.1 -1.5 -1.7 -1.2 -0.5 -1.4 -4.1 -1.3 -1.1 -1.2
Maths 2.1 1.5 -2.9 -1.7 0.9 -1.9 3.8 0.4 -0.6 -1.7 -0.5 -2.8 0.3 -4.7 -0.1 -0.3
Reading, Writing & Maths at least expected 48.3 51.7 10.0 43.9 44.1 38.7 52.7 40.0 42.9 39.0 39.1 41.1 41.4 26.1 40.2 47.4
CONTEXTUAL ATTAINMENT DATA
Disadvantaged 53 58 9 38 41 38 45 34 48 32 39 35 48 29 40 38
Non-Disadvantaged 40 40 12 58 53 43 64 46 35 56 40 70 25 22 41 56
All Boys 34 55 0 38 44 29 59 29 39 41 43 40 25 38 36 43
Disadvantaged Boys 38 63 0 31 35 23 48 29 46 36 33 36 33 50 36 35
Non-Disadvantaged Boys 27 46 0 50 63 50 75 29 31 50 100 67 0 0 36 51
All Girls 64 48 19 53 44 50 48 51 47 36 38 42 62 20 44 52
Disadvantaged Girls 68 54 15 46 44 55 44 40 49 25 42 33 67 13 43 42
Non-Disadvantaged Girls 56 29 23 75 43 33 55 60 41 67 25 71 50 29 46 61
White Pupils 33 100 7 44 17 80 0 0 - 43 41 33 57 100 37 48
Black Pupils 33 69 11 25 52 28 60 56 40 33 33 47 44 17 41 43
Asian Pupils 52 49 10 33 50 50 55 42 41 35 - 43 0 18 42 48
Mixed Pupils - - 0 57 0 33 - 33 - 57 50 0 50 0 29 49
Chinese Pupils - - - - 50 - - - - - - - - - 50 75
Other Ethnic Background Pupils 25 0 25 - 50 50 0 100 59 0 - 50 0 0 40 46
Pupils in school less than 2 years 25 0 0 38 20 40 50 10 40 0 0 25 33 0 20 31
Pupils in school for 2 years+ 50 53 13 45 46 38 53 44 43 41 45 44 42 27 42 49
Pupils with SEN Support 20 0 0 0 15 0 10 9 20 0 0 0 20 0 7 10
Pupils with ECH Plan - 0 0 0 - - 0 - - 0 - - - - 0 5
Pupils with EAL 51 52 10 40 45 40 54 43 44 35 50 50 50 18 42 46
Pupils without EAL 29 100 12 45 42 40 43 23 0 41 40 33 35 33 36 49
KEY STAGE 2 SUBJECT INFORMATION
Reading Number 60 60 90 41 59 31 91 90 147 59 23 56 29 23 859 14581
% At Least Expected 52 60 36 61 49 39 62 48 50 42 43 50 59 43 50 59
% Higher Standard 10 7 4 15 5 16 3 8 10 10 4 7 0 4 8 14
Writing Number 60 60 90 41 59 31 91 90 147 59 23 56 29 23 859 14573
% At Least Expected 63 68 12 73 66 65 77 62 72 69 70 71 55 74 63 69
% Higher Standard 0 3 0 15 3 0 44 1 0 8 0 0 0 0 7 6
GPS* Number 60 60 90 41 59 31 91 90 147 59 23 56 29 23 859 14581
% At Least Expected 87 87 53 63 73 52 73 70 69 54 61 59 79 57 68 71
% Higher Standard 22 22 10 5 15 13 15 19 16 19 13 4 7 4 14 22
Maths Number 60 60 90 41 59 31 91 90 147 59 23 56 29 23 859 14581
% At Least Expected 73 68 41 63 71 55 84 57 59 59 61 52 66 48 61 66
% Higher Standard 13 12 7 5 8 6 19 21 7 7 4 7 10 4 10 15
*Grammar, Punctuation & Spelling
FA
MIL
Y G
RO
UP
4M
obili
tyS
EN
EA
L
Ave
rage
scal
ed s
core
Ave
rage
Pro
gres
sF
SM
6B
oys
Girl
sE
thni
city
% o
f pup
ils a
t lea
st a
t the
exp
ecte
d st
anda
rd in
Rea
ding
, Writ
ing
and
Mat
hs
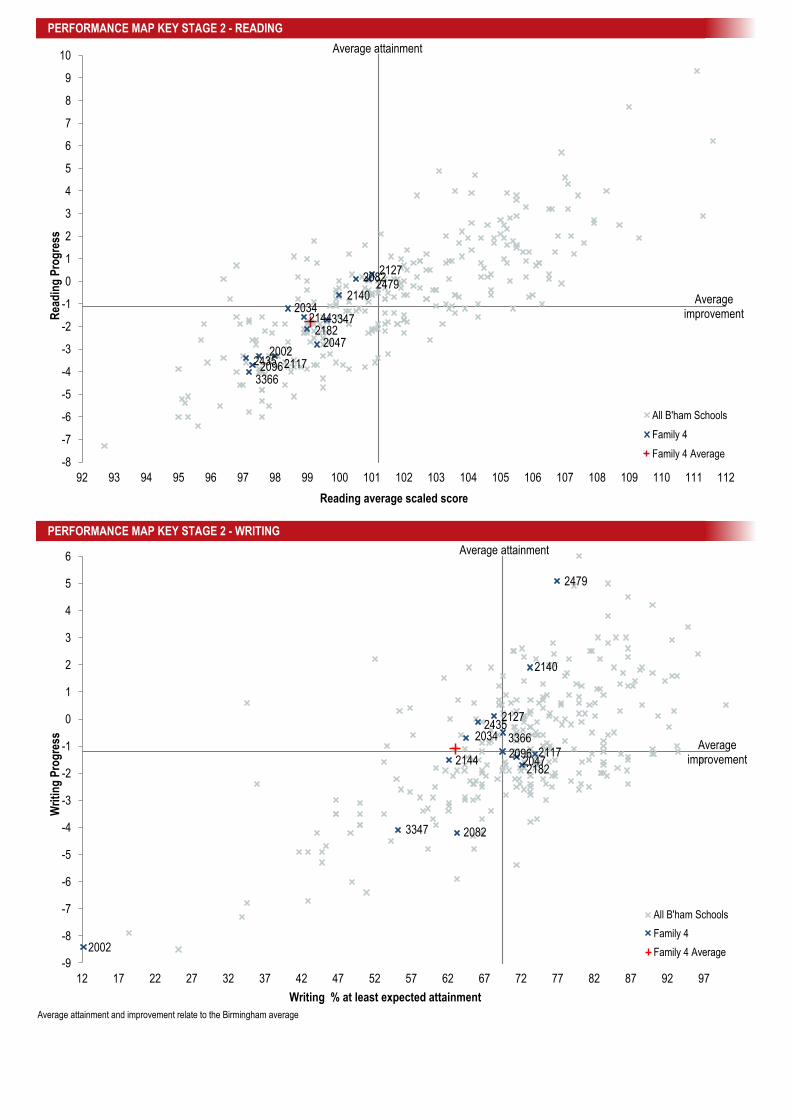
PERFORMANCE MAP KEY STAGE 2 - READING
PERFORMANCE MAP KEY STAGE 2 - WRITING
Average attainment and improvement relate to the Birmingham average
2082 2127
2002
2140
2435
2034
2479
2144 2182
2096 3366
2047
3347
2117
-8
-7
-6
-5
-4
-3
-2
-1
0
1
2
3
4
5
6
7
8
9
10
92 93 94 95 96 97 98 99 100 101 102 103 104 105 106 107 108 109 110 111 112
Rea
din
g P
rog
ress
Reading average scaled score
All B'ham Schools
Family 4
Family 4 Average
2082
2127
2002
2140
2435 2034
2479
2144 2182
2096
3366
2047
3347
2117
-9
-8
-7
-6
-5
-4
-3
-2
-1
0
1
2
3
4
5
6
12 17 22 27 32 37 42 47 52 57 62 67 72 77 82 87 92 97
Wri
tin
g P
rog
ress
Writing % at least expected attainment
All B'ham Schools
Family 4
Family 4 Average
Average attainment
Average improvement
Average attainment
Average improvement

PERFORMANCE MAP KEY STAGE 2 - MATHS
TRACKING MAP KEY STAGE 2 - READING, WRITING & MATHS COMBINED
Average attainment and difference relate to the Birmingham average
2082 2127
2002
2140
2435
2034
2479
2144
2182
2096
3366
2047
3347
2117
-7
-6
-5
-4
-3
-2
-1
0
1
2
3
4
5
6
7
96 97 98 99 100 101 102 103 104 105 106 107 108 109 110 111
Mat
hs
Pro
gre
ss
Maths average scaled score
All B'ham Schools
Family 4
Family 4 Average
2082
2127
2002
2140
2435
2034
2479
2144 2182
2096
3366
2047
3347
2117
0
2
4
6
8
10
12
14
16
18
20
22
0 5 10 15 20 25 30 35 40 45 50 55 60 65 70 75 80 85 90 95 100
% D
iffe
ren
ce f
rom
low
est
atta
inin
g s
ub
ject
to
RW
M
Reading, Writing & Maths % at least at expected level
All B'ham Schools
Family 4
Family 4 Average
Average difference
Average attainment
Average improvement
Average attainment
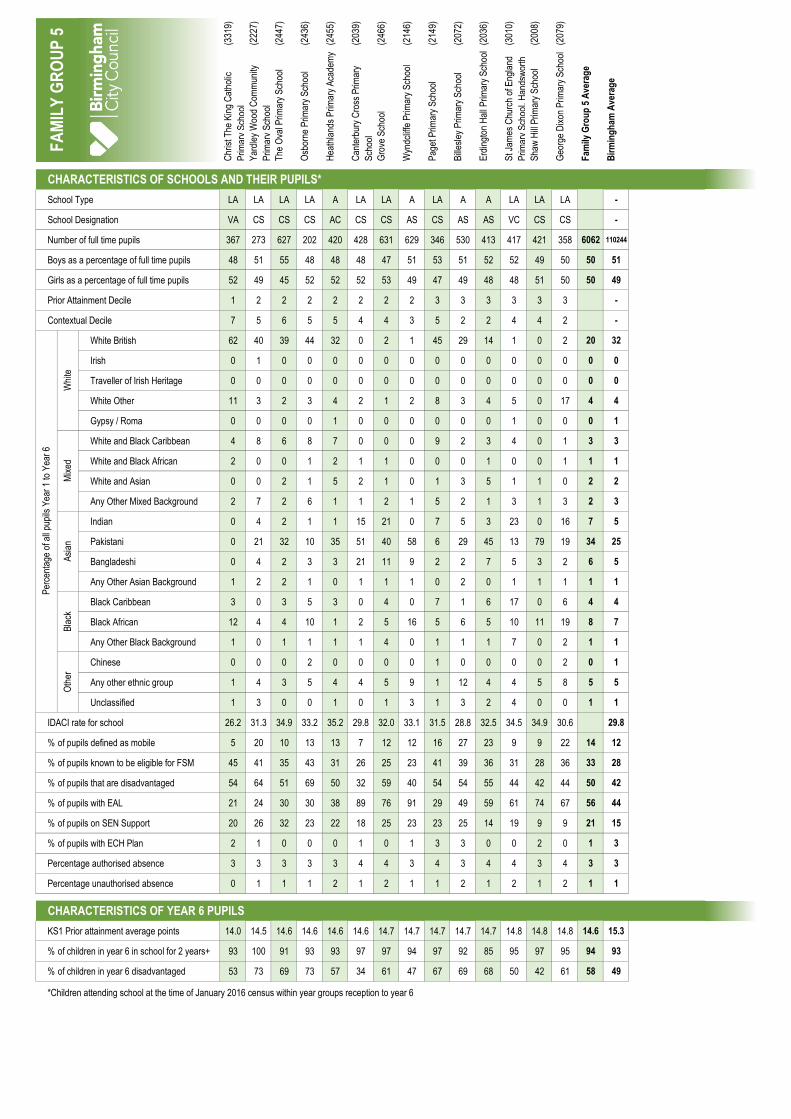
(331
9)
(222
7)
(244
7)
(243
6)
(245
5)
(203
9)
(246
6)
(214
6)
(214
9)
(207
2)
(203
6)
(301
0)
(200
8)
(207
9)
Chr
ist T
he K
ing
Cat
holic
Prim
ary
Sch
ool
Yar
dley
Woo
d C
omm
unity
Prim
ary
Sch
ool
The
Ova
l Prim
ary
Sch
ool
Osb
orne
Prim
ary
Sch
ool
Hea
thla
nds
Prim
ary
Aca
dem
y
Can
terb
ury
Cro
ss P
rimar
y
Sch
ool
Gro
ve S
choo
l
Wyn
dclif
fe P
rimar
y S
choo
l
Pag
et P
rimar
y S
choo
l
Bill
esle
y P
rimar
y S
choo
l
Erd
ingt
on H
all P
rimar
y S
choo
l
St J
ames
Chu
rch
of E
ngla
nd
Prim
ary
Sch
ool,
Han
dsw
orth
Sha
w H
ill P
rimar
y S
choo
l
Geo
rge
Dix
on P
rimar
y S
choo
l
Fam
ily G
rou
p 5
Ave
rag
e
Bir
min
gh
am A
vera
ge
CHARACTERISTICS OF SCHOOLS AND THEIR PUPILS*
School Type LA LA LA LA A LA LA A LA A A LA LA LA -
School Designation VA CS CS CS AC CS CS AS CS AS AS VC CS CS -
Number of full time pupils 367 273 627 202 420 428 631 629 346 530 413 417 421 358 6062 110244
Boys as a percentage of full time pupils 48 51 55 48 48 48 47 51 53 51 52 52 49 50 50 51
Girls as a percentage of full time pupils 52 49 45 52 52 52 53 49 47 49 48 48 51 50 50 49
Prior Attainment Decile 1 2 2 2 2 2 2 2 3 3 3 3 3 3 -
Contextual Decile 7 5 6 5 5 4 4 3 5 2 2 4 4 2 -
White British 62 40 39 44 32 0 2 1 45 29 14 1 0 2 20 32
Irish 0 1 0 0 0 0 0 0 0 0 0 0 0 0 0 0
Traveller of Irish Heritage 0 0 0 0 0 0 0 0 0 0 0 0 0 0 0 0
White Other 11 3 2 3 4 2 1 2 8 3 4 5 0 17 4 4
Gypsy / Roma 0 0 0 0 1 0 0 0 0 0 0 1 0 0 0 1
White and Black Caribbean 4 8 6 8 7 0 0 0 9 2 3 4 0 1 3 3
White and Black African 2 0 0 1 2 1 1 0 0 0 1 0 0 1 1 1
White and Asian 0 0 2 1 5 2 1 0 1 3 5 1 1 0 2 2
Any Other Mixed Background 2 7 2 6 1 1 2 1 5 2 1 3 1 3 2 3
Indian 0 4 2 1 1 15 21 0 7 5 3 23 0 16 7 5
Pakistani 0 21 32 10 35 51 40 58 6 29 45 13 79 19 34 25
Bangladeshi 0 4 2 3 3 21 11 9 2 2 7 5 3 2 6 5
Any Other Asian Background 1 2 2 1 0 1 1 1 0 2 0 1 1 1 1 1
Black Caribbean 3 0 3 5 3 0 4 0 7 1 6 17 0 6 4 4
Black African 12 4 4 10 1 2 5 16 5 6 5 10 11 19 8 7
Any Other Black Background 1 0 1 1 1 1 4 0 1 1 1 7 0 2 1 1
Chinese 0 0 0 2 0 0 0 0 1 0 0 0 0 2 0 1
Any other ethnic group 1 4 3 5 4 4 5 9 1 12 4 4 5 8 5 5
Unclassified 1 3 0 0 1 0 1 3 1 3 2 4 0 0 1 1
IDACI rate for school 26.2 31.3 34.9 33.2 35.2 29.8 32.0 33.1 31.5 28.8 32.5 34.5 34.9 30.6 29.8
% of pupils defined as mobile 5 20 10 13 13 7 12 12 16 27 23 9 9 22 14 12
% of pupils known to be eligible for FSM 45 41 35 43 31 26 25 23 41 39 36 31 28 36 33 28
% of pupils that are disadvantaged 54 64 51 69 50 32 59 40 54 54 55 44 42 44 50 42
% of pupils with EAL 21 24 30 30 38 89 76 91 29 49 59 61 74 67 56 44
% of pupils on SEN Support 20 26 32 23 22 18 25 23 23 25 14 19 9 9 21 15
% of pupils with ECH Plan 2 1 0 0 0 1 0 1 3 3 0 0 2 0 1 3
Percentage authorised absence 3 3 3 3 3 4 4 3 4 3 4 4 3 4 3 3
Percentage unauthorised absence 0 1 1 1 2 1 2 1 1 2 1 2 1 2 1 1
CHARACTERISTICS OF YEAR 6 PUPILS
KS1 Prior attainment average points 14.0 14.5 14.6 14.6 14.6 14.6 14.7 14.7 14.7 14.7 14.7 14.8 14.8 14.8 14.6 15.3
% of children in year 6 in school for 2 years+ 93 100 91 93 93 97 97 94 97 92 85 95 97 95 94 93 #VALUE! #VALUE! #VALUE! #VALUE! #VALUE!
% of children in year 6 disadvantaged 53 73 69 73 57 34 61 47 67 69 68 50 42 61 58 49
*Children attending school at the time of January 2016 census within year groups reception to year 6
FA
MIL
Y G
RO
UP
5P
erce
ntag
e of
all
pupi
ls Y
ear
1 to
Yea
r 6
Whi
teM
ixed
Asi
anB
lack
Oth
er

(331
9)
(222
7)
(244
7)
(243
6)
(245
5)
(203
9)
(246
6)
(214
6)
(214
9)
(207
2)
(203
6)
(301
0)
(200
8)
(207
9)
Chr
ist T
he K
ing
Cat
holic
Prim
ary
Sch
ool
Yar
dley
Woo
d C
omm
unity
Prim
ary
Sch
ool
The
Ova
l Prim
ary
Sch
ool
Osb
orne
Prim
ary
Sch
ool
Hea
thla
nds
Prim
ary
Aca
dem
y
Can
terb
ury
Cro
ss P
rimar
y
Sch
ool
Gro
ve S
choo
l
Wyn
dclif
fe P
rimar
y S
choo
l
Pag
et P
rimar
y S
choo
l
Bill
esle
y P
rimar
y S
choo
l
Erd
ingt
on H
all P
rimar
y S
choo
l
St J
ames
Chu
rch
of E
ngla
nd
Prim
ary
Sch
ool,
Han
dsw
orth
Sha
w H
ill P
rimar
y S
choo
l
Geo
rge
Dix
on P
rimar
y S
choo
l
Fam
ily G
rou
p 5
Ave
rag
e
Bir
min
gh
am A
vera
ge
ATTAINMENT DATA
Reading 104.2 99.2 98.4 100.0 97.4 100.8 101.6 98.3 102.0 101.0 99.0 95.2 104.1 100.1 99.9 101.2
GPS* 107.6 100.4 102.2 103.0 100.6 105.3 105.4 101.3 103.0 106.3 101.7 100.5 108.8 102.2 103.5 103.9
Maths 104.2 100.6 100.1 100.2 99.3 103.5 103.9 99.4 102.3 104.1 99.8 100.4 107.4 102.1 101.9 102.5
Reading 4.7 -0.9 -2.7 -0.3 -2.6 -0.5 1.1 -1.9 0.7 0.2 -2.2 -5.4 3.9 -3.7 -0.8 -1.1
Writing 2.5 0.5 -1.7 -3.5 -2.9 2.8 0.7 -2.5 -1.9 0.5 -2.2 -1.6 3.0 1.6 -0.4 -1.2
Maths 3.8 -0.3 -1.4 -1.4 -1.7 0.9 2.2 -1.9 1.2 2.4 -1.9 -1.5 6.2 -1.5 0.3 -0.3
Reading, Writing & Maths at least expected 55.6 31.0 34.8 36.7 25.4 53.2 53.4 35.2 43.3 58.1 28.3 16.7 75.0 39.0 42.2 47.4
CONTEXTUAL ATTAINMENT DATA
Disadvantaged 50 33 34 32 24 24 56 27 45 53 22 23 80 24 38 38
Non-Disadvantaged 62 25 36 50 28 68 50 43 40 68 42 10 71 63 48 56
All Boys 44 25 38 23 20 41 40 27 41 53 27 18 77 35 37 43
Disadvantaged Boys 33 27 36 22 18 18 38 24 47 48 11 18 79 20 32 35
Non-Disadvantaged Boys 60 20 40 25 23 52 45 32 29 62 55 18 76 63 45 51
All Girls 70 38 32 47 31 68 62 43 50 64 30 16 72 44 47 52
Disadvantaged Girls 78 40 32 38 29 30 70 31 40 59 32 26 82 30 44 42
Non-Disadvantaged Girls 64 33 31 75 33 89 52 50 67 83 25 0 67 63 52 61
White Pupils 45 25 31 27 17 67 25 0 35 56 18 0 - 22 33 48
Black Pupils 89 100 50 29 20 0 75 20 33 71 0 13 78 25 38 43
Asian Pupils - 22 36 40 38 55 56 37 33 55 38 23 77 59 48 48
Mixed Pupils 100 40 29 80 22 50 0 100 100 100 0 33 - - 45 49
Chinese Pupils - - - 0 - - - - - - - - - - 0 75
Other Ethnic Background Pupils - 0 0 0 0 0 0 25 100 50 67 0 33 33 29 46
Pupils in school less than 2 years 67 - 0 0 25 50 0 0 0 60 22 0 50 50 22 31
Pupils in school for 2 years+ 55 31 38 39 25 53 55 37 45 58 29 18 76 38 44 49
Pupils with SEN Support 11 8 18 0 0 0 10 0 0 18 13 0 0 0 8 10
Pupils with ECH Plan 100 - 0 - - 0 0 33 0 0 - - 67 - 29 5
Pupils with EAL 77 29 40 30 44 51 53 35 45 57 37 15 77 42 47 46
Pupils without EAL 47 32 32 40 17 67 57 38 42 59 17 19 57 35 36 49
KEY STAGE 2 SUBJECT INFORMATION
Reading Number 45 29 89 30 60 62 88 88 30 62 60 60 60 41 804 14581
% At Least Expected 87 55 49 43 40 56 63 45 63 61 47 27 75 49 54 59
% Higher Standard 18 3 6 17 5 8 11 8 20 13 7 5 27 17 11 14
Writing Number 45 29 89 30 59 62 88 88 30 62 60 60 60 41 803 14573
% At Least Expected 71 69 67 47 64 84 75 60 63 69 55 53 85 78 68 69
% Higher Standard 13 3 1 0 0 15 1 1 7 6 5 3 12 24 6 6
GPS* Number 45 29 89 30 60 62 88 88 30 62 60 60 60 41 804 14581
% At Least Expected 96 55 62 70 58 76 80 60 63 81 65 57 90 54 69 71
% Higher Standard 29 7 18 17 13 26 26 11 20 29 15 10 52 17 21 22
Maths Number 45 29 89 30 60 62 88 88 30 62 60 60 60 41 804 14581
% At Least Expected 71 59 54 47 47 65 73 58 63 77 47 52 87 54 61 66
% Higher Standard 27 7 10 10 8 18 23 5 20 15 10 8 40 12 15 15
*Grammar, Punctuation & Spelling
FA
MIL
Y G
RO
UP
5M
obili
tyS
EN
EA
L
Ave
rage
scal
ed s
core
Ave
rage
Pro
gres
sF
SM
6B
oys
Girl
sE
thni
city
% o
f pup
ils a
t lea
st a
t the
exp
ecte
d st
anda
rd in
Rea
ding
, Writ
ing
and
Mat
hs

PERFORMANCE MAP KEY STAGE 2 - READING
PERFORMANCE MAP KEY STAGE 2 - WRITING
Average attainment and improvement relate to the Birmingham average
3319
2227
2447
2436
2455
2039
2466
2146
2149 2072
2036
3010
2008
2079
-8
-7
-6
-5
-4
-3
-2
-1
0
1
2
3
4
5
6
7
8
9
10
92 93 94 95 96 97 98 99 100 101 102 103 104 105 106 107 108 109 110 111 112
Rea
din
g P
rog
ress
Reading average scaled score
All B'ham Schools
Family 5
Family 5 Average
3319
2227
2447
2436
2455
2039
2466
2146
2149
2072
2036
3010
2008
2079
-9
-8
-7
-6
-5
-4
-3
-2
-1
0
1
2
3
4
5
6
12 17 22 27 32 37 42 47 52 57 62 67 72 77 82 87 92 97
Wri
tin
g P
rog
ress
Writing % at least expected attainment
All B'ham Schools
Family 5
Family 5 Average
Average attainment
Average improvement
Average attainment
Average improvement
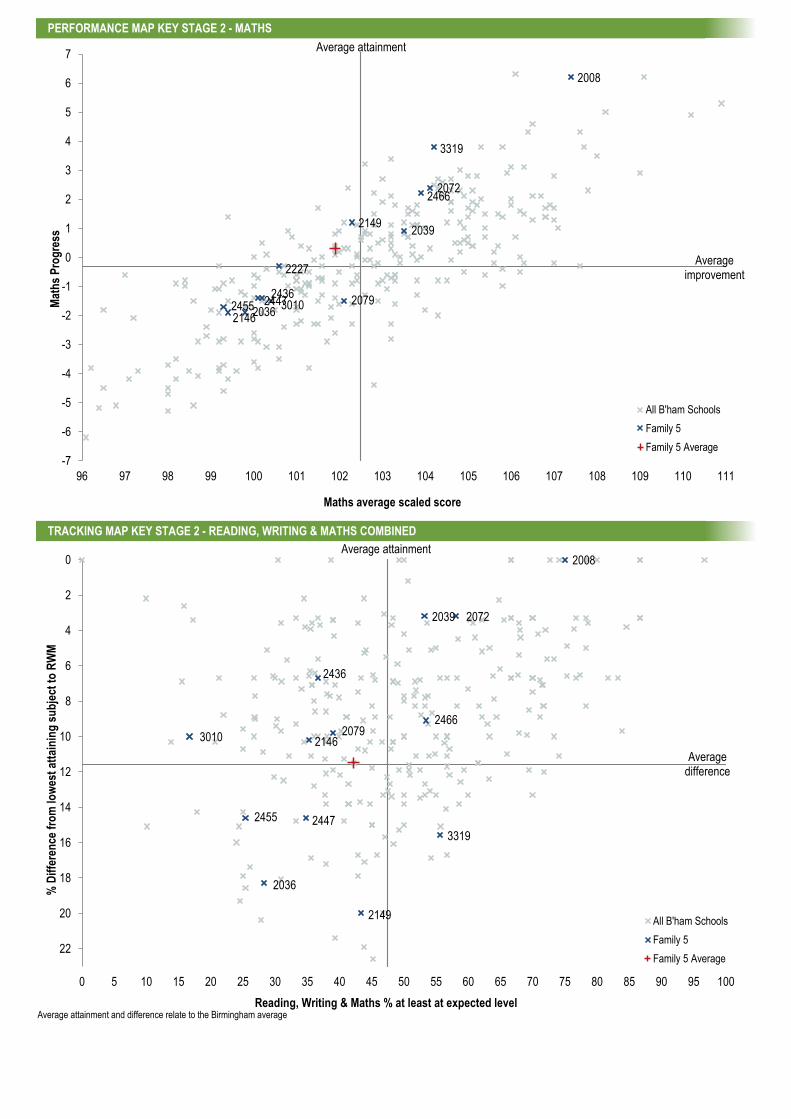
PERFORMANCE MAP KEY STAGE 2 - MATHS
TRACKING MAP KEY STAGE 2 - READING, WRITING & MATHS COMBINED
Average attainment and difference relate to the Birmingham average
3319
2227
2447 2436
2455
2039
2466
2146
2149
2072
2036 3010
2008
2079
-7
-6
-5
-4
-3
-2
-1
0
1
2
3
4
5
6
7
96 97 98 99 100 101 102 103 104 105 106 107 108 109 110 111
Mat
hs
Pro
gre
ss
Maths average scaled score
All B'ham Schools
Family 5
Family 5 Average
3319
2447
2436
2455
2039
2466
2146
2149
2072
2036
3010
2008
2079
0
2
4
6
8
10
12
14
16
18
20
22
0 5 10 15 20 25 30 35 40 45 50 55 60 65 70 75 80 85 90 95 100
% D
iffe
ren
ce f
rom
low
est
atta
inin
g s
ub
ject
to
RW
M
Reading, Writing & Maths % at least at expected level
All B'ham Schools
Family 5
Family 5 Average
Average difference
Average attainment
Average improvement
Average attainment
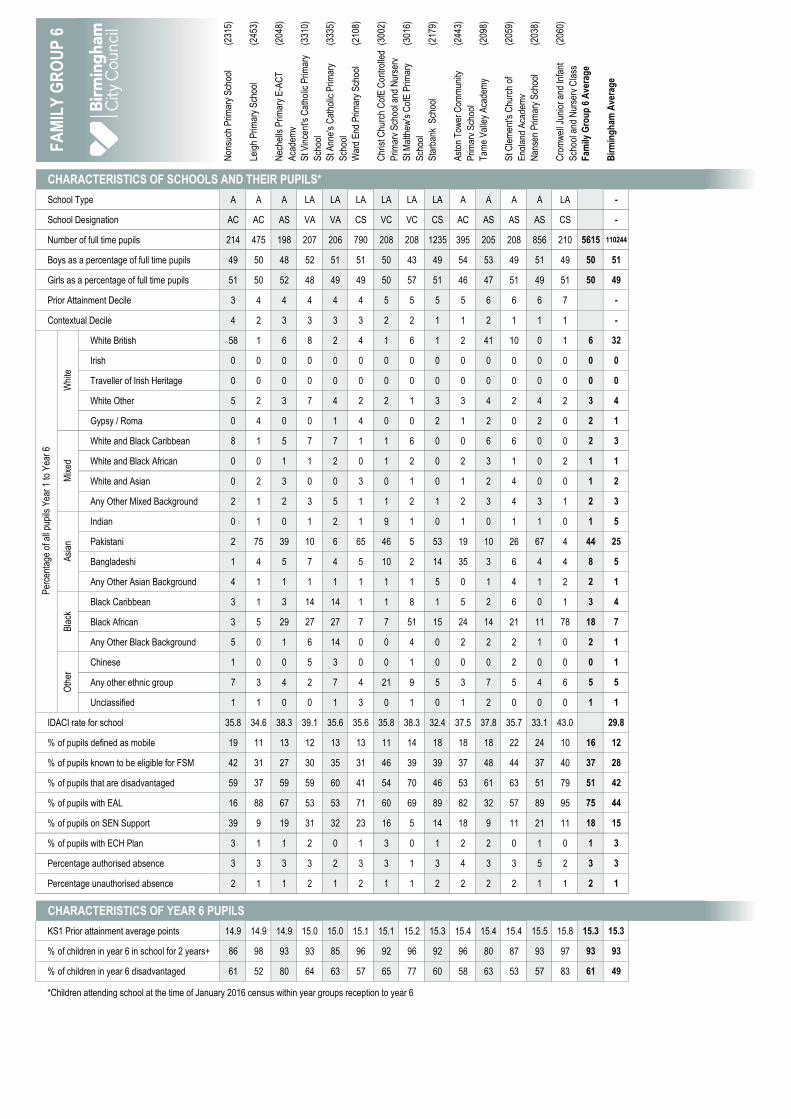
(231
5)
(245
3)
(204
8)
(331
0)
(333
5)
(210
8)
(300
2)
(301
6)
(217
9)
(244
3)
(209
8)
(205
9)
(203
8)
(206
0)
Non
such
Prim
ary
Sch
ool
Leig
h P
rimar
y S
choo
l
Nec
hells
Prim
ary
E-A
CT
Aca
dem
y
St V
ince
nt's
Cat
holic
Prim
ary
Sch
ool
St A
nne'
s C
atho
lic P
rimar
y
Sch
ool
War
d E
nd P
rimar
y S
choo
l
Chr
ist C
hurc
h C
ofE
Con
trol
led
Prim
ary
Sch
ool a
nd N
urse
ry
St M
atth
ew's
Cof
E P
rimar
y
Sch
ool
Sta
rban
k S
choo
l
Ast
on T
ower
Com
mun
ity
Prim
ary
Sch
ool
Tam
e V
alle
y A
cade
my
St C
lem
ent's
Chu
rch
of
Eng
land
Aca
dem
y
Nan
sen
Prim
ary
Sch
ool
Cro
mw
ell J
unio
r an
d In
fant
Sch
ool a
nd N
urse
ry C
lass
Fam
ily G
rou
p 6
Ave
rag
e
Bir
min
gh
am A
vera
ge
CHARACTERISTICS OF SCHOOLS AND THEIR PUPILS*
School Type A A A LA LA LA LA LA LA A A A A LA -
School Designation AC AC AS VA VA CS VC VC CS AC AS AS AS CS -
Number of full time pupils 214 475 198 207 206 790 208 208 1235 395 205 208 856 210 5615 110244
Boys as a percentage of full time pupils 49 50 48 52 51 51 50 43 49 54 53 49 51 49 50 51
Girls as a percentage of full time pupils 51 50 52 48 49 49 50 57 51 46 47 51 49 51 50 49
Prior Attainment Decile 3 4 4 4 4 4 5 5 5 5 6 6 6 7 -
Contextual Decile 4 2 3 3 3 3 2 2 1 1 2 1 1 1 -
White British 58 1 6 8 2 4 1 6 1 2 41 10 0 1 6 32
Irish 0 0 0 0 0 0 0 0 0 0 0 0 0 0 0 0
Traveller of Irish Heritage 0 0 0 0 0 0 0 0 0 0 0 0 0 0 0 0
White Other 5 2 3 7 4 2 2 1 3 3 4 2 4 2 3 4
Gypsy / Roma 0 4 0 0 1 4 0 0 2 1 2 0 2 0 2 1
White and Black Caribbean 8 1 5 7 7 1 1 6 0 0 6 6 0 0 2 3
White and Black African 0 0 1 1 2 0 1 2 0 2 3 1 0 2 1 1
White and Asian 0 2 3 0 0 3 0 1 0 1 2 4 0 0 1 2
Any Other Mixed Background 2 1 2 3 5 1 1 2 1 2 3 4 3 1 2 3
Indian 0 1 0 1 2 1 9 1 0 1 0 1 1 0 1 5
Pakistani 2 75 39 10 6 65 46 5 53 19 10 26 67 4 44 25
Bangladeshi 1 4 5 7 4 5 10 2 14 35 3 6 4 4 8 5
Any Other Asian Background 4 1 1 1 1 1 1 1 5 0 1 4 1 2 2 1
Black Caribbean 3 1 3 14 14 1 1 8 1 5 2 6 0 1 3 4
Black African 3 5 29 27 27 7 7 51 15 24 14 21 11 78 18 7
Any Other Black Background 5 0 1 6 14 0 0 4 0 2 2 2 1 0 2 1
Chinese 1 0 0 5 3 0 0 1 0 0 0 2 0 0 0 1
Any other ethnic group 7 3 4 2 7 4 21 9 5 3 7 5 4 6 5 5
Unclassified 1 1 0 0 1 3 0 1 0 1 2 0 0 0 1 1
IDACI rate for school 35.8 34.6 38.3 39.1 35.6 35.6 35.8 38.3 32.4 37.5 37.8 35.7 33.1 43.0 29.8
% of pupils defined as mobile 19 11 13 12 13 13 11 14 18 18 18 22 24 10 16 12
% of pupils known to be eligible for FSM 42 31 27 30 35 31 46 39 39 37 48 44 37 40 37 28
% of pupils that are disadvantaged 59 37 59 59 60 41 54 70 46 53 61 63 51 79 51 42
% of pupils with EAL 16 88 67 53 53 71 60 69 89 82 32 57 89 95 75 44
% of pupils on SEN Support 39 9 19 31 32 23 16 5 14 18 9 11 21 11 18 15
% of pupils with ECH Plan 3 1 1 2 0 1 3 0 1 2 2 0 1 0 1 3
Percentage authorised absence 3 3 3 3 2 3 3 1 3 4 3 3 5 2 3 3
Percentage unauthorised absence 2 1 1 2 1 2 1 1 2 2 2 2 1 1 2 1
CHARACTERISTICS OF YEAR 6 PUPILS
KS1 Prior attainment average points 14.9 14.9 14.9 15.0 15.0 15.1 15.1 15.2 15.3 15.4 15.4 15.4 15.5 15.8 15.3 15.3
% of children in year 6 in school for 2 years+ 86 98 93 93 85 96 92 96 92 96 80 87 93 97 93 93 #VALUE! #VALUE! #VALUE! #VALUE! #VALUE!
% of children in year 6 disadvantaged 61 52 80 64 63 57 65 77 60 58 63 53 57 83 61 49
*Children attending school at the time of January 2016 census within year groups reception to year 6
FA
MIL
Y G
RO
UP
6P
erce
ntag
e of
all
pupi
ls Y
ear
1 to
Yea
r 6
Whi
teM
ixed
Asi
anB
lack
Oth
er
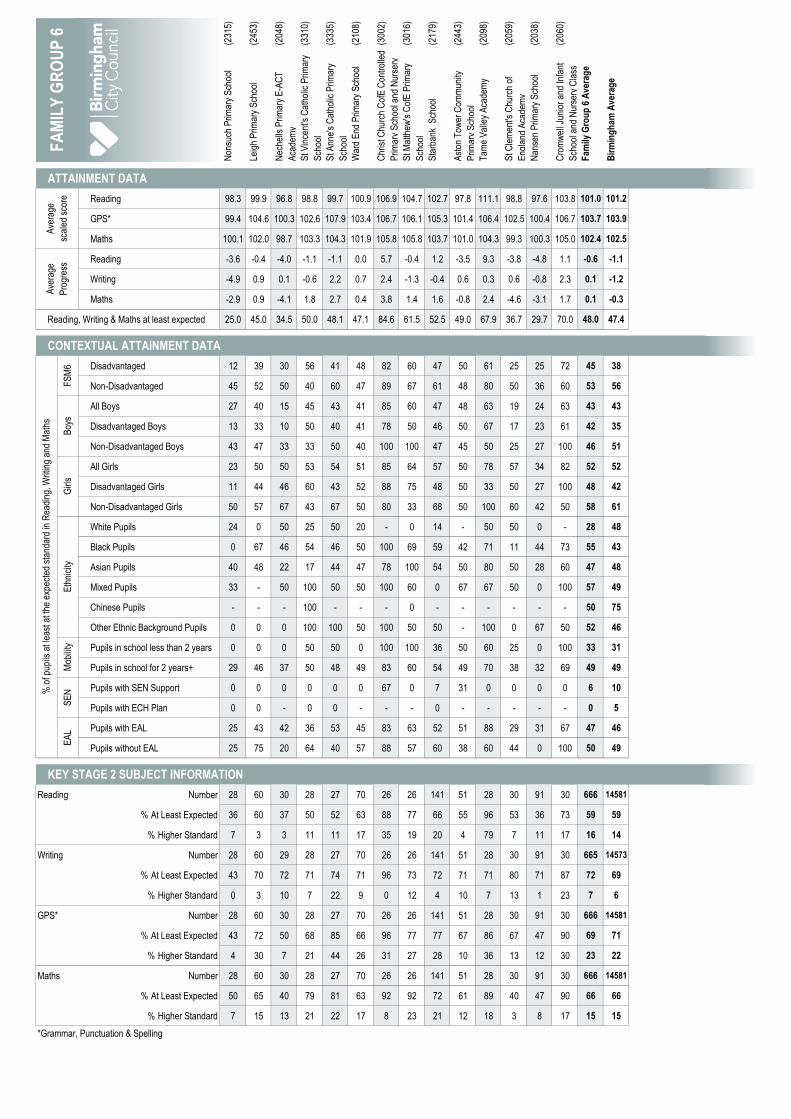
(231
5)
(245
3)
(204
8)
(331
0)
(333
5)
(210
8)
(300
2)
(301
6)
(217
9)
(244
3)
(209
8)
(205
9)
(203
8)
(206
0)
Non
such
Prim
ary
Sch
ool
Leig
h P
rimar
y S
choo
l
Nec
hells
Prim
ary
E-A
CT
Aca
dem
y
St V
ince
nt's
Cat
holic
Prim
ary
Sch
ool
St A
nne'
s C
atho
lic P
rimar
y
Sch
ool
War
d E
nd P
rimar
y S
choo
l
Chr
ist C
hurc
h C
ofE
Con
trol
led
Prim
ary
Sch
ool a
nd N
urse
ry
St M
atth
ew's
Cof
E P
rimar
y
Sch
ool
Sta
rban
k S
choo
l
Ast
on T
ower
Com
mun
ity
Prim
ary
Sch
ool
Tam
e V
alle
y A
cade
my
St C
lem
ent's
Chu
rch
of
Eng
land
Aca
dem
y
Nan
sen
Prim
ary
Sch
ool
Cro
mw
ell J
unio
r an
d In
fant
Sch
ool a
nd N
urse
ry C
lass
Fam
ily G
rou
p 6
Ave
rag
e
Bir
min
gh
am A
vera
ge
ATTAINMENT DATA
Reading 98.3 99.9 96.8 98.8 99.7 100.9 106.9 104.7 102.7 97.8 111.1 98.8 97.6 103.8 101.0 101.2
GPS* 99.4 104.6 100.3 102.6 107.9 103.4 106.7 106.1 105.3 101.4 106.4 102.5 100.4 106.7 103.7 103.9
Maths 100.1 102.0 98.7 103.3 104.3 101.9 105.8 105.8 103.7 101.0 104.3 99.3 100.3 105.0 102.4 102.5
Reading -3.6 -0.4 -4.0 -1.1 -1.1 0.0 5.7 -0.4 1.2 -3.5 9.3 -3.8 -4.8 1.1 -0.6 -1.1
Writing -4.9 0.9 0.1 -0.6 2.2 0.7 2.4 -1.3 -0.4 0.6 0.3 0.6 -0.8 2.3 0.1 -1.2
Maths -2.9 0.9 -4.1 1.8 2.7 0.4 3.8 1.4 1.6 -0.8 2.4 -4.6 -3.1 1.7 0.1 -0.3
Reading, Writing & Maths at least expected 25.0 45.0 34.5 50.0 48.1 47.1 84.6 61.5 52.5 49.0 67.9 36.7 29.7 70.0 48.0 47.4
CONTEXTUAL ATTAINMENT DATA
Disadvantaged 12 39 30 56 41 48 82 60 47 50 61 25 25 72 45 38
Non-Disadvantaged 45 52 50 40 60 47 89 67 61 48 80 50 36 60 53 56
All Boys 27 40 15 45 43 41 85 60 47 48 63 19 24 63 43 43
Disadvantaged Boys 13 33 10 50 40 41 78 50 46 50 67 17 23 61 42 35
Non-Disadvantaged Boys 43 47 33 33 50 40 100 100 47 45 50 25 27 100 46 51
All Girls 23 50 50 53 54 51 85 64 57 50 78 57 34 82 52 52
Disadvantaged Girls 11 44 46 60 43 52 88 75 48 50 33 50 27 100 48 42
Non-Disadvantaged Girls 50 57 67 43 67 50 80 33 68 50 100 60 42 50 58 61
White Pupils 24 0 50 25 50 20 - 0 14 - 50 50 0 - 28 48
Black Pupils 0 67 46 54 46 50 100 69 59 42 71 11 44 73 55 43
Asian Pupils 40 48 22 17 44 47 78 100 54 50 80 50 28 60 47 48
Mixed Pupils 33 - 50 100 50 50 100 60 0 67 67 50 0 100 57 49
Chinese Pupils - - - 100 - - - 0 - - - - - - 50 75
Other Ethnic Background Pupils 0 0 0 100 100 50 100 50 50 - 100 0 67 50 52 46
Pupils in school less than 2 years 0 0 0 50 50 0 100 100 36 50 60 25 0 100 33 31
Pupils in school for 2 years+ 29 46 37 50 48 49 83 60 54 49 70 38 32 69 49 49
Pupils with SEN Support 0 0 0 0 0 0 67 0 7 31 0 0 0 0 6 10
Pupils with ECH Plan 0 0 - 0 0 - - - 0 - - - - - 0 5
Pupils with EAL 25 43 42 36 53 45 83 63 52 51 88 29 31 67 47 46
Pupils without EAL 25 75 20 64 40 57 88 57 60 38 60 44 0 100 50 49
KEY STAGE 2 SUBJECT INFORMATION
Reading Number 28 60 30 28 27 70 26 26 141 51 28 30 91 30 666 14581
% At Least Expected 36 60 37 50 52 63 88 77 66 55 96 53 36 73 59 59
% Higher Standard 7 3 3 11 11 17 35 19 20 4 79 7 11 17 16 14
Writing Number 28 60 29 28 27 70 26 26 141 51 28 30 91 30 665 14573
% At Least Expected 43 70 72 71 74 71 96 73 72 71 71 80 71 87 72 69
% Higher Standard 0 3 10 7 22 9 0 12 4 10 7 13 1 23 7 6
GPS* Number 28 60 30 28 27 70 26 26 141 51 28 30 91 30 666 14581
% At Least Expected 43 72 50 68 85 66 96 77 77 67 86 67 47 90 69 71
% Higher Standard 4 30 7 21 44 26 31 27 28 10 36 13 12 30 23 22
Maths Number 28 60 30 28 27 70 26 26 141 51 28 30 91 30 666 14581
% At Least Expected 50 65 40 79 81 63 92 92 72 61 89 40 47 90 66 66
% Higher Standard 7 15 13 21 22 17 8 23 21 12 18 3 8 17 15 15
*Grammar, Punctuation & Spelling
FA
MIL
Y G
RO
UP
6M
obili
tyS
EN
EA
L
Ave
rage
scal
ed s
core
Ave
rage
Pro
gres
sF
SM
6B
oys
Girl
sE
thni
city
% o
f pup
ils a
t lea
st a
t the
exp
ecte
d st
anda
rd in
Rea
ding
, Writ
ing
and
Mat
hs

PERFORMANCE MAP KEY STAGE 2 - READING
PERFORMANCE MAP KEY STAGE 2 - WRITING
Average attainment and improvement relate to the Birmingham average
2315
2453
2048
3310 3335
2108
3002
3016
2179
2443
2098
2059
2038
2060
-8
-7
-6
-5
-4
-3
-2
-1
0
1
2
3
4
5
6
7
8
9
10
92 93 94 95 96 97 98 99 100 101 102 103 104 105 106 107 108 109 110 111 112
Rea
din
g P
rog
ress
Reading average scaled score
All B'ham Schools
Family 6
Family 6 Average
2315
2453
2048
3310
3335
2108
3002
3016
2179
2443 2098
2059
2038
2060
-9
-8
-7
-6
-5
-4
-3
-2
-1
0
1
2
3
4
5
6
12 17 22 27 32 37 42 47 52 57 62 67 72 77 82 87 92 97
Wri
tin
g P
rog
ress
Writing % at least expected attainment
All B'ham Schools
Family 6
Family 6 Average
Average attainment
Average improvement
Average attainment
Average improvement

PERFORMANCE MAP KEY STAGE 2 - MATHS
TRACKING MAP KEY STAGE 2 - READING, WRITING & MATHS COMBINED
Average attainment and difference relate to the Birmingham average
2315
2453
2048
3310
3335
2108
3002
3016 2179
2443
2098
2059
2038
2060
-7
-6
-5
-4
-3
-2
-1
0
1
2
3
4
5
6
7
96 97 98 99 100 101 102 103 104 105 106 107 108 109 110 111
Mat
hs
Pro
gre
ss
Maths average scaled score
All B'ham Schools
Family 6
Family 6 Average
2315
2453
2048
3310
3335
2108
3002
3016
2179
2443
2098 2059
2038
2060
0
2
4
6
8
10
12
14
16
18
20
22
0 5 10 15 20 25 30 35 40 45 50 55 60 65 70 75 80 85 90 95 100
% D
iffe
ren
ce f
rom
low
est
atta
inin
g s
ub
ject
to
RW
M
Reading, Writing & Maths % at least at expected level
All B'ham Schools
Family 6
Family 6 Average
Average difference
Average attainment
Average improvement
Average attainment
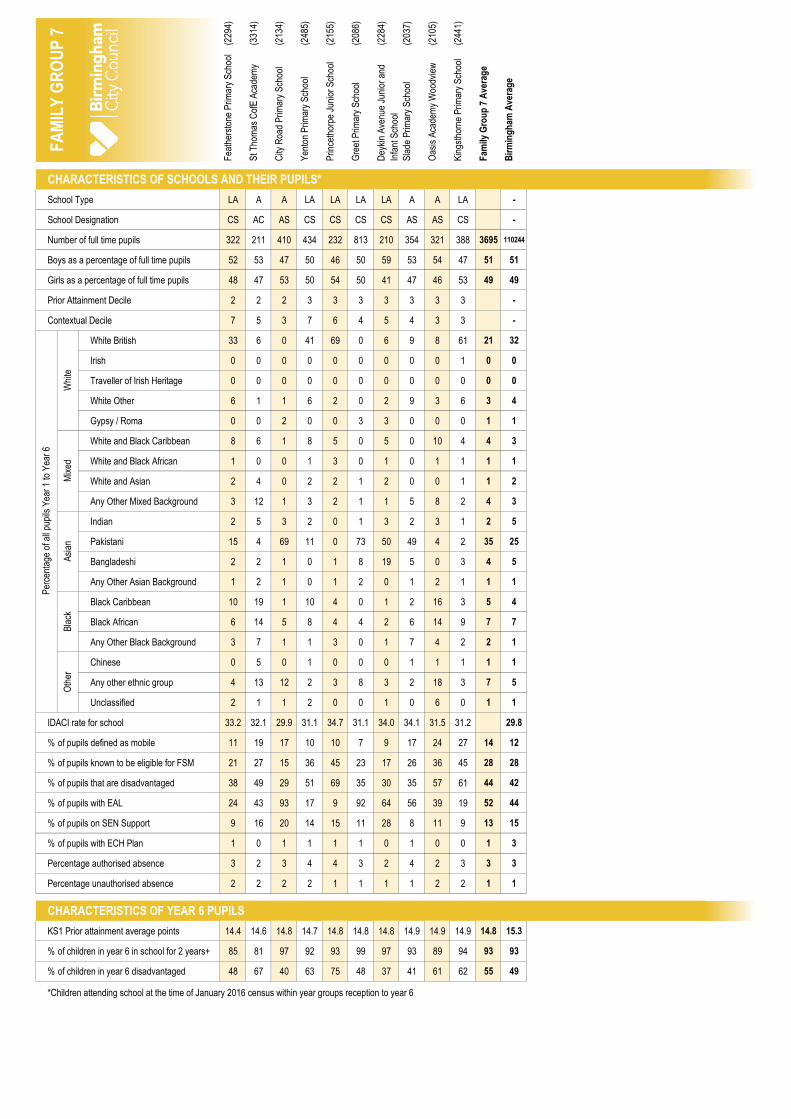
(229
4)
(331
4)
(213
4)
(248
5)
(215
5)
(208
6)
(228
4)
(203
7)
(210
5)
(244
1)
Fea
ther
ston
e P
rimar
y S
choo
l
St T
hom
as C
ofE
Aca
dem
y
City
Roa
d P
rimar
y S
choo
l
Yen
ton
Prim
ary
Sch
ool
Prin
ceth
orpe
Jun
ior
Sch
ool
Gre
et P
rimar
y S
choo
l
Dey
kin
Ave
nue
Juni
or a
nd
Infa
nt S
choo
l
Sla
de P
rimar
y S
choo
l
Oas
is A
cade
my
Woo
dvie
w
Kin
gsth
orne
Prim
ary
Sch
ool
Fam
ily G
rou
p 7
Ave
rag
e
Bir
min
gh
am A
vera
ge
CHARACTERISTICS OF SCHOOLS AND THEIR PUPILS*
School Type LA A A LA LA LA LA A A LA -
School Designation CS AC AS CS CS CS CS AS AS CS -
Number of full time pupils 322 211 410 434 232 813 210 354 321 388 3695 110244
Boys as a percentage of full time pupils 52 53 47 50 46 50 59 53 54 47 51 51
Girls as a percentage of full time pupils 48 47 53 50 54 50 41 47 46 53 49 49
Prior Attainment Decile 2 2 2 3 3 3 3 3 3 3 -
Contextual Decile 7 5 3 7 6 4 5 4 3 3 -
White British 33 6 0 41 69 0 6 9 8 61 21 32
Irish 0 0 0 0 0 0 0 0 0 1 0 0
Traveller of Irish Heritage 0 0 0 0 0 0 0 0 0 0 0 0
White Other 6 1 1 6 2 0 2 9 3 6 3 4
Gypsy / Roma 0 0 2 0 0 3 3 0 0 0 1 1
White and Black Caribbean 8 6 1 8 5 0 5 0 10 4 4 3
White and Black African 1 0 0 1 3 0 1 0 1 1 1 1
White and Asian 2 4 0 2 2 1 2 0 0 1 1 2
Any Other Mixed Background 3 12 1 3 2 1 1 5 8 2 4 3
Indian 2 5 3 2 0 1 3 2 3 1 2 5
Pakistani 15 4 69 11 0 73 50 49 4 2 35 25
Bangladeshi 2 2 1 0 1 8 19 5 0 3 4 5
Any Other Asian Background 1 2 1 0 1 2 0 1 2 1 1 1
Black Caribbean 10 19 1 10 4 0 1 2 16 3 5 4
Black African 6 14 5 8 4 4 2 6 14 9 7 7
Any Other Black Background 3 7 1 1 3 0 1 7 4 2 2 1
Chinese 0 5 0 1 0 0 0 1 1 1 1 1
Any other ethnic group 4 13 12 2 3 8 3 2 18 3 7 5
Unclassified 2 1 1 2 0 0 1 0 6 0 1 1
IDACI rate for school 33.2 32.1 29.9 31.1 34.7 31.1 34.0 34.1 31.5 31.2 29.8
% of pupils defined as mobile 11 19 17 10 10 7 9 17 24 27 14 12
% of pupils known to be eligible for FSM 21 27 15 36 45 23 17 26 36 45 28 28
% of pupils that are disadvantaged 38 49 29 51 69 35 30 35 57 61 44 42
% of pupils with EAL 24 43 93 17 9 92 64 56 39 19 52 44
% of pupils on SEN Support 9 16 20 14 15 11 28 8 11 9 13 15
% of pupils with ECH Plan 1 0 1 1 1 1 0 1 0 0 1 3
Percentage authorised absence 3 2 3 4 4 3 2 4 2 3 3 3
Percentage unauthorised absence 2 2 2 2 1 1 1 1 2 2 1 1
CHARACTERISTICS OF YEAR 6 PUPILS
KS1 Prior attainment average points 14.4 14.6 14.8 14.7 14.8 14.8 14.8 14.9 14.9 14.9 14.8 15.3
% of children in year 6 in school for 2 years+ 85 81 97 92 93 99 97 93 89 94 93 93 #VALUE! #VALUE! #VALUE! #VALUE! #VALUE! #VALUE! #VALUE! #VALUE! #VALUE!
% of children in year 6 disadvantaged 48 67 40 63 75 48 37 41 61 62 55 49
*Children attending school at the time of January 2016 census within year groups reception to year 6
FA
MIL
Y G
RO
UP
7P
erce
ntag
e of
all
pupi
ls Y
ear
1 to
Yea
r 6
Whi
teM
ixed
Asi
anB
lack
Oth
er
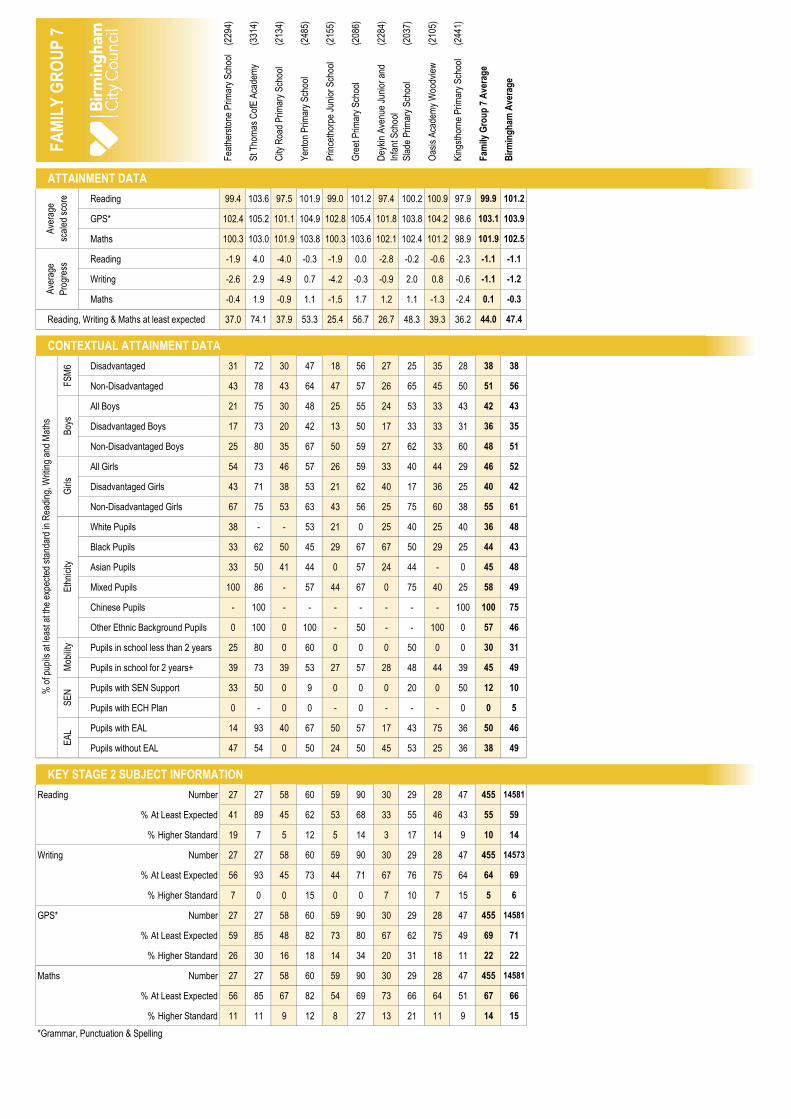
(229
4)
(331
4)
(213
4)
(248
5)
(215
5)
(208
6)
(228
4)
(203
7)
(210
5)
(244
1)
Fea
ther
ston
e P
rimar
y S
choo
l
St T
hom
as C
ofE
Aca
dem
y
City
Roa
d P
rimar
y S
choo
l
Yen
ton
Prim
ary
Sch
ool
Prin
ceth
orpe
Jun
ior
Sch
ool
Gre
et P
rimar
y S
choo
l
Dey
kin
Ave
nue
Juni
or a
nd
Infa
nt S
choo
l
Sla
de P
rimar
y S
choo
l
Oas
is A
cade
my
Woo
dvie
w
Kin
gsth
orne
Prim
ary
Sch
ool
Fam
ily G
rou
p 7
Ave
rag
e
Bir
min
gh
am A
vera
ge
ATTAINMENT DATA
Reading 99.4 103.6 97.5 101.9 99.0 101.2 97.4 100.2 100.9 97.9 99.9 101.2
GPS* 102.4 105.2 101.1 104.9 102.8 105.4 101.8 103.8 104.2 98.6 103.1 103.9
Maths 100.3 103.0 101.9 103.8 100.3 103.6 102.1 102.4 101.2 98.9 101.9 102.5
Reading -1.9 4.0 -4.0 -0.3 -1.9 0.0 -2.8 -0.2 -0.6 -2.3 -1.1 -1.1
Writing -2.6 2.9 -4.9 0.7 -4.2 -0.3 -0.9 2.0 0.8 -0.6 -1.1 -1.2
Maths -0.4 1.9 -0.9 1.1 -1.5 1.7 1.2 1.1 -1.3 -2.4 0.1 -0.3
Reading, Writing & Maths at least expected 37.0 74.1 37.9 53.3 25.4 56.7 26.7 48.3 39.3 36.2 44.0 47.4
CONTEXTUAL ATTAINMENT DATA
Disadvantaged 31 72 30 47 18 56 27 25 35 28 38 38
Non-Disadvantaged 43 78 43 64 47 57 26 65 45 50 51 56
All Boys 21 75 30 48 25 55 24 53 33 43 42 43
Disadvantaged Boys 17 73 20 42 13 50 17 33 33 31 36 35
Non-Disadvantaged Boys 25 80 35 67 50 59 27 62 33 60 48 51
All Girls 54 73 46 57 26 59 33 40 44 29 46 52
Disadvantaged Girls 43 71 38 53 21 62 40 17 36 25 40 42
Non-Disadvantaged Girls 67 75 53 63 43 56 25 75 60 38 55 61
White Pupils 38 - - 53 21 0 25 40 25 40 36 48
Black Pupils 33 62 50 45 29 67 67 50 29 25 44 43
Asian Pupils 33 50 41 44 0 57 24 44 - 0 45 48
Mixed Pupils 100 86 - 57 44 67 0 75 40 25 58 49
Chinese Pupils - 100 - - - - - - - 100 100 75
Other Ethnic Background Pupils 0 100 0 100 - 50 - - 100 0 57 46
Pupils in school less than 2 years 25 80 0 60 0 0 0 50 0 0 30 31
Pupils in school for 2 years+ 39 73 39 53 27 57 28 48 44 39 45 49
Pupils with SEN Support 33 50 0 9 0 0 0 20 0 50 12 10
Pupils with ECH Plan 0 - 0 0 - 0 - - - 0 0 5
Pupils with EAL 14 93 40 67 50 57 17 43 75 36 50 46
Pupils without EAL 47 54 0 50 24 50 45 53 25 36 38 49
KEY STAGE 2 SUBJECT INFORMATION
Reading Number 27 27 58 60 59 90 30 29 28 47 455 14581
% At Least Expected 41 89 45 62 53 68 33 55 46 43 55 59
% Higher Standard 19 7 5 12 5 14 3 17 14 9 10 14
Writing Number 27 27 58 60 59 90 30 29 28 47 455 14573
% At Least Expected 56 93 45 73 44 71 67 76 75 64 64 69
% Higher Standard 7 0 0 15 0 0 7 10 7 15 5 6
GPS* Number 27 27 58 60 59 90 30 29 28 47 455 14581
% At Least Expected 59 85 48 82 73 80 67 62 75 49 69 71
% Higher Standard 26 30 16 18 14 34 20 31 18 11 22 22
Maths Number 27 27 58 60 59 90 30 29 28 47 455 14581
% At Least Expected 56 85 67 82 54 69 73 66 64 51 67 66
% Higher Standard 11 11 9 12 8 27 13 21 11 9 14 15
*Grammar, Punctuation & Spelling
FA
MIL
Y G
RO
UP
7M
obili
tyS
EN
EA
L
Ave
rage
scal
ed s
core
Ave
rage
Pro
gres
sF
SM
6B
oys
Girl
sE
thni
city
% o
f pup
ils a
t lea
st a
t the
exp
ecte
d st
anda
rd in
Rea
ding
, Writ
ing
and
Mat
hs

PERFORMANCE MAP KEY STAGE 2 - READING
PERFORMANCE MAP KEY STAGE 2 - WRITING
Average attainment and improvement relate to the Birmingham average
2294
3314
2134
2485
2155
2086
2284
2037 2105
2441
-8
-7
-6
-5
-4
-3
-2
-1
0
1
2
3
4
5
6
7
8
9
10
92 93 94 95 96 97 98 99 100 101 102 103 104 105 106 107 108 109 110 111 112
Rea
din
g P
rog
ress
Reading average scaled score
All B'ham Schools
Family 7
Family 7 Average
2294
3314
2134
2485
2155
2086 2284
2037
2105
2441
-9
-8
-7
-6
-5
-4
-3
-2
-1
0
1
2
3
4
5
6
12 17 22 27 32 37 42 47 52 57 62 67 72 77 82 87 92 97
Wri
tin
g P
rog
ress
Writing % at least expected attainment
All B'ham Schools
Family 7
Family 7 Average
Average attainment
Average improvement
Average attainment
Average improvement

PERFORMANCE MAP KEY STAGE 2 - MATHS
TRACKING MAP KEY STAGE 2 - READING, WRITING & MATHS COMBINED
Average attainment and difference relate to the Birmingham average
2294
3314
2134
2485
2155
2086 2284
2037
2105
2441
-7
-6
-5
-4
-3
-2
-1
0
1
2
3
4
5
6
7
96 97 98 99 100 101 102 103 104 105 106 107 108 109 110 111
Mat
hs
Pro
gre
ss
Maths average scaled score
All B'ham Schools
Family 7
Family 7 Average
2294
3314
2134
2485
2155
2086
2284 2037 2105 2441
0
2
4
6
8
10
12
14
16
18
20
22
0 5 10 15 20 25 30 35 40 45 50 55 60 65 70 75 80 85 90 95 100
% D
iffe
ren
ce f
rom
low
est
atta
inin
g s
ub
ject
to
RW
M
Reading, Writing & Maths % at least at expected level
All B'ham Schools
Family 7
Family 7 Average
Average difference
Average attainment
Average improvement
Average attainment
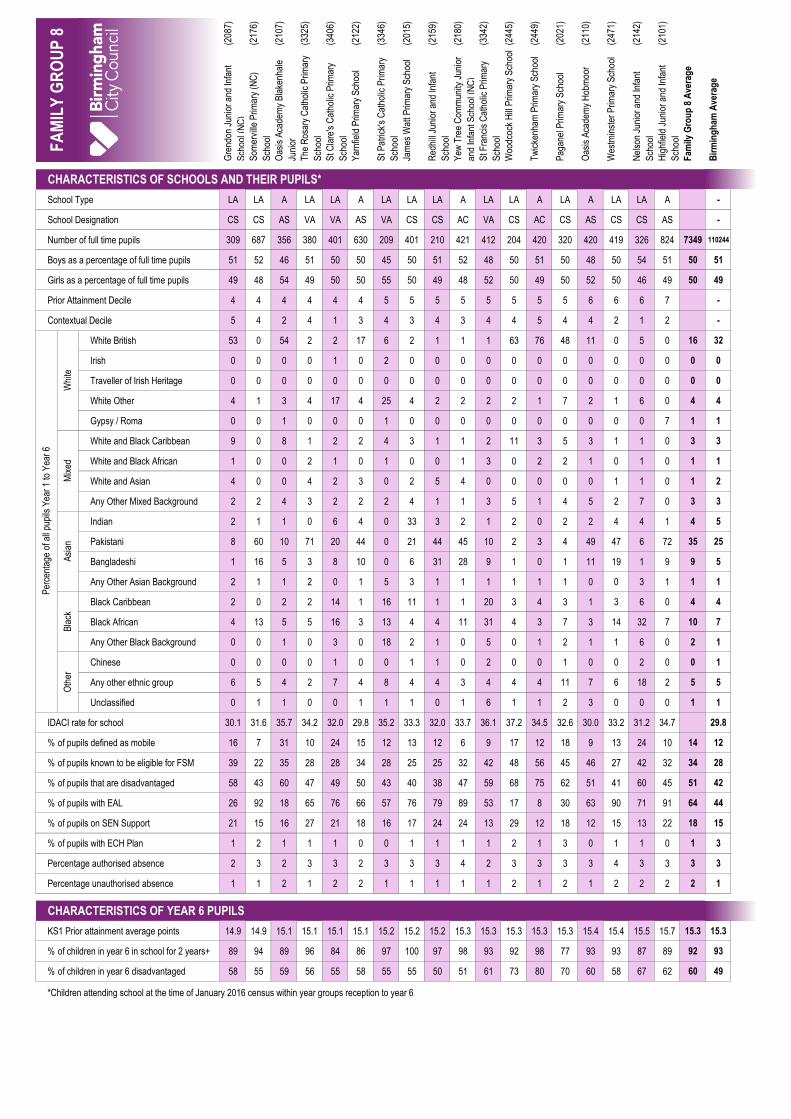
(208
7)
(217
6)
(210
7)
(332
5)
(340
6)
(212
2)
(334
6)
(201
5)
(215
9)
(218
0)
(334
2)
(244
5)
(244
9)
(202
1)
(211
0)
(247
1)
(214
2)
(210
1)
Gre
ndon
Jun
ior
and
Infa
nt
Sch
ool (
NC
)
Som
ervi
lle P
rimar
y (N
C)
Sch
ool
Oas
is A
cade
my
Bla
kenh
ale
Juni
or
The
Ros
ary
Cat
holic
Prim
ary
Sch
ool
St C
lare
's C
atho
lic P
rimar
y
Sch
ool
Yar
nfie
ld P
rimar
y S
choo
l
St P
atric
k's
Cat
holic
Prim
ary
Sch
ool
Jam
es W
att P
rimar
y S
choo
l
Red
hill
Juni
or a
nd In
fant
Sch
ool
Yew
Tre
e C
omm
unity
Jun
ior
and
Infa
nt S
choo
l (N
C)
St F
ranc
is C
atho
lic P
rimar
y
Sch
ool
Woo
dcoc
k H
ill P
rimar
y S
choo
l
Tw
icke
nham
Prim
ary
Sch
ool
Pag
anel
Prim
ary
Sch
ool
Oas
is A
cade
my
Hob
moo
r
Wes
tmin
ster
Prim
ary
Sch
ool
Nel
son
Juni
or a
nd In
fant
Sch
ool
Hig
hfie
ld J
unio
r an
d In
fant
Sch
ool
Fam
ily G
rou
p 8
Ave
rag
e
Bir
min
gh
am A
vera
ge
CHARACTERISTICS OF SCHOOLS AND THEIR PUPILS*
School Type LA LA A LA LA A LA LA LA A LA LA A LA A LA LA A -
School Designation CS CS AS VA VA AS VA CS CS AC VA CS AC CS AS CS CS AS -
Number of full time pupils 309 687 356 380 401 630 209 401 210 421 412 204 420 320 420 419 326 824 7349 110244
Boys as a percentage of full time pupils 51 52 46 51 50 50 45 50 51 52 48 50 51 50 48 50 54 51 50 51
Girls as a percentage of full time pupils 49 48 54 49 50 50 55 50 49 48 52 50 49 50 52 50 46 49 50 49
Prior Attainment Decile 4 4 4 4 4 4 5 5 5 5 5 5 5 5 6 6 6 7 -
Contextual Decile 5 4 2 4 1 3 4 3 4 3 4 4 5 4 4 2 1 2 -
White British 53 0 54 2 2 17 6 2 1 1 1 63 76 48 11 0 5 0 16 32
Irish 0 0 0 0 1 0 2 0 0 0 0 0 0 0 0 0 0 0 0 0
Traveller of Irish Heritage 0 0 0 0 0 0 0 0 0 0 0 0 0 0 0 0 0 0 0 0
White Other 4 1 3 4 17 4 25 4 2 2 2 2 1 7 2 1 6 0 4 4
Gypsy / Roma 0 0 1 0 0 0 1 0 0 0 0 0 0 0 0 0 0 7 1 1
White and Black Caribbean 9 0 8 1 2 2 4 3 1 1 2 11 3 5 3 1 1 0 3 3
White and Black African 1 0 0 2 1 0 1 0 0 1 3 0 2 2 1 0 1 0 1 1
White and Asian 4 0 0 4 2 3 0 2 5 4 0 0 0 0 0 1 1 0 1 2
Any Other Mixed Background 2 2 4 3 2 2 2 4 1 1 3 5 1 4 5 2 7 0 3 3
Indian 2 1 1 0 6 4 0 33 3 2 1 2 0 2 2 4 4 1 4 5
Pakistani 8 60 10 71 20 44 0 21 44 45 10 2 3 4 49 47 6 72 35 25
Bangladeshi 1 16 5 3 8 10 0 6 31 28 9 1 0 1 11 19 1 9 9 5
Any Other Asian Background 2 1 1 2 0 1 5 3 1 1 1 1 1 1 0 0 3 1 1 1
Black Caribbean 2 0 2 2 14 1 16 11 1 1 20 3 4 3 1 3 6 0 4 4
Black African 4 13 5 5 16 3 13 4 4 11 31 4 3 7 3 14 32 7 10 7
Any Other Black Background 0 0 1 0 3 0 18 2 1 0 5 0 1 2 1 1 6 0 2 1
Chinese 0 0 0 0 1 0 0 1 1 0 2 0 0 1 0 0 2 0 0 1
Any other ethnic group 6 5 4 2 7 4 8 4 4 3 4 4 4 11 7 6 18 2 5 5
Unclassified 0 1 1 0 0 1 1 1 0 1 6 1 1 2 3 0 0 0 1 1
IDACI rate for school 30.1 31.6 35.7 34.2 32.0 29.8 35.2 33.3 32.0 33.7 36.1 37.2 34.5 32.6 30.0 33.2 31.2 34.7 29.8
% of pupils defined as mobile 16 7 31 10 24 15 12 13 12 6 9 17 12 18 9 13 24 10 14 12
% of pupils known to be eligible for FSM 39 22 35 28 28 34 28 25 25 32 42 48 56 45 46 27 42 32 34 28
% of pupils that are disadvantaged 58 43 60 47 49 50 43 40 38 47 59 68 75 62 51 41 60 45 51 42
% of pupils with EAL 26 92 18 65 76 66 57 76 79 89 53 17 8 30 63 90 71 91 64 44
% of pupils on SEN Support 21 15 16 27 21 18 16 17 24 24 13 29 12 18 12 15 13 22 18 15
% of pupils with ECH Plan 1 2 1 1 1 0 0 1 1 1 1 2 1 3 0 1 1 0 1 3
Percentage authorised absence 2 3 2 3 3 2 3 3 3 4 2 3 3 3 3 4 3 3 3 3
Percentage unauthorised absence 1 1 2 1 2 2 1 1 1 1 1 2 1 2 1 2 2 2 2 1
CHARACTERISTICS OF YEAR 6 PUPILS
KS1 Prior attainment average points 14.9 14.9 15.1 15.1 15.1 15.1 15.2 15.2 15.2 15.3 15.3 15.3 15.3 15.3 15.4 15.4 15.5 15.7 15.3 15.3
% of children in year 6 in school for 2 years+ 89 94 89 96 84 86 97 100 97 98 93 92 98 77 93 93 87 89 92 93 #VALUE!
% of children in year 6 disadvantaged 58 55 59 56 55 58 55 55 50 51 61 73 80 70 60 58 67 62 60 49
*Children attending school at the time of January 2016 census within year groups reception to year 6
FA
MIL
Y G
RO
UP
8P
erce
ntag
e of
all
pupi
ls Y
ear
1 to
Yea
r 6
Whi
teM
ixed
Asi
anB
lack
Oth
er
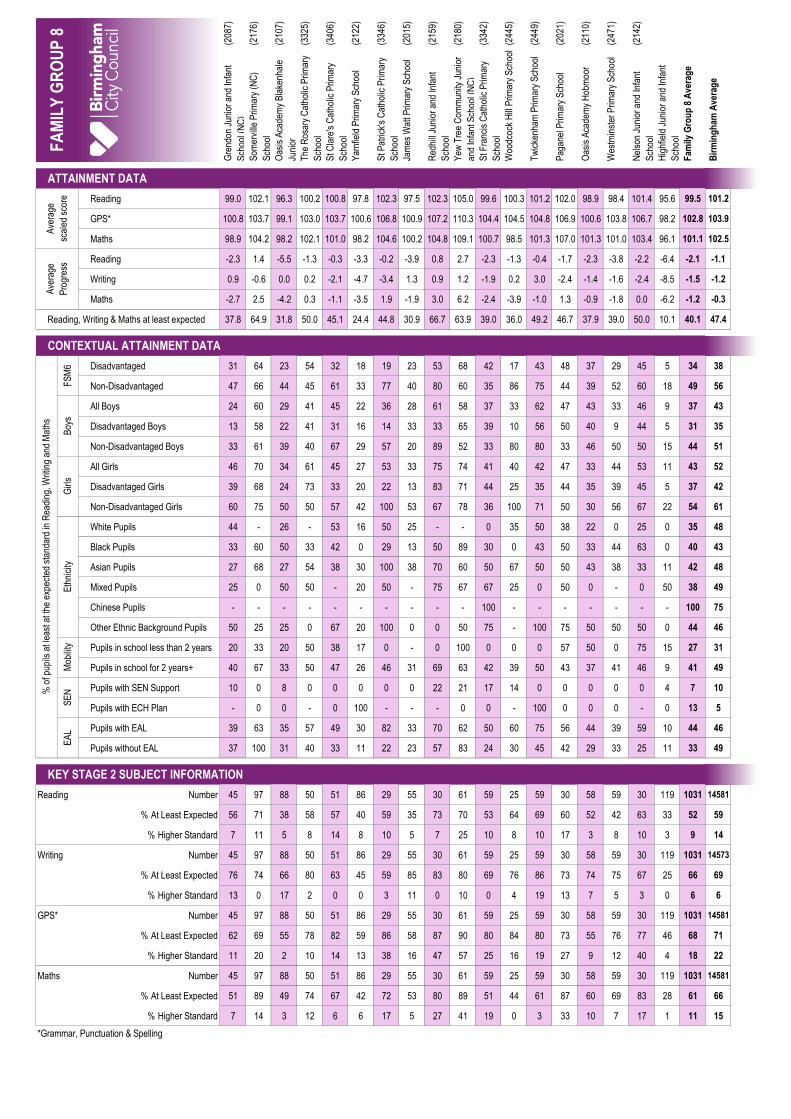
(208
7)
(217
6)
(210
7)
(332
5)
(340
6)
(212
2)
(334
6)
(201
5)
(215
9)
(218
0)
(334
2)
(244
5)
(244
9)
(202
1)
(211
0)
(247
1)
(214
2)
Gre
ndon
Jun
ior
and
Infa
nt
Sch
ool (
NC
)
Som
ervi
lle P
rimar
y (N
C)
Sch
ool
Oas
is A
cade
my
Bla
kenh
ale
Juni
or
The
Ros
ary
Cat
holic
Prim
ary
Sch
ool
St C
lare
's C
atho
lic P
rimar
y
Sch
ool
Yar
nfie
ld P
rimar
y S
choo
l
St P
atric
k's
Cat
holic
Prim
ary
Sch
ool
Jam
es W
att P
rimar
y S
choo
l
Red
hill
Juni
or a
nd In
fant
Sch
ool
Yew
Tre
e C
omm
unity
Jun
ior
and
Infa
nt S
choo
l (N
C)
St F
ranc
is C
atho
lic P
rimar
y
Sch
ool
Woo
dcoc
k H
ill P
rimar
y S
choo
l
Tw
icke
nham
Prim
ary
Sch
ool
Pag
anel
Prim
ary
Sch
ool
Oas
is A
cade
my
Hob
moo
r
Wes
tmin
ster
Prim
ary
Sch
ool
Nel
son
Juni
or a
nd In
fant
Sch
ool
Hig
hfie
ld J
unio
r an
d In
fant
Sch
ool
Fam
ily G
rou
p 8
Ave
rag
e
Bir
min
gh
am A
vera
ge
ATTAINMENT DATA
Reading 99.0 102.1 96.3 100.2 100.8 97.8 102.3 97.5 102.3 105.0 99.6 100.3 101.2 102.0 98.9 98.4 101.4 95.6 99.5 101.2
GPS* 100.8 103.7 99.1 103.0 103.7 100.6 106.8 100.9 107.2 110.3 104.4 104.5 104.8 106.9 100.6 103.8 106.7 98.2 102.8 103.9
Maths 98.9 104.2 98.2 102.1 101.0 98.2 104.6 100.2 104.8 109.1 100.7 98.5 101.3 107.0 101.3 101.0 103.4 96.1 101.1 102.5
Reading -2.3 1.4 -5.5 -1.3 -0.3 -3.3 -0.2 -3.9 0.8 2.7 -2.3 -1.3 -0.4 -1.7 -2.3 -3.8 -2.2 -6.4 -2.1 -1.1
Writing 0.9 -0.6 0.0 0.2 -2.1 -4.7 -3.4 1.3 0.9 1.2 -1.9 0.2 3.0 -2.4 -1.4 -1.6 -2.4 -8.5 -1.5 -1.2
Maths -2.7 2.5 -4.2 0.3 -1.1 -3.5 1.9 -1.9 3.0 6.2 -2.4 -3.9 -1.0 1.3 -0.9 -1.8 0.0 -6.2 -1.2 -0.3
Reading, Writing & Maths at least expected 37.8 64.9 31.8 50.0 45.1 24.4 44.8 30.9 66.7 63.9 39.0 36.0 49.2 46.7 37.9 39.0 50.0 10.1 40.1 47.4
CONTEXTUAL ATTAINMENT DATA
Disadvantaged 31 64 23 54 32 18 19 23 53 68 42 17 43 48 37 29 45 5 34 38
Non-Disadvantaged 47 66 44 45 61 33 77 40 80 60 35 86 75 44 39 52 60 18 49 56
All Boys 24 60 29 41 45 22 36 28 61 58 37 33 62 47 43 33 46 9 37 43
Disadvantaged Boys 13 58 22 41 31 16 14 33 33 65 39 10 56 50 40 9 44 5 31 35
Non-Disadvantaged Boys 33 61 39 40 67 29 57 20 89 52 33 80 80 33 46 50 50 15 44 51
All Girls 46 70 34 61 45 27 53 33 75 74 41 40 42 47 33 44 53 11 43 52
Disadvantaged Girls 39 68 24 73 33 20 22 13 83 71 44 25 35 44 35 39 45 5 37 42
Non-Disadvantaged Girls 60 75 50 50 57 42 100 53 67 78 36 100 71 50 30 56 67 22 54 61
White Pupils 44 - 26 - 53 16 50 25 - - 0 35 50 38 22 0 25 0 35 48
Black Pupils 33 60 50 33 42 0 29 13 50 89 30 0 43 50 33 44 63 0 40 43
Asian Pupils 27 68 27 54 38 30 100 38 70 60 50 67 50 50 43 38 33 11 42 48
Mixed Pupils 25 0 50 50 - 20 50 - 75 67 67 25 0 50 0 - 0 50 38 49
Chinese Pupils - - - - - - - - - - 100 - - - - - - - 100 75
Other Ethnic Background Pupils 50 25 25 0 67 20 100 0 0 50 75 - 100 75 50 50 50 0 44 46
Pupils in school less than 2 years 20 33 20 50 38 17 0 - 0 100 0 0 0 57 50 0 75 15 27 31
Pupils in school for 2 years+ 40 67 33 50 47 26 46 31 69 63 42 39 50 43 37 41 46 9 41 49
Pupils with SEN Support 10 0 8 0 0 0 0 0 22 21 17 14 0 0 0 0 0 4 7 10
Pupils with ECH Plan - 0 0 - 0 100 - - - 0 0 - 100 0 0 0 - 0 13 5
Pupils with EAL 39 63 35 57 49 30 82 33 70 62 50 60 75 56 44 39 59 10 44 46
Pupils without EAL 37 100 31 40 33 11 22 23 57 83 24 30 45 42 29 33 25 11 33 49
KEY STAGE 2 SUBJECT INFORMATION
Reading Number 45 97 88 50 51 86 29 55 30 61 59 25 59 30 58 59 30 119 1031 14581
% At Least Expected 56 71 38 58 57 40 59 35 73 70 53 64 69 60 52 42 63 33 52 59
% Higher Standard 7 11 5 8 14 8 10 5 7 25 10 8 10 17 3 8 10 3 9 14
Writing Number 45 97 88 50 51 86 29 55 30 61 59 25 59 30 58 59 30 119 1031 14573
% At Least Expected 76 74 66 80 63 45 59 85 83 80 69 76 86 73 74 75 67 25 66 69
% Higher Standard 13 0 17 2 0 0 3 11 0 10 0 4 19 13 7 5 3 0 6 6
GPS* Number 45 97 88 50 51 86 29 55 30 61 59 25 59 30 58 59 30 119 1031 14581
% At Least Expected 62 69 55 78 82 59 86 58 87 90 80 84 80 73 55 76 77 46 68 71
% Higher Standard 11 20 2 10 14 13 38 16 47 57 25 16 19 27 9 12 40 4 18 22
Maths Number 45 97 88 50 51 86 29 55 30 61 59 25 59 30 58 59 30 119 1031 14581
% At Least Expected 51 89 49 74 67 42 72 53 80 89 51 44 61 87 60 69 83 28 61 66
% Higher Standard 7 14 3 12 6 6 17 5 27 41 19 0 3 33 10 7 17 1 11 15
*Grammar, Punctuation & Spelling
FA
MIL
Y G
RO
UP
8M
obili
tyS
EN
EA
L
Ave
rage
scal
ed s
core
Ave
rage
Pro
gres
sF
SM
6B
oys
Girl
sE
thni
city
% o
f pup
ils a
t lea
st a
t the
exp
ecte
d st
anda
rd in
Rea
ding
, Writ
ing
and
Mat
hs
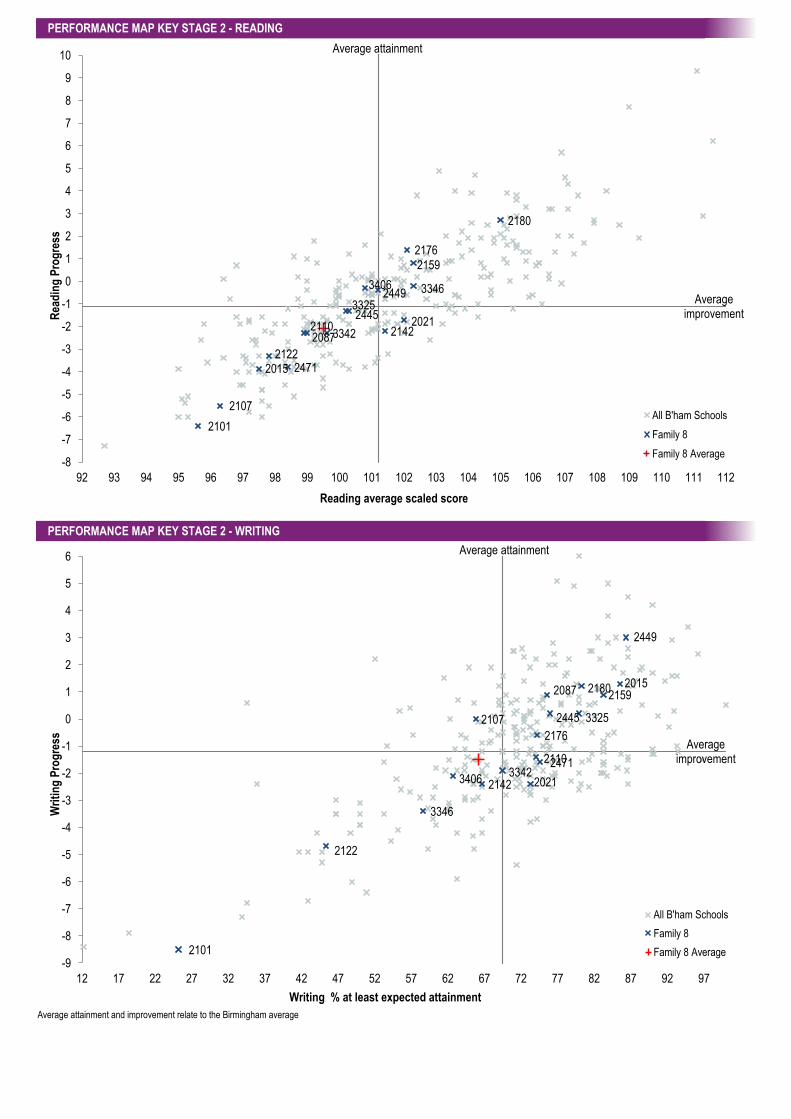
PERFORMANCE MAP KEY STAGE 2 - READING
PERFORMANCE MAP KEY STAGE 2 - WRITING
Average attainment and improvement relate to the Birmingham average
2087
2176
2107
3325
3406
2122
3346
2015
2159
2180
3342
2445
2449
2021 2110
2471
2142
2101
-8
-7
-6
-5
-4
-3
-2
-1
0
1
2
3
4
5
6
7
8
9
10
92 93 94 95 96 97 98 99 100 101 102 103 104 105 106 107 108 109 110 111 112
Rea
din
g P
rog
ress
Reading average scaled score
All B'ham Schools
Family 8
Family 8 Average
2087
2176
2107 3325
3406
2122
3346
2015 2159
2180
3342
2445
2449
2021
2110 2471
2142
2101 -9
-8
-7
-6
-5
-4
-3
-2
-1
0
1
2
3
4
5
6
12 17 22 27 32 37 42 47 52 57 62 67 72 77 82 87 92 97
Wri
tin
g P
rog
ress
Writing % at least expected attainment
All B'ham Schools
Family 8
Family 8 Average
Average attainment
Average improvement
Average attainment
Average improvement
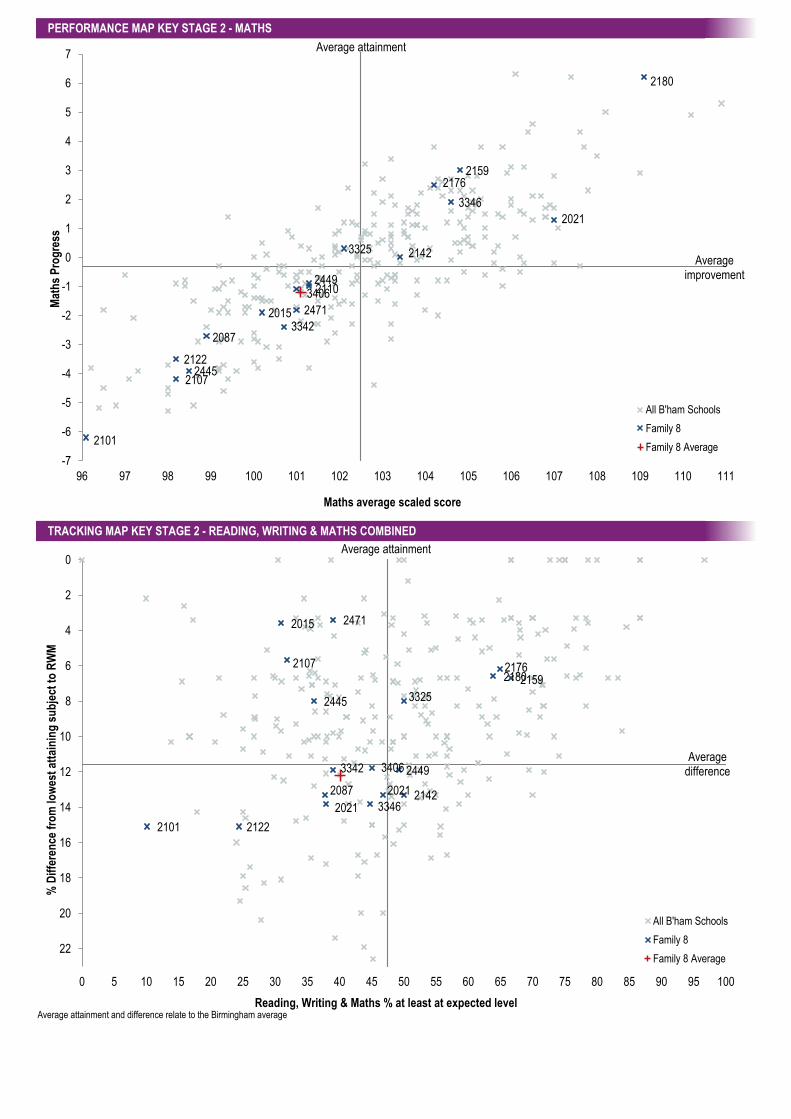
PERFORMANCE MAP KEY STAGE 2 - MATHS
TRACKING MAP KEY STAGE 2 - READING, WRITING & MATHS COMBINED
Average attainment and difference relate to the Birmingham average
2087
2176
2107
3325
3406
2122
3346
2015
2159
2180
3342
2445
2449
2021
2110
2471
2142
2101
-7
-6
-5
-4
-3
-2
-1
0
1
2
3
4
5
6
7
96 97 98 99 100 101 102 103 104 105 106 107 108 109 110 111
Mat
hs
Pro
gre
ss
Maths average scaled score
All B'ham Schools
Family 8
Family 8 Average
2087
2176 2107
3325
3406
2122
3346
2015
2159 2180
3342
2445
2449
2021
2021
2471
2142
2101
0
2
4
6
8
10
12
14
16
18
20
22
0 5 10 15 20 25 30 35 40 45 50 55 60 65 70 75 80 85 90 95 100
% D
iffe
ren
ce f
rom
low
est
atta
inin
g s
ub
ject
to
RW
M
Reading, Writing & Maths % at least at expected level
All B'ham Schools
Family 8
Family 8 Average
Average difference
Average attainment
Average improvement
Average attainment

(218
5)
(245
2)
(209
1)
(226
3)
(210
9)
(332
1)
(243
4)
(244
8)
(332
3)
(227
8)
(209
7)
(228
3)
Col
ebou
rne
Prim
ary
Sch
ool
Peg
asus
Prim
ary
Sch
ool
Gun
ter
Prim
ary
Sch
ool
Nor
thfie
ld M
anor
Prim
ary
Aca
dem
y
Fou
r D
wel
lings
Prim
ary
Aca
dem
y
Eng
lish
Mar
tyrs
' Cat
holic
Prim
ary
Sch
ool
Hill
ston
e P
rimar
y S
choo
l
Gos
sey
Lane
Aca
dem
y
The
Ora
tory
Rom
an C
atho
lic
Prim
ary
Sch
ool
Woo
dgat
e P
rimar
y S
choo
l
Sto
ry W
ood
Sch
ool a
nd
Chi
ldre
n's
Cen
tre
Mar
lbor
ough
Jun
ior
Sch
ool
Fam
ily G
rou
p 9
Ave
rag
e
Bir
min
gh
am A
vera
ge
CHARACTERISTICS OF SCHOOLS AND THEIR PUPILS*
School Type LA A LA A A LA A A LA LA LA LA -
School Designation CS AC CS AC AS VA AC AC VA CS CS CS -
Number of full time pupils 421 206 208 415 415 408 413 207 204 405 207 366 3875 110244
Boys as a percentage of full time pupils 52 47 55 56 50 52 47 53 53 50 47 52 51 51
Girls as a percentage of full time pupils 48 53 45 44 50 48 53 47 47 50 53 48 49 49
Prior Attainment Decile 2 3 3 3 4 4 4 4 4 4 4 4 -
Contextual Decile 7 8 7 5 5 5 6 7 6 6 6 5 -
White British 3 75 60 50 51 0 74 79 20 67 54 0 41 32
Irish 0 0 0 0 0 0 0 0 5 0 1 0 0 0
Traveller of Irish Heritage 0 0 0 1 0 0 0 0 0 0 0 0 0 0
White Other 2 3 2 2 2 10 0 1 13 2 3 2 3 4
Gypsy / Roma 0 0 0 0 0 2 0 0 0 0 0 0 0 1
White and Black Caribbean 1 11 5 5 10 0 7 7 12 7 7 0 5 3
White and Black African 0 2 0 1 0 0 0 0 3 1 0 0 1 1
White and Asian 3 0 0 2 0 1 2 0 1 3 2 0 1 2
Any Other Mixed Background 2 1 4 4 5 2 3 3 4 4 1 1 3 3
Indian 2 0 2 1 2 8 0 1 3 0 2 0 2 5
Pakistani 75 1 3 5 4 60 2 2 0 0 7 69 24 25
Bangladeshi 4 0 0 1 2 2 1 0 0 1 1 10 2 5
Any Other Asian Background 2 0 2 4 1 1 0 0 0 0 1 2 1 1
Black Caribbean 1 7 6 3 10 2 2 3 11 6 8 0 4 4
Black African 2 1 7 4 3 3 5 2 18 2 9 9 5 7
Any Other Black Background 0 1 1 1 2 0 1 1 3 1 0 0 1 1
Chinese 0 0 4 0 1 0 0 0 1 0 3 0 1 1
Any other ethnic group 2 0 3 16 6 7 1 1 4 3 2 5 5 5
Unclassified 1 0 2 0 1 2 1 1 2 3 0 1 1 1
IDACI rate for school 32.4 32.9 29.2 29.6 28.9 30.1 36.3 37.3 31.0 33.6 29.6 30.5 29.8
% of pupils defined as mobile 6 7 11 20 22 12 10 7 7 16 13 6 12 12
% of pupils known to be eligible for FSM 17 35 37 30 37 18 39 32 31 40 42 28 31 28
% of pupils that are disadvantaged 30 54 46 47 63 34 60 51 48 57 56 43 49 42
% of pupils with EAL 43 2 16 26 18 79 3 7 38 5 21 75 31 44
% of pupils on SEN Support 12 18 16 16 18 14 17 17 26 20 24 20 17 15
% of pupils with ECH Plan 0 0 2 0 1 1 1 0 0 2 2 0 1 3
Percentage authorised absence 3 4 3 3 3 3 2 2 4 3 2 4 3 3
Percentage unauthorised absence 1 1 2 1 2 1 2 3 1 2 1 1 1 1
CHARACTERISTICS OF YEAR 6 PUPILS
KS1 Prior attainment average points 14.5 14.7 14.8 14.9 14.9 15.0 15.0 15.0 15.1 15.1 15.1 15.1 14.9 15.3
% of children in year 6 in school for 2 years+ 93 97 90 78 77 98 88 97 96 86 86 95 90 93 #VALUE! #VALUE! #VALUE! #VALUE! #VALUE! #VALUE! #VALUE!
% of children in year 6 disadvantaged 40 66 52 59 60 53 68 57 63 68 64 51 57 49
*Children attending school at the time of January 2016 census within year groups reception to year 6
Asi
anB
lack
Oth
erF
AM
ILY
GR
OU
P 9
Per
cent
age
of a
ll pu
pils
Yea
r 1
to Y
ear
6
Whi
teM
ixed
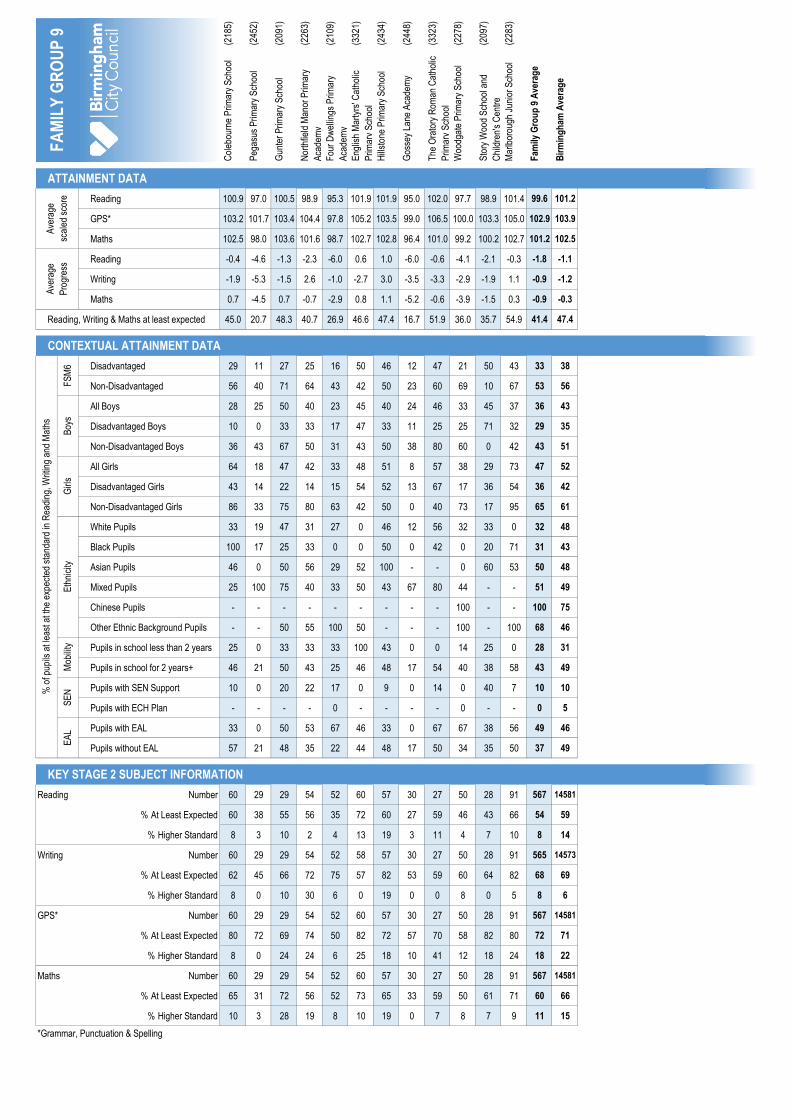
(218
5)
(245
2)
(209
1)
(226
3)
(210
9)
(332
1)
(243
4)
(244
8)
(332
3)
(227
8)
(209
7)
(228
3)
Col
ebou
rne
Prim
ary
Sch
ool
Peg
asus
Prim
ary
Sch
ool
Gun
ter
Prim
ary
Sch
ool
Nor
thfie
ld M
anor
Prim
ary
Aca
dem
y
Fou
r D
wel
lings
Prim
ary
Aca
dem
y
Eng
lish
Mar
tyrs
' Cat
holic
Prim
ary
Sch
ool
Hill
ston
e P
rimar
y S
choo
l
Gos
sey
Lane
Aca
dem
y
The
Ora
tory
Rom
an C
atho
lic
Prim
ary
Sch
ool
Woo
dgat
e P
rimar
y S
choo
l
Sto
ry W
ood
Sch
ool a
nd
Chi
ldre
n's
Cen
tre
Mar
lbor
ough
Jun
ior
Sch
ool
Fam
ily G
rou
p 9
Ave
rag
e
Bir
min
gh
am A
vera
ge
ATTAINMENT DATA
Reading 100.9 97.0 100.5 98.9 95.3 101.9 101.9 95.0 102.0 97.7 98.9 101.4 99.6 101.2
GPS* 103.2 101.7 103.4 104.4 97.8 105.2 103.5 99.0 106.5 100.0 103.3 105.0 102.9 103.9
Maths 102.5 98.0 103.6 101.6 98.7 102.7 102.8 96.4 101.0 99.2 100.2 102.7 101.2 102.5
Reading -0.4 -4.6 -1.3 -2.3 -6.0 0.6 1.0 -6.0 -0.6 -4.1 -2.1 -0.3 -1.8 -1.1
Writing -1.9 -5.3 -1.5 2.6 -1.0 -2.7 3.0 -3.5 -3.3 -2.9 -1.9 1.1 -0.9 -1.2
Maths 0.7 -4.5 0.7 -0.7 -2.9 0.8 1.1 -5.2 -0.6 -3.9 -1.5 0.3 -0.9 -0.3
Reading, Writing & Maths at least expected 45.0 20.7 48.3 40.7 26.9 46.6 47.4 16.7 51.9 36.0 35.7 54.9 41.4 47.4
CONTEXTUAL ATTAINMENT DATA
Disadvantaged 29 11 27 25 16 50 46 12 47 21 50 43 33 38
Non-Disadvantaged 56 40 71 64 43 42 50 23 60 69 10 67 53 56
All Boys 28 25 50 40 23 45 40 24 46 33 45 37 36 43
Disadvantaged Boys 10 0 33 33 17 47 33 11 25 25 71 32 29 35
Non-Disadvantaged Boys 36 43 67 50 31 43 50 38 80 60 0 42 43 51
All Girls 64 18 47 42 33 48 51 8 57 38 29 73 47 52
Disadvantaged Girls 43 14 22 14 15 54 52 13 67 17 36 54 36 42
Non-Disadvantaged Girls 86 33 75 80 63 42 50 0 40 73 17 95 65 61
White Pupils 33 19 47 31 27 0 46 12 56 32 33 0 32 48
Black Pupils 100 17 25 33 0 0 50 0 42 0 20 71 31 43
Asian Pupils 46 0 50 56 29 52 100 - - 0 60 53 50 48
Mixed Pupils 25 100 75 40 33 50 43 67 80 44 - - 51 49
Chinese Pupils - - - - - - - - - 100 - - 100 75
Other Ethnic Background Pupils - - 50 55 100 50 - - - 100 - 100 68 46
Pupils in school less than 2 years 25 0 33 33 33 100 43 0 0 14 25 0 28 31
Pupils in school for 2 years+ 46 21 50 43 25 46 48 17 54 40 38 58 43 49
Pupils with SEN Support 10 0 20 22 17 0 9 0 14 0 40 7 10 10
Pupils with ECH Plan - - - - 0 - - - - 0 - - 0 5
Pupils with EAL 33 0 50 53 67 46 33 0 67 67 38 56 49 46
Pupils without EAL 57 21 48 35 22 44 48 17 50 34 35 50 37 49
KEY STAGE 2 SUBJECT INFORMATION
Reading Number 60 29 29 54 52 60 57 30 27 50 28 91 567 14581
% At Least Expected 60 38 55 56 35 72 60 27 59 46 43 66 54 59
% Higher Standard 8 3 10 2 4 13 19 3 11 4 7 10 8 14
Writing Number 60 29 29 54 52 58 57 30 27 50 28 91 565 14573
% At Least Expected 62 45 66 72 75 57 82 53 59 60 64 82 68 69
% Higher Standard 8 0 10 30 6 0 19 0 0 8 0 5 8 6
GPS* Number 60 29 29 54 52 60 57 30 27 50 28 91 567 14581
% At Least Expected 80 72 69 74 50 82 72 57 70 58 82 80 72 71
% Higher Standard 8 0 24 24 6 25 18 10 41 12 18 24 18 22
Maths Number 60 29 29 54 52 60 57 30 27 50 28 91 567 14581
% At Least Expected 65 31 72 56 52 73 65 33 59 50 61 71 60 66
% Higher Standard 10 3 28 19 8 10 19 0 7 8 7 9 11 15
*Grammar, Punctuation & Spelling
EA
L
Ave
rage
scal
ed s
core
Ave
rage
Pro
gres
sF
SM
6B
oys
Girl
sE
thni
city
% o
f pup
ils a
t lea
st a
t the
exp
ecte
d st
anda
rd in
Rea
ding
, Writ
ing
and
Mat
hs
Mob
ility
SE
NF
AM
ILY
GR
OU
P 9
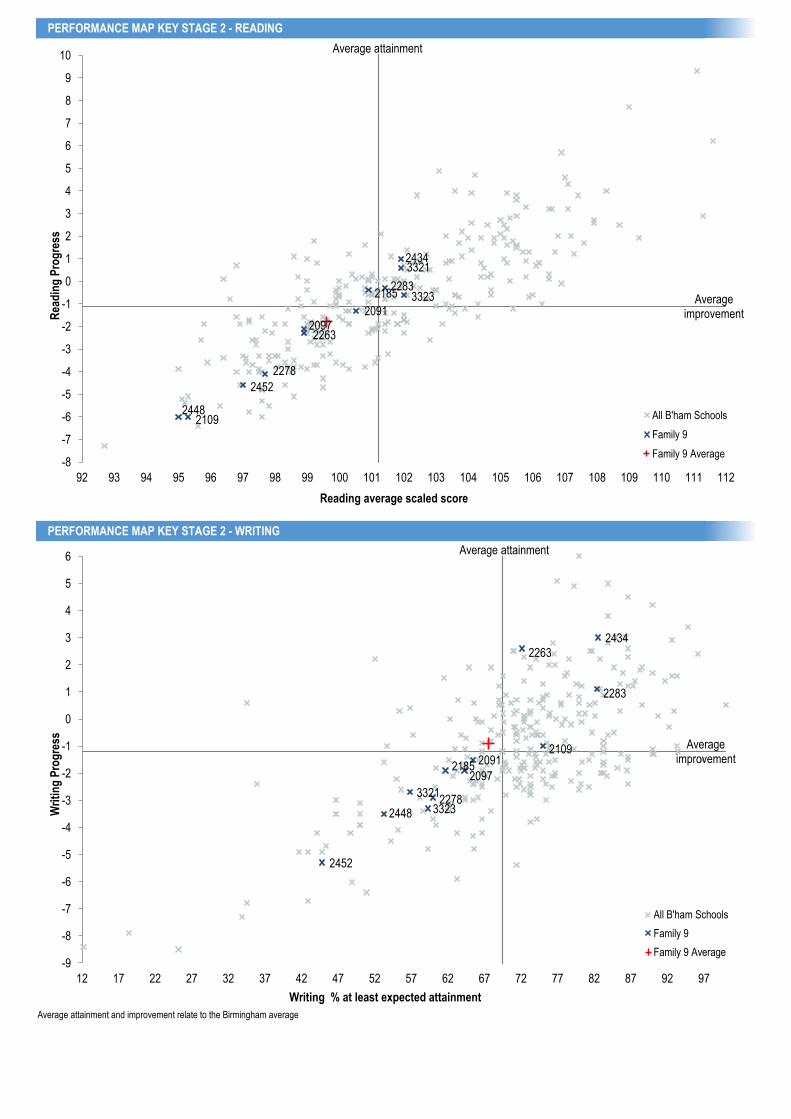
PERFORMANCE MAP KEY STAGE 2 - READING
PERFORMANCE MAP KEY STAGE 2 - WRITING
Average attainment and improvement relate to the Birmingham average
2185
2452
2091
2263
2109
3321 2434
2448
3323
2278
2097
2283
-8
-7
-6
-5
-4
-3
-2
-1
0
1
2
3
4
5
6
7
8
9
10
92 93 94 95 96 97 98 99 100 101 102 103 104 105 106 107 108 109 110 111 112
Rea
din
g P
rog
ress
Reading average scaled score
All B'ham Schools
Family 9
Family 9 Average
2185
2452
2091
2263
2109
3321
2434
2448 3323 2278
2097
2283
-9
-8
-7
-6
-5
-4
-3
-2
-1
0
1
2
3
4
5
6
12 17 22 27 32 37 42 47 52 57 62 67 72 77 82 87 92 97
Wri
tin
g P
rog
ress
Writing % at least expected attainment
All B'ham Schools
Family 9
Family 9 Average
Average attainment
Average improvement
Average attainment
Average improvement
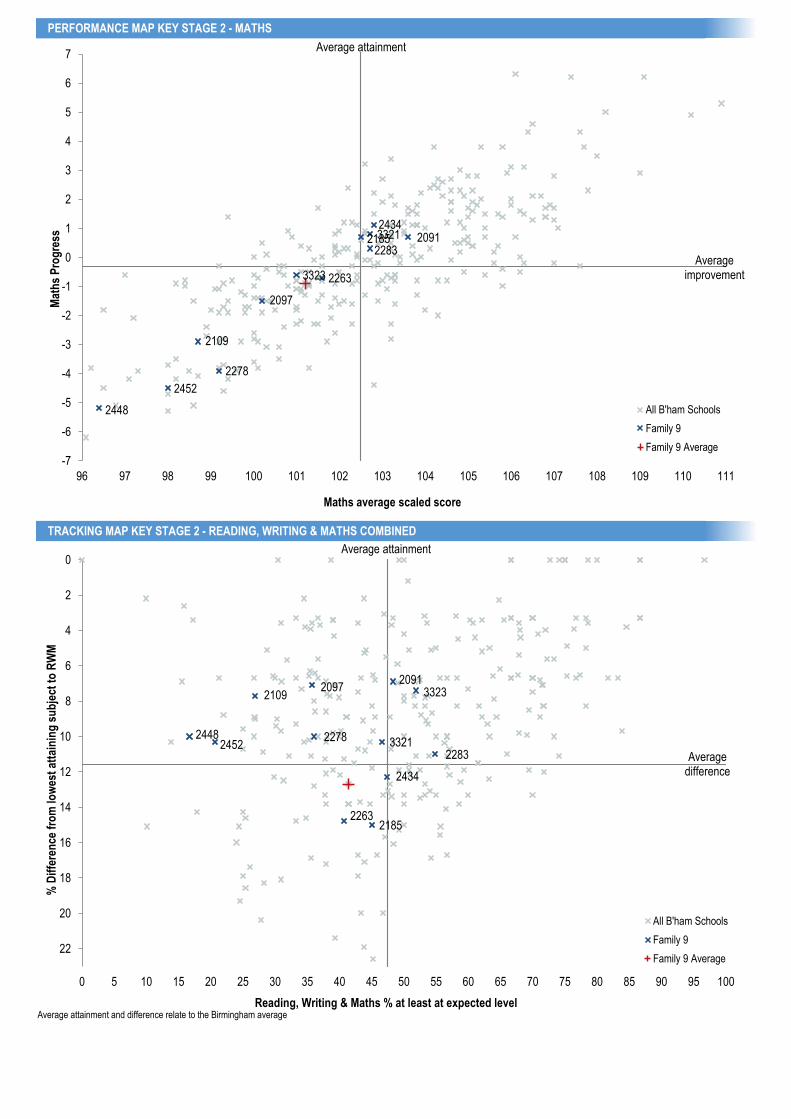
PERFORMANCE MAP KEY STAGE 2 - MATHS
TRACKING MAP KEY STAGE 2 - READING, WRITING & MATHS COMBINED
Average attainment and difference relate to the Birmingham average
2185
2452
2091
2263
2109
3321 2434
2448
3323
2278
2097
2283
-7
-6
-5
-4
-3
-2
-1
0
1
2
3
4
5
6
7
96 97 98 99 100 101 102 103 104 105 106 107 108 109 110 111
Mat
hs
Pro
gre
ss
Maths average scaled score
All B'ham Schools
Family 9
Family 9 Average
2185
2452
2091
2263
2109
3321
2434
2448
3323
2278
2097
2283
0
2
4
6
8
10
12
14
16
18
20
22
0 5 10 15 20 25 30 35 40 45 50 55 60 65 70 75 80 85 90 95 100
% D
iffe
ren
ce f
rom
low
est
atta
inin
g s
ub
ject
to
RW
M
Reading, Writing & Maths % at least at expected level
All B'ham Schools
Family 9
Family 9 Average
Average difference
Average attainment
Average improvement
Average attainment
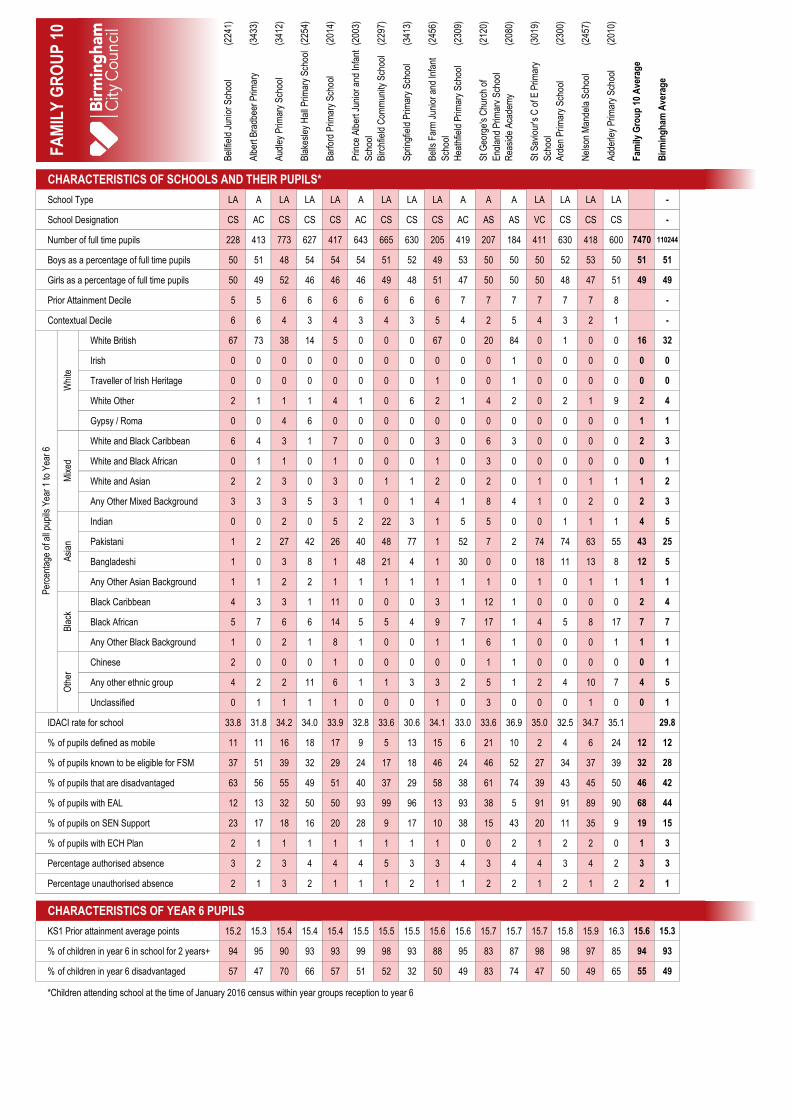
(224
1)
(343
3)
(341
2)
(225
4)
(201
4)
(200
3)
(229
7)
(341
3)
(245
6)
(230
9)
(212
0)
(208
0)
(301
9)
(230
0)
(245
7)
(201
0)
Bel
lfiel
d Ju
nior
Sch
ool
Alb
ert B
radb
eer
Prim
ary
Aud
ley
Prim
ary
Sch
ool
Bla
kesl
ey H
all P
rimar
y S
choo
l
Bar
ford
Prim
ary
Sch
ool
Prin
ce A
lber
t Jun
ior
and
Infa
nt
Sch
ool
Birc
hfie
ld C
omm
unity
Sch
ool
Spr
ingf
ield
Prim
ary
Sch
ool
Bel
ls F
arm
Jun
ior
and
Infa
nt
Sch
ool
Hea
thfie
ld P
rimar
y S
choo
l
St G
eorg
e's
Chu
rch
of
Eng
land
Prim
ary
Sch
ool
Rea
side
Aca
dem
y
St S
avio
ur's
C o
f E P
rimar
y
Sch
ool
Ard
en P
rimar
y S
choo
l
Nel
son
Man
dela
Sch
ool
Add
erle
y P
rimar
y S
choo
l
Fam
ily G
rou
p 1
0 A
vera
ge
Bir
min
gh
am A
vera
ge
CHARACTERISTICS OF SCHOOLS AND THEIR PUPILS*
School Type LA A LA LA LA A LA LA LA A A A LA LA LA LA -
School Designation CS AC CS CS CS AC CS CS CS AC AS AS VC CS CS CS -
Number of full time pupils 228 413 773 627 417 643 665 630 205 419 207 184 411 630 418 600 7470 110244
Boys as a percentage of full time pupils 50 51 48 54 54 54 51 52 49 53 50 50 50 52 53 50 51 51
Girls as a percentage of full time pupils 50 49 52 46 46 46 49 48 51 47 50 50 50 48 47 51 49 49
Prior Attainment Decile 5 5 6 6 6 6 6 6 6 7 7 7 7 7 7 8 -
Contextual Decile 6 6 4 3 4 3 4 3 5 4 2 5 4 3 2 1 -
White British 67 73 38 14 5 0 0 0 67 0 20 84 0 1 0 0 16 32
Irish 0 0 0 0 0 0 0 0 0 0 0 1 0 0 0 0 0 0
Traveller of Irish Heritage 0 0 0 0 0 0 0 0 1 0 0 1 0 0 0 0 0 0
White Other 2 1 1 1 4 1 0 6 2 1 4 2 0 2 1 9 2 4
Gypsy / Roma 0 0 4 6 0 0 0 0 0 0 0 0 0 0 0 0 1 1
White and Black Caribbean 6 4 3 1 7 0 0 0 3 0 6 3 0 0 0 0 2 3
White and Black African 0 1 1 0 1 0 0 0 1 0 3 0 0 0 0 0 0 1
White and Asian 2 2 3 0 3 0 1 1 2 0 2 0 1 0 1 1 1 2
Any Other Mixed Background 3 3 3 5 3 1 0 1 4 1 8 4 1 0 2 0 2 3
Indian 0 0 2 0 5 2 22 3 1 5 5 0 0 1 1 1 4 5
Pakistani 1 2 27 42 26 40 48 77 1 52 7 2 74 74 63 55 43 25
Bangladeshi 1 0 3 8 1 48 21 4 1 30 0 0 18 11 13 8 12 5
Any Other Asian Background 1 1 2 2 1 1 1 1 1 1 1 0 1 0 1 1 1 1
Black Caribbean 4 3 3 1 11 0 0 0 3 1 12 1 0 0 0 0 2 4
Black African 5 7 6 6 14 5 5 4 9 7 17 1 4 5 8 17 7 7
Any Other Black Background 1 0 2 1 8 1 0 0 1 1 6 1 0 0 0 1 1 1
Chinese 2 0 0 0 1 0 0 0 0 0 1 1 0 0 0 0 0 1
Any other ethnic group 4 2 2 11 6 1 1 3 3 2 5 1 2 4 10 7 4 5
Unclassified 0 1 1 1 1 0 0 0 1 0 3 0 0 0 1 0 0 1
IDACI rate for school 33.8 31.8 34.2 34.0 33.9 32.8 33.6 30.6 34.1 33.0 33.6 36.9 35.0 32.5 34.7 35.1 29.8
% of pupils defined as mobile 11 11 16 18 17 9 5 13 15 6 21 10 2 4 6 24 12 12
% of pupils known to be eligible for FSM 37 51 39 32 29 24 17 18 46 24 46 52 27 34 37 39 32 28
% of pupils that are disadvantaged 63 56 55 49 51 40 37 29 58 38 61 74 39 43 45 50 46 42
% of pupils with EAL 12 13 32 50 50 93 99 96 13 93 38 5 91 91 89 90 68 44
% of pupils on SEN Support 23 17 18 16 20 28 9 17 10 38 15 43 20 11 35 9 19 15
% of pupils with ECH Plan 2 1 1 1 1 1 1 1 1 0 0 2 1 2 2 0 1 3
Percentage authorised absence 3 2 3 4 4 4 5 3 3 4 3 4 4 3 4 2 3 3
Percentage unauthorised absence 2 1 3 2 1 1 1 2 1 1 2 2 1 2 1 2 2 1
CHARACTERISTICS OF YEAR 6 PUPILS
KS1 Prior attainment average points 15.2 15.3 15.4 15.4 15.4 15.5 15.5 15.5 15.6 15.6 15.7 15.7 15.7 15.8 15.9 16.3 15.6 15.3
% of children in year 6 in school for 2 years+ 94 95 90 93 93 99 98 93 88 95 83 87 98 98 97 85 94 93 #VALUE! #VALUE! #VALUE!
% of children in year 6 disadvantaged 57 47 70 66 57 51 52 32 50 49 83 74 47 50 49 65 55 49
*Children attending school at the time of January 2016 census within year groups reception to year 6
FA
MIL
Y G
RO
UP
10
Per
cent
age
of a
ll pu
pils
Yea
r 1
to Y
ear
6
Whi
teM
ixed
Asi
anB
lack
Oth
er

(224
1)
(343
3)
(341
2)
(225
4)
(201
4)
(200
3)
(229
7)
(341
3)
(245
6)
(230
9)
(212
0)
(208
0)
(301
9)
(230
0)
(245
7)
(201
0)
Bel
lfiel
d Ju
nior
Sch
ool
Alb
ert B
radb
eer
Prim
ary
Aud
ley
Prim
ary
Sch
ool
Bla
kesl
ey H
all P
rimar
y S
choo
l
Bar
ford
Prim
ary
Sch
ool
Prin
ce A
lber
t Jun
ior
and
Infa
nt
Sch
ool
Birc
hfie
ld C
omm
unity
Sch
ool
Spr
ingf
ield
Prim
ary
Sch
ool
Bel
ls F
arm
Jun
ior
and
Infa
nt
Sch
ool
Hea
thfie
ld P
rimar
y S
choo
l
St G
eorg
e's
Chu
rch
of
Eng
land
Prim
ary
Sch
ool
Rea
side
Aca
dem
y
St S
avio
ur's
C o
f E P
rimar
y
Sch
ool
Ard
en P
rimar
y S
choo
l
Nel
son
Man
dela
Sch
ool
Add
erle
y P
rimar
y S
choo
l
Fam
ily G
rou
p 1
0 A
vera
ge
Bir
min
gh
am A
vera
ge
ATTAINMENT DATA
Reading 102.1 102.0 98.6 97.8 99.4 98.4 101.7 96.9 103.7 98.1 103.8 103.6 102.7 99.0 107.0 - 100.3 101.2
GPS* 102.1 105.5 102.7 101.3 103.6 103.3 104.1 101.0 105.7 104.5 102.6 102.8 104.6 103.8 106.6 - 103.4 103.9
Maths 103.7 102.6 101.6 100.0 102.4 101.5 103.2 102.5 104.8 103.6 101.6 101.9 103.8 102.8 106.0 - 102.6 102.5
Reading 0.5 0.0 -3.5 -5.5 -2.3 -3.0 -0.7 -4.6 1.7 -3.8 2.2 -0.6 0.5 -3.9 4.6 0.0 -1.9 -1.1
Writing -0.6 -1.7 -0.9 -9.2 -1.9 1.7 0.3 -2.9 0.4 -0.1 0.9 -1.8 -7.3 -2.5 0.0 0.1 -1.8 -1.2
Maths 1.1 0.8 -1.3 -3.6 0.0 -0.7 0.7 0.6 2.3 0.7 -0.3 -2.6 1.1 -0.3 3.1 0.0 -0.1 -0.3
Reading, Writing & Maths at least expected 51.0 49.2 36.7 22.0 53.7 38.0 53.3 35.2 75.0 49.2 57.1 54.3 28.8 41.1 71.2 0.0 40.7 47.4
CONTEXTUAL ATTAINMENT DATA
Disadvantaged 46 29 37 17 42 36 45 31 75 53 61 53 32 33 62 0 36 38
Non-Disadvantaged 57 68 37 32 70 40 63 37 75 45 40 58 26 49 80 0 47 56
All Boys 42 42 30 19 61 35 44 29 73 47 45 57 19 38 71 0 37 43
Disadvantaged Boys 27 29 28 13 53 33 45 21 80 47 56 56 25 30 59 0 33 35
Non-Disadvantaged Boys 53 53 33 30 67 36 44 33 70 46 0 57 13 44 86 0 42 51
All Girls 61 57 45 26 43 42 62 40 78 52 65 52 43 45 71 0 45 52
Disadvantaged Girls 59 29 45 21 31 39 44 40 71 64 64 50 50 36 67 0 39 42
Non-Disadvantaged Girls 67 86 44 36 80 45 74 40 100 44 67 60 40 55 75 0 51 61
White Pupils 46 49 43 14 0 0 - 33 73 0 22 56 - 0 - 0 42 48
Black Pupils 80 50 29 40 53 0 38 40 100 100 57 - - 50 50 0 42 43
Asian Pupils 100 100 38 28 71 39 55 33 100 47 75 0 29 41 73 0 40 48
Mixed Pupils 67 0 0 0 17 0 67 - 33 100 100 50 - 0 100 0 37 49
Chinese Pupils - - - - - - - - - - - - - - - - - 75
Other Ethnic Background Pupils 40 50 0 0 50 100 0 100 100 100 0 - - 67 60 0 42 46
Pupils in school less than 2 years 67 0 22 0 25 0 100 33 67 0 60 50 0 50 50 0 28 31
Pupils in school for 2 years+ 50 52 38 24 56 38 52 35 76 52 57 55 29 41 72 0 42 49
Pupils with SEN Support 22 13 0 0 30 9 13 0 0 25 20 38 0 0 46 0 17 10
Pupils with ECH Plan 0 - 0 0 0 - 0 0 - - - 0 - 0 0 - 0 5
Pupils with EAL 60 73 33 29 54 38 53 36 80 48 67 50 30 43 70 0 40 46
Pupils without EAL 50 44 39 16 52 33 - 0 74 100 53 55 0 17 83 0 43 49
KEY STAGE 2 SUBJECT INFORMATION
Reading Number 49 59 90 91 54 92 90 91 24 61 28 46 59 90 59 88 1071 14581
% At Least Expected 63 66 47 38 63 46 61 42 79 49 75 76 76 50 78 0 52 59
% Higher Standard 14 17 6 5 7 9 16 1 21 2 25 9 10 4 41 0 10 14
Writing Number 49 59 90 91 54 92 90 91 24 61 28 46 59 90 59 87 1070 14573
% At Least Expected 73 64 76 31 70 86 86 58 75 80 79 74 34 67 78 91 70 69
% Higher Standard 2 3 3 0 0 9 4 2 13 2 7 2 0 0 3 5 3 6
GPS* Number 49 59 90 91 54 92 90 91 24 61 28 46 59 90 59 88 1071 14581
% At Least Expected 59 80 68 55 78 73 74 58 92 82 68 63 81 73 86 0 65 71
% Higher Standard 16 37 16 13 20 22 28 12 17 21 18 11 22 19 36 0 19 22
Maths Number 49 59 90 91 54 92 90 91 24 61 28 46 59 90 59 88 1071 14581
% At Least Expected 80 75 61 46 69 67 70 73 83 79 68 63 80 73 90 0 64 66
% Higher Standard 14 12 10 3 11 10 19 11 17 8 14 4 19 11 25 0 11 15
*Grammar, Punctuation & Spelling
FA
MIL
Y G
RO
UP
10
Mob
ility
SE
NE
AL
Ave
rage
scal
ed s
core
Ave
rage
Pro
gres
sF
SM
6B
oys
Girl
sE
thni
city
% o
f pup
ils a
t lea
st a
t the
exp
ecte
d st
anda
rd in
Rea
ding
, Writ
ing
and
Mat
hs
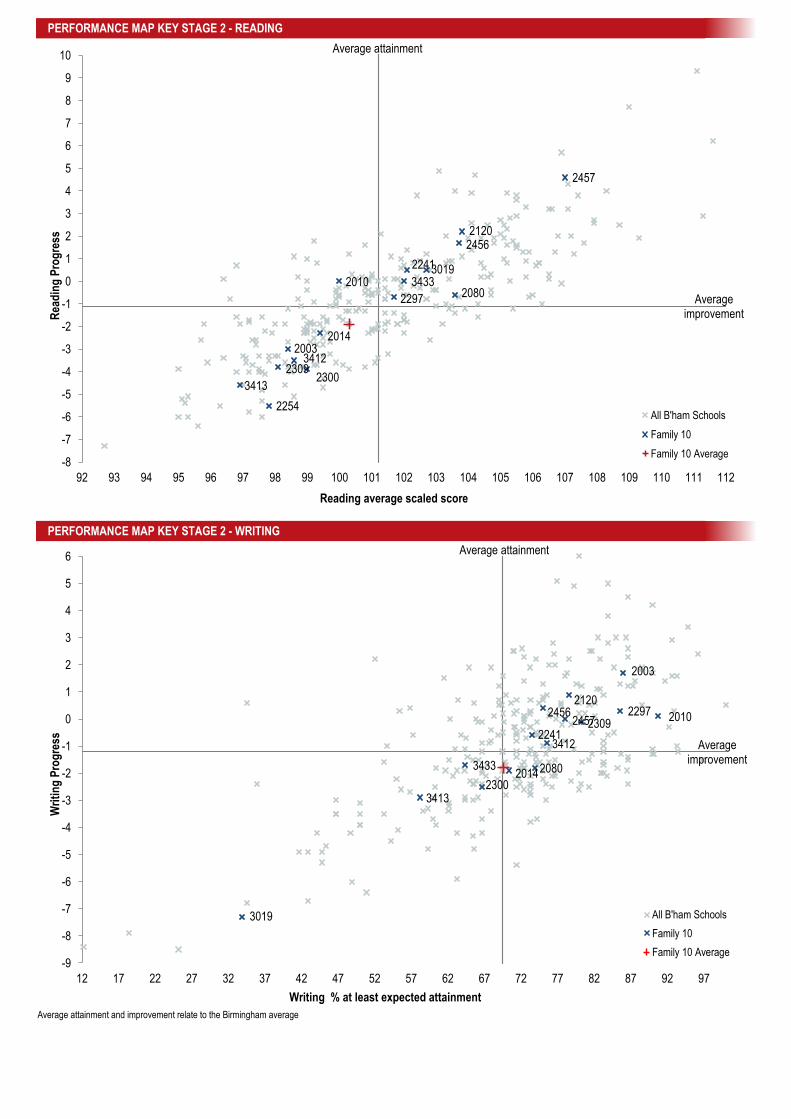
PERFORMANCE MAP KEY STAGE 2 - READING
PERFORMANCE MAP KEY STAGE 2 - WRITING
Average attainment and improvement relate to the Birmingham average
2241
3433
3412
2254
2014 2003
2297
3413
2456
2309
2120
2080
3019
2300
2457
2010
-8
-7
-6
-5
-4
-3
-2
-1
0
1
2
3
4
5
6
7
8
9
10
92 93 94 95 96 97 98 99 100 101 102 103 104 105 106 107 108 109 110 111 112
Rea
din
g P
rog
ress
Reading average scaled score
All B'ham Schools
Family 10
Family 10 Average
2241
3433
3412
2014
2003
2297
3413
2456 2309
2120
2080
3019
2300
2457 2010
-9
-8
-7
-6
-5
-4
-3
-2
-1
0
1
2
3
4
5
6
12 17 22 27 32 37 42 47 52 57 62 67 72 77 82 87 92 97
Wri
tin
g P
rog
ress
Writing % at least expected attainment
All B'ham Schools
Family 10
Family 10 Average
Average attainment
Average improvement
Average attainment
Average improvement
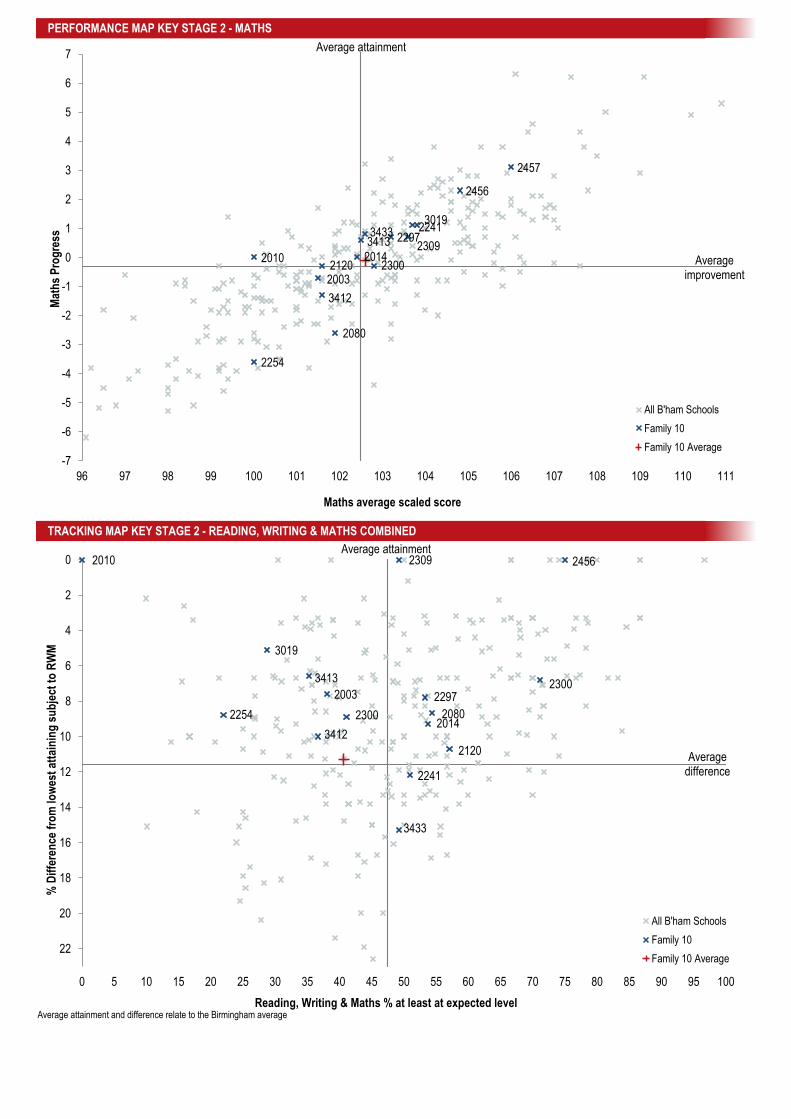
PERFORMANCE MAP KEY STAGE 2 - MATHS
TRACKING MAP KEY STAGE 2 - READING, WRITING & MATHS COMBINED
Average attainment and difference relate to the Birmingham average
2241 3433
3412
2254
2014
2003
2297 3413
2456
2309
2120
2080
3019
2300
2457
2010
-7
-6
-5
-4
-3
-2
-1
0
1
2
3
4
5
6
7
96 97 98 99 100 101 102 103 104 105 106 107 108 109 110 111
Mat
hs
Pro
gre
ss
Maths average scaled score
All B'ham Schools
Family 10
Family 10 Average
2241
3433
3412
2254 2014
2003 2297
3413
2456 2309
2120
2080
3019
2300
2300
2010 0
2
4
6
8
10
12
14
16
18
20
22
0 5 10 15 20 25 30 35 40 45 50 55 60 65 70 75 80 85 90 95 100
% D
iffe
ren
ce f
rom
low
est
atta
inin
g s
ub
ject
to
RW
M
Reading, Writing & Maths % at least at expected level
All B'ham Schools
Family 10
Family 10 Average
Average difference
Average attainment
Average improvement
Average attainment

(200
4)
(202
6)
(216
0)
(230
6)
(211
5)
(215
0)
(201
9)
(332
0)
(332
9)
(243
8)
(231
0)
(343
0)
(338
6)
(206
5)
(215
4)
Map
lede
ne P
rimar
y S
choo
l
Ban
ners
Gat
e P
rimar
y S
choo
l
Red
nal H
ill J
unio
r S
choo
l
Wat
er M
ill P
rimar
y S
choo
l
Kin
gsla
nd P
rimar
y S
choo
l
(NC
)
Par
k H
ill P
rimar
y S
choo
l
Wes
t Hea
th P
rimar
y S
choo
l
Cor
pus
Chr
isti
Cat
holic
Prim
ary
Sch
ool
St A
ugus
tine'
s C
atho
lic
Prim
ary
Sch
ool
Hig
hter
s H
eath
Com
mun
ity
Sch
ool
Fai
rway
Prim
ary
Sch
ool
Hod
ge H
ill P
rimar
y S
choo
l
St C
uthb
ert's
RC
Jun
ior
and
Infa
nt (
NC
) S
choo
l
Dor
ringt
on A
cade
my
St C
olum
ba's
Cat
holic
Prim
ary
Sch
ool
Fam
ily G
rou
p 1
1 A
vera
ge
Bir
min
gh
am A
vera
ge
CHARACTERISTICS OF SCHOOLS AND THEIR PUPILS*
School Type LA LA LA LA LA LA LA LA LA LA A LA LA A A -
School Designation CS CS CS CS CS CS CS VA VA CS AC CS VA AC AS -
Number of full time pupils 319 358 316 203 288 568 404 407 204 208 205 769 210 629 203 5291 110244
Boys as a percentage of full time pupils 49 56 47 53 53 54 51 53 54 52 44 50 50 52 46 51 51
Girls as a percentage of full time pupils 51 44 53 47 47 46 49 47 46 48 56 50 50 48 54 49 49
Prior Attainment Decile 2 3 3 4 4 5 5 5 5 5 5 5 6 6 6 -
Contextual Decile 8 8 7 5 7 5 6 7 6 7 8 5 7 5 7 -
White British 74 68 80 24 67 6 78 37 9 58 79 2 49 6 58 39 32
Irish 0 0 0 1 0 0 0 0 0 0 1 0 1 0 1 0 0
Traveller of Irish Heritage 0 0 0 0 0 0 0 0 0 0 0 0 0 0 1 0 0
White Other 2 3 1 5 2 2 2 5 41 0 2 3 7 2 2 4 4
Gypsy / Roma 0 0 0 0 1 0 0 0 0 0 0 3 0 0 0 1 1
White and Black Caribbean 3 4 5 6 5 4 5 4 2 3 4 1 9 5 11 4 3
White and Black African 0 0 1 0 0 0 1 0 1 1 1 0 0 1 3 1 1
White and Asian 3 2 2 1 0 1 2 3 2 5 0 3 2 4 1 2 2
Any Other Mixed Background 1 4 1 5 2 4 1 2 6 1 3 2 2 3 3 3 3
Indian 2 2 0 6 0 3 1 3 6 0 1 1 1 13 3 3 5
Pakistani 7 3 0 8 3 50 1 15 0 13 0 68 12 35 0 23 25
Bangladeshi 0 0 0 1 0 2 0 0 0 2 0 7 1 10 0 2 5
Any Other Asian Background 0 1 0 2 1 2 0 1 1 2 1 0 1 1 1 1 1
Black Caribbean 1 4 3 4 4 6 1 4 10 3 5 0 2 8 5 4 4
Black African 4 2 3 6 6 4 3 8 6 3 3 3 2 5 5 4 7
Any Other Black Background 0 1 1 2 2 1 3 1 2 0 1 0 1 2 5 1 1
Chinese 1 1 1 6 2 1 0 1 1 2 0 0 0 0 1 1 1
Any other ethnic group 1 2 1 17 2 11 0 5 14 7 1 4 11 4 1 5 5
Unclassified 0 3 0 8 3 5 0 10 1 0 0 1 1 1 1 2 1
IDACI rate for school 28.3 24.7 31.4 27.5 28.9 31.6 33.4 33.5 30.9 29.4 31.3 33.1 34.4 28.1 33.5 29.8
% of pupils defined as mobile 10 15 10 26 16 16 15 8 12 6 6 12 3 14 4 12 12
% of pupils known to be eligible for FSM 20 34 32 17 36 23 37 24 16 42 41 14 24 25 37 26 28
% of pupils that are disadvantaged 36 43 56 29 54 43 52 42 26 60 45 30 37 40 47 42 42
% of pupils with EAL 12 6 6 48 9 45 5 21 60 19 2 77 34 71 11 35 44
% of pupils on SEN Support 18 16 21 17 22 19 18 13 7 18 21 12 15 10 16 16 15
% of pupils with ECH Plan 1 1 0 2 0 2 1 1 1 1 2 1 2 0 1 1 3
Percentage authorised absence 3 4 3 4 4 4 3 2 4 3 4 3 3 4 2 3 3
Percentage unauthorised absence 2 1 1 2 1 1 1 2 1 1 1 3 0 2 1 2 1
CHARACTERISTICS OF YEAR 6 PUPILS
KS1 Prior attainment average points 14.5 15.1 14.9 15.0 15.1 15.1 15.2 15.2 15.2 15.2 15.3 15.3 15.4 15.4 15.4 15.2 15.3
% of children in year 6 in school for 2 years+ 98 79 90 69 93 95 85 92 96 100 96 98 97 94 100 92 93 #VALUE! #VALUE! #VALUE! #VALUE!
% of children in year 6 disadvantaged 48 54 62 59 60 52 66 44 38 77 57 36 43 48 50 52 49
*Children attending school at the time of January 2016 census within year groups reception to year 6
FA
MIL
Y G
RO
UP
11
Per
cent
age
of a
ll pu
pils
Yea
r 1
to Y
ear
6
Whi
teM
ixed
Asi
anB
lack
Oth
er

(200
4)
(202
6)
(216
0)
(230
6)
(211
5)
(215
0)
(201
9)
(332
0)
(332
9)
(243
8)
(231
0)
(343
0)
(338
6)
(206
5)
(215
4)
Map
lede
ne P
rimar
y S
choo
l
Ban
ners
Gat
e P
rimar
y S
choo
l
Red
nal H
ill J
unio
r S
choo
l
Wat
er M
ill P
rimar
y S
choo
l
Kin
gsla
nd P
rimar
y S
choo
l
(NC
)
Par
k H
ill P
rimar
y S
choo
l
Wes
t Hea
th P
rimar
y S
choo
l
Cor
pus
Chr
isti
Cat
holic
Prim
ary
Sch
ool
St A
ugus
tine'
s C
atho
lic
Prim
ary
Sch
ool
Hig
hter
s H
eath
Com
mun
ity
Sch
ool
Fai
rway
Prim
ary
Sch
ool
Hod
ge H
ill P
rimar
y S
choo
l
St C
uthb
ert's
RC
Jun
ior
and
Infa
nt (
NC
) S
choo
l
Dor
ringt
on A
cade
my
St C
olum
ba's
Cat
holic
Prim
ary
Sch
ool
Fam
ily G
rou
p 1
1 A
vera
ge
Bir
min
gh
am A
vera
ge
ATTAINMENT DATA
Reading 100.4 101.4 99.2 100.3 105.5 100.6 97.2 100.0 100.3 98.1 100.1 99.2 102.5 98.6 101.2 100.0 101.2
GPS* 102.1 101.3 99.5 102.4 103.1 105.7 99.5 104.0 101.7 99.7 101.8 102.0 103.6 106.7 104.2 102.7 103.9
Maths 100.1 102.0 97.1 98.6 104.6 102.9 100.0 101.6 104.4 96.8 101.3 99.2 103.5 102.9 103.8 101.0 102.5
Reading 0.3 0.1 -1.9 -0.9 3.6 -1.2 -5.8 -0.7 -1.9 -3.3 -1.7 -2.5 0.9 -3.8 -0.5 -1.6 -1.1
Writing 0.4 -4.9 -4.2 -3.4 0.8 -0.3 -1.8 1.9 1.9 -3.9 -0.5 -3.5 -1.1 0.6 -0.8 -1.4 -1.2
Maths -0.7 0.2 -4.2 -5.1 2.7 0.5 -2.8 0.0 2.6 -5.1 -0.9 -2.9 1.2 -0.2 1.8 -1.1 -0.3
Reading, Writing & Maths at least expected 45.5 35.4 35.5 37.9 71.1 50.8 30.2 50.8 53.8 26.7 39.3 32.2 60.0 43.8 53.3 43.2 47.4
CONTEXTUAL ATTAINMENT DATA
Disadvantaged 29 27 30 29 63 43 14 42 50 35 50 31 46 33 53 36 38
Non-Disadvantaged 61 45 45 50 83 59 61 58 56 0 25 33 71 54 53 51 56
All Boys 52 39 27 47 72 50 41 37 60 27 31 34 50 33 41 41 43
Disadvantaged Boys 30 33 26 33 69 44 25 46 67 40 43 38 33 18 44 37 35
Non-Disadvantaged Boys 73 45 29 63 78 58 67 29 57 0 22 32 63 50 38 47 51
All Girls 39 32 41 25 70 52 14 63 50 27 50 30 69 53 69 45 52
Disadvantaged Girls 27 21 33 25 55 42 0 38 43 31 56 25 57 48 67 35 42
Non-Disadvantaged Girls 50 45 50 25 89 59 50 79 56 0 33 33 78 58 71 55 61
White Pupils 47 32 33 27 71 40 33 50 75 32 39 0 46 14 42 41 48
Black Pupils 0 75 75 60 100 50 0 40 17 0 50 0 100 38 60 44 43
Asian Pupils 50 67 0 50 100 46 - 25 33 17 0 33 71 51 50 42 48
Mixed Pupils 43 29 50 25 50 67 100 71 75 50 50 50 50 29 100 51 49
Chinese Pupils - - 100 - - - - 100 - - - - - 100 - 100 75
Other Ethnic Background Pupils - 0 0 33 100 100 - 83 60 0 - - 100 0 - 61 46
Pupils in school less than 2 years 0 40 29 44 67 33 25 0 0 - 0 0 100 0 - 29 31
Pupils in school for 2 years+ 47 34 36 35 71 52 31 56 56 27 41 33 59 46 53 44 49
Pupils with SEN Support 11 25 0 0 20 8 0 0 0 0 17 8 17 0 0 6 10
Pupils with ECH Plan - 0 0 0 - - 50 - - 0 - 0 - - 0 11 5
Pupils with EAL 67 0 40 50 75 47 0 44 60 25 - 34 82 46 67 45 46
Pupils without EAL 44 36 35 35 71 56 31 53 45 27 39 24 50 37 52 42 49
KEY STAGE 2 SUBJECT INFORMATION
Reading Number 44 48 76 29 45 59 53 59 26 30 28 90 30 89 30 736 14581
% At Least Expected 64 58 55 52 82 63 40 56 62 40 61 53 80 46 67 57 59
% Higher Standard 14 13 8 17 18 12 4 10 12 10 0 10 10 8 13 10 14
Writing Number 44 48 76 29 45 59 53 59 26 30 28 90 30 89 30 736 14573
% At Least Expected 57 42 49 62 80 71 60 85 88 50 71 47 73 78 83 65 69
% Higher Standard 16 0 4 10 0 10 9 7 8 0 7 2 0 10 3 6 6
GPS* Number 44 48 76 29 45 59 53 59 26 30 28 90 30 89 30 736 14581
% At Least Expected 61 63 54 62 71 86 53 76 65 57 68 68 67 75 83 68 71
% Higher Standard 18 15 11 14 13 32 8 22 19 7 7 13 13 38 23 18 22
Maths Number 44 48 76 29 45 59 53 59 26 30 28 90 30 89 30 736 14581
% At Least Expected 52 73 39 48 87 69 58 64 69 37 61 43 83 65 73 60 66
% Higher Standard 7 13 8 14 9 19 6 17 31 3 4 14 7 21 20 13 15
*Grammar, Punctuation & Spelling
FA
MIL
Y G
RO
UP
11
Mob
ility
SE
NE
AL
Ave
rage
scal
ed s
core
Ave
rage
Pro
gres
sF
SM
6B
oys
Girl
sE
thni
city
% o
f pup
ils a
t lea
st a
t the
exp
ecte
d st
anda
rd in
Rea
ding
, Writ
ing
and
Mat
hs
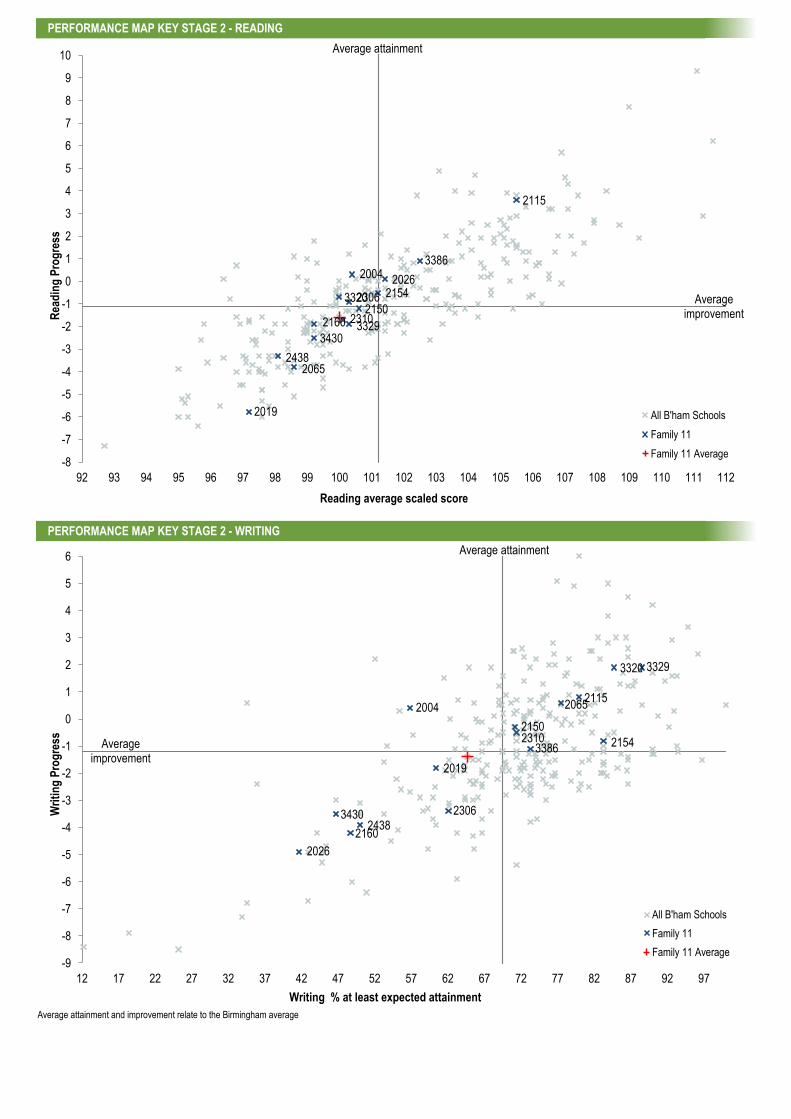
PERFORMANCE MAP KEY STAGE 2 - READING
PERFORMANCE MAP KEY STAGE 2 - WRITING
Average attainment and improvement relate to the Birmingham average
2004 2026
2160
2306
2115
2150
2019
3320
3329
2438
2310
3430
3386
2065
2154
-8
-7
-6
-5
-4
-3
-2
-1
0
1
2
3
4
5
6
7
8
9
10
92 93 94 95 96 97 98 99 100 101 102 103 104 105 106 107 108 109 110 111 112
Rea
din
g P
rog
ress
Reading average scaled score
All B'ham Schools
Family 11
Family 11 Average
2004
2026
2160
2306
2115
2150
2019
3320 3329
2438
2310
3430
3386
2065
2154
-9
-8
-7
-6
-5
-4
-3
-2
-1
0
1
2
3
4
5
6
12 17 22 27 32 37 42 47 52 57 62 67 72 77 82 87 92 97
Wri
tin
g P
rog
ress
Writing % at least expected attainment
All B'ham Schools
Family 11
Family 11 Average
Average attainment
Average improvement
Average attainment
Average improvement
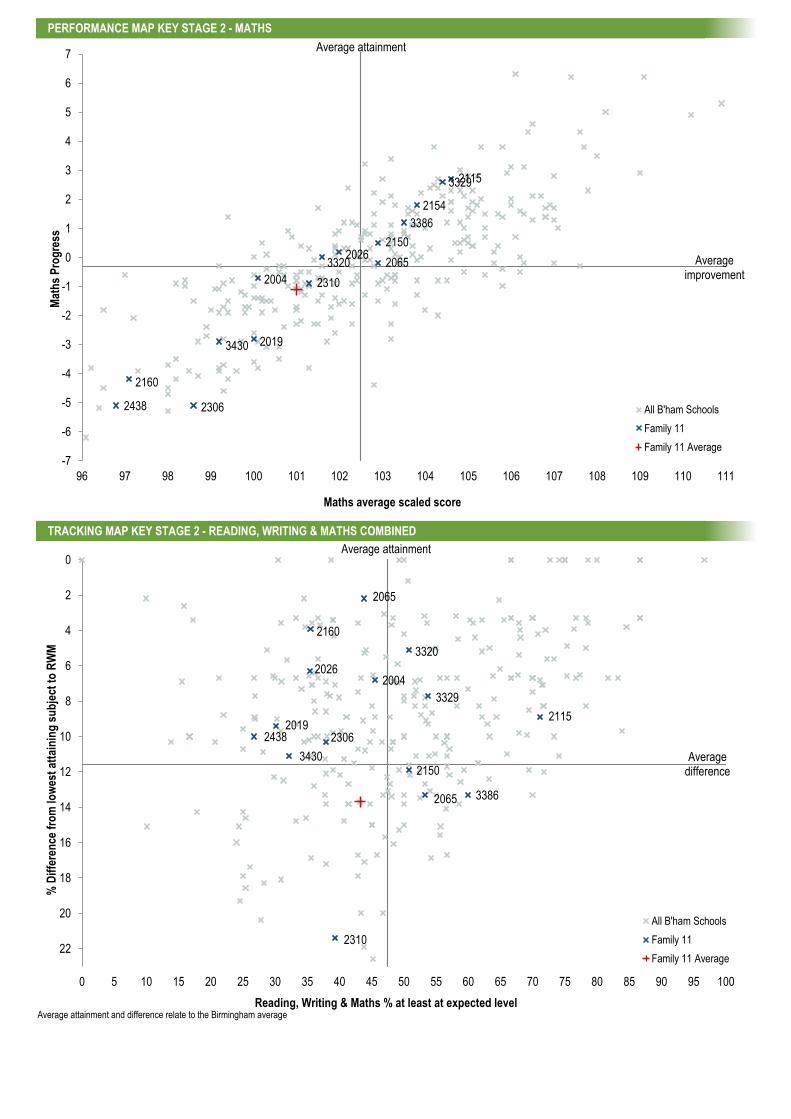
PERFORMANCE MAP KEY STAGE 2 - MATHS
TRACKING MAP KEY STAGE 2 - READING, WRITING & MATHS COMBINED
Average attainment and difference relate to the Birmingham average
2004
2026
2160
2306
2115
2150
2019
3320
3329
2438
2310
3430
3386
2065
2154
-7
-6
-5
-4
-3
-2
-1
0
1
2
3
4
5
6
7
96 97 98 99 100 101 102 103 104 105 106 107 108 109 110 111
Mat
hs
Pro
gre
ss
Maths average scaled score
All B'ham Schools
Family 11
Family 11 Average
2004 2026
2160
2306
2115
2150
2019
3320
3329
2438
2310
3430
3386
2065
2065
0
2
4
6
8
10
12
14
16
18
20
22
0 5 10 15 20 25 30 35 40 45 50 55 60 65 70 75 80 85 90 95 100
% D
iffe
ren
ce f
rom
low
est
atta
inin
g s
ub
ject
to
RW
M
Reading, Writing & Maths % at least at expected level
All B'ham Schools
Family 11
Family 11 Average
Average difference
Average attainment
Average improvement
Average attainment
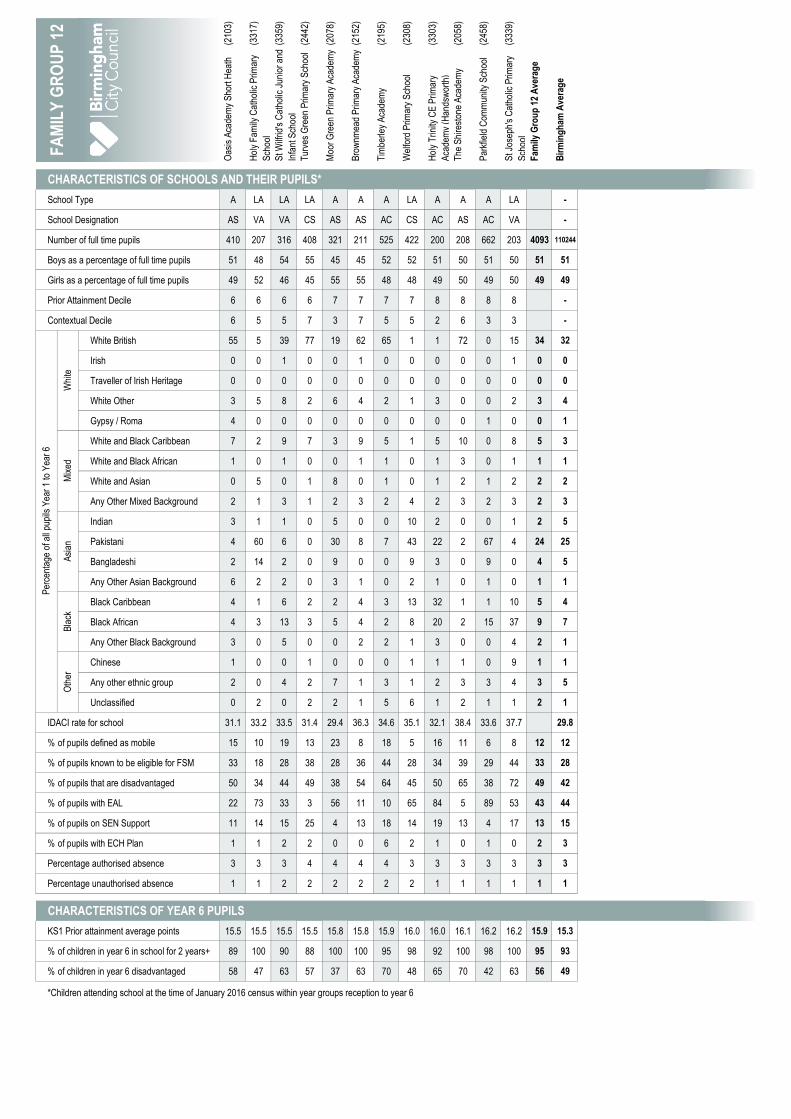
(210
3)
(331
7)
(335
9)
(244
2)
(207
8)
(215
2)
(219
5)
(230
8)
(330
3)
(205
8)
(245
8)
(333
9)
Oas
is A
cade
my
Sho
rt H
eath
Hol
y F
amily
Cat
holic
Prim
ary
Sch
ool
St W
ilfrid
's C
atho
lic J
unio
r an
d
Infa
nt S
choo
l
Tur
ves
Gre
en P
rimar
y S
choo
l
Moo
r G
reen
Prim
ary
Aca
dem
y
Bro
wnm
ead
Prim
ary
Aca
dem
y
Tim
berle
y A
cade
my
Wel
ford
Prim
ary
Sch
ool
Hol
y T
rinity
CE
Prim
ary
Aca
dem
y (H
ands
wor
th)
The
Shi
rest
one
Aca
dem
y
Par
kfie
ld C
omm
unity
Sch
ool
St J
osep
h's
Cat
holic
Prim
ary
Sch
ool
Fam
ily G
rou
p 1
2 A
vera
ge
Bir
min
gh
am A
vera
ge
CHARACTERISTICS OF SCHOOLS AND THEIR PUPILS*
School Type A LA LA LA A A A LA A A A LA -
School Designation AS VA VA CS AS AS AC CS AC AS AC VA -
Number of full time pupils 410 207 316 408 321 211 525 422 200 208 662 203 4093 110244
Boys as a percentage of full time pupils 51 48 54 55 45 45 52 52 51 50 51 50 51 51
Girls as a percentage of full time pupils 49 52 46 45 55 55 48 48 49 50 49 50 49 49
Prior Attainment Decile 6 6 6 6 7 7 7 7 8 8 8 8 -
Contextual Decile 6 5 5 7 3 7 5 5 2 6 3 3 -
White British 55 5 39 77 19 62 65 1 1 72 0 15 34 32
Irish 0 0 1 0 0 1 0 0 0 0 0 1 0 0
Traveller of Irish Heritage 0 0 0 0 0 0 0 0 0 0 0 0 0 0
White Other 3 5 8 2 6 4 2 1 3 0 0 2 3 4
Gypsy / Roma 4 0 0 0 0 0 0 0 0 0 1 0 0 1
White and Black Caribbean 7 2 9 7 3 9 5 1 5 10 0 8 5 3
White and Black African 1 0 1 0 0 1 1 0 1 3 0 1 1 1
White and Asian 0 5 0 1 8 0 1 0 1 2 1 2 2 2
Any Other Mixed Background 2 1 3 1 2 3 2 4 2 3 2 3 2 3
Indian 3 1 1 0 5 0 0 10 2 0 0 1 2 5
Pakistani 4 60 6 0 30 8 7 43 22 2 67 4 24 25
Bangladeshi 2 14 2 0 9 0 0 9 3 0 9 0 4 5
Any Other Asian Background 6 2 2 0 3 1 0 2 1 0 1 0 1 1
Black Caribbean 4 1 6 2 2 4 3 13 32 1 1 10 5 4
Black African 4 3 13 3 5 4 2 8 20 2 15 37 9 7
Any Other Black Background 3 0 5 0 0 2 2 1 3 0 0 4 2 1
Chinese 1 0 0 1 0 0 0 1 1 1 0 9 1 1
Any other ethnic group 2 0 4 2 7 1 3 1 2 3 3 4 3 5
Unclassified 0 2 0 2 2 1 5 6 1 2 1 1 2 1
IDACI rate for school 31.1 33.2 33.5 31.4 29.4 36.3 34.6 35.1 32.1 38.4 33.6 37.7 29.8
% of pupils defined as mobile 15 10 19 13 23 8 18 5 16 11 6 8 12 12
% of pupils known to be eligible for FSM 33 18 28 38 28 36 44 28 34 39 29 44 33 28
% of pupils that are disadvantaged 50 34 44 49 38 54 64 45 50 65 38 72 49 42
% of pupils with EAL 22 73 33 3 56 11 10 65 84 5 89 53 43 44
% of pupils on SEN Support 11 14 15 25 4 13 18 14 19 13 4 17 13 15
% of pupils with ECH Plan 1 1 2 2 0 0 6 2 1 0 1 0 2 3
Percentage authorised absence 3 3 3 4 4 4 4 3 3 3 3 3 3 3
Percentage unauthorised absence 1 1 2 2 2 2 2 2 1 1 1 1 1 1
CHARACTERISTICS OF YEAR 6 PUPILS
KS1 Prior attainment average points 15.5 15.5 15.5 15.5 15.8 15.8 15.9 16.0 16.0 16.1 16.2 16.2 15.9 15.3
% of children in year 6 in school for 2 years+ 89 100 90 88 100 100 95 98 92 100 98 100 95 93 #VALUE! #VALUE! #VALUE! #VALUE! #VALUE! #VALUE! #VALUE!
% of children in year 6 disadvantaged 58 47 63 57 37 63 70 48 65 70 42 63 56 49
*Children attending school at the time of January 2016 census within year groups reception to year 6
FA
MIL
Y G
RO
UP
12
Per
cent
age
of a
ll pu
pils
Yea
r 1
to Y
ear
6
Whi
teM
ixed
Asi
anB
lack
Oth
er

(210
3)
(331
7)
(335
9)
(244
2)
(207
8)
(215
2)
(219
5)
(230
8)
(330
3)
(205
8)
(245
8)
(333
9)
Oas
is A
cade
my
Sho
rt H
eath
Hol
y F
amily
Cat
holic
Prim
ary
Sch
ool
St W
ilfrid
's C
atho
lic J
unio
r an
d
Infa
nt S
choo
l
Tur
ves
Gre
en P
rimar
y S
choo
l
Moo
r G
reen
Prim
ary
Aca
dem
y
Bro
wnm
ead
Prim
ary
Aca
dem
y
Tim
berle
y A
cade
my
Wel
ford
Prim
ary
Sch
ool
Hol
y T
rinity
CE
Prim
ary
Aca
dem
y (H
ands
wor
th)
The
Shi
rest
one
Aca
dem
y
Par
kfie
ld C
omm
unity
Sch
ool
St J
osep
h's
Cat
holic
Prim
ary
Sch
ool
Fam
ily G
rou
p 1
2 A
vera
ge
Bir
min
gh
am A
vera
ge
ATTAINMENT DATA
Reading 102.0 99.5 102.1 99.5 103.4 101.4 97.6 100.3 99.7 104.1 101.8 107.4 101.1 101.2
GPS* 107.6 102.5 102.6 106.4 106.9 102.0 101.3 103.9 103.7 105.2 104.6 109.6 104.5 103.9
Maths 106.0 102.4 102.3 102.7 107.0 103.2 101.0 101.3 100.0 106.3 102.6 107.7 103.2 102.5
Reading -1.5 -2.5 -0.6 -2.8 -1.2 -0.8 -5.3 -3.9 -2.7 1.4 -1.9 3.8 -2.1 -1.1
Writing 1.2 -1.7 -1.9 0.2 1.6 -2.4 -2.2 -1.7 -4.3 1.2 -1.6 -1.0 -1.1 -1.2
Maths 1.8 -0.6 -0.9 -0.1 1.7 0.5 -2.3 -3.8 -2.6 -0.2 -1.3 3.8 -0.7 -0.3
Reading, Writing & Maths at least expected 60.0 43.3 56.7 42.9 66.7 43.8 28.1 45.2 50.0 70.0 56.5 70.8 50.8 47.4
CONTEXTUAL ATTAINMENT DATA
Disadvantaged 53 43 47 31 50 50 24 37 47 76 46 67 45 38
Non-Disadvantaged 70 44 73 58 76 33 37 53 56 56 64 78 59 56
All Boys 59 44 33 23 50 38 35 41 33 74 51 60 46 43
Disadvantaged Boys 53 44 30 20 33 43 27 31 22 91 45 57 42 35
Non-Disadvantaged Boys 67 43 40 27 57 33 42 50 67 50 56 67 50 51
All Girls 61 43 80 60 76 50 24 48 64 64 63 79 56 52
Disadvantaged Girls 53 40 67 41 57 54 24 41 75 60 47 75 47 42
Non-Disadvantaged Girls 75 44 100 85 90 33 29 56 50 100 73 83 68 61
White Pupils 53 25 64 47 78 47 22 - 50 65 - 67 47 48
Black Pupils 57 0 44 0 75 0 25 47 40 100 33 85 47 43
Asian Pupils 60 47 50 0 55 80 100 46 71 - 58 50 56 48
Mixed Pupils 100 60 75 50 0 20 25 20 50 75 100 100 54 49
Chinese Pupils - - - - - - - 100 - 100 - 0 50 75
Other Ethnic Background Pupils 100 - 0 0 100 - 0 - - 100 - - 38 46
Pupils in school less than 2 years 33 - 33 0 - - 33 0 0 - 50 - 21 31
Pupils in school for 2 years+ 63 43 59 49 67 44 28 46 54 70 57 71 52 49
Pupils with SEN Support 67 0 0 0 0 0 13 0 0 33 33 20 14 10
Pupils with ECH Plan 100 0 0 - - - 33 100 - - 60 - 50 5
Pupils with EAL 40 42 44 0 62 80 63 50 57 100 55 54 53 46
Pupils without EAL 64 45 62 45 71 37 23 38 20 67 71 91 49 49
KEY STAGE 2 SUBJECT INFORMATION
Reading Number 55 30 30 56 27 32 64 62 26 30 92 24 528 14581
% At Least Expected 67 50 67 54 67 69 39 55 58 80 72 96 62 59
% Higher Standard 9 10 17 7 19 6 6 11 19 30 7 33 12 14
Writing Number 55 30 30 56 27 32 64 62 26 30 92 24 528 14573
% At Least Expected 87 70 67 73 93 66 69 74 65 87 80 75 76 69
% Higher Standard 5 0 0 9 22 0 2 15 4 13 2 8 6 6
GPS* Number 55 30 30 56 27 32 64 62 26 30 92 24 528 14581
% At Least Expected 85 67 73 80 85 72 59 74 81 83 83 96 77 71
% Higher Standard 24 17 7 29 30 6 9 21 19 27 21 42 20 22
Maths Number 55 30 30 56 27 32 64 62 26 30 92 24 528 14581
% At Least Expected 85 60 73 71 93 75 52 56 62 77 71 96 70 66
% Higher Standard 25 17 17 9 26 16 9 10 12 30 7 33 15 15
*Grammar, Punctuation & Spelling
FA
MIL
Y G
RO
UP
12
Mob
ility
SE
NE
AL
Ave
rage
scal
ed s
core
Ave
rage
Pro
gres
sF
SM
6B
oys
Girl
sE
thni
city
% o
f pup
ils a
t lea
st a
t the
exp
ecte
d st
anda
rd in
Rea
ding
, Writ
ing
and
Mat
hs

PERFORMANCE MAP KEY STAGE 2 - READING
PERFORMANCE MAP KEY STAGE 2 - WRITING
Average attainment and improvement relate to the Birmingham average
2103
3317
3359
2442
2078
2152
2195
2308
3303
2058
2458
3339
-8
-7
-6
-5
-4
-3
-2
-1
0
1
2
3
4
5
6
7
8
9
10
92 93 94 95 96 97 98 99 100 101 102 103 104 105 106 107 108 109 110 111 112
Rea
din
g P
rog
ress
Reading average scaled score
All B'ham Schools
Family 12
Family 12 Average
2103
3317 3359
2442
2078
2152 2195
2308
3303
2058
2458
3339
-9
-8
-7
-6
-5
-4
-3
-2
-1
0
1
2
3
4
5
6
12 17 22 27 32 37 42 47 52 57 62 67 72 77 82 87 92 97
Wri
tin
g P
rog
ress
Writing % at least expected attainment
All B'ham Schools
Family 12
Family 12 Average
Average attainment
Average improvement
Average attainment
Average improvement
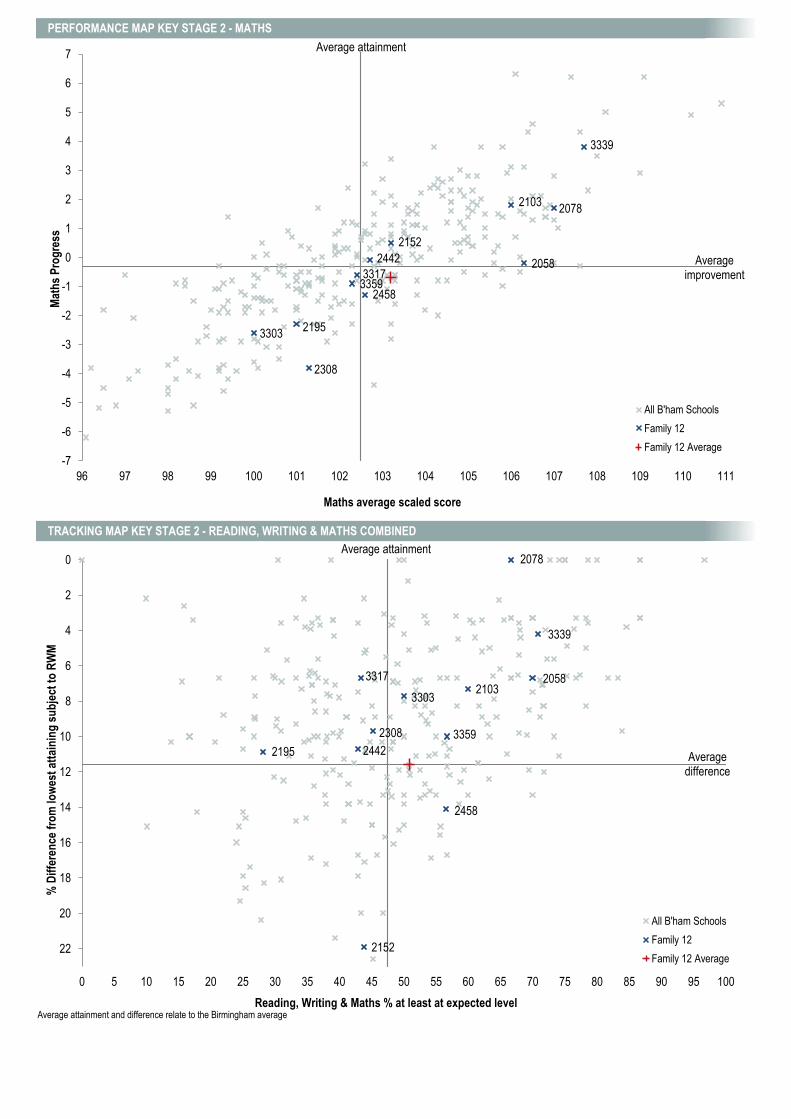
PERFORMANCE MAP KEY STAGE 2 - MATHS
TRACKING MAP KEY STAGE 2 - READING, WRITING & MATHS COMBINED
Average attainment and difference relate to the Birmingham average
2103
3317 3359
2442
2078
2152
2195
2308
3303
2058
2458
3339
-7
-6
-5
-4
-3
-2
-1
0
1
2
3
4
5
6
7
96 97 98 99 100 101 102 103 104 105 106 107 108 109 110 111
Mat
hs
Pro
gre
ss
Maths average scaled score
All B'ham Schools
Family 12
Family 12 Average
2103 3317
3359
2442
2078
2152
2195
2308
3303
2058
2458
3339
0
2
4
6
8
10
12
14
16
18
20
22
0 5 10 15 20 25 30 35 40 45 50 55 60 65 70 75 80 85 90 95 100
% D
iffe
ren
ce f
rom
low
est
atta
inin
g s
ub
ject
to
RW
M
Reading, Writing & Maths % at least at expected level
All B'ham Schools
Family 12
Family 12 Average
Average difference
Average attainment
Average improvement
Average attainment

(228
8)
(219
0)
(332
2)
(224
6)
(228
9)
(218
8)
(246
0)
(213
6)
(336
7)
(338
2)
(336
1)
(211
9)
(213
3)
(223
6)
(240
6)
(206
8)
(205
1)
(215
3)
Hol
lyw
ood
Prim
ary
Sch
ool
Sun
drid
ge P
rimar
y S
choo
l
Mar
yval
e C
atho
lic P
rimar
y
Sch
ool
The
Mea
dow
s P
rimar
y S
choo
l
Cof
ton
Prim
ary
Sch
ool
Stir
chle
y P
rimar
y S
choo
l
Rob
in H
ood
Aca
dem
y
Woo
dhou
se P
rimar
y A
cade
my
St G
erar
d's
RC
Jun
ior
and
Infa
nt S
choo
l
St M
artin
de
Por
res
Cat
holic
Prim
ary
Sch
ool
St M
arga
ret M
ary
RC
Jun
ior
and
Infa
nt S
choo
l
Lake
y La
ne J
unio
r an
d In
fant
Sch
ool
Mar
sh H
ill P
rimar
y S
choo
l
Bro
adm
eado
w J
unio
r S
choo
l
Min
wor
th J
unio
r an
d In
fant
Sch
ool
War
ren
Far
m P
rimar
y S
choo
l
Col
mer
s F
arm
Jun
ior
Sch
ool
Alle
ns C
roft
Prim
ary
Sch
ool
Fam
ily G
rou
p 1
3 A
vera
ge
Bir
min
gh
am A
vera
ge
CHARACTERISTICS OF SCHOOLS AND THEIR PUPILS*
School Type LA LA LA LA LA LA A A LA LA LA LA LA LA LA A LA LA -
School Designation CS CS VA CS FS CS AC AS VA VA VA CS CS CS CS AC CS CS -
Number of full time pupils 424 199 210 523 273 209 564 429 211 208 253 420 422 234 204 293 237 289 5602 110244
Boys as a percentage of full time pupils 52 52 50 55 56 48 52 52 48 61 45 50 50 53 55 48 47 49 51 51
Girls as a percentage of full time pupils 48 48 50 45 44 52 48 48 52 39 55 50 50 47 45 52 53 51 49 49
Prior Attainment Decile 4 4 4 4 4 5 5 5 5 6 6 6 7 7 7 7 7 7 -
Contextual Decile 9 8 9 8 9 7 8 7 8 7 8 6 7 7 7 7 8 6 -
White British 81 72 62 77 85 45 18 38 63 12 47 24 30 72 74 71 79 42 53 32
Irish 0 1 4 0 0 0 0 0 2 1 2 0 0 0 0 0 0 0 0 0
Traveller of Irish Heritage 0 0 1 0 0 0 0 0 0 0 0 0 0 0 0 0 0 0 0 0
White Other 1 4 7 2 1 6 2 3 5 5 9 2 4 2 3 2 2 2 3 4
Gypsy / Roma 0 0 1 0 0 0 0 0 0 0 0 0 1 0 0 0 0 0 0 1
White and Black Caribbean 7 9 3 6 3 5 1 6 10 7 2 3 6 5 3 6 2 6 5 3
White and Black African 1 2 2 0 1 1 0 2 1 1 0 0 1 0 2 2 0 0 1 1
White and Asian 1 2 0 2 0 2 4 2 1 3 1 2 2 2 0 0 0 1 1 2
Any Other Mixed Background 2 1 2 1 1 4 1 5 1 5 1 2 1 4 4 3 5 6 3 3
Indian 1 1 1 0 0 1 12 7 1 6 3 8 4 1 2 0 0 3 3 5
Pakistani 1 1 0 1 0 7 46 3 1 35 0 40 24 3 2 2 0 15 12 25
Bangladeshi 1 1 0 0 0 10 5 1 0 2 0 2 4 0 0 0 0 2 2 5
Any Other Asian Background 2 1 3 0 0 1 3 2 0 3 2 6 0 1 1 0 0 4 2 1
Black Caribbean 1 3 4 3 0 3 1 10 4 9 9 1 10 6 2 6 1 3 4 4
Black African 1 1 5 2 3 3 1 12 4 4 19 4 6 0 0 6 4 4 4 7
Any Other Black Background 0 0 2 0 0 1 1 1 1 3 3 1 3 1 1 2 3 1 1 1
Chinese 0 2 0 0 0 1 1 0 1 1 0 1 0 0 0 1 1 0 0 1
Any other ethnic group 1 0 2 1 2 7 4 7 4 1 2 4 2 2 3 1 0 8 3 5
Unclassified 0 1 3 3 2 3 1 1 2 3 0 1 2 0 2 0 2 2 1 1
IDACI rate for school 28.3 26.2 25.2 30.4 29.3 24.8 25.6 26.7 29.1 30.7 30.6 27.4 32.3 33.7 27.4 31.9 32.5 32.1 29.8
% of pupils defined as mobile 9 12 10 10 9 13 7 13 9 7 5 11 11 10 14 10 8 14 10 12
% of pupils known to be eligible for FSM 18 30 20 24 21 23 19 24 18 24 21 25 28 34 34 32 33 38 25 28
% of pupils that are disadvantaged 30 45 34 33 25 43 27 46 44 33 37 43 48 52 44 52 57 64 41 42
% of pupils with EAL 4 8 12 2 7 36 28 32 15 37 16 54 23 4 5 8 6 26 19 44
% of pupils on SEN Support 9 19 14 22 19 17 11 13 9 14 10 20 20 19 15 25 25 27 17 15
% of pupils with ECH Plan 4 1 0 5 0 0 1 3 1 1 2 1 1 0 2 0 1 3 2 3
Percentage authorised absence 3 4 3 4 3 2 4 3 3 3 2 3 2 3 4 3 3 2 3 3
Percentage unauthorised absence 1 2 1 1 1 2 1 1 1 1 1 1 1 1 1 1 2 1 1 1
CHARACTERISTICS OF YEAR 6 PUPILS
KS1 Prior attainment average points 14.9 15.0 15.1 15.1 15.1 15.3 15.3 15.3 15.4 15.4 15.5 15.5 15.6 15.7 15.8 15.8 15.8 15.9 15.4 15.3
% of children in year 6 in school for 2 years+ 95 79 90 93 94 86 95 92 97 93 100 91 84 79 88 100 93 93 91 93 #VALUE!
% of children in year 6 disadvantaged 42 58 40 37 28 36 33 48 55 47 52 40 60 54 77 53 59 75 49 49
*Children attending school at the time of January 2016 census within year groups reception to year 6
FA
MIL
Y G
RO
UP
13
Per
cent
age
of a
ll pu
pils
Yea
r 1
to Y
ear
6
Whi
teM
ixed
Asi
anB
lack
Oth
er
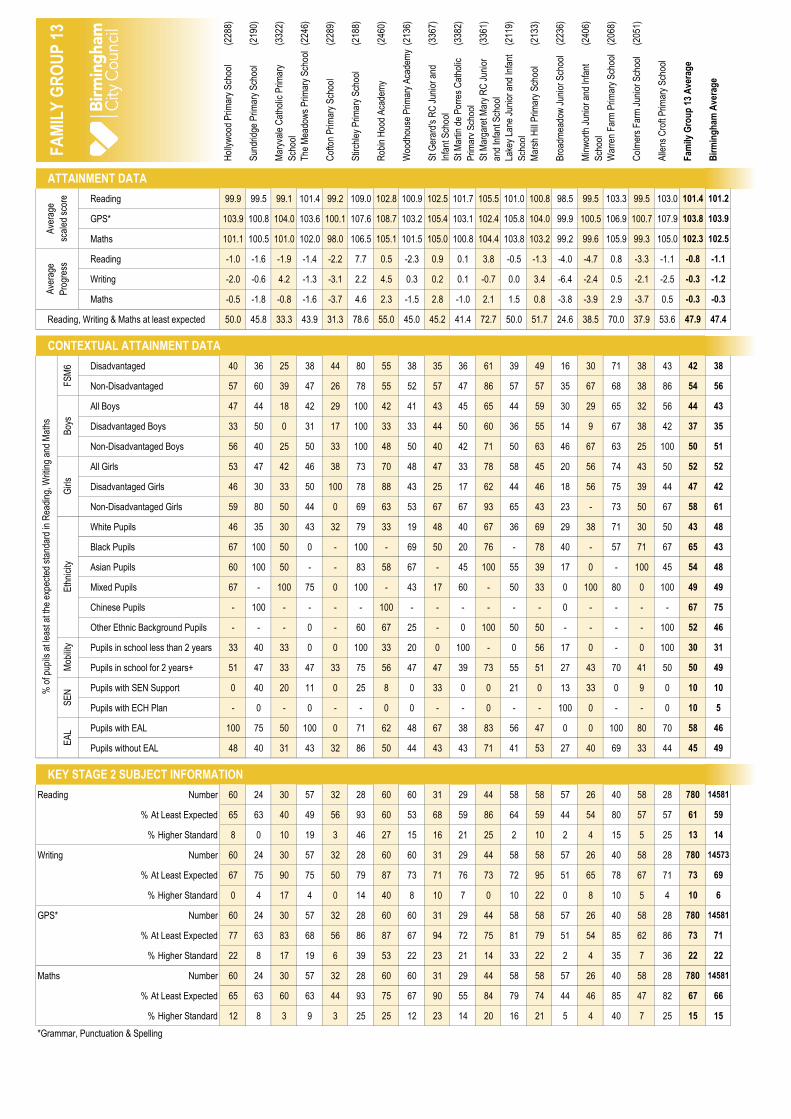
(228
8)
(219
0)
(332
2)
(224
6)
(228
9)
(218
8)
(246
0)
(213
6)
(336
7)
(338
2)
(336
1)
(211
9)
(213
3)
(223
6)
(240
6)
(206
8)
(205
1)
Hol
lyw
ood
Prim
ary
Sch
ool
Sun
drid
ge P
rimar
y S
choo
l
Mar
yval
e C
atho
lic P
rimar
y
Sch
ool
The
Mea
dow
s P
rimar
y S
choo
l
Cof
ton
Prim
ary
Sch
ool
Stir
chle
y P
rimar
y S
choo
l
Rob
in H
ood
Aca
dem
y
Woo
dhou
se P
rimar
y A
cade
my
St G
erar
d's
RC
Jun
ior
and
Infa
nt S
choo
l
St M
artin
de
Por
res
Cat
holic
Prim
ary
Sch
ool
St M
arga
ret M
ary
RC
Jun
ior
and
Infa
nt S
choo
l
Lake
y La
ne J
unio
r an
d In
fant
Sch
ool
Mar
sh H
ill P
rimar
y S
choo
l
Bro
adm
eado
w J
unio
r S
choo
l
Min
wor
th J
unio
r an
d In
fant
Sch
ool
War
ren
Far
m P
rimar
y S
choo
l
Col
mer
s F
arm
Jun
ior
Sch
ool
Alle
ns C
roft
Prim
ary
Sch
ool
Fam
ily G
rou
p 1
3 A
vera
ge
Bir
min
gh
am A
vera
ge
ATTAINMENT DATA
Reading 99.9 99.5 99.1 101.4 99.2 109.0 102.8 100.9 102.5 101.7 105.5 101.0 100.8 98.5 99.5 103.3 99.5 103.0 101.4 101.2
GPS* 103.9 100.8 104.0 103.6 100.1 107.6 108.7 103.2 105.4 103.1 102.4 105.8 104.0 99.9 100.5 106.9 100.7 107.9 103.8 103.9
Maths 101.1 100.5 101.0 102.0 98.0 106.5 105.1 101.5 105.0 100.8 104.4 103.8 103.2 99.2 99.6 105.9 99.3 105.0 102.3 102.5
Reading -1.0 -1.6 -1.9 -1.4 -2.2 7.7 0.5 -2.3 0.9 0.1 3.8 -0.5 -1.3 -4.0 -4.7 0.8 -3.3 -1.1 -0.8 -1.1
Writing -2.0 -0.6 4.2 -1.3 -3.1 2.2 4.5 0.3 0.2 0.1 -0.7 0.0 3.4 -6.4 -2.4 0.5 -2.1 -2.5 -0.3 -1.2
Maths -0.5 -1.8 -0.8 -1.6 -3.7 4.6 2.3 -1.5 2.8 -1.0 2.1 1.5 0.8 -3.8 -3.9 2.9 -3.7 0.5 -0.3 -0.3
Reading, Writing & Maths at least expected 50.0 45.8 33.3 43.9 31.3 78.6 55.0 45.0 45.2 41.4 72.7 50.0 51.7 24.6 38.5 70.0 37.9 53.6 47.9 47.4
CONTEXTUAL ATTAINMENT DATA
Disadvantaged 40 36 25 38 44 80 55 38 35 36 61 39 49 16 30 71 38 43 42 38
Non-Disadvantaged 57 60 39 47 26 78 55 52 57 47 86 57 57 35 67 68 38 86 54 56
All Boys 47 44 18 42 29 100 42 41 43 45 65 44 59 30 29 65 32 56 44 43
Disadvantaged Boys 33 50 0 31 17 100 33 33 44 50 60 36 55 14 9 67 38 42 37 35
Non-Disadvantaged Boys 56 40 25 50 33 100 48 50 40 42 71 50 63 46 67 63 25 100 50 51
All Girls 53 47 42 46 38 73 70 48 47 33 78 58 45 20 56 74 43 50 52 52
Disadvantaged Girls 46 30 33 50 100 78 88 43 25 17 62 44 46 18 56 75 39 44 47 42
Non-Disadvantaged Girls 59 80 50 44 0 69 63 53 67 67 93 65 43 23 - 73 50 67 58 61
White Pupils 46 35 30 43 32 79 33 19 48 40 67 36 69 29 38 71 30 50 43 48
Black Pupils 67 100 50 0 - 100 - 69 50 20 76 - 78 40 - 57 71 67 65 43
Asian Pupils 60 100 50 - - 83 58 67 - 45 100 55 39 17 0 - 100 45 54 48
Mixed Pupils 67 - 100 75 0 100 - 43 17 60 - 50 33 0 100 80 0 100 49 49
Chinese Pupils - 100 - - - - 100 - - - - - - 0 - - - - 67 75
Other Ethnic Background Pupils - - - 0 - 60 67 25 - 0 100 50 50 - - - - 100 52 46
Pupils in school less than 2 years 33 40 33 0 0 100 33 20 0 100 - 0 56 17 0 - 0 100 30 31
Pupils in school for 2 years+ 51 47 33 47 33 75 56 47 47 39 73 55 51 27 43 70 41 50 50 49
Pupils with SEN Support 0 40 20 11 0 25 8 0 33 0 0 21 0 13 33 0 9 0 10 10
Pupils with ECH Plan - 0 - 0 - - 0 0 - - 0 - - 100 0 - - 0 10 5
Pupils with EAL 100 75 50 100 0 71 62 48 67 38 83 56 47 0 0 100 80 70 58 46
Pupils without EAL 48 40 31 43 32 86 50 44 43 43 71 41 53 27 40 69 33 44 45 49
KEY STAGE 2 SUBJECT INFORMATION
Reading Number 60 24 30 57 32 28 60 60 31 29 44 58 58 57 26 40 58 28 780 14581
% At Least Expected 65 63 40 49 56 93 60 53 68 59 86 64 59 44 54 80 57 57 61 59
% Higher Standard 8 0 10 19 3 46 27 15 16 21 25 2 10 2 4 15 5 25 13 14
Writing Number 60 24 30 57 32 28 60 60 31 29 44 58 58 57 26 40 58 28 780 14573
% At Least Expected 67 75 90 75 50 79 87 73 71 76 73 72 95 51 65 78 67 71 73 69
% Higher Standard 0 4 17 4 0 14 40 8 10 7 0 10 22 0 8 10 5 4 10 6
GPS* Number 60 24 30 57 32 28 60 60 31 29 44 58 58 57 26 40 58 28 780 14581
% At Least Expected 77 63 83 68 56 86 87 67 94 72 75 81 79 51 54 85 62 86 73 71
% Higher Standard 22 8 17 19 6 39 53 22 23 21 14 33 22 2 4 35 7 36 22 22
Maths Number 60 24 30 57 32 28 60 60 31 29 44 58 58 57 26 40 58 28 780 14581
% At Least Expected 65 63 60 63 44 93 75 67 90 55 84 79 74 44 46 85 47 82 67 66
% Higher Standard 12 8 3 9 3 25 25 12 23 14 20 16 21 5 4 40 7 25 15 15
*Grammar, Punctuation & Spelling
FA
MIL
Y G
RO
UP
13
Mob
ility
SE
NE
AL
Ave
rage
scal
ed s
core
Ave
rage
Pro
gres
sF
SM
6B
oys
Girl
sE
thni
city
% o
f pup
ils a
t lea
st a
t the
exp
ecte
d st
anda
rd in
Rea
ding
, Writ
ing
and
Mat
hs
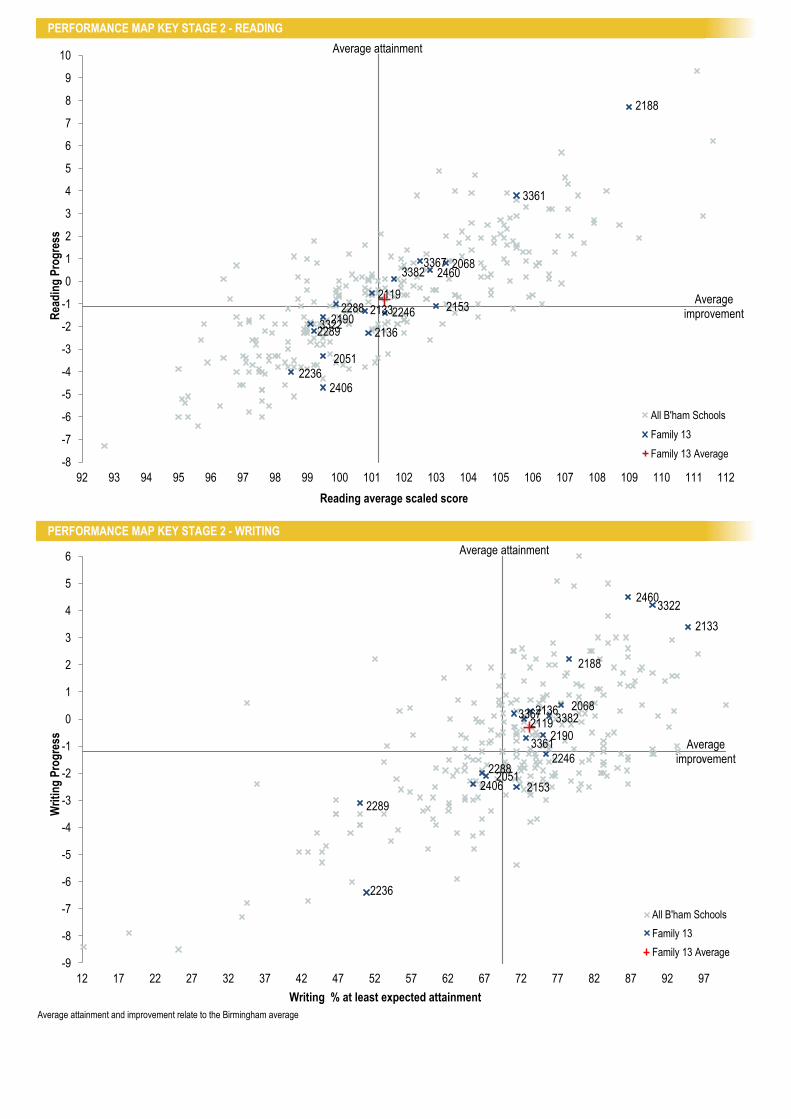
PERFORMANCE MAP KEY STAGE 2 - READING
PERFORMANCE MAP KEY STAGE 2 - WRITING
Average attainment and improvement relate to the Birmingham average
2288 2190 3322
2246
2289
2188
2460
2136
3367 3382
3361
2119
2133
2236 2406
2068
2051
2153
-8
-7
-6
-5
-4
-3
-2
-1
0
1
2
3
4
5
6
7
8
9
10
92 93 94 95 96 97 98 99 100 101 102 103 104 105 106 107 108 109 110 111 112
Rea
din
g P
rog
ress
Reading average scaled score
All B'ham Schools
Family 13
Family 13 Average
2288
2190
3322
2246
2289
2188
2460
2136 3367 3382
3361
2119
2133
2236
2406
2068
2051 2153
-9
-8
-7
-6
-5
-4
-3
-2
-1
0
1
2
3
4
5
6
12 17 22 27 32 37 42 47 52 57 62 67 72 77 82 87 92 97
Wri
tin
g P
rog
ress
Writing % at least expected attainment
All B'ham Schools
Family 13
Family 13 Average
Average attainment
Average improvement
Average attainment
Average improvement

PERFORMANCE MAP KEY STAGE 2 - MATHS
TRACKING MAP KEY STAGE 2 - READING, WRITING & MATHS COMBINED
Average attainment and difference relate to the Birmingham average
2288
2190
3322
2246
2289
2188
2460
2136
3367
3382
3361
2119
2133
2236 2406
2068
2051
2153
-7
-6
-5
-4
-3
-2
-1
0
1
2
3
4
5
6
7
96 97 98 99 100 101 102 103 104 105 106 107 108 109 110 111
Mat
hs
Pro
gre
ss
Maths average scaled score
All B'ham Schools
Family 13
Family 13 Average
2288
2190
3322
2246
2289
2188
2460
2136
3367
3382
3361
2119
2133
2236
2236 2068
2051
2153
0
2
4
6
8
10
12
14
16
18
20
22
0 5 10 15 20 25 30 35 40 45 50 55 60 65 70 75 80 85 90 95 100
% D
iffe
ren
ce f
rom
low
est
atta
inin
g s
ub
ject
to
RW
M
Reading, Writing & Maths % at least at expected level
All B'ham Schools
Family 13
Family 13 Average
Average difference
Average attainment
Average improvement
Average attainment
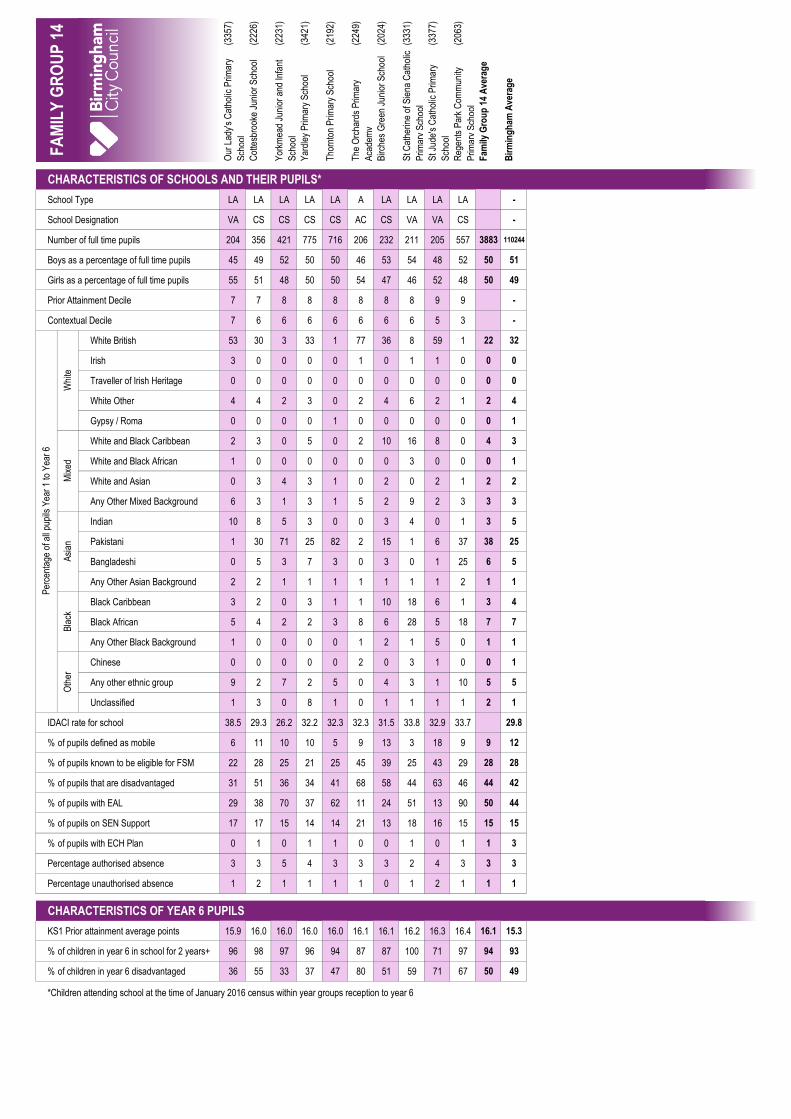
(335
7)
(222
6)
(223
1)
(342
1)
(219
2)
(224
9)
(202
4)
(333
1)
(337
7)
(206
3)
Our
Lad
y's
Cat
holic
Prim
ary
Sch
ool
Cot
tesb
rook
e Ju
nior
Sch
ool
Yor
kmea
d Ju
nior
and
Infa
nt
Sch
ool
Yar
dley
Prim
ary
Sch
ool
Tho
rnto
n P
rimar
y S
choo
l
The
Orc
hard
s P
rimar
y
Aca
dem
y
Birc
hes
Gre
en J
unio
r S
choo
l
St C
athe
rine
of S
iena
Cat
holic
Prim
ary
Sch
ool
St J
ude'
s C
atho
lic P
rimar
y
Sch
ool
Reg
ents
Par
k C
omm
unity
Prim
ary
Sch
ool
Fam
ily G
rou
p 1
4 A
vera
ge
Bir
min
gh
am A
vera
ge
CHARACTERISTICS OF SCHOOLS AND THEIR PUPILS*
School Type LA LA LA LA LA A LA LA LA LA -
School Designation VA CS CS CS CS AC CS VA VA CS -
Number of full time pupils 204 356 421 775 716 206 232 211 205 557 3883 110244
Boys as a percentage of full time pupils 45 49 52 50 50 46 53 54 48 52 50 51
Girls as a percentage of full time pupils 55 51 48 50 50 54 47 46 52 48 50 49
Prior Attainment Decile 7 7 8 8 8 8 8 8 9 9 -
Contextual Decile 7 6 6 6 6 6 6 6 5 3 -
White British 53 30 3 33 1 77 36 8 59 1 22 32
Irish 3 0 0 0 0 1 0 1 1 0 0 0
Traveller of Irish Heritage 0 0 0 0 0 0 0 0 0 0 0 0
White Other 4 4 2 3 0 2 4 6 2 1 2 4
Gypsy / Roma 0 0 0 0 1 0 0 0 0 0 0 1
White and Black Caribbean 2 3 0 5 0 2 10 16 8 0 4 3
White and Black African 1 0 0 0 0 0 0 3 0 0 0 1
White and Asian 0 3 4 3 1 0 2 0 2 1 2 2
Any Other Mixed Background 6 3 1 3 1 5 2 9 2 3 3 3
Indian 10 8 5 3 0 0 3 4 0 1 3 5
Pakistani 1 30 71 25 82 2 15 1 6 37 38 25
Bangladeshi 0 5 3 7 3 0 3 0 1 25 6 5
Any Other Asian Background 2 2 1 1 1 1 1 1 1 2 1 1
Black Caribbean 3 2 0 3 1 1 10 18 6 1 3 4
Black African 5 4 2 2 3 8 6 28 5 18 7 7
Any Other Black Background 1 0 0 0 0 1 2 1 5 0 1 1
Chinese 0 0 0 0 0 2 0 3 1 0 0 1
Any other ethnic group 9 2 7 2 5 0 4 3 1 10 5 5
Unclassified 1 3 0 8 1 0 1 1 1 1 2 1
IDACI rate for school 38.5 29.3 26.2 32.2 32.3 32.3 31.5 33.8 32.9 33.7 29.8
% of pupils defined as mobile 6 11 10 10 5 9 13 3 18 9 9 12
% of pupils known to be eligible for FSM 22 28 25 21 25 45 39 25 43 29 28 28
% of pupils that are disadvantaged 31 51 36 34 41 68 58 44 63 46 44 42
% of pupils with EAL 29 38 70 37 62 11 24 51 13 90 50 44
% of pupils on SEN Support 17 17 15 14 14 21 13 18 16 15 15 15
% of pupils with ECH Plan 0 1 0 1 1 0 0 1 0 1 1 3
Percentage authorised absence 3 3 5 4 3 3 3 2 4 3 3 3
Percentage unauthorised absence 1 2 1 1 1 1 0 1 2 1 1 1
CHARACTERISTICS OF YEAR 6 PUPILS
KS1 Prior attainment average points 15.9 16.0 16.0 16.0 16.0 16.1 16.1 16.2 16.3 16.4 16.1 15.3
% of children in year 6 in school for 2 years+ 96 98 97 96 94 87 87 100 71 97 94 93 #VALUE! #VALUE! #VALUE! #VALUE! #VALUE! #VALUE! #VALUE! #VALUE! #VALUE!
% of children in year 6 disadvantaged 36 55 33 37 47 80 51 59 71 67 50 49
*Children attending school at the time of January 2016 census within year groups reception to year 6
FA
MIL
Y G
RO
UP
14
Per
cent
age
of a
ll pu
pils
Yea
r 1
to Y
ear
6
Whi
teM
ixed
Asi
anB
lack
Oth
er
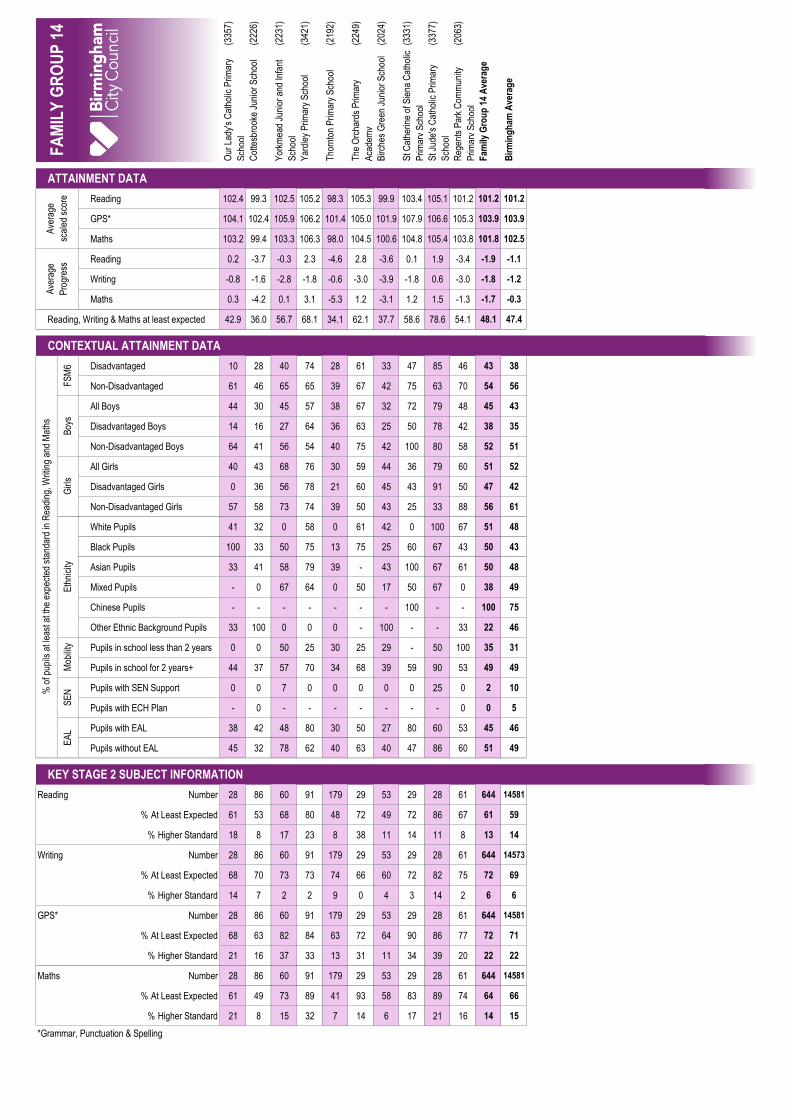
(335
7)
(222
6)
(223
1)
(342
1)
(219
2)
(224
9)
(202
4)
(333
1)
(337
7)
(206
3)
Our
Lad
y's
Cat
holic
Prim
ary
Sch
ool
Cot
tesb
rook
e Ju
nior
Sch
ool
Yor
kmea
d Ju
nior
and
Infa
nt
Sch
ool
Yar
dley
Prim
ary
Sch
ool
Tho
rnto
n P
rimar
y S
choo
l
The
Orc
hard
s P
rimar
y
Aca
dem
y
Birc
hes
Gre
en J
unio
r S
choo
l
St C
athe
rine
of S
iena
Cat
holic
Prim
ary
Sch
ool
St J
ude'
s C
atho
lic P
rimar
y
Sch
ool
Reg
ents
Par
k C
omm
unity
Prim
ary
Sch
ool
Fam
ily G
rou
p 1
4 A
vera
ge
Bir
min
gh
am A
vera
ge
ATTAINMENT DATA
Reading 102.4 99.3 102.5 105.2 98.3 105.3 99.9 103.4 105.1 101.2 101.2 101.2
GPS* 104.1 102.4 105.9 106.2 101.4 105.0 101.9 107.9 106.6 105.3 103.9 103.9
Maths 103.2 99.4 103.3 106.3 98.0 104.5 100.6 104.8 105.4 103.8 101.8 102.5
Reading 0.2 -3.7 -0.3 2.3 -4.6 2.8 -3.6 0.1 1.9 -3.4 -1.9 -1.1
Writing -0.8 -1.6 -2.8 -1.8 -0.6 -3.0 -3.9 -1.8 0.6 -3.0 -1.8 -1.2
Maths 0.3 -4.2 0.1 3.1 -5.3 1.2 -3.1 1.2 1.5 -1.3 -1.7 -0.3
Reading, Writing & Maths at least expected 42.9 36.0 56.7 68.1 34.1 62.1 37.7 58.6 78.6 54.1 48.1 47.4
CONTEXTUAL ATTAINMENT DATA
Disadvantaged 10 28 40 74 28 61 33 47 85 46 43 38
Non-Disadvantaged 61 46 65 65 39 67 42 75 63 70 54 56
All Boys 44 30 45 57 38 67 32 72 79 48 45 43
Disadvantaged Boys 14 16 27 64 36 63 25 50 78 42 38 35
Non-Disadvantaged Boys 64 41 56 54 40 75 42 100 80 58 52 51
All Girls 40 43 68 76 30 59 44 36 79 60 51 52
Disadvantaged Girls 0 36 56 78 21 60 45 43 91 50 47 42
Non-Disadvantaged Girls 57 58 73 74 39 50 43 25 33 88 56 61
White Pupils 41 32 0 58 0 61 42 0 100 67 51 48
Black Pupils 100 33 50 75 13 75 25 60 67 43 50 43
Asian Pupils 33 41 58 79 39 - 43 100 67 61 50 48
Mixed Pupils - 0 67 64 0 50 17 50 67 0 38 49
Chinese Pupils - - - - - - - 100 - - 100 75
Other Ethnic Background Pupils 33 100 0 0 0 - 100 - - 33 22 46
Pupils in school less than 2 years 0 0 50 25 30 25 29 - 50 100 35 31
Pupils in school for 2 years+ 44 37 57 70 34 68 39 59 90 53 49 49
Pupils with SEN Support 0 0 7 0 0 0 0 0 25 0 2 10
Pupils with ECH Plan - 0 - - - - - - - 0 0 5
Pupils with EAL 38 42 48 80 30 50 27 80 60 53 45 46
Pupils without EAL 45 32 78 62 40 63 40 47 86 60 51 49
KEY STAGE 2 SUBJECT INFORMATION
Reading Number 28 86 60 91 179 29 53 29 28 61 644 14581
% At Least Expected 61 53 68 80 48 72 49 72 86 67 61 59
% Higher Standard 18 8 17 23 8 38 11 14 11 8 13 14
Writing Number 28 86 60 91 179 29 53 29 28 61 644 14573
% At Least Expected 68 70 73 73 74 66 60 72 82 75 72 69
% Higher Standard 14 7 2 2 9 0 4 3 14 2 6 6
GPS* Number 28 86 60 91 179 29 53 29 28 61 644 14581
% At Least Expected 68 63 82 84 63 72 64 90 86 77 72 71
% Higher Standard 21 16 37 33 13 31 11 34 39 20 22 22
Maths Number 28 86 60 91 179 29 53 29 28 61 644 14581
% At Least Expected 61 49 73 89 41 93 58 83 89 74 64 66
% Higher Standard 21 8 15 32 7 14 6 17 21 16 14 15
*Grammar, Punctuation & Spelling
FA
MIL
Y G
RO
UP
14
Mob
ility
SE
NE
AL
Ave
rage
scal
ed s
core
Ave
rage
Pro
gres
sF
SM
6B
oys
Girl
sE
thni
city
% o
f pup
ils a
t lea
st a
t the
exp
ecte
d st
anda
rd in
Rea
ding
, Writ
ing
and
Mat
hs

PERFORMANCE MAP KEY STAGE 2 - READING
PERFORMANCE MAP KEY STAGE 2 - WRITING
Average attainment and improvement relate to the Birmingham average
3357
2226
2231
3421
2192
2249
2024
3331
3377
2063
-8
-7
-6
-5
-4
-3
-2
-1
0
1
2
3
4
5
6
7
8
9
10
92 93 94 95 96 97 98 99 100 101 102 103 104 105 106 107 108 109 110 111 112
Rea
din
g P
rog
ress
Reading average scaled score
All B'ham Schools
Family 14
Family 14 Average
3357
2226
2231
3421
2192
2249
2024
3331
3377
2063
-9
-8
-7
-6
-5
-4
-3
-2
-1
0
1
2
3
4
5
6
12 17 22 27 32 37 42 47 52 57 62 67 72 77 82 87 92 97
Wri
tin
g P
rog
ress
Writing % at least expected attainment
All B'ham Schools
Family 14
Family 14 Average
Average attainment
Average improvement
Average attainment
Average improvement

PERFORMANCE MAP KEY STAGE 2 - MATHS
TRACKING MAP KEY STAGE 2 - READING, WRITING & MATHS COMBINED
Average attainment and difference relate to the Birmingham average
3357
2226
2231
3421
2192
2249
2024
3331 3377
2063
-7
-6
-5
-4
-3
-2
-1
0
1
2
3
4
5
6
7
96 97 98 99 100 101 102 103 104 105 106 107 108 109 110 111
Mat
hs
Pro
gre
ss
Maths average scaled score
All B'ham Schools
Family 14
Family 14 Average
3357
2226 2231
3421
2192
2249
2024
3331
3377
2063
0
2
4
6
8
10
12
14
16
18
20
22
0 5 10 15 20 25 30 35 40 45 50 55 60 65 70 75 80 85 90 95 100
% D
iffe
ren
ce f
rom
low
est
atta
inin
g s
ub
ject
to
RW
M
Reading, Writing & Maths % at least at expected level
All B'ham Schools
Family 14
Family 14 Average
Average difference
Average attainment
Average improvement
Average attainment
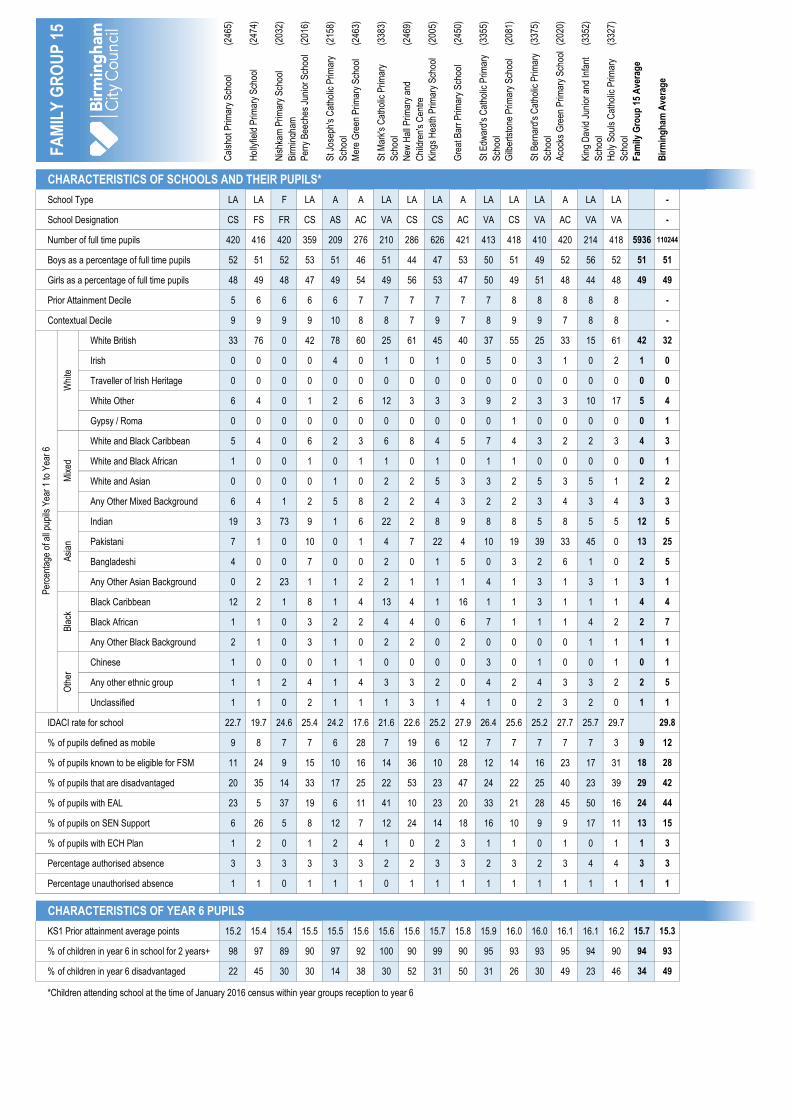
(246
5)
(247
4)
(203
2)
(201
6)
(215
8)
(246
3)
(338
3)
(246
9)
(200
5)
(245
0)
(335
5)
(208
1)
(337
5)
(202
0)
(335
2)
(332
7)
Cal
shot
Prim
ary
Sch
ool
Hol
lyfie
ld P
rimar
y S
choo
l
Nis
hkam
Prim
ary
Sch
ool
Birm
ingh
am
Per
ry B
eech
es J
unio
r S
choo
l
St J
osep
h's
Cat
holic
Prim
ary
Sch
ool
Mer
e G
reen
Prim
ary
Sch
ool
St M
ark'
s C
atho
lic P
rimar
y
Sch
ool
New
Hal
l Prim
ary
and
Chi
ldre
n's
Cen
tre
Kin
gs H
eath
Prim
ary
Sch
ool
Gre
at B
arr
Prim
ary
Sch
ool
St E
dwar
d's
Cat
holic
Prim
ary
Sch
ool
Gilb
erts
tone
Prim
ary
Sch
ool
St B
erna
rd's
Cat
holic
Prim
ary
Sch
ool
Aco
cks
Gre
en P
rimar
y S
choo
l
Kin
g D
avid
Jun
ior
and
Infa
nt
Sch
ool
Hol
y S
ouls
Cat
holic
Prim
ary
Sch
ool
Fam
ily G
rou
p 1
5 A
vera
ge
Bir
min
gh
am A
vera
ge
CHARACTERISTICS OF SCHOOLS AND THEIR PUPILS*
School Type LA LA F LA A A LA LA LA A LA LA LA A LA LA -
School Designation CS FS FR CS AS AC VA CS CS AC VA CS VA AC VA VA -
Number of full time pupils 420 416 420 359 209 276 210 286 626 421 413 418 410 420 214 418 5936 110244
Boys as a percentage of full time pupils 52 51 52 53 51 46 51 44 47 53 50 51 49 52 56 52 51 51
Girls as a percentage of full time pupils 48 49 48 47 49 54 49 56 53 47 50 49 51 48 44 48 49 49
Prior Attainment Decile 5 6 6 6 6 7 7 7 7 7 7 8 8 8 8 8 -
Contextual Decile 9 9 9 9 10 8 8 7 9 7 8 9 9 7 8 8 -
White British 33 76 0 42 78 60 25 61 45 40 37 55 25 33 15 61 42 32
Irish 0 0 0 0 4 0 1 0 1 0 5 0 3 1 0 2 1 0
Traveller of Irish Heritage 0 0 0 0 0 0 0 0 0 0 0 0 0 0 0 0 0 0
White Other 6 4 0 1 2 6 12 3 3 3 9 2 3 3 10 17 5 4
Gypsy / Roma 0 0 0 0 0 0 0 0 0 0 0 1 0 0 0 0 0 1
White and Black Caribbean 5 4 0 6 2 3 6 8 4 5 7 4 3 2 2 3 4 3
White and Black African 1 0 0 1 0 1 1 0 1 0 1 1 0 0 0 0 0 1
White and Asian 0 0 0 0 1 0 2 2 5 3 3 2 5 3 5 1 2 2
Any Other Mixed Background 6 4 1 2 5 8 2 2 4 3 2 2 3 4 3 4 3 3
Indian 19 3 73 9 1 6 22 2 8 9 8 8 5 8 5 5 12 5
Pakistani 7 1 0 10 0 1 4 7 22 4 10 19 39 33 45 0 13 25
Bangladeshi 4 0 0 7 0 0 2 0 1 5 0 3 2 6 1 0 2 5
Any Other Asian Background 0 2 23 1 1 2 2 1 1 1 4 1 3 1 3 1 3 1
Black Caribbean 12 2 1 8 1 4 13 4 1 16 1 1 3 1 1 1 4 4
Black African 1 1 0 3 2 2 4 4 0 6 7 1 1 1 4 2 2 7
Any Other Black Background 2 1 0 3 1 0 2 2 0 2 0 0 0 0 1 1 1 1
Chinese 1 0 0 0 1 1 0 0 0 0 3 0 1 0 0 1 0 1
Any other ethnic group 1 1 2 4 1 4 3 3 2 0 4 2 4 3 3 2 2 5
Unclassified 1 1 0 2 1 1 1 3 1 4 1 0 2 3 2 0 1 1
IDACI rate for school 22.7 19.7 24.6 25.4 24.2 17.6 21.6 22.6 25.2 27.9 26.4 25.6 25.2 27.7 25.7 29.7 29.8
% of pupils defined as mobile 9 8 7 7 6 28 7 19 6 12 7 7 7 7 7 3 9 12
% of pupils known to be eligible for FSM 11 24 9 15 10 16 14 36 10 28 12 14 16 23 17 31 18 28
% of pupils that are disadvantaged 20 35 14 33 17 25 22 53 23 47 24 22 25 40 23 39 29 42
% of pupils with EAL 23 5 37 19 6 11 41 10 23 20 33 21 28 45 50 16 24 44
% of pupils on SEN Support 6 26 5 8 12 7 12 24 14 18 16 10 9 9 17 11 13 15
% of pupils with ECH Plan 1 2 0 1 2 4 1 0 2 3 1 1 0 1 0 1 1 3
Percentage authorised absence 3 3 3 3 3 3 2 2 3 3 2 3 2 3 4 4 3 3
Percentage unauthorised absence 1 1 0 1 1 1 0 1 1 1 1 1 1 1 1 1 1 1
CHARACTERISTICS OF YEAR 6 PUPILS
KS1 Prior attainment average points 15.2 15.4 15.4 15.5 15.5 15.6 15.6 15.6 15.7 15.8 15.9 16.0 16.0 16.1 16.1 16.2 15.7 15.3
% of children in year 6 in school for 2 years+ 98 97 89 90 97 92 100 90 99 90 95 93 93 95 94 90 94 93 #VALUE! #VALUE! #VALUE!
% of children in year 6 disadvantaged 22 45 30 30 14 38 30 52 31 50 31 26 30 49 23 46 34 49
*Children attending school at the time of January 2016 census within year groups reception to year 6
Asi
anB
lack
Oth
erF
AM
ILY
GR
OU
P 1
5P
erce
ntag
e of
all
pupi
ls Y
ear
1 to
Yea
r 6
Whi
teM
ixed
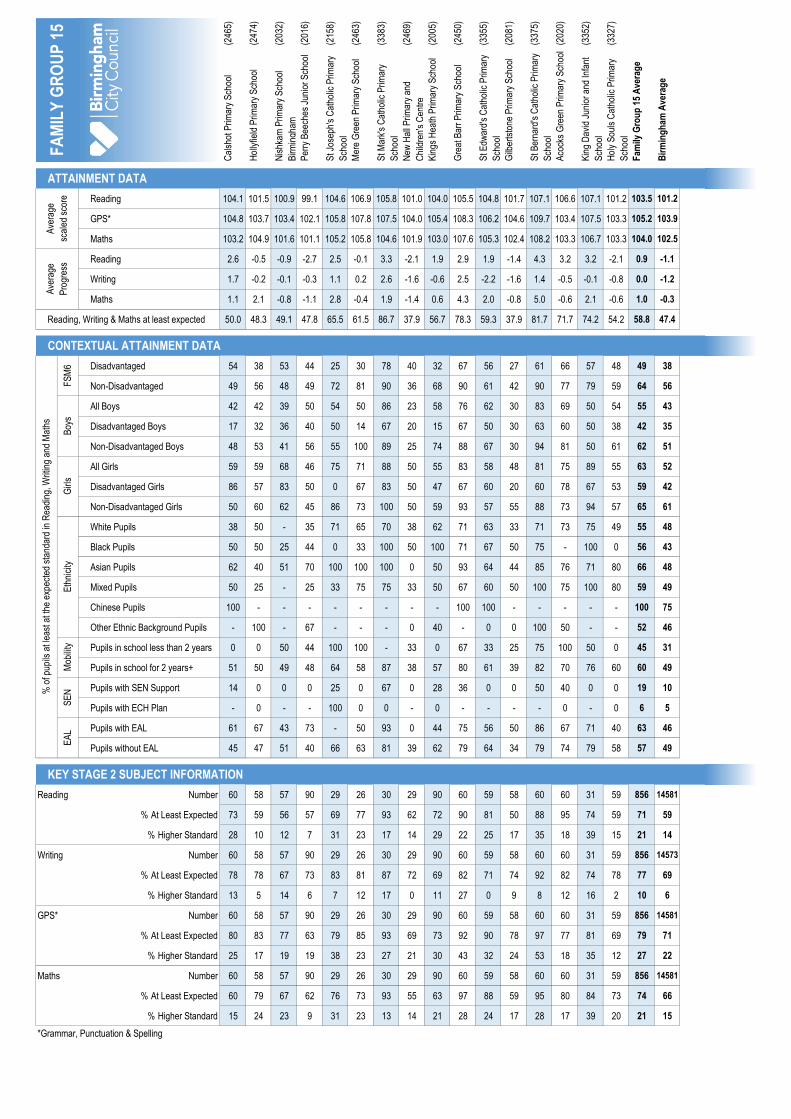
(246
5)
(247
4)
(203
2)
(201
6)
(215
8)
(246
3)
(338
3)
(246
9)
(200
5)
(245
0)
(335
5)
(208
1)
(337
5)
(202
0)
(335
2)
(332
7)
Cal
shot
Prim
ary
Sch
ool
Hol
lyfie
ld P
rimar
y S
choo
l
Nis
hkam
Prim
ary
Sch
ool
Birm
ingh
am
Per
ry B
eech
es J
unio
r S
choo
l
St J
osep
h's
Cat
holic
Prim
ary
Sch
ool
Mer
e G
reen
Prim
ary
Sch
ool
St M
ark'
s C
atho
lic P
rimar
y
Sch
ool
New
Hal
l Prim
ary
and
Chi
ldre
n's
Cen
tre
Kin
gs H
eath
Prim
ary
Sch
ool
Gre
at B
arr
Prim
ary
Sch
ool
St E
dwar
d's
Cat
holic
Prim
ary
Sch
ool
Gilb
erts
tone
Prim
ary
Sch
ool
St B
erna
rd's
Cat
holic
Prim
ary
Sch
ool
Aco
cks
Gre
en P
rimar
y S
choo
l
Kin
g D
avid
Jun
ior
and
Infa
nt
Sch
ool
Hol
y S
ouls
Cat
holic
Prim
ary
Sch
ool
Fam
ily G
rou
p 1
5 A
vera
ge
Bir
min
gh
am A
vera
ge
ATTAINMENT DATA
Reading 104.1 101.5 100.9 99.1 104.6 106.9 105.8 101.0 104.0 105.5 104.8 101.7 107.1 106.6 107.1 101.2 103.5 101.2
GPS* 104.8 103.7 103.4 102.1 105.8 107.8 107.5 104.0 105.4 108.3 106.2 104.6 109.7 103.4 107.5 103.3 105.2 103.9
Maths 103.2 104.9 101.6 101.1 105.2 105.8 104.6 101.9 103.0 107.6 105.3 102.4 108.2 103.3 106.7 103.3 104.0 102.5
Reading 2.6 -0.5 -0.9 -2.7 2.5 -0.1 3.3 -2.1 1.9 2.9 1.9 -1.4 4.3 3.2 3.2 -2.1 0.9 -1.1
Writing 1.7 -0.2 -0.1 -0.3 1.1 0.2 2.6 -1.6 -0.6 2.5 -2.2 -1.6 1.4 -0.5 -0.1 -0.8 0.0 -1.2
Maths 1.1 2.1 -0.8 -1.1 2.8 -0.4 1.9 -1.4 0.6 4.3 2.0 -0.8 5.0 -0.6 2.1 -0.6 1.0 -0.3
Reading, Writing & Maths at least expected 50.0 48.3 49.1 47.8 65.5 61.5 86.7 37.9 56.7 78.3 59.3 37.9 81.7 71.7 74.2 54.2 58.8 47.4
CONTEXTUAL ATTAINMENT DATA
Disadvantaged 54 38 53 44 25 30 78 40 32 67 56 27 61 66 57 48 49 38
Non-Disadvantaged 49 56 48 49 72 81 90 36 68 90 61 42 90 77 79 59 64 56
All Boys 42 42 39 50 54 50 86 23 58 76 62 30 83 69 50 54 55 43
Disadvantaged Boys 17 32 36 40 50 14 67 20 15 67 50 30 63 60 50 38 42 35
Non-Disadvantaged Boys 48 53 41 56 55 100 89 25 74 88 67 30 94 81 50 61 62 51
All Girls 59 59 68 46 75 71 88 50 55 83 58 48 81 75 89 55 63 52
Disadvantaged Girls 86 57 83 50 0 67 83 50 47 67 60 20 60 78 67 53 59 42
Non-Disadvantaged Girls 50 60 62 45 86 73 100 50 59 93 57 55 88 73 94 57 65 61
White Pupils 38 50 - 35 71 65 70 38 62 71 63 33 71 73 75 49 55 48
Black Pupils 50 50 25 44 0 33 100 50 100 71 67 50 75 - 100 0 56 43
Asian Pupils 62 40 51 70 100 100 100 0 50 93 64 44 85 76 71 80 66 48
Mixed Pupils 50 25 - 25 33 75 75 33 50 67 60 50 100 75 100 80 59 49
Chinese Pupils 100 - - - - - - - - 100 100 - - - - - 100 75
Other Ethnic Background Pupils - 100 - 67 - - - 0 40 - 0 0 100 50 - - 52 46
Pupils in school less than 2 years 0 0 50 44 100 100 - 33 0 67 33 25 75 100 50 0 45 31
Pupils in school for 2 years+ 51 50 49 48 64 58 87 38 57 80 61 39 82 70 76 60 60 49
Pupils with SEN Support 14 0 0 0 25 0 67 0 28 36 0 0 50 40 0 0 19 10
Pupils with ECH Plan - 0 - - 100 0 0 - 0 - - - - 0 - 0 6 5
Pupils with EAL 61 67 43 73 - 50 93 0 44 75 56 50 86 67 71 40 63 46
Pupils without EAL 45 47 51 40 66 63 81 39 62 79 64 34 79 74 79 58 57 49
KEY STAGE 2 SUBJECT INFORMATION
Reading Number 60 58 57 90 29 26 30 29 90 60 59 58 60 60 31 59 856 14581
% At Least Expected 73 59 56 57 69 77 93 62 72 90 81 50 88 95 74 59 71 59
% Higher Standard 28 10 12 7 31 23 17 14 29 22 25 17 35 18 39 15 21 14
Writing Number 60 58 57 90 29 26 30 29 90 60 59 58 60 60 31 59 856 14573
% At Least Expected 78 78 67 73 83 81 87 72 69 82 71 74 92 82 74 78 77 69
% Higher Standard 13 5 14 6 7 12 17 0 11 27 0 9 8 12 16 2 10 6
GPS* Number 60 58 57 90 29 26 30 29 90 60 59 58 60 60 31 59 856 14581
% At Least Expected 80 83 77 63 79 85 93 69 73 92 90 78 97 77 81 69 79 71
% Higher Standard 25 17 19 19 38 23 27 21 30 43 32 24 53 18 35 12 27 22
Maths Number 60 58 57 90 29 26 30 29 90 60 59 58 60 60 31 59 856 14581
% At Least Expected 60 79 67 62 76 73 93 55 63 97 88 59 95 80 84 73 74 66
% Higher Standard 15 24 23 9 31 23 13 14 21 28 24 17 28 17 39 20 21 15
*Grammar, Punctuation & Spelling
EA
L
Ave
rage
scal
ed s
core
Ave
rage
Pro
gres
sF
SM
6B
oys
Girl
sE
thni
city
% o
f pup
ils a
t lea
st a
t the
exp
ecte
d st
anda
rd in
Rea
ding
, Writ
ing
and
Mat
hs
Mob
ility
SE
NF
AM
ILY
GR
OU
P 1
5
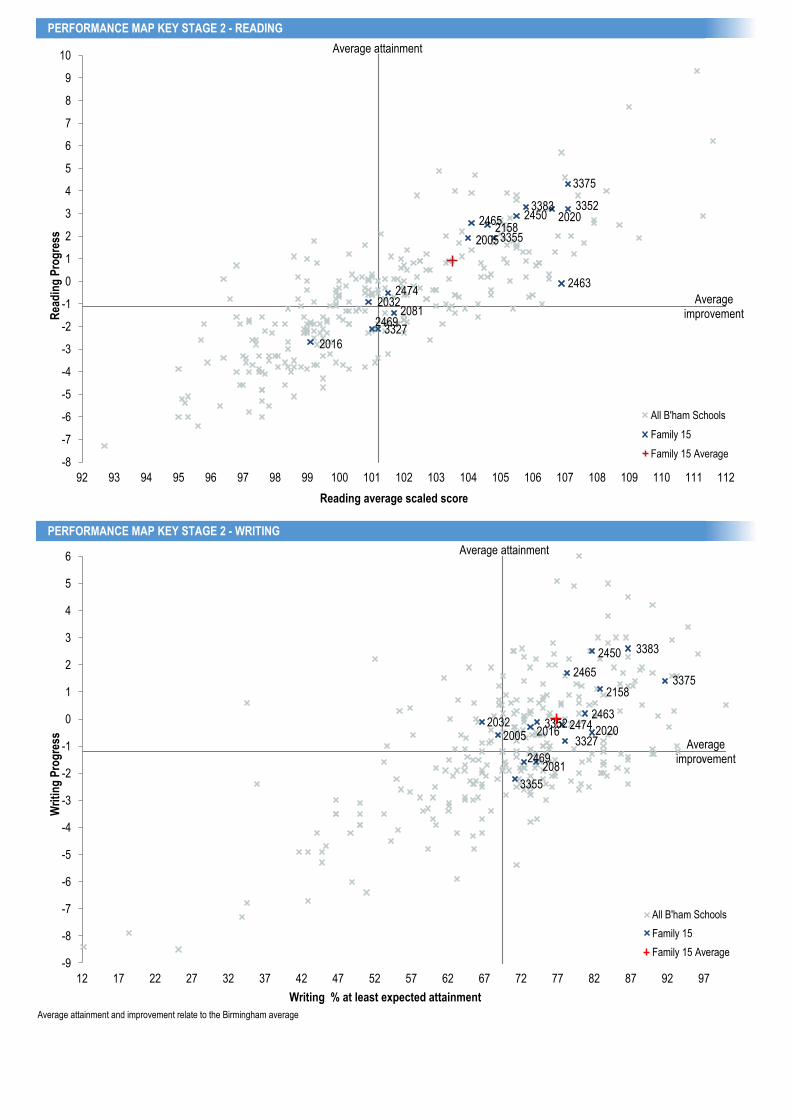
PERFORMANCE MAP KEY STAGE 2 - READING
PERFORMANCE MAP KEY STAGE 2 - WRITING
Average attainment and improvement relate to the Birmingham average
2465
2474 2032
2016
2158
2463
3383
2469
2005
2450
3355
2081
3375
2020 3352
3327
-8
-7
-6
-5
-4
-3
-2
-1
0
1
2
3
4
5
6
7
8
9
10
92 93 94 95 96 97 98 99 100 101 102 103 104 105 106 107 108 109 110 111 112
Rea
din
g P
rog
ress
Reading average scaled score
All B'ham Schools
Family 15
Family 15 Average
2465
2474 2032 2016
2158
2463
3383
2469
2005
2450
3355
2081
3375
2020 3352
3327
-9
-8
-7
-6
-5
-4
-3
-2
-1
0
1
2
3
4
5
6
12 17 22 27 32 37 42 47 52 57 62 67 72 77 82 87 92 97
Wri
tin
g P
rog
ress
Writing % at least expected attainment
All B'ham Schools
Family 15
Family 15 Average
Average attainment
Average improvement
Average attainment
Average improvement

PERFORMANCE MAP KEY STAGE 2 - MATHS
TRACKING MAP KEY STAGE 2 - READING, WRITING & MATHS COMBINED
Average attainment and difference relate to the Birmingham average
2465
2474
2032 2016
2158
2463
3383
2469
2005
2450
3355
2081
3375
2020
3352
3327
-7
-6
-5
-4
-3
-2
-1
0
1
2
3
4
5
6
7
96 97 98 99 100 101 102 103 104 105 106 107 108 109 110 111
Mat
hs
Pro
gre
ss
Maths average scaled score
All B'ham Schools
Family 15
Family 15 Average
2465 2474
2032
2016
2158
2463
3383
2469
2005
2450
3355 2081
3375
2020
2020
3327
0
2
4
6
8
10
12
14
16
18
20
22
0 5 10 15 20 25 30 35 40 45 50 55 60 65 70 75 80 85 90 95 100
% D
iffe
ren
ce f
rom
low
est
atta
inin
g s
ub
ject
to
RW
M
Reading, Writing & Maths % at least at expected level
All B'ham Schools
Family 15
Family 15 Average
Average difference
Average attainment
Average improvement
Average attainment
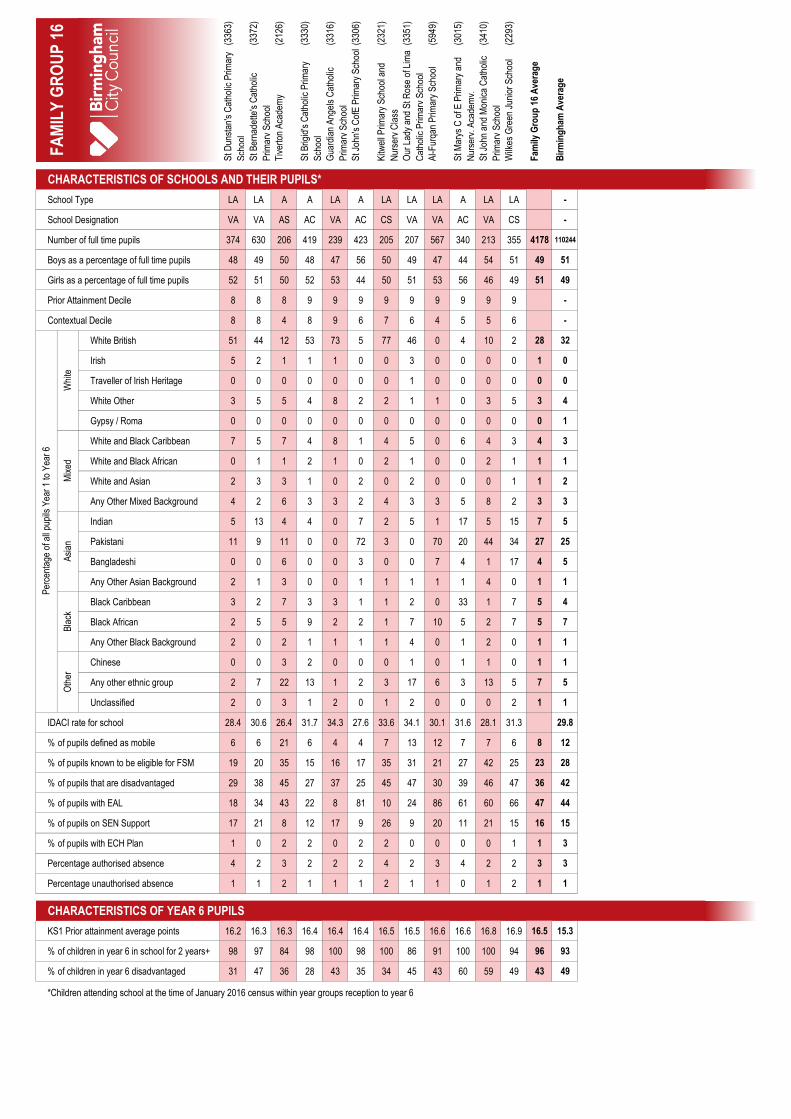
(336
3)
(337
2)
(212
6)
(333
0)
(331
6)
(330
6)
(232
1)
(335
1)
(594
9)
(301
5)
(341
0)
(229
3)
St D
unst
an's
Cat
holic
Prim
ary
Sch
ool
St B
erna
dette
's C
atho
lic
Prim
ary
Sch
ool
Tiv
erto
n A
cade
my
St B
rigid
's C
atho
lic P
rimar
y
Sch
ool
Gua
rdia
n A
ngel
s C
atho
lic
Prim
ary
Sch
ool
St J
ohn'
s C
ofE
Prim
ary
Sch
ool
Kitw
ell P
rimar
y S
choo
l and
Nur
sery
Cla
ss
Our
Lad
y an
d S
t Ros
e of
Lim
a
Cat
holic
Prim
ary
Sch
ool
Al-F
urqa
n P
rimar
y S
choo
l
St M
arys
C o
f E P
rimar
y an
d
Nur
sery
, Aca
dem
y,
St J
ohn
and
Mon
ica
Cat
holic
Prim
ary
Sch
ool
Wilk
es G
reen
Jun
ior
Sch
ool
Fam
ily G
rou
p 1
6 A
vera
ge
Bir
min
gh
am A
vera
ge
CHARACTERISTICS OF SCHOOLS AND THEIR PUPILS*
School Type LA LA A A LA A LA LA LA A LA LA -
School Designation VA VA AS AC VA AC CS VA VA AC VA CS -
Number of full time pupils 374 630 206 419 239 423 205 207 567 340 213 355 4178 110244
Boys as a percentage of full time pupils 48 49 50 48 47 56 50 49 47 44 54 51 49 51
Girls as a percentage of full time pupils 52 51 50 52 53 44 50 51 53 56 46 49 51 49
Prior Attainment Decile 8 8 8 9 9 9 9 9 9 9 9 9 -
Contextual Decile 8 8 4 8 9 6 7 6 4 5 5 6 -
White British 51 44 12 53 73 5 77 46 0 4 10 2 28 32
Irish 5 2 1 1 1 0 0 3 0 0 0 0 1 0
Traveller of Irish Heritage 0 0 0 0 0 0 0 1 0 0 0 0 0 0
White Other 3 5 5 4 8 2 2 1 1 0 3 5 3 4
Gypsy / Roma 0 0 0 0 0 0 0 0 0 0 0 0 0 1
White and Black Caribbean 7 5 7 4 8 1 4 5 0 6 4 3 4 3
White and Black African 0 1 1 2 1 0 2 1 0 0 2 1 1 1
White and Asian 2 3 3 1 0 2 0 2 0 0 0 1 1 2
Any Other Mixed Background 4 2 6 3 3 2 4 3 3 5 8 2 3 3
Indian 5 13 4 4 0 7 2 5 1 17 5 15 7 5
Pakistani 11 9 11 0 0 72 3 0 70 20 44 34 27 25
Bangladeshi 0 0 6 0 0 3 0 0 7 4 1 17 4 5
Any Other Asian Background 2 1 3 0 0 1 1 1 1 1 4 0 1 1
Black Caribbean 3 2 7 3 3 1 1 2 0 33 1 7 5 4
Black African 2 5 5 9 2 2 1 7 10 5 2 7 5 7
Any Other Black Background 2 0 2 1 1 1 1 4 0 1 2 0 1 1
Chinese 0 0 3 2 0 0 0 1 0 1 1 0 1 1
Any other ethnic group 2 7 22 13 1 2 3 17 6 3 13 5 7 5
Unclassified 2 0 3 1 2 0 1 2 0 0 0 2 1 1
IDACI rate for school 28.4 30.6 26.4 31.7 34.3 27.6 33.6 34.1 30.1 31.6 28.1 31.3 29.8
% of pupils defined as mobile 6 6 21 6 4 4 7 13 12 7 7 6 8 12
% of pupils known to be eligible for FSM 19 20 35 15 16 17 35 31 21 27 42 25 23 28
% of pupils that are disadvantaged 29 38 45 27 37 25 45 47 30 39 46 47 36 42
% of pupils with EAL 18 34 43 22 8 81 10 24 86 61 60 66 47 44
% of pupils on SEN Support 17 21 8 12 17 9 26 9 20 11 21 15 16 15
% of pupils with ECH Plan 1 0 2 2 0 2 2 0 0 0 0 1 1 3
Percentage authorised absence 4 2 3 2 2 2 4 2 3 4 2 2 3 3
Percentage unauthorised absence 1 1 2 1 1 1 2 1 1 0 1 2 1 1
CHARACTERISTICS OF YEAR 6 PUPILS
KS1 Prior attainment average points 16.2 16.3 16.3 16.4 16.4 16.4 16.5 16.5 16.6 16.6 16.8 16.9 16.5 15.3
% of children in year 6 in school for 2 years+ 98 97 84 98 100 98 100 86 91 100 100 94 96 93 #VALUE! #VALUE! #VALUE! #VALUE! #VALUE! #VALUE! #VALUE!
% of children in year 6 disadvantaged 31 47 36 28 43 35 34 45 43 60 59 49 43 49
*Children attending school at the time of January 2016 census within year groups reception to year 6
FA
MIL
Y G
RO
UP
16
Per
cent
age
of a
ll pu
pils
Yea
r 1
to Y
ear
6
Whi
teM
ixed
Asi
anB
lack
Oth
er
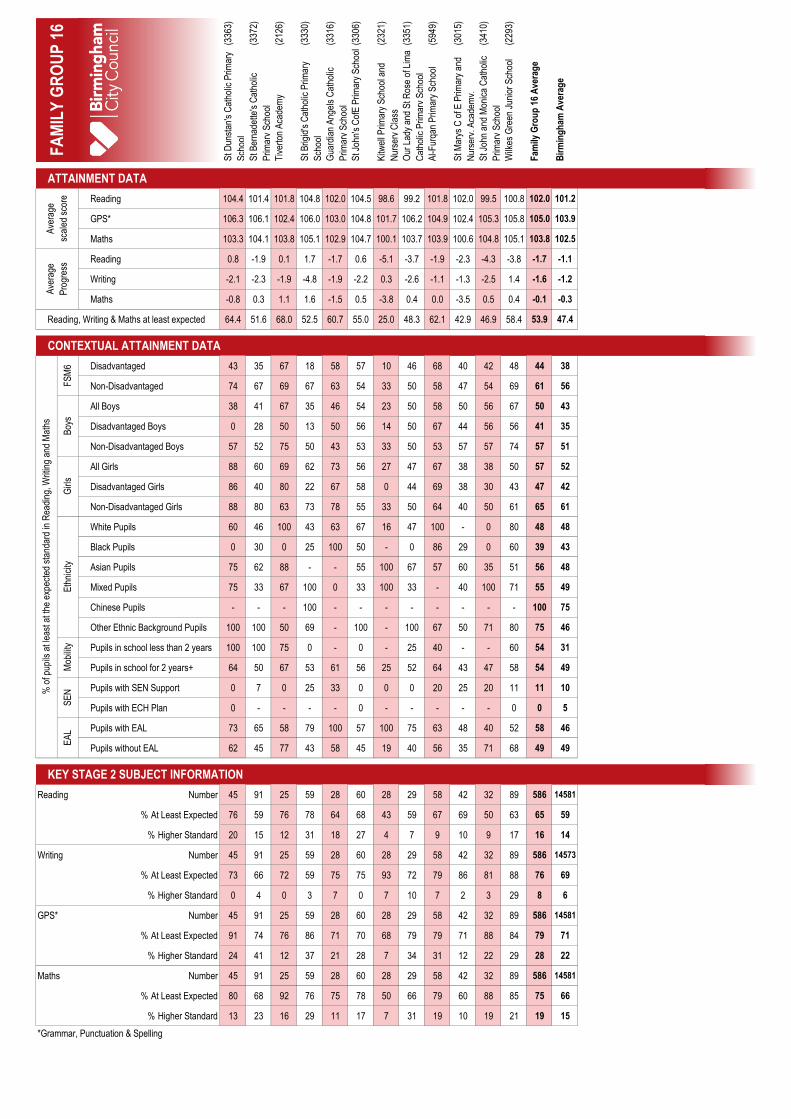
(336
3)
(337
2)
(212
6)
(333
0)
(331
6)
(330
6)
(232
1)
(335
1)
(594
9)
(301
5)
(341
0)
(229
3)
St D
unst
an's
Cat
holic
Prim
ary
Sch
ool
St B
erna
dette
's C
atho
lic
Prim
ary
Sch
ool
Tiv
erto
n A
cade
my
St B
rigid
's C
atho
lic P
rimar
y
Sch
ool
Gua
rdia
n A
ngel
s C
atho
lic
Prim
ary
Sch
ool
St J
ohn'
s C
ofE
Prim
ary
Sch
ool
Kitw
ell P
rimar
y S
choo
l and
Nur
sery
Cla
ss
Our
Lad
y an
d S
t Ros
e of
Lim
a
Cat
holic
Prim
ary
Sch
ool
Al-F
urqa
n P
rimar
y S
choo
l
St M
arys
C o
f E P
rimar
y an
d
Nur
sery
, Aca
dem
y,
St J
ohn
and
Mon
ica
Cat
holic
Prim
ary
Sch
ool
Wilk
es G
reen
Jun
ior
Sch
ool
Fam
ily G
rou
p 1
6 A
vera
ge
Bir
min
gh
am A
vera
ge
ATTAINMENT DATA
Reading 104.4 101.4 101.8 104.8 102.0 104.5 98.6 99.2 101.8 102.0 99.5 100.8 102.0 101.2
GPS* 106.3 106.1 102.4 106.0 103.0 104.8 101.7 106.2 104.9 102.4 105.3 105.8 105.0 103.9
Maths 103.3 104.1 103.8 105.1 102.9 104.7 100.1 103.7 103.9 100.6 104.8 105.1 103.8 102.5
Reading 0.8 -1.9 0.1 1.7 -1.7 0.6 -5.1 -3.7 -1.9 -2.3 -4.3 -3.8 -1.7 -1.1
Writing -2.1 -2.3 -1.9 -4.8 -1.9 -2.2 0.3 -2.6 -1.1 -1.3 -2.5 1.4 -1.6 -1.2
Maths -0.8 0.3 1.1 1.6 -1.5 0.5 -3.8 0.4 0.0 -3.5 0.5 0.4 -0.1 -0.3
Reading, Writing & Maths at least expected 64.4 51.6 68.0 52.5 60.7 55.0 25.0 48.3 62.1 42.9 46.9 58.4 53.9 47.4
CONTEXTUAL ATTAINMENT DATA
Disadvantaged 43 35 67 18 58 57 10 46 68 40 42 48 44 38
Non-Disadvantaged 74 67 69 67 63 54 33 50 58 47 54 69 61 56
All Boys 38 41 67 35 46 54 23 50 58 50 56 67 50 43
Disadvantaged Boys 0 28 50 13 50 56 14 50 67 44 56 56 41 35
Non-Disadvantaged Boys 57 52 75 50 43 53 33 50 53 57 57 74 57 51
All Girls 88 60 69 62 73 56 27 47 67 38 38 50 57 52
Disadvantaged Girls 86 40 80 22 67 58 0 44 69 38 30 43 47 42
Non-Disadvantaged Girls 88 80 63 73 78 55 33 50 64 40 50 61 65 61
White Pupils 60 46 100 43 63 67 16 47 100 - 0 80 48 48
Black Pupils 0 30 0 25 100 50 - 0 86 29 0 60 39 43
Asian Pupils 75 62 88 - - 55 100 67 57 60 35 51 56 48
Mixed Pupils 75 33 67 100 0 33 100 33 - 40 100 71 55 49
Chinese Pupils - - - 100 - - - - - - - - 100 75
Other Ethnic Background Pupils 100 100 50 69 - 100 - 100 67 50 71 80 75 46
Pupils in school less than 2 years 100 100 75 0 - 0 - 25 40 - - 60 54 31
Pupils in school for 2 years+ 64 50 67 53 61 56 25 52 64 43 47 58 54 49
Pupils with SEN Support 0 7 0 25 33 0 0 0 20 25 20 11 11 10
Pupils with ECH Plan 0 - - - - 0 - - - - - 0 0 5
Pupils with EAL 73 65 58 79 100 57 100 75 63 48 40 52 58 46
Pupils without EAL 62 45 77 43 58 45 19 40 56 35 71 68 49 49
KEY STAGE 2 SUBJECT INFORMATION
Reading Number 45 91 25 59 28 60 28 29 58 42 32 89 586 14581
% At Least Expected 76 59 76 78 64 68 43 59 67 69 50 63 65 59
% Higher Standard 20 15 12 31 18 27 4 7 9 10 9 17 16 14
Writing Number 45 91 25 59 28 60 28 29 58 42 32 89 586 14573
% At Least Expected 73 66 72 59 75 75 93 72 79 86 81 88 76 69
% Higher Standard 0 4 0 3 7 0 7 10 7 2 3 29 8 6
GPS* Number 45 91 25 59 28 60 28 29 58 42 32 89 586 14581
% At Least Expected 91 74 76 86 71 70 68 79 79 71 88 84 79 71
% Higher Standard 24 41 12 37 21 28 7 34 31 12 22 29 28 22
Maths Number 45 91 25 59 28 60 28 29 58 42 32 89 586 14581
% At Least Expected 80 68 92 76 75 78 50 66 79 60 88 85 75 66
% Higher Standard 13 23 16 29 11 17 7 31 19 10 19 21 19 15
*Grammar, Punctuation & Spelling
FA
MIL
Y G
RO
UP
16
Mob
ility
SE
NE
AL
Ave
rage
scal
ed s
core
Ave
rage
Pro
gres
sF
SM
6B
oys
Girl
sE
thni
city
% o
f pup
ils a
t lea
st a
t the
exp
ecte
d st
anda
rd in
Rea
ding
, Writ
ing
and
Mat
hs

PERFORMANCE MAP KEY STAGE 2 - READING
PERFORMANCE MAP KEY STAGE 2 - WRITING
Average attainment and improvement relate to the Birmingham average
3363
3372
2126
3330
3316
3306
2321
3351
5949 3015
3410 2293
-8
-7
-6
-5
-4
-3
-2
-1
0
1
2
3
4
5
6
7
8
9
10
92 93 94 95 96 97 98 99 100 101 102 103 104 105 106 107 108 109 110 111 112
Rea
din
g P
rog
ress
Reading average scaled score
All B'ham Schools
Family 16
Family 16 Average
3363 3372
2126
3330
3316 3306
2321
3351
5949 3015
3410
2293
-9
-8
-7
-6
-5
-4
-3
-2
-1
0
1
2
3
4
5
6
12 17 22 27 32 37 42 47 52 57 62 67 72 77 82 87 92 97
Wri
tin
g P
rog
ress
Writing % at least expected attainment
All B'ham Schools
Family 16
Family 16 Average
Average attainment
Average improvement
Average attainment
Average improvement

PERFORMANCE MAP KEY STAGE 2 - MATHS
TRACKING MAP KEY STAGE 2 - READING, WRITING & MATHS COMBINED
Average attainment and difference relate to the Birmingham average
3363
3372
2126
3330
3316
3306
2321
3351 5949
3015
3410
2293
-7
-6
-5
-4
-3
-2
-1
0
1
2
3
4
5
6
7
96 97 98 99 100 101 102 103 104 105 106 107 108 109 110 111
Mat
hs
Pro
gre
ss
Maths average scaled score
All B'ham Schools
Family 16
Family 16 Average
3363
3372
2126
3330
3316
3306
2321
3351
5949
3015
3410
2293
0
2
4
6
8
10
12
14
16
18
20
22
0 5 10 15 20 25 30 35 40 45 50 55 60 65 70 75 80 85 90 95 100
% D
iffe
ren
ce f
rom
low
est
atta
inin
g s
ub
ject
to
RW
M
Reading, Writing & Maths % at least at expected level
All B'ham Schools
Family 16
Family 16 Average
Average difference
Average attainment
Average improvement
Average attainment
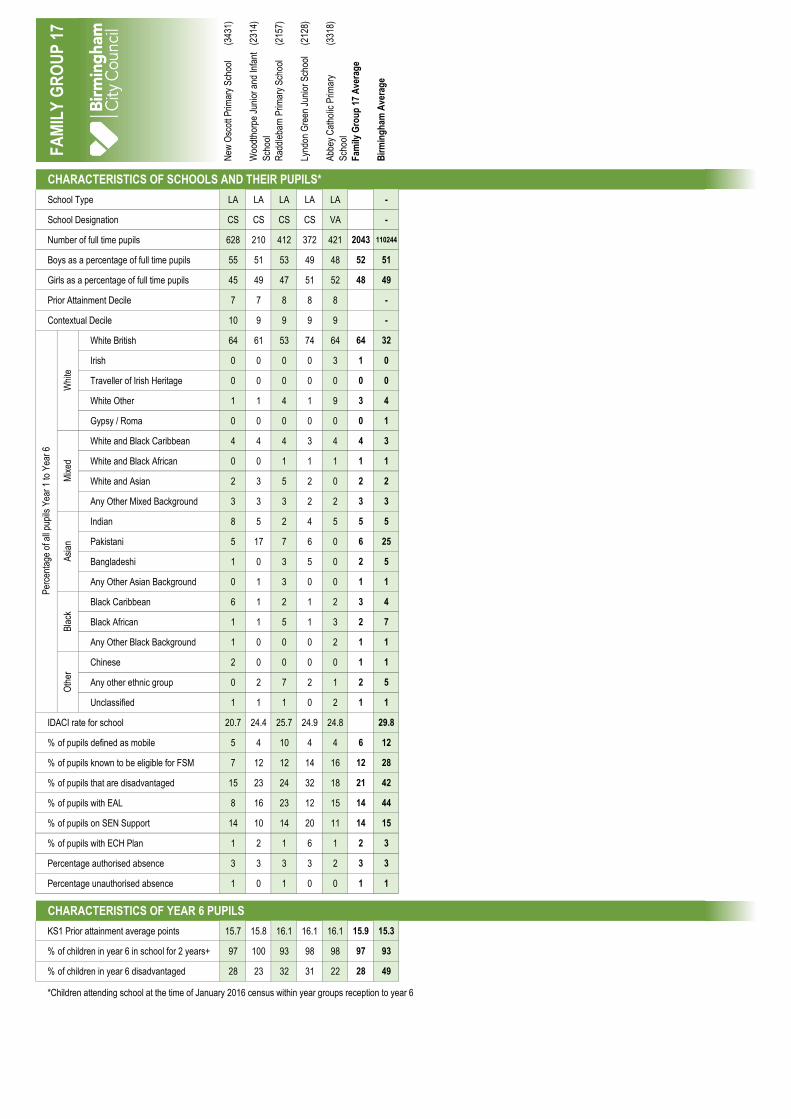
(343
1)
(231
4)
(215
7)
(212
8)
(331
8)
New
Osc
ott P
rimar
y S
choo
l
Woo
dtho
rpe
Juni
or a
nd In
fant
Sch
ool
Rad
dleb
arn
Prim
ary
Sch
ool
Lynd
on G
reen
Jun
ior
Sch
ool
Abb
ey C
atho
lic P
rimar
y
Sch
ool
Fam
ily G
rou
p 1
7 A
vera
ge
Bir
min
gh
am A
vera
ge
CHARACTERISTICS OF SCHOOLS AND THEIR PUPILS*
School Type LA LA LA LA LA -
School Designation CS CS CS CS VA -
Number of full time pupils 628 210 412 372 421 2043 110244
Boys as a percentage of full time pupils 55 51 53 49 48 52 51
Girls as a percentage of full time pupils 45 49 47 51 52 48 49
Prior Attainment Decile 7 7 8 8 8 -
Contextual Decile 10 9 9 9 9 -
White British 64 61 53 74 64 64 32
Irish 0 0 0 0 3 1 0
Traveller of Irish Heritage 0 0 0 0 0 0 0
White Other 1 1 4 1 9 3 4
Gypsy / Roma 0 0 0 0 0 0 1
White and Black Caribbean 4 4 4 3 4 4 3
White and Black African 0 0 1 1 1 1 1
White and Asian 2 3 5 2 0 2 2
Any Other Mixed Background 3 3 3 2 2 3 3
Indian 8 5 2 4 5 5 5
Pakistani 5 17 7 6 0 6 25
Bangladeshi 1 0 3 5 0 2 5
Any Other Asian Background 0 1 3 0 0 1 1
Black Caribbean 6 1 2 1 2 3 4
Black African 1 1 5 1 3 2 7
Any Other Black Background 1 0 0 0 2 1 1
Chinese 2 0 0 0 0 1 1
Any other ethnic group 0 2 7 2 1 2 5
Unclassified 1 1 1 0 2 1 1
IDACI rate for school 20.7 24.4 25.7 24.9 24.8 29.8
% of pupils defined as mobile 5 4 10 4 4 6 12
% of pupils known to be eligible for FSM 7 12 12 14 16 12 28
% of pupils that are disadvantaged 15 23 24 32 18 21 42
% of pupils with EAL 8 16 23 12 15 14 44
% of pupils on SEN Support 14 10 14 20 11 14 15
% of pupils with ECH Plan 1 2 1 6 1 2 3
Percentage authorised absence 3 3 3 3 2 3 3
Percentage unauthorised absence 1 0 1 0 0 1 1
CHARACTERISTICS OF YEAR 6 PUPILS
KS1 Prior attainment average points 15.7 15.8 16.1 16.1 16.1 15.9 15.3
% of children in year 6 in school for 2 years+ 97 100 93 98 98 97 93 #VALUE! #VALUE! #VALUE! #VALUE! #VALUE! #VALUE! #VALUE! #VALUE! #VALUE! #VALUE! #VALUE! #VALUE! #VALUE! #VALUE!
% of children in year 6 disadvantaged 28 23 32 31 22 28 49
*Children attending school at the time of January 2016 census within year groups reception to year 6
FA
MIL
Y G
RO
UP
17
Per
cent
age
of a
ll pu
pils
Yea
r 1
to Y
ear
6
Whi
teM
ixed
Asi
anB
lack
Oth
er

(343
1)
(231
4)
(215
7)
(212
8)
(331
8)
New
Osc
ott P
rimar
y S
choo
l
Woo
dtho
rpe
Juni
or a
nd In
fant
Sch
ool
Rad
dleb
arn
Prim
ary
Sch
ool
Lynd
on G
reen
Jun
ior
Sch
ool
Abb
ey C
atho
lic P
rimar
y
Sch
ool
Fam
ily G
rou
p 1
7 A
vera
ge
Bir
min
gh
am A
vera
ge
ATTAINMENT DATA
Reading 103.4 107.2 105.1 101.0 101.5 103.0 101.2
GPS* 105.3 107.8 105.6 103.4 102.7 104.5 103.9
Maths 103.5 106.8 104.9 101.5 101.4 103.1 102.5
Reading 0.9 2.0 1.0 -2.2 -1.8 -0.4 -1.1
Writing -0.2 -2.8 -2.7 -6.0 -2.3 -2.9 -1.2
Maths 0.8 1.4 0.6 -2.3 -2.3 -0.6 -0.3
Reading, Writing & Maths at least expected 62.2 66.7 67.9 30.9 55.0 53.3 47.4
CONTEXTUAL ATTAINMENT DATA
Disadvantaged 48 57 72 24 31 43 38
Non-Disadvantaged 68 70 66 34 62 57 56
All Boys 52 60 55 33 55 48 43
Disadvantaged Boys 15 50 63 27 0 30 35
Non-Disadvantaged Boys 66 64 52 35 67 54 51
All Girls 74 73 81 28 55 59 52
Disadvantaged Girls 83 67 80 22 44 54 42
Non-Disadvantaged Girls 70 75 82 32 59 61 61
White Pupils 59 67 64 35 62 53 48
Black Pupils 70 - 50 0 44 54 43
Asian Pupils 70 71 92 0 0 58 48
Mixed Pupils 50 50 50 60 33 48 49
Chinese Pupils 100 - - - - 100 75
Other Ethnic Background Pupils - - 0 0 - 0 46
Pupils in school less than 2 years 33 - 100 50 0 60 31
Pupils in school for 2 years+ 63 67 65 30 56 53 49
Pupils with SEN Support 9 33 10 13 0 11 10
Pupils with ECH Plan 25 0 0 0 0 6 5
Pupils with EAL 75 50 86 0 50 50 46
Pupils without EAL 61 68 65 34 55 54 49
KEY STAGE 2 SUBJECT INFORMATION
Reading Number 90 30 56 94 60 330 14581
% At Least Expected 71 77 77 62 70 70 59
% Higher Standard 22 33 30 10 12 19 14
Writing Number 90 30 56 94 60 330 14573
% At Least Expected 79 70 73 49 65 66 69
% Higher Standard 7 7 2 5 13 7 6
GPS* Number 90 30 56 94 60 330 14581
% At Least Expected 80 80 77 71 75 76 71
% Higher Standard 32 40 32 16 17 25 22
Maths Number 90 30 56 94 60 330 14581
% At Least Expected 77 77 88 61 67 72 66
% Higher Standard 20 30 16 10 8 15 15
*Grammar, Punctuation & Spelling
FA
MIL
Y G
RO
UP
17
Mob
ility
SE
NE
AL
Ave
rage
scal
ed s
core
Ave
rage
Pro
gres
sF
SM
6B
oys
Girl
sE
thni
city
% o
f pup
ils a
t lea
st a
t the
exp
ecte
d st
anda
rd in
Rea
ding
, Writ
ing
and
Mat
hs
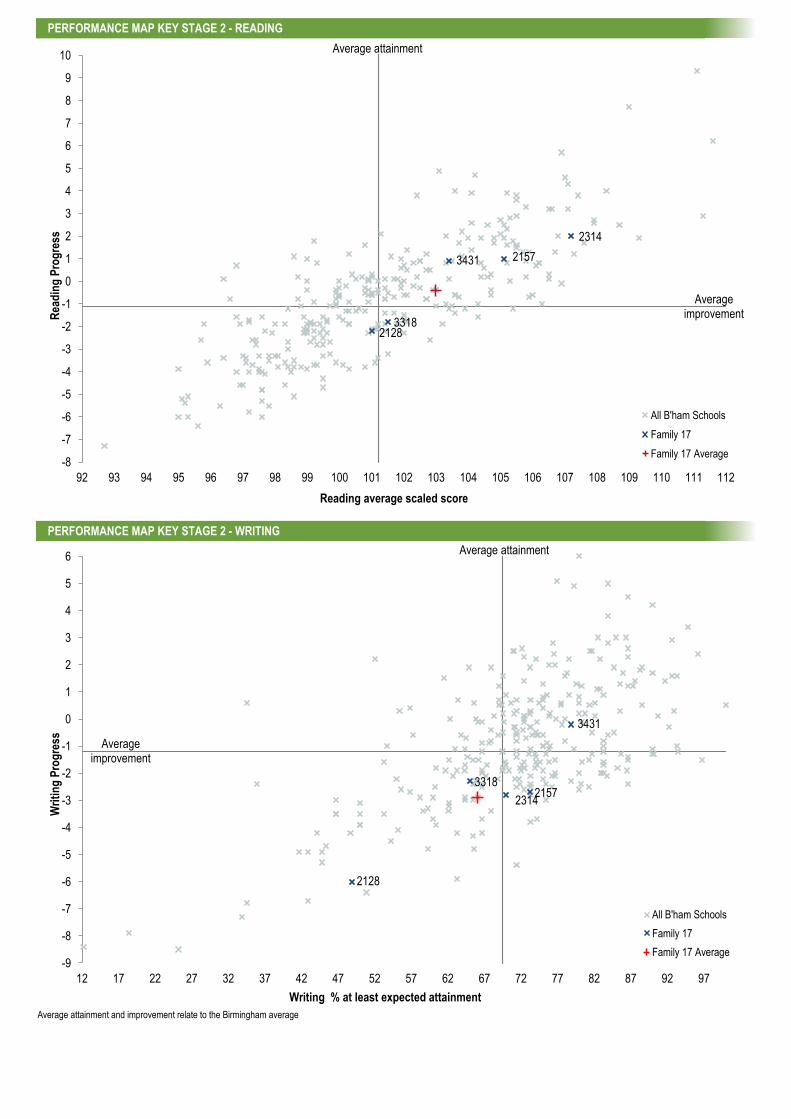
PERFORMANCE MAP KEY STAGE 2 - READING
PERFORMANCE MAP KEY STAGE 2 - WRITING
Average attainment and improvement relate to the Birmingham average
3431
2314
2157
2128 3318
-8
-7
-6
-5
-4
-3
-2
-1
0
1
2
3
4
5
6
7
8
9
10
92 93 94 95 96 97 98 99 100 101 102 103 104 105 106 107 108 109 110 111 112
Rea
din
g P
rog
ress
Reading average scaled score
All B'ham Schools
Family 17
Family 17 Average
3431
2314 2157
2128
3318
-9
-8
-7
-6
-5
-4
-3
-2
-1
0
1
2
3
4
5
6
12 17 22 27 32 37 42 47 52 57 62 67 72 77 82 87 92 97
Wri
tin
g P
rog
ress
Writing % at least expected attainment
All B'ham Schools
Family 17
Family 17 Average
Average attainment
Average improvement
Average attainment
Average improvement
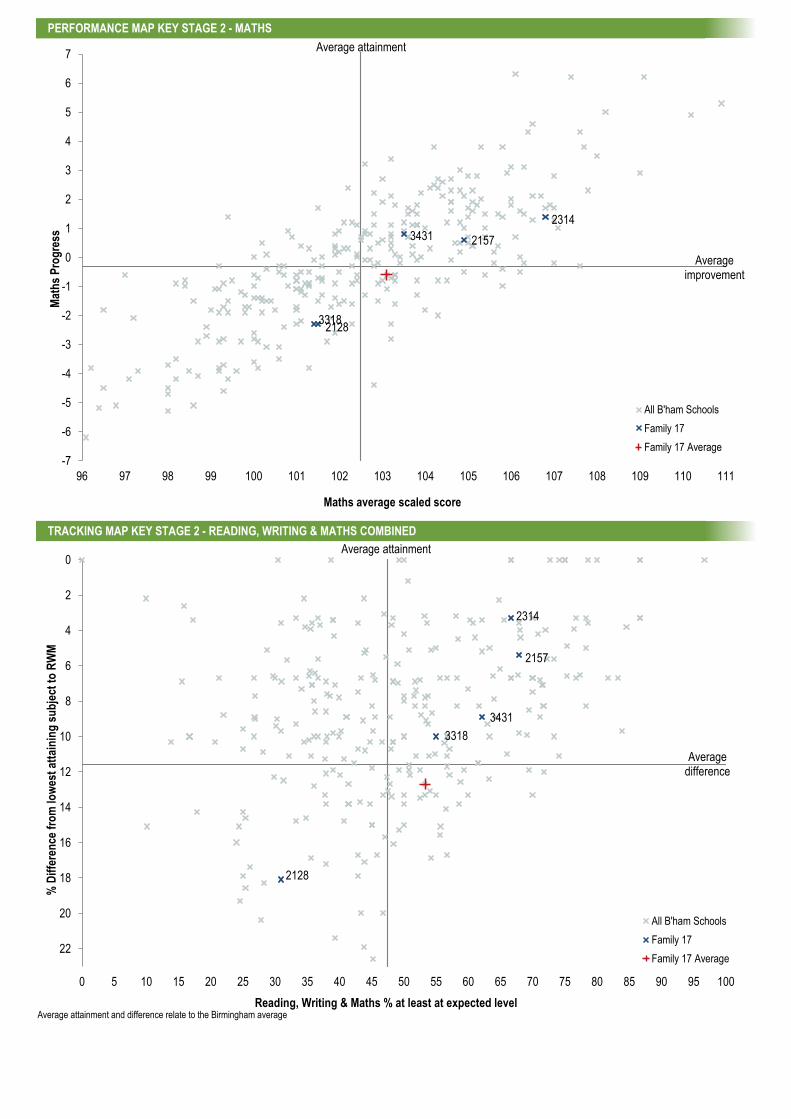
PERFORMANCE MAP KEY STAGE 2 - MATHS
TRACKING MAP KEY STAGE 2 - READING, WRITING & MATHS COMBINED
Average attainment and difference relate to the Birmingham average
3431
2314
2157
2128 3318
-7
-6
-5
-4
-3
-2
-1
0
1
2
3
4
5
6
7
96 97 98 99 100 101 102 103 104 105 106 107 108 109 110 111
Mat
hs
Pro
gre
ss
Maths average scaled score
All B'ham Schools
Family 17
Family 17 Average
3431
2314
2157
2128
3318
0
2
4
6
8
10
12
14
16
18
20
22
0 5 10 15 20 25 30 35 40 45 50 55 60 65 70 75 80 85 90 95 100
% D
iffe
ren
ce f
rom
low
est
atta
inin
g s
ub
ject
to
RW
M
Reading, Writing & Maths % at least at expected level
All B'ham Schools
Family 17
Family 17 Average
Average difference
Average attainment
Average improvement
Average attainment
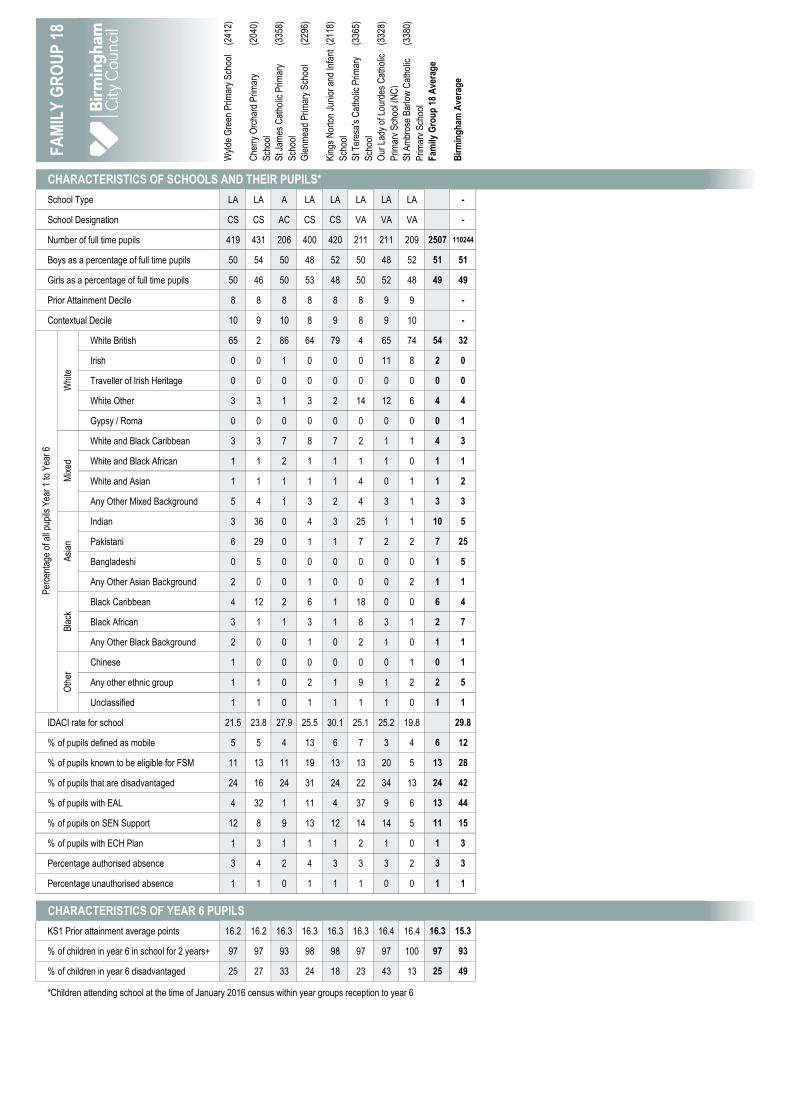
(241
2)
(204
0)
(335
8)
(229
6)
(211
8)
(336
5)
(332
8)
(338
0)
Wyl
de G
reen
Prim
ary
Sch
ool
Che
rry
Orc
hard
Prim
ary
Sch
ool
St J
ames
Cat
holic
Prim
ary
Sch
ool
Gle
nmea
d P
rimar
y S
choo
l
Kin
gs N
orto
n Ju
nior
and
Infa
nt
Sch
ool
St T
eres
a's
Cat
holic
Prim
ary
Sch
ool
Our
Lad
y of
Lou
rdes
Cat
holic
Prim
ary
Sch
ool (
NC
)
St A
mbr
ose
Bar
low
Cat
holic
Prim
ary
Sch
ool
Fam
ily G
rou
p 1
8 A
vera
ge
Bir
min
gh
am A
vera
ge
CHARACTERISTICS OF SCHOOLS AND THEIR PUPILS*
School Type LA LA A LA LA LA LA LA -
School Designation CS CS AC CS CS VA VA VA -
Number of full time pupils 419 431 206 400 420 211 211 209 2507 110244
Boys as a percentage of full time pupils 50 54 50 48 52 50 48 52 51 51
Girls as a percentage of full time pupils 50 46 50 53 48 50 52 48 49 49
Prior Attainment Decile 8 8 8 8 8 8 9 9 -
Contextual Decile 10 9 10 8 9 8 9 10 -
White British 65 2 86 64 79 4 65 74 54 32
Irish 0 0 1 0 0 0 11 8 2 0
Traveller of Irish Heritage 0 0 0 0 0 0 0 0 0 0
White Other 3 3 1 3 2 14 12 6 4 4
Gypsy / Roma 0 0 0 0 0 0 0 0 0 1
White and Black Caribbean 3 3 7 8 7 2 1 1 4 3
White and Black African 1 1 2 1 1 1 1 0 1 1
White and Asian 1 1 1 1 1 4 0 1 1 2
Any Other Mixed Background 5 4 1 3 2 4 3 1 3 3
Indian 3 36 0 4 3 25 1 1 10 5
Pakistani 6 29 0 1 1 7 2 2 7 25
Bangladeshi 0 5 0 0 0 0 0 0 1 5
Any Other Asian Background 2 0 0 1 0 0 0 2 1 1
Black Caribbean 4 12 2 6 1 18 0 0 6 4
Black African 3 1 1 3 1 8 3 1 2 7
Any Other Black Background 2 0 0 1 0 2 1 0 1 1
Chinese 1 0 0 0 0 0 0 1 0 1
Any other ethnic group 1 1 0 2 1 9 1 2 2 5
Unclassified 1 1 0 1 1 1 1 0 1 1
IDACI rate for school 21.5 23.8 27.9 25.5 30.1 25.1 25.2 19.8 29.8
% of pupils defined as mobile 5 5 4 13 6 7 3 4 6 12
% of pupils known to be eligible for FSM 11 13 11 19 13 13 20 5 13 28
% of pupils that are disadvantaged 24 16 24 31 24 22 34 13 24 42
% of pupils with EAL 4 32 1 11 4 37 9 6 13 44
% of pupils on SEN Support 12 8 9 13 12 14 14 5 11 15
% of pupils with ECH Plan 1 3 1 1 1 2 1 0 1 3
Percentage authorised absence 3 4 2 4 3 3 3 2 3 3
Percentage unauthorised absence 1 1 0 1 1 1 0 0 1 1
CHARACTERISTICS OF YEAR 6 PUPILS
KS1 Prior attainment average points 16.2 16.2 16.3 16.3 16.3 16.3 16.4 16.4 16.3 15.3
% of children in year 6 in school for 2 years+ 97 97 93 98 98 97 97 100 97 93 #VALUE! #VALUE! #VALUE! #VALUE! #VALUE! #VALUE! #VALUE! #VALUE! #VALUE! #VALUE! #VALUE!
% of children in year 6 disadvantaged 25 27 33 24 18 23 43 13 25 49
*Children attending school at the time of January 2016 census within year groups reception to year 6
FA
MIL
Y G
RO
UP
18
Per
cent
age
of a
ll pu
pils
Yea
r 1
to Y
ear
6
Whi
teM
ixed
Asi
anB
lack
Oth
er

(241
2)
(204
0)
(335
8)
(229
6)
(211
8)
(336
5)
(332
8)
(338
0)
Wyl
de G
reen
Prim
ary
Sch
ool
Che
rry
Orc
hard
Prim
ary
Sch
ool
St J
ames
Cat
holic
Prim
ary
Sch
ool
Gle
nmea
d P
rimar
y S
choo
l
Kin
gs N
orto
n Ju
nior
and
Infa
nt
Sch
ool
St T
eres
a's
Cat
holic
Prim
ary
Sch
ool
Our
Lad
y of
Lou
rdes
Cat
holic
Prim
ary
Sch
ool (
NC
)
St A
mbr
ose
Bar
low
Cat
holic
Prim
ary
Sch
ool
Fam
ily G
rou
p 1
8 A
vera
ge
Bir
min
gh
am A
vera
ge
ATTAINMENT DATA
Reading 105.1 102.7 105.0 99.7 102.7 103.0 101.5 105.2 102.9 101.2
GPS* 106.8 106.3 104.9 102.8 104.4 106.0 103.6 103.4 104.9 103.9
Maths 105.1 104.9 105.2 101.1 102.9 102.3 102.3 103.0 103.4 102.5
Reading 2.5 -0.8 2.1 -3.2 -0.8 -0.4 -3.2 1.6 -0.4 -1.1
Writing 0.5 -2.1 1.6 -4.5 -3.0 -2.5 -5.9 -1.5 -2.2 -1.2
Maths 1.9 1.0 1.8 -2.2 -0.9 -1.6 -2.3 -0.8 -0.2 -0.3
Reading, Writing & Maths at least expected 69.5 63.3 83.3 35.6 52.5 46.7 40.0 56.7 55.7 47.4
CONTEXTUAL ATTAINMENT DATA
Disadvantaged 67 56 50 21 36 29 38 75 46 38
Non-Disadvantaged 70 66 100 40 56 52 41 54 59 56
All Boys 59 53 71 40 57 31 38 44 50 43
Disadvantaged Boys 50 43 43 33 33 33 43 100 43 35
Non-Disadvantaged Boys 62 57 100 43 60 30 33 36 52 51
All Girls 80 73 94 31 50 59 43 71 61 52
Disadvantaged Girls 86 67 67 0 38 25 33 50 48 42
Non-Disadvantaged Girls 78 76 100 38 54 69 50 75 65 61
White Pupils 76 50 88 33 53 75 36 56 57 48
Black Pupils 33 22 50 33 50 38 50 100 36 43
Asian Pupils 60 69 - 60 75 47 0 50 62 48
Mixed Pupils 60 83 67 50 43 - 100 - 61 49
Chinese Pupils - - - - - - - - - 75
Other Ethnic Background Pupils 100 - - 0 0 0 - - 20 46
Pupils in school less than 2 years 50 50 50 0 100 0 0 - 40 31
Pupils in school for 2 years+ 70 64 86 36 52 48 41 57 56 49
Pupils with SEN Support 0 14 25 13 0 0 0 0 7 10
Pupils with ECH Plan 0 - - 0 0 - - - 0 5
Pupils with EAL 0 62 50 20 67 38 20 100 48 46
Pupils without EAL 71 64 86 37 52 53 44 54 57 49
KEY STAGE 2 SUBJECT INFORMATION
Reading Number 59 60 30 59 59 30 30 30 357 14581
% At Least Expected 78 68 90 53 78 77 50 80 71 59
% Higher Standard 32 17 17 8 12 10 13 30 17 14
Writing Number 59 60 30 59 59 30 30 30 357 14573
% At Least Expected 81 77 93 54 64 73 63 77 72 69
% Higher Standard 14 5 13 2 7 3 0 7 6 6
GPS* Number 59 60 30 59 59 30 30 30 357 14581
% At Least Expected 86 87 80 75 83 87 70 83 82 71
% Higher Standard 41 30 17 17 19 27 17 13 24 22
Maths Number 59 60 30 59 59 30 30 30 357 14581
% At Least Expected 88 82 93 64 68 67 63 73 75 66
% Higher Standard 22 22 17 8 15 10 10 13 15 15
*Grammar, Punctuation & Spelling
FA
MIL
Y G
RO
UP
18
Mob
ility
SE
NE
AL
Ave
rage
scal
ed s
core
Ave
rage
Pro
gres
sF
SM
6B
oys
Girl
sE
thni
city
% o
f pup
ils a
t lea
st a
t the
exp
ecte
d st
anda
rd in
Rea
ding
, Writ
ing
and
Mat
hs
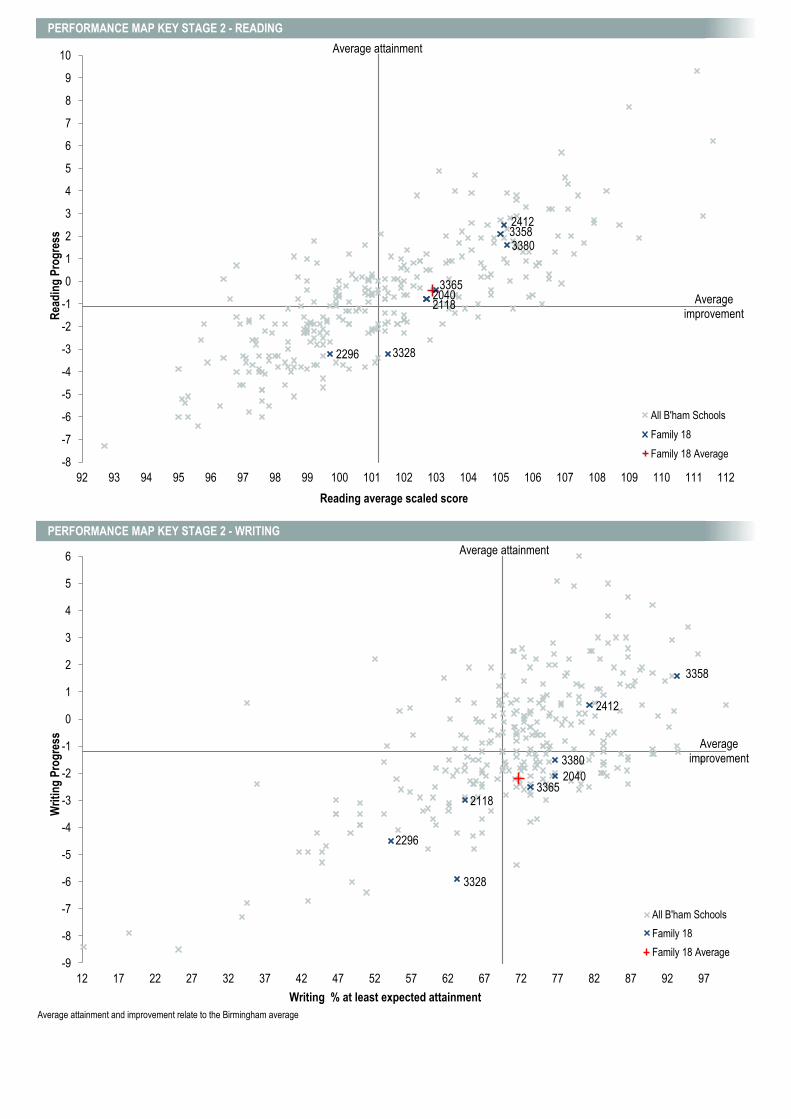
PERFORMANCE MAP KEY STAGE 2 - READING
PERFORMANCE MAP KEY STAGE 2 - WRITING
Average attainment and improvement relate to the Birmingham average
2412
2040
3358
2296
2118
3365
3328
3380
-8
-7
-6
-5
-4
-3
-2
-1
0
1
2
3
4
5
6
7
8
9
10
92 93 94 95 96 97 98 99 100 101 102 103 104 105 106 107 108 109 110 111 112
Rea
din
g P
rog
ress
Reading average scaled score
All B'ham Schools
Family 18
Family 18 Average
2412
2040
3358
2296
2118 3365
3328
3380
-9
-8
-7
-6
-5
-4
-3
-2
-1
0
1
2
3
4
5
6
12 17 22 27 32 37 42 47 52 57 62 67 72 77 82 87 92 97
Wri
tin
g P
rog
ress
Writing % at least expected attainment
All B'ham Schools
Family 18
Family 18 Average
Average attainment
Average improvement
Average attainment
Average improvement
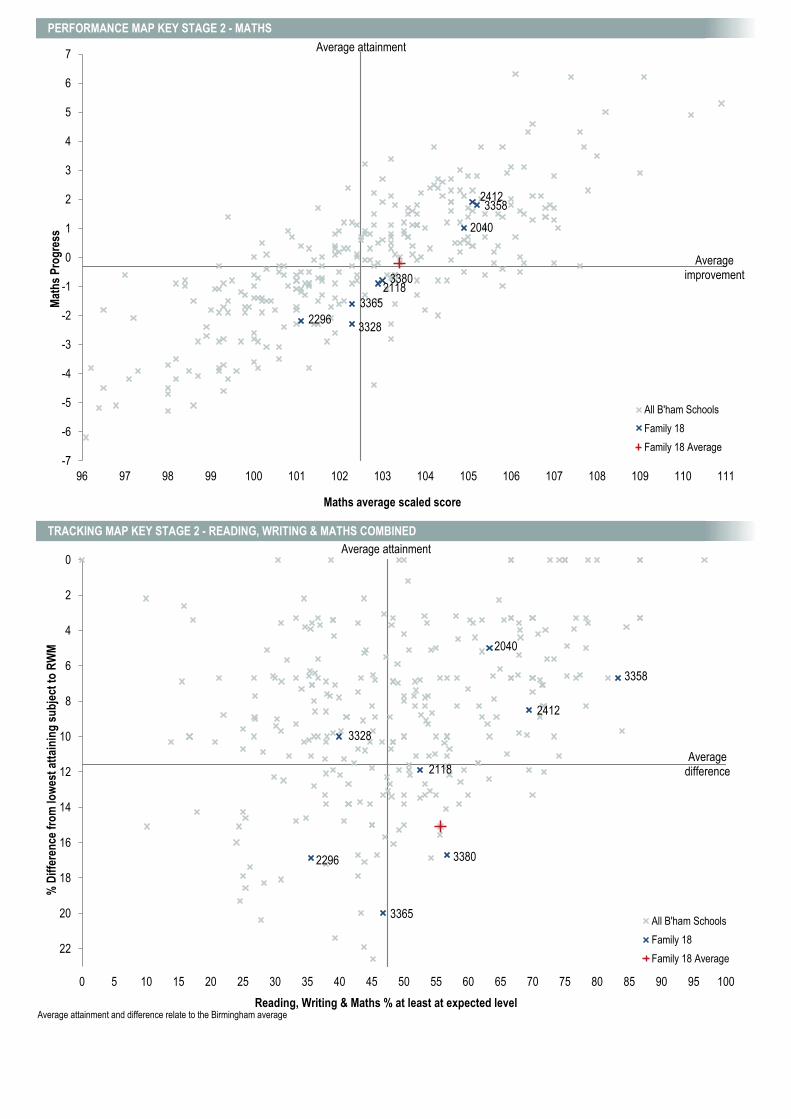
PERFORMANCE MAP KEY STAGE 2 - MATHS
TRACKING MAP KEY STAGE 2 - READING, WRITING & MATHS COMBINED
Average attainment and difference relate to the Birmingham average
2412
2040
3358
2296
2118
3365
3328
3380
-7
-6
-5
-4
-3
-2
-1
0
1
2
3
4
5
6
7
96 97 98 99 100 101 102 103 104 105 106 107 108 109 110 111
Mat
hs
Pro
gre
ss
Maths average scaled score
All B'ham Schools
Family 18
Family 18 Average
2412
2040
3358
2296
2118
3365
3328
3380
0
2
4
6
8
10
12
14
16
18
20
22
0 5 10 15 20 25 30 35 40 45 50 55 60 65 70 75 80 85 90 95 100
% D
iffe
ren
ce f
rom
low
est
atta
inin
g s
ub
ject
to
RW
M
Reading, Writing & Maths % at least at expected level
All B'ham Schools
Family 18
Family 18 Average
Average difference
Average attainment
Average improvement
Average attainment

(247
7)
(330
2)
(201
1)
(338
5)
(229
5)
(208
5)
(342
8)
(334
9)
(331
1)
(205
5)
(209
2)
(336
0)
(222
5)
(245
1)
(433
4)
Har
born
e P
rimar
y S
choo
l
Sai
nt B
arna
bas
Chu
rch
of
Eng
land
Prim
ary
Sch
ool
Whe
eler
s La
ne P
rimar
y
Sch
ool
St P
eter
's C
atho
lic P
rimar
y
Sch
ool
Bro
okva
le P
rimar
y S
choo
l
Gre
enho
lm P
rimar
y S
choo
l
St P
eter
s C
ofE
Prim
ary
Sch
ool
St T
hom
as M
ore
Cat
holic
Prim
ary
Sch
ool
St M
icha
el's
Chu
rch
of
Eng
land
Aid
ed P
rimar
y S
choo
l
Cot
terid
ge P
rimar
y S
choo
l
Hal
l Gre
en J
unio
r S
choo
l
St J
ohn
Fis
her
Cat
holic
Prim
ary
Sch
ool
Wor
ld's
End
Jun
ior
Sch
ool
Gre
en M
eado
w P
rimar
y
Sch
ool
Al-H
ijrah
Sch
ool
Fam
ily G
rou
p 1
9 A
vera
ge
Bir
min
gh
am A
vera
ge
CHARACTERISTICS OF SCHOOLS AND THEIR PUPILS*
School Type LA LA LA LA A A LA LA A LA LA LA LA A LA -
School Designation CS VA CS VA AC AC VC VA AC CS CS VA CS AC VA -
Number of full time pupils 627 330 628 208 212 488 414 352 350 407 450 209 317 422 419 5833 110244
Boys as a percentage of full time pupils 53 52 55 48 45 50 52 51 55 47 55 49 48 51 51 51 51
Girls as a percentage of full time pupils 47 48 45 52 55 50 48 49 45 53 45 51 52 49 49 49 49
Prior Attainment Decile 9 9 9 9 9 9 9 9 9 9 9 10 10 10 10 -
Contextual Decile 9 8 8 9 8 9 9 9 8 8 9 9 7 8 5 -
White British 42 36 42 60 26 50 46 78 63 65 7 82 47 67 0 45 32
Irish 1 0 0 1 0 0 0 1 0 0 0 1 0 1 0 0 0
Traveller of Irish Heritage 0 0 0 0 0 0 0 1 0 0 0 0 0 0 0 0 0
White Other 2 3 2 3 3 3 5 5 2 3 1 1 5 1 1 2 4
Gypsy / Roma 0 0 0 0 0 0 0 0 0 0 0 0 0 0 0 0 1
White and Black Caribbean 3 10 4 6 7 4 2 4 9 8 1 4 8 5 0 5 3
White and Black African 1 3 0 1 0 1 1 0 2 1 0 1 1 1 0 1 1
White and Asian 5 4 5 1 1 3 4 0 0 2 3 1 5 1 0 3 2
Any Other Mixed Background 6 2 3 3 7 3 4 0 3 3 2 3 4 4 2 3 3
Indian 14 2 5 2 6 8 9 3 1 2 16 2 4 3 4 6 5
Pakistani 7 11 27 0 23 8 4 1 1 1 54 0 5 0 62 16 25
Bangladeshi 0 1 2 0 2 3 0 0 0 1 4 0 0 0 9 2 5
Any Other Asian Background 1 1 0 2 3 1 3 0 1 1 5 0 1 1 0 1 1
Black Caribbean 3 12 2 3 10 13 5 0 4 3 0 0 3 3 0 4 4
Black African 2 7 2 7 6 2 7 3 9 6 1 3 5 4 17 5 7
Any Other Black Background 1 1 0 1 1 1 1 1 2 0 0 1 2 1 0 1 1
Chinese 4 3 1 0 1 1 3 0 0 0 1 1 2 3 0 1 1
Any other ethnic group 6 1 4 12 1 1 6 3 2 3 2 2 7 2 5 4 5
Unclassified 1 1 0 0 3 2 1 0 1 1 1 1 1 3 1 1 1
IDACI rate for school 22.4 26.7 27.1 30.4 28.2 26.4 24.0 26.6 30.1 29.7 24.6 29.0 27.8 32.1 30.3 29.8
% of pupils defined as mobile 7 12 6 4 9 6 6 4 9 11 2 4 9 5 5 7 12
% of pupils known to be eligible for FSM 8 16 19 13 19 16 13 14 30 20 11 10 31 23 18 17 28
% of pupils that are disadvantaged 13 26 31 29 30 33 23 27 42 36 27 21 53 41 32 30 42
% of pupils with EAL 24 19 29 26 19 17 27 8 11 10 28 3 21 9 93 24 44
% of pupils on SEN Support 10 12 12 26 9 7 18 14 21 20 7 11 12 12 5 12 15
% of pupils with ECH Plan 1 1 0 1 1 1 2 0 1 1 1 1 2 1 1 1 3
Percentage authorised absence 2 3 3 3 3 3 2 3 3 3 3 3 3 3 4 3 3
Percentage unauthorised absence 1 1 1 1 1 1 1 2 1 1 0 0 1 0 1 1 1
CHARACTERISTICS OF YEAR 6 PUPILS
KS1 Prior attainment average points 16.5 16.5 16.6 16.6 16.6 16.6 16.7 16.8 16.8 16.9 16.9 17.0 17.1 17.2 17.3 16.8 15.3
% of children in year 6 in school for 2 years+ 91 100 92 96 90 100 95 100 85 88 98 100 93 97 97 95 93 #VALUE! #VALUE! #VALUE! #VALUE!
% of children in year 6 disadvantaged 13 10 44 39 43 26 27 29 52 29 29 40 57 48 35 34 49
*Children attending school at the time of January 2016 census within year groups reception to year 6
FA
MIL
Y G
RO
UP
19
Per
cent
age
of a
ll pu
pils
Yea
r 1
to Y
ear
6
Whi
teM
ixed
Asi
anB
lack
Oth
er

(247
7)
(330
2)
(201
1)
(338
5)
(229
5)
(208
5)
(342
8)
(334
9)
(331
1)
(205
5)
(209
2)
(336
0)
(222
5)
(245
1)
(433
4)
Har
born
e P
rimar
y S
choo
l
Sai
nt B
arna
bas
Chu
rch
of
Eng
land
Prim
ary
Sch
ool
Whe
eler
s La
ne P
rimar
y
Sch
ool
St P
eter
's C
atho
lic P
rimar
y
Sch
ool
Bro
okva
le P
rimar
y S
choo
l
Gre
enho
lm P
rimar
y S
choo
l
St P
eter
s C
ofE
Prim
ary
Sch
ool
St T
hom
as M
ore
Cat
holic
Prim
ary
Sch
ool
St M
icha
el's
Chu
rch
of
Eng
land
Aid
ed P
rimar
y S
choo
l
Cot
terid
ge P
rimar
y S
choo
l
Hal
l Gre
en J
unio
r S
choo
l
St J
ohn
Fis
her
Cat
holic
Prim
ary
Sch
ool
Wor
ld's
End
Jun
ior
Sch
ool
Gre
en M
eado
w P
rimar
y
Sch
ool
Al-H
ijrah
Sch
ool
Fam
ily G
rou
p 1
9 A
vera
ge
Bir
min
gh
am A
vera
ge
ATTAINMENT DATA
Reading 105.4 102.1 106.8 97.6 103.6 105.5 105.9 104.7 102.8 105.7 105.2 108.3 103.5 103.9 103.6 104.7 101.2
GPS* 107.1 103.1 107.6 102.5 105.8 109.0 108.4 106.9 105.0 107.1 106.0 107.5 106.0 107.7 106.4 106.8 103.9
Maths 105.4 103.7 106.0 101.8 104.8 105.7 104.6 103.2 102.8 106.3 106.2 108.0 103.8 105.6 104.3 105.1 102.5
Reading 1.8 -1.8 2.0 -6.0 -0.6 1.5 1.3 -0.6 -2.6 1.3 0.8 4.0 -1.1 -1.2 -1.4 0.3 -1.1
Writing -3.2 -3.7 -2.4 -3.4 -2.0 0.5 -1.2 -5.4 -0.5 -0.3 -2.3 1.7 -1.0 -4.2 -2.6 -2.1 -1.2
Maths 1.0 0.1 2.0 -2.1 0.2 1.5 -0.1 -2.3 -4.4 1.5 1.6 3.5 -0.8 -0.2 -0.8 0.4 -0.3
Reading, Writing & Maths at least expected 55.6 50.0 64.0 35.7 63.3 75.4 58.3 57.1 51.9 76.5 73.3 86.7 63.0 58.3 61.7 63.2 47.4
CONTEXTUAL ATTAINMENT DATA
Disadvantaged 42 67 49 36 46 63 63 50 29 73 65 75 52 48 76 55 38
Non-Disadvantaged 58 48 76 35 76 80 57 60 77 78 77 94 78 68 54 67 56
All Boys 48 50 64 31 54 69 63 58 43 72 69 80 54 48 55 58 43
Disadvantaged Boys 56 100 53 20 43 50 67 50 14 50 53 60 48 30 85 51 35
Non-Disadvantaged Boys 46 47 70 38 67 75 61 60 71 79 75 90 71 59 31 62 51
All Girls 64 50 64 40 71 83 55 57 62 79 79 93 73 67 68 68 52
Disadvantaged Girls 0 50 45 50 50 75 57 50 43 82 82 86 60 58 63 59 42
Non-Disadvantaged Girls 68 50 85 33 82 86 54 60 83 77 79 100 81 79 70 72 61
White Pupils 62 56 77 37 56 69 57 50 41 75 82 83 62 64 - 63 48
Black Pupils 50 50 50 33 50 75 50 100 50 40 50 100 50 33 100 59 43
Asian Pupils 54 33 60 100 82 90 64 100 100 100 73 - 40 75 58 66 48
Mixed Pupils 56 63 44 50 75 83 40 67 67 86 100 100 64 38 0 60 49
Chinese Pupils 50 0 - - - - 100 - - 100 - - 100 67 - 67 75
Other Ethnic Background Pupils 50 - 67 0 - - 75 - - - 100 100 80 0 100 62 46
Pupils in school less than 2 years 63 - 71 0 33 - 67 - 50 100 100 - 50 0 100 64 31
Pupils in school for 2 years+ 55 50 63 37 67 75 58 57 52 73 73 87 64 60 60 63 49
Pupils with SEN Support 7 0 0 33 50 0 8 0 0 20 0 0 18 0 0 9 10
Pupils with ECH Plan 0 - 100 0 0 - 0 - 0 - 0 100 67 0 - 31 5
Pupils with EAL 63 0 59 43 67 83 85 33 50 100 72 100 56 50 62 64 46
Pupils without EAL 54 54 67 33 63 75 51 59 52 73 74 86 64 60 60 63 49
KEY STAGE 2 SUBJECT INFORMATION
Reading Number 90 30 89 28 30 61 60 49 27 51 90 30 54 60 60 809 14581
% At Least Expected 74 67 81 39 73 82 78 73 67 80 84 97 72 68 70 76 59
% Higher Standard 37 7 30 0 20 21 30 18 19 29 29 50 17 22 22 25 14
Writing Number 90 30 89 28 30 61 60 49 27 51 90 30 54 60 60 809 14573
% At Least Expected 62 60 72 68 77 89 83 71 74 92 79 90 83 67 80 76 69
% Higher Standard 10 3 3 0 3 11 5 0 22 10 2 27 13 0 2 7 6
GPS* Number 90 30 89 28 30 61 60 49 27 51 90 30 54 60 60 809 14581
% At Least Expected 86 77 88 68 83 97 93 82 78 88 83 93 87 85 80 86 71
% Higher Standard 42 10 43 7 20 46 42 35 33 35 34 27 28 38 32 35 22
Maths Number 90 30 89 28 30 61 60 49 27 51 90 30 54 60 60 809 14581
% At Least Expected 73 80 83 71 83 93 65 69 63 90 84 97 76 80 78 79 66
% Higher Standard 33 17 36 4 20 11 33 10 11 29 36 40 19 22 20 25 15
*Grammar, Punctuation & Spelling
FA
MIL
Y G
RO
UP
19
Mob
ility
SE
NE
AL
Ave
rage
scal
ed s
core
Ave
rage
Pro
gres
sF
SM
6B
oys
Girl
sE
thni
city
% o
f pup
ils a
t lea
st a
t the
exp
ecte
d st
anda
rd in
Rea
ding
, Writ
ing
and
Mat
hs

PERFORMANCE MAP KEY STAGE 2 - READING
PERFORMANCE MAP KEY STAGE 2 - WRITING
Average attainment and improvement relate to the Birmingham average
2477
3302
2011
3385
2295
2085 3428
3349
3311
2055 2092
3360
2225 2451 4334
-8
-7
-6
-5
-4
-3
-2
-1
0
1
2
3
4
5
6
7
8
9
10
92 93 94 95 96 97 98 99 100 101 102 103 104 105 106 107 108 109 110 111 112
Rea
din
g P
rog
ress
Reading average scaled score
All B'ham Schools
Family 19
Family 19 Average
2477 3302
2011
3385
2295
2085
3428
3349
3311 2055
2092
3360
2225
2451
4334
-9
-8
-7
-6
-5
-4
-3
-2
-1
0
1
2
3
4
5
6
12 17 22 27 32 37 42 47 52 57 62 67 72 77 82 87 92 97
Wri
tin
g P
rog
ress
Writing % at least expected attainment
All B'ham Schools
Family 19
Family 19 Average
Average attainment
Average improvement
Average attainment
Average improvement

PERFORMANCE MAP KEY STAGE 2 - MATHS
TRACKING MAP KEY STAGE 2 - READING, WRITING & MATHS COMBINED
Average attainment and difference relate to the Birmingham average
2477
3302
2011
3385
2295
2085
3428
3349
3311
2055 2092
3360
2225 2451
4334
-7
-6
-5
-4
-3
-2
-1
0
1
2
3
4
5
6
7
96 97 98 99 100 101 102 103 104 105 106 107 108 109 110 111
Mat
hs
Pro
gre
ss
Maths average scaled score
All B'ham Schools
Family 19
Family 19 Average
2477
3302
2011
3385
2295
2085 3428
3349
3311
2055
2092
3360
2225
2451 2451
0
2
4
6
8
10
12
14
16
18
20
22
0 5 10 15 20 25 30 35 40 45 50 55 60 65 70 75 80 85 90 95 100
% D
iffe
ren
ce f
rom
low
est
atta
inin
g s
ub
ject
to
RW
M
Reading, Writing & Maths % at least at expected level
All B'ham Schools
Family 19
Family 19 Average
Average difference
Average attainment
Average improvement
Average attainment
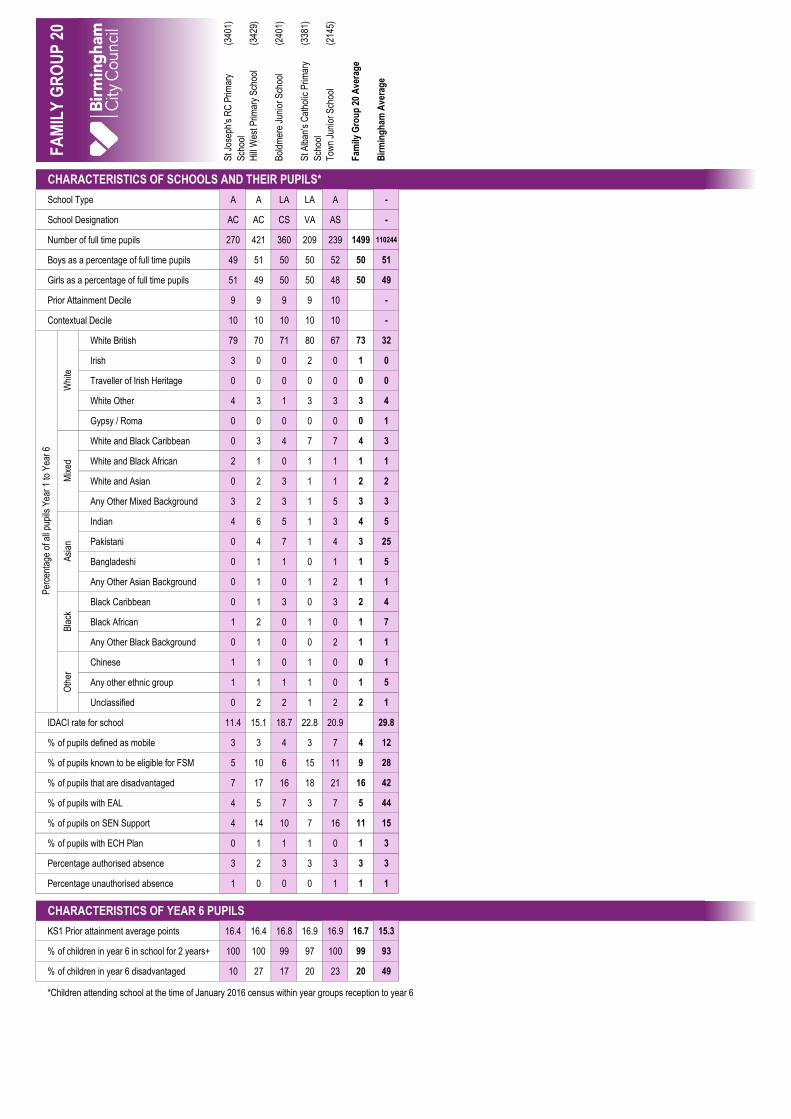
(340
1)
(342
9)
(240
1)
(338
1)
(214
5)
St J
osep
h's
RC
Prim
ary
Sch
ool
Hill
Wes
t Prim
ary
Sch
ool
Bol
dmer
e Ju
nior
Sch
ool
St A
lban
's C
atho
lic P
rimar
y
Sch
ool
Tow
n Ju
nior
Sch
ool
Fam
ily G
rou
p 2
0 A
vera
ge
Bir
min
gh
am A
vera
ge
CHARACTERISTICS OF SCHOOLS AND THEIR PUPILS*
School Type A A LA LA A -
School Designation AC AC CS VA AS -
Number of full time pupils 270 421 360 209 239 1499 110244
Boys as a percentage of full time pupils 49 51 50 50 52 50 51
Girls as a percentage of full time pupils 51 49 50 50 48 50 49
Prior Attainment Decile 9 9 9 9 10 -
Contextual Decile 10 10 10 10 10 -
White British 79 70 71 80 67 73 32
Irish 3 0 0 2 0 1 0
Traveller of Irish Heritage 0 0 0 0 0 0 0
White Other 4 3 1 3 3 3 4
Gypsy / Roma 0 0 0 0 0 0 1
White and Black Caribbean 0 3 4 7 7 4 3
White and Black African 2 1 0 1 1 1 1
White and Asian 0 2 3 1 1 2 2
Any Other Mixed Background 3 2 3 1 5 3 3
Indian 4 6 5 1 3 4 5
Pakistani 0 4 7 1 4 3 25
Bangladeshi 0 1 1 0 1 1 5
Any Other Asian Background 0 1 0 1 2 1 1
Black Caribbean 0 1 3 0 3 2 4
Black African 1 2 0 1 0 1 7
Any Other Black Background 0 1 0 0 2 1 1
Chinese 1 1 0 1 0 0 1
Any other ethnic group 1 1 1 1 0 1 5
Unclassified 0 2 2 1 2 2 1
IDACI rate for school 11.4 15.1 18.7 22.8 20.9 29.8
% of pupils defined as mobile 3 3 4 3 7 4 12
% of pupils known to be eligible for FSM 5 10 6 15 11 9 28
% of pupils that are disadvantaged 7 17 16 18 21 16 42
% of pupils with EAL 4 5 7 3 7 5 44
% of pupils on SEN Support 4 14 10 7 16 11 15
% of pupils with ECH Plan 0 1 1 1 0 1 3
Percentage authorised absence 3 2 3 3 3 3 3
Percentage unauthorised absence 1 0 0 0 1 1 1
CHARACTERISTICS OF YEAR 6 PUPILS
KS1 Prior attainment average points 16.4 16.4 16.8 16.9 16.9 16.7 15.3
% of children in year 6 in school for 2 years+ 100 100 99 97 100 99 93 #VALUE! #VALUE! #VALUE! #VALUE! #VALUE! #VALUE! #VALUE! #VALUE! #VALUE! #VALUE! #VALUE! #VALUE! #VALUE! #VALUE!
% of children in year 6 disadvantaged 10 27 17 20 23 20 49
*Children attending school at the time of January 2016 census within year groups reception to year 6
FA
MIL
Y G
RO
UP
20
Per
cent
age
of a
ll pu
pils
Yea
r 1
to Y
ear
6
Whi
teM
ixed
Asi
anB
lack
Oth
er
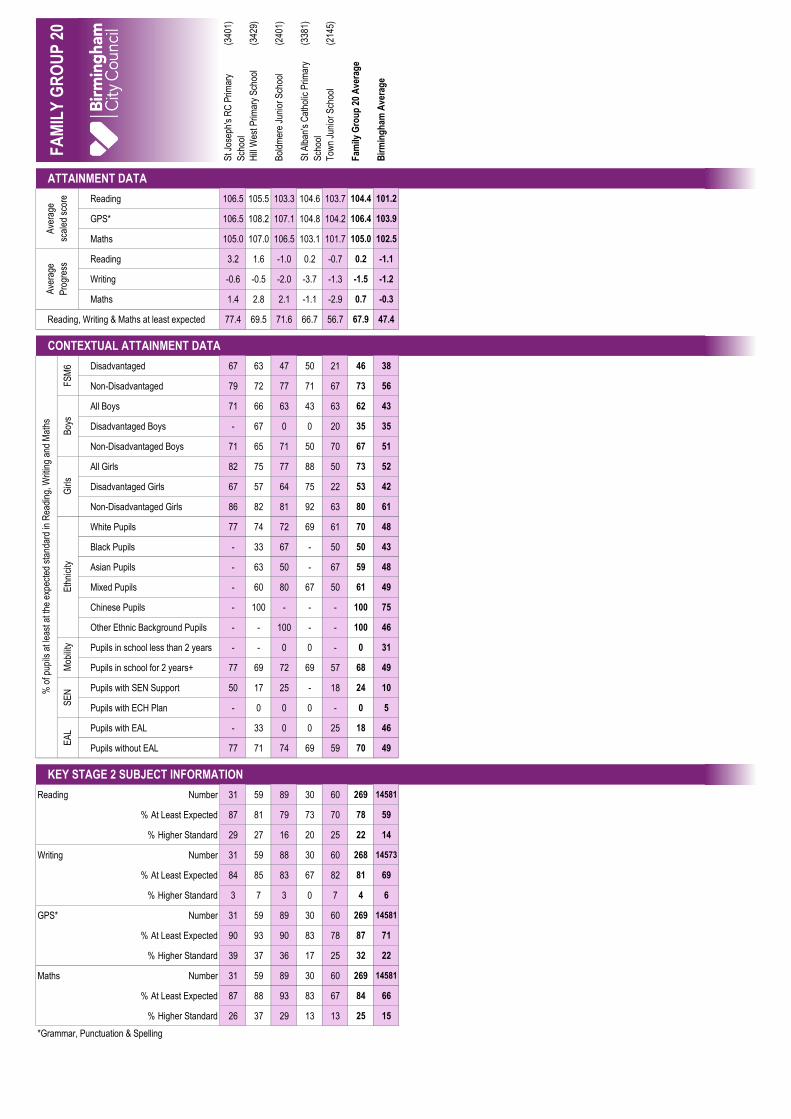
(340
1)
(342
9)
(240
1)
(338
1)
(214
5)
St J
osep
h's
RC
Prim
ary
Sch
ool
Hill
Wes
t Prim
ary
Sch
ool
Bol
dmer
e Ju
nior
Sch
ool
St A
lban
's C
atho
lic P
rimar
y
Sch
ool
Tow
n Ju
nior
Sch
ool
Fam
ily G
rou
p 2
0 A
vera
ge
Bir
min
gh
am A
vera
ge
ATTAINMENT DATA
Reading 106.5 105.5 103.3 104.6 103.7 104.4 101.2
GPS* 106.5 108.2 107.1 104.8 104.2 106.4 103.9
Maths 105.0 107.0 106.5 103.1 101.7 105.0 102.5
Reading 3.2 1.6 -1.0 0.2 -0.7 0.2 -1.1
Writing -0.6 -0.5 -2.0 -3.7 -1.3 -1.5 -1.2
Maths 1.4 2.8 2.1 -1.1 -2.9 0.7 -0.3
Reading, Writing & Maths at least expected 77.4 69.5 71.6 66.7 56.7 67.9 47.4
CONTEXTUAL ATTAINMENT DATA
Disadvantaged 67 63 47 50 21 46 38
Non-Disadvantaged 79 72 77 71 67 73 56
All Boys 71 66 63 43 63 62 43
Disadvantaged Boys - 67 0 0 20 35 35
Non-Disadvantaged Boys 71 65 71 50 70 67 51
All Girls 82 75 77 88 50 73 52
Disadvantaged Girls 67 57 64 75 22 53 42
Non-Disadvantaged Girls 86 82 81 92 63 80 61
White Pupils 77 74 72 69 61 70 48
Black Pupils - 33 67 - 50 50 43
Asian Pupils - 63 50 - 67 59 48
Mixed Pupils - 60 80 67 50 61 49
Chinese Pupils - 100 - - - 100 75
Other Ethnic Background Pupils - - 100 - - 100 46
Pupils in school less than 2 years - - 0 0 - 0 31
Pupils in school for 2 years+ 77 69 72 69 57 68 49
Pupils with SEN Support 50 17 25 - 18 24 10
Pupils with ECH Plan - 0 0 0 - 0 5
Pupils with EAL - 33 0 0 25 18 46
Pupils without EAL 77 71 74 69 59 70 49
KEY STAGE 2 SUBJECT INFORMATION
Reading Number 31 59 89 30 60 269 14581
% At Least Expected 87 81 79 73 70 78 59
% Higher Standard 29 27 16 20 25 22 14
Writing Number 31 59 88 30 60 268 14573
% At Least Expected 84 85 83 67 82 81 69
% Higher Standard 3 7 3 0 7 4 6
GPS* Number 31 59 89 30 60 269 14581
% At Least Expected 90 93 90 83 78 87 71
% Higher Standard 39 37 36 17 25 32 22
Maths Number 31 59 89 30 60 269 14581
% At Least Expected 87 88 93 83 67 84 66
% Higher Standard 26 37 29 13 13 25 15
*Grammar, Punctuation & Spelling
FA
MIL
Y G
RO
UP
20
Mob
ility
SE
NE
AL
Ave
rage
scal
ed s
core
Ave
rage
Pro
gres
sF
SM
6B
oys
Girl
sE
thni
city
% o
f pup
ils a
t lea
st a
t the
exp
ecte
d st
anda
rd in
Rea
ding
, Writ
ing
and
Mat
hs
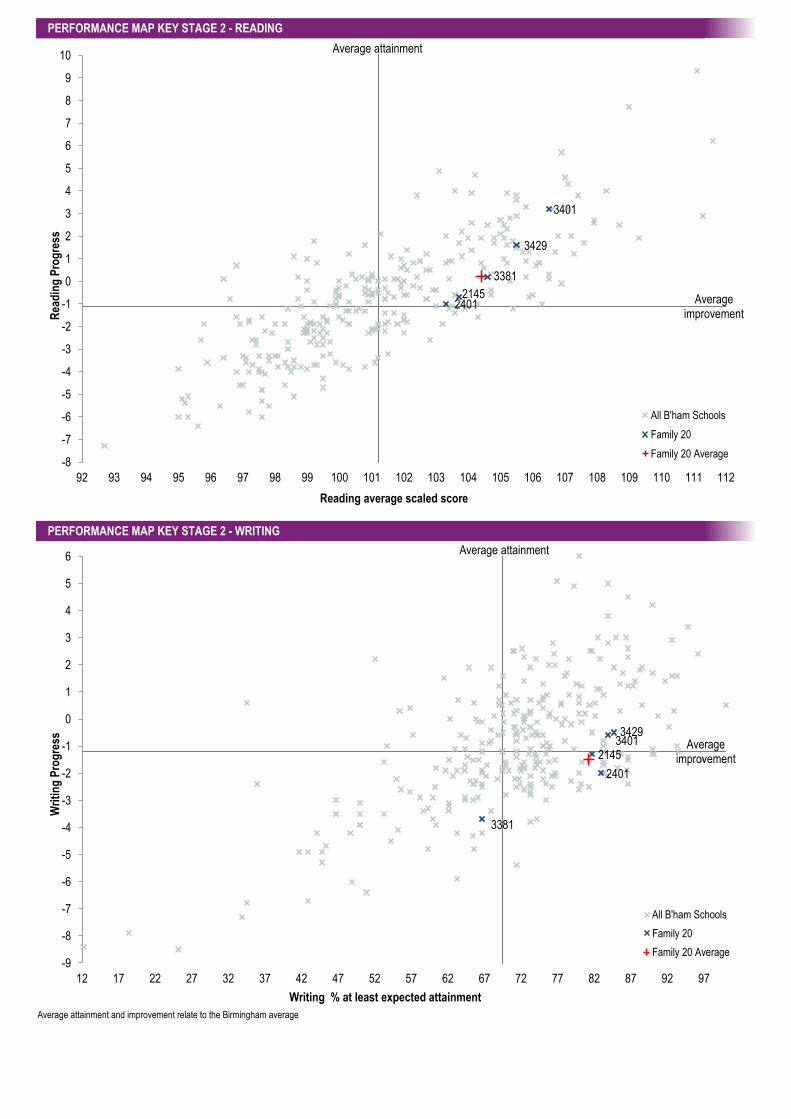
PERFORMANCE MAP KEY STAGE 2 - READING
PERFORMANCE MAP KEY STAGE 2 - WRITING
Average attainment and improvement relate to the Birmingham average
3401
3429
2401
3381
2145
-8
-7
-6
-5
-4
-3
-2
-1
0
1
2
3
4
5
6
7
8
9
10
92 93 94 95 96 97 98 99 100 101 102 103 104 105 106 107 108 109 110 111 112
Rea
din
g P
rog
ress
Reading average scaled score
All B'ham Schools
Family 20
Family 20 Average
3401 3429
2401
3381
2145
-9
-8
-7
-6
-5
-4
-3
-2
-1
0
1
2
3
4
5
6
12 17 22 27 32 37 42 47 52 57 62 67 72 77 82 87 92 97
Wri
tin
g P
rog
ress
Writing % at least expected attainment
All B'ham Schools
Family 20
Family 20 Average
Average attainment
Average improvement
Average attainment
Average improvement
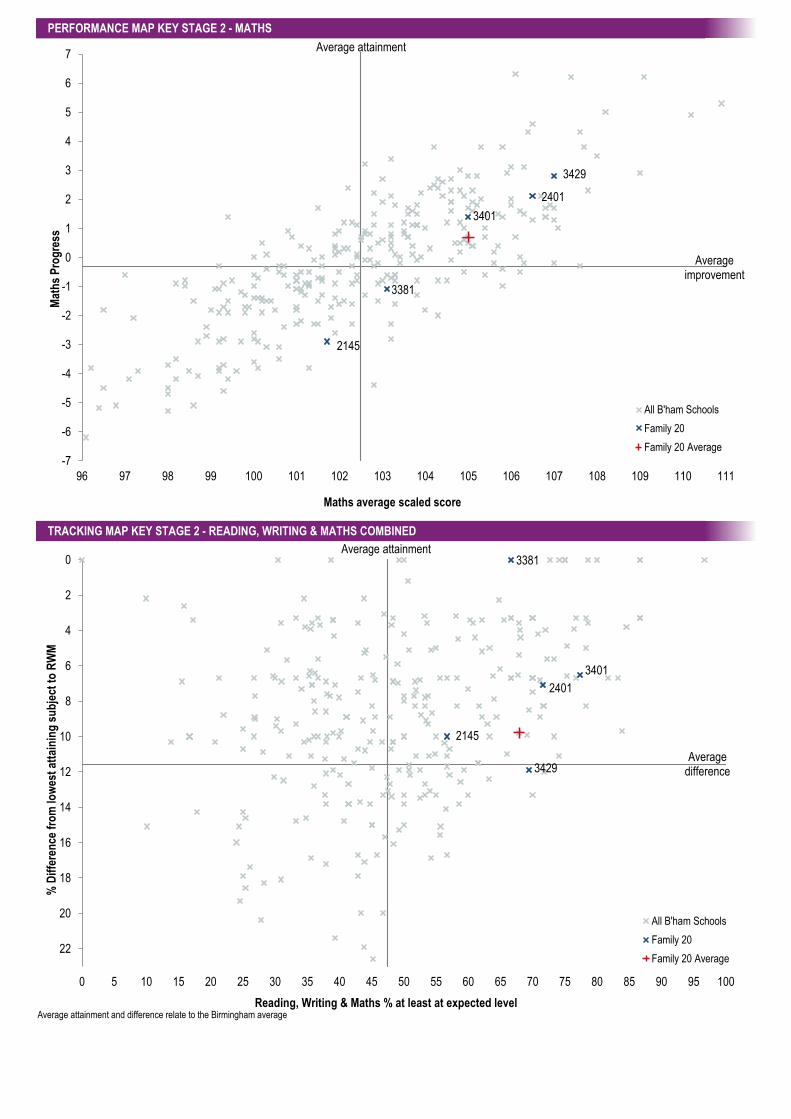
PERFORMANCE MAP KEY STAGE 2 - MATHS
TRACKING MAP KEY STAGE 2 - READING, WRITING & MATHS COMBINED
Average attainment and difference relate to the Birmingham average
3401
3429
2401
3381
2145
-7
-6
-5
-4
-3
-2
-1
0
1
2
3
4
5
6
7
96 97 98 99 100 101 102 103 104 105 106 107 108 109 110 111
Mat
hs
Pro
gre
ss
Maths average scaled score
All B'ham Schools
Family 20
Family 20 Average
3401
3429
2401
3381
2145
0
2
4
6
8
10
12
14
16
18
20
22
0 5 10 15 20 25 30 35 40 45 50 55 60 65 70 75 80 85 90 95 100
% D
iffe
ren
ce f
rom
low
est
atta
inin
g s
ub
ject
to
RW
M
Reading, Writing & Maths % at least at expected level
All B'ham Schools
Family 20
Family 20 Average
Average difference
Average attainment
Average improvement
Average attainment
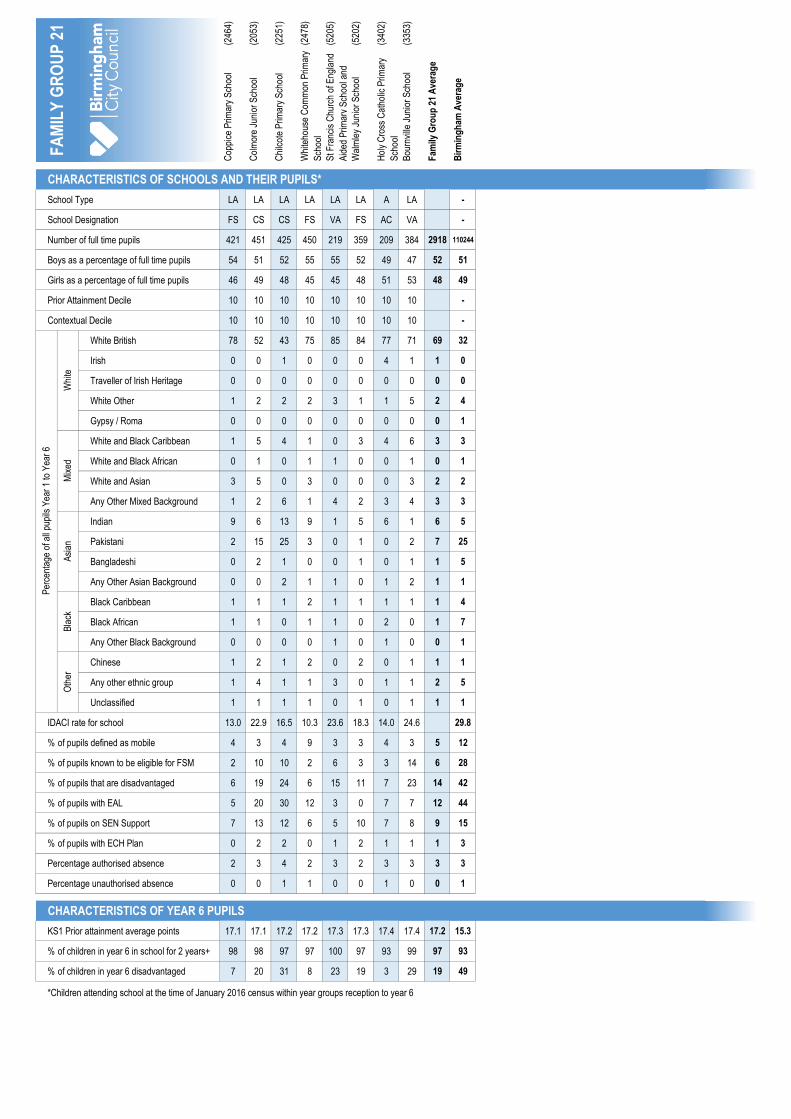
(246
4)
(205
3)
(225
1)
(247
8)
(520
5)
(520
2)
(340
2)
(335
3)
Cop
pice
Prim
ary
Sch
ool
Col
mor
e Ju
nior
Sch
ool
Chi
lcot
e P
rimar
y S
choo
l
Whi
teho
use
Com
mon
Prim
ary
Sch
ool
St F
ranc
is C
hurc
h of
Eng
land
Aid
ed P
rimar
y S
choo
l and
Wal
mle
y Ju
nior
Sch
ool
Hol
y C
ross
Cat
holic
Prim
ary
Sch
ool
Bou
rnvi
lle J
unio
r S
choo
l
Fam
ily G
rou
p 2
1 A
vera
ge
Bir
min
gh
am A
vera
ge
CHARACTERISTICS OF SCHOOLS AND THEIR PUPILS*
School Type LA LA LA LA LA LA A LA -
School Designation FS CS CS FS VA FS AC VA -
Number of full time pupils 421 451 425 450 219 359 209 384 2918 110244
Boys as a percentage of full time pupils 54 51 52 55 55 52 49 47 52 51
Girls as a percentage of full time pupils 46 49 48 45 45 48 51 53 48 49
Prior Attainment Decile 10 10 10 10 10 10 10 10 -
Contextual Decile 10 10 10 10 10 10 10 10 -
White British 78 52 43 75 85 84 77 71 69 32
Irish 0 0 1 0 0 0 4 1 1 0
Traveller of Irish Heritage 0 0 0 0 0 0 0 0 0 0
White Other 1 2 2 2 3 1 1 5 2 4
Gypsy / Roma 0 0 0 0 0 0 0 0 0 1
White and Black Caribbean 1 5 4 1 0 3 4 6 3 3
White and Black African 0 1 0 1 1 0 0 1 0 1
White and Asian 3 5 0 3 0 0 0 3 2 2
Any Other Mixed Background 1 2 6 1 4 2 3 4 3 3
Indian 9 6 13 9 1 5 6 1 6 5
Pakistani 2 15 25 3 0 1 0 2 7 25
Bangladeshi 0 2 1 0 0 1 0 1 1 5
Any Other Asian Background 0 0 2 1 1 0 1 2 1 1
Black Caribbean 1 1 1 2 1 1 1 1 1 4
Black African 1 1 0 1 1 0 2 0 1 7
Any Other Black Background 0 0 0 0 1 0 1 0 0 1
Chinese 1 2 1 2 0 2 0 1 1 1
Any other ethnic group 1 4 1 1 3 0 1 1 2 5
Unclassified 1 1 1 1 0 1 0 1 1 1
IDACI rate for school 13.0 22.9 16.5 10.3 23.6 18.3 14.0 24.6 29.8
% of pupils defined as mobile 4 3 4 9 3 3 4 3 5 12
% of pupils known to be eligible for FSM 2 10 10 2 6 3 3 14 6 28
% of pupils that are disadvantaged 6 19 24 6 15 11 7 23 14 42
% of pupils with EAL 5 20 30 12 3 0 7 7 12 44
% of pupils on SEN Support 7 13 12 6 5 10 7 8 9 15
% of pupils with ECH Plan 0 2 2 0 1 2 1 1 1 3
Percentage authorised absence 2 3 4 2 3 2 3 3 3 3
Percentage unauthorised absence 0 0 1 1 0 0 1 0 0 1
CHARACTERISTICS OF YEAR 6 PUPILS
KS1 Prior attainment average points 17.1 17.1 17.2 17.2 17.3 17.3 17.4 17.4 17.2 15.3
% of children in year 6 in school for 2 years+ 98 98 97 97 100 97 93 99 97 93 #VALUE! #VALUE! #VALUE! #VALUE! #VALUE! #VALUE! #VALUE! #VALUE! #VALUE! #VALUE! #VALUE!
% of children in year 6 disadvantaged 7 20 31 8 23 19 3 29 19 49
*Children attending school at the time of January 2016 census within year groups reception to year 6
Asi
anB
lack
Oth
erF
AM
ILY
GR
OU
P 2
1P
erce
ntag
e of
all
pupi
ls Y
ear
1 to
Yea
r 6
Whi
teM
ixed

(246
4)
(205
3)
(225
1)
(247
8)
(520
5)
(520
2)
(340
2)
(335
3)
Cop
pice
Prim
ary
Sch
ool
Col
mor
e Ju
nior
Sch
ool
Chi
lcot
e P
rimar
y S
choo
l
Whi
teho
use
Com
mon
Prim
ary
Sch
ool
St F
ranc
is C
hurc
h of
Eng
land
Aid
ed P
rimar
y S
choo
l and
Wal
mle
y Ju
nior
Sch
ool
Hol
y C
ross
Cat
holic
Prim
ary
Sch
ool
Bou
rnvi
lle J
unio
r S
choo
l
Fam
ily G
rou
p 2
1 A
vera
ge
Bir
min
gh
am A
vera
ge
ATTAINMENT DATA
Reading 107.9 107.6 101.1 105.8 106.1 103.2 111.6 106.3 105.8 101.2
GPS* 107.4 107.3 104.7 106.9 107.0 104.7 110.9 106.4 106.6 103.9
Maths 106.8 105.4 103.3 106.8 106.1 106.9 110.2 103.2 105.7 102.5
Reading 2.6 1.7 -3.6 0.9 0.7 -1.9 6.2 -1.0 0.2 -1.1
Writing -1.4 -2.4 -2.4 -1.7 -3.7 -1.8 -1.1 -1.9 -2.0 -1.2
Maths 1.7 0.7 -1.6 1.4 0.7 1.8 4.9 -2.8 0.4 -0.3
Reading, Writing & Maths at least expected 78.3 69.2 47.5 73.3 67.7 64.8 86.7 56.3 66.0 47.4
CONTEXTUAL ATTAINMENT DATA
Disadvantaged 25 28 21 40 71 35 100 29 32 38
Non-Disadvantaged 82 79 60 76 67 72 86 68 74 56
All Boys 73 70 43 73 56 60 83 47 62 43
Disadvantaged Boys 0 25 20 50 67 25 - 18 24 35
Non-Disadvantaged Boys 76 79 55 74 54 67 83 62 70 51
All Girls 83 68 52 75 80 71 89 67 71 52
Disadvantaged Girls 33 30 22 33 75 44 100 45 40 42
Non-Disadvantaged Girls 89 79 64 82 82 78 88 74 79 61
White Pupils 74 70 41 70 67 66 85 59 66 48
Black Pupils 100 67 100 0 - - 100 100 78 43
Asian Pupils 83 63 52 91 - 60 100 67 66 48
Mixed Pupils 100 71 67 67 - 67 100 44 63 49
Chinese Pupils - 100 - - - 0 - - 67 75
Other Ethnic Background Pupils 100 67 0 - 100 - - 0 50 46
Pupils in school less than 2 years 100 100 50 50 - 100 100 0 77 31
Pupils in school for 2 years+ 78 69 47 74 68 64 86 57 66 49
Pupils with SEN Support 11 0 0 50 0 0 100 13 15 10
Pupils with ECH Plan - 33 - - - 0 - 0 14 5
Pupils with EAL 100 53 40 100 100 - 100 63 63 46
Pupils without EAL 77 72 51 67 66 65 86 56 66 49
KEY STAGE 2 SUBJECT INFORMATION
Reading Number 60 91 61 60 31 88 30 96 517 14581
% At Least Expected 88 85 61 83 81 67 97 71 77 59
% Higher Standard 48 35 7 33 35 23 57 32 32 14
Writing Number 60 91 61 60 31 88 30 96 517 14573
% At Least Expected 87 80 75 83 74 85 90 86 83 69
% Higher Standard 7 5 7 5 0 3 10 5 5 6
GPS* Number 60 91 61 60 31 88 30 96 517 14581
% At Least Expected 88 86 75 85 87 78 97 72 82 71
% Higher Standard 45 42 28 40 35 26 63 31 37 22
Maths Number 60 91 61 60 31 88 30 96 517 14581
% At Least Expected 92 79 70 87 94 82 100 67 81 66
% Higher Standard 35 30 21 32 29 40 63 21 32 15
*Grammar, Punctuation & Spelling
EA
L
Ave
rage
scal
ed s
core
Ave
rage
Pro
gres
sF
SM
6B
oys
Girl
sE
thni
city
% o
f pup
ils a
t lea
st a
t the
exp
ecte
d st
anda
rd in
Rea
ding
, Writ
ing
and
Mat
hs
Mob
ility
SE
NF
AM
ILY
GR
OU
P 2
1
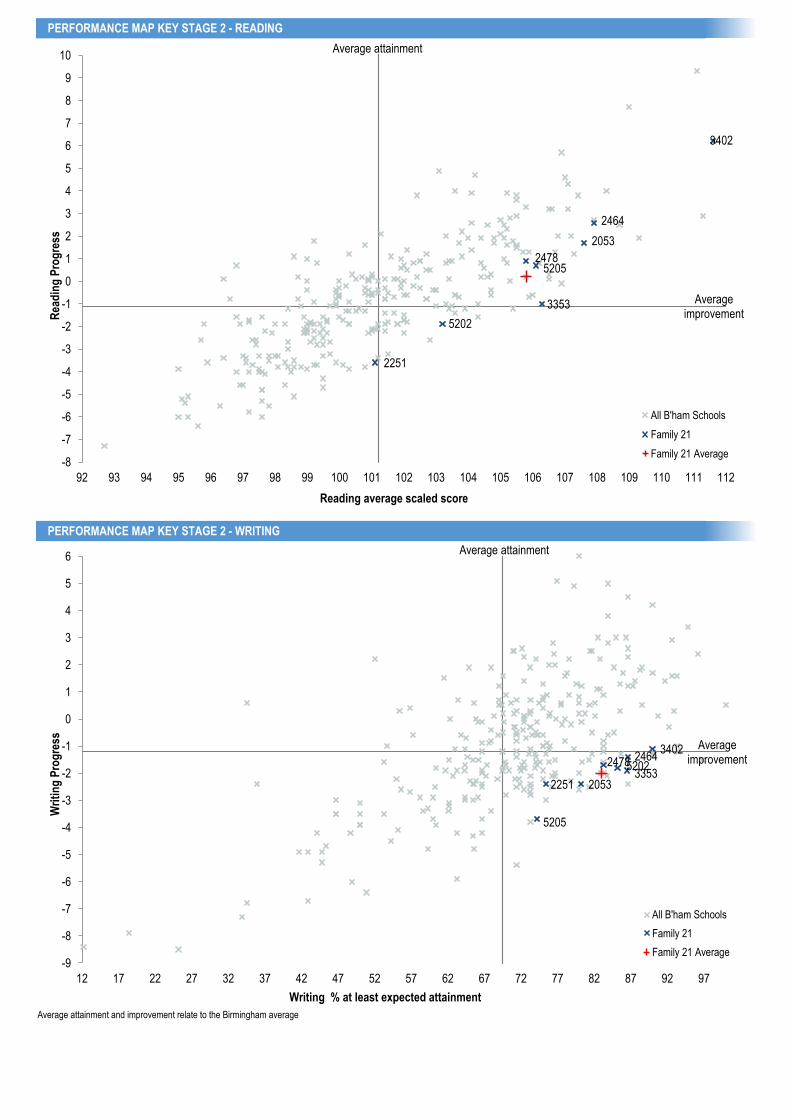
PERFORMANCE MAP KEY STAGE 2 - READING
PERFORMANCE MAP KEY STAGE 2 - WRITING
Average attainment and improvement relate to the Birmingham average
2464
2053
2251
2478 5205
5202
3402
3353
-8
-7
-6
-5
-4
-3
-2
-1
0
1
2
3
4
5
6
7
8
9
10
92 93 94 95 96 97 98 99 100 101 102 103 104 105 106 107 108 109 110 111 112
Rea
din
g P
rog
ress
Reading average scaled score
All B'ham Schools
Family 21
Family 21 Average
2464
2053 2251
2478
5205
5202
3402
3353
-9
-8
-7
-6
-5
-4
-3
-2
-1
0
1
2
3
4
5
6
12 17 22 27 32 37 42 47 52 57 62 67 72 77 82 87 92 97
Wri
tin
g P
rog
ress
Writing % at least expected attainment
All B'ham Schools
Family 21
Family 21 Average
Average attainment
Average improvement
Average attainment
Average improvement
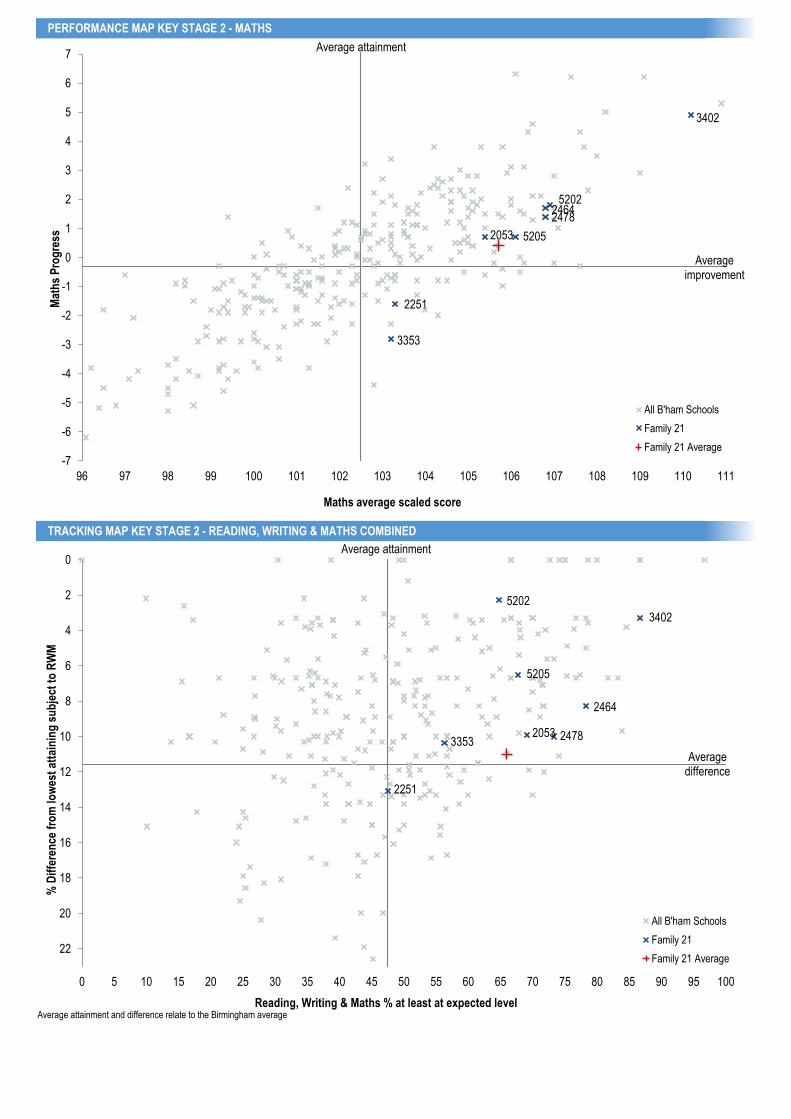
PERFORMANCE MAP KEY STAGE 2 - MATHS
TRACKING MAP KEY STAGE 2 - READING, WRITING & MATHS COMBINED
Average attainment and difference relate to the Birmingham average
2464
2053
2251
2478
5205
5202
3402
3353
-7
-6
-5
-4
-3
-2
-1
0
1
2
3
4
5
6
7
96 97 98 99 100 101 102 103 104 105 106 107 108 109 110 111
Mat
hs
Pro
gre
ss
Maths average scaled score
All B'ham Schools
Family 21
Family 21 Average
2464
2053
2251
2478
5205
5202
3402
3353
0
2
4
6
8
10
12
14
16
18
20
22
0 5 10 15 20 25 30 35 40 45 50 55 60 65 70 75 80 85 90 95 100
% D
iffe
ren
ce f
rom
low
est
atta
inin
g s
ub
ject
to
RW
M
Reading, Writing & Maths % at least at expected level
All B'ham Schools
Family 21
Family 21 Average
Average difference
Average attainment
Average improvement
Average attainment

(241
6)
(330
7)
(300
4)
(336
2)
(242
5)
(343
5)
(231
2)
(302
5)
(520
1)
(334
4)
(337
4)
(246
2)
(242
0)
(340
3)
(300
3)
Moo
r H
all P
rimar
y S
choo
l
St L
aure
nce
Chu
rch
Juni
or
Sch
ool
Qui
nton
Chu
rch
Prim
ary
Sch
ool
St P
eter
and
St P
aul R
C
Juni
or a
nd In
fant
Sch
ool
Pen
ns P
rimar
y S
choo
l
Fou
r O
aks
Prim
ary
Sch
ool
Cha
d V
ale
Prim
ary
Sch
ool
St M
ary'
s C
hurc
h of
Eng
land
Prim
ary
Sch
ool
The
Dea
nery
Chu
rch
of
Eng
land
Prim
ary
Sch
ool
St M
ary'
s C
atho
lic P
rimar
y
Sch
ool
Our
Lad
y of
Fat
ima
Cat
holic
Prim
ary
Sch
ool
Littl
e S
utto
n P
rimar
y S
choo
l
Man
ey H
ill P
rimar
y S
choo
l
St N
icho
las
Cat
holic
Prim
ary
Sch
ool
Mos
eley
Chu
rch
of E
ngla
nd
Prim
ary
Sch
ool
Fam
ily G
rou
p 2
2 A
vera
ge
Bir
min
gh
am A
vera
ge
CHARACTERISTICS OF SCHOOLS AND THEIR PUPILS*
School Type LA LA LA LA LA LA LA LA A LA A LA LA A LA -
School Designation FS VA VC VA CS FS CS VC AC VA AC FS CS AC VA -
Number of full time pupils 212 358 205 210 210 421 388 330 419 361 210 421 240 211 210 4406 110244
Boys as a percentage of full time pupils 52 50 45 47 54 49 55 49 54 48 55 49 48 51 49 50 51
Girls as a percentage of full time pupils 48 50 55 53 46 51 45 51 46 52 45 51 52 49 51 50 49
Prior Attainment Decile 10 10 10 10 10 10 10 10 10 10 10 10 10 10 10 -
Contextual Decile 10 10 9 9 10 10 8 8 10 9 10 10 10 10 10 -
White British 84 75 60 62 64 71 13 41 81 41 60 78 68 90 69 63 32
Irish 0 1 0 3 0 0 1 0 0 4 2 1 0 2 1 1 0
Traveller of Irish Heritage 0 0 0 0 0 0 0 0 0 0 0 0 0 0 0 0 0
White Other 2 1 1 16 2 2 5 3 3 12 7 2 4 3 1 4 4
Gypsy / Roma 0 0 0 0 0 0 0 0 0 0 0 0 0 0 0 0 1
White and Black Caribbean 2 5 5 6 4 2 2 6 3 3 4 2 3 1 5 3 3
White and Black African 0 1 2 2 1 0 1 3 0 0 0 0 0 1 1 1 1
White and Asian 0 1 2 0 2 1 0 1 0 0 0 2 3 1 5 1 2
Any Other Mixed Background 1 2 5 3 5 2 8 2 4 6 6 2 2 2 4 4 3
Indian 5 1 10 3 12 10 28 9 4 7 5 10 7 0 1 8 5
Pakistani 1 0 1 0 5 1 18 3 0 1 0 1 6 0 3 3 25
Bangladeshi 1 0 1 0 0 0 1 3 0 0 0 0 1 0 0 0 5
Any Other Asian Background 2 1 1 1 0 1 2 3 1 3 0 0 1 0 0 1 1
Black Caribbean 1 2 2 2 1 1 1 4 2 1 2 0 1 1 3 2 4
Black African 0 4 6 2 2 0 2 9 1 11 7 1 1 1 1 3 7
Any Other Black Background 0 1 1 0 1 1 2 0 0 3 2 0 0 0 2 1 1
Chinese 0 2 2 0 2 0 2 4 1 1 0 0 2 0 4 1 1
Any other ethnic group 0 2 2 1 1 0 10 9 1 5 4 1 3 1 0 3 5
Unclassified 2 1 1 0 0 6 4 1 1 2 1 0 1 0 2 2 1
IDACI rate for school 10.3 26.3 26.2 24.8 14.0 7.7 22.8 26.7 10.1 26.3 21.8 10.0 10.6 11.5 21.7 29.8
% of pupils defined as mobile 3 4 6 5 3 2 11 11 1 5 1 2 2 4 4 4 12
% of pupils known to be eligible for FSM 3 13 8 12 5 3 11 19 1 8 10 4 2 2 1 7 28
% of pupils that are disadvantaged 7 25 16 20 15 7 18 24 4 12 19 9 6 5 7 13 42
% of pupils with EAL 2 6 11 16 12 2 34 30 1 35 15 9 9 2 7 13 44
% of pupils on SEN Support 7 15 8 9 12 4 8 9 7 7 6 6 5 2 3 7 15
% of pupils with ECH Plan 1 1 0 0 0 2 1 2 0 0 4 1 0 1 1 1 3
Percentage authorised absence 2 2 3 3 2 2 3 2 2 3 2 2 2 2 2 2 3
Percentage unauthorised absence 1 0 1 1 0 0 1 0 1 1 0 0 1 0 0 0 1
CHARACTERISTICS OF YEAR 6 PUPILS
KS1 Prior attainment average points 17.4 17.4 17.5 17.5 17.5 17.5 17.7 17.7 17.7 17.9 17.9 17.9 18.0 18.5 19.1 17.8 15.3
% of children in year 6 in school for 2 years+ 97 98 100 100 93 97 97 93 100 97 97 98 100 100 90 97 93 #VALUE! #VALUE! #VALUE! #VALUE!
% of children in year 6 disadvantaged 13 33 21 33 13 7 29 30 3 3 10 10 13 13 10 17 49
*Children attending school at the time of January 2016 census within year groups reception to year 6
FA
MIL
Y G
RO
UP
22
Per
cent
age
of a
ll pu
pils
Yea
r 1
to Y
ear
6
Whi
teM
ixed
Asi
anB
lack
Oth
er
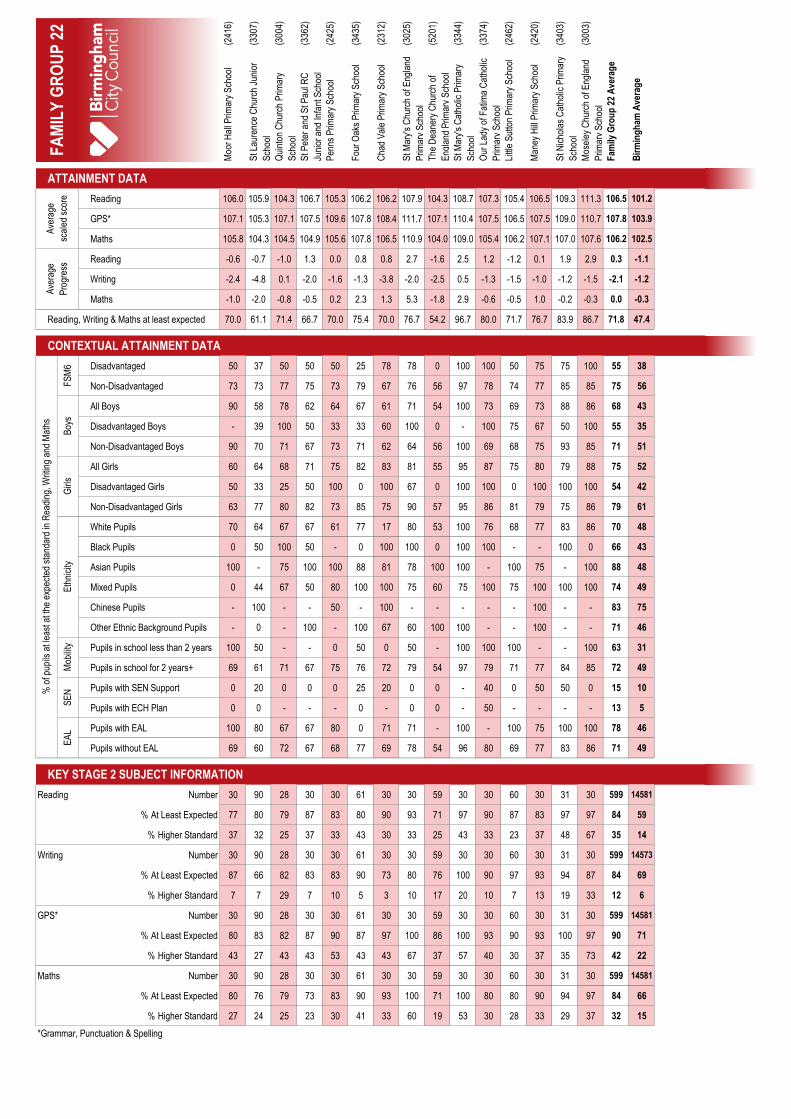
(241
6)
(330
7)
(300
4)
(336
2)
(242
5)
(343
5)
(231
2)
(302
5)
(520
1)
(334
4)
(337
4)
(246
2)
(242
0)
(340
3)
(300
3)
Moo
r H
all P
rimar
y S
choo
l
St L
aure
nce
Chu
rch
Juni
or
Sch
ool
Qui
nton
Chu
rch
Prim
ary
Sch
ool
St P
eter
and
St P
aul R
C
Juni
or a
nd In
fant
Sch
ool
Pen
ns P
rimar
y S
choo
l
Fou
r O
aks
Prim
ary
Sch
ool
Cha
d V
ale
Prim
ary
Sch
ool
St M
ary'
s C
hurc
h of
Eng
land
Prim
ary
Sch
ool
The
Dea
nery
Chu
rch
of
Eng
land
Prim
ary
Sch
ool
St M
ary'
s C
atho
lic P
rimar
y
Sch
ool
Our
Lad
y of
Fat
ima
Cat
holic
Prim
ary
Sch
ool
Littl
e S
utto
n P
rimar
y S
choo
l
Man
ey H
ill P
rimar
y S
choo
l
St N
icho
las
Cat
holic
Prim
ary
Sch
ool
Mos
eley
Chu
rch
of E
ngla
nd
Prim
ary
Sch
ool
Fam
ily G
rou
p 2
2 A
vera
ge
Bir
min
gh
am A
vera
ge
ATTAINMENT DATA
Reading 106.0 105.9 104.3 106.7 105.3 106.2 106.2 107.9 104.3 108.7 107.3 105.4 106.5 109.3 111.3 106.5 101.2
GPS* 107.1 105.3 107.1 107.5 109.6 107.8 108.4 111.7 107.1 110.4 107.5 106.5 107.5 109.0 110.7 107.8 103.9
Maths 105.8 104.3 104.5 104.9 105.6 107.8 106.5 110.9 104.0 109.0 105.4 106.2 107.1 107.0 107.6 106.2 102.5
Reading -0.6 -0.7 -1.0 1.3 0.0 0.8 0.8 2.7 -1.6 2.5 1.2 -1.2 0.1 1.9 2.9 0.3 -1.1
Writing -2.4 -4.8 0.1 -2.0 -1.6 -1.3 -3.8 -2.0 -2.5 0.5 -1.3 -1.5 -1.0 -1.2 -1.5 -2.1 -1.2
Maths -1.0 -2.0 -0.8 -0.5 0.2 2.3 1.3 5.3 -1.8 2.9 -0.6 -0.5 1.0 -0.2 -0.3 0.0 -0.3
Reading, Writing & Maths at least expected 70.0 61.1 71.4 66.7 70.0 75.4 70.0 76.7 54.2 96.7 80.0 71.7 76.7 83.9 86.7 71.8 47.4
CONTEXTUAL ATTAINMENT DATA
Disadvantaged 50 37 50 50 50 25 78 78 0 100 100 50 75 75 100 55 38
Non-Disadvantaged 73 73 77 75 73 79 67 76 56 97 78 74 77 85 85 75 56
All Boys 90 58 78 62 64 67 61 71 54 100 73 69 73 88 86 68 43
Disadvantaged Boys - 39 100 50 33 33 60 100 0 - 100 75 67 50 100 55 35
Non-Disadvantaged Boys 90 70 71 67 73 71 62 64 56 100 69 68 75 93 85 71 51
All Girls 60 64 68 71 75 82 83 81 55 95 87 75 80 79 88 75 52
Disadvantaged Girls 50 33 25 50 100 0 100 67 0 100 100 0 100 100 100 54 42
Non-Disadvantaged Girls 63 77 80 82 73 85 75 90 57 95 86 81 79 75 86 79 61
White Pupils 70 64 67 67 61 77 17 80 53 100 76 68 77 83 86 70 48
Black Pupils 0 50 100 50 - 0 100 100 0 100 100 - - 100 0 66 43
Asian Pupils 100 - 75 100 100 88 81 78 100 100 - 100 75 - 100 88 48
Mixed Pupils 0 44 67 50 80 100 100 75 60 75 100 75 100 100 100 74 49
Chinese Pupils - 100 - - 50 - 100 - - - - - 100 - - 83 75
Other Ethnic Background Pupils - 0 - 100 - 100 67 60 100 100 - - 100 - - 71 46
Pupils in school less than 2 years 100 50 - - 0 50 0 50 - 100 100 100 - - 100 63 31
Pupils in school for 2 years+ 69 61 71 67 75 76 72 79 54 97 79 71 77 84 85 72 49
Pupils with SEN Support 0 20 0 0 0 25 20 0 0 - 40 0 50 50 0 15 10
Pupils with ECH Plan 0 0 - - - 0 - 0 0 - 50 - - - - 13 5
Pupils with EAL 100 80 67 67 80 0 71 71 - 100 - 100 75 100 100 78 46
Pupils without EAL 69 60 72 67 68 77 69 78 54 96 80 69 77 83 86 71 49
KEY STAGE 2 SUBJECT INFORMATION
Reading Number 30 90 28 30 30 61 30 30 59 30 30 60 30 31 30 599 14581
% At Least Expected 77 80 79 87 83 80 90 93 71 97 90 87 83 97 97 84 59
% Higher Standard 37 32 25 37 33 43 30 33 25 43 33 23 37 48 67 35 14
Writing Number 30 90 28 30 30 61 30 30 59 30 30 60 30 31 30 599 14573
% At Least Expected 87 66 82 83 83 90 73 80 76 100 90 97 93 94 87 84 69
% Higher Standard 7 7 29 7 10 5 3 10 17 20 10 7 13 19 33 12 6
GPS* Number 30 90 28 30 30 61 30 30 59 30 30 60 30 31 30 599 14581
% At Least Expected 80 83 82 87 90 87 97 100 86 100 93 90 93 100 97 90 71
% Higher Standard 43 27 43 43 53 43 43 67 37 57 40 30 37 35 73 42 22
Maths Number 30 90 28 30 30 61 30 30 59 30 30 60 30 31 30 599 14581
% At Least Expected 80 76 79 73 83 90 93 100 71 100 80 80 90 94 97 84 66
% Higher Standard 27 24 25 23 30 41 33 60 19 53 30 28 33 29 37 32 15
*Grammar, Punctuation & Spelling
FA
MIL
Y G
RO
UP
22
Mob
ility
SE
NE
AL
Ave
rage
scal
ed s
core
Ave
rage
Pro
gres
sF
SM
6B
oys
Girl
sE
thni
city
% o
f pup
ils a
t lea
st a
t the
exp
ecte
d st
anda
rd in
Rea
ding
, Writ
ing
and
Mat
hs
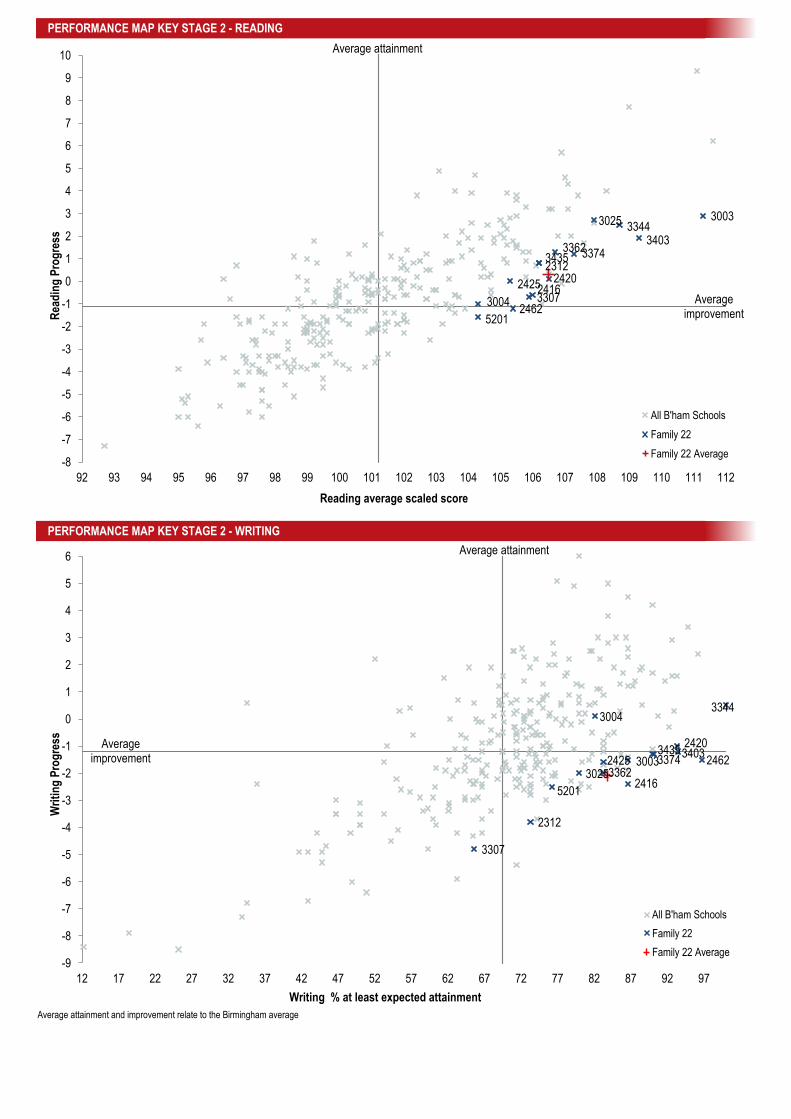
PERFORMANCE MAP KEY STAGE 2 - READING
PERFORMANCE MAP KEY STAGE 2 - WRITING
Average attainment and improvement relate to the Birmingham average
2416 3307 3004
3362
2425
3435 2312
3025
5201
3344
3374
2462
2420
3403
3003
-8
-7
-6
-5
-4
-3
-2
-1
0
1
2
3
4
5
6
7
8
9
10
92 93 94 95 96 97 98 99 100 101 102 103 104 105 106 107 108 109 110 111 112
Rea
din
g P
rog
ress
Reading average scaled score
All B'ham Schools
Family 22
Family 22 Average
2416
3307
3004
3362 2425
3435
2312
3025
5201
3344
3374 2462
2420 3403
3003
-9
-8
-7
-6
-5
-4
-3
-2
-1
0
1
2
3
4
5
6
12 17 22 27 32 37 42 47 52 57 62 67 72 77 82 87 92 97
Wri
tin
g P
rog
ress
Writing % at least expected attainment
All B'ham Schools
Family 22
Family 22 Average
Average attainment
Average improvement
Average attainment
Average improvement
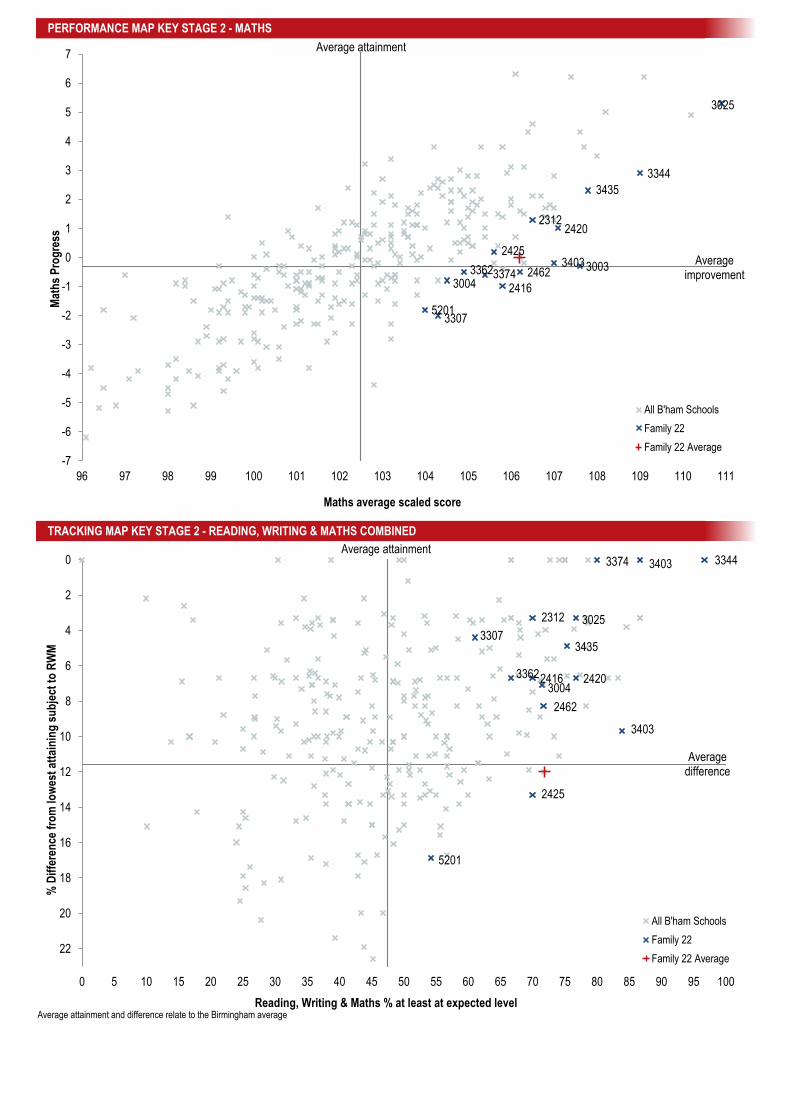
PERFORMANCE MAP KEY STAGE 2 - MATHS
TRACKING MAP KEY STAGE 2 - READING, WRITING & MATHS COMBINED
Average attainment and difference relate to the Birmingham average
2416
3307
3004 3362
2425
3435
2312
3025
5201
3344
3374 2462
2420
3403 3003
-7
-6
-5
-4
-3
-2
-1
0
1
2
3
4
5
6
7
96 97 98 99 100 101 102 103 104 105 106 107 108 109 110 111
Mat
hs
Pro
gre
ss
Maths average scaled score
All B'ham Schools
Family 22
Family 22 Average
2416
3307
3004 3362
2425
3435
2312 3025
5201
3344 3374
2462
2420
3403
3403 0
2
4
6
8
10
12
14
16
18
20
22
0 5 10 15 20 25 30 35 40 45 50 55 60 65 70 75 80 85 90 95 100
% D
iffe
ren
ce f
rom
low
est
atta
inin
g s
ub
ject
to
RW
M
Reading, Writing & Maths % at least at expected level
All B'ham Schools
Family 22
Family 22 Average
Average difference
Average attainment
Average improvement
Average attainment
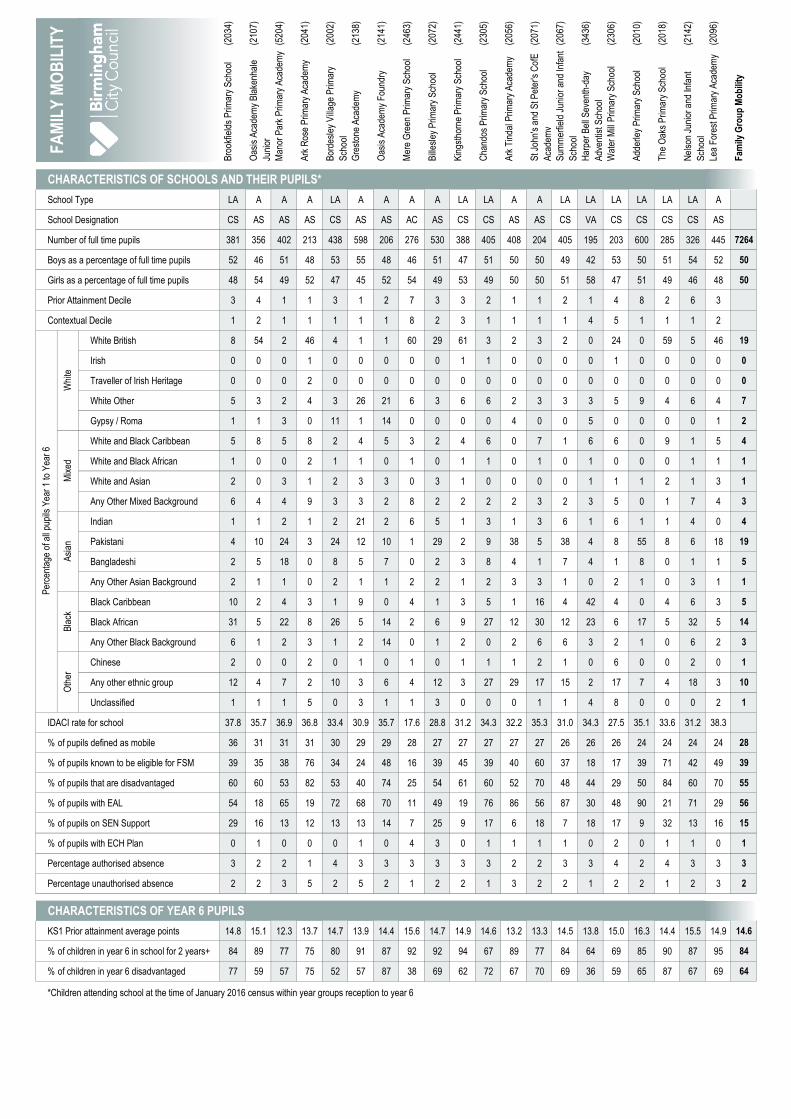
(203
4)
(210
7)
(520
4)
(204
1)
(200
2)
(213
8)
(214
1)
(246
3)
(207
2)
(244
1)
(230
5)
(205
6)
(207
1)
(206
7)
(343
6)
(230
6)
(201
0)
(201
8)
(214
2)
(209
6)
Bro
okfie
lds
Prim
ary
Sch
ool
Oas
is A
cade
my
Bla
kenh
ale
Juni
or
Man
or P
ark
Prim
ary
Aca
dem
y
Ark
Ros
e P
rimar
y A
cade
my
Bor
desl
ey V
illag
e P
rimar
y
Sch
ool
Gre
ston
e A
cade
my
Oas
is A
cade
my
Fou
ndry
Mer
e G
reen
Prim
ary
Sch
ool
Bill
esle
y P
rimar
y S
choo
l
Kin
gsth
orne
Prim
ary
Sch
ool
Cha
ndos
Prim
ary
Sch
ool
Ark
Tin
dal P
rimar
y A
cade
my
St J
ohn'
s an
d S
t Pet
er's
Cof
E
Aca
dem
y
Sum
mer
field
Jun
ior
and
Infa
nt
Sch
ool
Har
per
Bel
l Sev
enth
-day
Adv
entis
t Sch
ool
Wat
er M
ill P
rimar
y S
choo
l
Add
erle
y P
rimar
y S
choo
l
The
Oak
s P
rimar
y S
choo
l
Nel
son
Juni
or a
nd In
fant
Sch
ool
Lea
For
est P
rimar
y A
cade
my
Fam
ily G
rou
p M
ob
ility
CHARACTERISTICS OF SCHOOLS AND THEIR PUPILS*
School Type LA A A A LA A A A A LA LA A A LA LA LA LA LA LA A
School Designation CS AS AS AS CS AS AS AC AS CS CS AS AS CS VA CS CS CS CS AS
Number of full time pupils 381 356 402 213 438 598 206 276 530 388 405 408 204 405 195 203 600 285 326 445 7264
Boys as a percentage of full time pupils 52 46 51 48 53 55 48 46 51 47 51 50 50 49 42 53 50 51 54 52 50
Girls as a percentage of full time pupils 48 54 49 52 47 45 52 54 49 53 49 50 50 51 58 47 51 49 46 48 50
Prior Attainment Decile 3 4 1 1 3 1 2 7 3 3 2 1 1 2 1 4 8 2 6 3
Contextual Decile 1 2 1 1 1 1 1 8 2 3 1 1 1 1 4 5 1 1 1 2
White British 8 54 2 46 4 1 1 60 29 61 3 2 3 2 0 24 0 59 5 46 19
Irish 0 0 0 1 0 0 0 0 0 1 1 0 0 0 0 1 0 0 0 0 0
Traveller of Irish Heritage 0 0 0 2 0 0 0 0 0 0 0 0 0 0 0 0 0 0 0 0 0
White Other 5 3 2 4 3 26 21 6 3 6 6 2 3 3 3 5 9 4 6 4 7
Gypsy / Roma 1 1 3 0 11 1 14 0 0 0 0 4 0 0 5 0 0 0 0 1 2
White and Black Caribbean 5 8 5 8 2 4 5 3 2 4 6 0 7 1 6 6 0 9 1 5 4
White and Black African 1 0 0 2 1 1 0 1 0 1 1 0 1 0 1 0 0 0 1 1 1
White and Asian 2 0 3 1 2 3 3 0 3 1 0 0 0 0 1 1 1 2 1 3 1
Any Other Mixed Background 6 4 4 9 3 3 2 8 2 2 2 2 3 2 3 5 0 1 7 4 3
Indian 1 1 2 1 2 21 2 6 5 1 3 1 3 6 1 6 1 1 4 0 4
Pakistani 4 10 24 3 24 12 10 1 29 2 9 38 5 38 4 8 55 8 6 18 19
Bangladeshi 2 5 18 0 8 5 7 0 2 3 8 4 1 7 4 1 8 0 1 1 5
Any Other Asian Background 2 1 1 0 2 1 1 2 2 1 2 3 3 1 0 2 1 0 3 1 1
Black Caribbean 10 2 4 3 1 9 0 4 1 3 5 1 16 4 42 4 0 4 6 3 5
Black African 31 5 22 8 26 5 14 2 6 9 27 12 30 12 23 6 17 5 32 5 14
Any Other Black Background 6 1 2 3 1 2 14 0 1 2 0 2 6 6 3 2 1 0 6 2 3
Chinese 2 0 0 2 0 1 0 1 0 1 1 1 2 1 0 6 0 0 2 0 1
Any other ethnic group 12 4 7 2 10 3 6 4 12 3 27 29 17 15 2 17 7 4 18 3 10
Unclassified 1 1 1 5 0 3 1 1 3 0 0 0 1 1 4 8 0 0 0 2 1
IDACI rate for school 37.8 35.7 36.9 36.8 33.4 30.9 35.7 17.6 28.8 31.2 34.3 32.2 35.3 31.0 34.3 27.5 35.1 33.6 31.2 38.3
% of pupils defined as mobile 36 31 31 31 30 29 29 28 27 27 27 27 27 26 26 26 24 24 24 24 28
% of pupils known to be eligible for FSM 39 35 38 76 34 24 48 16 39 45 39 40 60 37 18 17 39 71 42 49 39
% of pupils that are disadvantaged 60 60 53 82 53 40 74 25 54 61 60 52 70 48 44 29 50 84 60 70 55
% of pupils with EAL 54 18 65 19 72 68 70 11 49 19 76 86 56 87 30 48 90 21 71 29 56
% of pupils on SEN Support 29 16 13 12 13 13 14 7 25 9 17 6 18 7 18 17 9 32 13 16 15
% of pupils with ECH Plan 0 1 0 0 0 1 0 4 3 0 1 1 1 1 0 2 0 1 1 0 1
Percentage authorised absence 3 2 2 1 4 3 3 3 3 3 3 2 2 3 3 4 2 4 3 3 3
Percentage unauthorised absence 2 2 3 5 2 5 2 1 2 2 1 3 2 2 1 2 2 1 2 3 2
CHARACTERISTICS OF YEAR 6 PUPILS
KS1 Prior attainment average points 14.8 15.1 12.3 13.7 14.7 13.9 14.4 15.6 14.7 14.9 14.6 13.2 13.3 14.5 13.8 15.0 16.3 14.4 15.5 14.9 14.6
% of children in year 6 in school for 2 years+ 84 89 77 75 80 91 87 92 92 94 67 89 77 84 64 69 85 90 87 95 84
% of children in year 6 disadvantaged 77 59 57 75 52 57 87 38 69 62 72 67 70 69 36 59 65 87 67 69 64
*Children attending school at the time of January 2016 census within year groups reception to year 6
FA
MIL
Y M
OB
ILIT
YP
erce
ntag
e of
all
pupi
ls Y
ear
1 to
Yea
r 6
Whi
teM
ixed
Asi
anB
lack
Oth
er
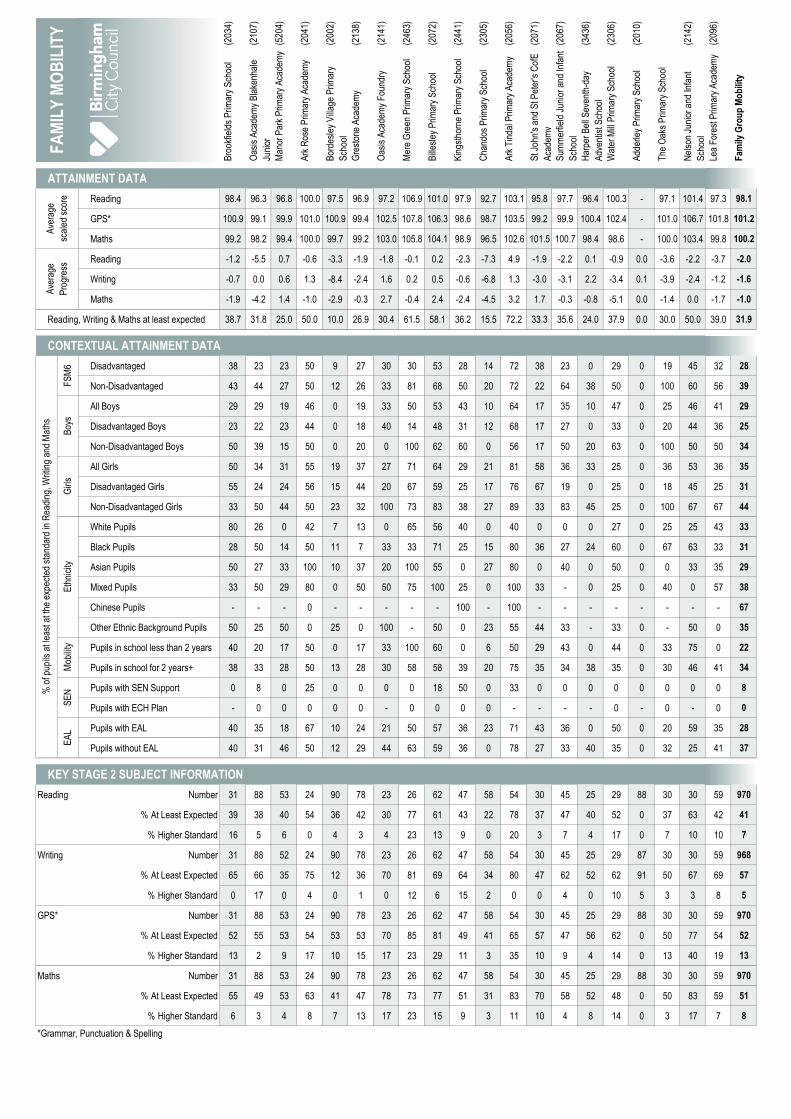
(203
4)
(210
7)
(520
4)
(204
1)
(200
2)
(213
8)
(214
1)
(246
3)
(207
2)
(244
1)
(230
5)
(205
6)
(207
1)
(206
7)
(343
6)
(230
6)
(201
0)
(214
2)
(209
6)
Bro
okfie
lds
Prim
ary
Sch
ool
Oas
is A
cade
my
Bla
kenh
ale
Juni
or
Man
or P
ark
Prim
ary
Aca
dem
y
Ark
Ros
e P
rimar
y A
cade
my
Bor
desl
ey V
illag
e P
rimar
y
Sch
ool
Gre
ston
e A
cade
my
Oas
is A
cade
my
Fou
ndry
Mer
e G
reen
Prim
ary
Sch
ool
Bill
esle
y P
rimar
y S
choo
l
Kin
gsth
orne
Prim
ary
Sch
ool
Cha
ndos
Prim
ary
Sch
ool
Ark
Tin
dal P
rimar
y A
cade
my
St J
ohn'
s an
d S
t Pet
er's
Cof
E
Aca
dem
y
Sum
mer
field
Jun
ior
and
Infa
nt
Sch
ool
Har
per
Bel
l Sev
enth
-day
Adv
entis
t Sch
ool
Wat
er M
ill P
rimar
y S
choo
l
Add
erle
y P
rimar
y S
choo
l
The
Oak
s P
rimar
y S
choo
l
Nel
son
Juni
or a
nd In
fant
Sch
ool
Lea
For
est P
rimar
y A
cade
my
Fam
ily G
rou
p M
ob
ility
ATTAINMENT DATA
Reading 98.4 96.3 96.8 100.0 97.5 96.9 97.2 106.9 101.0 97.9 92.7 103.1 95.8 97.7 96.4 100.3 - 97.1 101.4 97.3 98.1
GPS* 100.9 99.1 99.9 101.0 100.9 99.4 102.5 107.8 106.3 98.6 98.7 103.5 99.2 99.9 100.4 102.4 - 101.0 106.7 101.8 101.2
Maths 99.2 98.2 99.4 100.0 99.7 99.2 103.0 105.8 104.1 98.9 96.5 102.6 101.5 100.7 98.4 98.6 - 100.0 103.4 99.8 100.2
Reading -1.2 -5.5 0.7 -0.6 -3.3 -1.9 -1.8 -0.1 0.2 -2.3 -7.3 4.9 -1.9 -2.2 0.1 -0.9 0.0 -3.6 -2.2 -3.7 -2.0
Writing -0.7 0.0 0.6 1.3 -8.4 -2.4 1.6 0.2 0.5 -0.6 -6.8 1.3 -3.0 -3.1 2.2 -3.4 0.1 -3.9 -2.4 -1.2 -1.6
Maths -1.9 -4.2 1.4 -1.0 -2.9 -0.3 2.7 -0.4 2.4 -2.4 -4.5 3.2 1.7 -0.3 -0.8 -5.1 0.0 -1.4 0.0 -1.7 -1.0
Reading, Writing & Maths at least expected 38.7 31.8 25.0 50.0 10.0 26.9 30.4 61.5 58.1 36.2 15.5 72.2 33.3 35.6 24.0 37.9 0.0 30.0 50.0 39.0 31.9
CONTEXTUAL ATTAINMENT DATA
Disadvantaged 38 23 23 50 9 27 30 30 53 28 14 72 38 23 0 29 0 19 45 32 28
Non-Disadvantaged 43 44 27 50 12 26 33 81 68 50 20 72 22 64 38 50 0 100 60 56 39
All Boys 29 29 19 46 0 19 33 50 53 43 10 64 17 35 10 47 0 25 46 41 29
Disadvantaged Boys 23 22 23 44 0 18 40 14 48 31 12 68 17 27 0 33 0 20 44 36 25
Non-Disadvantaged Boys 50 39 15 50 0 20 0 100 62 60 0 56 17 50 20 63 0 100 50 50 34
All Girls 50 34 31 55 19 37 27 71 64 29 21 81 58 36 33 25 0 36 53 36 35
Disadvantaged Girls 55 24 24 56 15 44 20 67 59 25 17 76 67 19 0 25 0 18 45 25 31
Non-Disadvantaged Girls 33 50 44 50 23 32 100 73 83 38 27 89 33 83 45 25 0 100 67 67 44
White Pupils 80 26 0 42 7 13 0 65 56 40 0 40 0 0 0 27 0 25 25 43 33
Black Pupils 28 50 14 50 11 7 33 33 71 25 15 80 36 27 24 60 0 67 63 33 31
Asian Pupils 50 27 33 100 10 37 20 100 55 0 27 80 0 40 0 50 0 0 33 35 29
Mixed Pupils 33 50 29 80 0 50 50 75 100 25 0 100 33 - 0 25 0 40 0 57 38
Chinese Pupils - - - 0 - - - - - 100 - 100 - - - - - - - - 67
Other Ethnic Background Pupils 50 25 50 0 25 0 100 - 50 0 23 55 44 33 - 33 0 - 50 0 35
Pupils in school less than 2 years 40 20 17 50 0 17 33 100 60 0 6 50 29 43 0 44 0 33 75 0 22
Pupils in school for 2 years+ 38 33 28 50 13 28 30 58 58 39 20 75 35 34 38 35 0 30 46 41 34
Pupils with SEN Support 0 8 0 25 0 0 0 0 18 50 0 33 0 0 0 0 0 0 0 0 8
Pupils with ECH Plan - 0 0 0 0 0 - 0 0 0 0 - - - - 0 - 0 - 0 0
Pupils with EAL 40 35 18 67 10 24 21 50 57 36 23 71 43 36 0 50 0 20 59 35 28
Pupils without EAL 40 31 46 50 12 29 44 63 59 36 0 78 27 33 40 35 0 32 25 41 37
KEY STAGE 2 SUBJECT INFORMATION
Reading Number 31 88 53 24 90 78 23 26 62 47 58 54 30 45 25 29 88 30 30 59 970
% At Least Expected 39 38 40 54 36 42 30 77 61 43 22 78 37 47 40 52 0 37 63 42 41
% Higher Standard 16 5 6 0 4 3 4 23 13 9 0 20 3 7 4 17 0 7 10 10 7
Writing Number 31 88 52 24 90 78 23 26 62 47 58 54 30 45 25 29 87 30 30 59 968
% At Least Expected 65 66 35 75 12 36 70 81 69 64 34 80 47 62 52 62 91 50 67 69 57
% Higher Standard 0 17 0 4 0 1 0 12 6 15 2 0 0 4 0 10 5 3 3 8 5
GPS* Number 31 88 53 24 90 78 23 26 62 47 58 54 30 45 25 29 88 30 30 59 970
% At Least Expected 52 55 53 54 53 53 70 85 81 49 41 65 57 47 56 62 0 50 77 54 52
% Higher Standard 13 2 9 17 10 15 17 23 29 11 3 35 10 9 4 14 0 13 40 19 13
Maths Number 31 88 53 24 90 78 23 26 62 47 58 54 30 45 25 29 88 30 30 59 970
% At Least Expected 55 49 53 63 41 47 78 73 77 51 31 83 70 58 52 48 0 50 83 59 51
% Higher Standard 6 3 4 8 7 13 17 23 15 9 3 11 10 4 8 14 0 3 17 7 8
*Grammar, Punctuation & Spelling
FA
MIL
Y M
OB
ILIT
YM
obili
tyS
EN
EA
L
Ave
rage
scal
ed s
core
Ave
rage
Pro
gres
sF
SM
6B
oys
Girl
sE
thni
city
% o
f pup
ils a
t lea
st a
t the
exp
ecte
d st
anda
rd in
Rea
ding
, Writ
ing
and
Mat
hs
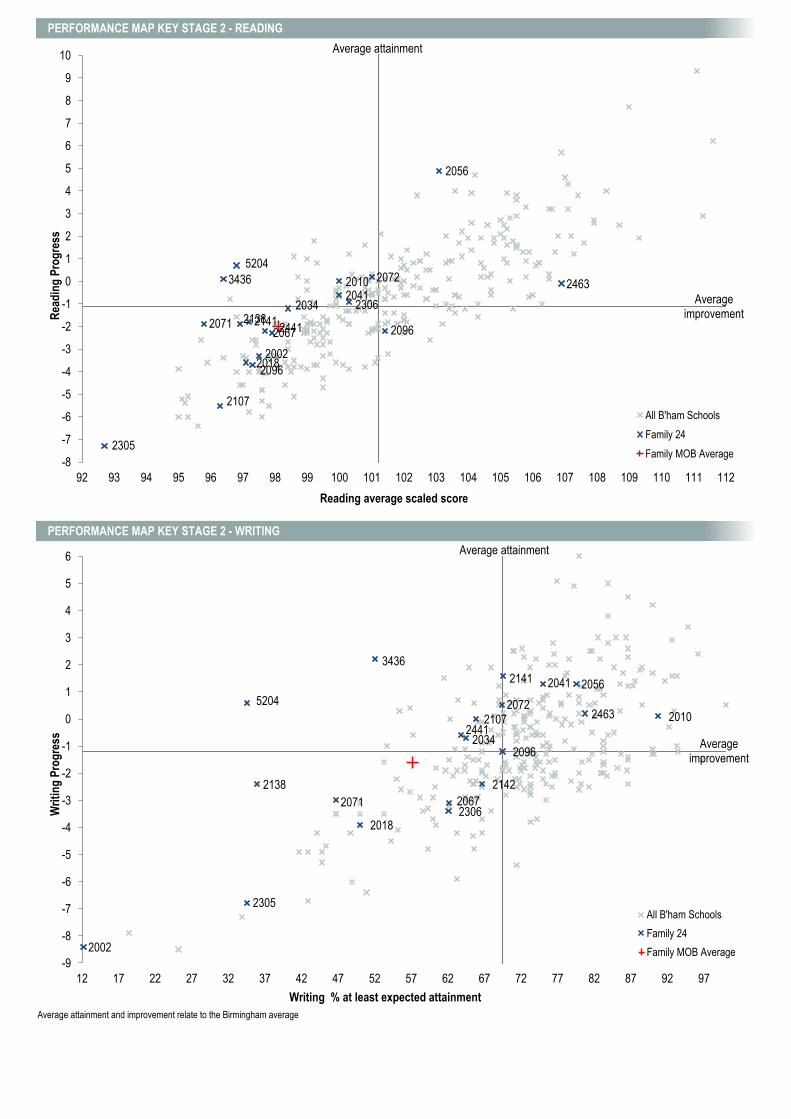
PERFORMANCE MAP KEY STAGE 2 - READING
PERFORMANCE MAP KEY STAGE 2 - WRITING
Average attainment and improvement relate to the Birmingham average
2034
2107
5204
2041
2002
2138 2141
2463 2072
2441
2305
2056
2071 2067
3436
2306
2010
2018
2096
2096
-8
-7
-6
-5
-4
-3
-2
-1
0
1
2
3
4
5
6
7
8
9
10
92 93 94 95 96 97 98 99 100 101 102 103 104 105 106 107 108 109 110 111 112
Rea
din
g P
rog
ress
Reading average scaled score
All B'ham Schools
Family 24
Family MOB Average
2034
2107
5204
2041
2002
2138
2141
2463 2072
2441
2305
2056
2071 2067
3436
2306
2010
2018
2142
2096
-9
-8
-7
-6
-5
-4
-3
-2
-1
0
1
2
3
4
5
6
12 17 22 27 32 37 42 47 52 57 62 67 72 77 82 87 92 97
Wri
tin
g P
rog
ress
Writing % at least expected attainment
All B'ham Schools
Family 24
Family MOB Average
Average attainment
Average improvement
Average attainment
Average improvement
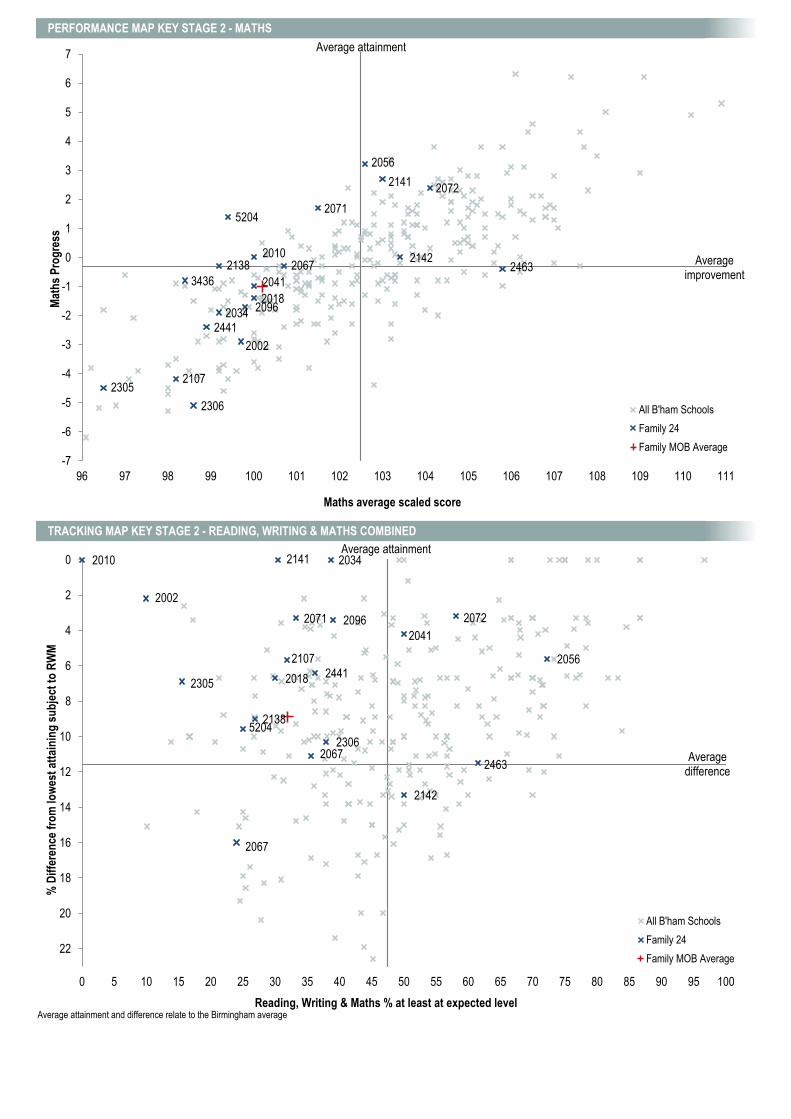
PERFORMANCE MAP KEY STAGE 2 - MATHS
TRACKING MAP KEY STAGE 2 - READING, WRITING & MATHS COMBINED
Average attainment and difference relate to the Birmingham average
2034
2107
5204
2041
2002
2138
2141
2463
2072
2441
2305
2056
2071
2067
3436
2306
2010
2018
2142
2096
-7
-6
-5
-4
-3
-2
-1
0
1
2
3
4
5
6
7
96 97 98 99 100 101 102 103 104 105 106 107 108 109 110 111
Mat
hs
Pro
gre
ss
Maths average scaled score
All B'ham Schools
Family 24
Family MOB Average
2034
2107
5204
2041
2002
2138
2141
2463
2072
2441 2305
2056
2071
2067
2067
2306
2010
2018
2142
2096
0
2
4
6
8
10
12
14
16
18
20
22
0 5 10 15 20 25 30 35 40 45 50 55 60 65 70 75 80 85 90 95 100
% D
iffe
ren
ce f
rom
low
est
atta
inin
g s
ub
ject
to
RW
M
Reading, Writing & Maths % at least at expected level
All B'ham Schools
Family 24
Family MOB Average
Average difference
Average attainment
Average improvement
Average attainment

(229
7)
(207
0)
(341
3)
(231
3)
(206
0)
(247
9)
(200
3)
(213
4)
(433
4)
(230
9)
(208
6)
(217
6)
(205
7)
(218
2)
(203
0)
(230
0)
(301
9)
(218
9)
(214
6)
(210
1)
Birc
hfie
ld C
omm
unity
Sch
ool
Mon
tgom
ery
Prim
ary
Aca
dem
y
Spr
ingf
ield
Prim
ary
Sch
ool
Hea
th M
ount
Prim
ary
Sch
ool
Cro
mw
ell J
unio
r an
d In
fant
Sch
ool a
nd N
urse
ry C
lass
Ang
lese
y P
rimar
y S
choo
l
Prin
ce A
lber
t Jun
ior
and
Infa
nt
Sch
ool
City
Roa
d P
rimar
y S
choo
l
Al-H
ijrah
Sch
ool
Hea
thfie
ld P
rimar
y S
choo
l
Gre
et P
rimar
y S
choo
l
Som
ervi
lle P
rimar
y (N
C)
Sch
ool
Per
cy S
hurm
er A
cade
my
Ark
Cha
mbe
rlain
Prim
ary
Aca
dem
y
Bor
desl
ey G
reen
Prim
ary
Sch
ool
Ard
en P
rimar
y S
choo
l
St S
avio
ur's
C o
f E P
rimar
y
Sch
ool
Lady
pool
Prim
ary
Sch
ool
Wyn
dclif
fe P
rimar
y S
choo
l
Hig
hfie
ld J
unio
r an
d In
fant
Sch
ool
Fam
ily G
rou
p E
AL
CHARACTERISTICS OF SCHOOLS AND THEIR PUPILS*
School Type LA A LA LA LA LA A A LA A LA LA A A LA LA LA LA A A
School Designation CS AS CS CS CS CS AC AS VA AC CS CS AS AC CS CS VC CS AS AS
Number of full time pupils 665 617 630 419 210 672 643 410 419 419 813 687 414 599 630 630 411 411 629 824 11152
Boys as a percentage of full time pupils 51 54 52 51 49 47 54 47 51 53 50 52 53 53 50 52 50 50 51 51 51
Girls as a percentage of full time pupils 49 46 48 49 51 53 46 53 49 47 50 48 47 47 50 48 50 50 49 49 49
Prior Attainment Decile 6 1 6 2 7 3 6 2 10 7 3 4 2 3 2 7 7 3 2 7
Contextual Decile 4 1 3 2 1 2 3 3 5 4 4 4 1 2 3 3 4 1 3 2
White British 0 0 0 1 1 1 0 0 0 0 0 0 1 0 0 1 0 0 1 0 0
Irish 0 0 0 0 0 0 0 0 0 0 0 0 0 0 0 0 0 0 0 0 0
Traveller of Irish Heritage 0 0 0 0 0 0 0 0 0 0 0 0 0 0 0 0 0 0 0 0 0
White Other 0 1 6 0 2 0 1 1 1 1 0 1 1 2 6 2 0 0 2 0 1
Gypsy / Roma 0 0 0 0 0 0 0 2 0 0 3 0 0 0 3 0 0 4 0 7 1
White and Black Caribbean 0 0 0 0 0 0 0 1 0 0 0 0 0 0 0 0 0 0 0 0 0
White and Black African 0 0 0 0 2 0 0 0 0 0 0 0 0 0 1 0 0 0 0 0 0
White and Asian 1 0 1 0 0 0 0 0 0 0 1 0 1 0 2 0 1 1 0 0 0
Any Other Mixed Background 0 2 1 1 1 1 1 1 2 1 1 2 2 1 0 0 1 2 1 0 1
Indian 22 2 3 2 0 2 2 3 4 5 1 1 1 0 0 1 0 1 0 1 3
Pakistani 48 60 77 44 4 31 40 69 62 52 73 60 24 42 70 74 74 48 58 72 56
Bangladeshi 21 11 4 2 4 53 48 1 9 30 8 16 3 30 8 11 18 10 9 9 16
Any Other Asian Background 1 3 1 1 2 0 1 1 0 1 2 1 5 1 1 0 1 1 1 1 1
Black Caribbean 0 0 0 1 1 0 0 1 0 1 0 0 2 0 0 0 0 0 0 0 0
Black African 5 8 4 8 78 6 5 5 17 7 4 13 17 15 7 5 4 6 16 7 9
Any Other Black Background 0 1 0 0 0 1 1 1 0 1 0 0 1 0 0 0 0 0 0 0 0
Chinese 0 0 0 0 0 0 0 0 0 0 0 0 0 0 0 0 0 0 0 0 0
Any other ethnic group 1 12 3 41 6 3 1 12 5 2 8 5 43 9 2 4 2 23 9 2 8
Unclassified 0 0 0 0 0 0 0 1 1 0 0 1 0 0 0 0 0 3 3 0 0
IDACI rate for school 33.6 35.0 30.6 37.3 43.0 35.6 32.8 29.9 30.3 33.0 31.1 31.6 35.2 33.9 31.9 32.5 35.0 33.8 33.1 34.7
% of pupils defined as mobile 5 14 13 6 10 10 9 17 5 6 7 7 10 9 10 4 2 14 12 10 9
% of pupils known to be eligible for FSM 17 33 18 38 40 30 24 15 18 24 23 22 38 35 22 34 27 48 23 32 27
% of pupils that are disadvantaged 37 46 29 46 79 46 40 29 32 38 35 43 55 52 37 43 39 57 40 45 42
% of pupils with EAL 99 99 96 95 95 94 93 93 93 93 92 92 92 92 91 91 91 91 91 91 93
% of pupils on SEN Support 9 10 17 26 11 16 28 20 5 38 11 15 12 4 21 11 20 20 23 22 17
% of pupils with ECH Plan 1 1 1 1 0 3 1 1 1 0 1 2 4 0 1 2 1 2 1 0 1
Percentage authorised absence 5 2 3 3 2 4 4 3 4 4 3 3 2 2 4 3 4 4 3 3 3
Percentage unauthorised absence 1 2 2 1 1 2 1 2 1 1 1 1 1 1 1 2 1 2 1 2 1
CHARACTERISTICS OF YEAR 6 PUPILS
KS1 Prior attainment average points 15.5 13.8 15.5 14.7 15.8 14.9 15.5 14.8 17.3 15.6 14.8 14.9 14.3 14.9 14.4 15.8 15.7 14.7 14.7 15.7 15.1
% of children in year 6 in school for 2 years+ 98 95 93 97 97 98 99 97 97 95 99 94 90 93 97 98 98 97 94 89 95
% of children in year 6 disadvantaged 52 47 32 57 83 60 51 40 35 49 48 55 71 61 47 50 47 58 47 62 52
*Children attending school at the time of January 2016 census within year groups reception to year 6
FA
MIL
Y E
AL
Per
cent
age
of a
ll pu
pils
Yea
r 1
to Y
ear
6
Whi
teM
ixed
Asi
anB
lack
Oth
er
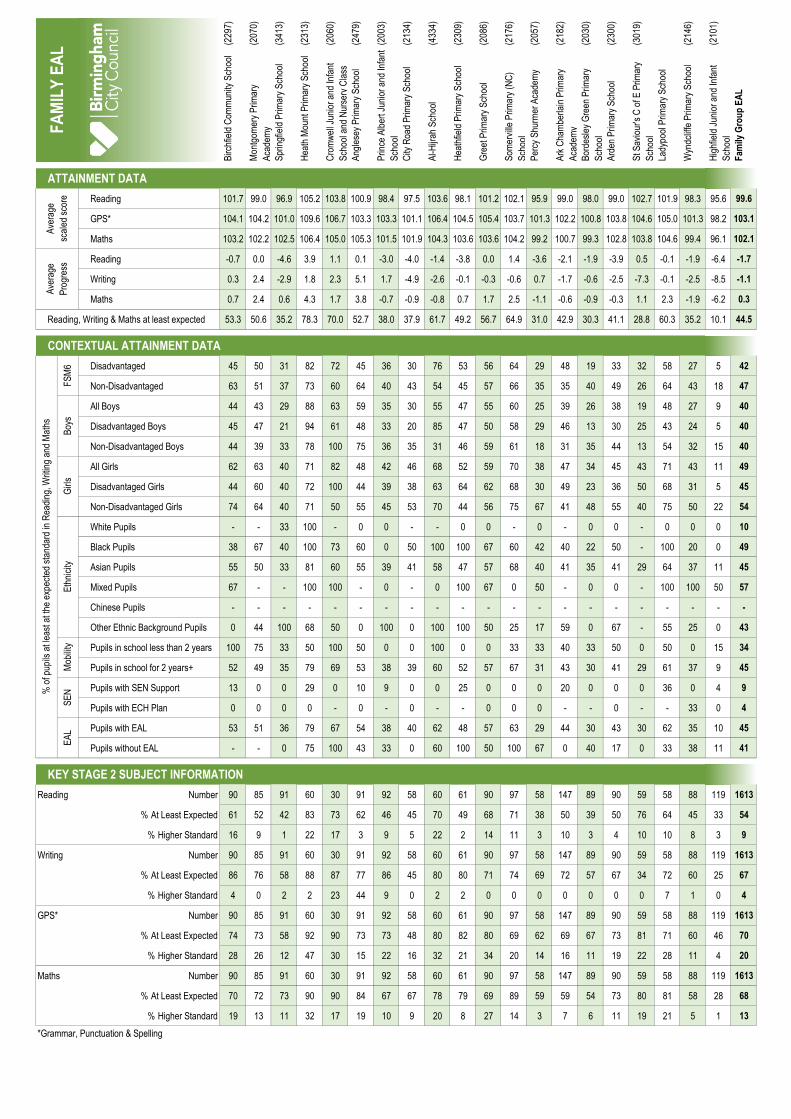
(229
7)
(207
0)
(341
3)
(231
3)
(206
0)
(247
9)
(200
3)
(213
4)
(433
4)
(230
9)
(208
6)
(217
6)
(205
7)
(218
2)
(203
0)
(230
0)
(301
9)
(214
6)
(210
1)
Birc
hfie
ld C
omm
unity
Sch
ool
Mon
tgom
ery
Prim
ary
Aca
dem
y
Spr
ingf
ield
Prim
ary
Sch
ool
Hea
th M
ount
Prim
ary
Sch
ool
Cro
mw
ell J
unio
r an
d In
fant
Sch
ool a
nd N
urse
ry C
lass
Ang
lese
y P
rimar
y S
choo
l
Prin
ce A
lber
t Jun
ior
and
Infa
nt
Sch
ool
City
Roa
d P
rimar
y S
choo
l
Al-H
ijrah
Sch
ool
Hea
thfie
ld P
rimar
y S
choo
l
Gre
et P
rimar
y S
choo
l
Som
ervi
lle P
rimar
y (N
C)
Sch
ool
Per
cy S
hurm
er A
cade
my
Ark
Cha
mbe
rlain
Prim
ary
Aca
dem
y
Bor
desl
ey G
reen
Prim
ary
Sch
ool
Ard
en P
rimar
y S
choo
l
St S
avio
ur's
C o
f E P
rimar
y
Sch
ool
Lady
pool
Prim
ary
Sch
ool
Wyn
dclif
fe P
rimar
y S
choo
l
Hig
hfie
ld J
unio
r an
d In
fant
Sch
ool
Fam
ily G
rou
p E
AL
ATTAINMENT DATA
Reading 101.7 99.0 96.9 105.2 103.8 100.9 98.4 97.5 103.6 98.1 101.2 102.1 95.9 99.0 98.0 99.0 102.7 101.9 98.3 95.6 99.6
GPS* 104.1 104.2 101.0 109.6 106.7 103.3 103.3 101.1 106.4 104.5 105.4 103.7 101.3 102.2 100.8 103.8 104.6 105.0 101.3 98.2 103.1
Maths 103.2 102.2 102.5 106.4 105.0 105.3 101.5 101.9 104.3 103.6 103.6 104.2 99.2 100.7 99.3 102.8 103.8 104.6 99.4 96.1 102.1
Reading -0.7 0.0 -4.6 3.9 1.1 0.1 -3.0 -4.0 -1.4 -3.8 0.0 1.4 -3.6 -2.1 -1.9 -3.9 0.5 -0.1 -1.9 -6.4 -1.7
Writing 0.3 2.4 -2.9 1.8 2.3 5.1 1.7 -4.9 -2.6 -0.1 -0.3 -0.6 0.7 -1.7 -0.6 -2.5 -7.3 -0.1 -2.5 -8.5 -1.1
Maths 0.7 2.4 0.6 4.3 1.7 3.8 -0.7 -0.9 -0.8 0.7 1.7 2.5 -1.1 -0.6 -0.9 -0.3 1.1 2.3 -1.9 -6.2 0.3
Reading, Writing & Maths at least expected 53.3 50.6 35.2 78.3 70.0 52.7 38.0 37.9 61.7 49.2 56.7 64.9 31.0 42.9 30.3 41.1 28.8 60.3 35.2 10.1 44.5
CONTEXTUAL ATTAINMENT DATA
Disadvantaged 45 50 31 82 72 45 36 30 76 53 56 64 29 48 19 33 32 58 27 5 42
Non-Disadvantaged 63 51 37 73 60 64 40 43 54 45 57 66 35 35 40 49 26 64 43 18 47
All Boys 44 43 29 88 63 59 35 30 55 47 55 60 25 39 26 38 19 48 27 9 40
Disadvantaged Boys 45 47 21 94 61 48 33 20 85 47 50 58 29 46 13 30 25 43 24 5 40
Non-Disadvantaged Boys 44 39 33 78 100 75 36 35 31 46 59 61 18 31 35 44 13 54 32 15 40
All Girls 62 63 40 71 82 48 42 46 68 52 59 70 38 47 34 45 43 71 43 11 49
Disadvantaged Girls 44 60 40 72 100 44 39 38 63 64 62 68 30 49 23 36 50 68 31 5 45
Non-Disadvantaged Girls 74 64 40 71 50 55 45 53 70 44 56 75 67 41 48 55 40 75 50 22 54
White Pupils - - 33 100 - 0 0 - - 0 0 - 0 - 0 0 - 0 0 0 10
Black Pupils 38 67 40 100 73 60 0 50 100 100 67 60 42 40 22 50 - 100 20 0 49
Asian Pupils 55 50 33 81 60 55 39 41 58 47 57 68 40 41 35 41 29 64 37 11 45
Mixed Pupils 67 - - 100 100 - 0 - 0 100 67 0 50 - 0 0 - 100 100 50 57
Chinese Pupils - - - - - - - - - - - - - - - - - - - - -
Other Ethnic Background Pupils 0 44 100 68 50 0 100 0 100 100 50 25 17 59 0 67 - 55 25 0 43
Pupils in school less than 2 years 100 75 33 50 100 50 0 0 100 0 0 33 33 40 33 50 0 50 0 15 34
Pupils in school for 2 years+ 52 49 35 79 69 53 38 39 60 52 57 67 31 43 30 41 29 61 37 9 45
Pupils with SEN Support 13 0 0 29 0 10 9 0 0 25 0 0 0 20 0 0 0 36 0 4 9
Pupils with ECH Plan 0 0 0 0 - 0 - 0 - - 0 0 0 - - 0 - - 33 0 4
Pupils with EAL 53 51 36 79 67 54 38 40 62 48 57 63 29 44 30 43 30 62 35 10 45
Pupils without EAL - - 0 75 100 43 33 0 60 100 50 100 67 0 40 17 0 33 38 11 41
KEY STAGE 2 SUBJECT INFORMATION
Reading Number 90 85 91 60 30 91 92 58 60 61 90 97 58 147 89 90 59 58 88 119 1613
% At Least Expected 61 52 42 83 73 62 46 45 70 49 68 71 38 50 39 50 76 64 45 33 54
% Higher Standard 16 9 1 22 17 3 9 5 22 2 14 11 3 10 3 4 10 10 8 3 9
Writing Number 90 85 91 60 30 91 92 58 60 61 90 97 58 147 89 90 59 58 88 119 1613
% At Least Expected 86 76 58 88 87 77 86 45 80 80 71 74 69 72 57 67 34 72 60 25 67
% Higher Standard 4 0 2 2 23 44 9 0 2 2 0 0 0 0 0 0 0 7 1 0 4
GPS* Number 90 85 91 60 30 91 92 58 60 61 90 97 58 147 89 90 59 58 88 119 1613
% At Least Expected 74 73 58 92 90 73 73 48 80 82 80 69 62 69 67 73 81 71 60 46 70
% Higher Standard 28 26 12 47 30 15 22 16 32 21 34 20 14 16 11 19 22 28 11 4 20
Maths Number 90 85 91 60 30 91 92 58 60 61 90 97 58 147 89 90 59 58 88 119 1613
% At Least Expected 70 72 73 90 90 84 67 67 78 79 69 89 59 59 54 73 80 81 58 28 68
% Higher Standard 19 13 11 32 17 19 10 9 20 8 27 14 3 7 6 11 19 21 5 1 13
*Grammar, Punctuation & Spelling
FA
MIL
Y E
AL
Mob
ility
SE
NE
AL
Ave
rage
scal
ed s
core
Ave
rage
Pro
gres
sF
SM
6B
oys
Girl
sE
thni
city
% o
f pup
ils a
t lea
st a
t the
exp
ecte
d st
anda
rd in
Rea
ding
, Writ
ing
and
Mat
hs
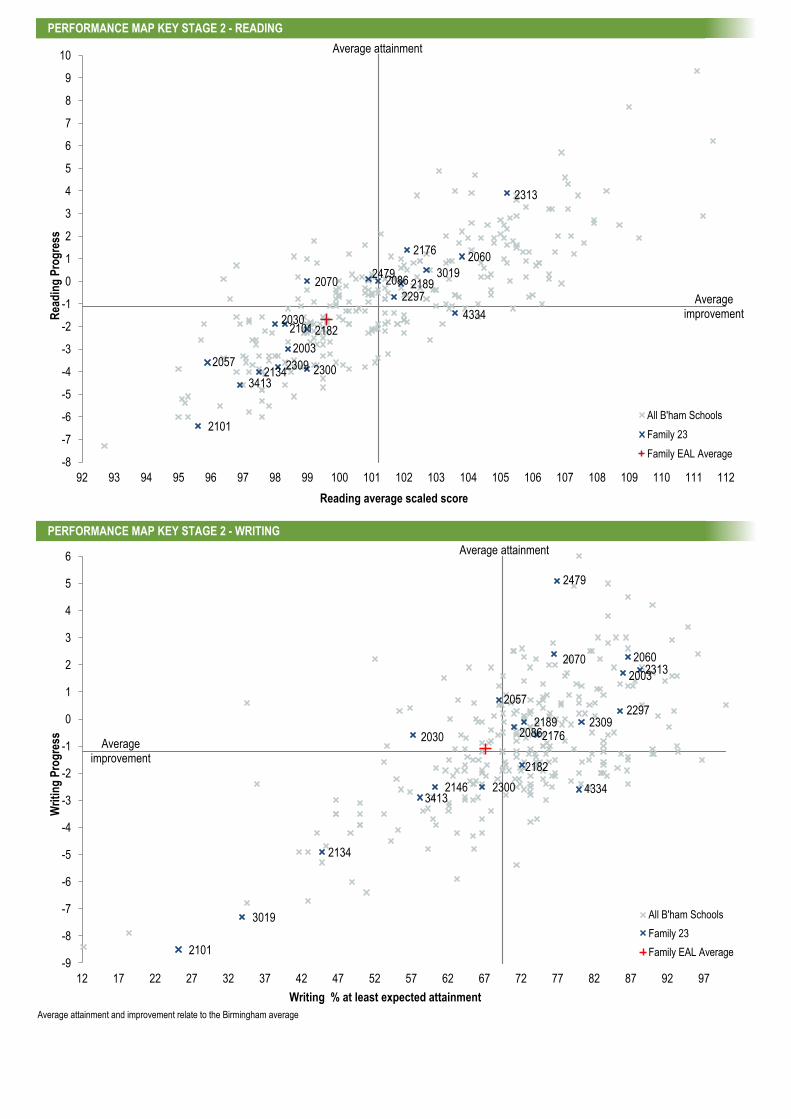
PERFORMANCE MAP KEY STAGE 2 - READING
PERFORMANCE MAP KEY STAGE 2 - WRITING
Average attainment and improvement relate to the Birmingham average
2297 2070
3413
2313
2060
2479
2003
2134
4334
2309
2086
2176
2057
2182 2030
2300
3019 2189
2101
2101
-8
-7
-6
-5
-4
-3
-2
-1
0
1
2
3
4
5
6
7
8
9
10
92 93 94 95 96 97 98 99 100 101 102 103 104 105 106 107 108 109 110 111 112
Rea
din
g P
rog
ress
Reading average scaled score
All B'ham Schools
Family 23
Family EAL Average
2297
2070
3413
2313 2060
2479
2003
2134
4334
2309 2086 2176
2057
2182
2030
2300
3019
2189
2146
2101 -9
-8
-7
-6
-5
-4
-3
-2
-1
0
1
2
3
4
5
6
12 17 22 27 32 37 42 47 52 57 62 67 72 77 82 87 92 97
Wri
tin
g P
rog
ress
Writing % at least expected attainment
All B'ham Schools
Family 23
Family EAL Average
Average attainment
Average improvement
Average attainment
Average improvement
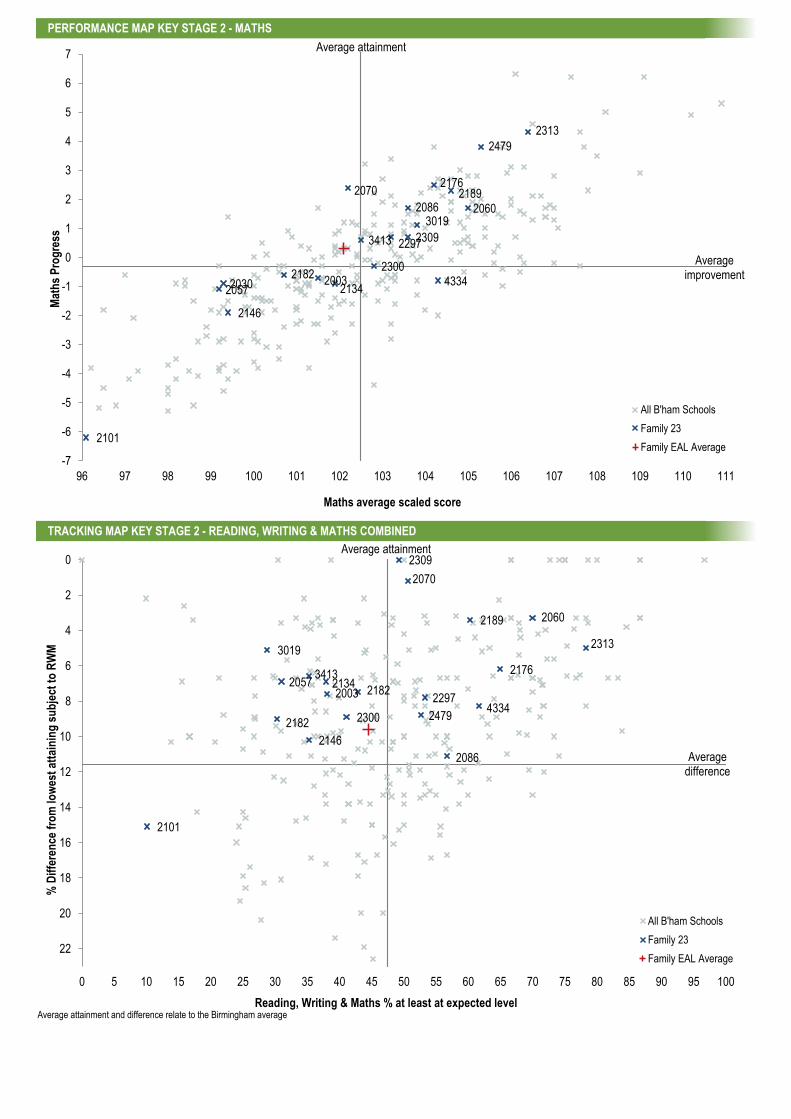
PERFORMANCE MAP KEY STAGE 2 - MATHS
TRACKING MAP KEY STAGE 2 - READING, WRITING & MATHS COMBINED
Average attainment and difference relate to the Birmingham average
2297
2070
3413
2313
2060
2479
2003 2134
4334
2309
2086
2176
2057
2182 2030
2300
3019
2189
2146
2101
-7
-6
-5
-4
-3
-2
-1
0
1
2
3
4
5
6
7
96 97 98 99 100 101 102 103 104 105 106 107 108 109 110 111
Mat
hs
Pro
gre
ss
Maths average scaled score
All B'ham Schools
Family 23
Family EAL Average
2297
2070
3413
2313
2060
2479
2003 2134
4334
2309
2086
2176 2057
2182
2182 2300
3019
2189
2146
2101
0
2
4
6
8
10
12
14
16
18
20
22
0 5 10 15 20 25 30 35 40 45 50 55 60 65 70 75 80 85 90 95 100
% D
iffe
ren
ce f
rom
low
est
atta
inin
g s
ub
ject
to
RW
M
Reading, Writing & Maths % at least at expected level
All B'ham Schools
Family 23
Family EAL Average
Average difference
Average attainment
Average improvement
Average attainment
114
Appendices
How have the schools been grouped?
Schools were grouped into families on the basis of a combination of an average of their prior attainment and contextual data.
Included Measures (for definitions see section at beginning of document)
Prior attainment Income deprivation affecting children index (IDACI) Free school meal eligibility (FSM) English as an additional language (EAL) Mobility
Standardisation Methodology
To prevent problems due to the differing scales or magnitudes among the variables or measures, different methods of standardisation were considered. In general, variables with larger standard deviations (i.e. those with larger dispersions) have more impact on the final similarity measure. Therefore it was necessary to make each variable equally represented by standardising the data.
Z-score standardisation
This is the most common method of standardisation. Z-score standardisation compares each value of the variable to the mean. This is then divided by the standard deviation of each variable. This works well when data is normally distributed.
Log transformation
This method takes the natural log of the variable.
Range standardisation
This method compares each value of the variable to the minimum value variable. This is then divided by the difference between the maximum and minimum value variables. However, it does not work well with data that contains outliers.
Range standardisation method was chosen as not all the data was normally distributed for the Z-score method and the log transformation method did not work well with all variables, particularly EAL. There were outliers in the datasets, however, they were relatively few and it was felt the impact on the analysis would be minimal.
Once the data was standardised, weightings were applied to the variables

115
Family Group Weightings
Prior attainment – 66% School Environment (a combination of the IDACI and FSM averages) – 20% English as an additional language – 10% Mobility measure – 4%
The weightings are those used by the DFE when compiling DFE Families of Schools, published 2011.
The weighted variables were summed to produce an overall score for each school.
Schools were ranked according to their overall score and then grouped in deciles and allocated a number 1 – 10, where 1 is the most disadvantaged decile and 10 the least.
In the absence of sophisticated statistical packages the schools were grouped into their families manually. The aim was to ensure that all key stage 1 average point scores (KS! APS) for schools were within 1 standard deviation of the group’s mean. The vast majority of schools within groups met this criteria, however KS1 APS for 7% of schools were more than 1.5 standard deviations away from the mean for the group. These schools were classified as outliers.
DfE Name of Establishment Family Group
3347 St Edmund's Catholic Primary School 4
2117 Oasis Academy Boulton 4
2060 Cromwell Junior and Infant School and Nursery Class 6
2165 Highfield Junior and Infant School 8
2010 Adderley Primary School 10
2458 Parkfield Community School 12
3339 St Joseph's Catholic Primary School 12
2063 Regents Park Community Primary School 14
3410 St John and Monica Catholic Primary School 16
2293 Wilkes Green Junior School 16
2451 Green Meadow Primary School 19
4334 Al-Hijrah School 19
3403 St Nicholas Catholic Primary School 22
3003 Moseley Church of England Primary School 22
Schools where KS1 APS is more than 1.5 standard deviations above the mean of the group
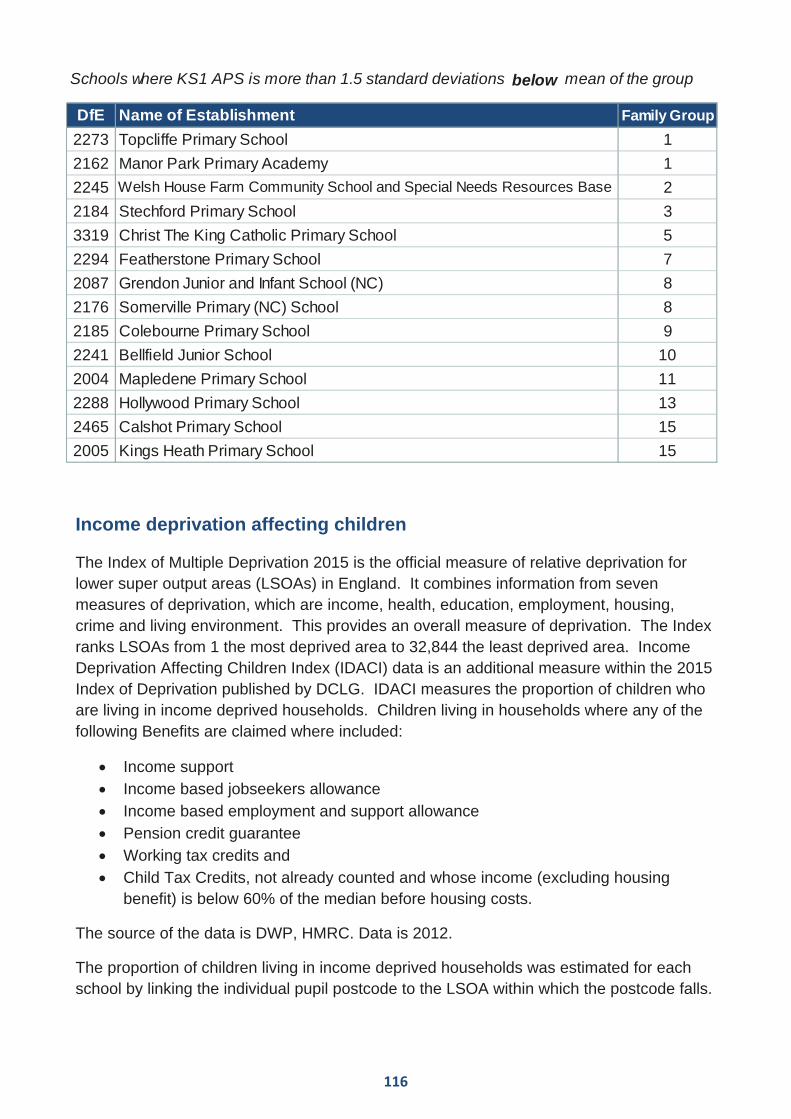
116
Income deprivation affecting children
The Index of Multiple Deprivation 2015 is the official measure of relative deprivation for lower super output areas (LSOAs) in England. It combines information from seven measures of deprivation, which are income, health, education, employment, housing, crime and living environment. This provides an overall measure of deprivation. The Index ranks LSOAs from 1 the most deprived area to 32,844 the least deprived area. Income Deprivation Affecting Children Index (IDACI) data is an additional measure within the 2015 Index of Deprivation published by DCLG. IDACI measures the proportion of children who are living in income deprived households. Children living in households where any of the following Benefits are claimed where included:
Income support Income based jobseekers allowance Income based employment and support allowance Pension credit guarantee Working tax credits and Child Tax Credits, not already counted and whose income (excluding housing
benefit) is below 60% of the median before housing costs.
The source of the data is DWP, HMRC. Data is 2012.
The proportion of children living in income deprived households was estimated for each school by linking the individual pupil postcode to the LSOA within which the postcode falls.
DfE Name of Establishment Family Group
2273 Topcliffe Primary School 1
2162 Manor Park Primary Academy 1
2245 Welsh House Farm Community School and Special Needs Resources Base 2
2184 Stechford Primary School 3
3319 Christ The King Catholic Primary School 5
2294 Featherstone Primary School 7
2087 Grendon Junior and Infant School (NC) 8
2176 Somerville Primary (NC) School 8
2185 Colebourne Primary School 9
2241 Bellfield Junior School 10
2004 Mapledene Primary School 11
2288 Hollywood Primary School 13
2465 Calshot Primary School 15
2005 Kings Heath Primary School 15
Schools where KS1 APS is more than 1.5 standard deviations below mean of the group

117
Data quality
School contextual data has been extracted from the January 2016 school census. Key Stage 2 outcomes are extracted from pupil level Primary School performance tables publication data released by the Department for Education on 19/12/2016.
This document does not incorporate any changes to Key Stage 2 outcomes made during the second data checking exercise that finished the end of January 2017.
School and Family Group List
Family School Type Constituency
17 (3318) Abbey Catholic Primary School VA Erdington
15 (2020) Acocks Green Primary School AC Yardley
10 (2010) Adderley Primary School (Mobility) CS Hodge Hill
10 (3433) Albert Bradbeer Primary AC Northfield
16 (5949) Al-Furqan Primary School VA Yardley
19 (4334) Al-Hijrah School (EAL) VA Ladywood
13 (2153) Allens Croft Primary School CS Selly Oak
4 (2144) Alston Primary School AS Hodge Hill
3 (2062) Anderton Park Primary School CS Hall Green
4 (2479) Anglesey Primary School (EAL) CS Perry Barr
10 (2300) Arden Primary School (EAL) CS Hall Green
4 (2182) Ark Chamberlain Primary Academy (EAL) AC Yardley
1 (2041) Ark Rose Primary Academy (Mobility) AS Northfield
1 (2056) Ark Tindal Primary Academy (Mobility) AS Hall Green
6 (2443) Aston Tower Community Primary School AC Ladywood
10 (3412) Audley Primary School CS Yardley
11 (2026) Banners Gate Primary School CS Sutton Coldfield
10 (2014) Barford Primary School CS Ladywood
10 (2241) Bellfield Junior School CS Northfield
10 (2456) Bells Farm Junior and Infant School CS Selly Oak
4 (2435) Benson Community School CS Ladywood
5 (2072) Billesley Primary School (Mobility) AS Selly Oak
14 (2024) Birches Green Junior School CS Erdington
10 (2297) Birchfield Community School (EAL) CS Ladywood
10 (2254) Blakesley Hall Primary School CS Yardley
20 (2401) Boldmere Junior School CS Sutton Coldfield
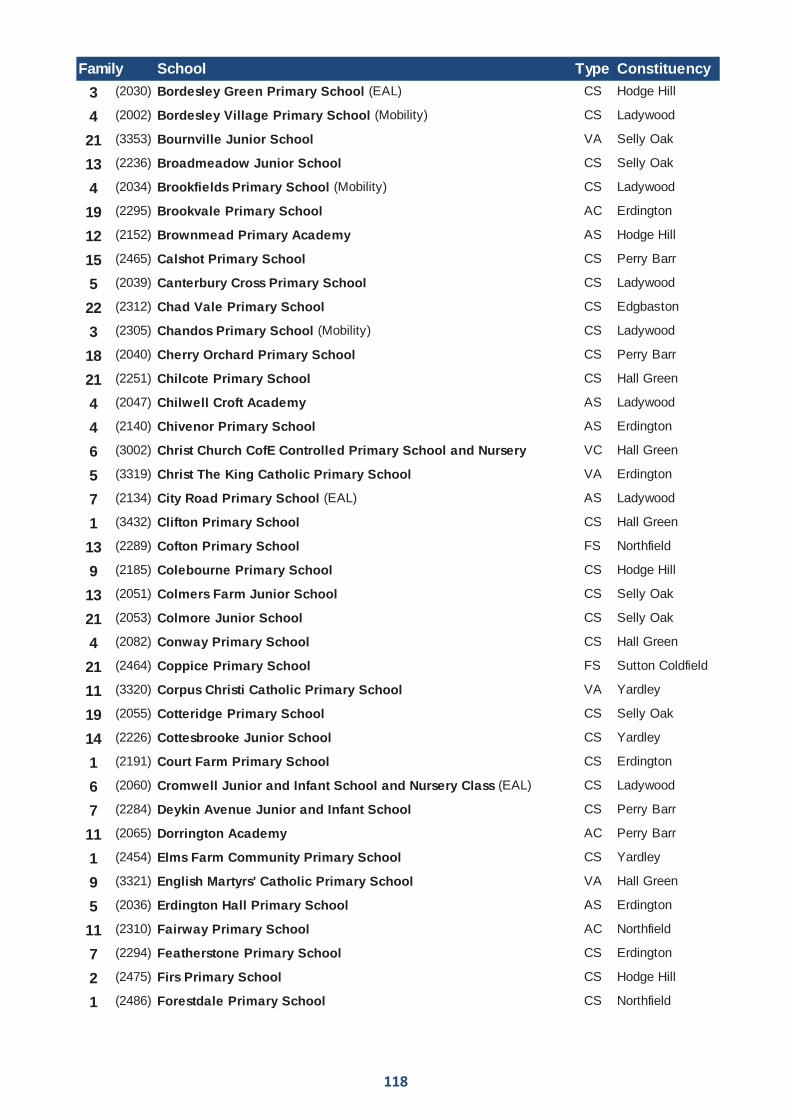
118
Family School Type Constituency
3 (2030) Bordesley Green Primary School (EAL) CS Hodge Hill
4 (2002) Bordesley Village Primary School (Mobility) CS Ladywood
21 (3353) Bournville Junior School VA Selly Oak
13 (2236) Broadmeadow Junior School CS Selly Oak
4 (2034) Brookfields Primary School (Mobility) CS Ladywood
19 (2295) Brookvale Primary School AC Erdington
12 (2152) Brownmead Primary Academy AS Hodge Hill
15 (2465) Calshot Primary School CS Perry Barr
5 (2039) Canterbury Cross Primary School CS Ladywood
22 (2312) Chad Vale Primary School CS Edgbaston
3 (2305) Chandos Primary School (Mobility) CS Ladywood
18 (2040) Cherry Orchard Primary School CS Perry Barr
21 (2251) Chilcote Primary School CS Hall Green
4 (2047) Chilwell Croft Academy AS Ladywood
4 (2140) Chivenor Primary School AS Erdington
6 (3002) Christ Church CofE Controlled Primary School and Nursery VC Hall Green
5 (3319) Christ The King Catholic Primary School VA Erdington
7 (2134) City Road Primary School (EAL) AS Ladywood
1 (3432) Clifton Primary School CS Hall Green
13 (2289) Cofton Primary School FS Northfield
9 (2185) Colebourne Primary School CS Hodge Hill
13 (2051) Colmers Farm Junior School CS Selly Oak
21 (2053) Colmore Junior School CS Selly Oak
4 (2082) Conway Primary School CS Hall Green
21 (2464) Coppice Primary School FS Sutton Coldfield
11 (3320) Corpus Christi Catholic Primary School VA Yardley
19 (2055) Cotteridge Primary School CS Selly Oak
14 (2226) Cottesbrooke Junior School CS Yardley
1 (2191) Court Farm Primary School CS Erdington
6 (2060) Cromwell Junior and Infant School and Nursery Class (EAL) CS Ladywood
7 (2284) Deykin Avenue Junior and Infant School CS Perry Barr
11 (2065) Dorrington Academy AC Perry Barr
1 (2454) Elms Farm Community Primary School CS Yardley
9 (3321) English Martyrs' Catholic Primary School VA Hall Green
5 (2036) Erdington Hall Primary School AS Erdington
11 (2310) Fairway Primary School AC Northfield
7 (2294) Featherstone Primary School CS Erdington
2 (2475) Firs Primary School CS Hodge Hill
1 (2486) Forestdale Primary School CS Northfield

119
Family School Type Constituency
9 (2109) Four Dwellings Primary Academy AS Edgbaston
22 (3435) Four Oaks Primary School FS Sutton Coldfield
5 (2079) George Dixon Primary School CS Edgbaston
15 (2081) Gilbertstone Primary School CS Yardley
18 (2296) Glenmead Primary School CS Perry Barr
9 (2448) Gossey Lane Academy AC Hodge Hill
15 (2450) Great Barr Primary School AC Perry Barr
19 (2451) Green Meadow Primary School AC Northfield
19 (2085) Greenholm Primary School AC Perry Barr
7 (2086) Greet Primary School (EAL) CS Hall Green
8 (2087) Grendon Junior and Infant School (NC) CS Selly Oak
3 (2138) Grestone Academy (Mobility) AS Perry Barr
5 (2466) Grove School CS Perry Barr
16 (3316) Guardian Angels Catholic Primary School VA Hodge Hill
9 (2091) Gunter Primary School CS Erdington
19 (2092) Hall Green Junior School CS Hall Green
19 (2477) Harborne Primary School CS Edgbaston
3 (3436) Harper Bell Seventh-day Adventist School (Mobility) VA Ladywood
3 (2121) Hawkesley Church Primary Academy AS Northfield
1 (2099) Hawthorn Primary School CS Perry Barr
2 (2313) Heath Mount Primary School (EAL) CS Hall Green
10 (2309) Heathfield Primary School (EAL) AC Perry Barr
5 (2455) Heathlands Primary Academy AC Hodge Hill
8 (2101) Highfield Junior and Infant School (EAL) AS Hodge Hill
11 (2438) Highters Heath Community School CS Selly Oak
20 (3429) Hill West Primary School AC Sutton Coldfield
9 (2434) Hillstone Primary School AC Hodge Hill
11 (3430) Hodge Hill Primary School CS Hodge Hill
15 (2474) Hollyfield Primary School FS Sutton Coldfield
13 (2288) Hollywood Primary School CS Selly Oak
21 (3402) Holy Cross Catholic Primary School AC Sutton Coldfield
12 (3317) Holy Family Catholic Primary School VA Yardley
15 (3327) Holy Souls Catholic Primary School VA Yardley
12 (3303) Holy Trinity CE Primary Academy (Handsworth) AC Perry Barr
8 (2015) James Watt Primary School CS Ladywood
3 (2111) Jervoise School AC Northfield
15 (3352) King David Junior and Infant School VA Hall Green
15 (2005) Kings Heath Primary School CS Hall Green
18 (2118) Kings Norton Junior and Infant School CS Northfield
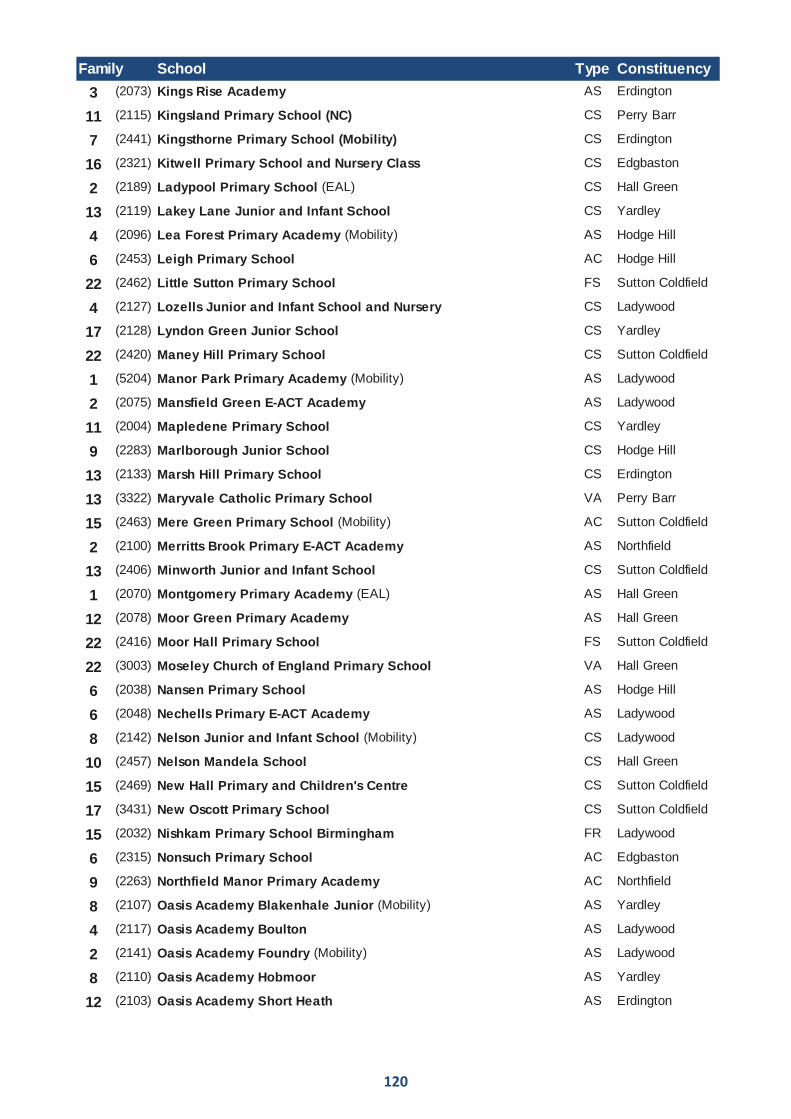
120
Family School Type Constituency
3 (2073) Kings Rise Academy AS Erdington
11 (2115) Kingsland Primary School (NC) CS Perry Barr
7 (2441) Kingsthorne Primary School (Mobility) CS Erdington
16 (2321) Kitwell Primary School and Nursery Class CS Edgbaston
2 (2189) Ladypool Primary School (EAL) CS Hall Green
13 (2119) Lakey Lane Junior and Infant School CS Yardley
4 (2096) Lea Forest Primary Academy (Mobility) AS Hodge Hill
6 (2453) Leigh Primary School AC Hodge Hill
22 (2462) Little Sutton Primary School FS Sutton Coldfield
4 (2127) Lozells Junior and Infant School and Nursery CS Ladywood
17 (2128) Lyndon Green Junior School CS Yardley
22 (2420) Maney Hill Primary School CS Sutton Coldfield
1 (5204) Manor Park Primary Academy (Mobility) AS Ladywood
2 (2075) Mansfield Green E-ACT Academy AS Ladywood
11 (2004) Mapledene Primary School CS Yardley
9 (2283) Marlborough Junior School CS Hodge Hill
13 (2133) Marsh Hill Primary School CS Erdington
13 (3322) Maryvale Catholic Primary School VA Perry Barr
15 (2463) Mere Green Primary School (Mobility) AC Sutton Coldfield
2 (2100) Merritts Brook Primary E-ACT Academy AS Northfield
13 (2406) Minworth Junior and Infant School CS Sutton Coldfield
1 (2070) Montgomery Primary Academy (EAL) AS Hall Green
12 (2078) Moor Green Primary Academy AS Hall Green
22 (2416) Moor Hall Primary School FS Sutton Coldfield
22 (3003) Moseley Church of England Primary School VA Hall Green
6 (2038) Nansen Primary School AS Hodge Hill
6 (2048) Nechells Primary E-ACT Academy AS Ladywood
8 (2142) Nelson Junior and Infant School (Mobility) CS Ladywood
10 (2457) Nelson Mandela School CS Hall Green
15 (2469) New Hall Primary and Children's Centre CS Sutton Coldfield
17 (3431) New Oscott Primary School CS Sutton Coldfield
15 (2032) Nishkam Primary School Birmingham FR Ladywood
6 (2315) Nonsuch Primary School AC Edgbaston
9 (2263) Northfield Manor Primary Academy AC Northfield
8 (2107) Oasis Academy Blakenhale Junior (Mobility) AS Yardley
4 (2117) Oasis Academy Boulton AS Ladywood
2 (2141) Oasis Academy Foundry (Mobility) AS Ladywood
8 (2110) Oasis Academy Hobmoor AS Yardley
12 (2103) Oasis Academy Short Heath AS Erdington
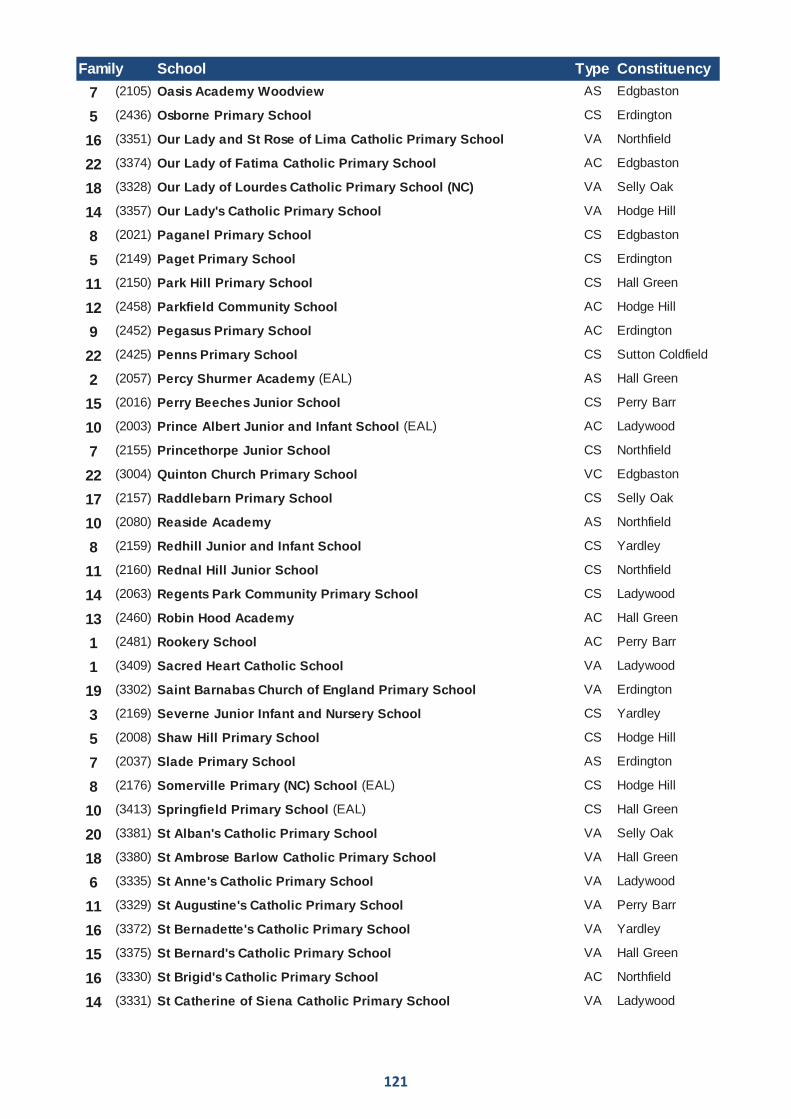
121
Family School Type Constituency
7 (2105) Oasis Academy Woodview AS Edgbaston
5 (2436) Osborne Primary School CS Erdington
16 (3351) Our Lady and St Rose of Lima Catholic Primary School VA Northfield
22 (3374) Our Lady of Fatima Catholic Primary School AC Edgbaston
18 (3328) Our Lady of Lourdes Catholic Primary School (NC) VA Selly Oak
14 (3357) Our Lady's Catholic Primary School VA Hodge Hill
8 (2021) Paganel Primary School CS Edgbaston
5 (2149) Paget Primary School CS Erdington
11 (2150) Park Hill Primary School CS Hall Green
12 (2458) Parkfield Community School AC Hodge Hill
9 (2452) Pegasus Primary School AC Erdington
22 (2425) Penns Primary School CS Sutton Coldfield
2 (2057) Percy Shurmer Academy (EAL) AS Hall Green
15 (2016) Perry Beeches Junior School CS Perry Barr
10 (2003) Prince Albert Junior and Infant School (EAL) AC Ladywood
7 (2155) Princethorpe Junior School CS Northfield
22 (3004) Quinton Church Primary School VC Edgbaston
17 (2157) Raddlebarn Primary School CS Selly Oak
10 (2080) Reaside Academy AS Northfield
8 (2159) Redhill Junior and Infant School CS Yardley
11 (2160) Rednal Hill Junior School CS Northfield
14 (2063) Regents Park Community Primary School CS Ladywood
13 (2460) Robin Hood Academy AC Hall Green
1 (2481) Rookery School AC Perry Barr
1 (3409) Sacred Heart Catholic School VA Ladywood
19 (3302) Saint Barnabas Church of England Primary School VA Erdington
3 (2169) Severne Junior Infant and Nursery School CS Yardley
5 (2008) Shaw Hill Primary School CS Hodge Hill
7 (2037) Slade Primary School AS Erdington
8 (2176) Somerville Primary (NC) School (EAL) CS Hodge Hill
10 (3413) Springfield Primary School (EAL) CS Hall Green
20 (3381) St Alban's Catholic Primary School VA Selly Oak
18 (3380) St Ambrose Barlow Catholic Primary School VA Hall Green
6 (3335) St Anne's Catholic Primary School VA Ladywood
11 (3329) St Augustine's Catholic Primary School VA Perry Barr
16 (3372) St Bernadette's Catholic Primary School VA Yardley
15 (3375) St Bernard's Catholic Primary School VA Hall Green
16 (3330) St Brigid's Catholic Primary School AC Northfield
14 (3331) St Catherine of Siena Catholic Primary School VA Ladywood

122
Family School Type Constituency
1 (3337) St Chad's Catholic Primary School VA Ladywood
8 (3406) St Clare's Catholic Primary School VA Perry Barr
6 (2059) St Clement's Church of England Academy AS Ladywood
11 (2154) St Columba's Catholic Primary School AS Northfield
11 (3386) St Cuthbert's RC Junior and Infant (NC) School VA Hodge Hill
16 (3363) St Dunstan's Catholic Primary School VA Hall Green
4 (3347) St Edmund's Catholic Primary School VA Ladywood
15 (3355) St Edward's Catholic Primary School VA Selly Oak
8 (3342) St Francis Catholic Primary School VA Perry Barr
21 (5205) St Francis Church of England Aided Primary School and Nursery VA Selly Oak
1 (2104) St George's Church of England Academy, Newtown AS Ladywood
10 (2120) St George's Church of England Primary School AS Ladywood
13 (3367) St Gerard's RC Junior and Infant School VA Erdington
18 (3358) St James Catholic Primary School AC Northfield
5 (3010) St James Church of England Primary School, Handsworth VC Perry Barr
16 (3410) St John and Monica Catholic Primary School VA Hall Green
19 (3360) St John Fisher Catholic Primary School VA Northfield
1 (2071) St John's and St Peter's CofE Academy (Mobility) AS Ladywood
16 (3306) St John's CofE Primary School AC Hall Green
15 (2158) St Joseph's Catholic Primary School AS Selly Oak
12 (3339) St Joseph's Catholic Primary School VA Ladywood
20 (3401) St Joseph's RC Primary School AC Sutton Coldfield
14 (3377) St Jude's Catholic Primary School VA Selly Oak
22 (3307) St Laurence Church Junior School VA Northfield
13 (3361) St Margaret Mary RC Junior and Infant School VA Erdington
15 (3383) St Mark's Catholic Primary School VA Perry Barr
13 (3382) St Martin de Porres Catholic Primary School VA Hall Green
3 (3350) St Mary and St John Junior and Infant School VA Erdington
16 (3015) St Marys C of E Primary and Nursery, Academy, Handsworth AC Perry Barr
22 (3344) St Mary's Catholic Primary School VA Edgbaston
22 (3025) St Mary's Church of England Primary School VC Selly Oak
6 (3016) St Matthew's CofE Primary School VC Ladywood
19 (3311) St Michael's Church of England Aided Primary School AC Edgbaston
1 (2061) St Michael's CofE Primary Academy, Handsworth AS Ladywood
22 (3403) St Nicholas Catholic Primary School AC Sutton Coldfield
8 (3346) St Patrick's Catholic Primary School VA Ladywood
4 (3366) St Paul's Catholic Primary School AC Northfield
22 (3362) St Peter and St Paul RC Junior and Infant School VA Erdington
19 (3385) St Peter's Catholic Primary School VA Edgbaston
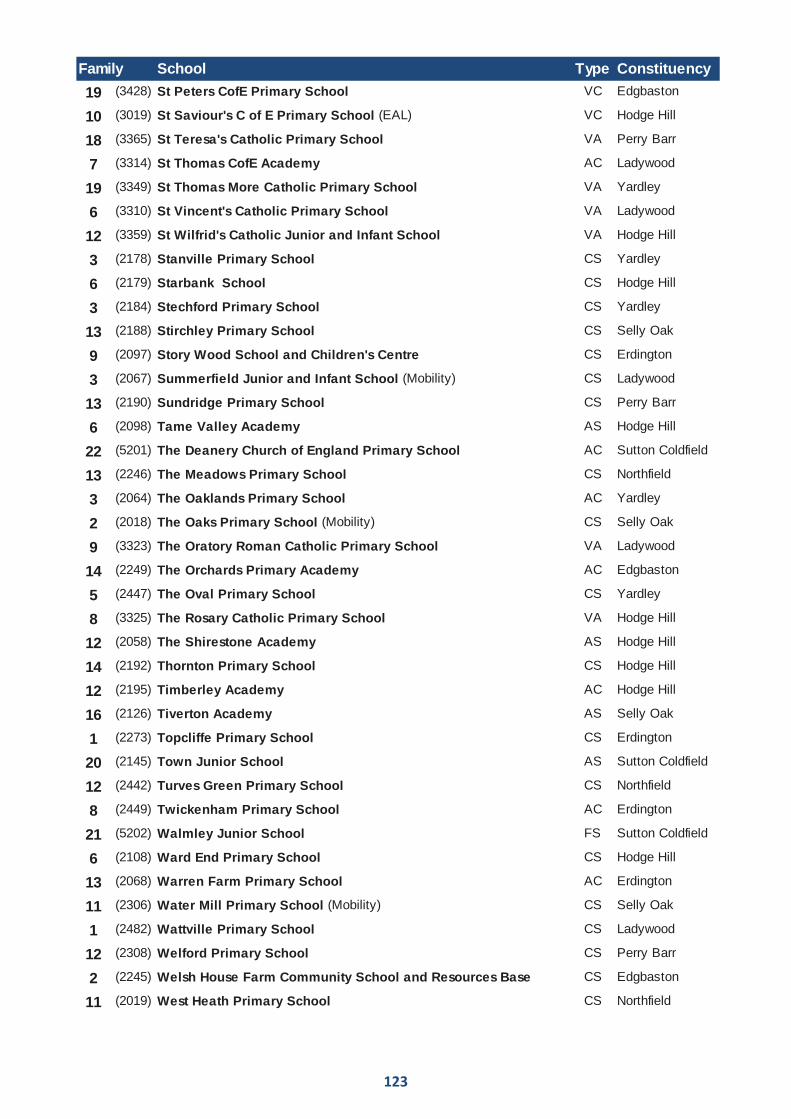
123
Family School Type Constituency
19 (3428) St Peters CofE Primary School VC Edgbaston
10 (3019) St Saviour's C of E Primary School (EAL) VC Hodge Hill
18 (3365) St Teresa's Catholic Primary School VA Perry Barr
7 (3314) St Thomas CofE Academy AC Ladywood
19 (3349) St Thomas More Catholic Primary School VA Yardley
6 (3310) St Vincent's Catholic Primary School VA Ladywood
12 (3359) St Wilfrid's Catholic Junior and Infant School VA Hodge Hill
3 (2178) Stanville Primary School CS Yardley
6 (2179) Starbank School CS Hodge Hill
3 (2184) Stechford Primary School CS Yardley
13 (2188) Stirchley Primary School CS Selly Oak
9 (2097) Story Wood School and Children's Centre CS Erdington
3 (2067) Summerfield Junior and Infant School (Mobility) CS Ladywood
13 (2190) Sundridge Primary School CS Perry Barr
6 (2098) Tame Valley Academy AS Hodge Hill
22 (5201) The Deanery Church of England Primary School AC Sutton Coldfield
13 (2246) The Meadows Primary School CS Northfield
3 (2064) The Oaklands Primary School AC Yardley
2 (2018) The Oaks Primary School (Mobility) CS Selly Oak
9 (3323) The Oratory Roman Catholic Primary School VA Ladywood
14 (2249) The Orchards Primary Academy AC Edgbaston
5 (2447) The Oval Primary School CS Yardley
8 (3325) The Rosary Catholic Primary School VA Hodge Hill
12 (2058) The Shirestone Academy AS Hodge Hill
14 (2192) Thornton Primary School CS Hodge Hill
12 (2195) Timberley Academy AC Hodge Hill
16 (2126) Tiverton Academy AS Selly Oak
1 (2273) Topcliffe Primary School CS Erdington
20 (2145) Town Junior School AS Sutton Coldfield
12 (2442) Turves Green Primary School CS Northfield
8 (2449) Twickenham Primary School AC Erdington
21 (5202) Walmley Junior School FS Sutton Coldfield
6 (2108) Ward End Primary School CS Hodge Hill
13 (2068) Warren Farm Primary School AC Erdington
11 (2306) Water Mill Primary School (Mobility) CS Selly Oak
1 (2482) Wattville Primary School CS Ladywood
12 (2308) Welford Primary School CS Perry Barr
2 (2245) Welsh House Farm Community School and Resources Base CS Edgbaston
11 (2019) West Heath Primary School CS Northfield
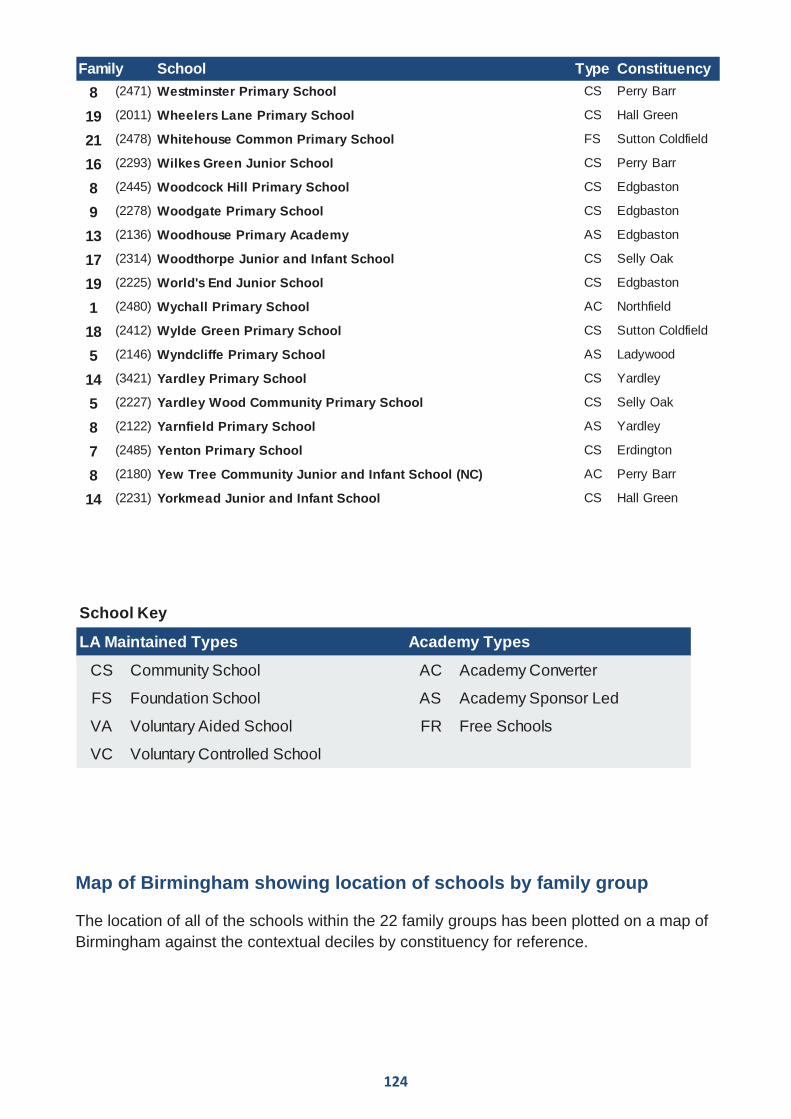
124
Map of Birmingham showing location of schools by family group
The location of all of the schools within the 22 family groups has been plotted on a map of Birmingham against the contextual deciles by constituency for reference.
Family School Type Constituency
8 (2471) Westminster Primary School CS Perry Barr
19 (2011) Wheelers Lane Primary School CS Hall Green
21 (2478) Whitehouse Common Primary School FS Sutton Coldfield
16 (2293) Wilkes Green Junior School CS Perry Barr
8 (2445) Woodcock Hill Primary School CS Edgbaston
9 (2278) Woodgate Primary School CS Edgbaston
13 (2136) Woodhouse Primary Academy AS Edgbaston
17 (2314) Woodthorpe Junior and Infant School CS Selly Oak
19 (2225) World's End Junior School CS Edgbaston
1 (2480) Wychall Primary School AC Northfield
18 (2412) Wylde Green Primary School CS Sutton Coldfield
5 (2146) Wyndcliffe Primary School AS Ladywood
14 (3421) Yardley Primary School CS Yardley
5 (2227) Yardley Wood Community Primary School CS Selly Oak
8 (2122) Yarnfield Primary School AS Yardley
7 (2485) Yenton Primary School CS Erdington
8 (2180) Yew Tree Community Junior and Infant School (NC) AC Perry Barr
14 (2231) Yorkmead Junior and Infant School CS Hall Green
School Key
LA Maintained Types Academy Types
CS Community School AC Academy Converter
FS Foundation School AS Academy Sponsor Led
VA Voluntary Aided School FR Free Schools
VC Voluntary Controlled School
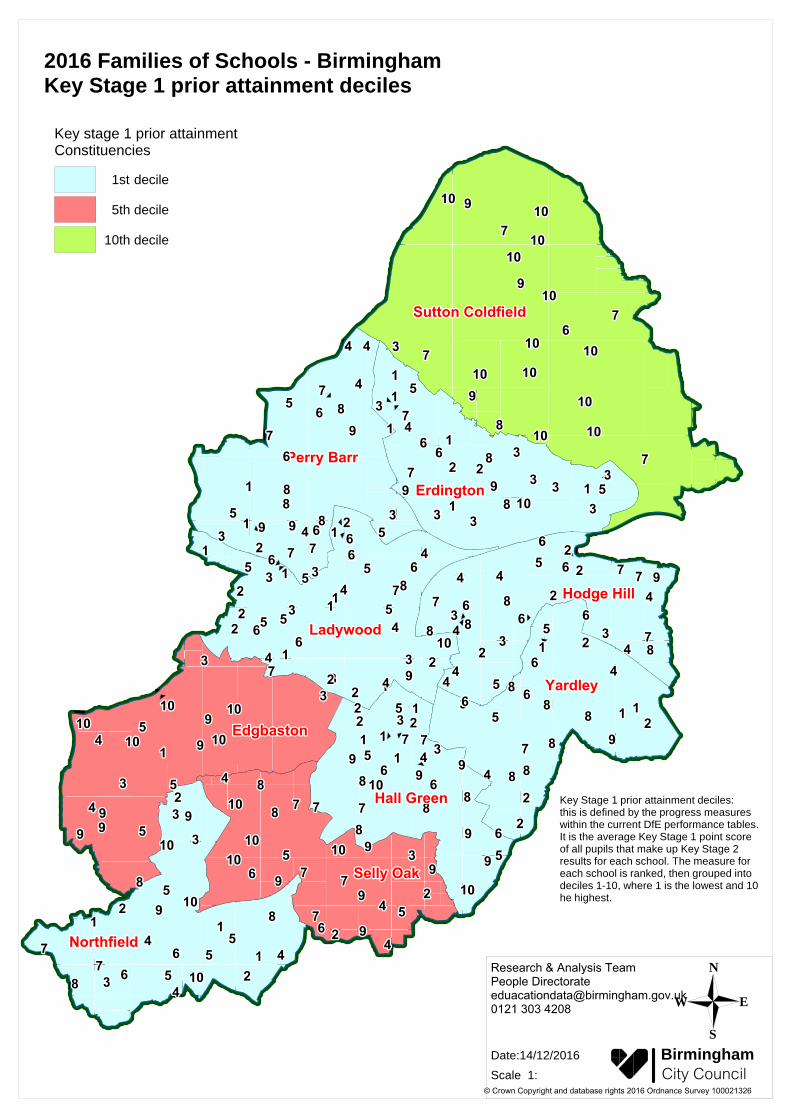
BirminghamCity Council
Date:14/12/2016
Scale 1:
N
S
EW
Key stage 1 prior attainmentConstituencies
1st decile
5th decile
10th decile
2016 Families of Schools - BirminghamKey Stage 1 prior attainment deciles
Key Stage 1 prior attainment deciles:this is defined by the progress measureswithin the current DfE performance tables.It is the average Key Stage 1 point scoreof all pupils that make up Key Stage 2results for each school. The measure foreach school is ranked, then grouped intodeciles 1-10, where 1 is the lowest and 10he highest.
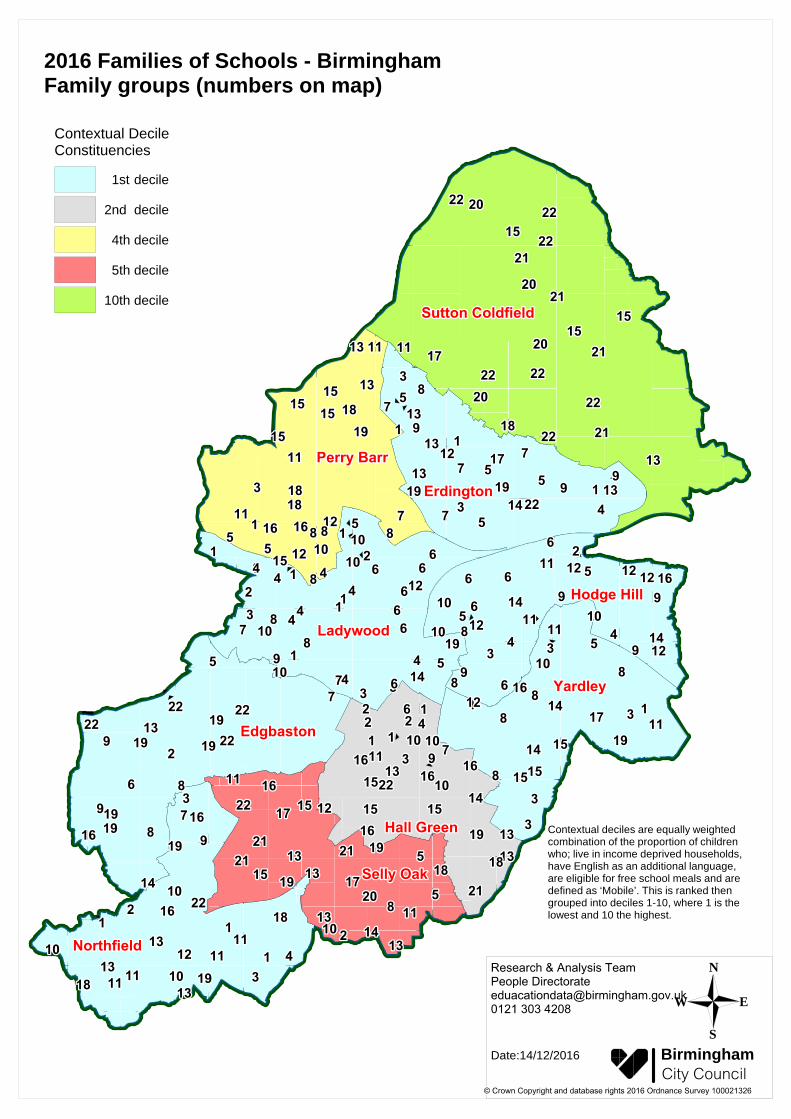
BirminghamCity Council
Date:14/12/2016
N
S
EW
Contextual DecileConstituencies
1st decile
2nd decile
4th decile
5th decile
10th decile
2016 Families of Schools - BirminghamFamily groups (numbers on map)
Contextual deciles are equally weightedcombination of the proportion of childrenwho; live in income deprived households,have English as an additional language,are eligible for free school meals and aredefined as ‘Mobile’. This is ranked thengrouped into deciles 1-10, where 1 is thelowest and 10 the highest.

This page has been intentionally left blank