fa 06cse182 cse182-l12 mass spectrometry peptide identification
Post on 21-Dec-2015
219 views
TRANSCRIPT

Fa 06 CSE182
CSE182-L12
Mass SpectrometryPeptide identification

Fa 06 CSE182
Ion mass computations
• Amino-acids are linked into peptide chains, by forming peptide bonds
• Residue mass– Res.Mass(aa) =
Mol.Mass(aa)-18– (loss of water)

Fa 06 CSE182
Peptide chains
• MolMass(SGFAL) = resM(S)+…res(L)+18

Fa 06 CSE182
M/Z values for b/y-ions
• Singly charged b-ion = ResMass(prefix) + 1
• Singly charged y-ion= ResMass(suffix)+18+1
• What if the ions have higher units of charge?
RNH+
3-CH-CO-NH-CH-COOH R
RNH+
3-CH-CO-NH-CH-CO R
H+ RNH2-CH-CO-………-NH-CH-COOH R
Ionized Peptide

Fa 06 CSE182
De novo interpretation
• Given a spectrum (a collection of b-y ions), compute the peptide that generated the spectrum.
• A database of peptides is not given!• Useful?
– Many genomes have not been sequenced, but are very useful.
– Tagging/filtering– PTMs
Fa 06 CSE182
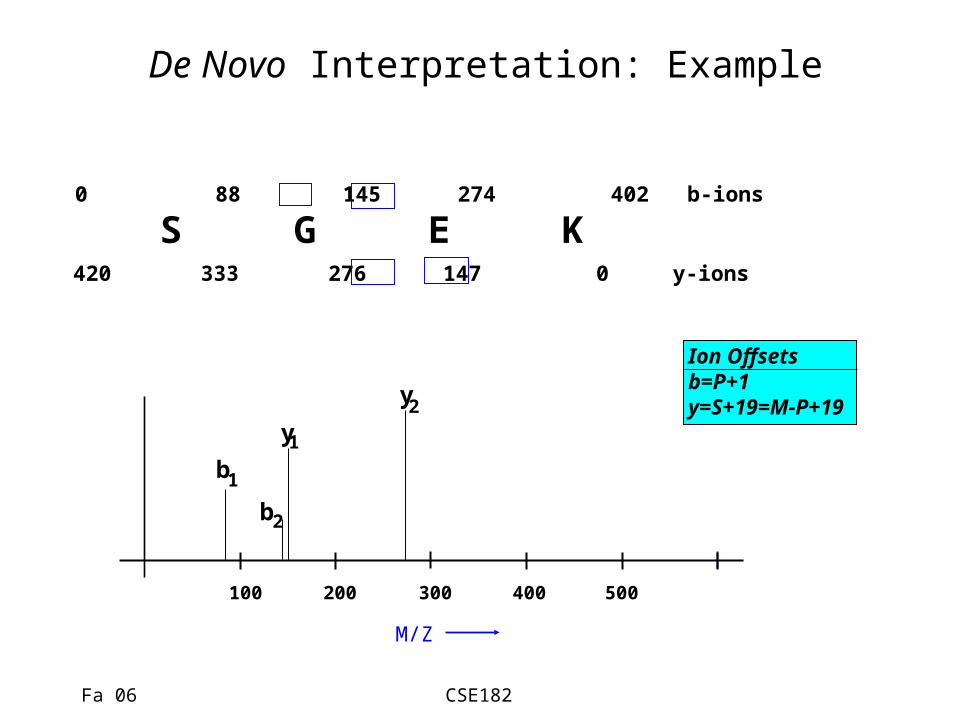
De Novo Interpretation: Example
S G E K0 88 145 274 402 b-ions
420 333 276 147 0 y-ions
b
y
y
2
100 500400300200
M/Z
b
1
1
2
Ion Offsetsb=P+1y=S+19=M-P+19
Fa 06 CSE182
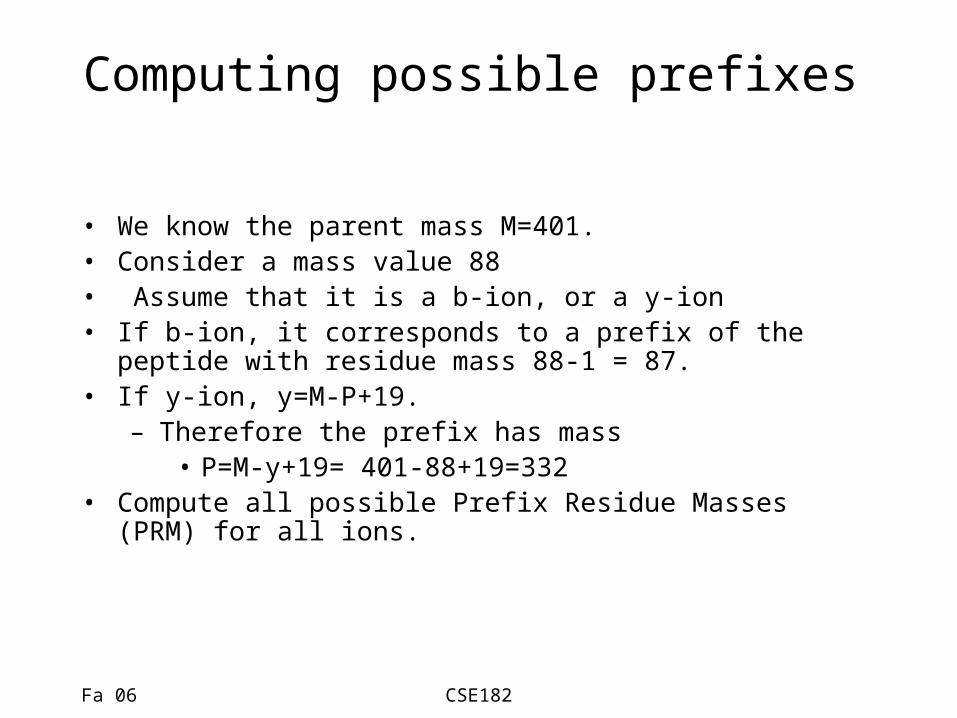
Computing possible prefixes
• We know the parent mass M=401.• Consider a mass value 88• Assume that it is a b-ion, or a y-ion• If b-ion, it corresponds to a prefix of the peptide with
residue mass 88-1 = 87.• If y-ion, y=M-P+19.
– Therefore the prefix has mass • P=M-y+19= 401-88+19=332
• Compute all possible Prefix Residue Masses (PRM) for all ions.

Fa 06 CSE182
Putative Prefix Masses
Prefix Mass
M=401 b y88 87 332145 144 275147 146 273276 275 144
S G E K0 87 144 273 401
• Only a subset of the prefix masses are correct.
• The correct mass values form a ladder of amino-acid residues
Fa 06 CSE182
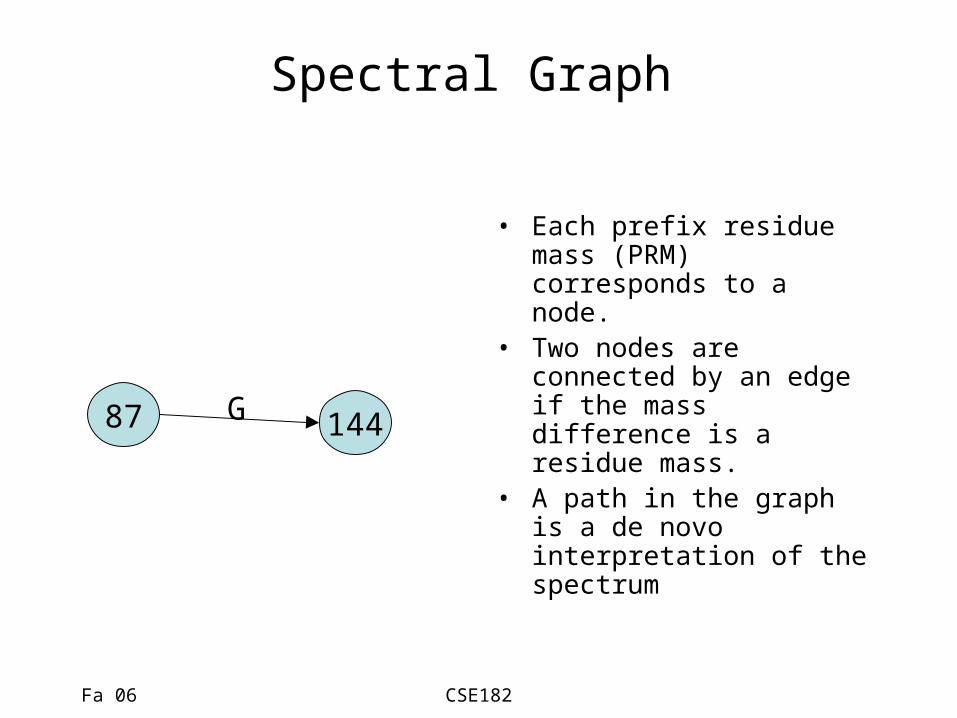
Spectral Graph
• Each prefix residue mass (PRM) corresponds to a node.
• Two nodes are connected by an edge if the mass difference is a residue mass.
• A path in the graph is a de novo interpretation of the spectrum
87 144G

Fa 06 CSE182
Spectral Graph
• Each peak, when assigned to a prefix/suffix ion type generates a unique prefix residue mass.
• Spectral graph: – Each node u defines a putative prefix residue M(u).– (u,v) in E if M(v)-M(u) is the residue mass of an a.a. (tag)
or 0.– Paths in the spectral graph correspond to a interpretation
300100
401
200
0
S G E K
27387 146144 275 332

Fa 06 CSE182
Re-defining de novo interpretation
• Find a subset of nodes in spectral graph s.t.– 0, M are included– Each peak contributes at most one node (interpretation)(*)– Each adjacent pair (when sorted by mass) is connected by an
edge (valid residue mass)– An appropriate objective function (ex: the number of peaks
interpreted) is maximized
300100
401
200
0
S G E K
27387 146144 275 332
87 144G

Fa 06 CSE182
Two problems
• Too many nodes.– Only a small fraction are correspond to b/y ions (leading to
true PRMs) (learning problem)• Multiple Interpretations
– Even if the b/y ions were correctly predicted, each peak generates multiple possibilities, only one of which is correct. We need to find a path that uses each peak only once (algorithmic problem).
– In general, the forbidden pairs problem is NP-hard
300100
401
200
0
S G E K
27387 146144 275 332
Fa 06 CSE182
Too many nodes
• We will use other properties to decide if a peak is a b-y peak or not.
• For now, assume that (u) is a score function for a peak u being a b-y ion.

Fa 06 CSE182
Multiple Interpretation
• Each peak generates multiple possibilities, only one of which is correct. We need to find a path that uses each peak only once (algorithmic problem).
• In general, the forbidden pairs problem is NP-hard
• However, The b,y ions have a special non-interleaving property
• Consider pairs (b1,y1), (b2,y2)– If (b1 < b2), then y1 > y2
Fa 06 CSE182
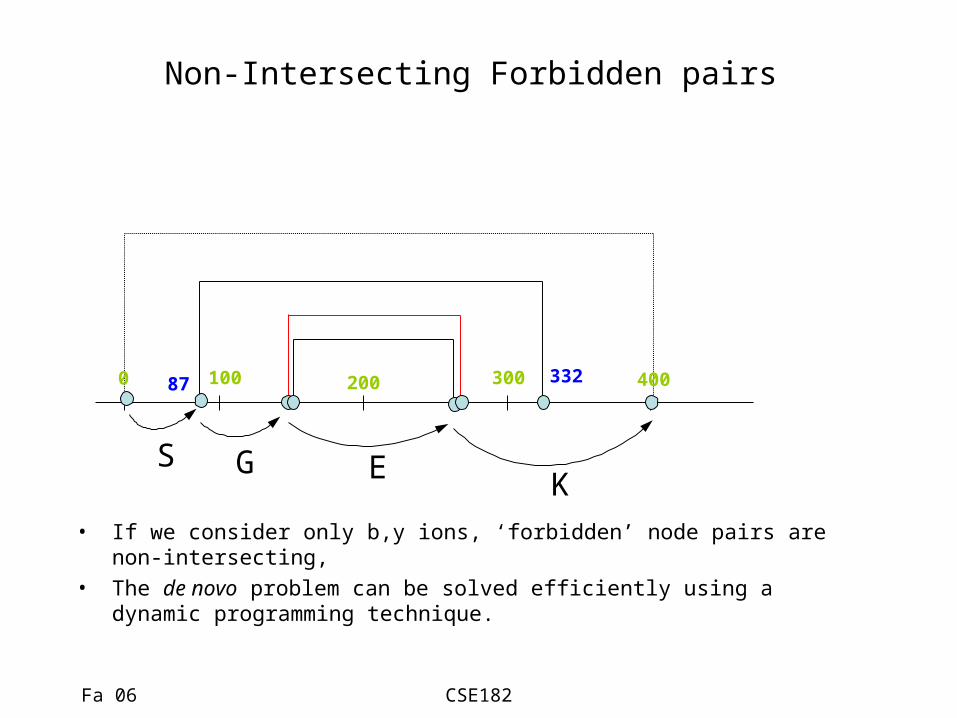
Non-Intersecting Forbidden pairs
300100 4002000
S G E K• If we consider only b,y ions, ‘forbidden’ node pairs are non-
intersecting, • The de novo problem can be solved efficiently using a dynamic
programming technique.
87 332

Fa 06 CSE182
The forbidden pairs method
• Sort the PRMs according to increasing mass values.• For each node u, f(u) represents the forbidden pair• Let m(u) denote the mass value of the PRM.• Let (u) denote the score of u• Objective: Find a path of maximum score with no
forbidden pairs.
300100 4002000 87 332
u f(u)
Fa 06 CSE182
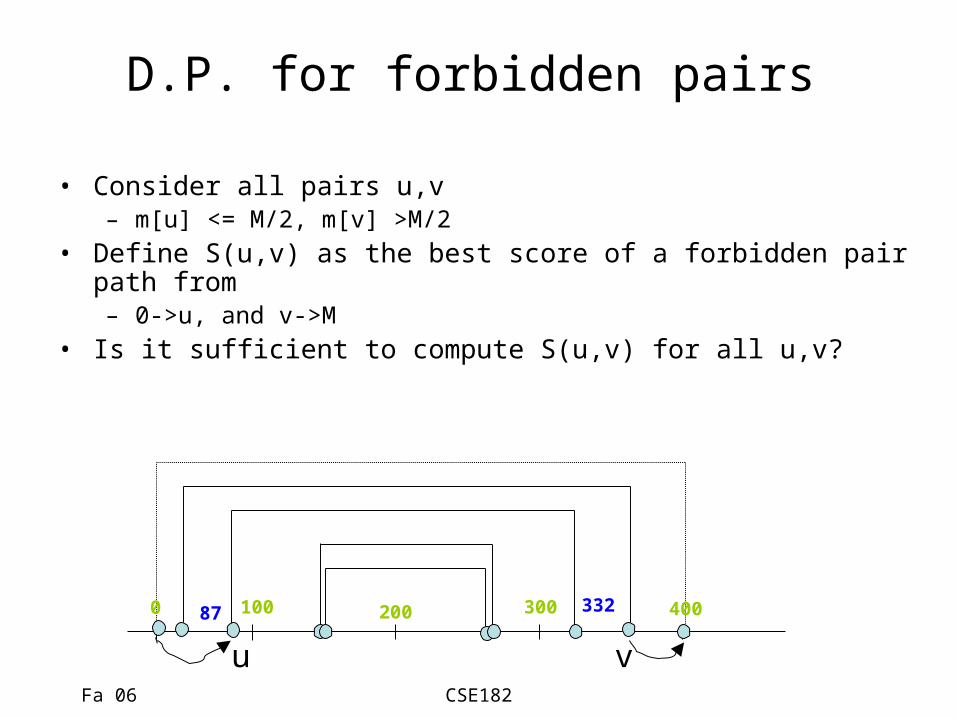
D.P. for forbidden pairs
• Consider all pairs u,v– m[u] <= M/2, m[v] >M/2
• Define S(u,v) as the best score of a forbidden pair path from – 0->u, and v->M
• Is it sufficient to compute S(u,v) for all u,v?
300100 4002000 87 332
u v

Fa 06 CSE182
D.P. for forbidden pairs
• Note that the best interpretation is given by
€
max((u,v )∈E ) S(u,v)
300100 4002000 87 332
u v
Fa 06 CSE182
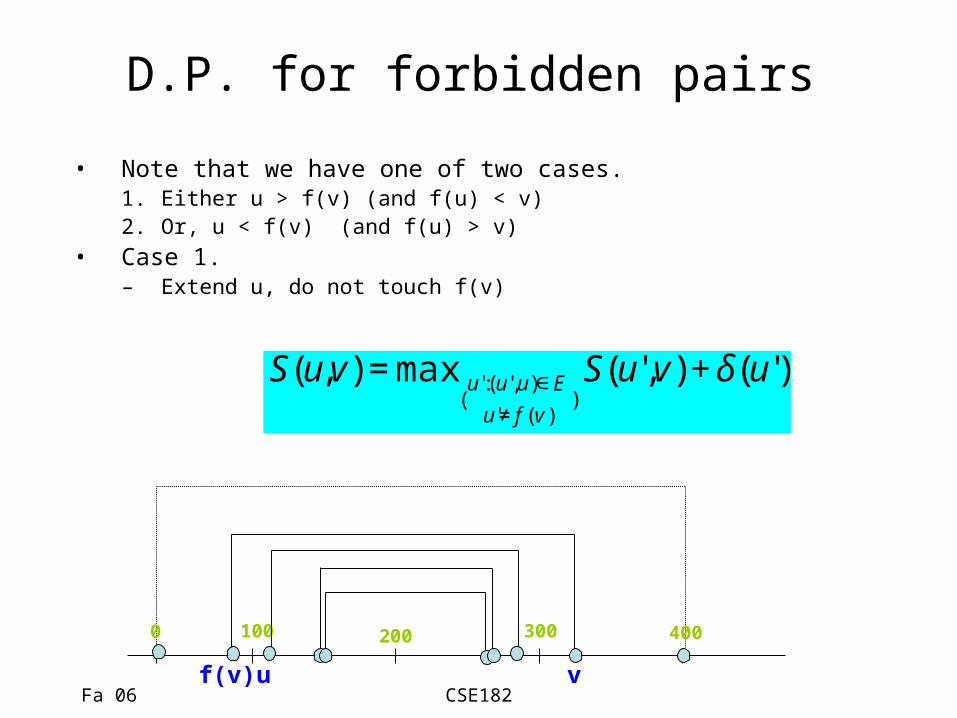
D.P. for forbidden pairs
• Note that we have one of two cases.1. Either u > f(v) (and f(u) < v)2. Or, u < f(v) (and f(u) > v)
• Case 1.– Extend u, do not touch f(v)
300100 4002000
uf(v) v
€
S(u,v) = max(u':(u',u)∈E
u'≠ f (v ))S(u',v) + δ(u')

Fa 06 CSE182
The complete algorithm
for all u /*increasing mass values from 0 to M/2 */for all v /*decreasing mass values from M to M/2 */
if (u < f[v])
else if (u > f[v])
If (u,v)E /*maxI is the score of the best interpretation*/maxI = max {maxI,S[u,v]}
€
S[u,v] = max (w,u)∈E
w≠ f (v )
⎛
⎝ ⎜
⎞
⎠ ⎟S[w,v] + δ(w)
€
S[u,v] = max (v,w )∈E
w≠ f (u)
⎛
⎝ ⎜
⎞
⎠ ⎟S[u,w] + δ(w)

Fa 06 CSE182
De Novo: Second issue
• Given only b,y ions, a forbidden pairs path will solve the problem.
• However, recall that there are MANY other ion types.– Typical length of peptide: 15– Typical # peaks? 50-150?– #b/y ions?– Most ions are “Other”
• a ions, neutral losses, isotopic peaks….
Fa 06 CSE182
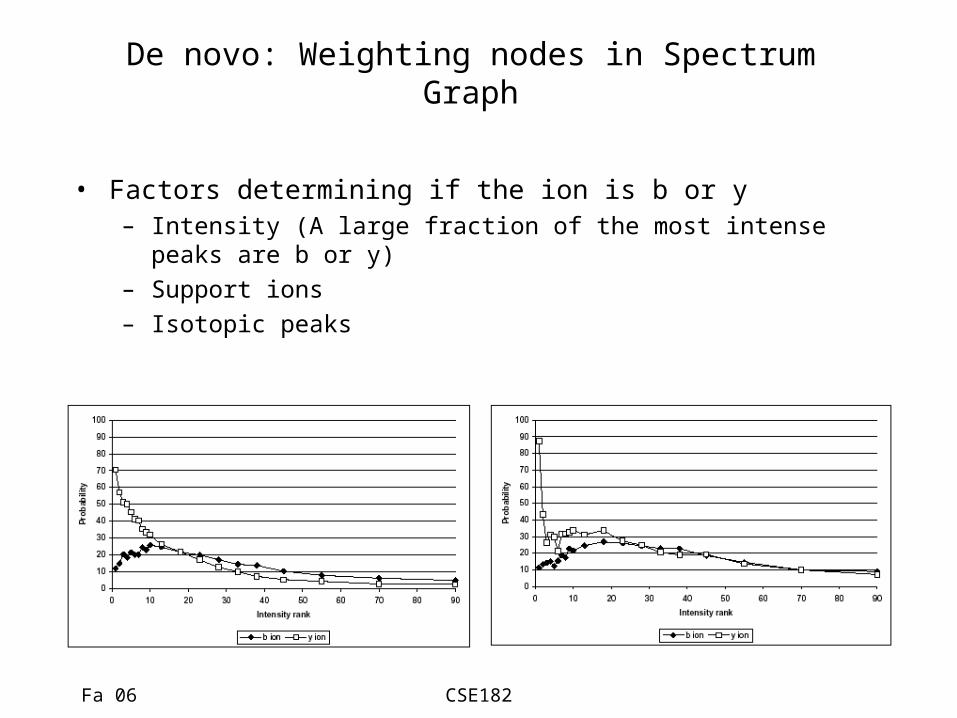
De novo: Weighting nodes in Spectrum Graph
• Factors determining if the ion is b or y– Intensity (A large fraction of the most intense peaks are b
or y)– Support ions– Isotopic peaks
Fa 06 CSE182
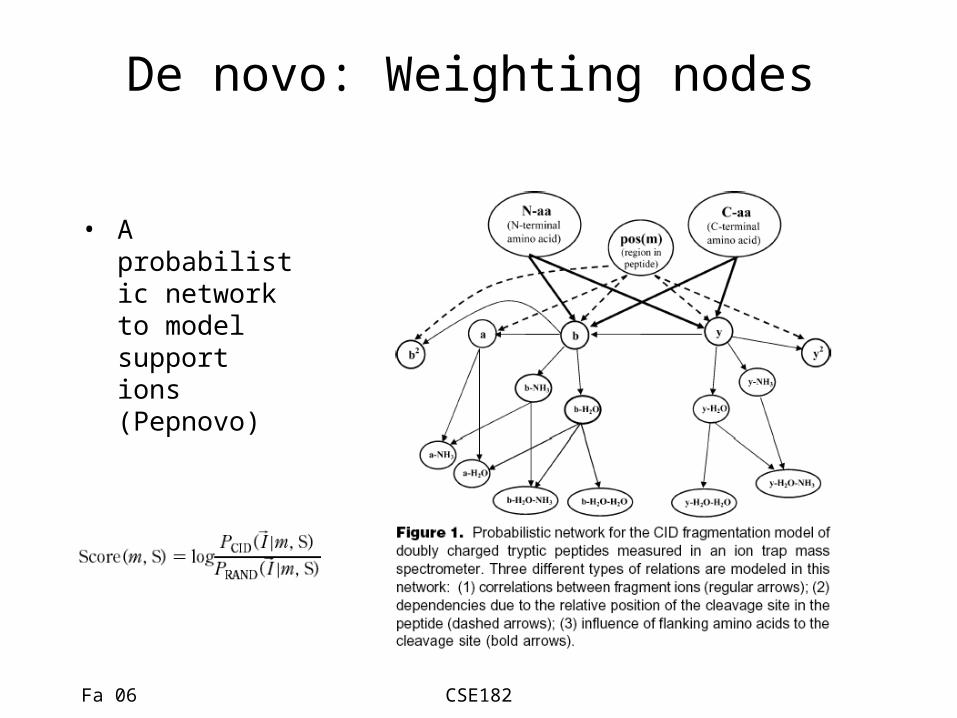
De novo: Weighting nodes
• A probabilistic network to model support ions (Pepnovo)

Fa 06 CSE182
De Novo Interpretation Summary
• The main challenge is to separate b/y ions from everything else (weighting nodes), and separating the prefix ions from the suffix ions (Forbidden Pairs).
• As always, the abstract idea must be supplemented with many details.
– Noise peaks, incomplete fragmentation– In reality, a PRM is first scored on its likelihood of being correct, and the
forbidden pair method is applied subsequently.
• In spite of these algorithms, de novo identification remains an error-prone process. When the peptide is in the database, db search is the method of choice.
Fa 06 CSE182
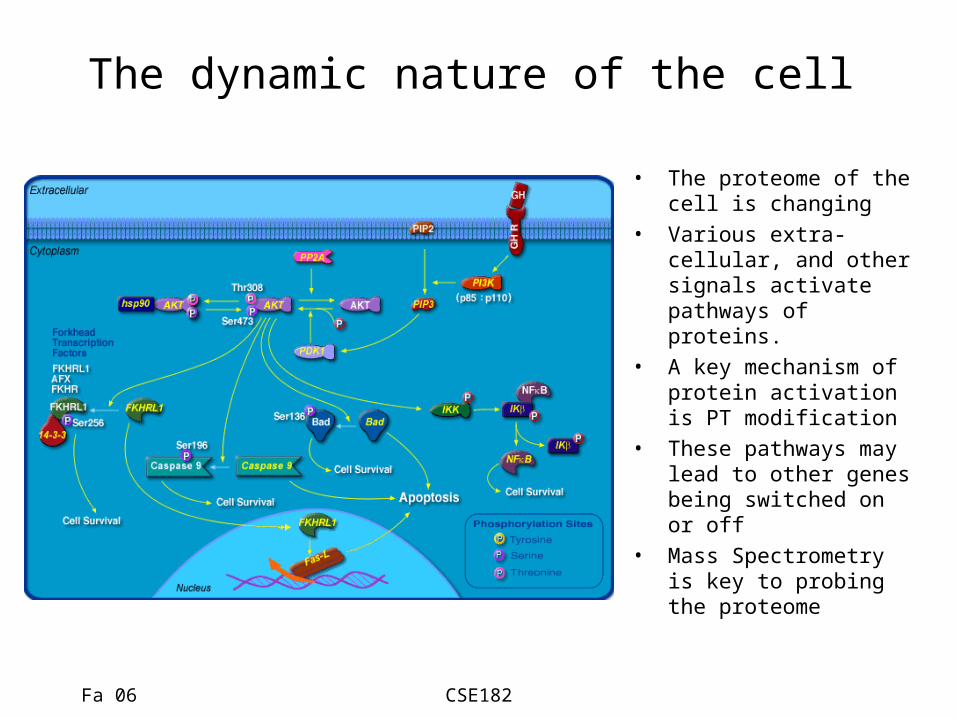
The dynamic nature of the cell
• The proteome of the cell is changing
• Various extra-cellular, and other signals activate pathways of proteins.
• A key mechanism of protein activation is PT modification
• These pathways may lead to other genes being switched on or off
• Mass Spectrometry is key to probing the proteome

Fa 06 CSE182
What happens to the spectrum upon modification?
• Consider the peptide MSTYER.
• Either S,T, or Y (one or more) can be phosphorylated
• Upon phosphorylation, the b-, and y-ions shift in a characteristic fashion. Can you determine where the modification has occurred?
11
654325432
If T is phosphorylated, b3, b4, b5, b6, and y4, y5, y6 will shift

Fa 06 CSE182
Effect of PT modifications on identification
• The shifts do not affect de novo interpretation too much. Why?
• Database matching algorithms are affected, and must be changed.
• Given a candidate peptide, and a spectrum, can you identify the sites of modifications
Fa 06 CSE182
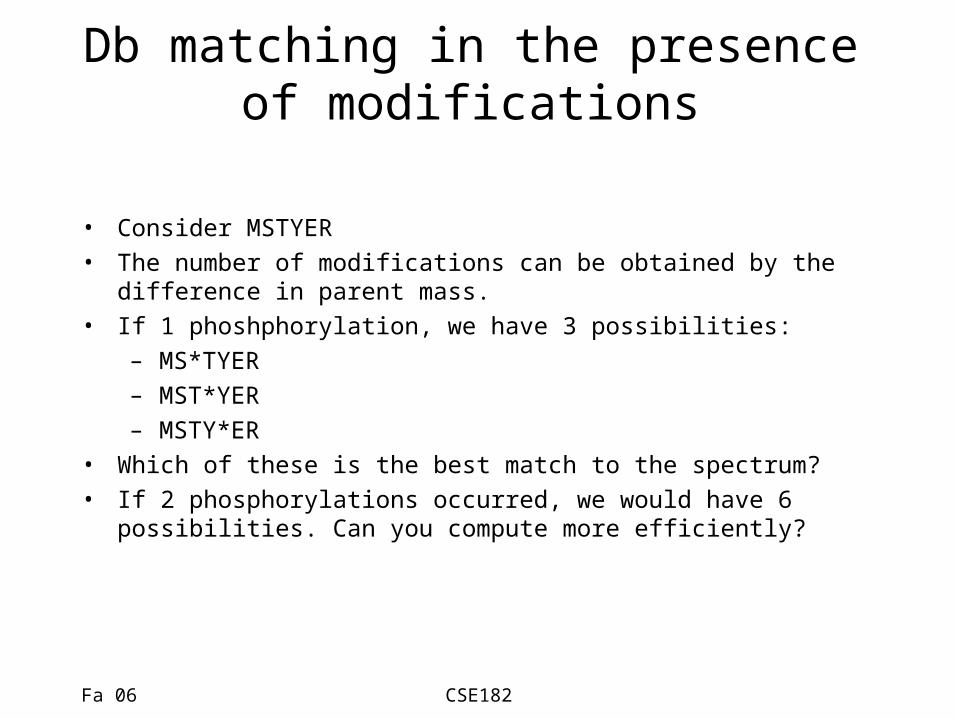
Db matching in the presence of modifications
• Consider MSTYER• The number of modifications can be obtained by the difference
in parent mass.• If 1 phoshphorylation, we have 3 possibilities:
– MS*TYER– MST*YER– MSTY*ER
• Which of these is the best match to the spectrum?• If 2 phosphorylations occurred, we would have 6 possibilities.
Can you compute more efficiently?
Fa 06 CSE182
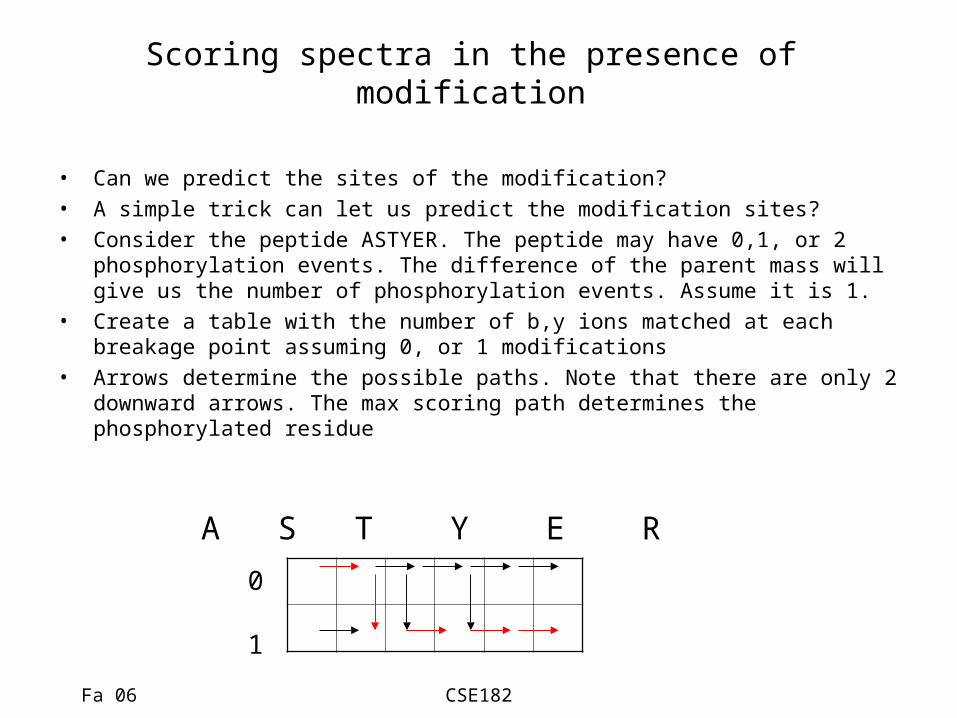
Scoring spectra in the presence of modification
• Can we predict the sites of the modification?• A simple trick can let us predict the modification sites?• Consider the peptide ASTYER. The peptide may have 0,1, or 2
phosphorylation events. The difference of the parent mass will give us the number of phosphorylation events. Assume it is 1.
• Create a table with the number of b,y ions matched at each breakage point assuming 0, or 1 modifications
• Arrows determine the possible paths. Note that there are only 2 downward arrows. The max scoring path determines the phosphorylated residue
A S T Y E R
0
1
Fa 06 CSE182
Modifications
• Modifications significantly increase the time of search.
• The algorithm speeds it up somewhat, but is still expensive
Fa 06 CSE182
Fast identification of modified peptides

Fa 06 CSE182
Filtering Peptides to speed up search
Filter SignificanceScoreextension
De novo
Db55M peptides
CandidatePeptides
Database
MDERHILNMKLQWVCSDLPTYWASDLENQIKRSACVMTLACHGGEMNGALPQWRTHLLERTYKMNVVGGPASSDALITGMQSDPILLVCATRGHEWAILFGHNLWACVNMLETAIKLEGVFGSVLRAEKLNKAA
PETYIN..As with genomic sequence, we build computational filters that eliminate much of the database, leaving only a few candidates for the more expensive scoring.

Fa 06 CSE182
Basic Filtering
• Typical tools score all peptides with close enough parent mass and tryptic termini
• Filtering by parent mass is problematic when PTMs are allowed, as one must consider multiple parent masses

Fa 06 CSE182
Tag-based filtering
• A tag is a short peptide with a prefix and suffix mass• Efficient: An average tripeptide tag matches Swiss-Prot
~700 times• Analogy: Using tags to search the proteome is similar to
moving from full Smith-Waterman alignment to BLAST

Fa 06 CSE182
Tag generation
WR
A
C
VG
E
K
DW
LP
T
L T
TAG Prefix Mass
AVG 0.0
WTD 120.2
PET 211.4
• Using local paths in the spectrum graph, construct peptide tags.• Use the top ten tags to filter the database• Tagging is related to de novo sequencing yet different.• Objective: Compute a subset of short strings, at least one of
which must be correct. Longer tags=> better filter.

Fa 06 CSE182
Tag based search using tries
YFDDSTSTDTDYYNM
Y
M
F D
N
Y
M
F D
N
…..YFDSTGSGIFDESTMTKTYFDSTDYNMAK….
De novo trie
scan
Fa 06 CSE182
Modification Summary
• Modifications shift spectra in characteristic ways.
• A modification sensitive database search can identify modifications, but is computationally expensive
• Filtering using de novo tag generation can speed up the process making identification of modified peptides tractable.

Fa 06 CSE182
MS based quantitation
Fa 06 CSE182
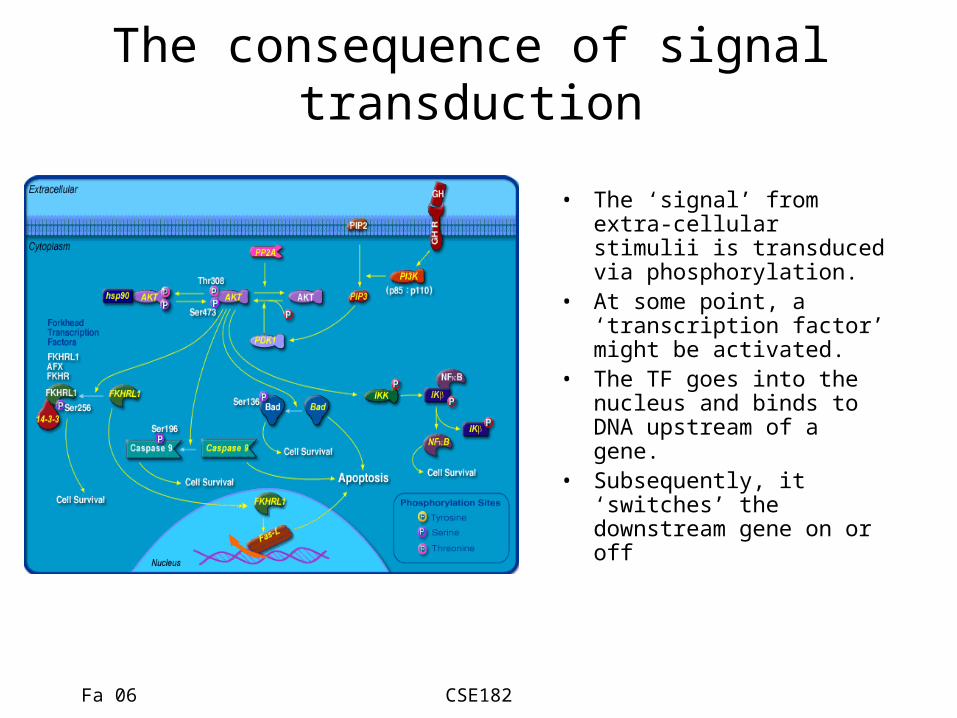
The consequence of signal transduction
• The ‘signal’ from extra-cellular stimulii is transduced via phosphorylation.
• At some point, a ‘transcription factor’ might be activated.
• The TF goes into the nucleus and binds to DNA upstream of a gene.
• Subsequently, it ‘switches’ the downstream gene on or off

Fa 06 CSE182
Transcription
• Transcription is the process of ‘transcribing’ or copying a gene from DNA to RNA
Fa 06 CSE182
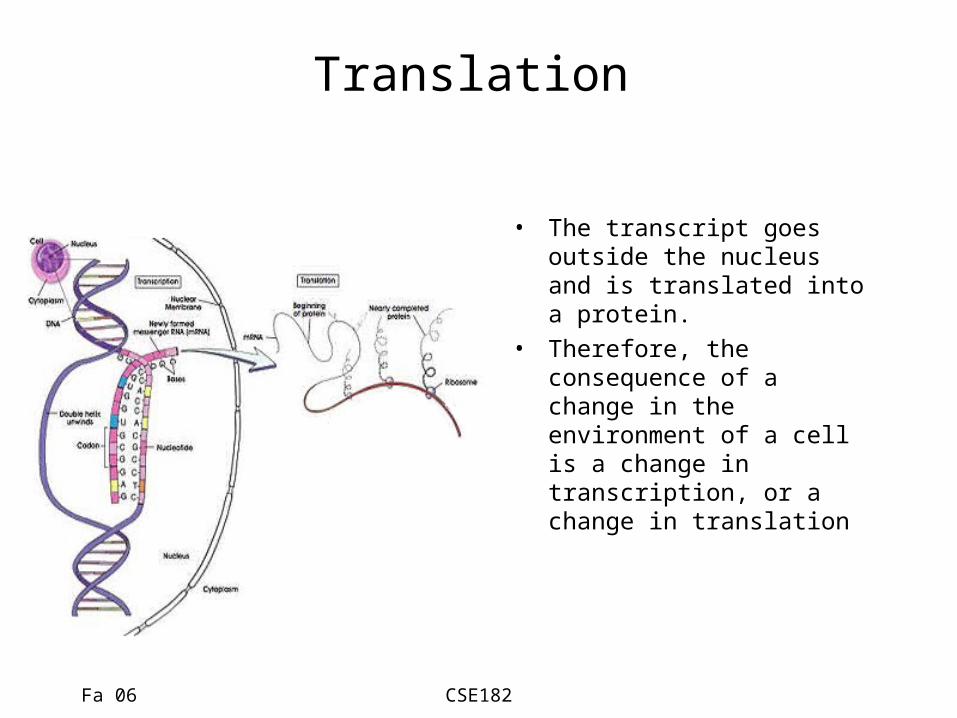
Translation
• The transcript goes outside the nucleus and is translated into a protein.
• Therefore, the consequence of a change in the environment of a cell is a change in transcription, or a change in translation

Fa 06 CSE182
Quantitation: Gene/Protein Expression
mRNA1
mRNA1
mRNA1
mRNA1
mRNA1
100 43520 Protein 1
Protein 2
Protein 3
Sample 1 Sample 2Sample 1 Sample2
Our Goal is to construct a matrix as shown for proteins, and RNA, and use it to identify differentially expressed transcripts/proteins
Fa 06 CSE182
Gene Expression
• Measuring expression at transcript level is done by micro-arrays and other tools
• Expression at the protein level is being done using mass spectrometry.
• Two problems arise:– Data: How to populate the matrices on the previous slide?
(‘easy’ for mRNA, difficult for proteins)– Analysis: Is a change in expression significant? (Identical
for both mRNA, and proteins). • We will consider the data problem here. The analysis
problem will be considered when we discuss micro-arrays.