f1cdxtech | roche foundation medicine
TRANSCRIPT

Page 1 of 36 RAL-0011, Ver. 02
FoundationOne CDx Technical Information Foundation Medicine, Inc. 150 Second Street, Cambridge, MA 02141 USA FMI Germany GmbH Nonnenwald 2, Building 433 82377 Penzberg Germany Intended Use FoundationOne® CDx (F1CDx) is a next generation sequencing based in vitro diagnostic device for detection of substitutions, insertion and deletion alterations (indels), and copy number alterations (CNAs) in 324 genes and select gene rearrangements, as well as genomic signatures including microsatellite instability (MSI) and tumor mutational burden (TMB) using DNA isolated from formalin-fixed paraffin embedded (FFPE) tumor tissue specimens. The test is intended as a companion diagnostic to identify patients who may benefit from treatment with therapies in accordance with approved therapeutic product labeling. Additionally, F1CDx is intended to provide tumor mutation profiling to be used by qualified health care professionals in accordance with professional guidelines in oncology for patients with solid malignant neoplasms. Contraindication There are no known contraindications. Warnings and Precautions
• Alterations reported may include somatic (not inherited) or germline (inherited) alterations; however, the test does not distinguish between germline and somatic alterations. The test does not provide information about susceptibility.
• Biopsy may pose a risk to the patient when archival tissue is not available for use with the assay. The patient’s physician should determine whether the patient is a candidate for biopsy.
Limitations
• For in vitro diagnostic use. • For prescription use only. This test must be ordered by a qualified medical professional in accordance
with clinical laboratory regulations. • A negative result does not rule out the presence of a mutation below the limits of detection of the assay. • Samples with <25% tumor may have decreased sensitivity for the detection of CNAs including ERBB2. • Concordance with other validated methods for CNA (with the exception of ERBB2) and gene
rearrangement (with the exception of ALK) detection has not been demonstrated. • The MSI-H/MSS designation by FMI F1CDx test is based on genome wide analysis of 95 microsatellite
loci and not based on the 5 or 7 MSI loci described in current clinical practice guidelines. Refer to the summary of safety and effectiveness data (SSED) of F1CDx at: https://www.accessdata.fda.gov/cdrh_docs/pdf17/P170019B.pdf for additional details on methodology. The threshold for MSI-H/MSS was determined by analytical concordance to comparator assays (IHC and PCR) using uterine, cecum and colorectal cancer FFPE tissue. The clinical validity of the qualitative MSI designation has not been established.
• TMB by F1CDx is defined based on counting the total number of all synonymous and non-synonymous variants present at 5% allele frequency or greater (after filtering) and reported as mutations per megabase (mut/Mb) unit. The clinical validity of TMB defined by this panel has not been established.
• Decisions on patient care and treatment must be based on the independent medical judgment of the treating physician, taking into consideration all applicable information concerning the patient’s condition,

Page 2 of 36 RAL-0011, Ver. 02
such as patient and family history, physical examinations, information from other diagnostic tests, and patient preferences, in accordance with the standard of care in a given community.
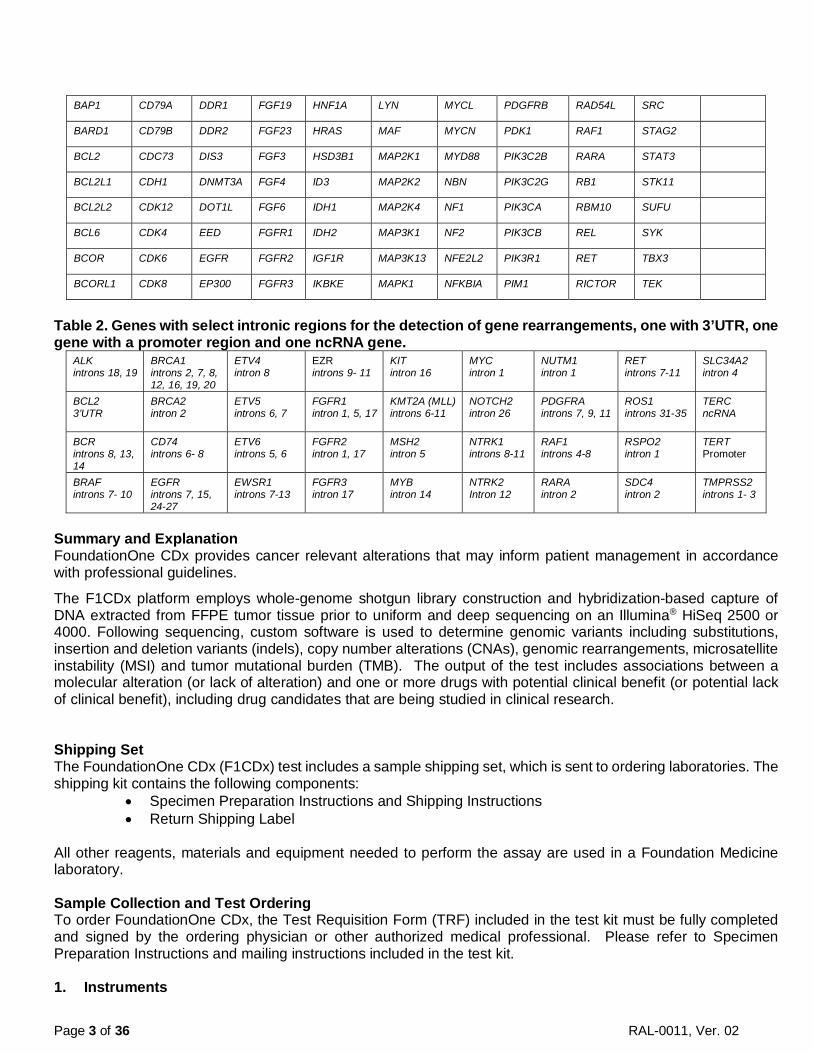
Test Principle FoundationOne CDx (F1CDx) is performed as a laboratory service using DNA extracted from formalin-fixed, paraffin-embedded (FFPE) tumor samples. The assay employs a single DNA extraction method from routine FFPE biopsy or surgical resection specimens, 50-1000 ng of which will undergo whole-genome shotgun library construction and hybridization-based capture of all coding exons from 309 cancer-related genes, one promoter region, one non-coding (ncRNA), and select intronic regions from 34 commonly rearranged genes, 21 of which also include the coding exons (refer to Table 1 and Table 2 for complete list of genes included in F1CDx). In total, the assay detects alterations in a total of 324 genes. Using an Illumina® HiSeq 2500 or 4000 platform, hybrid capture–selected libraries are sequenced to high uniform depth (targeting >500X median coverage with >99% of exons at coverage >100X). Sequence data is then processed using a customized analysis pipeline designed to detect all classes of genomic alterations, including base substitutions, indels, copy number alterations (amplifications and homozygous gene deletions), and selected genomic rearrangements (e.g., gene fusions). Additionally, genomic signatures including microsatellite instability (MSI) and tumor mutational burden (TMB) are reported. Table 1. Genes with full coding exonic regions included in FoundationOne CDx for the detection of substitutions, insertions and deletions (indels), and copy number alterations (CNAs).
ABL1 BRAF CDKN1A EPHA3 FGFR4 IKZF1 MCL1 NKX2-1 PMS2 RNF43 TET2
ACVR1B BRCA1 CDKN1B EPHB1 FH INPP4B MDM2 NOTCH1 POLD1 ROS1 TGFBR2
AKT1 BRCA2 CDKN2A EPHB4 FLCN IRF2 MDM4 NOTCH2 POLE RPTOR TIPARP
AKT2 BRD4 CDKN2B ERBB2 FLT1 IRF4 MED12 NOTCH3 PPARG SDHA TNFAIP3
AKT3 BRIP1 CDKN2C ERBB3 FLT3 IRS2 MEF2B NPM1 PPP2R1A SDHB TNFRSF14
ALK BTG1 CEBPA ERBB4 FOXL2 JAK1 MEN1 NRAS PPP2R2A SDHC TP53
ALOX12B BTG2 CHEK1 ERCC4 FUBP1 JAK2 MERTK NT5C2 PRDM1 SDHD TSC1
AMER1 BTK CHEK2 ERG GABRA6 JAK3 MET NTRK1 PRKAR1A SETD2 TSC2
APC C11orf30 CIC ERRFI1 GATA3 JUN MITF NTRK2 PRKCI SF3B1 TYRO3
AR CALR CREBBP ESR1 GATA4 KDM5A MKNK1 NTRK3 PTCH1 SGK1 U2AF1
ARAF CARD11 CRKL EZH2 GATA6 KDM5C MLH1 P2RY8 PTEN SMAD2 VEGFA
ARFRP1 CASP8 CSF1R FAM46C GID4 (C17orf39) KDM6A MPL PALB2 PTPN11 SMAD4 VHL
ARID1A CBFB CSF3R FANCA GNA11 KDR MRE11A PARK2 PTPRO SMARCA4 WHSC1
ASXL1 CBL CTCF FANCC GNA13 KEAP1 MSH2 PARP1 QKI SMARCB1 WHSC1L1
ATM CCND1 CTNNA1 FANCG GNAQ KEL MSH3 PARP2 RAC1 SMO WT1
ATR CCND2 CTNNB1 FANCL GNAS KIT MSH6 PARP3 RAD21 SNCAIP XPO1
ATRX CCND3 CUL3 FAS GRM3 KLHL6 MST1R PAX5 RAD51 SOCS1 XRCC2
AURKA CCNE1 CUL4A FBXW7 GSK3B KMT2A (MLL) MTAP PBRM1 RAD51B SOX2 ZNF217
AURKB CD22 CXCR4 FGF10 H3F3A KMT2D (MLL2) MTOR PDCD1 RAD51C SOX9 ZNF703
AXIN1 CD274 CYP17A1 FGF12 HDAC1 KRAS MUTYH PDCD1LG2 RAD51D SPEN
AXL CD70 DAXX FGF14 HGF LTK MYC PDGFRA RAD52 SPOP
Page 3 of 36 RAL-0011, Ver. 02
BAP1 CD79A DDR1 FGF19 HNF1A LYN MYCL PDGFRB RAD54L SRC
BARD1 CD79B DDR2 FGF23 HRAS MAF MYCN PDK1 RAF1 STAG2
BCL2 CDC73 DIS3 FGF3 HSD3B1 MAP2K1 MYD88 PIK3C2B RARA STAT3
BCL2L1 CDH1 DNMT3A FGF4 ID3 MAP2K2 NBN PIK3C2G RB1 STK11
BCL2L2 CDK12 DOT1L FGF6 IDH1 MAP2K4 NF1 PIK3CA RBM10 SUFU
BCL6 CDK4 EED FGFR1 IDH2 MAP3K1 NF2 PIK3CB REL SYK
BCOR CDK6 EGFR FGFR2 IGF1R MAP3K13 NFE2L2 PIK3R1 RET TBX3
BCORL1 CDK8 EP300 FGFR3 IKBKE MAPK1 NFKBIA PIM1 RICTOR TEK
Table 2. Genes with select intronic regions for the detection of gene rearrangements, one with 3’UTR, one gene with a promoter region and one ncRNA gene.
ALK introns 18, 19
BRCA1 introns 2, 7, 8, 12, 16, 19, 20
ETV4 intron 8
EZR introns 9- 11
KIT intron 16
MYC intron 1
NUTM1 intron 1
RET introns 7-11
SLC34A2 intron 4
BCL2 3’UTR
BRCA2 intron 2
ETV5 introns 6, 7
FGFR1 intron 1, 5, 17
KMT2A (MLL) introns 6-11
NOTCH2 intron 26
PDGFRA introns 7, 9, 11
ROS1 introns 31-35
TERC ncRNA
BCR introns 8, 13, 14
CD74 introns 6- 8
ETV6 introns 5, 6
FGFR2 intron 1, 17
MSH2 intron 5
NTRK1 introns 8-11
RAF1 introns 4-8
RSPO2 intron 1
TERT Promoter
BRAF introns 7- 10
EGFR introns 7, 15, 24-27
EWSR1 introns 7-13
FGFR3 intron 17
MYB intron 14
NTRK2 Intron 12
RARA intron 2
SDC4 intron 2
TMPRSS2 introns 1- 3
Summary and Explanation FoundationOne CDx provides cancer relevant alterations that may inform patient management in accordance with professional guidelines.
The F1CDx platform employs whole-genome shotgun library construction and hybridization-based capture of DNA extracted from FFPE tumor tissue prior to uniform and deep sequencing on an Illumina® HiSeq 2500 or 4000. Following sequencing, custom software is used to determine genomic variants including substitutions, insertion and deletion variants (indels), copy number alterations (CNAs), genomic rearrangements, microsatellite instability (MSI) and tumor mutational burden (TMB). The output of the test includes associations between a molecular alteration (or lack of alteration) and one or more drugs with potential clinical benefit (or potential lack of clinical benefit), including drug candidates that are being studied in clinical research. Shipping Set The FoundationOne CDx (F1CDx) test includes a sample shipping set, which is sent to ordering laboratories. The shipping kit contains the following components:
• Specimen Preparation Instructions and Shipping Instructions • Return Shipping Label
All other reagents, materials and equipment needed to perform the assay are used in a Foundation Medicine laboratory. Sample Collection and Test Ordering To order FoundationOne CDx, the Test Requisition Form (TRF) included in the test kit must be fully completed and signed by the ordering physician or other authorized medical professional. Please refer to Specimen Preparation Instructions and mailing instructions included in the test kit. 1. Instruments

Page 4 of 36 RAL-0011, Ver. 02
The FoundationOne CDx device is intended to be performed with the following instruments: • Agilent Technologies Benchbot Workstation with Integrated Bravo Automated Liquid Handler
(Cambridge laboratory only) • Beckman Biomek NXP Span-8 Liquid Handler or Hamilton Automated Liquid Handler • Covaris LE220 Focused ultrasonicator • Thermo Fisher Scientific KingFisher™ Flex with 96 Deep-well Head • Illumina® cBot System • Illumina® HiSeq 2500 or 4000 System
2. Performance Characteristics
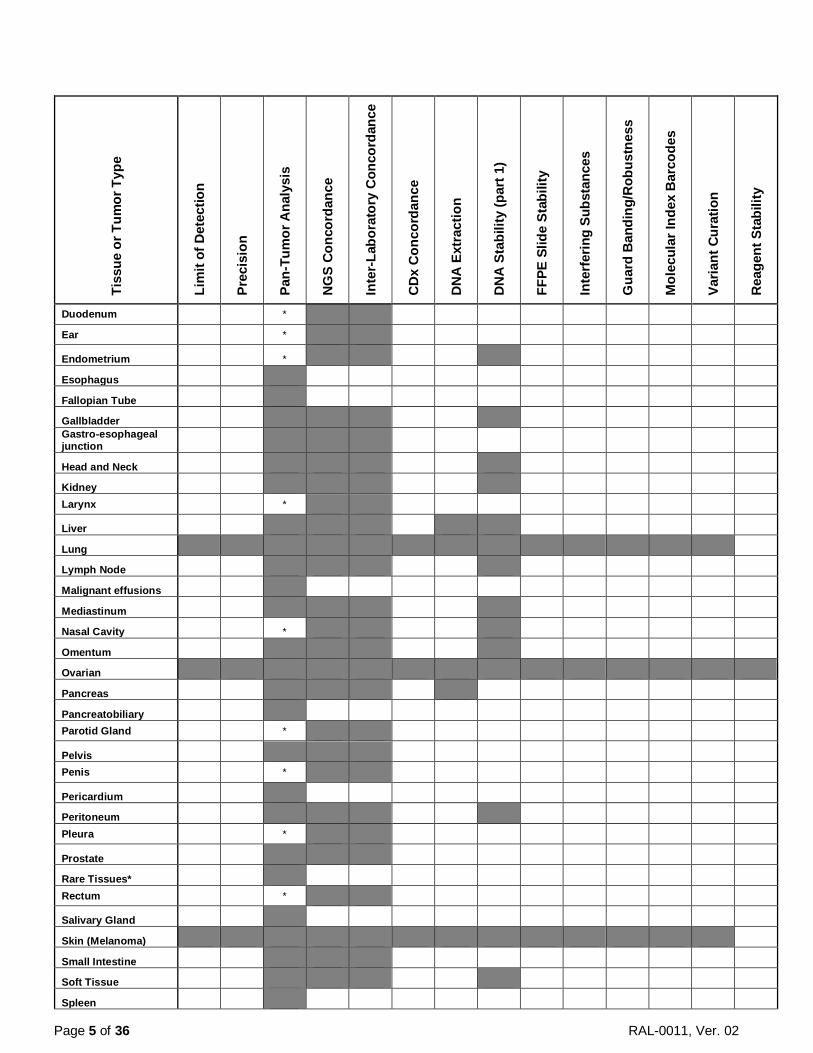
F1CDx was originally developed by Foundation Medicine in the Cambridge laboratory, USA. F1CDx was analytically validated in the Penzberg laboratory, Germany, through an inter-laboratory concordance study. The results from this concordance study met pre-determined acceptance criteria and have thus demonstrated equivalence between F1CDx run in the Cambridge laboratory and the Penzberg laboratory. Performance characteristics described herein were established in F1CDx run in the Cambridge laboratory and highly similar performances are anticipated for F1CDx run in the Penzberg laboratory. Performance characteristics of F1CDx were established using DNA derived from a wide range of FFPE tissue types. Table 3 below provides a summary of tissue types included in each study. Each study also included a broad range of representative alteration types for each class of alteration (substitution, insertion-deletion, copy number alterations, and rearrangements) in various genomic contexts across a broad selection of genes as well as analysis of genomic signatures including MSI and TMB. Table 4 provides a summary of genes and alteration types associated with validation studies. Table 3. Summary of Tissue Types Included in Validation Studies.
Tiss
ue o
r Tum
or T
ype
Lim
it of
Det
ectio
n
Prec
isio
n
Pan-
Tum
or A
naly
sis
NG
S Co
ncor
danc
e
Inte
r-La
bora
tory
Con
cord
ance
CD
x C
onco
rdan
ce
DN
A E
xtra
ctio
n
DN
A S
tabi
lity
(par
t 1)
FFPE
Slid
e St
abili
ty
Inte
rfer
ing
Subs
tanc
es
Gua
rd B
andi
ng/R
obus
tnes
s
Mol
ecul
ar In
dex
Bar
code
s
Varia
nt C
urat
ion
Rea
gent
Sta
bilit
y Abdomen or Abdominal wall
Adrenal Gland
Anus
Appendix
Bladder
Bone
Brain
Breast
Cervix
Chest wall
Colon
Diaphragm
Page 5 of 36 RAL-0011, Ver. 02
Tiss
ue o
r Tum
or T
ype
Lim
it of
Det
ectio
n
Prec
isio
n
Pan-
Tum
or A
naly
sis
NG
S Co
ncor
danc
e
Inte
r-La
bora
tory
Con
cord
ance
CD
x C
onco
rdan
ce
DN
A E
xtra
ctio
n
DN
A S
tabi
lity
(par
t 1)
FFPE
Slid
e St
abili
ty
Inte
rfer
ing
Subs
tanc
es
Gua
rd B
andi
ng/R
obus
tnes
s
Mol
ecul
ar In
dex
Bar
code
s
Varia
nt C
urat
ion
Rea
gent
Sta
bilit
y
Duodenum *
Ear *
Endometrium *
Esophagus
Fallopian Tube
Gallbladder Gastro-esophageal junction
Head and Neck
Kidney Larynx *
Liver
Lung
Lymph Node
Malignant effusions
Mediastinum
Nasal Cavity *
Omentum
Ovarian
Pancreas
Pancreatobiliary Parotid Gland *
Pelvis Penis *
Pericardium
Peritoneum Pleura *
Prostate
Rare Tissues* Rectum *
Salivary Gland
Skin (Melanoma)
Small Intestine
Soft Tissue
Spleen

Page 6 of 36 RAL-0011, Ver. 02
Tiss
ue o
r Tum
or T
ype
Lim
it of
Det
ectio
n
Prec
isio
n
Pan-
Tum
or A
naly
sis
NG
S Co
ncor
danc
e
Inte
r-La
bora
tory
Con
cord
ance
CD
x C
onco
rdan
ce
DN
A E
xtra
ctio
n
DN
A S
tabi
lity
(par
t 1)
FFPE
Slid
e St
abili
ty
Inte
rfer
ing
Subs
tanc
es
Gua
rd B
andi
ng/R
obus
tnes
s
Mol
ecul
ar In
dex
Bar
code
s
Varia
nt C
urat
ion
Rea
gent
Sta
bilit
y
Stomach
Thyroid Tongue *
Trachea *
Ureter
Uterus
Vagina
Vulva
Whipple Resection *Included as "Rare Tissues" in Pan-Tumor Analysis Table 4. Summary of Genes and Alteration Types Included in Validation Studies.
Genes Subs
titut
ions
Inse
rtio
n/D
elet
ions
CN
As
Rea
rran
gem
ents
Prec
isio
n
LoD
NG
S C
onco
rdan
ce
Inte
r-la
b C
onco
rdan
ce
In S
ilico
Stu
dy
DN
A E
xtra
ctio
n
Gua
rd B
and
Inte
rfer
ing
Subs
tanc
es
ABL1 1 1 1 1 1 0 1 1 1 0 0 0 ACVR1B 1 1 0 0 1 1 0 1 1 0 0 0 AKT1 1 0 1 1 1 1 1 1 1 1 0 1 AKT2 1 1 1 0 1 0 1 1 1 1 0 0 AKT3 1 1 0 0 1 1 1 1 1 0 0 0 ALK* 1 1 0 1 1 1 1 1 1 1 0 0 ALOX12B 1 1 0 0 0 1 0 1 1 0 0 1 AMER1 (FAM123B) 1 1 0 0 1 1 0 1 1 0 0 0 APC 1 1 1 0 1 1 1 1 1 1 1 1 AR 1 1 1 0 1 1 1 1 1 1 1 0 ARAF 1 1 0 0 1 1 1 1 1 0 1 1 ARFRP1 1 0 1 0 1 0 0 1 1 0 1 0 ARID1A 1 1 0 1 1 1 1 1 1 1 0 1 ASXL1 1 1 1 0 1 1 1 1 1 1 0 0 ATM 1 1 0 1 1 1 1 1 1 1 0 0 ATR 1 1 1 0 1 0 0 1 1 1 1 0 ATRX 1 1 0 0 0 1 1 1 1 1 0 0 AURKA 1 0 1 0 1 1 1 1 1 0 1 0 AURKB 1 1 0 0 0 1 1 1 1 0 0 0 AXIN1 1 1 0 0 1 1 0 1 1 0 0 1

Page 7 of 36 RAL-0011, Ver. 02
Genes Subs
titut
ions
Inse
rtio
n/D
elet
ions
CN
As
Rea
rran
gem
ents
Prec
isio
n
LoD
NG
S C
onco
rdan
ce
Inte
r-la
b C
onco
rdan
ce
In S
ilico
Stu
dy
DN
A E
xtra
ctio
n
Gua
rd B
and
Inte
rfer
ing
Subs
tanc
es
AXL 1 0 1 1 1 0 1 1 1 1 0 0 BAP1 1 1 1 0 0 1 1 1 1 0 0 0 BARD1 1 1 0 0 1 1 1 1 1 0 0 0 BCL2 1 1 0 0 1 0 1 1 1 1 0 0 BCL2L1 0 0 1 0 0 0 0 1 1 0 1 1 BCL2L2 1 0 1 1 0 0 0 1 1 0 0 0 BCL6 1 1 1 0 1 0 0 1 1 0 1 0 BCOR 1 1 0 0 1 1 1 1 1 1 0 0 BCORL1 1 1 0 0 1 1 1 1 1 1 1 0 BCR 0 0 0 0 0 0 0 0 1 0 0 0 BRAF 1 1 0 1 1 1 1 1 1 1 0 1 BRCA1 1 1 1 1 1 1 1 1 1 1 1 1 BRCA2 1 1 1 1 1 1 1 1 1 1 1 1 BRD4 1 1 0 0 1 1 0 1 1 1 0 0 BRIP1 1 1 0 0 1 1 1 1 1 1 0 1 BTG1 1 1 0 0 1 0 0 1 1 0 0 0 BTG2 0 0 0 0 0 0 0 0 1 0 0 0 BTK 1 0 0 0 1 1 0 1 1 0 0 0 C11orf30 (EMSY) 1 1 1 0 1 1 0 1 1 1 1 0 CALR 1 0 0 0 0 0 1 0 1 0 0 0 CARD11 1 1 1 0 1 1 0 1 1 0 0 0 CASP8 1 1 0 0 0 1 0 1 1 0 1 0 CBFB 0 0 0 0 0 0 0 0 1 0 0 0 CBL 1 1 0 0 1 1 1 1 1 1 1 1 CCND1 1 1 1 0 1 1 1 1 1 1 1 1 CCND2 1 0 1 0 0 0 0 1 1 0 0 0 CCND3 1 0 1 0 0 1 0 1 1 1 0 0 CCNE1 1 0 1 0 0 1 1 1 1 1 0 0 CD22 1 1 0 0 1 1 0 0 1 0 0 0 CD274 1 1 1 0 0 0 0 1 1 1 0 0 CD70 0 0 0 0 0 0 0 0 1 0 0 0 CD74 0 0 0 0 0 0 0 0 1 0 0 0 CD79A 0 1 0 0 0 1 0 0 1 0 0 0 CD79B 1 0 0 0 0 0 0 0 1 1 0 0 CDC73 1 0 0 1 0 0 0 1 1 0 1 1 CDH1 1 1 0 0 1 1 1 1 1 1 0 0 CDK12 1 1 1 0 0 1 1 1 1 0 0 0 CDK4 1 0 1 0 1 0 1 1 1 1 0 1 CDK6 1 0 0 0 0 0 0 0 1 0 0 1 CDK8 1 0 1 0 1 1 1 1 1 0 1 0 CDKN1A 1 1 0 0 0 0 1 1 1 1 0 0 CDKN1B 1 1 0 0 0 1 0 1 1 0 0 0 CDKN2A 1 1 1 1 1 1 1 1 1 1 1 1 CDKN2B 1 0 1 0 1 1 0 1 1 1 1 1 CDKN2C 0 0 1 0 0 0 0 0 1 0 1 0 CEBPA 1 1 1 0 1 0 1 1 1 1 0 0 CHEK1 1 0 0 0 1 0 1 1 1 1 0 0 CHEK2 1 1 0 0 0 1 1 1 1 0 0 0 CIC 1 1 0 0 1 1 0 1 1 0 0 0 CREBBP 1 1 0 0 1 1 1 1 1 1 1 0 CRKL 1 1 0 0 1 1 0 0 1 1 0 0

Page 8 of 36 RAL-0011, Ver. 02
Genes Subs
titut
ions
Inse
rtio
n/D
elet
ions
CN
As
Rea
rran
gem
ents
Prec
isio
n
LoD
NG
S C
onco
rdan
ce
Inte
r-la
b C
onco
rdan
ce
In S
ilico
Stu
dy
DN
A E
xtra
ctio
n
Gua
rd B
and
Inte
rfer
ing
Subs
tanc
es
CSF1R 1 0 0 1 1 1 1 1 1 1 1 0 CSF3R 1 1 0 0 1 1 1 0 1 0 1 0 CTCF 1 1 0 0 1 0 0 1 1 1 1 0 CTNNA1 1 1 1 1 1 0 0 1 1 1 0 0 CTNNB1 1 1 1 1 1 0 1 1 1 1 0 1 CUL3 1 1 0 0 0 0 0 1 1 0 1 0 CUL4A 1 0 1 0 1 0 0 1 1 1 1 0 CXCR4 0 0 0 0 0 0 0 0 1 0 0 0 CYP17A1 1 0 0 0 1 0 0 1 1 0 0 1 DAXX 1 1 0 0 1 1 1 1 1 0 0 0 DDR1 1 1 0 0 1 1 0 1 1 0 0 0 DDR2 1 0 1 0 1 1 1 1 1 0 1 0 DIS3 1 0 1 0 1 1 0 1 1 1 1 0 DNMT3A 1 1 0 0 1 0 1 1 1 0 0 0 DOT1L 1 0 1 0 1 0 0 1 1 0 0 0 EED 0 0 0 0 0 0 0 0 1 0 0 0 EGFR 1 1 1 1 1 1 1 1 1 1 1 1 EP300 1 1 0 0 1 1 0 1 1 1 0 0 EPHA3 1 0 0 0 1 0 1 1 1 0 0 0 EPHB1 1 1 0 0 1 1 0 1 1 1 0 1 EPHB4 1 1 0 0 1 1 0 1 1 1 0 1 ERBB2 1 0 1 0 1 1 1 1 1 0 1 1 ERBB3 1 1 1 1 1 0 1 1 1 1 0 1 ERBB4 1 1 1 0 1 1 1 1 1 1 0 0 ERCC4 1 0 0 0 1 1 0 1 1 1 0 1 ERG 1 1 0 0 1 1 0 1 1 1 0 0 ERRFI1 1 1 0 0 1 0 0 1 1 1 0 0 ESR1 1 0 1 0 1 1 1 1 1 0 1 0 ETV4 0 0 0 0 0 0 0 0 1 0 0 0 ETV5 0 0 0 0 0 0 0 0 1 0 0 0 ETV6 0 0 0 0 0 0 0 0 1 0 0 0 EWSR1 0 0 0 1 1 0 0 0 1 0 0 0 EZH2 1 0 0 0 1 0 1 1 1 0 1 0 EZR 0 0 0 0 0 0 0 0 1 0 0 0 FAM46C 1 0 0 0 0 0 0 1 1 0 0 0 FANCA 1 1 1 0 1 0 1 1 1 1 0 0 FANCC 1 0 0 0 1 1 0 1 1 1 0 1 FANCG 1 1 1 0 1 1 0 1 1 1 0 0 FANCL 1 1 0 0 0 1 0 1 1 0 1 0 FAS 1 1 0 0 0 1 0 1 1 0 0 0 FBXW7 1 1 0 0 1 1 1 1 1 1 0 1 FGF10 1 0 1 0 1 1 0 1 1 0 1 0 FGF12 1 0 1 0 0 0 0 1 1 0 1 0 FGF14 1 0 1 0 1 0 0 1 1 1 1 1 FGF19 1 1 1 0 1 0 0 1 1 1 1 0 FGF23 1 0 1 0 0 1 0 1 1 0 0 0 FGF3 1 0 1 1 1 1 0 1 1 1 1 0 FGF4 1 0 1 0 1 0 0 1 1 1 1 0 FGF6 1 0 1 0 0 0 0 1 1 1 0 0 FGFR1 1 1 1 1 1 1 1 1 1 1 1 1 FGFR2 1 0 1 1 0 1 1 1 1 1 0 0 FGFR3 1 0 0 0 1 0 1 1 1 1 0 1

Page 9 of 36 RAL-0011, Ver. 02
Genes Subs
titut
ions
Inse
rtio
n/D
elet
ions
CN
As
Rea
rran
gem
ents
Prec
isio
n
LoD
NG
S C
onco
rdan
ce
Inte
r-la
b C
onco
rdan
ce
In S
ilico
Stu
dy
DN
A E
xtra
ctio
n
Gua
rd B
and
Inte
rfer
ing
Subs
tanc
es
FGFR4 1 1 0 0 1 1 1 1 1 0 1 0 FH 1 1 0 0 1 0 0 1 1 0 0 0 FLCN 1 1 0 0 1 1 0 1 1 1 0 0 FLT1 1 1 1 1 1 1 1 1 1 1 1 0 FLT3 1 0 1 0 1 0 1 1 1 1 1 0 FOXL2 1 1 0 0 1 1 0 1 1 0 1 0 FUBP1 1 1 0 0 1 0 0 1 1 1 0 1 GABRA6 1 1 1 0 1 0 0 1 1 1 0 0 GATA3 1 1 1 0 1 1 1 1 1 0 1 0 GATA4 1 1 1 0 0 1 0 1 1 0 0 0 GATA6 1 1 1 0 1 1 0 1 1 1 0 0 GID4 (C17orf39) 1 0 0 0 0 0 0 1 1 0 0 0 GNA11 1 0 1 1 1 0 1 1 1 0 0 0 GNA13 1 0 0 0 1 0 0 1 1 1 0 0 GNAQ 1 0 0 0 0 1 1 1 1 0 0 0 GNAS 1 0 1 0 1 1 1 1 1 0 1 0 GRM3 1 0 0 0 1 1 1 1 1 1 0 0 GSK3B 1 0 0 0 0 0 0 1 1 0 0 0 H3F3A 0 0 0 0 0 0 0 0 1 0 0 0 HDAC1 1 0 0 0 1 0 0 0 1 0 0 0 HGF 1 0 0 0 1 0 0 1 1 1 0 1 HNF1A 1 1 0 0 1 1 1 1 1 1 0 0 HRAS 1 1 0 0 0 0 1 1 1 0 0 1 HSD3B1 1 0 0 0 1 0 0 1 1 0 0 0 ID3 0 0 0 0 0 0 0 0 1 0 0 0 IDH1 1 1 0 0 1 1 1 1 1 1 0 1 IDH2 1 1 0 0 1 0 1 1 1 1 0 0 IGF1R 1 1 1 0 1 1 1 1 1 1 0 1 IKBKE 1 1 1 0 1 1 0 1 1 0 0 0 IKZF1 1 0 1 0 1 1 1 1 1 0 0 0 INPP4B 1 0 0 0 1 1 0 1 1 1 0 0 IRF2 1 0 0 0 1 0 0 1 1 0 0 0 IRF4 0 0 0 0 0 0 0 0 1 0 0 0 IRS2 1 1 1 0 1 1 0 1 1 1 1 0 JAK1 1 1 1 1 1 1 1 1 1 1 0 0 JAK2 1 1 1 0 1 0 1 1 1 1 0 0 JAK3 1 1 1 0 0 1 1 1 1 1 0 0 JUN 1 0 0 0 0 1 0 0 1 0 0 0 KDM5A 1 1 1 0 1 1 0 1 1 0 1 0 KDM5C 1 0 0 1 1 1 0 1 1 0 0 0 KDM6A 1 1 1 0 1 1 1 1 1 1 0 0 KDR 1 1 1 0 1 1 1 1 1 1 1 0 KEAP1 1 1 0 0 1 1 0 1 1 1 0 1 KEL 1 0 0 0 1 0 0 1 1 1 0 1 KIT 1 1 1 0 1 1 1 1 1 1 1 1 KLHL6 1 1 1 0 1 0 0 1 1 1 1 0 KMT2A (MLL) 1 1 1 0 1 1 1 1 1 1 1 0 KMT2D (MLL2) 1 1 0 1 1 1 0 1 1 1 1 0 KRAS 1 1 1 0 1 1 1 1 1 1 0 0 LTK 1 1 0 0 1 1 0 1 1 1 0 0 LYN 1 1 1 1 1 1 0 1 1 1 0 0

Page 10 of 36 RAL-0011, Ver. 02
Genes Subs
titut
ions
Inse
rtio
n/D
elet
ions
CN
As
Rea
rran
gem
ents
Prec
isio
n
LoD
NG
S C
onco
rdan
ce
Inte
r-la
b C
onco
rdan
ce
In S
ilico
Stu
dy
DN
A E
xtra
ctio
n
Gua
rd B
and
Inte
rfer
ing
Subs
tanc
es
MAF 1 0 0 0 1 1 0 0 1 0 0 0 MAP2K1 1 0 0 0 0 0 1 1 1 0 0 0 MAP2K2 1 0 0 1 1 1 1 1 1 0 0 0 MAP2K4 1 1 1 1 0 0 1 1 1 1 0 0 MAP3K1 1 1 1 0 1 1 0 1 1 1 1 0 MAP3K13 1 0 1 0 1 1 0 1 1 1 1 1 MAPK1 1 1 0 0 0 1 1 0 1 0 0 0 MCL1 1 0 1 0 1 0 1 1 1 0 0 0 MDM2 1 0 1 0 1 0 1 0 1 1 0 0 MDM4 1 0 1 0 0 0 1 1 1 1 0 0 MED12 1 1 0 0 1 1 1 1 1 1 1 0 MEF2B 1 0 1 0 1 0 0 1 1 1 1 0 MEN1 1 1 0 0 1 1 1 1 1 0 1 0 MERTK 1 0 0 0 0 0 0 1 1 0 0 0 MET 1 1 0 0 1 1 1 1 1 1 0 0 MITF 1 0 1 0 1 0 1 1 1 0 0 0 MKNK1 1 0 0 0 0 1 0 1 1 1 0 0 MLH1 1 1 1 0 1 1 1 1 1 0 0 0 MPL 1 1 1 0 1 0 1 1 1 1 0 0 MRE11A 1 1 1 1 1 0 1 1 1 0 0 0 MSH2 1 1 0 0 1 1 1 1 1 0 1 0 MSH3 1 1 0 0 1 1 0 0 1 1 0 0 MSH6 1 1 0 0 1 1 1 1 1 1 0 0 MST1R 1 1 0 0 1 1 0 1 1 1 0 1 MTAP 1 0 1 0 1 1 1 0 1 1 1 1 MTOR 1 1 0 0 1 1 1 1 1 1 0 0 MUTYH 1 0 0 0 1 1 1 1 1 1 0 0 MYB 0 0 0 1 0 0 0 1 1 0 0 0 MYC 1 1 1 1 1 1 1 1 1 1 1 0 MYCL 1 1 1 0 1 0 0 1 1 0 0 0 MYCN 1 1 0 0 0 0 1 1 1 0 0 0 MYD88 1 0 0 0 0 0 1 1 1 0 0 0 NBN 1 1 1 0 1 1 1 1 1 1 0 0 NF1 1 1 1 1 1 1 1 1 1 1 1 0 NF2 1 1 0 0 1 0 1 1 1 0 0 0 NFE2L2 1 1 0 0 0 1 0 1 1 1 0 0 NFKBIA 1 1 1 0 0 1 0 1 1 0 1 0 NKX2-1 1 1 1 0 0 1 1 1 1 0 1 0 NOTCH1 1 1 0 1 1 1 1 1 1 1 1 1 NOTCH2 1 1 1 0 1 0 1 1 1 0 1 1 NOTCH3 1 1 0 0 1 1 0 1 1 1 1 1 NPM1 0 0 1 0 0 0 0 1 1 0 0 0 NRAS 1 0 0 0 0 0 1 1 1 0 0 0 NT5C2 0 1 0 0 0 1 0 0 1 0 0 0 NTRK1 1 1 1 0 1 1 1 1 1 1 0 1 NTRK2 1 1 0 0 0 1 1 1 1 1 0 1 NTRK3 1 0 0 0 1 1 1 1 1 1 0 0 NUTM1 0 0 0 0 0 0 0 0 1 0 0 0 P2RY8 1 0 0 0 1 0 0 0 1 0 0 0 PALB2 1 1 0 0 1 1 1 1 1 1 0 0 PARK2 1 1 1 1 1 0 0 1 1 0 1 0 PARP1 1 0 0 0 1 1 0 1 1 0 0 0

Page 11 of 36 RAL-0011, Ver. 02
Genes Subs
titut
ions
Inse
rtio
n/D
elet
ions
CN
As
Rea
rran
gem
ents
Prec
isio
n
LoD
NG
S C
onco
rdan
ce
Inte
r-la
b C
onco
rdan
ce
In S
ilico
Stu
dy
DN
A E
xtra
ctio
n
Gua
rd B
and
Inte
rfer
ing
Subs
tanc
es
PARP2 1 1 0 0 1 0 0 1 1 0 1 0 PARP3 1 0 0 0 0 0 0 1 1 1 0 1 PAX5 1 0 1 0 0 0 1 1 1 0 0 0 PBRM1 1 1 1 1 1 1 1 1 1 1 1 1 PDCD1 0 1 0 0 0 1 0 0 1 0 0 0 PDCD1LG2 1 1 1 0 1 0 0 1 1 0 0 0 PDGFRA 1 0 1 0 1 1 1 1 1 1 1 1 PDGFRB 1 0 1 0 1 0 1 1 1 1 1 0 PDK1 1 0 0 0 0 0 0 1 1 0 0 0 PIK3C2B 1 1 1 1 1 1 0 1 1 1 0 0 PIK3C2G 1 1 1 0 1 1 0 1 1 1 1 1 PIK3CA 1 1 1 1 1 1 1 1 1 1 1 0 PIK3CB 1 1 1 0 1 1 1 1 1 1 1 0 PIK3R1 1 1 1 1 1 1 1 1 1 0 0 0 PIM1 1 0 0 0 1 0 0 0 1 0 0 0 PMS2 1 0 1 0 1 1 1 1 1 1 0 0 POLD1 1 1 1 0 1 1 1 1 1 1 0 1 POLE 1 1 0 0 1 1 1 1 1 1 1 0 PPARG 1 0 0 0 0 1 0 1 1 0 0 0 PPP2R1A 1 1 1 0 1 0 0 1 1 1 1 0 PPP2R2A 1 0 0 0 0 1 0 0 1 0 0 0 PRDM1 1 0 1 0 0 1 0 1 1 0 0 0 PRKAR1A 1 0 0 0 0 0 0 1 1 0 0 0 PRKCI 1 1 1 0 0 0 0 1 1 1 1 0 PTCH1 1 1 0 0 1 1 1 1 1 1 0 0 PTEN 1 1 1 0 1 0 1 1 1 1 0 0 PTPN11 1 1 0 1 1 1 1 1 1 1 1 0 PTPRO 1 0 0 0 1 0 0 0 1 1 0 0 QKI 0 1 0 0 1 0 0 1 1 0 0 0 RAC1 1 0 0 0 0 0 1 1 1 1 0 0 RAD21 1 0 1 0 1 1 1 0 1 1 1 0 RAD51 1 0 0 0 0 0 0 1 1 0 0 0 RAD51B (RAD51L1) 1 0 1 0 1 1 0 1 1 0 1 0 RAD51C 1 1 0 0 0 1 1 1 1 1 0 0 RAD51D (RAD51L3) 1 0 1 0 1 1 1 0 1 0 0 0 RAD52 1 0 1 0 1 0 0 1 1 0 0 0 RAD54L 1 1 0 0 1 0 0 1 1 1 1 0 RAF1 1 0 0 0 1 0 1 1 1 1 0 1 RARA 1 1 1 0 1 1 1 1 1 1 0 0 RB1 1 1 1 1 1 0 1 1 1 1 0 0 RBM10 1 1 0 0 0 1 0 1 1 1 0 0 REL 1 1 0 0 0 0 0 1 1 0 0 1 RET 1 0 0 0 1 1 1 1 1 1 0 0 RICTOR 1 0 1 0 1 1 1 1 1 1 1 1 RNF43 1 1 0 0 1 1 0 1 1 1 0 0 ROS1 1 1 1 0 1 1 1 1 1 1 0 0 RPTOR 1 1 0 1 1 1 1 1 1 1 1 1 RSPO2 0 0 0 0 0 0 0 0 1 0 0 0 SDC4 0 0 0 0 0 0 0 0 1 0 0 0 SDHA 1 1 1 0 1 1 0 1 1 1 1 1

Page 12 of 36 RAL-0011, Ver. 02
Genes Subs
titut
ions
Inse
rtio
n/D
elet
ions
CN
As
Rea
rran
gem
ents
Prec
isio
n
LoD
NG
S C
onco
rdan
ce
Inte
r-la
b C
onco
rdan
ce
In S
ilico
Stu
dy
DN
A E
xtra
ctio
n
Gua
rd B
and
Inte
rfer
ing
Subs
tanc
es
SDHB 1 0 0 0 0 0 0 1 1 0 0 0 SDHC 1 0 1 0 1 0 0 0 1 0 0 1 SDHD 1 0 0 0 0 0 0 1 1 0 0 0 SETD2 1 1 0 0 1 1 0 1 1 1 0 0 SF3B1 1 0 0 0 1 1 1 1 1 1 0 0 SGK1 1 0 1 0 0 1 0 0 1 0 1 0 SLC34A2 0 0 0 0 0 0 0 0 1 0 0 0 SMAD2 1 0 1 0 1 0 1 1 1 0 0 0 SMAD4 1 1 1 1 1 1 1 1 1 0 0 0 SMARCA4 1 1 0 0 1 1 1 1 1 0 0 0 SMARCB1 1 1 0 0 0 0 1 1 1 0 0 0 SMO 1 1 0 1 1 1 1 1 1 0 0 0 SNCAIP 1 1 1 0 1 0 0 1 1 1 1 1 SOCS1 1 0 0 0 0 0 0 1 1 0 0 0 SOX2 1 0 1 0 0 1 0 1 1 0 1 0 SOX9 1 1 0 0 1 1 0 1 1 1 1 1 SPEN 1 1 0 1 1 1 0 1 1 1 0 1 SPOP 1 0 1 1 1 1 1 1 1 1 0 0 SRC 1 0 1 0 1 0 1 1 1 1 0 0 STAG2 1 1 0 0 0 0 1 1 1 1 0 0 STAT3 1 1 1 0 1 0 0 1 1 1 0 0 STK11 1 1 1 1 1 0 1 1 1 1 0 1 SUFU 1 0 0 0 0 0 1 1 1 1 0 0 SYK 1 0 0 0 1 1 0 1 1 1 0 0 TBX3 1 1 1 1 1 1 0 1 1 1 0 0 TEK 1 0 1 0 1 0 0 1 1 1 0 0 TERC 0 0 1 0 0 0 0 1 1 0 1 0 TERT promoter 1 0 0 0 0 1 0 1 1 1 1 1 TET2 1 1 0 0 1 1 1 1 1 1 1 0 TGFBR2 1 1 0 0 1 1 1 1 1 1 0 0 TIPARP 1 0 1 0 0 1 0 1 1 0 1 1 TMPRSS2 0 0 0 1 0 0 0 1 1 0 0 0 TNFAIP3 1 1 1 0 1 1 0 1 1 1 0 0 TNFRSF14 1 1 0 0 1 0 0 1 1 0 0 0 TP53 1 1 1 0 1 1 1 1 1 1 1 1 TSC1 1 1 0 0 1 1 1 1 1 1 0 0 TSC2 1 1 0 0 1 1 1 1 1 1 1 1 TYRO3 1 1 0 0 1 1 0 1 1 1 1 0 U2AF1 1 0 0 0 0 0 1 1 1 0 0 0 VEGFA 1 0 0 0 0 0 0 1 1 1 0 1 VHL 1 0 0 0 0 0 1 1 1 0 0 0 WHSC1 1 1 0 0 1 1 0 0 1 1 0 0 WHSC1L1 1 1 1 0 1 0 0 0 1 0 0 0 WT1 1 1 0 0 0 0 1 1 1 1 0 1 XPO1 1 1 0 0 1 0 0 1 1 1 0 0 XRCC2 0 0 0 1 1 0 0 0 1 0 0 0 ZNF217 1 1 1 0 1 1 0 1 1 1 1 0 ZNF703 1 1 1 0 1 1 0 1 1 1 0 1
2.1 Concordance to an Orthogonal Method

Page 13 of 36 RAL-0011, Ver. 02
The detection of alterations by FoundationOne CDx (F1CDx) assay was compared to results of an externally validated NGS assay (evNGS). Overall there were 157 overlapping genes between the two assays. The comparison between short alterations, including base substitutions and short indels, detected by F1CDx and the orthogonal method included 188 samples from 46 different tumors. A summary of Positive Percent Agreement (PPA) and Negative Percent Agreement (NPA) is provided in Table 5 below. Differences in variants of unknown significance (VUS) alteration calls between the platform were noted, and are expected based on differences in filtering employed by F1CDx and evNGS. Negative predictive value and positive predictive value were also calculated and were found to be different than percent agreement because the two platforms filter VUS differently. Discordant alterations not related to VUS filtering were primarily caused by deletions with low allelic fraction in homopolymer regions. The F1CDx variant calling pipeline imposes a filter based on MAF of ≥0.10 for indels in homopolymer regions to reduce the likelihood of calling false positives resulting from artifacts introduced by the technology. As such, the difference observed was due to varying filter thresholds between the two platforms. For additional concordance results for select biomarker-associated variants, refer to the Summary of Clinical Studies in Section 3.
Table 5. Concordance Summary for short variants inclusive of both substitutions and indels.
F1CDx+ /evNGS+
F1CDx-/evNGS+
F1CDx+ /evNGS-
F1CDx-/evNGS- PPA [95% CI]* NPA [95% CI]*
All short variants
1282 73 375 284218 94.6% [93.3%-95.8%]
99.9% [99.9%-99.9%]
Substitutions 1111 39 334 242540 96.6%
[95.4%-97.6%] 99.9% [99.8%-99.9%]
Indels 171 34 41 41678 83.4%
[77.6%-88.2%] 99.9% [99.9%-99.9%]
*The PPA and NPA were calculated without adjusting for the distribution of samples enrolled using the FoundationOne Laboratory Developed Test (F1 LDT), therefore these estimates may be biased upward.
2.2 Concordance – Comparison to FoundationOne
To support the use of retrospective data generated using the FoundationOne (F1 LDT, a NGS test based on the same platform), a concordance study was conducted with FoundationOne CDx (F1CDx). This study evaluated a test set of 165 specimens. PPA and NPA between the F1CDx and F1 LDT, using the F1 assay as the reference method, was calculated for all alterations, as well as for alterations binned by type: short variants, copy number alterations (CNAs) and rearrangements. A total of 2325 variants, including 2026 short variants, 266 copy number alterations and 33 rearrangements were included in the study. The study results are summarized in Table 6 below.
Table 6. Summary of Inter-Laboratory Concordance Comparing FoundationOne CDx to the FoundationOne LDT (F1).
F1CDx+/F1 LDT+ F1CDx-/F1 LDT+ F1CDx+/F1 LDT- F1CDx-/F1 LDT- PPA NPA
All variants 2246 33 46 322890 98.6% 99.99%
All short variants 1984 19 23 299099 99.1% 99.99%
Substitutions 1692 10 19 254854 99.4% 99.99%
Indels 292 9 4 44245 97.0% 99.99%
All CNA 230 14 22 19204 94.3% 99.9%
Amplifications 157 10 12 14671 94.0% 99.9%
Losses 73 4 10 4533 94.8% 99.8%
Rearrangements 32 0 1 4587 100.0% 99.98%
The qualitative output for MSI (MSI-H vs. MSS) in the F1 LDT and F1CDx were evaluated. PPA, NPA and Overall Percent Agreement (OPA) of MSI status between the two assays was calculated for all 165
Page 14 of 36 RAL-0011, Ver. 02
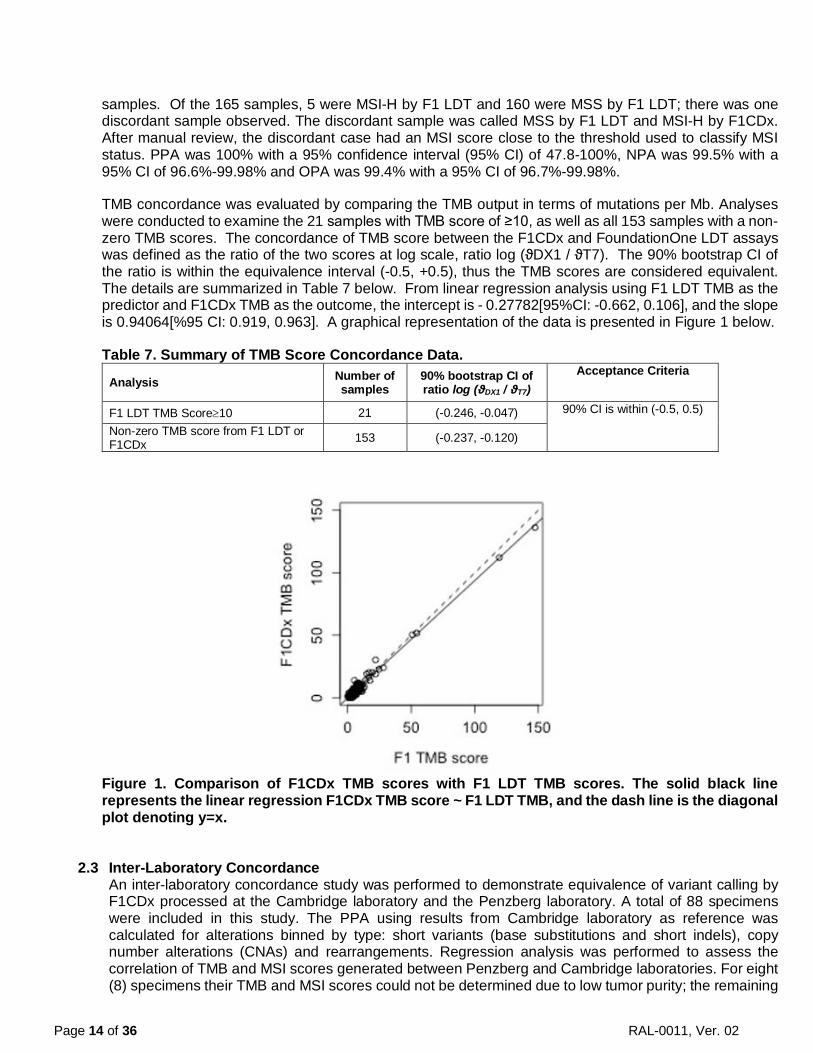
samples. Of the 165 samples, 5 were MSI-H by F1 LDT and 160 were MSS by F1 LDT; there was one discordant sample observed. The discordant sample was called MSS by F1 LDT and MSI-H by F1CDx. After manual review, the discordant case had an MSI score close to the threshold used to classify MSI status. PPA was 100% with a 95% confidence interval (95% CI) of 47.8-100%, NPA was 99.5% with a 95% CI of 96.6%-99.98% and OPA was 99.4% with a 95% CI of 96.7%-99.98%.
TMB concordance was evaluated by comparing the TMB output in terms of mutations per Mb. Analyses were conducted to examine the 21 samples with TMB score of ≥10, as well as all 153 samples with a non-zero TMB scores. The concordance of TMB score between the F1CDx and FoundationOne LDT assays was defined as the ratio of the two scores at log scale, ratio log (ϑDX1 / ϑT7). The 90% bootstrap CI of the ratio is within the equivalence interval (-0.5, +0.5), thus the TMB scores are considered equivalent. The details are summarized in Table 7 below. From linear regression analysis using F1 LDT TMB as the predictor and F1CDx TMB as the outcome, the intercept is - 0.27782[95%CI: -0.662, 0.106], and the slope is 0.94064[%95 CI: 0.919, 0.963]. A graphical representation of the data is presented in Figure 1 below.
Table 7. Summary of TMB Score Concordance Data.
Analysis Number of samples
90% bootstrap CI of ratio log (ϑDX1 / ϑT7)
Acceptance Criteria
F1 LDT TMB Score≥10 21 (-0.246, -0.047) 90% CI is within (-0.5, 0.5)
Non-zero TMB score from F1 LDT or F1CDx 153 (-0.237, -0.120)
Figure 1. Comparison of F1CDx TMB scores with F1 LDT TMB scores. The solid black line represents the linear regression F1CDx TMB score ~ F1 LDT TMB, and the dash line is the diagonal plot denoting y=x.
2.3 Inter-Laboratory Concordance An inter-laboratory concordance study was performed to demonstrate equivalence of variant calling by F1CDx processed at the Cambridge laboratory and the Penzberg laboratory. A total of 88 specimens were included in this study. The PPA using results from Cambridge laboratory as reference was calculated for alterations binned by type: short variants (base substitutions and short indels), copy number alterations (CNAs) and rearrangements. Regression analysis was performed to assess the correlation of TMB and MSI scores generated between Penzberg and Cambridge laboratories. For eight (8) specimens their TMB and MSI scores could not be determined due to low tumor purity; the remaining

Page 15 of 36 RAL-0011, Ver. 02
80 samples were used to generate the linear regression curve and the coefficient of determination values (R2) were determined from the curve. The study results are summarized in Table 8 below. Table 8: Summary of Inter-Laboratory Concordance Comparing F1CDx Variant Calling at Penzberg Laboratory to Cambridge Laboratory
Variant Type/Genomic Signature
Concordance Acceptance Criteria
Concordance Validation Result
Conclusion
Short Variants (Base Substitutions and Short Indels)
PPA ≥95% 99.48% (384/386a,b) PASS
Copy Number Alterations
PPA ≥90% 97.87% (138/141a,c) PASS
Rearrangements PPA ≥90% 100% (10/10a) PASS
TMB R2 ≥0.90 0.963 PASS
Linear regression slope 0.90 ≥ x ≥ 1.10
1.003 PASS
MSI R2 ≥0.90 0.986 PASS
Linear regression slope 0.90 ≥ x ≥ 1.10
0.960 PASS
a Number of alterations detected in samples processed in Penzberg and Cambridge laboratories, respectively b The two discordant variants had a mutant allele frequency (MAF) close to the LoD c All three discordant variants were called as “equivocal”
2.4 Tissue Comparability
A large-scale retrospective analysis was conducted, using 80,715 specimens from 43 tissue types, in order to establish the comparability of assay performance across tumor tissue types. The goal of the study was to establish that assay performance after DNA extraction is independent of the tissue type from which the DNA was extracted. The retrospective analysis of data included specimens assayed using the F1 LDT assay. DNA extraction, and post-DNA extraction data were assessed for comparability of performance across tissue types. The dataset for analysis consisted of routine clinical samples analyzed using F1 LDT from March 25, 2015 to March 13, 2017. Thirty-nine of the 43 tissue types had ≥90% of specimens passing DNA extraction QC. Specimen DNA extraction pass rates for the remaining four tissue types, lung, pancreas, pelvis and prostate, were 89.6%, 89%, 89%, and 79.7%, respectively. Each of these four tissue types have characteristically small biopsies and may also be more likely to require macro-dissection. Of specimens entering the assay at Library Construction (LC), 39 of 43 tissue types had ≥90% of specimens resulting in a successful patient report being issued. The four tissue types below 90% include pancreatobiliary, appendix, pericardium, and prostate, and had pass rates of 83%, 88%, 79%, and 84%, respectively. For these four tissue types, the most frequent cause of failure was low tumor purity with no alterations detected. The mean LC yields across tissue types were 7,050 ng to 8,643 ng compared to the minimum required 545 ng. The percent of specimens passing the LC QC for each tissue type ranged from 98%-100%. After Hybrid Capture (HC), the mean yields across tissue types ranged from 434 ng to 576 ng, well above the minimum requirement of 140 ng. The percent of specimens passing HC across tissue types ranged from ranged from 97%-100%. The average median exon coverage assessed across tissue types ranged from 702X-793X, with percent of specimens passing QC for median coverage across tissue types ranging from 96%-100%. Uniformity of coverage was assessed by calculating the average percent of targets with >100X coverage across tissue types, and ranged from 99.0%-99.8%. The percentage of specimens passing this QC metric ranged from 98%-100%. The average sequencing error rate, assessed across tissue types, is 0.0028-0.0031, well below the required error rate (0.01) for assay

Page 16 of 36 RAL-0011, Ver. 02
acceptance. The pass rate for all tissue types was 100% for error rate. Performance data for this study is summarized in Table 9 below. Table 9. Summary of post-DNA Extraction Analysis.
QC Metric Name F1CDx QC
Specification
Mean QC Performance Across
Tissue Types
QC Pass Rate Across Tissue
Types
Tissue types with ≥90% QC
Pass Rate
Overall report Pass/Qualified rate
Pass rate: ≥90% specimens
N/A 79%-98% 39/43 (90.6%)
LC Yield ≥545 ng 7050–8643 ng 98-100% 43/43 (100%)
Library Yield after HC ≥140 ng 434-576 ng 97-100% 43/43 (100%)
Median Exon Coverage ≥250X 702-793X 96-100% 43/43 (100%)
Percent of target >100X coverage
≥95% target at ≥100X coverage
99.0%-99.8% targets 98%-100% 43/43 (100%)
Sequencing error rate <1% 0.0028-0.0031 100% 43/43 (100%)
Noisy copy number data N/A* N/A 93.8-100% 43/43 (100%)
*for information only, not a specification
2.5 Analytical Specificity 2.5.1 Interfering Substances
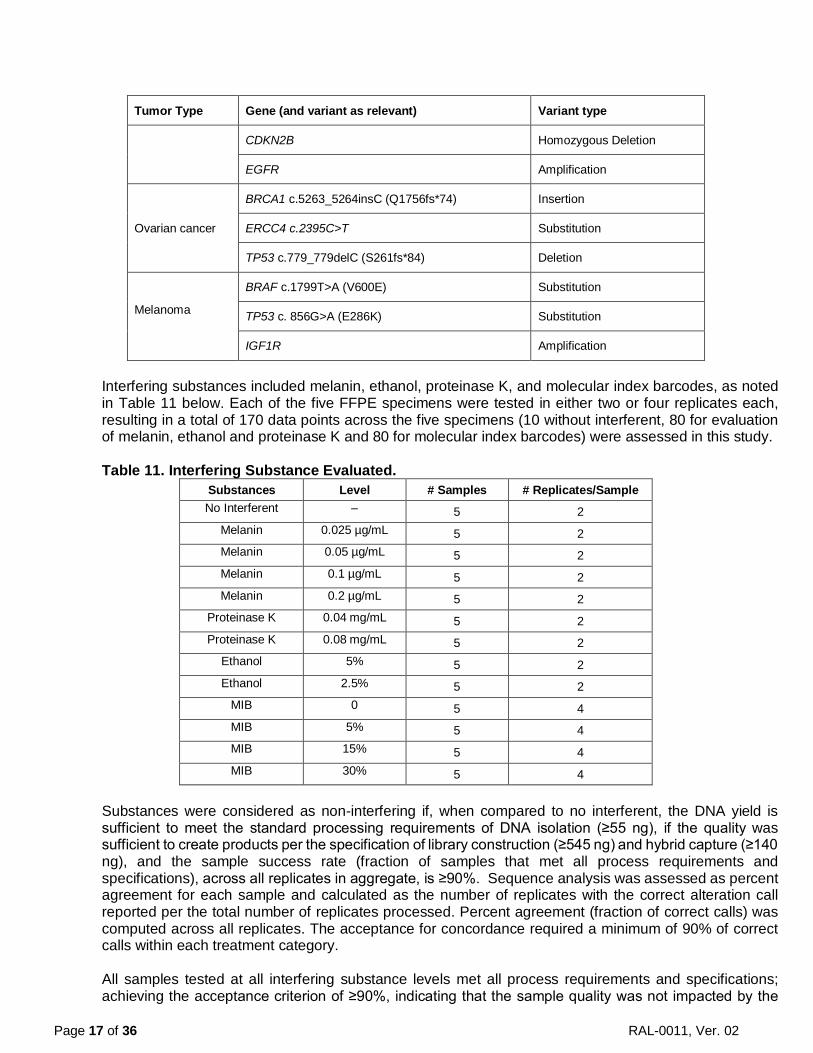
The robustness of the FoundationOne CDx (F1CDx) assay process was assessed while evaluating human formalin-fixed paraffin-embedded (FFPE) samples in the presence of exogenous and endogenous interfering substances. Five FFPE specimens representing five tumor types (ovary, lung, colorectal, breast and melanoma) including representative variant types (substitution, indel, amplification, homozygous deletion and rearrangement) were assessed in duplicate (Table 10). An additional 54 short alterations (substitutions and indels) were assessed. The addition of interfering substances including melanin (endogenous), ethanol (exogenous), proteinase K (exogenous), and molecular index barcodes (MIB) (exogenous) was evaluated to determine if they were impactful to F1CDx, and the results were compared to the control (no interferents) condition. Table 10. Summary of tumor types and variant types included in study.
Tumor Type Gene (and variant as relevant) Variant type
CRC
FGFR1 Rearrangement
BCL2L1 Amplification
AXIN1 c.1058G>A (R353H) Substitution
SOX9 c.768_769insGG (R257fs*23) Insertion
Breast cancer
ERBB2 Amplification
AKT1 Amplification
CCND1 Amplification
Lung cancer CDKN2A Homozygous Deletion
Page 17 of 36 RAL-0011, Ver. 02
Tumor Type Gene (and variant as relevant) Variant type
CDKN2B Homozygous Deletion
EGFR Amplification
Ovarian cancer
BRCA1 c.5263_5264insC (Q1756fs*74) Insertion
ERCC4 c.2395C>T Substitution
TP53 c.779_779delC (S261fs*84) Deletion
Melanoma
BRAF c.1799T>A (V600E) Substitution
TP53 c. 856G>A (E286K) Substitution
IGF1R Amplification
Interfering substances included melanin, ethanol, proteinase K, and molecular index barcodes, as noted in Table 11 below. Each of the five FFPE specimens were tested in either two or four replicates each, resulting in a total of 170 data points across the five specimens (10 without interferent, 80 for evaluation of melanin, ethanol and proteinase K and 80 for molecular index barcodes) were assessed in this study. Table 11. Interfering Substance Evaluated.
Substances Level # Samples # Replicates/Sample No Interferent ‒ 5 2
Melanin 0.025 µg/mL 5 2 Melanin 0.05 µg/mL 5 2 Melanin 0.1 µg/mL 5 2 Melanin 0.2 µg/mL 5 2
Proteinase K 0.04 mg/mL 5 2 Proteinase K 0.08 mg/mL 5 2
Ethanol 5% 5 2 Ethanol 2.5% 5 2
MIB 0 5 4 MIB 5% 5 4 MIB 15% 5 4 MIB 30% 5 4
Substances were considered as non-interfering if, when compared to no interferent, the DNA yield is sufficient to meet the standard processing requirements of DNA isolation (≥55 ng), if the quality was sufficient to create products per the specification of library construction (≥545 ng) and hybrid capture (≥140 ng), and the sample success rate (fraction of samples that met all process requirements and specifications), across all replicates in aggregate, is ≥90%. Sequence analysis was assessed as percent agreement for each sample and calculated as the number of replicates with the correct alteration call reported per the total number of replicates processed. Percent agreement (fraction of correct calls) was computed across all replicates. The acceptance for concordance required a minimum of 90% of correct calls within each treatment category. All samples tested at all interfering substance levels met all process requirements and specifications; achieving the acceptance criterion of ≥90%, indicating that the sample quality was not impacted by the

Page 18 of 36 RAL-0011, Ver. 02
interfering substances at the levels evaluated. The concordance of variants for the melanin, proteinase K and MIB evaluations was 100%, and was 95.3% for the ethanol evaluation, each meeting the acceptance criterion of ≥90%, indicating that the performance was not affected by the tested interferents. In addition to the variants selected to represent specific alteration types summarized in Table 10, samples included in the study harbored 54 additional short alterations (substitutions and indels) and were 100% concordant across all replicates for each variant. In a supplemental study, thirteen (13) additional samples representing rearrangements in FGFR2 and ROS1, copy number amplifications in ERBB2 and MET, and homologous recombination repair (HRR) positive short nucleotide variants were assessed to support the validation of interfering substances across multiple tumor types and disease ontologies. Three exogenous substances were evaluated: ethanol, Proteinase K, and MIB. Success rates across treatments for the assessment of DNA yield and processing performance met the ≥90% acceptance criteria, demonstrating that sample quality was not impacted by the interfering substances evaluated. The concordance of variant calls across all treatment categories was ≥90%, indicating that the interfering substances evaluated herein were not impactful to sequence concordance.
2.5.2 In silico Analysis – Hybrid Capture Bait Specificity
Bait specificity was addressed through an assessment of coverage at the base level for targeted regions included in FoundationOne CDx (F1CDx). Lack of bait specificity and/or insufficient bait inclusion would result in regions of diminished high quality mapped reads due to the capture of off-target content. This analysis showed that all regions that may harbor the alterations associated consistently have high quality (MQS ≥ 30), deep coverage ≥ 250X. When assessing the entire gene set, 99.45% of individual bases in targeted coding regions +/-2 bp of flanking intronic splice site are covered with ≥100X coverage, and 91.45% of individual bases within targeted introns platform-wide had ≥100X coverage.
2.5.3 Carryover/Cross-contamination No carryover or cross-contamination was observed when alternating positive and negative samples for BRCA1 and BRCA2 variants, assessed in a checker-board pattern (see Summary of Safety and Effectiveness Data for FoundationFocus CDxBRCA LOH assay P160018). In addition, data from plates with high-level confirmed ERBB2 amplifications, EGFR T790M alterations or ALK fusions were examined for cross-contamination in adjacent wells containing confirmed negative samples. No contamination was observed.
2.6 Precision: Repeatability and Reproducibility In this study, repeatability and reproducibility of alterations, including agreement for MSI, TMB, and MAF of short variants, were evaluated. Repeatability between intra-run aliquots (run on the same plate under the same conditions) and reproducibility of inter-run aliquots (run on different plates under different conditions) were assessed and compared across three different sequencers and three different reagent lots, across multiple days of performance by multiple operators.
A total of 47 samples with alterations in a variety of genomic contexts were tested, as shown in Tables 12 and 13 below. Each sample also included additional alterations that were included in the assessment for a total of 717 alterations assessed. The maximum insertion length in this study was 30 bp and the longest deletion was 263 bp.
Table 12. Sample set 1 for validation.
Gene Number of Unique Samples Alteration Tumor Type
EGFR 3 Exon 19 Deletion
NSCLC 2 Exon 21 L858R

Page 19 of 36 RAL-0011, Ver. 02
Gene Number of Unique Samples Alteration Tumor Type
2 Exon 20 T790M
KRAS 3 Codons 12/13 substitution CRC
ALK 3 Fusion NSCLC
BRAF 3 V600E/V600K Melanoma
ERBB2 3 Amplification Breast cancer
Table 13. Sample set 2 for validation. Alteration Type Number of
Unique Samples Alteration Size Genomic Context
Substitution 3 - -
Short Insertion 2 1-2bp Homopolymer Repeats
Short Insertion 2 1-2bp Dinucleotide Repeats
Short Insertion 2 3-5bp -
Short Insertion 2 >5bp -
Short Deletion 2 1-2bp Homopolymer Repeats
Short Deletion 2 1-2bp Dinucleotide Repeats
Short Deletion 2 3-5bp -
Short Deletion 2 >5bp -
Amplification 3 - -
Homozygous Deletion 3 - -
Rearrangement 3 - -
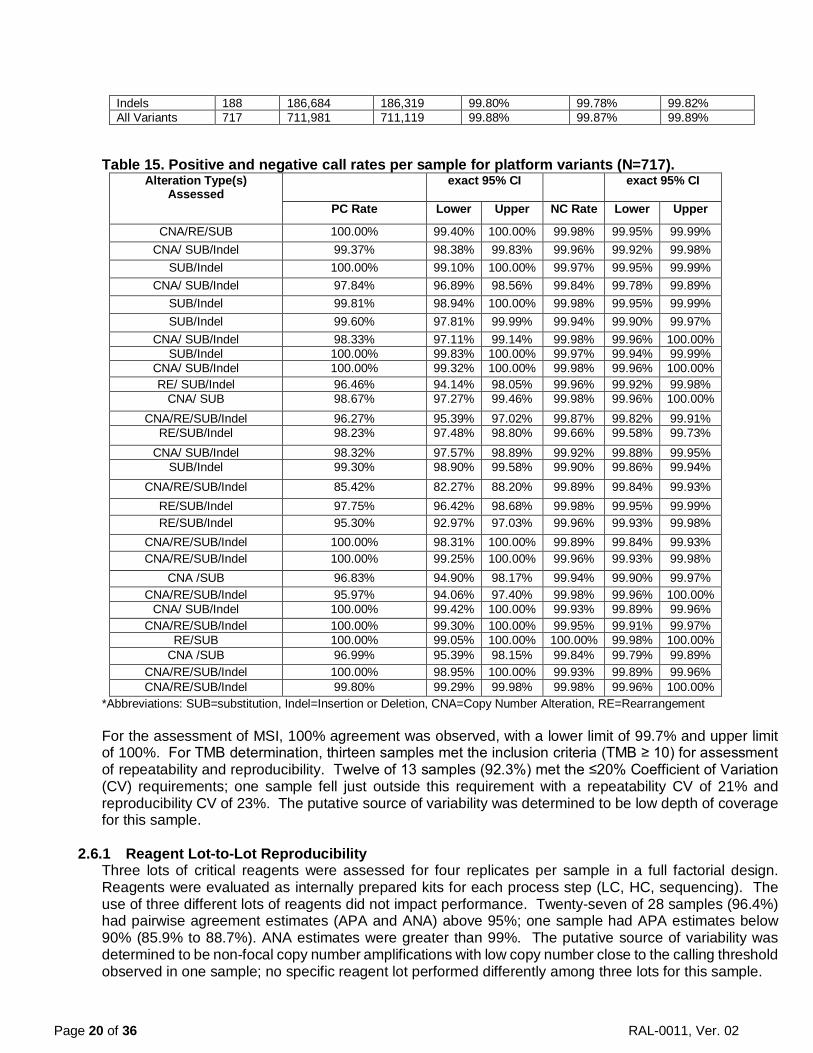
The results demonstrated that the F1CDx is robust regarding the repeatability and reproducibility of calling genomic alterations. Across all samples, the pre-sequencing process failure is 1.5%, and the no call rate is 0.18% for MSI, 6.38% for TMB (all) and 0.22% for TMB (>10 mut/Mb). Within the assessment of repeatability and reproducibility for variants in sample set 1, all variants from all samples were 100% concordant. Percent of negative calls at each variant location for wild-type samples was 100%. Similarly, the platform-level repeatability and reproducibility showed high overall agreement across alteration bins, and high sample-level positive and negative call rates as summarized in Tables 14 and 15 below. The platform-level study included a total of 443 substitutions, 188 indels, 55 copy number amplifications, 13 copy number loss, and 18 rearrangements in the variant set across the samples. Table 14. Reproducibility across variant bins (copy number, rearrangement, substitution, indels).
Variant Bin # of Variants
# of valid Comparisons
# of Agreements
Positive Percent Agreement
95% CI Lower Limit
95% CI Upper Limit
CNAs 68 67,524 67,300 99.67% 99.62% 99.71% Rearrangements 18 17,874 17,851 99.87% 99.81% 99.92% Substitutions 443 439,899 439,649 99.94% 99.94% 99.95%
Page 20 of 36 RAL-0011, Ver. 02
Indels 188 186,684 186,319 99.80% 99.78% 99.82% All Variants 717 711,981 711,119 99.88% 99.87% 99.89%
Table 15. Positive and negative call rates per sample for platform variants (N=717). Alteration Type(s)
Assessed exact 95% CI exact 95% CI
PC Rate Lower Upper NC Rate Lower Upper
CNA/RE/SUB 100.00% 99.40% 100.00% 99.98% 99.95% 99.99% CNA/ SUB/Indel 99.37% 98.38% 99.83% 99.96% 99.92% 99.98%
SUB/Indel 100.00% 99.10% 100.00% 99.97% 99.95% 99.99% CNA/ SUB/Indel 97.84% 96.89% 98.56% 99.84% 99.78% 99.89%
SUB/Indel 99.81% 98.94% 100.00% 99.98% 99.95% 99.99% SUB/Indel 99.60% 97.81% 99.99% 99.94% 99.90% 99.97%
CNA/ SUB/Indel 98.33% 97.11% 99.14% 99.98% 99.96% 100.00% SUB/Indel 100.00% 99.83% 100.00% 99.97% 99.94% 99.99%
CNA/ SUB/Indel 100.00% 99.32% 100.00% 99.98% 99.96% 100.00% RE/ SUB/Indel 96.46% 94.14% 98.05% 99.96% 99.92% 99.98%
CNA/ SUB 98.67% 97.27% 99.46% 99.98% 99.96% 100.00% CNA/RE/SUB/Indel 96.27% 95.39% 97.02% 99.87% 99.82% 99.91%
RE/SUB/Indel 98.23% 97.48% 98.80% 99.66% 99.58% 99.73% CNA/ SUB/Indel 98.32% 97.57% 98.89% 99.92% 99.88% 99.95%
SUB/Indel 99.30% 98.90% 99.58% 99.90% 99.86% 99.94% CNA/RE/SUB/Indel 85.42% 82.27% 88.20% 99.89% 99.84% 99.93%
RE/SUB/Indel 97.75% 96.42% 98.68% 99.98% 99.95% 99.99% RE/SUB/Indel 95.30% 92.97% 97.03% 99.96% 99.93% 99.98%
CNA/RE/SUB/Indel 100.00% 98.31% 100.00% 99.89% 99.84% 99.93% CNA/RE/SUB/Indel 100.00% 99.25% 100.00% 99.96% 99.93% 99.98%
CNA /SUB 96.83% 94.90% 98.17% 99.94% 99.90% 99.97% CNA/RE/SUB/Indel 95.97% 94.06% 97.40% 99.98% 99.96% 100.00%
CNA/ SUB/Indel 100.00% 99.42% 100.00% 99.93% 99.89% 99.96% CNA/RE/SUB/Indel 100.00% 99.30% 100.00% 99.95% 99.91% 99.97%
RE/SUB 100.00% 99.05% 100.00% 100.00% 99.98% 100.00% CNA /SUB 96.99% 95.39% 98.15% 99.84% 99.79% 99.89%
CNA/RE/SUB/Indel 100.00% 98.95% 100.00% 99.93% 99.89% 99.96% CNA/RE/SUB/Indel 99.80% 99.29% 99.98% 99.98% 99.96% 100.00%
*Abbreviations: SUB=substitution, Indel=Insertion or Deletion, CNA=Copy Number Alteration, RE=Rearrangement For the assessment of MSI, 100% agreement was observed, with a lower limit of 99.7% and upper limit of 100%. For TMB determination, thirteen samples met the inclusion criteria (TMB ≥ 10) for assessment of repeatability and reproducibility. Twelve of 13 samples (92.3%) met the ≤20% Coefficient of Variation (CV) requirements; one sample fell just outside this requirement with a repeatability CV of 21% and reproducibility CV of 23%. The putative source of variability was determined to be low depth of coverage for this sample.
2.6.1 Reagent Lot-to-Lot Reproducibility
Three lots of critical reagents were assessed for four replicates per sample in a full factorial design. Reagents were evaluated as internally prepared kits for each process step (LC, HC, sequencing). The use of three different lots of reagents did not impact performance. Twenty-seven of 28 samples (96.4%) had pairwise agreement estimates (APA and ANA) above 95%; one sample had APA estimates below 90% (85.9% to 88.7%). ANA estimates were greater than 99%. The putative source of variability was determined to be non-focal copy number amplifications with low copy number close to the calling threshold observed in one sample; no specific reagent lot performed differently among three lots for this sample.

Page 21 of 36 RAL-0011, Ver. 02
2.6.2 Instrument-to-Instrument Reproducibility Four replicates per sample were sequenced on each of three Illumina HiSeq4000 sequencers, serial numbers K00255, K00256, and K00257 in a full factorial design. The use of three different sequencers did not impact performance. Twenty-seven of 28 samples (96.4%) had pairwise agreement estimates (APA and ANA) at least 97%; one sample had APA estimates below 90% (86.6% to 89.2%). ANA estimates was greater than 99%. The putative source of variability was determined to be non-focal copy number amplifications with low copy number close to the calling threshold observed in one sample; no specific sequencer performed differently among three sequencers for this sample.
2.7 Analytical Sensitivity: Limit of Detection (LoD) and Limit of Blank (LoB) The LoDs of seven (7) biomarkers are summarized in Table 16-1 and 16-2 below. An additional twelve (12) categories of alteration types were evaluated for the F1CDx assay platform validation. A single FFPE tumor sample was selected for each of the variant categories. For each sample, six levels of MAF, with 13 replicates per level, were evaluated for a total of 78 replicates per sample. For platform-wide LoD assessment, the indels were grouped together (other than homopolymer repeat context) as they are similar in LoD characteristics. The indels ranged from 1 bp up to 42 bp insertions and deletions up to 276 bp. Indels at homopolymer repeat context had higher LoD, with a dependency on the length of the repeat context. In addition, LoD of MSI-high and TMB was also evaluated. The LoD for representative alterations detected by the F1CDx platform is summarized in Table 17-1 and 17-2. Table 16-1. Summary of LoD for alterations (short variants). LoD is based on Allele Fraction.
Alteration LoD1 Allele Fraction (%)
(100% Hit Rate)
LoD2
Allele Fraction (%) (Probit)
EGFR L858R 2.4% < 2.4% (all detected) EGFR Exon 19 deletion 5.1% 3.4% EGFR T790M 2.5% 1.8% KRAS G12/G13 2.3% < 2.3% (all detected) BRAF V600E/K 2.0% < 2.0% (all detected) BRCA1/23 Alteration in non-repetitive or homopolymer <4 bp Deletion in 8 bp homopolymer
N/A N/A
5.9% 15.3%
1 LoD calculations for the variants were based on the hit rate approach, as there were less than three levels with hit rate between 10% and 90% for all variants (not including BRCA1/2 variants). LoD from the hit rate approach is defined as the lowest level with 100% hit rate (worst scenario). 2LoD calculations for variants based on the probit approach with 95% probability of detection. 3See Summary of Safety and Effectiveness Data for P160018.
Table 16-2. Summary of analytical sensitivity for tumor purity for alterations (copy number alteration and rearrangement). LoD is based on tumor purity.
Alteration Tumor Purity (%) (100% Hit Rate)1
Tumor Purity (%) (Probit)2
ALK fusion 2.6%3 1.8% ERBB2 amplification 25.3%4 19.7%
1Sensitivity calculations for variants were based on the hit rate approach, as there were less than three levels with hit rate between 10% and 90%. LoD from the hit rate approach is defined as the lowest level with 100% hit rate (worst scenario). 2Sensitivity calculations for the variants based on the probit approach with 95% probability of detection. 3The number of chimeric reads for the sample evaluated is 16 at the indicated tumor fraction. 4The number of copy number amplifications for the sample evaluated is 6 at the indicated tumor fraction.
Table 17-1. Summary of representative LoD for F1CDx platform (short variants)

Page 22 of 36 RAL-0011, Ver. 02
Variant Category Subcategory N Range LoD1
Allele Fraction (%)
Base Substitutions known3 212 1.8-7.92 other4 166 5.9-11.8
Indels at non-homopolymer context, including insertions up to 42bp and deletions up to 276bp
known 3 4.5-6.5
other 17 6.0-10.2
Indels at homopolymer context
5bp repeat 8 10.0-12.2 6bp repeat 2 13.6-13.7 7bp repeat 4 16.3-20.4 8bp repeat 3 17.0-20.0
1LoD calculations for the platform variants were based on the hit rate approach for variants with less than three levels with hit rate between 10% and 90% and probit approach for variants with at least three levels with hit rate between 10% and 90%. LoD from the hit rate approach is defined as the lowest level with 100% hit rate (worst scenario). 2Data includes an alteration in the TERT promoter, 124C>T (LoD of 7.9%). TERT is the only promoter region interrogated and is highly enriched for repetitive context of poly-Gs, not present in coding regions. 3Alterations classified as” known” are defined as those that are listed in COSMIC 4Alterations classified as “other” include truncating events in tumor suppressor genes (splice, frameshift and nonsense) as well as variants that appear in hotspot locations but do not have a specific COSMIC association, or are considered variants of unknown significance (VUS) due to lack of reported evidence and conclusive change in function.
Table 17-2. Summary of representative analytical sensitivity for tumor purity for F1CDx platform alterations (copy number variants and rearrangements)
Variant Category N Range Tumor Purity (%)1
Copy Number Amplifications (CN>10) Copy Number Amplifications (6≤CN≤10)
8 7
9.6%-18.5% 19.5%-58.3%2
Copy Number: Homozygous Deletions 3 33.4%-33.4% Genomic Rearrangements 3 9.2%-14.9% MSI-High 3 8.3%-15.8%
1Sensitivity calculations for the platform variants were based on the hit rate approach for variants with less than three levels with hit rate between 10% and 90% and probit approach for variants with at least three levels with hit rate between 10% and 90%. LoD from the hit rate approach is defined as the lowest level with 100% hit rate (worst scenario) 2Max represents VUS alteration at calling threshold.
The LoB of zero was confirmed through the assessment of alterations within the LoB samples, with a percentage of false-positive results less than 5% (type I error risk α=0.05). Seventy-five (75) samples were used for the assessment of LoB. For all the alterations evaluated for LoD, the LoB of zero was confirmed. A similar study was conducted for BRCA alterations (PMA P160018) with no false-positive BRCA calls observed, thus confirming the LoB of zero for BRCA.

Page 23 of 36 RAL-0011, Ver. 02
2.8 Stability 2.8.1 Reagent Stability
Identical reagents with the same specifications are used following the same protocols for both the FoundationFocus CDxBRCA LOH Assay and FoundationOne CDx (F1CDx). For reagent stability performance data, see Technical File of FoundationFocus CDxBRCA LOH. The claimed reagent stability is 4 months for the library construction (LC) and hybrid capture (HC) kits, and 3 months for the sequencing kits.
2.8.2 DNA Stability
Stability of DNA was evaluated through a retrospective review of data generated using the FoundationOne LDT assay. Samples from 47 unique clinical specimens from 21 different tissues of origin were evaluated. The sample set covered 200 alterations inclusive of nucleotide changes, indels, copy number amplifications, copy number losses and rearrangements. Duration of DNA storage at time of testing ranged from 48 to 464 days, with a median of 184 days and a mean of 199 days. A total of 199 of 200 alteration calls were concordant. A 242-day old sample with a single alteration call that met inclusion criteria was discordant; however, this sample was classified as not meeting all QC criteria due to other data quality issues. DNA age for the sample with discordance was 242 days. Sixteen other samples had concordant calls with DNA age >242 days. Based on this data, DNA stored in accordance with internal procedures can be considered stable for up to six months. Further supporting this retrospective data is a prospective study conducted using ovarian cancer samples, see the Summary of Safety and Effectiveness Data for P160018. An additional prospective DNA stability study is underway.
2.8.3 FFPE Sample Stability
The FFPE Slide Stability Study evaluated the stability of FFPE tumor tissue prepared as slides prior to DNA extraction for use within the F1CDx Assay. The study evaluated five tumor samples including ovarian, lung, colorectal cancer, melanoma and breast cancer that contained a variety of DNA alterations, as described in Table 18-1 below, over a period of 15 months. The five samples were selected for specific biomarkers, but were found to contain additional alterations as well (13 CNAs, one rearrangement, 53 base substitutions and five indels; refer to Table 18-2). To assess stability of pre-cut FFPE tissue for genomic alterations, the agreement between results from the defined time points for each sample were calculated by comparing the alteration call reported at each follow-up time point to the alteration call at baseline (T0). All four follow-up time points have been evaluated – 30 days, 6 months, 12 months, and 15 months, and alterations at all the time points are in 100% agreement with the Day 0 baseline results (T0). The FFPE slides are considered stable for at least 12 months, given the successful performance observed out to 15 months.
Table 18-1. Stability Results at baseline, 30 days, 6 months, 12 months and 15 months.
Tissue
Baseline Call (T0) Percent Agreement
to T0
Percent Agreement
to T0
Percent Agreement to
T0
Percent Agreement to
T0 Gene Variant Effect 30 days
(T1) 6 months
(T2) 12 months
(T3) 15 months
(T4) Ovarian BRCA1 c.1340_1341insG,
p.H448fs*8 100% (2/2) 100% (2/2) 100% (2/2) 100% (2/2)
Lung KRAS c.34G>T, p.G12C 100% (2/2) 100% (2/2) 100% (2/2) 100% (2/2) CRC PIK3CA c.3139C>T,
p.H1047Y 100% (2/2) 100% (2/2) 100% (2/2) 100% (2/2)
Melanoma CDKN2A Homozygous Deletion
100% (2/2) 100% (2/2) 100% (2/2) 100% (2/2)
Melanoma CDKN2B Homozygous Deletion
100% (2/2) 100% (2/2) 100% (2/2) 100% (2/2)
Breast ERBB2 Amplification 100% (1/1) 100% (2/2) 100% (2/2) 100% (2/2)
Table 18-2. Percent agreement for each variant type.

Page 24 of 36 RAL-0011, Ver. 02
Variant type # of variants
30 days (T1) Percent Agreement (# agreement/total)
6 months (T2) Percent Agreement (# agreement/total)
12 months (T3) Percent Agreement (# agreement/total)
15 months (T4) Percent Agreement (# agreement/total)
Copy Number 13 100.0% (23/23) 100.0% (26/26) 100% (26/26) 100% (26/26) Rearrangement 1 100.0% (2/2) 100.0% (2/2) 100% (2/2) 100% (2/2) Substitution 53 100.0% (98/98) 100.0% (106/106) 99.1% (105/106) 100% (106/106) Ins/Dels 5 100.0% (7/7) 100.0% (10/10) 100% (10/10) 100% (10/10)
2.9 Reagent Lot Interchangeability
Identical reagents with the same specifications are used following the same protocols for both the FoundationFocus CDxBRCA LOH assay and FoundationOne CDx. For reagent lot interchangeability performance data, see the Technical File of FoundationFocus CDxBRCA LOH.
2.10 General Lab Equipment and Reagent Evaluation 2.10.1 DNA Amplification
Identical reagents and equipment with the same specifications are used following the same protocols for both the FoundationFocus CDxBRCA LOH Assay and FoundationOne CDx. For DNA amplification performance data, see the Technical File of FoundationFocus CDxBRCA LOH.
2.10.2 DNA Extraction
The performance of DNA extraction from FFPE tumor specimens was evaluated. The DNA extraction procedure for the FoundationOne CDx (F1CDx) assay was assessed by testing FFPE specimens including two samples per tissue type for ten different tumor tissue types including lung, breast, ovarian, melanoma, colorectal, brain, hepatic, pancreatic, thyroid, and bladder with different representative types of alterations. Samples were run in duplicate for a total of 240 extractions, employing two different KingFisher Flex Magnetic Particle Processors (120 extractions per processor) and comparing across three extraction reagent lots (80 extractions per reagent lot). Average DNA yield was calculated across twelve (12) replicates for each sample. All average DNA yields were significantly above the minimum requirement of 55 ng, with the minimum being 758.3 ng. Only one sample aliquot of the 240 replicates failed the DNA yield specification, and the success rates based on the reagent lot and the equipment were 98.8% (79/80) and 99.2% (119/120), respectively, passing the acceptance criteria (≥90%). Concordance of all genomic alterations detected was also analyzed for all variants across 12 replicates for each sample. Table 19 provides a summary of concordance across replicates. A study with an additional ten samples will be completed post-market. Table 19. Summary of Concordance Across Replicates of DNA Extraction Study.
Group Nconcordance Ntotal Concordance 95% CI
Substitutions (All MAF) 2700 2969 90.9% [89.9% 91.9%]
Substitutions (MAF > 10%) 1631 1637 99.6% [99.2% 99.9%] Substitutions (All MAF, excluding hypermutated sample)* 1663 1685 98.7% [98% 99.1%]
Indel (All) 465 476 97.7% [95.9% 98.8%]
Copy Number: Amplification 307 314 97.8% [95.4% 99%]
Copy Number: Loss 132 144 91.7% [85.9% 95.3%]
Rearrangement 84 90 93.3% [85.9% 97.2%] *One sample included in the study was hypermutated, harboring many alterations near LoD and exhibited evidence of external contamination. Concordance of substitutions was 80.8% for this sample.

Page 25 of 36 RAL-0011, Ver. 02
2.11 Guard banding/Robustness Guard banding studies were performed to evaluate the impact of process variation with regard to the measurement of DNA concentration at various stages of the process. Guard bands were evaluated relative to observed and measured process variability for Library Construction (LC), Hybrid Capture (HC), and Sequencing. Each of the three guard banding experiments demonstrated reliable and robust performance at all DNA input levels evaluated. A total of 255 samples were processed; ninety (90) to assess DNA input into LC, ninety (90) to assess DNA input into HC, and seventy-five (75) to assess DNA input into sequencing. For LC input, five samples were run in triplicate over six different DNA input levels representing -20% and -50% from the lower limit (50 ng) to +20% and +50% from the upper limit (1000 ng) needed for LC (n=90). Five samples were run in triplicate over six DNA input levels representing -25% and -50% from the lower limit (0.5 µg) to +25% and +50% from the upper limit (2.0 µg) for HC input. The third component of the guard banding study evaluated the captured DNA input into the sequencing reaction. Five samples were run in triplicate over five different DNA input levels representing ±10% and ±20% from the required amount needed for sequencing (1.75 nM; n=75). Concordance of detected alterations was calculated for each condition across successful replicates. Results from this study supports the robustness of the F1CDx process. The study design and results are shown below in Tables 20-1 through 20-4. Table 20-1. Summary of the success rate per process and per input level, and concordance of substitutions (SUB) among successful replicates.
Process
Input Level
# of Sample Failures
Variant Type
# of Concordant Successes
# of Variant Comparisons
Success Rate (95% CI) (Number of Concordant comparisons)
LC 25 ng 1/15 SUB 184 184 100.0% (98.0%, 100.0%) LC 40 ng 0/15 SUB 192 192 100.0% (98.1%, 100.0%) LC 50 ng 0/15 SUB 191 192 99.5% (97.1%, 100%) LC 1000ng 0/15 SUB 192 192 100.0% (98.1%, 100.0%) LC 1200 ng 0/15 SUB 191 192 99.5% (97.1%, 100%) LC 1500 ng 0/15 SUB 190 192 99.0% (96.3%, 99.9%)
HC 0.25 µg 15/15 SUB 0 0 NA* (no samples sequenced) HC 0.375 µg 12/15 SUB 30 30 100.0% (88.4%, 100.0%) HC 0.5 µg 1/15 SUB 166 166 100.0% (97.8%, 100.0%) HC 2.0 µg 0/15 SUB 192 192 100.0% (98.1%, 100.0%) HC 2.5 µg 0/15 SUB 192 192 100.0% (98.1%, 100.0%) HC 3.0 µg 0/15 SUB 192 192 100.0% (98.1%, 100.0%)
Seq 1.4 nM 0/15 SUB 192 192 100.0% (98.1%, 100.0%) Seq 1.575 nM 1/15 SUB 180 180 100.0% (98.0%, 100.0%) Seq 1.75 nM 1/15 SUB 184 184 100.0% (98.0%, 100.0%) Seq 1.925 nM 0/15 SUB 192 192 100.0% (98.1%, 100.0%) Seq 2.1 nM 0/15 SUB 192 192 100.0% (98.1%, 100.0%)
* All samples failed at the input level of 0.25 µg and as a result, there is no data available to present for that level.
Table 20-2. Summary of the success rate per process and per input level, and concordance of insertions and deletions (INDEL) among successful replicates.
Process Input Level
# of sample failures
Variant Type
# of concordant successes
# of variant comparisons
Success Rate (95% CI) (Number of Concordant comparisons)
LC 25 ng 1/15 INDEL 17 17 100.0% (80.5%, 100.0%)

Page 26 of 36 RAL-0011, Ver. 02
Process Input Level
# of sample failures
Variant Type
# of concordant successes
# of variant comparisons
Success Rate (95% CI) (Number of Concordant comparisons)
LC 40 ng 0/15 INDEL 18 18 100.0% (81.5%, 100.0%) LC 50 ng 0/15 INDEL 18 18 100.0% (81.5%, 100.0%) LC 1000ng 0/15 INDEL 18 18 100.0% (81.5%, 100.0%) LC 1200 ng 0/15 INDEL 18 18 100.0% (81.5%, 100.0%) LC 1500 ng 0/15 INDEL 18 18 100.0% (81.5%, 100.0%)
HC 0.25 µg 15/15 INDEL 0 0 NA* (no samples sequenced) HC 0.375 µg 12/15 INDEL 4 4 100.0% (39.8%, 100.0%) HC 0.5 µg 1/15 INDEL 18 18 100.0% (81.5%, 100.0%) HC 2.0 µg 0/15 INDEL 18 18 100.0% (81.5%, 100.0%) HC 2.5 µg 0/15 INDEL 18 18 100.0% (81.5%, 100.0%) HC 3.0 µg 0/15 INDEL 18 18 100.0% (81.5%, 100.0%)
Seq 1.4 nM 0/15 INDEL 18 18 100.0% (81. 5%, 100.0%) Seq 1.575 nM 1/15 INDEL 16 16 100.0% (79.4%, 100.0%) Seq 1.75 nM 1/15 INDEL 17 17 100.0% (80.5%, 100.0%) Seq 1.925 nM 0/15 INDEL 18 18 100.0% (81.5%, 100.0%) Seq 2.1 nM 0/15 INDEL 18 18 100.0% (81.5%, 100.0%)
* All samples failed at the input level of 0.25 µg and as a result, there is no data available to present for that level.
Table 20-3. Summary of the success rate per process and per input level, and concordance of rearrangements (RE) among successful replicates.
Process Input Level
# of sample failures
Variant Type
# of concordant successes
# of variant comparisons
Success Rate (95% CI) (Number of Concordant comparisons)
LC 25 ng 1/15 RE 6 6 100.0% (54.1%, 100.0%) LC 40 ng 0/15 RE 6 6 100.0% (54.1%, 100.0%) LC 50 ng 0/15 RE 6 6 100.0% (54.1%, 100.0%) LC 1000ng 0/15 RE 6 6 100.0% (54.1%, 100.0%) LC 1200 ng 0/15 RE 6 6 100.0% (54.1%, 100.0%) LC 1500 ng 0/15 RE 6 6 100.0% (54.1%, 100.0%)
HC 0.25 µg 15/15 RE 0 0 NA* (no samples sequenced) HC 0.375 µg 12/15 RE 2 2 100.0% (15.8%, 100.0%) HC 0.5 µg 1/15 RE 6 6 100.0% (54.1%, 100.0%)
HC 2.0 µg 0/15 RE 6 6 100.0% (54.1%, 100.0%)
HC 2.5 µg 0/15 RE 6 6 100.0% (54.1%, 100.0%)
HC 3.0 µg 0/15 RE 6 6 100.0% (54.1%, 100.0%)
Seq 1.4 nM 0/15 RE 8 9 88.9% (51.8%, 99.7%) Seq 1.575 nM 1/15 RE 9 9 100.0% (66.4%, 100.0%) Seq 1.75 nM 1/15 RE 8 8 100.0% (63.1%, 100.0%) Seq 1.925 nM 0/15 RE 8 9 88.9% (51.8%, 99.7%) Seq 2.1 nM 0/15 RE 7 9 77.8% (40.0%, 97.2%)
* All samples failed at the input level of 0.25 µg and as a result, there is no data available to present for that level.

Page 27 of 36 RAL-0011, Ver. 02
Table 20-4. Summary of the success rate per process and per input level, and concordance of copy number alterations (CN) among successful replicates.
Process Input Level
# of sample failures
Variant Type
# of concordant successes
# of variant comparisons
Success Rate (95% CI) (Number of Concordant comparisons)
LC 25 ng 1/15 CN 128 128 100.0% (97.2%, 100.0%) LC 40 ng 0/15 CN 132 132 100.0% (97.2%, 100.0%) LC 50 ng 0/15 CN 132 132 100.0% (97.2%, 100.0%)
LC 1000ng 0/15 CN 132 132 100.0% (97.2%, 100.0%)
LC 1200 ng 0/15 CN 132 132 100.0% (97.2%, 100.0%)
LC 1500 ng 0/15 CN 132 132 100.0% (97.2%, 100.0%)
HC 0.25 µg 15/15 CN 0 0 NA* (no samples sequenced) HC 0.375 µg 12/15 CN 13 14 92.9% (66.1%, 99.8%) HC 0.5 µg 1/15 CN 107 108 99.0% (95.0 %, 100.0%) HC 2.0 µg 0/15 CN 129 132 97.7% (93.5%, 99.5%) HC 2.5 µg 0/15 CN 129 132 97.7% (93.5%, 99.5%) HC 3.0 µg 0/15 CN 130 132 98.5% (94.6%, 99.8%)
Seq 1.4 nM 0/15 CN 131 132 99.2% (95.9%, 100.0%) Seq 1.575 nM 1/15 CN 122 128 95.3% (90.1%, 98.3%) Seq 1.75 nM 1/15 CN 128 128 100.0% (97.2%, 100.0%) Seq 1.925 nM 0/15 CN 130 132 98.5% (94.6%, 99.8%) Seq 2.1 nM 0/15 CN 131 132 99.2% (95.9%, 100.0%)
* All samples failed at the input level of 0.25 µg and as a result, there is no data available to present for that level.
3. Clinical Studies Non-inferiority (NI) statistical testing approach was used for the enrichment design presented in the paper by Li (2016)1, when a reference standard is not available. To assess clinical concordance, F1CDx was compared to FDA-approved CDxs (CCD). All studies based on NI passed the acceptance criteria specified in each study protocol. Clinical concordance studies, with the exception of ALK and EGFR T790M, were subject to pre-screening bias. Therefore, the concordance results may be over or under estimated and the failure rate may be underestimated.
3.1 FoundationOne CDx Concordance Study for EGFR Exon19delL858R
Clinical validity of FoundationOne CDx (F1CDx) used for identifying patients with advanced NSCLC who may be eligible for treatment with Gilotrif® (afatinib), Iressa® (gefitinib), or Tarceva® (erlotinib) was established by retrospectively testing 282 samples from NSCLC patients. The EGFR diagnostic results from the F1CDx assay were compared against those obtained from the approved cobas® EGFR Mutation Test v2 (Roche Molecular Systems). Samples were tested using cobas® EGFR mutation test (CCD1) with an approximately equal number of mutation positive and negative samples, followed by testing with F1CDx and a second, replicate testing of cobas® EGFR mutation test (CCD2). NSCLC tumor samples used for this study were not obtained from a clinical trial and had limited demographic data available. For this study age and gender data were available and were found to be similar to the pivotal study EURTAC. Two separate concordance analyses were performed: one with samples with complete records only (N = 267), and the other with all the 282 samples, where missing data was handled by multiple imputation. Data from concordance testing is summarized in Table 21 below.

Page 28 of 36 RAL-0011, Ver. 02
Table 21. Concordance Table with CCD1, CCD2 and F1CDX results with eligible samples. CCD1+ CCD1-
CCD2+ CCD2- CCD2 missing Total CCD2+ CCD2- CCD2 missing Total
F1CDx+ 106 0 0 106 1 1* 0 2 F1CDx- 2** 1 0 3 3 153 0 156 F1CDx Missing 3 0 0 3 1 9 2 12 Total 111 1 0 112 5 163 2 170
* QRF006212 was the only sample where both replicates of the cobas® v2 assay reported negative results but F1CDx reported positive for L858R with AF 33%. Upon further review, F1CDx identified a second somatic mutation in-cis (on same allele) as that of L858R with identical AF only 17bp downstream: EGFR A864P. Therefore, it is suspected that this second mutation interfered with the allele-specific PCR primers of cobas® v2, and thus L858R went undetected. ** QRF005867 was reported as positive for both replicates of cobas® v2 for exon19 deletion, but negative by F1CDx. F1CDx detected the exon19 deletion, but incorrectly annotated the variant as 2 frameshift mutations. This would have been corrected by manual curation review, which was not part of this concordance study. QRF005883 was also reported as positive for both replicates of cobas® v2 for exon19 deletion, but negative by F1CDx. F1CDx identified an 18bp exon 19 insertion event, with protein effect K745_E746insIPVAIK. As cobas®v2 is not designed to detect insertion events at exon 19, it is likely an error by cobas® v2.
Fifteen (15) samples were assigned as missing data for F1CDX, two of which also had missing results for CCD2. Missing data was caused by process failures or samples not meeting assay specifications. By defining the reference standard as the consensus calls between CCD1 and CCD2, F1CDx achieved a PPA of 98.1% (106/108) (95% CI [93.5%, 99.8%]) and NPA of 99.4% (153/154) (95% CI [96.4%, 100.0%]). These data are summarized in Table 22.
Table 22. Summary of concordance data using agreement between CCD1 and CCD2 as the reference.
CCD1+/CCD2+ CCD1-/CCD2-
F1CDX+ 106 1
F1CDX- 2 153 The mutations detected by cobas® EGFR mutation test include all the mutations detected by therascreen® EGFR RGQ PCR Kit, as well as a few additional exon19 deletions/L858R variants. Several concordance studies comparing the cobas® EGFR mutation test and therascreen® EGFR RGQ PCR Kit have been reported in literature2,3,4, supporting that these two assays are concordant. Additionally, a post-market concordance study will be completed comparing F1CDx to the therascreen® EGFR RGQ PCR Kit.
3.2 FoundationOne CDx Concordance Study for EGFR T790M The study established the clinical validity of the FoundationOne CDx (F1CDx) used for identifying NSCLC patients harboring EGFR T790M that may be eligible for treatment with Tagrisso® (osimertinib). The patient samples and corresponding demographic information were obtained from AstraZeneca in connection with the clinical studies entitled AURA (NCT01802632), AURA2 (NCT02094261) and AURA3 (NCT02151981). The EGFR T790M diagnostic results from the F1CDx assay were compared against the consensus calls between the original T790M testing used in the AURA, AURA2 and AURA3 studies and a separate run of the FDA approved cobas® v2 EGFR Mutation Test (Roche Molecular Systems, referred to as cobas® v2 assay below; using a NI approach.

Page 29 of 36 RAL-0011, Ver. 02
Two separate concordance analyses were performed: one included samples with complete records only (N = 227), and the second analysis was with all the 312 samples, where missing data was handled by multiple imputation. A summary of concordance is presented in Table 23.
Table 23. Concordance Table with CCD1, CCD2 and F1CDX results with eligible samples. CCD1+ CCD1-
CCD2+ CCD2- CCD2 missing Total CCD2+ CCD2- CCD2 missing Total
F1CDx+ 87 19 1 107 8 15 0 23
F1CDx- 1 4 0 5 0 93 2 95 F1CDx Missing 21 4 8 33 1 37 11 49
Total 109 27 9 145 9 145 13 167 Eighty-two samples were assigned as missing data for F1CDx, which consisted of 78 samples with no sequencing results from F1CDx and four samples with QC status as “Fail” after curation. CCD2 had 22 samples with missing data in total, in which 19 samples also had missing values in F1CDx. The concordance analysis above shows that for the results of PPA, F1CDx is more concordant with both CCD1 and CCD2 than CCD1 is with CCD2; the opposite is true for NPA results. See Venn Diagram below for the T790M-positive calls (Figure 2).
Figure 2. Venn Diagram for EGFR T790M-positive samples
A difference in detection sensitivity between CCD1 and CCD2 was observed, with CCD1 appearing to be more sensitive than CCD2. This could be attributed to the fact that CCD1 was run 2-3 years ago using freshly biopsied tissue, while CCD2 testing was recently performed using DNA extracted from archival FFPE sections. Figure 3 below illustrates the relationship between allele frequency and detection by F1CDx, CCD1 and CCD2. The results demonstrated that F1CDx detects mutations at allele frequency lower than 5% which are not detected by cobas® v2 assay. The clinical performance in this subset of patient population (patients with an EGFR T790M mutation detected with an allele fraction <5%) is ongoing and has not been established.

Page 30 of 36 RAL-0011, Ver. 02
Figure 3. Distribution of MAF in F1CDx+ (FCD) samples By defining the reference standard as the consensus calls between CCD1 and CCD2, F1CDx achieved a PPA of 98.9% (87/88) (95% CI [93.8%, 100.0%]) and NPA of 86.1% (93/108) (95% CI [78.1%, 92.0%]) as summarized in Table 24 below.
Table 24. Summary of concordance data using agreement between CCD1 and CCD2 as the reference.
CCD1+/CCD2+ CCD1-/CCD2-
F1CDx+ 87 15
F1CDx- 1 93
3.3 FoundationOne CDx Concordance Study for ERBB2 (HER2) Clinical validity of FoundationOne CDx (F1CDx) used to identify patients eligible for treatment with approved HER2-directed therapies including Herceptin® (trastuzumab), Kadcyla® (ado-trastuzumab-emtansine), and Perjeta® (pertuzumab) was established. A study was performed using 317 pre-screened retrospective samples obtained from patients with advanced breast cancer. The failure rate for pre-screening is not known, however, the sample set is enriched for samples with HER2+ samples with ratio between 2 and 3 representing 27% of samples compared to the expected range of 8-10% reported in literature5,6. The ERBB2 amplification positive results from the F1CDx assay were compared against those obtained from the approved HER2 FISH PharmDx® Kit (Dako Denmark A/S). The samples used for this study were not obtained from a clinical trial and had limited demographic data available. For this study age and ethnicity data were available. Age data was compared to the Danish Study for the Danish Breast Cancer Group clinical trial 89-D in 1990 and was found to have a similar distribution, though the mean age was higher for the concordance samples. Concordance data are summarized in Table 25 below.

Page 31 of 36 RAL-0011, Ver. 02
Table 25. Concordance Table with CCD1, CCD2 and F1CDx results with eligible samples.
CCD1+ CCD1- CCD2+ CCD2- Total CCD2+ CCD2- Total F1CDx+ 101 2 103 3 3 6 F1CDx- 12 10 22 6 180 186 Total 113 12 125 9 183 192
The prevalence of the ERBB2/HER2 amplification mutation in the IU population is based on the ASCO guideline and is estimated to be 17.5%. To assess the impact of prevalence for the main results of this study, a sensitivity analysis was performed using the lower and upper bound of the prevalence guideline of 15% and 20%. The sensitivity analysis also showed that there was no impact on the study conclusion. The distribution of age is similar to the IU population for all samples tested. However, there was missing demographic data from the sample population. For missing data analysis using multiple imputation, the results show that based on the MAR assumption, the invalid test results did not affect the conclusion of this study.
The Venn diagrams for samples tested positive or negative for ERBB2/HER2-amplification mutation in all three assays (F1CDx, CCD1 and CCD2) are presented in Figure 4.
Figure 4. Venn Diagrams for ERBB2-amplification positive (left panel) and negative (right panel) samples.
These two Venn diagrams illustrate concordance among F1CDx, CCD1 and CCD2. For the F1CDx+ samples, concordance of F1CDx with CCD1 or CCD2 was better than concordance between the same platform tests CCD1 and CCD2; for the F1CDx- samples, F1CDx was more consistent in calling negative alterations than either CCD1 or CCD2. Using the consensus calls between CCD1 and CCD2 as the reference standard, i.e. limiting analysis to only the samples in which CCD1 and CCD2 are in agreement, the results are shown below:
Table 26. Summary of concordance data using agreement between CCD1 and CCD2 as the reference.
CCD1+/CCD2+ CCD1-/CCD2-
F1CDx+ 101 3
F1CDx- 12 180
Based on these results, PPA is 89.4% (101/113) (95% CI [82.2%, 94.4%]) and NPA is 98.4% (180/183) (95% CI [95.3%, 99.7%]).
3
106
12
32
F1CDx +
CCD2 + CCD1+
3
12
2
101
F1CDx-
CCD2- CCD1-
10
3
6 180

Page 32 of 36 RAL-0011, Ver. 02
3.4 FoundationOne CDx Concordance Study for ALK Clinical validity of FoundationOne CDx (F1CDx) used to identify non-small cell lung cancer (NSCLC) patients eligible for treatment with approved ALK-directed therapies including Alecensa® (alectinib), XALKori® (crizotinib), or Zykadia® (ceritinib) was established. The study was performed using 175 tumor samples from patients with histologically-confirmed NSCLC including enrolled patients as well as screen failures from the clinical trial NCT02075840, Roche study number BO28984 (also known as the ALEX study), which is a randomized, active controlled, multicenter phase III open-label study designed to evaluate the efficacy and safety of alectinib compared with crizotinib treatment in participants with treatment-naïve ALK rearrangement positive advanced NSCLC. The ALK diagnostic results from the F1CDx panel were compared against those obtained from the US FDA approved Ventana ALK (D5F3) CDx Assay (“Ventana IHC”, Ventana Medical Systems, Inc.) and Vysis ALK Break-Apart FISH Probe Kit (“Vysis FISH”, Abbott Molecular). The Vysis FISH assay results used were obtained from the ALEX study. In this concordance study, the majority of the samples were from the IU population of the clinical trial NCT02075840. The concordance results are summarized in Table 27 below. Table 27. Concordance Table with CCD1, CCD2 and F1CDx results with eligible samples CCD1 + CCD1 - CCD2 + CCD2 - Total CCD2 + CCD2 - Total F1CDx + 78 1 79 3 0 3 F1CDx - 6* 7 13 5 75 80 Total 84 8 92 8 75 83
*Two samples harbored ALK rearrangements that were detected by F1CDx but were classified as negative based on the study protocol. The Venn diagrams for samples tested positive or negative for ALK-rearrangement mutation in all three assays (F1CDx, CCD1 and CCD2) are shown in Figure 5.
Figure 5. Venn Diagrams for ALK-rearrangement positive (left panel) and negative (right panel) samples.
These two Venn diagrams illustrate concordance among F1CDx, CCD1 and CCD2. A number of samples with discordant results between CCD1 and CCD2 were observed. This is expected because Vysis FISH Assay (CCD2) is a technology that probes at the DNA level while Ventana ALK IHC assay examines protein expression. When samples that were discordant between CCD1 and CCD2 were excluded, the concordance between F1CDx+ with CCD1+ and CCD2+ samples was superior to concordance between CCD1+ and CCD2+ samples. For the F1CDx- samples, F1CDx was more consistent in calling negative alterations than either CCD1 or CCD2. Using the consensus calls between CCD1 and CCD2 as the reference standard, i.e. limiting analysis to only the samples in which CCD1 and CCD2 are in agreement, the results are shown below in Table 28
0
75
6
31
F1CDx+
CCD2 + CCD1+
3
6
1
78
F1CDx-
CCD2- CCD1-
7
0
5 75

Page 33 of 36 RAL-0011, Ver. 02
Table 28. Summary of concordance data using agreement between CCD1 and CCD2 as the reference.
CCD1+/CCD2+ CCD1-/CCD2-
F1CDx+ 78 0
F1CDx- 6* 75 *Two samples harbored ALK rearrangements that were detected by F1CDx but were classified as negative based on the study protocol. Based on these results, PPA is 92.9% (78/84) (95% CI [85.1%, 97.3%]) and NPA is 100% (75/75) (95% CI [95.2%, 100.0%]).
3.5 FoundationOne CDx Concordance Study for KRAS Clinical validity of FoundationOne CDx (F1CDx) used to identify colorectal cancer patients that may not benefit from certain EGFR inhibitor treatments, including Erbitux® (cetuximab) or Vectibix® (panitumumab), due to alterations in KRAS. The study was performed using 342 retrospective samples obtained from patients with advanced front-line or later-line colorectal cancer (CRC). Samples used in this study underwent pre-screening using the FoundationOne laboratory developed test (F1 LDT) or prescreening by an external vendor to enrich for positive samples. The prescreen failure rate using the F1 LDT was 3.7% and is unknown for the external vendor. The KRAS diagnostic results from the F1CDx assay were compared against those obtained from the approved therascreen® KRAS RGQ PCR Kit (Qiagen). The samples used for this study were not obtained from a clinical trial and had limited demographic data available. For this study age, gender and ethnicity data were available. Age and gender characteristics were found to be similar between the F1CDx concordance study and the pivotal studies, with the percentage of male samples in the concordance study being slightly lower compared to the pivotal studies (CRYSTAL and PRIME). Concordance data are summarized in Table 29 below. Table 29. Concordance Table with CCD1, CCD2 and F1CDx results with eligible samples.
CCD1+ CCD1-
CCD2+ CCD2- CCD2 missing Total CCD2+ CCD2- CCD2
missing Total
F1CDx+ 173 0 2 175 0 0 0 0 F1CDx- 0 2 0 2 1 154 7 162 F1CDx Missing 0 0 0 0 0 3 0 3
Total 173 2 2 177 1 157 7 165 Twelve (12) samples are assigned as missing data, including 3 samples with missing data in F1CDx and 9 samples with missing data in CCD2.
The prevalence of the KRAS mutation in the IU population is based on the CRYSTAL study for cetuximab (35.6%) and PRIME study for panitumumab (40%). The key statistics of PPA and NPA between F1CDx and the two replicates of the therascreen® assay (CCD1 and CCD2) were estimated based on the result in Table 30. Multiple imputation was used to impute the missing data and showed that missing data did not impact study conclusions. The summary statistics of age and sex were highly similar to the estimates from the pivotal trial CRYSTAL (for cetuximab) and PRIME (for panitumumab) studies. By defining the reference standard as the consensus calls between CCD1 and CCD2, F1CDx achieved a PPA of 100% (173/173) (95% CI [97.9%, 100.0%]) and NPA of 100% (154/154) (95% CI [97.6%, 100.0%]).
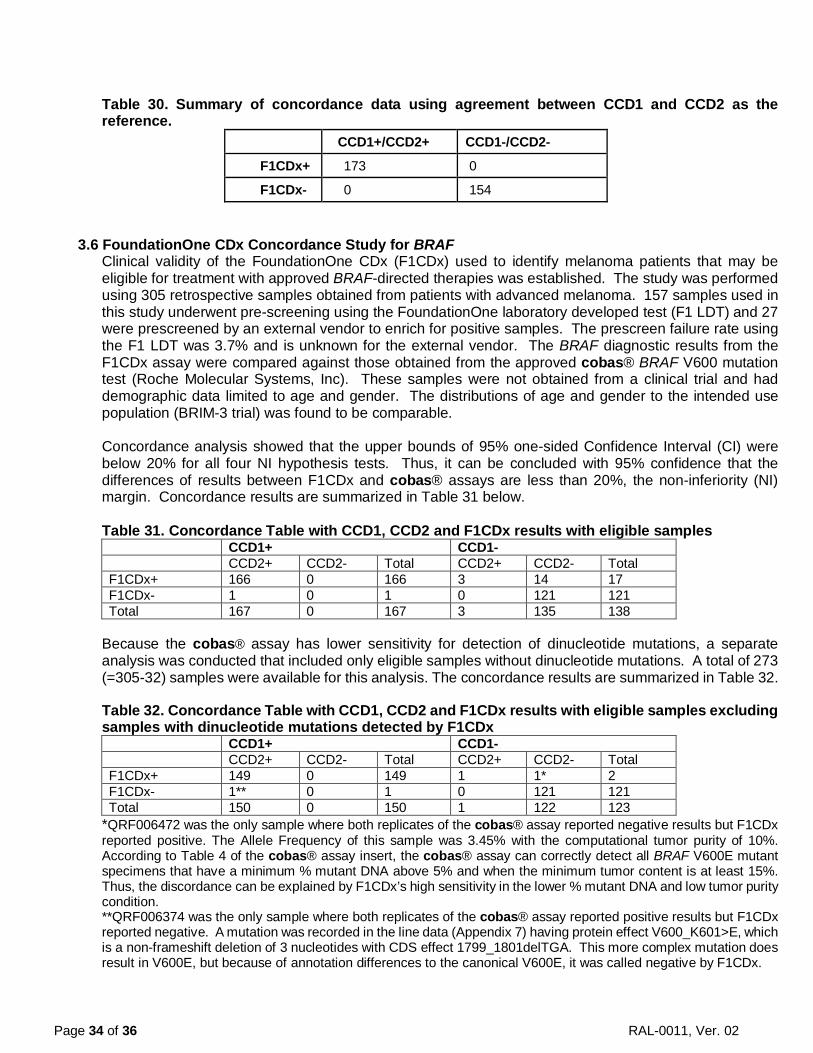
Page 34 of 36 RAL-0011, Ver. 02
Table 30. Summary of concordance data using agreement between CCD1 and CCD2 as the reference.
CCD1+/CCD2+ CCD1-/CCD2-
F1CDx+ 173 0
F1CDx- 0 154
3.6 FoundationOne CDx Concordance Study for BRAF Clinical validity of the FoundationOne CDx (F1CDx) used to identify melanoma patients that may be eligible for treatment with approved BRAF-directed therapies was established. The study was performed using 305 retrospective samples obtained from patients with advanced melanoma. 157 samples used in this study underwent pre-screening using the FoundationOne laboratory developed test (F1 LDT) and 27 were prescreened by an external vendor to enrich for positive samples. The prescreen failure rate using the F1 LDT was 3.7% and is unknown for the external vendor. The BRAF diagnostic results from the F1CDx assay were compared against those obtained from the approved cobas® BRAF V600 mutation test (Roche Molecular Systems, Inc). These samples were not obtained from a clinical trial and had demographic data limited to age and gender. The distributions of age and gender to the intended use population (BRIM-3 trial) was found to be comparable. Concordance analysis showed that the upper bounds of 95% one-sided Confidence Interval (CI) were below 20% for all four NI hypothesis tests. Thus, it can be concluded with 95% confidence that the differences of results between F1CDx and cobas® assays are less than 20%, the non-inferiority (NI) margin. Concordance results are summarized in Table 31 below. Table 31. Concordance Table with CCD1, CCD2 and F1CDx results with eligible samples CCD1+ CCD1- CCD2+ CCD2- Total CCD2+ CCD2- Total F1CDx+ 166 0 166 3 14 17 F1CDx- 1 0 1 0 121 121 Total 167 0 167 3 135 138
Because the cobas® assay has lower sensitivity for detection of dinucleotide mutations, a separate analysis was conducted that included only eligible samples without dinucleotide mutations. A total of 273 (=305-32) samples were available for this analysis. The concordance results are summarized in Table 32.
Table 32. Concordance Table with CCD1, CCD2 and F1CDx results with eligible samples excluding samples with dinucleotide mutations detected by F1CDx CCD1+ CCD1- CCD2+ CCD2- Total CCD2+ CCD2- Total F1CDx+ 149 0 149 1 1* 2 F1CDx- 1** 0 1 0 121 121 Total 150 0 150 1 122 123
*QRF006472 was the only sample where both replicates of the cobas® assay reported negative results but F1CDx reported positive. The Allele Frequency of this sample was 3.45% with the computational tumor purity of 10%. According to Table 4 of the cobas® assay insert, the cobas® assay can correctly detect all BRAF V600E mutant specimens that have a minimum % mutant DNA above 5% and when the minimum tumor content is at least 15%. Thus, the discordance can be explained by F1CDx’s high sensitivity in the lower % mutant DNA and low tumor purity condition. **QRF006374 was the only sample where both replicates of the cobas® assay reported positive results but F1CDx reported negative. A mutation was recorded in the line data (Appendix 7) having protein effect V600_K601>E, which is a non-frameshift deletion of 3 nucleotides with CDS effect 1799_1801delTGA. This more complex mutation does result in V600E, but because of annotation differences to the canonical V600E, it was called negative by F1CDx.

Page 35 of 36 RAL-0011, Ver. 02
PPA and NPA were calculated by defining the reference standard as the consensus calls between CCD1 and CCD2. The observed performance of cobas® has lower sensitivity for detection of dinucleotide V600 alterations (including V600K) than the single nucleotide V600E 1799T>A alteration, particularly at allele frequency below 40% detected by F1CDx, therefore, the data presented will include PPA/NPA results both with both alterations as the study was designed, as well as for V600E only in Table 33. A study using the THxIDTM BRAF kit (bioMérieux) was conducted using 29 samples with BRAF V600 dinucleotide mutation detected by F1CDx and 29 negative samples to provide a better evaluation of V600 dinucleotide concordance. Out of the 51 samples with valid results from the THxIDTM BRAF kit (Table 34), there was only one discordant result (F1CDx-/THxID+), achieving a PPA of 96.3% (26/27) (95% CI [81.0%, 99.9%]) and NPA of 100% (24/24) (95% CI [85.8%, 100.0%]). Table 33. PPA and NPA for BRAF V600 detection with cobas®. PPA NPA All V600 alterations 99.4% (166/167) 89.6% (121/135) Single nucleotide V600E (1799T>A) 99.3% (149/150) 99.2% (121/122) Table 34. Concordance of BRAF dinucleotide samples with THxIDTM BRAF kit.
Dinucleotide Samples THxID+ THxID- Total
F1CDx+ 26 0 26 F1CDx- 1 24 25 Total 27 24 51
3.7 FoundationOne CDx Concordance with FoundationFocus CDxBRCA LOH for BRCA1and BRCA2. FoundationOne CDx (F1CDx) and FoundationFocus CDxBRCA LOH use the same reagents, equipment and procedures with exception of the allowance for a broader range of DNA input into library construction and incremental enhancements to the analysis pipeline for F1CDx. The two changes were shown to have no impact on assay performance through the guard band study which included ovarian tissue and a comprehensive validation of the analysis pipeline which included robust regression testing and reanalysis of FoundationFocus CDxBRCA LOH clinical bridging sample data. As such, the assays were determined to be concordant. Details for the clinical study in which the assay was shown to be effective in identify patients with ovarian cancer that may benefit from rucaparib treatment can be found in the Technical File of FoundationFocus CDxBRCA LOH. 3.8 Summary of Clinical Concordance Studies A summary of clinical concordance study results is included in Table 35 below. The reference standard used to calculate positive percent agreement (PPA) and negative percent agreement (NPA) below is defined as the consensus calls between the two comparator methods or comparator runs. Agreement calculations solely using consensus calls may overestimate the performance of F1CDx. Table 35. Summary of PPA and NPA for Concordance Studies
Biomarker PPA NPA Comparator Method EGFR exon 19 deletions and L858R
98.1% (106/108) 99.4% (153/154) cobas® EGFR Mutation Test v2
EGFR T790M 98.9% (87/88) 86.1% (93/108) cobas® EGFR Mutation Test v1 cobas® EGFR Mutation Test v2
ALK rearrangements 92.9% (78/84) 100% (75/75) Ventana ALK (D5F3) CDx Assay Vysis ALK Break-Apart FISH Probe Kit
KRAS 100% (173/173) 100% (154/154) therascreen® KRAS RGQ PCR Kit ERBB2(HER2) Amplifications
89.4% (101/113) 98.4% (180/183) Dako HER2 FISH PharmDx® Kit
BRAF V600 99.4% (166/167) 89.6% (121/135)* cobas® BRAF V600 Mutation Test

Page 36 of 36 RAL-0011, Ver. 02
Biomarker PPA NPA Comparator Method BRAF V600E BRAF V600 dinucleotide**
99.3% (149/150) 96.3% (26/27)
99.2% (121/122) 100% (24/24)
cobas® BRAF V600 Mutation Test THxIDTM BRAF kit
* Sensitivity of dinucleotide detection of BRAF V600K and V600E was found to be significantly reduced in cobas® test, in particular for samples in which F1CDx detected the dinucleotides to be of lower than 40% MAF, leading to low NPA values. ** A study using the THxIDTM BRAF kit (bioMérieux) was conducted with samples with BRAF V600 dinucleotide mutation detected by F1CDx and BRAF V600 negative samples to provide a better evaluation of V600 dinucleotide concordance.
4. References
1. Li M. Statistical Methods for Clinical Validation of Follow-On Companion Diagnostic Devices via an External
2. Kimura H., Ohira T., Uchida O., et al. Analytical performance of the cobas EGFR mutation assay for Japanese non-small-cell lung cancer. Lung Cancer 83, 329-333 (2014).
3. Lopez-Rios F., Angulo B., Gomez B., et al. Comparison of molecular testing methods for the detection of EGFR mutations in formalin-fixed paraffin-embedded tissue specimens of non-small cell lung cancer. J Clin Pathol 66, 381–385 (2013).
4. Wong AT, To RM, Wong CL, et al. Evaluation of 2 Real-Time PCR Assays for In Vitro Diagnostic Use in the Rapid and Multiplex Detection of EGFR Gene Mutations in NSCLC. Diagn Mol Pathol 22, 138-43 (2013).
5. Press et al., HER2 Gene Amplification Testing by Fluorescent In Situ Hybridization (FISH): Comparison of the ASCO-College of American Pathologists Guidelines With FISH Scores Used for Enrollment in Breast Cancer International Research Group Clinical Trials, J Clin Oncol 34:3518-3528, 2016
6. Dowsett, M. et al, Disease-Free Survival According to Degree of HER2 Amplification for Patients Treated with Adjuvant Chemotherapy With or Without 1 Year of Trastuzumab: The HERA Trial, J Clin Oncol 27:2962-2969, 2009
QARAD BVBA Cipalstraat 3, 2440 Geel, Belgium
Foundation Medicine, Inc. 150 Second Street Cambridge, MA 02141