f1/5/2 umar banda (012 358 8110) mayoral … umar banda (012 358 8110) group financial services...
TRANSCRIPT

1
F1/5/2 Umar Banda (012 358 8110)
MAYORAL COMMITTEE: JANUARY 2018
From: The City Manager To: The Executive Mayor SUBMISSION
GROUP FINANCIAL SERVICES DEPARTMENT: MUNICIPAL FINANCE MANAGEMENT ACT (MFMA)
(1) IN-YEAR FINANCIAL REPORT (MONTHLY AND SECOND QUARTER
BUDGET STATEMENT) FOR THE PERIOD ENDING 31 DECEMBER 2017 AND;
(2) MID-YEAR BUDGET ASSESSMENT
1. PURPOSE
This report outlines progress on the financial performance of the City of Tshwane against the budget for the period ended 31 December 2017, in compliance with
Sections 52(d), 71 and 72 of the Municipal Finance Management Act (MFMA).
2. STRATEGIC PILLAR
A City that is open, honest and responsive.
3. BACKGROUND
Section 52(d) of the MFMA stipulates that “the mayor of a municipality – must, within 30 days of the end of each quarter, submit a report to Council on the
implementation of the budget and the financial state of the municipality.” Section 71(1) further stipulates: “The accounting officer of a municipality must by no later than 10 working days after the end of each month submit to the mayor of the
municipality and the relevant treasury a statement in the prescribed format on the
state of the municipality’s budget.” For the reporting period ended 31 December 2017, the ten-working-day reporting limit expires on 15 January 2018.
In addition, Section 72 of the MFMA, which relates to the mid-year budget and performance assessment, requires that the Accounting Officer of the Municipality must, by 25 January of each year, submit a report to the Executive Mayor, National
Treasury and Provincial Treasury, assessing the performance of the municipality during the first half of the financial year, and as part of the review, make
recommendations as to whether an adjustments budget is necessary, and recommend revised projections for revenue and expenditure to the extent that it may be necessary.

2
4. DISCUSSION
On 25 May 2017, Council approved the 2017/18 Medium-term Revenue and Expenditure Framework for the City of Tshwane.
The attached in-year report (Annexure A) provides a high-level analysis as at 31 December 2017 in the prescribed format. Material variances will be briefly referred
to in this report. Comprehensive explanations will be included in the Monthly Financial Management Report.
The following table summarises the financial performance as at 31 December 2017.
The actual operating revenue realised, excluding capital transfers and contributions
to the City of Tshwane, reflects an unfavourable variance of R939 million against the year-to-date (YTD) budget for the period ended 31 December 2017.
The operating expenditure is underspent by R2 billion, which is 12% less than the YTD expenditure projection.
The total capital budget allocation amounts to R3,9 billion. The expenditure for the period including the entities amounts to R854 million, representing 22% against the
total budget.
Cash and cash equivalents as at 31 December 2017 amount to R2 billion. The mid-term results for revenue and expenditure reflects an unfavourable variance.
The following impending shortfalls and overspending need to be addressed.
Under-recovery of service charges revenue by R449 million as a result of the following:
- Electricity revenue (R35 million unfavourable) mainly on smart prepaid electricity.
- Water revenue (R369 million unfavourable) and sanitation (R15 million unfavourable) – due to a decline in usage. The budget for water and sewerage is based on statistical trends.
- Refuse revenue (R30 million unfavourable) mainly on bulk containers and landfill sites.

3
Transfers and subsidies: (R589 million unfavourable) mainly due to the
outstanding transfer of the equitable share.
The overall expenditure is underspent by R2 billion, however, there are certain line items that have overspent, such as overtime salaries, standby allowance,
leased buildings, etc.
The possible under-recovery on revenue and possible overspending on
expenditure will be managed and addressed as part of the adjustment budget.
4.1 INTERDEPARTMENTAL AND CLUSTER IMPACT
The Mayoral Committee will be provided with a monthly financial management report
that contains comprehensive detail on the variance against the budget.
5. COMMENTS OF STAKEHOLDERS
5.1 GROUP HEAD: GROUP LEGAL AND SECRETARIAT SERVICES
Note is taken of the purpose and contents of the report for purposes of these
comments. It transpires from the report that it complies with the requirements of Section 52(d), 71 and 72 of the MFMA, with reference to the prescribed reporting
responsibilities of the Executive Mayor and Accounting Officer as expounded in the report.
In view of the above, the recommendations are supported for consideration and
further action by the Accounting Officer in terms of Section 70(1)(a) and (b) of the MFMA.
6. IMPLICATIONS
6.1 HUMAN RESOURCES
None
6.2 FINANCES (BUDGET AND VALUE FOR MONEY)
This report incorporates information on the City of Tshwane’s financial status for the period ended 31 December 2017. Upon receipt of the statement or report submitted by the Accounting Officer to the Executive Mayor, in terms of Section 71 of the MFMA,
the Executive Mayor is obliged to take certain steps regarding “budgetary control and early identification of financial problems”, as required in terms of Section 54 of the
MFMA. Furthermore, the Accounting Officer must, in writing, report to the municipal Council the impending shortfalls, overspending and overdrafts in terms of Section 70 of the MFMA.
6.3 CONSTITUTIONAL AND LEGAL FACTORS
This report must be approved, in compliance with legislative requirements (Section 52(d) and 71 of the MFMA) and National Treasury Regulation GG 32141 of 17 April
2009.
6.4 COMMUNICATION

4
In compliance with legislative requirements (Section 71 of the MFMA), this document is provided to all stakeholders by placing it on the City of Tshwane public website.
6.5 PREVIOUS MAYORAL COMMITTEE AND COUNCIL RESOLUTIONS
None
7. COMPLIANCE WITH MUNICIPAL STANDARD CHART OF ACCOUNTS (mSCOA)
The primary objective of the mSCOA regulation is to achieve uniformity across all local governments (municipalities and municipal entities). All municipalities are expected to transact in line with the seven mSCOA segments from 1 July 2017.
The City was not mSCOA-ready by 1 July 2017, due to challenges and delays
encountered during the project, which included the following:
System landscape optimisation and a functional solution to enable the effective
migration of the City’s data.
Completion of all test cycles, including mock migrations.
Completion of end user training.
Infrastructure readiness and disaster recovery. Significant progress has been
made, as procurement of the required infrastructure is complete and commissioning is in progress.
Completion of migration or de-establishment of all entities.
Completion of non-SAP systems integration and rationalisation.
However, the City is still required to submit financial information to the National Treasury in terms of the seven mSCOA segments, and the project team is developing
a reporting solution that is currently being tested. Monthly mSCOA data strings were submitted to the National Treasury.
8. CONCLUSION
This report meets the MFMA requirement for the Executive Mayor to receive a Section 71 “monthly budget statement” within ten working days after the end of the month and compliance with MFMA Section 52(d), 71 and 72.
Mid-term budget, performance and assessment report
In terms of Section 72 of the MFMA the accounting officer of a municipality must by 25 January of each year assess the performance of the municipality during the first
half of the financial year and as part of the review;
(a) make recommendations as to whether an adjustments budget is necessary; and (b) recommend revised projections for revenue and expenditure to the extent that this may be necessary.
Taking into account the mid-term performance as discussed above the adjustment
budget is necessary mainly to –
address the impending shortfall on the services charges revenue;
address possible overspending in certain line items;

5
appropriate rollover grants that were approved during the financial year;
appropriate additional grant funding that has been received; and
adjust expenditure in line with anticipated revenue to be realised.
ANNEXURE
Annexure A: In-year report in terms of GG 32141 of 17 April 2009
RECOMMENDED: That it be recommended to the Mayoral Committee:
1. That the content of the report and attached Annexure A be noted.
2. That the report be noted in compliance with Section 52(d) and 71 of the MFMA and
Municipal Budget and Reporting Regulations.
3. That, in compliance with Section 72 of the MFMA, the mid-term budget, performance
and assessment report be noted.
4. That the impending shortfall on revenue, as highlighted in the report, be addressed
in terms of Section 70(1) (a) and (b) of the MFMA.
5. That this statement be submitted to the National Treasury and the Provincial Treasury, in both signed-document and electronic format.
6. That, based on the mid-term performance, an adjustments budget for the 2017/18 financial year is necessary and must be tabled at Council in February 2018.

6
REPORT – FLOW COMPLIANCE CHECK FILE: F1/5/2
INITIATOR: Umar Banda (012 358 8110) GROUP FINANCIAL SERVICES MUNICIPAL FINANCE MANAGEMENT ACT (MFMA): IN-YEAR FINANCIAL REPORT FOR THE PERIOD ENDING
31 DECEMBER 2017. REPORT CHECKED AND PASSED FOR SUBMISSION TO:
Comments, if any, on the report
Divisional Head: Budget Office NM Mokete
SIGNATURE: ………………………………………......
DATE: …………………………………………………...
Acting Divisional Head: Financial Reporting and Assets E Richards
SIGNATURE: ………………………………………......
DATE: …………………………………………………...
Divisional Head: Treasury Office
KC Thipe
SIGNATURE: ………………………………………...... DATE: …………………………………………………...
Divisional Head: Revenue Management D Pillay
SIGNATURE: ……………………………………….......
DATE: ………………………………….………………...
Head of the Department: Chief Financial Officer U Banda
SIGNATURE: …………………………………………...
DATE: ……………………………………….……………
MMC: Finance Mare-Lise Fourie
SIGNATURE: …………………………………………... DATE: ....………………………………………………...
7
ANNEXURE A
IN-YEAR REPORT
BUDGET YEAR: 2017/18
REPORTING PERIOD: M06 DECEMBER 2017

8
Table of contents
PART 1: IN-YEAR REPORT............................................................................................................9
1.1 Mayor’s report ...............................................................................................................9 1.2 Recommendations .......................................................................................................9 1.3 Executive summary......................................................................................................9
1.4 In-year budget statement tables ............................................................................. 19 (a) Table C1: Consolidated monthly budget statement – summary....................... 20
(b) Table C2: Consolidated monthly budget statement – financial performance (standard classification)........................................................................................... 21
(c) Table C3: Consolidated monthly budget statement – financial performance
(revenue and expenditure by municipal vote)...................................................... 22 (d) Table C4: Consolidated monthly budget statement – financial performance
(revenue and expenditure)...................................................................................... 23 (e) Table C5: Consolidated monthly budget statement – capital expenditure by
vote, standard classification and funding ............................................................. 24
(f) Table C6: Consolidated monthly budget statement – financial position.......... 25 (g) Table C7: Consolidated monthly budget statement – cash flow....................... 26
PART 2: SUPPORTING DOCUMENTATION............................................................................ 27
(a) Table SC1: Material variance explanations ......................................................... 27
(b) Table SC2: Monthly budget statement – performance indicators .................... 29 (c) Table SC3: Monthly budget statement – aged debtors...................................... 30
(d) Table SC4: Monthly budget statement – aged creditors.................................... 30 (e) Table SC5: Monthly budget statement – investment portfolio .......................... 31 (f) Table SC6: Monthly budget statement – transfers and grant receipts ............ 32
(g) Table SC7(1): Monthly budget statement – transfers and grant expenditures33 (h) Table SC7(2): Monthly budget statement – expenditure against approved
rollovers...................................................................................................................... 34 (i) Table SC8: Monthly budget statement – councillor and staff benefits ............ 35 (j) Table SC9: Monthly budget statement – actual and revised targets for cash
receipts....................................................................................................................... 36 (k) Table SC10: Monthly budget statement – parent municipality’s financial
performance (revenue and expenditure) .............................................................. 37
(l) Table SC11: Monthly budget statement – summary of municipal entities ...... 38 (m) Table SC12: Consolidated monthly budget statement – capital expenditure
trend............................................................................................................................ 38 (n) Table SC13a: Consolidated monthly budget statement – capital expenditure
on new assets by asset class ................................................................................. 39
(o) Table SC13b: Consolidated monthly budget statement – capital expenditure on renewal of existing assets by asset class ....................................................... 40
(p) Table SC13c: Consolidated monthly budget statement – capital expenditure on repairs and maintenance by asset class ......................................................... 41
(q) Table SC13d: Consolidated monthly budget statement – depreciation by asset
class............................................................................................................................ 42 (r) Table SC13e: Monthly budget statement – capital expenditure on upgrading of
existing assets by asset class ................................................................................ 43 (s) Municipal Manager’s quality certification .............................................................. 44

9
PART 1: IN-YEAR REPORT 1.1 Mayor’s report
On 25 May 2017, Council approved the Medium-term Revenue and Expenditure Framework (MTREF) for the 2017/18 financial year. This gives effect to the City of
Tshwane’s Service Delivery Implementation Plan, including the two municipal entities.
The City of Tshwane aims to act in accordance with the principles of good governance, transparency and stewardship of public resources.
1.2 Recommendations
That it be recommended to the Mayoral Committee:
1. That the contents of the report and attached Annexure A be noted. 2. That the report be noted in compliance with Section 52(d) and 71 of the MFMA and
Municipal Budget and Reporting Regulations.
3. That, in compliance with Section 72 of the MFMA, the mid-term budget and performance and assessment report be noted.
4. That the impending shortfall on revenue, as highlighted in the report, be addressed in terms of Section 70(1) (a) and (b) of the MFMA.
5. That this statement be submitted to the National Treasury and the Provincial Treasury, in both signed-document and electronic format.
6. That, based on the mid-term performance, an adjustments budget for the 2017/18
financial year is necessary and must be tabled at Council in February 2018.
1.3 Executive summary
The financial results of the City of Tshwane for the period ended 31 December 2017
are summarised as follows: Consolidated monthly budget statement – summary
The summary of the consolidated monthly budget statement as reflected in Table C4
indicates the following information:
Revenue by source
Expenditure by type
Transfers recognised
The table provides information related to the unaudited outcome, original budget and
the performance for the period under review, YTD variance and YTD variance percentage. The total revenue excludes capital transfers and contributions. The reasons for variances for all votes are captured in Table SC1 of this report.

10
Table C4: Consolidated monthly budget statement – Financial performance (revenue and expenditure)
The YTD actual revenue amounts to R14,9 billion and reflects an unfavourable
variance of R939 million against the YTD budget of R15,9 billion. The YTD variance on revenue is mainly due to the following items:
Property rates (R151 million favourable) – due to an increased number of
properties billed.
Service charges: Electricity revenue (R34,7 million unfavourable) – due to
under-recovery mainly on smart prepaid electricity. Technical audits on all meters are currently being conducted and all notifications and placements of meters attended to.
2016/17
Audited
Outcome
Original
Budget
Monthly
actual
YearTD
actual
YearTD
budget
YTD
variance
YTD
variance
Full Year
Forecast
R thousands %
Revenue By Source
Property rates 5 912 584 6 514 409 571 772 3 273 840 3 123 179 150 661 5% 6 514 409
Serv ice charges - electricity rev enue 10 800 091 11 176 494 810 829 5 753 343 5 788 049 (34 706) -1% 11 176 494
Serv ice charges - w ater rev enue 3 189 550 3 996 886 128 956 1 673 314 2 042 341 (369 028) -18% 3 996 886
Serv ice charges - sanitation rev enue 1 032 486 982 879 75 280 485 169 500 216 (15 047) -3% 982 879
Serv ice charges - refuse rev enue 1 065 583 1 410 506 139 876 670 738 701 053 (30 315) -4% 1 410 506
Rental of facilities and equipment 140 955 151 864 9 877 57 048 80 557 (23 509) -29% 156 496
Interest earned - ex ternal inv estments 105 994 79 493 6 750 78 484 39 839 38 646 97% 79 493
Interest earned - outstanding debtors 623 114 466 691 52 107 311 339 236 400 74 939 32% 466 691
Fines, penalties and forfeits 204 354 332 854 24 081 89 375 166 624 (77 249) -46% 332 854
Licences and permits 145 529 54 796 13 476 66 367 71 391 (5 025) -7% 54 796
Agency serv ices – 6 650 – – – – 6 650
Transfers and subsidies 3 761 456 4 159 532 544 935 2 161 104 2 750 548 (589 444) -21% 4 159 532
Other rev enue 970 173 887 079 41 982 355 033 411 356 (56 323) -14% 882 432
Gains on disposal of PPE 3 571 5 880 – 0 2 940 (2 940) -100% 5 880
Total Revenue (excluding capital transfers and
contributions)
27 955 440 30 226 013 2 419 922 14 975 154 15 914 494 (939 340) -6% 30 225 997
Expenditure By Type
Employ ee related costs 8 016 904 8 778 736 686 472 4 142 077 4 531 767 (389 690) -9% 8 778 772
Remuneration of councillors 120 365 125 281 10 511 60 604 66 643 (6 039) -9% 125 281
Debt impairment 780 739 1 175 973 – 493 289 591 155 (97 866) -17% 1 175 973
Depreciation & asset impairment 1 624 536 1 961 302 138 709 732 140 988 483 (256 343) -26% 1 961 302
Finance charges 1 319 814 1 417 357 334 833 1 006 687 757 207 249 480 33% 1 417 357
Bulk purchases 7 466 982 7 462 684 540 059 4 316 363 4 577 537 (261 174) -6% 7 742 137
Other materials 2 170 290 3 261 702 223 227 1 299 328 1 439 867 (140 538) -10% 2 864 644
Contracted serv ices 2 604 332 2 874 971 289 845 1 298 812 2 061 379 (762 567) -37% 2 608 881
Transfers and subsidies 423 719 49 980 2 026 48 590 66 681 (18 091) -27% 50 707
Other ex penditure 2 862 350 2 886 842 207 052 1 315 494 1 706 782 (391 288) -23% 3 269 776
Loss on disposal of PPE 1 224 1 – – 1 (1) -100% 1
Total Expenditure 27 391 255 29 994 829 2 432 734 14 713 384 16 787 501 (2 074 117) -12% 29 994 829
Surplus/(Deficit) 564 184 231 184 (12 812) 261 769 (873 007) 1 134 777 (0) 231 168 Transfers and subsidies - capital (monetary allocations)
(National / Prov incial and District) 2 407 713 2 443 910 302 434 794 939 1 160 308 (365 369) (0) 2 443 910 Transfers and subsidies - capital (monetary allocations)
(National / Prov incial Departmental Agencies,
Households, Non-profit Institutions, Priv ate Enterprises,
Public Corporatons, Higher Educational Institutions) – 6 000 – – – – 6 000
Transfers and subsidies - capital (in-kind - all) 54 397 32 816 – 13 855 16 408 (2 553) (0) 32 816
Surplus/(Deficit) after capital transfers &
contributions
3 026 294 2 713 910 289 623 1 070 563 303 708 2 713 894
Tax ation – 500 214 – – – 500
Surplus/(Deficit) after taxation 3 026 294 2 713 410 289 409 1 070 563 303 708 2 713 394
Attributable to minorities – – – – – –
Surplus/(Deficit) attributable to municipality 3 026 294 2 713 410 289 409 1 070 563 303 708 2 713 394
Surplus/ (Deficit) for the year 3 026 294 2 713 410 289 409 1 070 563 303 708 2 713 394
Description
Budget Year 2017/18
TSH City Of Tshwane - Table C4 Monthly Budget Statement - Financial Performance (revenue and expenditure) - M06 December

11
Service charges: Water (R369 million unfavourable) and sanitation
(R15 million unfavourable) – due to a decline in usage. The budget for water and sewerage is based on statistical trends.
Service charges: Refuse (R30 million unfavourable) – mainly on bulk
containers and landfill sites. The income from billing landfill sites for December is not reflecting yet. The impact of weighbridges at four landfill sites and billing
of waste contractors are still being evaluated, and information on billing documents are being corrected and processed.
Rental of facilities and equipment (R23,5 million unfavourable) – mainly due to
under-recovery on the rental of housing accommodation, facilities and commercial properties. Expired lease agreements are in the process of being
advertised and renewed.
Interest earned on external investments (R38,6 million favourable) – interest
earned on the bank account and investments were better than projected.
Interest earned on outstanding debtors (R75 million favourable) – as a result of an increase in outstanding debtors.
Fines and penalties (R77 million unfavourable) – mainly due to outstanding income from AARTO traffic fines. There is a delay in capturing transactions, as
data is only available after the closing of each month. A recovery plan prepared by NT consultants submitted in the Adjustment Budget will alleviate the under-
recovery.
Licences and permits (R5 million unfavourable) – mainly due to a decline in applications on driver’s licences.
Transfers and subsidies (R589 million unfavourable) – mainly due to the outstanding transfer of the equitable share.
Other revenue (R56 million unfavourable) – due to under-recovery on the following line items:
Reminder fees are under-recovered by R10,8 million. The service is
dependent on reminders issued on arrear accounts; the revenue for the
period was less than projected. Building plan fees are under-recovered by R6,5 million. The building plan
applications revenue is market-driven and seasonal. Sundry fees are under-recovered by R15,6 million. The revenue includes
and amount of R28,6 million allocated to Sandspruit Water Works
Association (SWA). This income was then allocated the charges for drain cleaning/opening of sewerage blockages in the MAWIGA (Mabopane,
Winterveld and Ga-Rankuwa) area to sundry fees. This budget should move to Region 1 during the adjusted budget.
Approval fees: Advertisement signs are under-recovered by R10 million.
The income is dependent on fees collected from agencies for advertising campaigns.
Market fees are under-recovered by R17 million due to the delays in processing. Monthly collections are journalised at the beginning of the following month.
Admission fees are under-recovered by R4,8 million. Admission fees are seasonal and the December revenue is still outstanding; to reflect in the next reporting month.
Transport fees are under-recovered by R11,8 million. Tshwane Bus Services’ planned shifts have been reduced from 230 to 165 due to
shortage of resources, including bus drivers.
12
Township development contributions on electricity are under-recovered by
R7,4 million. The service contributions are payable to the City of Tshwane
by developers in terms of the Services Contribution Policy, and are based on applications received from developers for this service.
Township development contributions for rezoning is under-recovered by R22 million. Development and land use rights application submissions are market-driven and seasonal.
VAT corrections direct income is over recovered by R49 million. The inputs for VAT recovery was more than the provision.
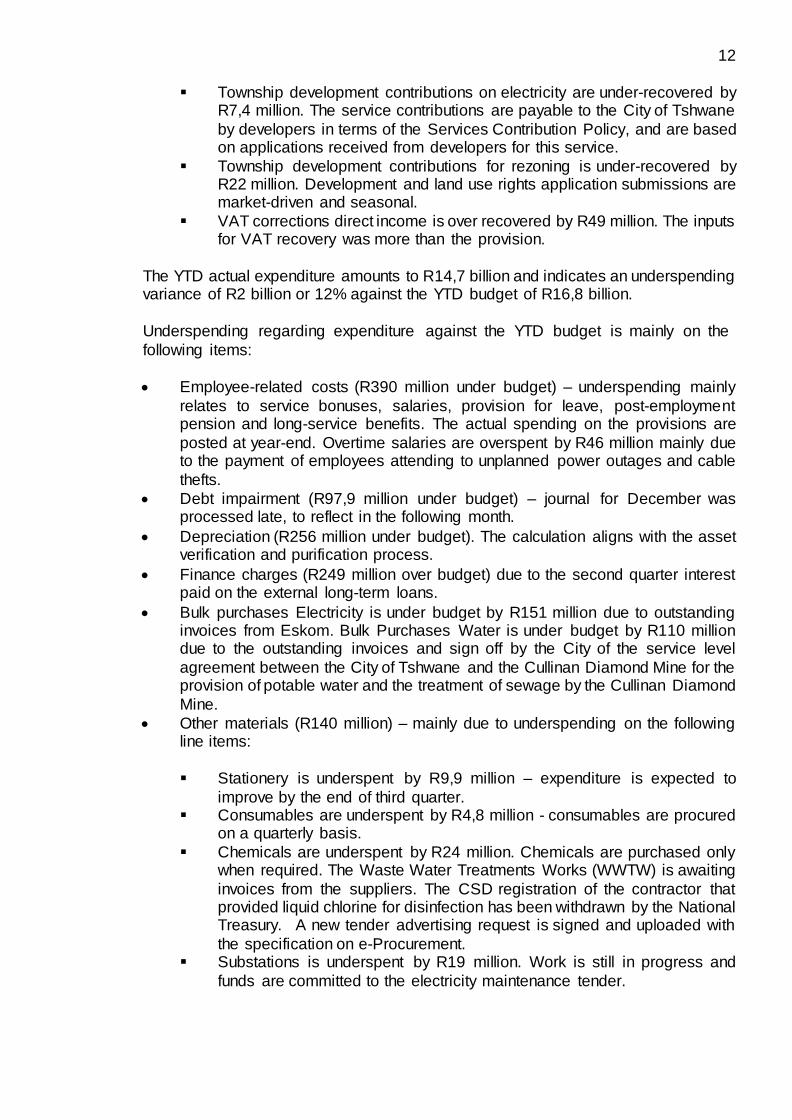
The YTD actual expenditure amounts to R14,7 billion and indicates an underspending variance of R2 billion or 12% against the YTD budget of R16,8 billion.
Underspending regarding expenditure against the YTD budget is mainly on the
following items:
Employee-related costs (R390 million under budget) – underspending mainly
relates to service bonuses, salaries, provision for leave, post-employment pension and long-service benefits. The actual spending on the provisions are
posted at year-end. Overtime salaries are overspent by R46 million mainly due to the payment of employees attending to unplanned power outages and cable
thefts.
Debt impairment (R97,9 million under budget) – journal for December was processed late, to reflect in the following month.
Depreciation (R256 million under budget). The calculation aligns with the asset verification and purification process.
Finance charges (R249 million over budget) due to the second quarter interest paid on the external long-term loans.
Bulk purchases Electricity is under budget by R151 million due to outstanding invoices from Eskom. Bulk Purchases Water is under budget by R110 million due to the outstanding invoices and sign off by the City of the service level
agreement between the City of Tshwane and the Cullinan Diamond Mine for the provision of potable water and the treatment of sewage by the Cullinan Diamond
Mine.
Other materials (R140 million) – mainly due to underspending on the following line items:
Stationery is underspent by R9,9 million – expenditure is expected to
improve by the end of third quarter. Consumables are underspent by R4,8 million - consumables are procured
on a quarterly basis.
Chemicals are underspent by R24 million. Chemicals are purchased only when required. The Waste Water Treatments Works (WWTW) is awaiting
invoices from the suppliers. The CSD registration of the contractor that provided liquid chlorine for disinfection has been withdrawn by the National Treasury. A new tender advertising request is signed and uploaded with
the specification on e-Procurement. Substations is underspent by R19 million. Work is still in progress and
funds are committed to the electricity maintenance tender.

13
Contracted services (R763 million under) – mainly on the following line items:
Formalisation of informal settlements is underspent by R11 million.
Contracts have expired and new contracts were approved in November 2017.
DBSA Feasibility Study is underspent by R31 million. The tender for the feasibility study is in process, and expenditure is expected in the third quarter of the financial year.
Re Aga Tshwane projects are underspent by R29,7 million. Contracts have expired and new contracts were approved in November 2017.
Project Linked Housing is overspent by R18,2 million due to payment made on housing top structures at Zithobeni and Mamelodi.
Consultants fees are underspent by R21 million; consultants are utilised
as and when required. Municipal services: Other providers is underspent by R31 million due to
outstanding invoices from Eskom. All waste water treatment works and water reservoirs are utilising electricity to function in the areas supplied by Eskom, eg Ekangala, Klipgat, Themba and Babelegi Waste Water
Treatment Works. Connections are underspent by R44 million. Installations and maintenance
on water meter connections are done only when required. Water meters must be ordered on time to cater for the number of meter replacements and new connections that will be done; reservations for those meters were
made from the stores. Electricity reticulation is underspent by R80 million. Work is still in progress
and expenditure is expected to increase towards the end of the third quarter.
Buildings are underspent by R44 million. Underspending emanating from
Tshepo 10 000 contracts not being utilised anymore. There are no active tenders on building maintenance; currently relying on panel appointments by the Group Property Management Department.
Grounds are underspent by R63 million. Expenditure is expected to be incurred towards the rainy season as the grass cutting cycle increases.
Water reticulation network is underspent by R54 million. Work is still in progress and expenditure will increase in the third quarter of the financial year.
Roads is underspent by R46 million. The tender for roads rehabilitation closed and no contractor has been appointed yet.
Storm water systems is underspent by R13,8 million. Work is still in progress and expenditure will increase in the third quarter of the financial year.
Lights are underspent by R20 million. Work is still in progress and expenditure will increase in the third quarter of the financial year.
Waste Water Purification Works (WWPW) is underspent by R38 million. Current maintenance contracts have expired. Awaiting tenders to be adjudicated for the repair and maintenance of WWPW plants.
Traffic control is underspent by R26 million due to the unavailability of road signs at the stores. The current tender was cancelled by BAC in August
2017 and a new tender process had to be initiated.

14
Transfers and grants (R18 million under) – due to underspending on the
payment of municipal entities and for the early childhood development NGO support.
Other expenditure (R391 million under) – due to underspending, mainly on the following line items:
Rental of Plant and Equipment (R15 million underspent). Work is still in
progress and expenditure will increase in the third quarter of the financial
year. Telecommunication (R45 million underspent) due to the non-alignment of
expenditure to projection. Expenditure for the period has been paid. Internet fees (R14 million underspent) due to incorrect projections. The
services are fixed contractual services.
EPWP job creation is underspent by R32 million due to delays in updating the EPWP database. The process has been finalised, a new group has
been appointed and expenditure will increase in the third quarter. LED initiatives are underspent by R21 million due to the delay in signing
off the partnership renewal agreements with the Automotive Industry
Development Centre (AIDC), the Small Enterprise Development Agency (SEDA) and the Tourism Grading Council of South Africa (TGCSA), and
the delay in the signing of a lease renewal with the North West Development Corporation for the Ga-Rankuwa Eco-furniture Project.
Insurance premiums and insurance premiums and excesses is overspent
by R29 million due to the payment of annual insurance premiums, which are paid in the first quarter of the financial year, including a number of
outstanding claims which escalated to this financial year. Management information system (R27 million underspent). The services
are fixed contractual services which are paid monthly. Projections were
not aligning to actual payments. Implementation of OITPS (R46 million). The payment is mainly for SAP
support services; awaiting invoices from the service provider. Wi-Fi is underspent by R28 million. There is no vehicle for the
implementation, currently maintaining the existing Wi-Fi. Awaiting approval
and award of tender to be finalised. Protective clothing is underspent by R17,5 million. Funds have been
committed, awaiting availability of stock from the stores.
The reasons for variances for all sources or types of groups are captured in Table
SC1 of this report.
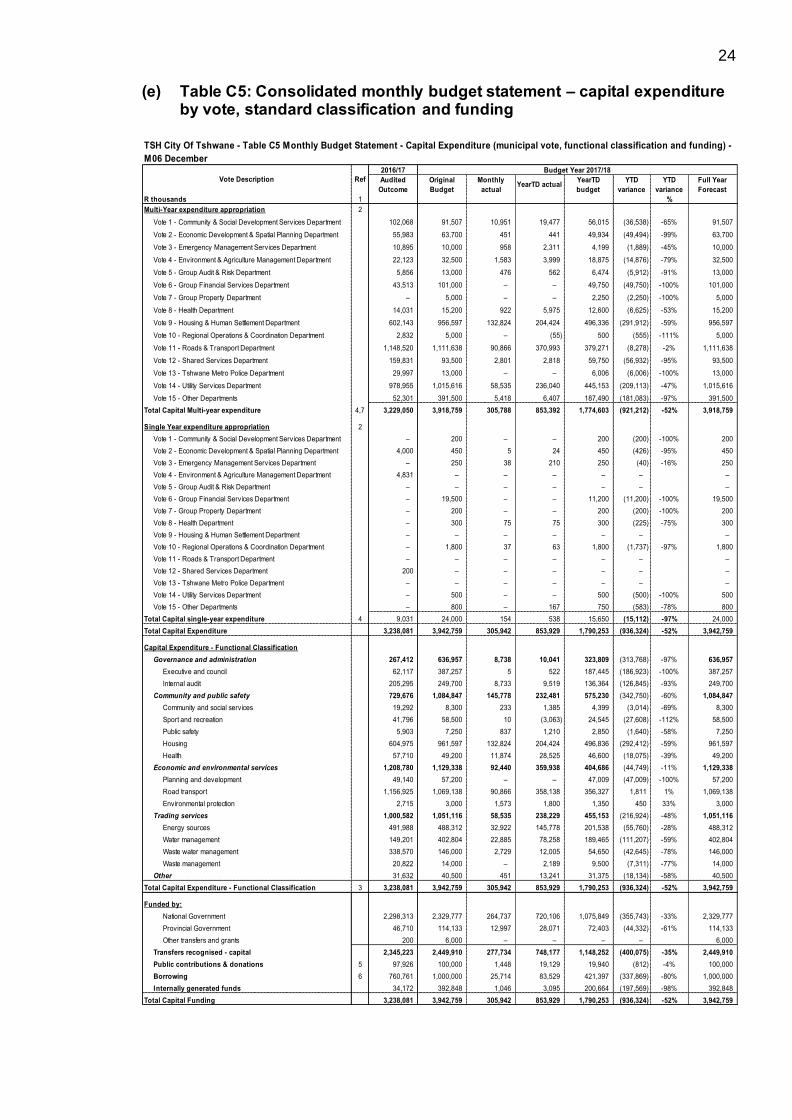
Summary of capital expenditure The capital expenditure report shown in Table C1 and C5 of this report has been
prepared based on the format required to be lodged electronically with the National Treasury, and it is categorised by municipal vote, capital expenditure by standard
classification and the funding sources required to fund the capital budget.
15
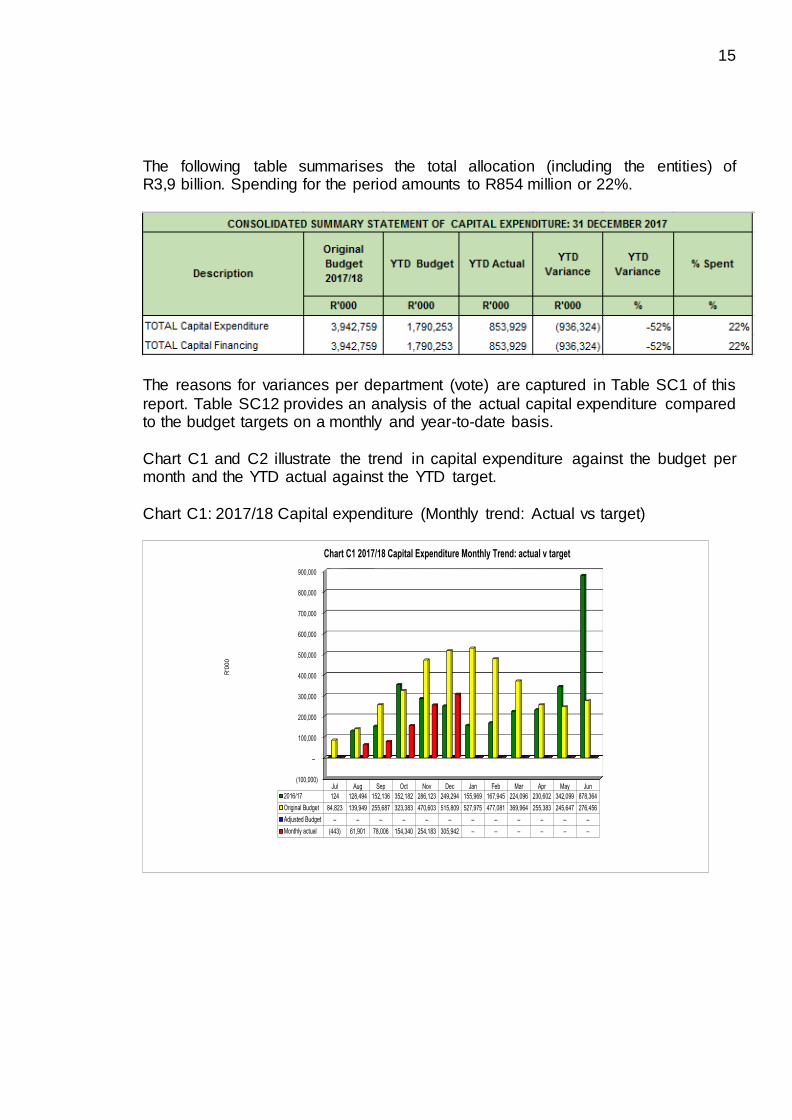
The following table summarises the total allocation (including the entities) of R3,9 billion. Spending for the period amounts to R854 million or 22%.
The reasons for variances per department (vote) are captured in Table SC1 of this
report. Table SC12 provides an analysis of the actual capital expenditure compared to the budget targets on a monthly and year-to-date basis.
Chart C1 and C2 illustrate the trend in capital expenditure against the budget per month and the YTD actual against the YTD target.
Chart C1: 2017/18 Capital expenditure (Monthly trend: Actual vs target)
(100,000)
–
100,000
200,000
300,000
400,000
500,000
600,000
700,000
800,000
900,000
Jul Aug Sep Oct Nov Dec Jan Feb Mar Apr May Jun
2016/17 124 128,494 152,136 352,182 286,123 249,294 155,969 167,945 224,096 230,602 342,099 878,364
Original Budget 84,823 139,949 255,687 323,383 470,603 515,809 527,975 477,081 369,964 255,383 245,647 276,456
Adjusted Budget – – – – – – – – – – – –
Monthly actual (443) 61,901 78,006 154,340 254,183 305,942 – – – – – –
R'0
00
Chart C1 2017/18 Capital Expenditure Monthly Trend: actual v target

16
Chart C2: 2017/18 Capital expenditure (YTD actual vs YTD target)
Capital expenditure by asset class on new assets and on the renewal of existing
assets is contained in Table SC13a and SC13b. The expenditure on repairs and maintenance by asset class and the depreciation by
asset class are detailed in Table SC13c and SC13d.
Financial position The financial position, as indicated in Table C1, shows that community wealth/equity
of the City of Tshwane, as at 31 December 2017, amounts to R23,3 billion against a budget of R25 million. Details related to the assets and
liabilities of the City of Tshwane are provided in Table C6, in a format which is consistent with international standards and aligned with GRAP 1.
Cash flow
The cash flow of the City of Tshwane, as depicted in Table C1 and C7 and detailed in Table SC9, indicates the following:
The closing balance of the cash and cash equivalents as at the end of December 2017 amounts to R2 billion (this amount includes the sinking fund).
The cash flow from operating activities is R299 million, compared to the target of R647 million. Due to lower expenditure in the second quarter.
The cash flow from investing activities amounts to R694 million, compared to a target of R2 billion. Due to lower spending on capital.
The cash flow from financing activities amounts to R151 million, compared to
the target of R124 million.
(500,000)
–
500,000
1,000,000
1,500,000
2,000,000
2,500,000
3,000,000
3,500,000
4,000,000
Jul Aug Sep Oct Nov Dec Jan Feb Mar Apr May Jun
YearTD actual (443) 61,458 139,464 293,804 547,987 853,929 – – – – – –
YearTD budget 84,823 224,772 480,459 803,842 1,274,4 1,790,2 2,318,2 2,795,3 3,165,2 3,420,6 3,666,3 3,942,7
R'0
00
Chart C2 2017/18 Capital Expenditure: YTD actual v YTD target

17
Debtors’ age analysis
The debtors’ report, as reflected in Table C1 and SC3, has been prepared based on the format required to be lodged electronically with the National Treasury. This format
provides an extended age analysis, as well as an age analysis by debtor type. It also compares this month’s results with the same period of the previous financial year.
Table C1 and SC3 indicate that the total debtors amount to R10,8 billion.
Chart C3 illustrates the aged consumer debtors and reflects a collection problem pertaining to debtors in the “over one-year” category.
An amount of R5 billion is outstanding in this category compared to R4,7 billion outstanding in the 2016/17 financial year.
Chart C3: Aged consumer debtors’ analysis
Chart C4 shows that the increase in the customer category is attributable to households, which reflect an increase of R216 million compared to the previous
financial year. Chart C4: Consumer debtors by customer category
–
1,000,000
2,000,000
3,000,000
4,000,000
5,000,000
6,000,000
0-30Days
31-60Days
61-90Days
91-120Days
121-150Dys
151-180Dys
181 Dys-1 Yr
Over 1Yr
Budget Year 2017/18 1,812,841 305,437 245,874 286,207 304,205 540,176 2,322,005 5,012,169
2016/17 1,395,781 211,946 228,848 235,202 260,298 384,206 987,413 4,682,000
R'0
00
Chart C3 Aged Consumer Debtors Analysis
–
1,000,000
2,000,000
3,000,000
4,000,000
5,000,000
6,000,000
7,000,000
8,000,000
Organs of State Commercial Households Other
2016/17 134,777 2,054,893 6,994,777 1,319,599
Budget Year 2017/18 138,945 2,118,446 7,211,110 1,360,411
R'00
0
Chart C4 Consumer Debtors (total by Debtor Customer Category)

18
Creditors’ age analysis
The creditors’ report, as well as Table C1 and SC4, provides an extended age analysis by creditor type. The summary report indicates that there are no long-term
outstanding creditors. The chart compares this month’s results with the previous financial year's, which
shows the aged creditors per category.
Chart C5: Aged creditors’ analysis
Investment portfolio analysis (Table SC5)
The investment portfolio analysis, shown in Table SC5, includes information
consistent with the requirements of the Municipal Investment Regulations of 2005 issued by the National Treasury. It reflects the institution where funds are invested, the period of investment, the type of investment and the accrued interest for the
month. The market value at the end of the month amounts to R1,8 billion.
Allocation of grant receipts and expenditure (Table SC6 and SC7) The disclosure on transfers and grant receipts, for both operating and capital
expenditure, is reflected in Table SC6. The receipts from national, provincial and other grant providers are also indicated.
The total grants allocated, including entities, amounts to R6,6 billion and an amount of R3,5 billion has been received for the period.
Table SC7 (1) indicates the expenditure incurred against each allocation for the reporting period. The disclosure on the transfer and grant expenditure table reflects
the recognition of expenditures amounting to R3 billion against the YTD budget of R3,8 billion.
(500,000)
–
500,000
1,000,000
1,500,000
2,000,000
2,500,000
3,000,000
BulkElectricity
Bulk Water PAYEdeductions
VAT(output less
input)
Pensions /Retirementdeductions
Loanrepayment
s
TradeCreditors
AuditorGeneral
Other
2016/17 611,629 175,765 90,988 (88,240) 104,254 1,326,150 983,528 4,687 527,864
Budget Year 2017/18 615,735 347,960 112,006 (60,588) 112,055 150,379 950,949 – 2,567,520
R'0
00
Chart C5 Aged Creditors Analysis

19
Expenditure on councillor and staff benefits (Table SC8)
The disclosure on councillors, board members and employee benefits is captured in Table SC8 and provides a comparison of actual expenditure and budgeted
expenditure. Parent municipality’s financial performance (Table SC10)
This disclosure is required by the National Treasury. Municipalities that have
municipal entities should provide the monthly statement of financial performance for the parent municipality only.
Summary of municipal entities (Table SC11)
The City of Tshwane has two municipal entities as indicated in Table SC11:
Housing Company Tshwane (HCT)
Tshwane Economic Development Agency (TEDA)
This table summarises the revenue, operating expenditure and capital expenditure for these entities. The reasons for the variance have been captured in Table SC1.
Performance indicators (Table SC2)
This table reflects various ratios, such as –
borrowing management;
liquidity;
revenue management; and
creditor management.
1.4 In-year budget statement tables
The financial results for the period ended 31 December 2017 are reflected in Table C1 to C7, and they are followed by the supporting documents contained in Table SC1 to SC13d.

20
(a) Table C1: Consolidated monthly budget statement – summary

21
(b) Table C2: Consolidated monthly budget statement – financial
performance (standard classification)
Note: The variance in total revenue in Table C1 differs from that in Table C2 because in Table C1
the item “Capital transfers” is excluded, whereas in Table C2 it has been included.
2016/17 Budget Year 2017/18
Audited
Outcome
Original
Budget
Monthly
actualYearTD actual
YearTD
budgetYTD variance
YTD
variance
Full Year
Forecast
R thousands 1 %
Revenue - Functional
Governance and administration 9,947,303 10,717,815 1,100,576 5,509,309 5,806,445 (297,136) -5% 10,717,815
Executive and council 77,703 75,280 950 3,101 22,749 (19,648) -86% 75,280
Finance and administration 9,817,881 10,600,371 1,099,524 5,489,417 5,762,614 (273,196) -5% 10,600,371
Internal audit 51,719 42,165 102 16,791 21,082 (4,291) -20% 42,165
Community and public safety 1,295,311 1,512,235 240,985 557,481 818,354 (260,873) -32% 1,512,235
Community and social services 54,748 15,430 913 8,878 8,380 498 6% 15,430
Sport and recreation 44,250 23,910 1,078 8,227 13,309 (5,082) -38% 23,910
Public safety 222,391 334,136 23,655 89,454 167,068 (77,615) -46% 334,136
Housing 800,705 968,680 188,564 339,237 498,691 (159,454) -32% 968,680
Health 173,217 170,078 26,774 111,685 130,906 (19,221) -15% 170,078
Economic and environmental services 1,665,352 1,600,352 122,747 635,680 748,258 (112,577) -15% 1,600,336
Planning and development 200,999 186,248 11,871 86,840 127,372 (40,531) -32% 186,248
Road transport 1,451,583 1,319,389 110,853 548,534 558,094 (9,561) -2% 1,319,373
Environmental protection 12,770 94,715 24 306 62,792 (62,486) -100% 94,715
Trading services 17,287,457 18,650,592 1,234,972 8,969,221 9,589,317 (620,096) -6% 18,650,592
Energy sources 11,438,329 11,730,582 859,258 5,777,624 6,021,041 (243,417) -4% 11,730,582
Water management 3,492,422 4,100,522 154,992 2,006,155 2,130,843 (124,688) -6% 4,100,522
Waste water management 1,055,838 1,362,903 80,747 514,000 709,714 (195,714) -28% 1,362,903
Waste management 1,300,869 1,456,585 139,976 671,442 727,719 (56,278) -8% 1,456,585
Other 4 222,126 227,746 23,076 112,256 128,836 (16,580) -13% 227,746
Total Revenue - Functional 2 30,417,549 32,708,740 2,722,356 15,783,947 17,091,210 (1,307,262) -8% 32,708,723
Expenditure - Functional
Governance and administration 5,144,326 7,288,308 692,828 3,455,417 3,856,635 (401,218) -10% 7,277,357
Executive and council 885,197 1,230,769 69,981 461,454 550,210 (88,756) -16% 989,924
Finance and administration 3,911,209 5,755,519 618,859 2,848,761 3,153,462 (304,701) -10% 5,985,414
Internal audit 347,920 302,020 3,988 145,202 152,964 (7,762) -5% 302,020
Community and public safety 4,227,024 3,936,721 376,950 2,039,230 2,273,743 (234,514) -10% 4,011,943
Community and social services 307,037 269,256 37,010 155,036 202,601 (47,565) -23% 344,479
Sport and recreation 407,303 374,267 29,725 165,573 239,116 (73,543) -31% 374,267
Public safety 2,352,619 2,219,047 207,069 1,185,108 1,230,375 (45,267) -4% 2,219,047
Housing 566,472 466,664 57,766 251,524 271,253 (19,729) -7% 466,664
Health 593,593 607,488 45,379 281,989 330,398 (48,409) -15% 607,488
Economic and environmental services 2,745,385 3,210,120 244,218 1,413,605 1,780,785 (367,180) -21% 3,150,293
Planning and development 801,431 1,034,346 73,615 435,449 553,536 (118,087) -21% 974,519
Road transport 1,817,941 1,911,711 160,297 917,221 1,090,023 (172,801) -16% 1,911,711
Environmental protection 126,013 264,063 10,306 60,934 137,226 (76,292) -56% 264,063
Trading services 15,085,276 15,388,317 1,109,722 7,735,467 8,789,878 (1,054,412) -12% 15,388,317
Energy sources 10,494,835 10,073,638 712,322 5,457,950 5,920,871 (462,921) -8% 10,073,638
Water management 2,852,986 3,128,834 256,866 1,504,416 1,689,169 (184,753) -11% 3,128,834
Waste water management 445,639 1,107,046 60,421 300,475 609,130 (308,654) -51% 1,107,046
Waste management 1,291,816 1,078,799 80,113 472,625 570,709 (98,083) -17% 1,078,799
Other 189,245 171,863 9,230 69,666 86,460 (16,794) -19% 167,418
Total Expenditure - Functional 3 27,391,255 29,995,329 2,432,947 14,713,384 16,787,501 (2,074,117) -12% 29,995,329
Surplus/ (Deficit) for the year 3,026,294 2,713,410 289,409 1,070,563 303,708 766,855 252% 2,713,394
RefDescription
TSH City Of Tshwane - Table C2 Monthly Budget Statement - Financial Performance (functional classification) - M06 December
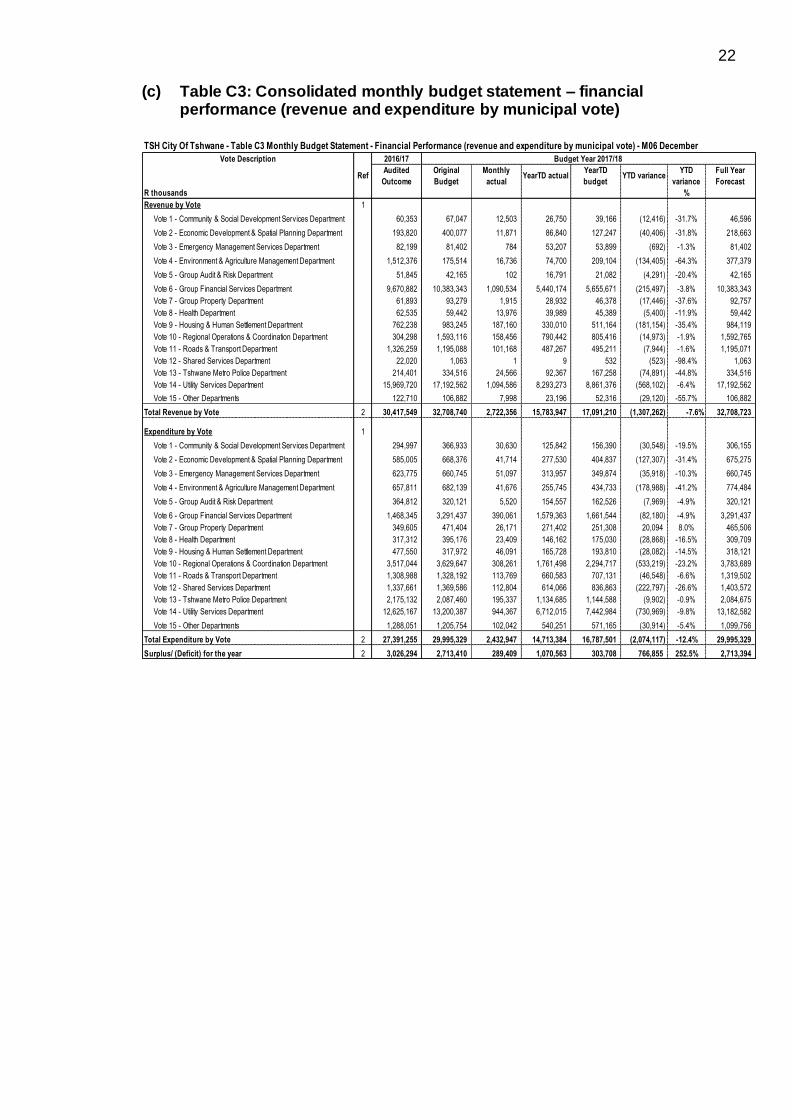
22
(c) Table C3: Consolidated monthly budget statement – financial
performance (revenue and expenditure by municipal vote)
Vote Description 2016/17
Audited
Outcome
Original
Budget
Monthly
actualYearTD actual
YearTD
budgetYTD variance
YTD
variance
Full Year
Forecast
R thousands %
Revenue by Vote 1
Vote 1 - Community & Social Development Services Department 60,353 67,047 12,503 26,750 39,166 (12,416) -31.7% 46,596
Vote 2 - Economic Development & Spatial Planning Department 193,820 400,077 11,871 86,840 127,247 (40,406) -31.8% 218,663
Vote 3 - Emergency Management Services Department 82,199 81,402 784 53,207 53,899 (692) -1.3% 81,402
Vote 4 - Environment & Agriculture Management Department 1,512,376 175,514 16,736 74,700 209,104 (134,405) -64.3% 377,379
Vote 5 - Group Audit & Risk Department 51,845 42,165 102 16,791 21,082 (4,291) -20.4% 42,165
Vote 6 - Group Financial Services Department 9,670,882 10,383,343 1,090,534 5,440,174 5,655,671 (215,497) -3.8% 10,383,343
Vote 7 - Group Property Department 61,893 93,279 1,915 28,932 46,378 (17,446) -37.6% 92,757
Vote 8 - Health Department 62,535 59,442 13,976 39,989 45,389 (5,400) -11.9% 59,442
Vote 9 - Housing & Human Settlement Department 762,238 983,245 187,160 330,010 511,164 (181,154) -35.4% 984,119
Vote 10 - Regional Operations & Coordination Department 304,298 1,593,116 158,456 790,442 805,416 (14,973) -1.9% 1,592,765
Vote 11 - Roads & Transport Department 1,326,259 1,195,088 101,168 487,267 495,211 (7,944) -1.6% 1,195,071
Vote 12 - Shared Services Department 22,020 1,063 1 9 532 (523) -98.4% 1,063
Vote 13 - Tshwane Metro Police Department 214,401 334,516 24,566 92,367 167,258 (74,891) -44.8% 334,516
Vote 14 - Utility Services Department 15,969,720 17,192,562 1,094,586 8,293,273 8,861,376 (568,102) -6.4% 17,192,562
Vote 15 - Other Departments 122,710 106,882 7,998 23,196 52,316 (29,120) -55.7% 106,882
Total Revenue by Vote 2 30,417,549 32,708,740 2,722,356 15,783,947 17,091,210 (1,307,262) -7.6% 32,708,723
Expenditure by Vote 1
Vote 1 - Community & Social Development Services Department 294,997 366,933 30,630 125,842 156,390 (30,548) -19.5% 306,155
Vote 2 - Economic Development & Spatial Planning Department 585,005 668,376 41,714 277,530 404,837 (127,307) -31.4% 675,275
Vote 3 - Emergency Management Services Department 623,775 660,745 51,097 313,957 349,874 (35,918) -10.3% 660,745
Vote 4 - Environment & Agriculture Management Department 657,811 682,139 41,676 255,745 434,733 (178,988) -41.2% 774,484
Vote 5 - Group Audit & Risk Department 364,812 320,121 5,520 154,557 162,526 (7,969) -4.9% 320,121
Vote 6 - Group Financial Services Department 1,468,345 3,291,437 390,061 1,579,363 1,661,544 (82,180) -4.9% 3,291,437
Vote 7 - Group Property Department 349,605 471,404 26,171 271,402 251,308 20,094 8.0% 465,506
Vote 8 - Health Department 317,312 395,176 23,409 146,162 175,030 (28,868) -16.5% 309,709
Vote 9 - Housing & Human Settlement Department 477,550 317,972 46,091 165,728 193,810 (28,082) -14.5% 318,121
Vote 10 - Regional Operations & Coordination Department 3,517,044 3,629,647 308,261 1,761,498 2,294,717 (533,219) -23.2% 3,783,689
Vote 11 - Roads & Transport Department 1,308,988 1,328,192 113,769 660,583 707,131 (46,548) -6.6% 1,319,502
Vote 12 - Shared Services Department 1,337,661 1,369,586 112,804 614,066 836,863 (222,797) -26.6% 1,403,572
Vote 13 - Tshwane Metro Police Department 2,175,132 2,087,460 195,337 1,134,685 1,144,588 (9,902) -0.9% 2,084,675
Vote 14 - Utility Services Department 12,625,167 13,200,387 944,367 6,712,015 7,442,984 (730,969) -9.8% 13,182,582
Vote 15 - Other Departments 1,288,051 1,205,754 102,042 540,251 571,165 (30,914) -5.4% 1,099,756
Total Expenditure by Vote 2 27,391,255 29,995,329 2,432,947 14,713,384 16,787,501 (2,074,117) -12.4% 29,995,329
Surplus/ (Deficit) for the year 2 3,026,294 2,713,410 289,409 1,070,563 303,708 766,855 252.5% 2,713,394
TSH City Of Tshwane - Table C3 Monthly Budget Statement - Financial Performance (revenue and expenditure by municipal vote) - M06 December
Ref
Budget Year 2017/18

23
(d) Table C4: Consolidated monthly budget statement – financial
performance (revenue and expenditure)
Note: Total revenue excludes capital transfers and contributions. These are indicated separately in this table as “Transfers recognised – capital”.
2016/17
Audited
Outcome
Original
Budget
Monthly
actual
YearTD
actual
YearTD
budget
YTD
variance
YTD
variance
Full Year
Forecast
R thousands %
Revenue By Source
Property rates 5 912 584 6 514 409 571 772 3 273 840 3 123 179 150 661 5% 6 514 409
Serv ice charges - electricity rev enue 10 800 091 11 176 494 810 829 5 753 343 5 788 049 (34 706) -1% 11 176 494
Serv ice charges - w ater rev enue 3 189 550 3 996 886 128 956 1 673 314 2 042 341 (369 028) -18% 3 996 886
Serv ice charges - sanitation rev enue 1 032 486 982 879 75 280 485 169 500 216 (15 047) -3% 982 879
Serv ice charges - refuse rev enue 1 065 583 1 410 506 139 876 670 738 701 053 (30 315) -4% 1 410 506
Rental of facilities and equipment 140 955 151 864 9 877 57 048 80 557 (23 509) -29% 156 496
Interest earned - ex ternal inv estments 105 994 79 493 6 750 78 484 39 839 38 646 97% 79 493
Interest earned - outstanding debtors 623 114 466 691 52 107 311 339 236 400 74 939 32% 466 691
Fines, penalties and forfeits 204 354 332 854 24 081 89 375 166 624 (77 249) -46% 332 854
Licences and permits 145 529 54 796 13 476 66 367 71 391 (5 025) -7% 54 796
Agency serv ices – 6 650 – – – – 6 650
Transfers and subsidies 3 761 456 4 159 532 544 935 2 161 104 2 750 548 (589 444) -21% 4 159 532
Other rev enue 970 173 887 079 41 982 355 033 411 356 (56 323) -14% 882 432
Gains on disposal of PPE 3 571 5 880 – 0 2 940 (2 940) -100% 5 880
Total Revenue (excluding capital transfers and
contributions)
27 955 440 30 226 013 2 419 922 14 975 154 15 914 494 (939 340) -6% 30 225 997
Expenditure By Type
Employ ee related costs 8 016 904 8 778 736 686 472 4 142 077 4 531 767 (389 690) -9% 8 778 772
Remuneration of councillors 120 365 125 281 10 511 60 604 66 643 (6 039) -9% 125 281
Debt impairment 780 739 1 175 973 – 493 289 591 155 (97 866) -17% 1 175 973
Depreciation & asset impairment 1 624 536 1 961 302 138 709 732 140 988 483 (256 343) -26% 1 961 302
Finance charges 1 319 814 1 417 357 334 833 1 006 687 757 207 249 480 33% 1 417 357
Bulk purchases 7 466 982 7 462 684 540 059 4 316 363 4 577 537 (261 174) -6% 7 742 137
Other materials 2 170 290 3 261 702 223 227 1 299 328 1 439 867 (140 538) -10% 2 864 644
Contracted serv ices 2 604 332 2 874 971 289 845 1 298 812 2 061 379 (762 567) -37% 2 608 881
Transfers and subsidies 423 719 49 980 2 026 48 590 66 681 (18 091) -27% 50 707
Other ex penditure 2 862 350 2 886 842 207 052 1 315 494 1 706 782 (391 288) -23% 3 269 776
Loss on disposal of PPE 1 224 1 – – 1 (1) -100% 1
Total Expenditure 27 391 255 29 994 829 2 432 734 14 713 384 16 787 501 (2 074 117) -12% 29 994 829
Surplus/(Deficit) 564 184 231 184 (12 812) 261 769 (873 007) 1 134 777 (0) 231 168 Transfers and subsidies - capital (monetary allocations)
(National / Prov incial and District) 2 407 713 2 443 910 302 434 794 939 1 160 308 (365 369) (0) 2 443 910 Transfers and subsidies - capital (monetary allocations)
(National / Prov incial Departmental Agencies,
Households, Non-profit Institutions, Priv ate Enterprises,
Public Corporatons, Higher Educational Institutions) – 6 000 – – – – 6 000
Transfers and subsidies - capital (in-kind - all) 54 397 32 816 – 13 855 16 408 (2 553) (0) 32 816
Surplus/(Deficit) after capital transfers &
contributions
3 026 294 2 713 910 289 623 1 070 563 303 708 2 713 894
Tax ation – 500 214 – – – 500
Surplus/(Deficit) after taxation 3 026 294 2 713 410 289 409 1 070 563 303 708 2 713 394
Attributable to minorities – – – – – –
Surplus/(Deficit) attributable to municipality 3 026 294 2 713 410 289 409 1 070 563 303 708 2 713 394
Surplus/ (Deficit) for the year 3 026 294 2 713 410 289 409 1 070 563 303 708 2 713 394
Description
Budget Year 2017/18
TSH City Of Tshwane - Table C4 Monthly Budget Statement - Financial Performance (revenue and expenditure) - M06 December
24
(e) Table C5: Consolidated monthly budget statement – capital expenditure
by vote, standard classification and funding
2016/17 Budget Year 2017/18
Audited
Outcome
Original
Budget
Monthly
actualYearTD actual
YearTD
budget
YTD
variance
YTD
variance
Full Year
Forecast
R thousands 1 %
Multi-Year expenditure appropriation 2
Vote 1 - Community & Social Development Services Department 102,068 91,507 10,951 19,477 56,015 (36,538) -65% 91,507
Vote 2 - Economic Development & Spatial Planning Department 55,983 63,700 451 441 49,934 (49,494) -99% 63,700
Vote 3 - Emergency Management Services Department 10,895 10,000 958 2,311 4,199 (1,889) -45% 10,000
Vote 4 - Environment & Agriculture Management Department 22,123 32,500 1,583 3,999 18,875 (14,876) -79% 32,500
Vote 5 - Group Audit & Risk Department 5,856 13,000 476 562 6,474 (5,912) -91% 13,000
Vote 6 - Group Financial Services Department 43,513 101,000 – – 49,750 (49,750) -100% 101,000
Vote 7 - Group Property Department – 5,000 – – 2,250 (2,250) -100% 5,000
Vote 8 - Health Department 14,031 15,200 922 5,975 12,600 (6,625) -53% 15,200
Vote 9 - Housing & Human Settlement Department 602,143 956,597 132,824 204,424 496,336 (291,912) -59% 956,597
Vote 10 - Regional Operations & Coordination Department 2,832 5,000 – (55) 500 (555) -111% 5,000
Vote 11 - Roads & Transport Department 1,148,520 1,111,638 90,866 370,993 379,271 (8,278) -2% 1,111,638
Vote 12 - Shared Services Department 159,831 93,500 2,801 2,818 59,750 (56,932) -95% 93,500
Vote 13 - Tshwane Metro Police Department 29,997 13,000 – – 6,006 (6,006) -100% 13,000
Vote 14 - Utility Services Department 978,955 1,015,616 58,535 236,040 445,153 (209,113) -47% 1,015,616
Vote 15 - Other Departments 52,301 391,500 5,418 6,407 187,490 (181,083) -97% 391,500
Total Capital Multi-year expenditure 4,7 3,229,050 3,918,759 305,788 853,392 1,774,603 (921,212) -52% 3,918,759
Single Year expenditure appropriation 2
Vote 1 - Community & Social Development Services Department – 200 – – 200 (200) -100% 200
Vote 2 - Economic Development & Spatial Planning Department 4,000 450 5 24 450 (426) -95% 450
Vote 3 - Emergency Management Services Department – 250 38 210 250 (40) -16% 250
Vote 4 - Environment & Agriculture Management Department 4,831 – – – – – –
Vote 5 - Group Audit & Risk Department – – – – – – –
Vote 6 - Group Financial Services Department – 19,500 – – 11,200 (11,200) -100% 19,500
Vote 7 - Group Property Department – 200 – – 200 (200) -100% 200
Vote 8 - Health Department – 300 75 75 300 (225) -75% 300
Vote 9 - Housing & Human Settlement Department – – – – – – –
Vote 10 - Regional Operations & Coordination Department – 1,800 37 63 1,800 (1,737) -97% 1,800
Vote 11 - Roads & Transport Department – – – – – – –
Vote 12 - Shared Services Department 200 – – – – – –
Vote 13 - Tshwane Metro Police Department – – – – – – –
Vote 14 - Utility Services Department – 500 – – 500 (500) -100% 500
Vote 15 - Other Departments – 800 – 167 750 (583) -78% 800
Total Capital single-year expenditure 4 9,031 24,000 154 538 15,650 (15,112) -97% 24,000
Total Capital Expenditure 3,238,081 3,942,759 305,942 853,929 1,790,253 (936,324) -52% 3,942,759
Capital Expenditure - Functional Classification
Governance and administration 267,412 636,957 8,738 10,041 323,809 (313,768) -97% 636,957
Executive and council 62,117 387,257 5 522 187,445 (186,923) -100% 387,257
Internal audit 205,295 249,700 8,733 9,519 136,364 (126,845) -93% 249,700
Community and public safety 729,676 1,084,847 145,778 232,481 575,230 (342,750) -60% 1,084,847
Community and social services 19,292 8,300 233 1,385 4,399 (3,014) -69% 8,300
Sport and recreation 41,796 58,500 10 (3,063) 24,545 (27,608) -112% 58,500
Public safety 5,903 7,250 837 1,210 2,850 (1,640) -58% 7,250
Housing 604,975 961,597 132,824 204,424 496,836 (292,412) -59% 961,597
Health 57,710 49,200 11,874 28,525 46,600 (18,075) -39% 49,200
Economic and environmental services 1,208,780 1,129,338 92,440 359,938 404,686 (44,749) -11% 1,129,338
Planning and development 49,140 57,200 – – 47,009 (47,009) -100% 57,200
Road transport 1,156,925 1,069,138 90,866 358,138 356,327 1,811 1% 1,069,138
Environmental protection 2,715 3,000 1,573 1,800 1,350 450 33% 3,000
Trading services 1,000,582 1,051,116 58,535 238,229 455,153 (216,924) -48% 1,051,116
Energy sources 491,988 488,312 32,922 145,778 201,538 (55,760) -28% 488,312
Water management 149,201 402,804 22,885 78,258 189,465 (111,207) -59% 402,804
Waste water management 338,570 146,000 2,729 12,005 54,650 (42,645) -78% 146,000
Waste management 20,822 14,000 – 2,189 9,500 (7,311) -77% 14,000
Other 31,632 40,500 451 13,241 31,375 (18,134) -58% 40,500
Total Capital Expenditure - Functional Classification 3 3,238,081 3,942,759 305,942 853,929 1,790,253 (936,324) -52% 3,942,759
Funded by:
National Government 2,298,313 2,329,777 264,737 720,106 1,075,849 (355,743) -33% 2,329,777
Provincial Government 46,710 114,133 12,997 28,071 72,403 (44,332) -61% 114,133
Other transfers and grants 200 6,000 – – – – 6,000
Transfers recognised - capital 2,345,223 2,449,910 277,734 748,177 1,148,252 (400,075) -35% 2,449,910
Public contributions & donations 5 97,926 100,000 1,448 19,129 19,940 (812) -4% 100,000
Borrowing 6 760,761 1,000,000 25,714 83,529 421,397 (337,869) -80% 1,000,000
Internally generated funds 34,172 392,848 1,046 3,095 200,664 (197,569) -98% 392,848
Total Capital Funding 3,238,081 3,942,759 305,942 853,929 1,790,253 (936,324) -52% 3,942,759
TSH City Of Tshwane - Table C5 Monthly Budget Statement - Capital Expenditure (municipal vote, functional classification and funding) -
M06 December
Vote Description Ref

25
(f) Table C6: Consolidated monthly budget statement – financial position
2016/17 Budget Year 2017/18
Audited
Outcome
Original
BudgetYearTD actual
Full Year
Forecast
R thousands 1
ASSETS
Current assets
Cash 398,775 121,000 47,916 121,000
Call investment deposits 1,712,109 2,502,289 2,237,266 2,502,289
Consumer debtors 7,948,261 3,423,486 3,293,162 3,423,486
Other debtors 1,162,454 1,067,508 887,760 1,067,508
Current portion of long-term receivables 91,005 163,349 91,005 163,349
Inventory 688,895 698,494 676,499 698,494
Total current assets 12,001,499 7,976,126 7,233,607 7,976,126
Non current assets
Long-term receivables 25,661 6,366 1,221,626 6,366
Investments 711 858,036 711 858,036
Investment property 749,410 927,675 773,100 927,675
Property, plant and equipment 33,890,210 37,968,303 34,017,572 37,968,303
Intangible assets 385,034 379,756 388,542 379,756
Other non-current assets 4,095,737 – 4,292,202 –
Total non current assets 39,146,763 40,140,136 40,693,753 40,140,136
TOTAL ASSETS 51,148,262 48,116,261 47,927,360 48,116,261
LIABILITIES
Current liabilities
Borrowing 852,379 788,401 910,024 788,401
Consumer deposits 407,337 395,755 472,914 395,755
Trade and other payables 8,993,976 7,197,370 8,012,432 7,197,370
Total current liabilities 10,253,692 8,381,526 9,395,370 8,381,526
Non current liabilities
Borrowing 11,123,593 11,195,205 11,013,162 11,195,205
Provisions 4,208,076 3,569,019 4,208,076 3,569,019
Total non current liabilities 15,331,669 14,764,224 15,221,238 14,764,224
TOTAL LIABILITIES 25,585,360 23,145,750 24,616,608 23,145,750
NET ASSETS 2 25,562,901 24,970,512 23,310,751 24,970,512
COMMUNITY WEALTH/EQUITY
Accumulated Surplus/(Deficit) 25,274,453 24,713,269 23,079,948 24,713,269
Reserves 230,803 257,243 230,803 257,243
TOTAL COMMUNITY WEALTH/EQUITY 2 25,505,256 24,970,512 23,310,751 24,970,512
Description Ref
TSH City Of Tshwane - Table C6 Monthly Budget Statement - Financial Position - M06 December

26
(g) Table C7: Consolidated monthly budget statement – cash flow
27
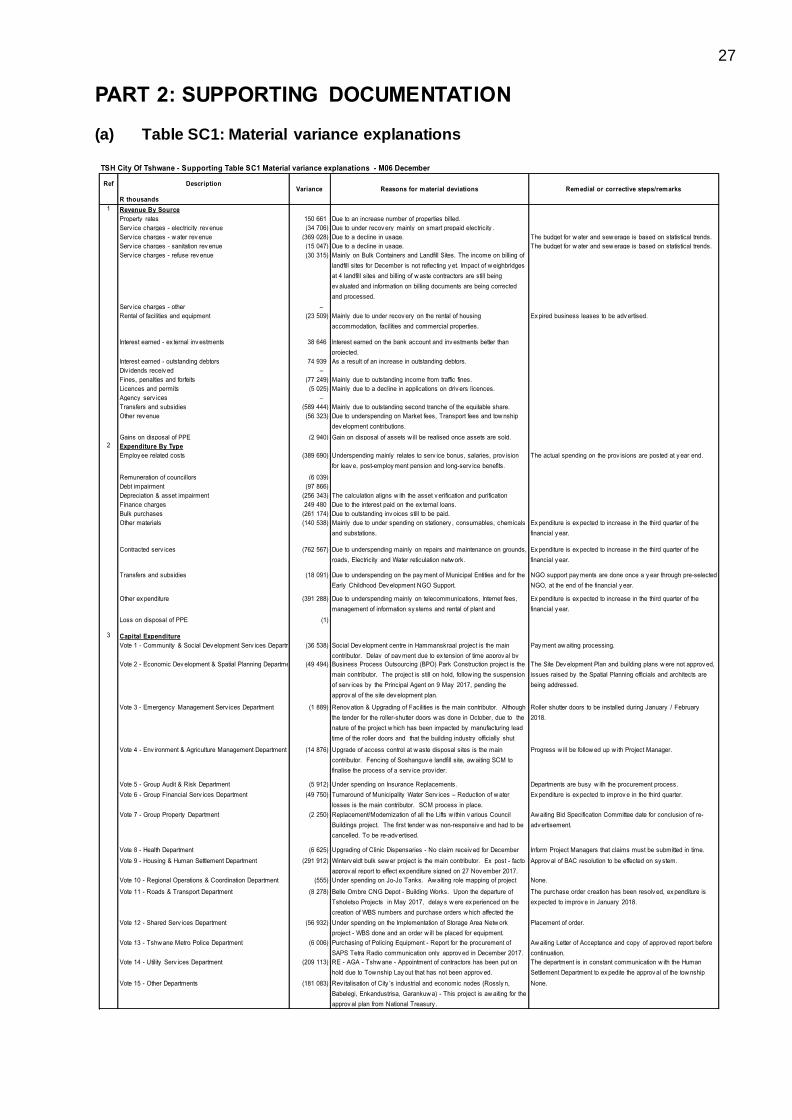
PART 2: SUPPORTING DOCUMENTATION (a) Table SC1: Material variance explanations
Variance Reasons for material deviations Remedial or corrective steps/remarks
R thousands
1 Revenue By Source
Property rates 150 661 Due to an increase number of properties billed.
Serv ice charges - electricity rev enue (34 706) Due to under recov ery mainly on smart prepaid electricity .
Serv ice charges - w ater rev enue (369 028) Due to a decline in usage. The budget for w ater and sew erage is based on statistical trends.
Serv ice charges - sanitation rev enue (15 047) Due to a decline in usage. The budget for w ater and sew erage is based on statistical trends.
Serv ice charges - refuse rev enue (30 315) Mainly on Bulk Containers and Landfill Sites. The income on billing of
landfill sites for December is not reflecting y et. Impact of w eighbridges
at 4 landfill sites and billing of w aste contractors are still being
ev aluated and information on billing documents are being corrected
and processed.
Serv ice charges - other –
Rental of facilities and equipment (23 509) Mainly due to under recov ery on the rental of housing
accommodation, facilities and commercial properties.
Ex pired business leases to be adv ertised.
Interest earned - ex ternal inv estments 38 646 Interest earned on the bank account and inv estments better than
projected.
Interest earned - outstanding debtors 74 939 As a result of an increase in outstanding debtors.
Div idends receiv ed –
Fines, penalties and forfeits (77 249) Mainly due to outstanding income from traffic fines.
Licences and permits (5 025) Mainly due to a decline in applications on driv ers licences.
Agency serv ices –
Transfers and subsidies (589 444) Mainly due to outstanding second tranche of the equitable share.
Other rev enue (56 323) Due to underspending on Market fees, Transport fees and tow nship
dev elopment contributions.
Gains on disposal of PPE (2 940) Gain on disposal of assets w ill be realised once assets are sold.
2 Expenditure By Type
Employ ee related costs (389 690) Underspending mainly relates to serv ice bonus, salaries, prov ision
for leav e, post-employ ment pension and long-serv ice benefits.
The actual spending on the prov isions are posted at y ear end.
Remuneration of councillors (6 039)
Debt impairment (97 866)
Depreciation & asset impairment (256 343) The calculation aligns w ith the asset v erification and purification
Finance charges 249 480 Due to the interest paid on the ex ternal loans.
Bulk purchases (261 174) Due to outstanding inv oices still to be paid.
Other materials (140 538) Mainly due to under spending on stationery , consumables, chemicals
and substations.
Ex penditure is ex pected to increase in the third quarter of the
financial y ear.
Contracted serv ices (762 567) Due to underspending mainly on repairs and maintenance on grounds,
roads, Electricity and Water reticulation netw ork.
Ex penditure is ex pected to increase in the third quarter of the
financial y ear.
Transfers and subsidies (18 091) Due to underspending on the pay ment of Municipal Entities and for the
Early Childhood Dev elopment NGO Support.
NGO support pay ments are done once a y ear through pre-selected
NGO, at the end of the financial y ear.
Other ex penditure (391 288) Due to underspending mainly on telecommunications, Internet fees,
management of information sy stems and rental of plant and
equipment.
Ex penditure is ex pected to increase in the third quarter of the
financial y ear.
Loss on disposal of PPE (1)
3 Capital Expenditure
Vote 1 - Community & Social Dev elopment Serv ices Department (36 538) Social Dev elopment centre in Hammanskraal project is the main
contributor. Delay of pay ment due to ex tension of time approv al by
Pay ment aw aiting processing.
Vote 2 - Economic Dev elopment & Spatial Planning Department (49 494) Business Process Outsourcing (BPO) Park Construction project is the
main contributor. The project is still on hold, follow ing the suspension
of serv ices by the Principal Agent on 9 May 2017, pending the
approv al of the site dev elopment plan.
The Site Dev elopment Plan and building plans w ere not approv ed,
issues raised by the Spatial Planning officials and architects are
being addressed.
Vote 3 - Emergency Management Serv ices Department (1 889) Renov ation & Upgrading of Facilities is the main contributor. Although
the tender for the roller-shutter doors w as done in October, due to the
nature of the project w hich has been impacted by manufacturing lead
time of the roller doors and that the building industry officially shut
dow n mid-December, this project w ill only realize ex penditure during
Roller shutter doors to be installed during January / February
2018.
Vote 4 - Env ironment & Agriculture Management Department (14 876) Upgrade of access control at w aste disposal sites is the main
contributor. Fencing of Soshanguv e landfill site, aw aiting SCM to
finalise the process of a serv ice prov ider.
Progress w ill be follow ed up w ith Project Manager.
Vote 5 - Group Audit & Risk Department (5 912) Under spending on Insurance Replacements. Departments are busy w ith the procurement process.
Vote 6 - Group Financial Serv ices Department (49 750) Turnaround of Municipality Water Serv ices – Reduction of w ater
losses is the main contributor. SCM process in place.
Ex penditure is ex pected to improv e in the third quarter.
Vote 7 - Group Property Department (2 250) Replacement/Modernization of all the Lifts w ithin v arious Council
Buildings project. The first tender w as non-responsiv e and had to be
cancelled. To be re-adv ertised.
Aw aiting Bid Specification Committee date for conclusion of re-
adv ertisement.
Vote 8 - Health Department (6 625) Upgrading of Clinic Dispensaries - No claim receiv ed for December
2017.
Inform Project Managers that claims must be submitted in time.
Vote 9 - Housing & Human Settlement Department (291 912) Winterv eldt bulk sew er project is the main contributor. Ex post - facto
approv al report to effect ex penditure signed on 27 Nov ember 2017.
Approv al of BAC resolution to be effected on sy stem.
Vote 10 - Regional Operations & Coordination Department (555) Under spending on Jo-Jo Tanks. Aw aiting role mapping of project
managers.
None.
Vote 11 - Roads & Transport Department (8 278) Belle Ombre CNG Depot - Building Works. Upon the departure of
Tsholetso Projects in May 2017, delay s w ere ex perienced on the
creation of WBS numbers and purchase orders w hich affected the
The purchase order creation has been resolv ed, ex penditure is
ex pected to improv e in January 2018.
Vote 12 - Shared Serv ices Department (56 932) Under spending on the Implementation of Storage Area Netw ork
project - WBS done and an order w ill be placed for equipment.
Placement of order.
Vote 13 - Tshw ane Metro Police Department (6 006) Purchasing of Policing Equipment - Report for the procurement of
SAPS Tetra Radio communication only approv ed in December 2017.
Aw aiting Letter of Acceptance and copy of approv ed report before
continuation.
Vote 14 - Utility Serv ices Department (209 113) RE - AGA - Tshw ane - Appointment of contractors has been put on
hold due to Tow nship Lay out that has not been approv ed.
The department is in constant communication w ith the Human
Settlement Department to ex pedite the approv al of the tow nship
lay out plans.Vote 15 - Other Departments (181 083) Rev italisation of City ’s industrial and economic nodes (Rossly n,
Babelegi, Enkandustrisa, Garankuw a) - This project is aw aiting for the
approv al plan from National Treasury .
None.
Ref Description
TSH City Of Tshwane - Supporting Table SC1 Material variance explanations - M06 December

28
Table SC1: Material variance explanations (continued)
Variance Reasons for material deviations Remedial or corrective steps/remarks
R thousands
4 Financial Position
Current assets (742 519) Decrease in cash, inv estments and consumer debtors.
Non current assets 553 617 Increase in long term receiv ables.
Current liabilities 1 013 844 Increase in borrow ings, trade and other pay ables.
Non current liabilities 457 014 Increase in prov isions.
5 Cash Flow
Transfer receipts - capital (357 330) Underspending on capital grants.
Contributions & Contributed assets 3 761 Contributions on assets.
Proceeds on disposal of PPE (490)
Short term loans –
Borrow ing long term/refinancing (77 042) Long Term borrow ings is ex pected in the fourth quarter.
Increase in consumer deposits 7 378 An increase in consumer deposit.
Receipt of non-current debtors 15 750 Mov ement in consumer debtors
Receipt of non-current receiv ables (33 071) Decrease in non- current receiv ables.
Change in non-current inv estments 41 687 Includes the Entities - SWA consumers debtors.
Capital assets (203 348) Underspending on the capital budget.
Repay ment of borrow ing (50 149) Repay ment less than budgeted.
7 Municipal Entities
Revenue
Housing Company Tshw ane (5 274) Main contributor is Transfers and Subsidies. The v ariance w as
attributed to certain marketing activ ities not carried out due to the entity
not deliv ering Tow nlands project and v acant senior management
positions not filled. The grant is recognized once the entity has fulfilled
the mandate as per the Serv ice Deliv ery Agreement betw een the City
and the entity .
Management has adv ertised senior management position and
those positions w ill be filled the beginning of the quarter 3. The non-
performing contractor has been put in terms.
Tshw ane Economic Dev elopment Agency (8 375) Not all grant pay ments hav e been receiv ed.
Expenditure
Housing Company Tshw ane (16 724) Contracted serv ices - The v ariance w as due to certain marketing
activ ities not carried out due to the entity not deliv ering 100 social
housing units at the end of the financial y ear due to the contractors non-
performance.
The contractor has been put into terms to deliv er 158 units by the
end of quarter 3.
Tshw ane Economic Dev elopment Agency (8 637) Ex penditure less than projected.
Capital Expenditure
Housing Company Tshw ane (8 508) Chantel projects – Adv ert to appoint a contractor on upgrading of bulk
infrastructure has been adv ertised, appointment ex pected by the end
of December 2017 ; Tow nlands project – the entity is aw aiting R10
million from SHRA, In terms of performance 148 units on the first floor
are in progress w hich equates to 3 blocks; Timberlands projects –
90% of the design has been completed.
This w ill be corrected during the adjustment budget.
Tshw ane Economic Dev elopment Agency (200) No ex penditure has been incurred for the period.
Ref Description
TSH City Of Tshwane - Supporting Table SC1 Material variance explanations - M06 December

29
(b) Table SC2: Monthly budget statement – performance indicators
2016/17 Budget Year 2017/18
Audited
Outcome
Original
Budget
Adjusted
BudgetYearTD actual
Full Year
Forecast
Borrowing Management
Capital Charges to Operating Expenditure Interest & principal paid/Operating Expenditure 2.8% 11.3% 0.0% 6.8% 5.1%
Borrowed funding of 'own' capital expenditure Borrowings/Capital expenditure excl. transfers and grants 23.5% 25.4% 0.0% 9.8% 25.4%
Safety of Capital
Debt to Equity Loans, Accounts Payable, Overdraft & Tax Provision/
Funds & Reserves
82.2% 76.8% 0.0% 85.5% 76.8%
Gearing Long Term Borrowing/ Funds & Reserves 4819.5% 4352.0% 0.0% 4771.7% 4352.0%
Liquidity
Current Ratio Current assets/current liabilities 1 117.0% 95.2% 0.0% 77.0% 95.2%
Liquidity Ratio Monetary Assets/Current Liabilities 20.6% 31.3% 0.0% 24.3% 31.3%
Revenue Management
Annual Debtors Collection Rate
(Payment Level % )
Last 12 Mths Receipts/ Last 12 Mths Billing
Outstanding Debtors to Revenue Total Outstanding Debtors to Annual Revenue 33.0% 15.4% 0.0% 36.7% 15.4%
Longstanding Debtors Recovered Debtors > 12 Mths Recovered/Total Debtors >
12 Months Old
0.0% 0.0% 0.0% 0.0% 0.0%
Creditors Management
Creditors System Efficiency % of Creditors Paid Within Terms (within MFMA s 65(e)) 100.0% 100.0% 0.0% 100.0% 100.0%
Funding of Provisions
Percentage Of Provisions Not Funded Unfunded Provisions/Total Provisions
Other Indicators
Electricity Distribution Losses % Volume (units purchased and generated less units
sold)/units purchased and generated
2 21.3% 18.5% 0.0% 21.2% 18.5%
Water Distribution Losses % Volume (units purchased and own source less units
sold)/Total units purchased and own source
2 27.8% 22.6% 0.0% 19.9% 22.6%
Employee costs Employee costs/Total Revenue - capital revenue 28.7% 29.0% 0.0% 27.7% 29.0%
Repairs & Maintenance R&M/Total Revenue - capital revenue 3.8% 4.0% 0.0% 3.0% 4.0%
Interest & Depreciation I&D/Total Revenue - capital revenue 10.5% 11.2% 0.0% 6.7% 5.1%
IDP regulation financial viability indicators
i. Debt coverage (Total Operating Revenue - Operating Grants)/Debt
service payments due within financial year)
141.0 30.5 0.0 -11.8 30.5
ii. O/S Service Debtors to Revenue Total outstanding service debtors/annual revenue
received for services
28.4% 19.2% 0.0% 26.2% 19.2%
iii. Cost coverage (Available cash + Investments)/monthly fixed operational
expenditure
0.08 1.20 0.00 0.16 1.20
Description of financial indicator Basis of calculation Ref
TSH City Of Tshwane - Supporting Table SC2 Monthly Budget Statement - performance indicators - M06 December

30
(c) Table SC3: Monthly budget statement – aged debtors
(d) Table SC4: Monthly budget statement – aged creditors
Description
R thousands
NT
Code0-30 Days 31-60 Days 61-90 Days 91-120 Days 121-150 Dys 151-180 Dys 181 Dys-1 Yr Over 1Yr Total
Total
over 90 days
Actual Bad
Debts Written
Off against
Debtors
Impairment -
Bad Debts i.t.o
Council Policy
Debtors Age Analysis By Income Source
Trade and Other Receivables from Exchange Transactions - Water 1200 407,780 58,548 48,488 60,658 106,071 128,779 553,326 971,475 2,335,126 1,820,310 2,313
Trade and Other Receivables from Exchange Transactions - Electricity 1300 286,819 34,837 32,814 34,969 34,684 26,554 115,117 562,310 1,128,104 773,634 460
Receivables from Non-exchange Transactions - Property Rates 1400 637,786 59,911 65,256 64,206 56,193 47,203 326,409 1,161,050 2,418,014 1,655,061 407
Receivables from Exchange Transactions - Waste Water Management 1500 91,140 11,448 8,079 10,563 9,321 11,474 68,448 180,856 391,329 280,662 432
Receivables from Exchange Transactions - Waste Management 1600 176,996 20,101 12,991 16,268 13,111 14,337 198,096 282,903 734,803 524,715 509
Receivables from Exchange Transactions - Property Rental Debtors 1700 9,857 2,689 1,756 1,286 1,100 233,021 182 41,714 291,606 277,304 –
Interest on Arrear Debtor Accounts 1810 144,868 54,470 45,447 54,624 49,309 57,314 541,054 1,152,020 2,099,106 1,854,322 1,090
Other 1900 57,595 63,432 31,043 43,633 34,417 21,492 519,371 659,840 1,430,824 1,278,753 762
Total By Income Source 2000 1,812,841 305,437 245,874 286,207 304,205 540,176 2,322,005 5,012,169 10,828,913 8,464,762 5,974 –
2016/17 - totals only 1,395,781 211,946 228,848 235,202 260,298 384,206 987,413 4,682,000 8,385,695 6,549,120 3,679
Debtors Age Analysis By Customer Group
Organs of State 2200 103,489 17,338 16,075 11,389 4,908 (13,551) 2,307 (3,010) 138,945 2,043 –
Commercial 2300 128,892 80,631 74,459 84,679 97,592 180,059 294,265 1,177,869 2,118,446 1,834,465 –
Households 2400 961,622 197,293 149,845 180,341 190,793 243,560 1,982,882 3,304,775 7,211,110 5,902,351 5,521
Other 2500 618,838 10,175 5,495 9,797 10,913 130,107 42,551 532,535 1,360,411 725,903 453
Total By Customer Group 2600 1,812,841 305,437 245,874 286,207 304,205 540,176 2,322,005 5,012,169 10,828,913 8,464,762 5,974 –
TSH City Of Tshwane - Supporting Table SC3 Monthly Budget Statement - aged debtors - M06 December
Budget Year 2017/18
Budget Year 2017/18
R thousands
Creditors Age Analysis By Customer Type
Bulk Electricity 0100 615,735 615,735 611,629
Bulk Water 0200 347,960 347,960 175,765
PAYE deductions 0300 112,006 112,006 90,988
VAT (output less input) 0400 (60,588) (60,588) (88,240)
Pensions / Retirement deductions 0500 112,055 112,055 104,254
Loan repayments 0600 150,379 150,379 1,326,150
Trade Creditors 0700 950,949 950,949 983,528
Auditor General 0800 – – 4,687
Other 0900 2,567,520 2,567,520 527,864
Total By Customer Type 1000 4,796,015 – – – – – – – 4,796,015 3,736,625
Prior year totals
for chart (same
period)
TSH City Of Tshwane - Supporting Table SC4 Monthly Budget Statement - aged creditors - M06 December
181 Days -
1 Year
Over 1
Year
Total61 -
90 Days
91 -
120 Days
121 -
150 Days
151 -
180 Days
Description NT
Code0 -
30 Days
31 -
60 Days
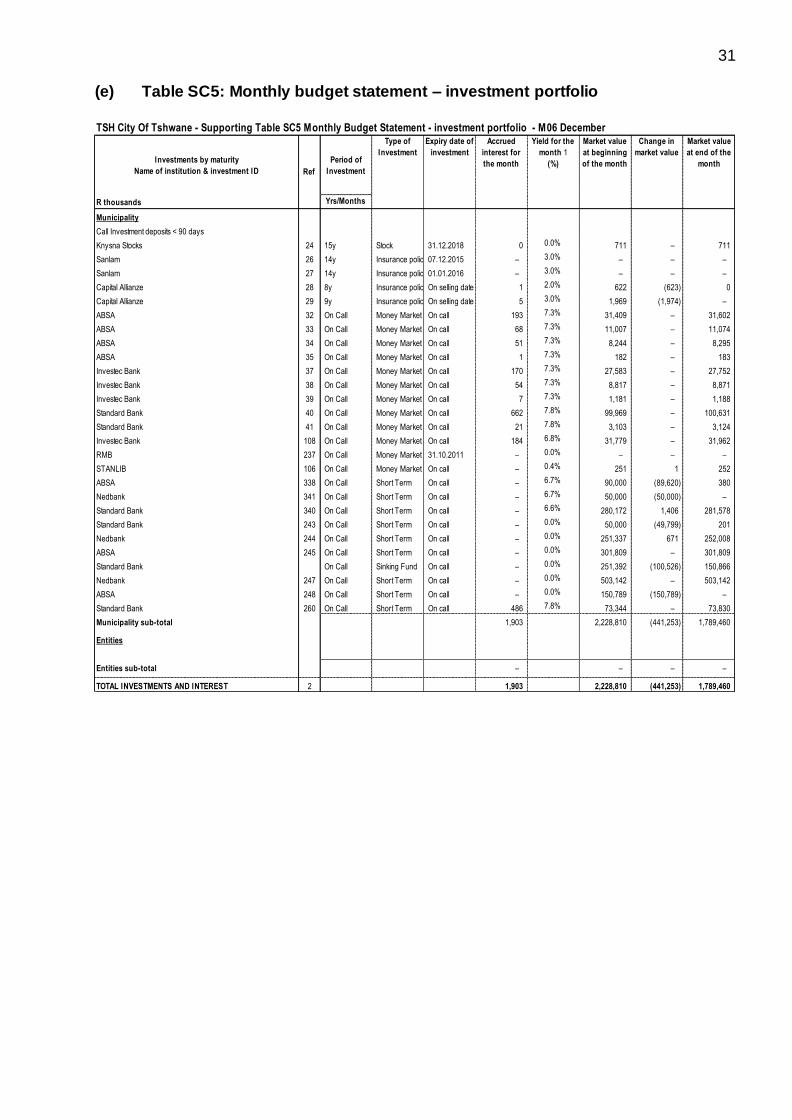
31
(e) Table SC5: Monthly budget statement – investment portfolio
Investments by maturity
Name of institution & investment ID
Period of
Investment
R thousands Yrs/Months
Municipality
Call Investment deposits < 90 days
Knysna Stocks 24 15y Stock 31.12.2018 0 0.0% 711 – 711
Sanlam 26 14y Insurance policy 07.12.2015 – 3.0% – – –
Sanlam 27 14y Insurance policy 01.01.2016 – 3.0% – – –
Capital Allianze 28 8y Insurance policy On selling date 1 2.0% 622 (623) 0
Capital Allianze 29 9y Insurance policy On selling date 5 3.0% 1,969 (1,974) –
ABSA 32 On Call Money Market On call 193 7.3% 31,409 – 31,602
ABSA 33 On Call Money Market On call 68 7.3% 11,007 – 11,074
ABSA 34 On Call Money Market On call 51 7.3% 8,244 – 8,295
ABSA 35 On Call Money Market On call 1 7.3% 182 – 183
Investec Bank 37 On Call Money Market On call 170 7.3% 27,583 – 27,752
Investec Bank 38 On Call Money Market On call 54 7.3% 8,817 – 8,871
Investec Bank 39 On Call Money Market On call 7 7.3% 1,181 – 1,188
Standard Bank 40 On Call Money Market On call 662 7.8% 99,969 – 100,631
Standard Bank 41 On Call Money Market On call 21 7.8% 3,103 – 3,124
Investec Bank 108 On Call Money Market On call 184 6.8% 31,779 – 31,962
RMB 237 On Call Money Market 31.10.2011 – 0.0% – – –
STANLIB 106 On Call Money Market On call – 0.4% 251 1 252
ABSA 338 On Call Short Term On call – 6.7% 90,000 (89,620) 380
Nedbank 341 On Call Short Term On call – 6.7% 50,000 (50,000) –
Standard Bank 340 On Call Short Term On call – 6.6% 280,172 1,406 281,578
Standard Bank 243 On Call Short Term On call – 0.0% 50,000 (49,799) 201
Nedbank 244 On Call Short Term On call – 0.0% 251,337 671 252,008
ABSA 245 On Call Short Term On call – 0.0% 301,809 – 301,809
Standard Bank On Call Sinking Fund On call – 0.0% 251,392 (100,526) 150,866
Nedbank 247 On Call Short Term On call – 0.0% 503,142 – 503,142
ABSA 248 On Call Short Term On call – 0.0% 150,789 (150,789) –
Standard Bank 260 On Call Short Term On call 486 7.8% 73,344 – 73,830
Municipality sub-total 1,903 2,228,810 (441,253) 1,789,460
Entities
Entities sub-total – – – –
TOTAL INVESTMENTS AND INTEREST 2 1,903 2,228,810 (441,253) 1,789,460
TSH City Of Tshwane - Supporting Table SC5 Monthly Budget Statement - investment portfolio - M06 December
Ref
Type of
Investment
Expiry date of
investment
Market value
at end of the
month
Accrued
interest for
the month
Yield for the
month 1
(%)
Market value
at beginning
of the month
Change in
market value

32
(f) Table SC6: Monthly budget statement – transfers and grant receipts
2016/17 Budget Year 2017/18
Audited
Outcome
Original
Budget
Monthly
actual
YearTD
actual
YearTD
budget
YTD
variance
YTD
variance
Full Year
Forecast
R thousands %
RECEIPTS:
Operating Transfers and Grants
National Government: 3 614 648 3 875 608 481 471 2 033 349 2 744 278 (710 929) -25,9% 3 875 608
Local Gov ernment Equitable Share 1 864 838 2 132 788 – 888 662 1 599 591 (710 929) -44,4% 2 132 788
Fuel Lev y 1 440 100 1 444 413 481 471 962 942 962 942 – 1 444 413
Finance Management Grant 2 875 2 650 – 2 650 2 650 – 2 650
Urban Settlement Dev elopment Grant 46 180 48 492 – 48 492 48 492 – 48 492
Ex panded Public Works Programme Incentiv e (EPWP) 50 247 20 451 – 14 315 14 315 – 20 451
Public Transport Netw ork Operations Grant 204 010 221 049 – 110 524 110 524 – 221 049
Integrated City Dev elopment Grant 6 398 5 764 – 5 764 5 764 – 5 764
Provincial Government: 342 400 217 173 123 033 236 611 183 412 53 199 29,0% 217 173
Primary Health Care 44 325 46 541 13 962 32 578 32 578 0 0,0% 46 541
Emergency Medical Serv ices 62 850 65 993 – 46 195 46 195 – 65 993
HIV and Aids Grant 12 649 12 720 – 7 632 12 720 (5 088) -40,0% 12 720
Housing Top Structure (HSDG) 203 285 90 664 109 071 149 211 90 664 58 547 64,6% 90 664
Sports and Recreation : Community Libraries 7 145 1 255 – 995 1 255 (260) -20,7% 1 255
Gautrans 12 071 – – – – – –
Reseach and Technology 75 – – – – – –
Other grant providers: 365 329 152 176 7 276 33 620 74 302 (40 682) -54,8% 152 176
DBSA 61 000 26 000 (26 000) -100,0% 61 000
Tirelo Bosha Grant - Research and Development 3 900 5 751 – 628 5 751 (5 123) -89,1% 5 751
Broadband/Wifi 1 087 – – – – – –
Housing Company Tshwane 30 629 31 275 2 866 11 004 15 476 (4 472) -28,9% 31 275
TEDA 58 166 54 150 4 410 21 988 27 075 (5 087) -18,8% 54 150
Sandspruit 271 547 – – – – – –
Total Operating Transfers and Grants 4 322 377 4 244 957 611 780 2 303 581 3 001 992 (698 412) -23,3% 4 244 957
Capital Transfers and Grants
National Government: 2 367 908 2 329 777 7 177 1 163 476 1 163 476 – 2 329 777
Urban Settlement Dev elopment Grant 1 493 154 1 567 923 – 759 715 759 715 – 1 567 923
Public Transport Infrastructure & Sy stems Grant 750 000 679 190 – 339 596 339 596 – 679 190
Intergrated National Electrification Programme 40 000 30 000 7 177 11 500 11 500 – 30 000
Neighbourhood Dev elopment Partnership Grant 48 500 20 000 – 20 000 20 000 – 20 000
Intergrated City Dev elopment Grant 36 254 32 665 – 32 665 32 665 – 32 665
Provincial Government: 43 585 43 507 – 36 509 36 509 – 43 507
Sport and Recreation: Community Libraries 6 978 9 507 – 9 507 9 507 – 9 507
Social Infrastructure Grant 36 607 34 000 – 27 002 27 002 – 34 000
Other grant providers: 200 6 000 – 2 859 5 332 (2 474) -46,4% 6 000
LG SETA Discretionaty grant (93 appies over 3 years) – 6 000 – 2 859 5 332 (2 474) -46,4% 6 000
Smart Connect Grant 200 – – – – –
Total Capital Transfers and Grants 2 411 693 2 379 284 7 177 1 202 844 1 205 317 (2 474) -0,2% 2 379 284
TOTAL RECEIPTS OF TRANSFERS & GRANTS 6 734 070 6 624 241 618 957 3 506 424 4 207 310 (700 885) -16,7% 6 624 241
Description
TSH City Of Tshwane - Supporting Table SC6 Monthly Budget Statement - transfers and grant receipts - M06 December

33
(g) Table SC7(1): Monthly budget statement – transfers and grant expenditures
2016/17 Budget Year 2017/18
Audited
Outcome
Original
Budget
Monthly
actualYearTD actual
YearTD
budget
YTD
variance
YTD
variance
Full Year
Forecast
R thousands %
EXPENDITURE
Operating expenditure of Transfers and Grants
National Government: 3,609,606 3,875,608 512,097 2,077,641 2,544,990 (467,349) -18.4% 3,869,844
Local Government Equitable Share 1,864,838 2,132,788 – 888,662 1,421,859 (533,197) -37.5% 2,132,788
Fuel Levy 1,440,100 1,444,413 481,471 962,942 962,942 – 1,444,413
Finance Management Grant 2,875 2,650 322 1,975 2,584 (608) -23.5% 2,650
Urban Settlement Development Grant 46,180 48,492 – 48,492 27,000 21,492 79.6% 48,492
Expanded Public Works Programme Incentive (EPWP) 50,247 20,451 – 14,315 14,315 – 20,451
Public Transport Network Operations Grant 199,221 221,049 29,920 158,851 110,526 48,325 43.7%
Integrated City Development Grant 6,145 5,764 383 2,403 5,764 (3,362) -58.3% 221,049
Provincial Government: 198,421 217,173 47,148 147,709 132,749 14,960 11.3% 217,173
Primary Health Care 44,325 46,541 13,963 32,579 32,579 0 0.0% 46,541
Emergency Medical Services 62,850 65,993 46,195 46,195 0 0.0% 65,993
HIV and Aids Grant 12,649 12,720 1,422 8,694 12,720 (4,026) -31.7% 12,720
Housing Top Structure (HSDG) 72,555 90,664 31,690 58,223 40,000 18,223 45.6% 90,664
Sports and Recreation : Community Libraries 5,932 1,255 74 2,019 1,255 764 60.9% 1,255
Gautrans 110 – – – – – –
[insert description] –
Other grant providers: 364,242 152,176 7,904 33,620 79,302 (45,682) -57.6% 152,176
DBSA – 61,000 – – 31,000 (31,000) -100.0% 61,000
Tirelo Bosha Grant - Research and Development 3,900 5,751 628 628 5,751 (5,123) -89.1% 5,751
Housing Company Tshwane 30,629 31,275 2,866 11,004 15,476 (4,472) -28.9% 31,275
TEDA 58,166 54,150 4,410 21,988 27,075 (5,087) -18.8% 54,150
Sandspruit 271,547 – – –
Total operating expenditure of Transfers and Grants: 4,172,269 4,244,957 567,150 2,258,970 2,757,041 (498,071) -18.1% 4,239,193
Capital expenditure of Transfers and Grants
National Government: 2,232,139 2,329,777 264,737 720,106 1,075,849 (355,742) -33.1% 2,329,777
Urban Settlement Development Grant 1,415,652 1,567,923 184,158 407,585 747,713 (340,128) -45.5% 1,567,923
Public Transport Infrastructure & Systems Grant 729,153 679,190 77,577 295,657 305,635 (9,978) -3.3% 679,190
Intergrated National Electrification Programme 39,332 30,000 3,003 16,366 13,500 2,866 21.2% 30,000
Neighbourhood Development Partnership Grant 48,002 20,000 498 9,000 (8,502) -94.5% 20,000
Intergrated City Development Grant – 32,665 – 32,665
Provincial Government: 46,710 114,133 10,951 22,550 36,995 (14,445) -39.0% 114,133
Sport and Recreation: Community Libraries 5,710 9,507 – – 2,995 (2,995) -100.0% 9,507
Social Infrastructure Grant 41,000 34,000 10,951 22,550 34,000 (11,450) -33.7% 34,000
HCT - SHRA – 70,626 – 70,626
Other grant providers: 200 6,000 – – – – 6,000
LG SETA Discretionaty grant (93 appies over 3 years) – 6,000 – – – – 6,000
Smart Connect Grant 200 – – – – – –
Total capital expenditure of Transfers and Grants 2,279,049 2,449,910 275,688 742,656 1,112,843 (370,187) -33.3% 2,449,910
TOTAL EXPENDITURE OF TRANSFERS AND GRANTS 6,451,318 6,694,867 842,838 3,001,626 3,869,884 (868,258) -22.4% 6,689,103
Description Ref
TSH City Of Tshwane - Supporting Table SC7(1) Monthly Budget Statement - transfers and grant expenditure - M06 December

34
(h) Table SC7 (2): Monthly budget statement – expenditure against approved
rollovers
Approved
Rollover 2016/17Monthly actual YearTD actual YTD variance YTD variance
R thousands %
EXPENDITURE
Operating expenditure of Approved Roll-overs
National Government: – – – –
Local Government Equitable Share –
Fuel Levy –
Finance Management Grant –
Water Services Operating Subsidy Grant –
Urban Settlement Development Grant –
Municipal Human Settlement Capacity Grant –
Provincial Government: – – – –
Primary Health Care –
Emergency Medical Services –
HIV and Aids Grant –
Housing Top Structure (HSDG) –
Sports and Recreation : Community Libraries
Gautrans
Reseach and Technology –
District Municipality: – – – –
–
[insert description] –
Other grant providers: – – – –
DBSA –
Tirelo Bosha Grant - Research and Development
Broadband/Wifi
Housing Company Tshwane
TEDA –
Total operating expenditure of Approved Roll-overs – – – –
Capital expenditure of Approved Roll-overs
National Government: – – – –
Urban Settlement Development Grant –
Public Transport Infrastructure & Systems Grant –
Intergrated National Electrification Programme –
Water Affairs –
Neighbourhood Development Partnership Grant –
Finance Management Grant
Energy Efficiency and Demand Side Management
Intergrated City Development Grant –
Provincial Government: – – – –
Sport and Recreation: Community Libraries –
Gautrans
Social Infrastructure Grant
District Municipality: – – – –
–
–
Other grant providers: – – – –
LG SETA Discretionaty grant (93 appies over 3 years) –
Smart Connect Grant –
Total capital expenditure of Approved Roll-overs – – – –
TOTAL EXPENDITURE OF APPROVED ROLL-OVERS – – – –
TSH City Of Tshwane - Supporting Table SC7(2) Monthly Budget Statement - Expenditure against approved rollovers - M06 December
Description Ref
Budget Year 2017/18
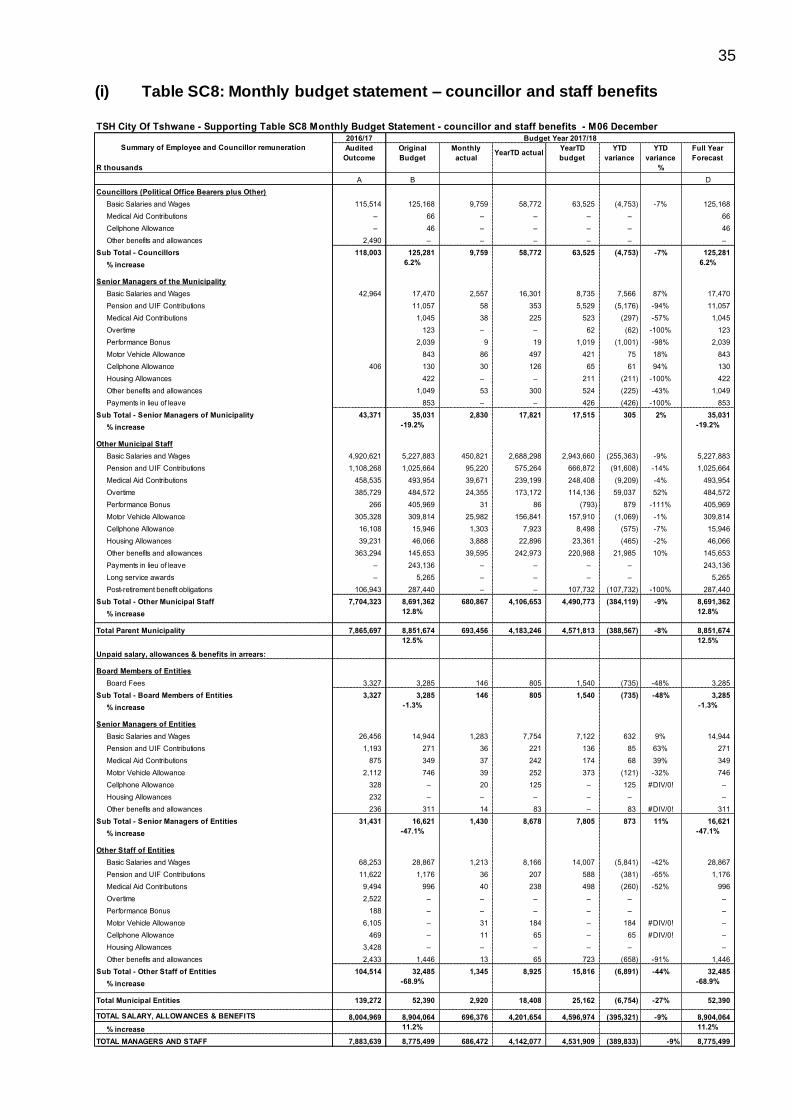
35
(i) Table SC8: Monthly budget statement – councillor and staff benefits
2016/17 Budget Year 2017/18
Audited
Outcome
Original
Budget
Monthly
actualYearTD actual
YearTD
budget
YTD
variance
YTD
variance
Full Year
Forecast
R thousands %
A B D
Councillors (Political Office Bearers plus Other)
Basic Salaries and Wages 115,514 125,168 9,759 58,772 63,525 (4,753) -7% 125,168
Medical Aid Contributions – 66 – – – – 66
Cellphone Allowance – 46 – – – – 46
Other benefits and allowances 2,490 – – – – – –
Sub Total - Councillors 118,003 125,281 9,759 58,772 63,525 (4,753) -7% 125,281
% increase 6.2% 6.2%
Senior Managers of the Municipality
Basic Salaries and Wages 42,964 17,470 2,557 16,301 8,735 7,566 87% 17,470
Pension and UIF Contributions 11,057 58 353 5,529 (5,176) -94% 11,057
Medical Aid Contributions 1,045 38 225 523 (297) -57% 1,045
Overtime 123 – – 62 (62) -100% 123
Performance Bonus 2,039 9 19 1,019 (1,001) -98% 2,039
Motor Vehicle Allowance 843 86 497 421 75 18% 843
Cellphone Allowance 406 130 30 126 65 61 94% 130
Housing Allowances 422 – – 211 (211) -100% 422
Other benefits and allowances 1,049 53 300 524 (225) -43% 1,049
Payments in lieu of leave 853 – – 426 (426) -100% 853
Sub Total - Senior Managers of Municipality 43,371 35,031 2,830 17,821 17,515 305 2% 35,031
% increase -19.2% -19.2%
Other Municipal Staff
Basic Salaries and Wages 4,920,621 5,227,883 450,821 2,688,298 2,943,660 (255,363) -9% 5,227,883
Pension and UIF Contributions 1,108,268 1,025,664 95,220 575,264 666,872 (91,608) -14% 1,025,664
Medical Aid Contributions 458,535 493,954 39,671 239,199 248,408 (9,209) -4% 493,954
Overtime 385,729 484,572 24,355 173,172 114,136 59,037 52% 484,572
Performance Bonus 266 405,969 31 86 (793) 879 -111% 405,969
Motor Vehicle Allowance 305,328 309,814 25,982 156,841 157,910 (1,069) -1% 309,814
Cellphone Allowance 16,108 15,946 1,303 7,923 8,498 (575) -7% 15,946
Housing Allowances 39,231 46,066 3,888 22,896 23,361 (465) -2% 46,066
Other benefits and allowances 363,294 145,653 39,595 242,973 220,988 21,985 10% 145,653
Payments in lieu of leave – 243,136 – – – – 243,136
Long service awards – 5,265 – – – – 5,265
Post-retirement benefit obligations 106,943 287,440 – – 107,732 (107,732) -100% 287,440
Sub Total - Other Municipal Staff 7,704,323 8,691,362 680,867 4,106,653 4,490,773 (384,119) -9% 8,691,362
% increase 12.8% 12.8%
Total Parent Municipality 7,865,697 8,851,674 693,456 4,183,246 4,571,813 (388,567) -8% 8,851,674
12.5% 12.5%
Unpaid salary, allowances & benefits in arrears:
Board Members of Entities
Board Fees 3,327 3,285 146 805 1,540 (735) -48% 3,285
Sub Total - Board Members of Entities 3,327 3,285 146 805 1,540 (735) -48% 3,285
% increase -1.3% -1.3%
Senior Managers of Entities
Basic Salaries and Wages 26,456 14,944 1,283 7,754 7,122 632 9% 14,944
Pension and UIF Contributions 1,193 271 36 221 136 85 63% 271
Medical Aid Contributions 875 349 37 242 174 68 39% 349
Motor Vehicle Allowance 2,112 746 39 252 373 (121) -32% 746
Cellphone Allowance 328 – 20 125 – 125 #DIV/0! –
Housing Allowances 232 – – – – – –
Other benefits and allowances 236 311 14 83 – 83 #DIV/0! 311
Sub Total - Senior Managers of Entities 31,431 16,621 1,430 8,678 7,805 873 11% 16,621
% increase -47.1% -47.1%
Other Staff of Entities
Basic Salaries and Wages 68,253 28,867 1,213 8,166 14,007 (5,841) -42% 28,867
Pension and UIF Contributions 11,622 1,176 36 207 588 (381) -65% 1,176
Medical Aid Contributions 9,494 996 40 238 498 (260) -52% 996
Overtime 2,522 – – – – – –
Performance Bonus 188 – – – – – –
Motor Vehicle Allowance 6,105 – 31 184 – 184 #DIV/0! –
Cellphone Allowance 469 – 11 65 – 65 #DIV/0! –
Housing Allowances 3,428 – – – – – –
Other benefits and allowances 2,433 1,446 13 65 723 (658) -91% 1,446
Sub Total - Other Staff of Entities 104,514 32,485 1,345 8,925 15,816 (6,891) -44% 32,485
% increase -68.9% -68.9%
Total Municipal Entities 139,272 52,390 2,920 18,408 25,162 (6,754) -27% 52,390
TOTAL SALARY, ALLOWANCES & BENEFITS 8,004,969 8,904,064 696,376 4,201,654 4,596,974 (395,321) -9% 8,904,064
% increase 11.2% 11.2%
TOTAL MANAGERS AND STAFF 7,883,639 8,775,499 686,472 4,142,077 4,531,909 (389,833) -9% 8,775,499
Summary of Employee and Councillor remuneration
TSH City Of Tshwane - Supporting Table SC8 Monthly Budget Statement - councillor and staff benefits - M06 December

36
(j) Table SC9: Monthly budget statement – actual and revised targets for cash
receipts
NB. Bulk purchases for water and electricity is budgeted under Other Material as per mSCOA format.
TSH City Of Tshwane - Supporting Table SC9 Monthly Budget Statement - actuals and revised targets for cash receipts - M06 December
Dec December December
R thousands 1 Outcome Actual Variances
Cash Receipts By Source
Property rates 488,310 571,772 83,462 6,188,689 6,621,771 7,085,671
Service charges - electricity revenue 866,937 810,066 (56,871) 10,617,669 11,222,469 11,850,363
Service charges - water revenue 310,083 129,058 (181,025) 3,797,042 4,013,332 4,237,910
Service charges - sanitation revenue 77,690 75,280 (2,410) 933,735 987,044 1,042,410
Service charges - refuse 113,644 139,862 26,218 1,339,981 1,436,887 1,540,960
Service charges - other – 675 675
Rental of facilities and equipment 12,559 9,877 (2,682) 151,864 166,870 182,866
Interest earned - external investments 6,621 6,750 130 79,493 74,609 79,434
Interest earned - outstanding debtors 12,761 52,107 39,346 153,853 115,476 120,064
Fines, penalties and forfeits 27,738 24,081 (3,656) 332,854 349,555 368,570
Licences and permits 4,566 13,476 8,910 54,796 58,484 61,759
Agency services – – – 6,650 22,994 37,440
Transfer receipts - operating 1,197,400 611,780 (585,620) 4,159,532 4,425,895 4,747,475
Other revenue 73,372 41,982 (31,390) 887,079 924,704 977,067
Cash Receipts by Source 3,191,681 2,486,767 (704,914) 28,703,237 30,420,091 32,331,990
Other Cash Flows by Source
Transfer receipts - capital 364,507 7,177 (357,330) 2,443,910 2,160,936 2,301,281
Contributions & Contributed assets 3,761 3,761
Proceeds on disposal of PPE 490 – (490) 5,880 1,242 1,312
Borrowing long term/refinancing 77,042 – (77,042) 1,000,000 1,000,000 1,300,000
Increase in consumer deposits 647 8,024 7,378 7,760 7,915 8,073
Receipt of non-current debtors (8,559) 7,191 15,750 (102,705) (116,398) (130,765)
Receipt of non-current receivables 83 (32,988) (33,071) 993 1,124 1,178
Change in non-current investments (41,687) – 41,687 (500,246) 115,989 (14,758)
Total Cash Receipts by Source 3,584,204 2,479,932 (1,104,272) 31,558,829 33,590,899 35,798,312
Cash Payments by Type
Employee related costs 661,725 686,472 24,747 8,778,772 9,439,307 10,072,202
Remuneration of councillors 10,403 10,511 108 125,281 132,672 140,102
Interest paid 117,893 334,833 216,939 1,417,357 1,199,598 1,145,762
Bulk purchases - Electricity 504,602 534,877 30,275 7,462,684 7,902,983 8,361,356
Other materials 254,226 228,408 (25,818) 3,264,102 3,518,605 3,771,551
Contracted services 196,467 289,845 93,378 2,865,416 2,965,098 3,275,913
Grants and subsidies paid - other 4,159 2,026 (2,132) 49,980 53,438 56,523
General expenses 239,309 331,177 91,869 2,419,932 2,615,805 2,765,096
Cash Payments by Type 1,988,785 2,418,150 429,365 26,383,524 27,827,507 29,588,506
Other Cash Flows/Payments by Type
Capital assets 509,290 305,942 (203,348) 3,863,903 3,748,258 4,363,327
Repayment of borrowing 50,149 – (50,149) 601,794 664,410 701,243
Total Cash Payments by Type 2,548,224 2,724,092 175,868 30,849,221 32,240,176 34,653,076
NET INCREASE/(DECREASE) IN CASH HELD 1,035,980 (244,159) (1,280,139) 709,608 1,350,723 1,145,236
Cash/cash equivalents at the month/year beginning: 483,608 2,285,182 2,041,022 1,907,681 2,617,289 3,968,011
Cash/cash equivalents at the month/year end: 1,519,588 2,041,022 760,883 2,617,289 3,968,011 5,113,247
Budget Year
+1 2018/19
Budget Year
+2 2019/20
Description
Budget Year
2017/18
Ref
Budget
Year
2017/18
2017/18 Medium Term Revenue &
Expenditure Framework

37
(k) Table SC10: Monthly budget statement – parent municipality’s financial
performance (revenue and expenditure)
2016/17 Budget Year 2017/18
Audited
Outcome
Original
Budget
Monthly
actualYearTD actual
YearTD
budgetYTD variance
YTD
variance
Full Year
Forecast
R thousands 1 %
Revenue By Source
Property rates 5,912,861 6,515,154 571,772 3,273,840 3,123,179 150,661 5% 6,515,154
Service charges - electricity revenue 10,800,176 11,178,192 810,829 5,753,343 5,788,049 (34,706) -1% 11,178,192
Service charges - water revenue 3,189,550 3,997,989 128,956 1,673,314 2,042,341 (369,028) -18% 3,997,989
Service charges - sanitation revenue 1,032,486 982,879 75,280 485,169 500,216 (15,047) -3% 982,879
Service charges - refuse revenue 1,275,689 1,410,506 139,876 670,738 701,053 (30,315) -4% 1,410,506
Rental of facilities and equipment 166,327 141,688 9,165 52,793 75,471 (22,678) -30% 141,688
Interest earned - external investments 105,227 79,254 6,805 78,371 39,720 38,651 97% 79,254
Interest earned - outstanding debtors 558,545 466,585 52,095 311,268 236,348 74,920 32% 466,585
Fines, penalties and forfeits 204,354 332,854 24,081 89,375 166,624 (77,249) -46% 332,854
Licences and permits 145,529 54,796 13,476 66,367 71,391 (5,025) -7% 54,796
Transfers and subsidies 3,768,216 4,159,532 537,659 2,128,112 2,707,996 (579,885) -21% 4,159,532
Other revenue 949,152 885,086 44,258 354,938 407,988 (53,051) -13% 885,086
Gains on disposal of PPE 3,571 5,880 – 0 2,940 (2,940) -100% 5,880
Total Revenue (excluding capital transfers and contributions) 28,111,685 30,210,396 2,414,253 14,937,627 15,863,317 (925,691) -6% 30,210,396
Expenditure By Type
Employee related costs 7,898,754 8,726,381 683,697 4,124,474 4,507,991 (383,517) -9% 8,726,381
Remuneration of councillors 118,019 125,281 10,366 59,799 65,102 (5,304) -8% 125,281
Debt impairment 637,816 1,175,973 – 493,289 591,155 (97,866) -17% 1,175,973
Depreciation & asset impairment 1,620,078 1,958,477 138,623 730,943 987,078 (256,136) -26% 1,958,477
Finance charges 1,319,529 1,417,117 334,812 1,006,561 757,081 249,480 33% 1,417,117
Bulk purchases 7,597,154 7,462,684 540,059 4,316,363 4,577,537 (261,174) -6% 7,462,684
Other materials 2,251,765 3,262,121 223,227 1,299,328 1,439,867 (140,538) -10% 3,262,121
Contracted services 2,942,766 2,846,473 297,778 1,302,554 2,051,932 (749,378) -37% 2,846,473
Transfers and subsidies 423,719 135,405 2,026 48,590 66,681 (18,091) -27% 135,405
Other expenditure 2,772,491 2,875,449 203,841 1,308,221 1,694,459 (386,238) -23% 2,875,449
Loss on disposal of PPE 1,138 1 – – 1 (1) -100% 1
Total Expenditure 27,583,230 29,985,363 2,434,429 14,690,120 16,738,883 (2,048,764) -12% 29,985,363 –
Surplus/(Deficit) 528,455 225,033 (20,176) 247,507 (875,566) 1,123,073 (0) 225,033
Transfers and subsidies - capital (monetary allocations)
(National / Provincial and District) 2,407,713 2,373,284 281,529 737,790 1,098,856 (361,066) (0) 2,373,284
Transfers and subsidies - capital (monetary allocations)
(National / Provincial Departmental Agencies, Households, Non-
profit Institutions, Private Enterprises, Public Corporatons, Higher
Educational Institutions) – 6,000 – – – – 6,000
Transfers and subsidies - capital (in-kind - all) 54,397 34,722 – 13,855 16,408 (2,553) (0) 34,722
Surplus/(Deficit) after capital transfers & contributions 2,990,565 2,639,039 261,353 999,152 239,698 2,639,039
Taxation – – – – – – –
Surplus/(Deficit) after taxation 2,990,565 2,639,039 261,353 999,152 239,698 2,639,039
Description Ref
TSH City Of Tshwane - NOT REQUIRED - municipality does not have entities or this is the parent municipality's budget - M06 December

38
(l) Table SC11: Monthly budget statement – summary of municipal entities
(m) Table SC12: Consolidated monthly budget statement – capital expenditure
trend
2016/17
Audited
Outcome
Original
Budget
Monthly
actual
YearTD
actual
YearTD
budget
YTD
variance
YTD
variance
Full Year
Forecast
R thousands %
Revenue By Municipal Entity
Housing Company Tshwane 47,254 41,669 3,601 15,396 20,670 (5,274) -26% 41,669
Tshw ane Economic Dev elopment Agency 61,022 61,013 2,068 22,131 30,507 (8,375) -27% 61,013
Total Operating Revenue 108,276 102,682 5,669 37,527 51,176 (13,649) -27% 102,682
Expenditure By Municipal Entity
Housing Company Tshwane 33,698 38,224 (5,615) 1,795 18,519 (16,724) -90% 38,224
Tshw ane Economic Dev elopment Agency 110,423 60,213 3,920 21,469 30,107 (8,637) -29% 60,213
Total Operating Expenditure 144,121 98,437 (1,696) 23,265 48,626 (25,361) -52% 98,437
Surplus/ (Deficit) for the yr/period (35,844) 4,245 7,364 14,262 2,550 (39,011) -1530% 4,245
Capital Expenditure By Municipal Entity
Housing Company Tshwane 47,600 122,175 29,958 52,745 61,252 (8,508) -14% 122,175
Tshw ane Economic Dev elopment Agency 1,435 300 – – 200 (200) -100% 300
Total Capital Expenditure 49,035 122,475 29,958 52,745 61,452 (8,708) -14% 122,475
Description
TSH City Of Tshwane - NOT REQUIRED - municipality does not have entities or this is the parent municipality's budget - M06 December
Budget Year 2017/18
2016/17
Audited
Outcome
Original
Budget
Adjusted
Budget
Monthly
actualYearTD actual
YearTD
budget
YTD
variance
YTD
variance
% spend of
Original
Budget
R thousands %
Monthly expenditure performance trend
July 124 84,823 (443) (443) 84,823 85,266 100.5% 0%
August 128,494 139,949 61,901 61,458 224,772 163,315 72.7% 2%
September 152,136 255,687 78,006 139,464 480,459 340,995 71.0% 4%
October 352,182 323,383 154,340 293,804 803,842 510,038 63.5% 7%
November 286,123 470,603 254,183 547,987 1,274,444 726,457 57.0% 14%
December 249,294 515,809 305,942 853,929 1,790,253 936,324 52.3% 22%
January 155,969 527,975 2,318,228 –
February 167,945 477,081 2,795,309 –
March 224,096 369,964 3,165,274 –
April 230,602 255,383 3,420,656 –
May 342,099 245,647 3,666,303 –
June 878,364 276,456 3,942,759 –
Total Capital expenditure 3,167,429 3,942,759 – 853,929
Month
TSH City Of Tshwane - Supporting Table SC12 Monthly Budget Statement - capital expenditure trend - M06 DecemberBudget Year 2017/18
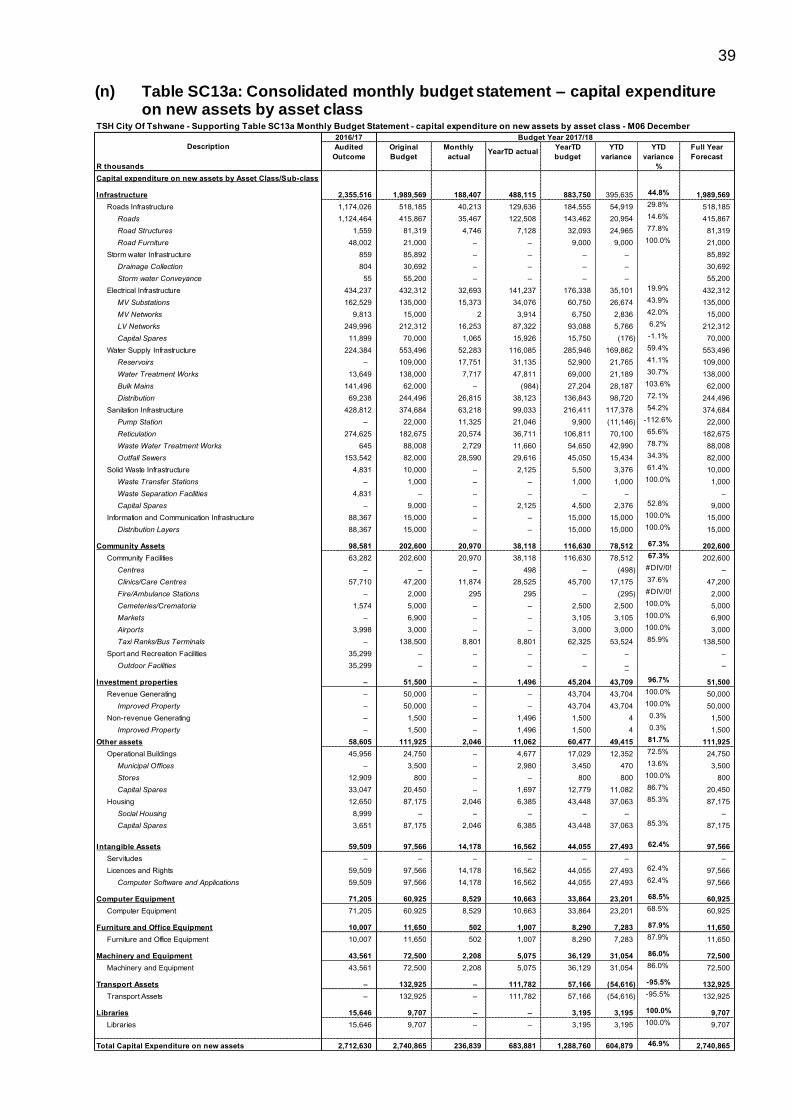
39
(n) Table SC13a: Consolidated monthly budget statement – capital expenditure
on new assets by asset class
2016/17 Budget Year 2017/18
Audited
Outcome
Original
Budget
Monthly
actualYearTD actual
YearTD
budget
YTD
variance
YTD
variance
Full Year
Forecast
R thousands %
Capital expenditure on new assets by Asset Class/Sub-class
Infrastructure 2,355,516 1,989,569 188,407 488,115 883,750 395,635 44.8% 1,989,569
Roads Infrastructure 1,174,026 518,185 40,213 129,636 184,555 54,919 29.8% 518,185
Roads 1,124,464 415,867 35,467 122,508 143,462 20,954 14.6% 415,867
Road Structures 1,559 81,319 4,746 7,128 32,093 24,965 77.8% 81,319
Road Furniture 48,002 21,000 – – 9,000 9,000 100.0% 21,000
Storm water Infrastructure 859 85,892 – – – – 85,892
Drainage Collection 804 30,692 – – – – 30,692
Storm water Conveyance 55 55,200 – – – – 55,200
Electrical Infrastructure 434,237 432,312 32,693 141,237 176,338 35,101 19.9% 432,312
MV Substations 162,529 135,000 15,373 34,076 60,750 26,674 43.9% 135,000
MV Networks 9,813 15,000 2 3,914 6,750 2,836 42.0% 15,000
LV Networks 249,996 212,312 16,253 87,322 93,088 5,766 6.2% 212,312
Capital Spares 11,899 70,000 1,065 15,926 15,750 (176) -1.1% 70,000
Water Supply Infrastructure 224,384 553,496 52,283 116,085 285,946 169,862 59.4% 553,496
Reservoirs – 109,000 17,751 31,135 52,900 21,765 41.1% 109,000
Water Treatment Works 13,649 138,000 7,717 47,811 69,000 21,189 30.7% 138,000
Bulk Mains 141,496 62,000 – (984) 27,204 28,187 103.6% 62,000
Distribution 69,238 244,496 26,815 38,123 136,843 98,720 72.1% 244,496
Sanitation Infrastructure 428,812 374,684 63,218 99,033 216,411 117,378 54.2% 374,684
Pump Station – 22,000 11,325 21,046 9,900 (11,146) -112.6% 22,000
Reticulation 274,625 182,675 20,574 36,711 106,811 70,100 65.6% 182,675
Waste Water Treatment Works 645 88,008 2,729 11,660 54,650 42,990 78.7% 88,008
Outfall Sewers 153,542 82,000 28,590 29,616 45,050 15,434 34.3% 82,000
Solid Waste Infrastructure 4,831 10,000 – 2,125 5,500 3,376 61.4% 10,000
Waste Transfer Stations – 1,000 – – 1,000 1,000 100.0% 1,000
Waste Separation Facilities 4,831 – – – – – –
Capital Spares – 9,000 – 2,125 4,500 2,376 52.8% 9,000
Information and Communication Infrastructure 88,367 15,000 – – 15,000 15,000 100.0% 15,000
Distribution Layers 88,367 15,000 – – 15,000 15,000 100.0% 15,000
Community Assets 98,581 202,600 20,970 38,118 116,630 78,512 67.3% 202,600
Community Facilities 63,282 202,600 20,970 38,118 116,630 78,512 67.3% 202,600
Centres – – – 498 – (498) #DIV/0! –
Clinics/Care Centres 57,710 47,200 11,874 28,525 45,700 17,175 37.6% 47,200
Fire/Ambulance Stations – 2,000 295 295 – (295) #DIV/0! 2,000
Cemeteries/Crematoria 1,574 5,000 – – 2,500 2,500 100.0% 5,000
Markets – 6,900 – – 3,105 3,105 100.0% 6,900
Airports 3,998 3,000 – – 3,000 3,000 100.0% 3,000
Taxi Ranks/Bus Terminals – 138,500 8,801 8,801 62,325 53,524 85.9% 138,500
Sport and Recreation Facilities 35,299 – – – – – –
Outdoor Facilities 35,299 – – – – – – –
Investment properties – 51,500 – 1,496 45,204 43,709 96.7% 51,500
Revenue Generating – 50,000 – – 43,704 43,704 100.0% 50,000
Improved Property – 50,000 – – 43,704 43,704 100.0% 50,000
Non-revenue Generating – 1,500 – 1,496 1,500 4 0.3% 1,500
Improved Property – 1,500 – 1,496 1,500 4 0.3% 1,500
Other assets 58,605 111,925 2,046 11,062 60,477 49,415 81.7% 111,925
Operational Buildings 45,956 24,750 – 4,677 17,029 12,352 72.5% 24,750
Municipal Offices – 3,500 – 2,980 3,450 470 13.6% 3,500
Stores 12,909 800 – – 800 800 100.0% 800
Capital Spares 33,047 20,450 – 1,697 12,779 11,082 86.7% 20,450
Housing 12,650 87,175 2,046 6,385 43,448 37,063 85.3% 87,175
Social Housing 8,999 – – – – – –
Capital Spares 3,651 87,175 2,046 6,385 43,448 37,063 85.3% 87,175
Intangible Assets 59,509 97,566 14,178 16,562 44,055 27,493 62.4% 97,566
Servitudes – – – – – – –
Licences and Rights 59,509 97,566 14,178 16,562 44,055 27,493 62.4% 97,566
Computer Software and Applications 59,509 97,566 14,178 16,562 44,055 27,493 62.4% 97,566
Computer Equipment 71,205 60,925 8,529 10,663 33,864 23,201 68.5% 60,925
Computer Equipment 71,205 60,925 8,529 10,663 33,864 23,201 68.5% 60,925
Furniture and Office Equipment 10,007 11,650 502 1,007 8,290 7,283 87.9% 11,650
Furniture and Office Equipment 10,007 11,650 502 1,007 8,290 7,283 87.9% 11,650
Machinery and Equipment 43,561 72,500 2,208 5,075 36,129 31,054 86.0% 72,500
Machinery and Equipment 43,561 72,500 2,208 5,075 36,129 31,054 86.0% 72,500
Transport Assets – 132,925 – 111,782 57,166 (54,616) -95.5% 132,925
Transport Assets – 132,925 – 111,782 57,166 (54,616) -95.5% 132,925
Libraries 15,646 9,707 – – 3,195 3,195 100.0% 9,707
Libraries 15,646 9,707 – – 3,195 3,195 100.0% 9,707
Total Capital Expenditure on new assets 2,712,630 2,740,865 236,839 683,881 1,288,760 604,879 46.9% 2,740,865
Description
TSH City Of Tshwane - Supporting Table SC13a Monthly Budget Statement - capital expenditure on new assets by asset class - M06 December

40
(o) Table SC13b: Consolidated monthly budget statement – capital expenditure
on renewal of existing assets by asset class
2016/17 Budget Year 2017/18
Audited
Outcome
Original
Budget
Monthly
actualYearTD actual
YearTD
budget
YTD
variance
YTD
variance
Full Year
Forecast
R thousands %
Capital expenditure on renewal of existing assets by Asset Class/Sub-class
Infrastructure 441,867 437,422 33,274 68,517 176,148 107,631 61.1% 437,422
Roads Infrastructure 258,178 293,422 32,642 65,026 132,180 67,155 50.8% 293,422
Roads 229,081 293,422 32,642 65,026 132,180 67,155 50.8% 293,422
Road Structures 29,096 – – – – – –
Electrical Infrastructure 43,588 22,000 121 1,326 9,900 8,574 86.6% 22,000
HV Substations 3,519 – – – – – –
MV Substations – 5,000 – – 2,250 2,250 100.0% 5,000
MV Networks – 5,000 – 490 2,250 1,760 78.2% 5,000
LV Networks 38,984 10,000 121 836 4,500 3,664 81.4% 10,000
Capital Spares 1,085 2,000 – – 900 900 100.0% 2,000
Water Supply Infrastructure 61,614 102,000 510 1,986 34,068 32,082 94.2% 102,000
Bulk Mains 46,898 – – – – – –
Distribution 14,716 102,000 510 1,986 34,068 32,082 94.2% 102,000
Sanitation Infrastructure 62,496 20,000 – 180 – (180) #DIV/0! 20,000
Reticulation – 20,000 – 180 – (180) #DIV/0! 20,000
Waste Water Treatment Works 62,496 – – – – – –
Solid Waste Infrastructure 15,991 – – – – – –
Waste Transfer Stations 15,991 – – – – – –
Community Assets 12,901 39,000 504 6,083 18,020 11,937 66.2% 39,000
Community Facilities 7,493 7,000 504 705 3,500 2,795 79.8% 7,000
Halls 1,590 – – – – – –
Clinics/Care Centres – 2,000 – – 900 900 100.0% 2,000
Fire/Ambulance Stations 5,903 5,000 504 705 2,600 1,895 72.9% 5,000
Sport and Recreation Facilities 5,408 32,000 – 5,377 14,520 9,143 63.0% 32,000
Outdoor Facilities 5,408 32,000 – 5,377 14,520 9,143 63.0% 32,000
Investment properties – 346,000 – – 169,200 169,200 100.0% 346,000
Revenue Generating – 346,000 – – 169,200 169,200 100.0% 346,000
Improved Property – 346,000 – – 169,200 169,200 100.0% 346,000
Other assets 24,586 20,000 – – 14,000 14,000 100.0% 20,000
Operational Buildings 14,658 – – – – – –
Stores 14,658 – – – – – –
Housing 9,929 20,000 – – 14,000 14,000 100.0% 20,000
Social Housing 9,929 20,000 – – 14,000 14,000 100.0% 20,000
Machinery and Equipment 4,298 8,000 – – 2,000 2,000 100.0% 8,000
Machinery and Equipment 4,298 8,000 – – 2,000 2,000 100.0% 8,000
Total Capital Expenditure on renewal of existing assets 483,653 850,422 33,778 74,600 379,368 304,768 80.3% 850,422
TSH City Of Tshwane - Supporting Table SC13b Monthly Budget Statement - capital expenditure on renewal of existing assets by asset class - M06 December
Description

41
(p) Table SC13c: Consolidated monthly budget statement – capital expenditure
on repairs and maintenance by asset class
2016/17 Budget Year 2017/18
Audited
Outcome
Original
Budget
Monthly
actualYearTD actual
YearTD
budget
YTD
variance
YTD
variance
Full Year
Forecast
R thousands %
Repairs and maintenance expenditure by Asset Class/Sub-class
Infrastructure 563,863 706,687 44,619 242,943 641,883 398,940 62.2% 706,687
Roads Infrastructure 74,710 121,332 9,851 30,113 123,191 93,078 75.6% 121,332
Roads 70,223 83,306 8,550 23,676 89,599 65,923 73.6% 83,306
Road Structures – 480 – – 480 480 100.0% 480
Road Furniture 4,487 37,546 1,301 6,438 33,112 26,675 80.6% 37,546
Storm water Infrastructure 16,174 19,407 1,506 5,727 19,563 13,836 70.7% 19,407
Drainage Collection 16,174 10,953 1,506 5,727 19,563 13,836 70.7% 10,953
Storm water Conveyance – 8,454 – – – – 8,454
Electrical Infrastructure 327,442 310,446 18,496 118,248 277,396 159,147 57.4% 310,446
Power Plants 48,084 10,000 246 9,098 5,000 (4,098) -82.0% 10,000
HV Substations 168,722 10,272 1,474 9,662 60,823 51,161 84.1% 10,272
HV Switching Station – 9,870 – – – – 9,870
HV Transmission Conductors – 804 – – – – 804
MV Substations – 45,532 2,382 22,531 39,466 16,935 42.9% 45,532
MV Switching Stations – 18,147 – – 586 586 100.0% 18,147
MV Networks 56,337 115,773 5,283 30,282 69,932 39,651 56.7% 115,773
LV Networks 54,300 100,049 9,112 46,676 101,588 54,912 54.1% 100,049
Water Supply Infrastructure 63,233 127,406 10,220 60,505 121,029 60,524 50.0% 127,406
Reservoirs 14,844 8,786 4,381 15,278 17,770 2,492 14.0% 8,786
Water Treatment Works 3,242 7,350 589 4,527 4,774 247 5.2% 7,350
Bulk Mains – 5,720 7 78 439 361 82.3% 5,720
Distribution 45,147 105,551 5,244 40,622 98,047 57,425 58.6% 105,551
Sanitation Infrastructure 62,721 108,414 4,277 25,265 84,833 59,568 70.2% 108,414
Pump Station 4,239 4,732 489 1,688 7,786 6,099 78.3% 4,732
Reticulation 8,455 11,704 1,199 10,510 24,615 14,104 57.3% 11,704
Waste Water Treatment Works 50,027 86,523 2,589 13,067 52,432 39,365 75.1% 86,523
Outfall Sewers – 5,456 – – – – 5,456
Solid Waste Infrastructure 15,422 14,466 268 2,742 13,691 10,950 80.0% 14,466
Landfill Sites 4,361 8,372 19 2,364 4,856 2,491 51.3% 8,372
Waste Drop-off Points 11,061 5,946 235 351 8,750 8,398 96.0% 5,946
Waste Separation Facilities – 148 14 26 86 60 69.7% 148
Rail Infrastructure 273 242 – – 101 101 100.0% 242
Rail Lines 273 242 – – 101 101 100.0% 242
Information and Communication Infrastructure 3,887 4,973 – 342 2,078 1,736 83.5% 4,973
Core Layers – 2,021 – 74 1,011 937 92.7% 2,021
Distribution Layers 3,887 2,952 – 269 1,068 799 74.8% 2,952
Community Assets 23,196 152,242 11,446 43,290 128,505 85,215 66.3% 152,242
Community Facilities 17,756 124,491 10,304 31,239 103,211 71,971 69.7% 124,491
Halls – 663 – 398 719 321 44.6% 663
Centres – 884 32 46 827 781 94.4% 884
Clinics/Care Centres – 3,936 21 297 3,859 3,562 92.3% 3,936
Fire/Ambulance Stations 11,743 2,984 527 2,223 8,999 6,777 75.3% 2,984
Museums – 432 – 236 432 196 45.3% 432
Galleries – 155 – 21 155 133 86.3% 155
Cemeteries/Crematoria – 11,968 1,146 4,246 12,650 8,404 66.4% 11,968
Police – 4,331 671 1,416 2,554 1,138 44.6% 4,331
Public Open Space – 85,388 7,476 19,853 65,776 45,923 69.8% 85,388
Nature Reserves 6,013 6,726 386 2,617 4,570 1,953 42.7% 6,726
Markets – 5,018 46 (114) 2,432 2,546 104.7% 5,018
Airports – 2,007 – – 238 238 100.0% 2,007
Sport and Recreation Facilities 5,439 27,750 1,142 12,051 25,294 13,243 52.4% 27,750
Indoor Facilities – 133 – 40 133 93 70.1% 133
Outdoor Facilities 5,439 27,617 1,142 12,011 25,161 13,150 52.3% 27,617 –
Investment properties – 6,427 373 1,774 3,214 1,440 44.8% 6,427
Revenue Generating – 6,427 373 1,774 3,214 1,440 44.8% 6,427
Improved Property – 512 – 4 256 252 98.5% 512
Unimproved Property – 5,915 373 1,770 2,958 1,188 40.2% 5,915
Other assets 179,296 68,658 2,552 20,943 54,074 33,131 61.3% 68,658
Operational Buildings 179,248 59,149 2,513 20,731 52,783 32,053 60.7% 59,149
Municipal Offices 177,520 16,050 875 3,040 11,623 8,583 73.8% 16,050
Pay/Enquiry Points – 1,708 – – 15 15 100.0% 1,708
Workshops – 165 – – 82 82 100.0% 165
Manufacturing Plant 1,653 2,694 6 1,114 2,694 1,580 58.6% 2,694
Depots 75 38,532 1,631 16,577 38,369 21,793 56.8% 38,532
Housing 48 9,509 39 212 1,290 1,078 83.6% 9,509
Social Housing 48 9,509 39 212 1,290 1,078 83.6% 9,509
Biological or Cultivated Assets – 332 193 255 962 707 73.5% 332
Biological or Cultivated Assets – 332 193 255 962 707 73.5% 332
Intangible Assets 73,544 62,143 27,210 47,062 42,166 (4,896) -11.6% 62,143
Licences and Rights 73,544 62,143 27,210 47,062 42,166 (4,896) -11.6% 62,143
Computer Software and Applications 73,544 62,143 27,210 47,062 42,166 (4,896) -11.6% 62,143
Computer Equipment 126 16,716 3,227 6,588 9,798 3,209 32.8% 16,716
Computer Equipment 126 16,716 3,227 6,588 9,798 3,209 32.8% 16,716
Furniture and Office Equipment 1,779 2,812 21 615 1,626 1,011 62.2% 2,812
Furniture and Office Equipment 1,779 2,812 21 615 1,626 1,011 62.2% 2,812
Machinery and Equipment 83,379 51,329 4,812 30,156 68,364 38,208 55.9% 51,329
Machinery and Equipment 83,379 51,329 4,812 30,156 68,364 38,208 55.9% 51,329
Transport Assets 136,253 124,100 9,152 53,624 67,879 14,255 21.0% 124,100
Transport Assets 136,253 124,100 9,152 53,624 67,879 14,255 21.0% 124,100
Libraries 32 6,483 320 2,564 5,950 3,386 56.9% 6,483
Libraries 32 6,483 320 2,564 5,950 3,386 56.9% 6,483
Total Repairs and Maintenance Expenditure 1,061,466 1,197,929 103,924 449,815 1,024,420 574,605 56.1% 1,197,929
TSH City Of Tshwane - Supporting Table SC13c Monthly Budget Statement - expenditure on repairs and maintenance by asset class - M06 December
Description

42
(q) Table SC13d: Consolidated monthly budget statement – depreciation by asset
class
2016/17 Budget Year 2017/18
Audited
Outcome
Original
Budget
Monthly
actual
YearTD
actual
YearTD
budget
YTD
variance
Full Year
Forecast
R thousands
Depreciation by Asset Class/Sub-class
Infrastructure 1,407,624 1,378,220 97,472 514,480 694,613 180,134 1,378,220
Roads Infrastructure 236,463 474,552 33,562 177,147 239,171 62,024 474,552
Roads 236,463 403,363 28,527 150,573 203,292 52,720 403,363
Road Structures – 6,701 474 2,501 3,377 876 6,701
Road Furniture – 64,488 4,561 24,073 32,502 8,429 64,488
Storm w ater Infrastructure 117,846 92,315 6,529 34,461 46,526 12,066 92,315
Drainage Collection 117,846 – – – – – –
Storm water Conveyance – 92,315 6,529 34,461 46,526 12,066 92,315
Electrical Infrastructure 533,567 330,273 23,358 123,289 166,455 43,167 330,273
Power Plants (13,422) 5,931 419 2,214 2,989 775 5,931
HV Substations 546,989 57,870 4,093 21,603 29,166 7,564 57,870
HV Switching Station – 10 1 4 5 1 10
HV Transmission Conductors – 15,737 1,113 5,874 7,931 2,057 15,737
MV Substations – 23,936 1,693 8,935 12,064 3,128 23,936
MV Switching Stations – 4,347 307 1,623 2,191 568 4,347
MV Networks – 71,748 5,074 26,783 36,161 9,377 71,748
LV Networks – 150,694 10,658 56,253 75,949 19,696 150,694
Water Supply Infrastructure 439,082 239,666 16,950 89,466 120,790 31,324 239,666
Dams and Weirs (123,876) 975 69 364 491 127 975
Boreholes – 169 12 63 85 22 169
Reservoirs – 29,036 2,054 10,839 14,634 3,795 29,036
Pump Stations – 5,109 361 1,907 2,575 668 5,109
Water Treatment Works – 20,976 1,483 7,830 10,572 2,742 20,976
Bulk Mains – 54,103 3,826 20,196 27,267 7,071 54,103
Distribution 562,958 128,251 9,070 47,875 64,638 16,762 128,251
Distribution Points – 425 30 159 214 56 425
PRV Stations – 622 44 232 313 81 622
Sanitation Infrastructure (323,047) 212,960 15,061 79,496 107,330 27,834 212,960
Pump Station 1,513 2,626 186 980 1,323 343 2,626
Reticulation (324,560) 135,530 9,585 50,592 68,306 17,714 135,530
Waste Water Treatment Works – 42,542 3,009 15,881 21,441 5,560 42,542
Outfall Sewers – 32,263 2,282 12,043 16,260 4,217 32,263
Solid Waste Infrastructure 6,354 13,510 955 5,043 6,809 1,766 13,510
Landfill Sites 6,354 – – – – – –
Waste Processing Facilities – 9,003 637 3,361 4,537 1,177 9,003
Waste Separation Facilities – 4,507 319 1,682 2,272 589 4,507
Rail Infrastructure 22,873 – – – – – –
Rail Lines 22,873 – – – – – –
Information and Communication Infrastructure 374,486 14,943 1,057 5,578 7,531 1,953 14,943
Data Centres 374,486 – – – – – –
Core Layers – 14,943 1,057 5,578 7,531 1,953 14,943
Community Assets (612,925) 207,791 14,696 77,567 104,725 27,158 207,791
Community Facilities 44,750 130,769 9,248 48,815 65,907 17,092 130,769
Halls – 3,089 218 1,153 1,557 404 3,089
Centres – 7,735 547 2,887 3,898 1,011 7,735
Crèches – 961 68 359 485 126 961
Clinics/Care Centres 15,401 9,514 673 3,552 4,795 1,244 9,514
Fire/Ambulance Stations 1,513 7,213 510 2,693 3,636 943 7,213
Testing Stations – 3 0 1 2 0 3
Museums – 687 49 256 346 90 687
Libraries 3,026 – – – – – –
Cemeteries/Crematoria (12,110) 10,083 713 3,764 5,082 1,318 10,083
Police 9,077 537 38 200 271 70 537
Public Open Space – 39,041 2,761 14,574 19,676 5,103 39,041
Public Ablution Facilities 13,169 216 15 80 109 28 216
Markets – 15,550 1,100 5,805 7,837 2,032 15,550
Stalls – 16 1 6 8 2 16
Airports – 20,148 1,425 7,521 10,155 2,633 20,148
Taxi Ranks/Bus Terminals – 15,974 1,130 5,963 8,051 2,088 15,974
Capital Spares 14,675 – – – – – –
Sport and Recreation Facilities (657,674) 77,022 5,447 28,752 38,819 10,067 77,022
Outdoor Facilities (657,674) 77,022 5,447 28,752 38,819 10,067 77,022
Heritage assets – 207,840 14,699 77,585 104,750 27,165 207,840
Monuments – 138 10 52 70 18 138
Historic Buildings – 181,792 12,857 67,862 91,622 23,760 181,792
Works of Art – 25,830 1,827 9,642 13,018 3,376 25,830
Other Heritage – 81 6 30 41 11 81 –
Investment properties 829,588 13,002 920 4,854 6,553 1,699 13,002
Rev enue Generating 829,588 13,002 920 4,854 6,553 1,699 13,002
Improved Property 811,011 13,002 920 4,854 6,553 1,699 13,002
Unimproved Property 18,578 – – – – – –
Other assets (64,235) 14,093 997 5,261 7,103 1,842 14,093
Operational Buildings (82,843) 279 20 104 140 36 279
Municipal Offices – 124 9 46 62 16 124
Training Centres 1,664 – – – – – –
Depots – 155 11 58 78 20 155
Capital Spares (84,507) – – – – – –
Housing 18,608 13,814 977 5,157 6,962 1,806 13,814
Staff Housing 18,608 849 60 317 428 111 849
Social Housing – 12,965 917 4,840 6,534 1,694 12,965
Biological or Cultivated Assets – 28 2 11 14 4 28
Biological or Cultiv ated Assets – 28 2 11 14 4 28
Intangible Assets (222,122) 32,192 2,277 12,017 16,225 4,208 32,192
Serv itudes – 11,466 811 4,280 5,779 1,499 11,466
Licences and Rights (222,122) 20,727 1,466 7,737 10,446 2,709 20,727
Computer Software and Applications (222,122) 20,727 1,466 7,737 10,446 2,709 20,727 – – – – –
Computer Equipment 6,051 36,722 2,597 13,708 18,508 4,800 36,722
Computer Equipment 6,051 36,722 2,597 13,708 18,508 4,800 36,722
Furniture and Office Equipment 279,647 4,795 339 1,790 2,417 627 4,795
Furniture and Office Equipment 279,647 4,795 339 1,790 2,417 627 4,795
Machinery and Equipment 908 21,828 1,544 8,148 11,001 2,853 21,828
Machinery and Equipment 908 21,828 1,544 8,148 11,001 2,853 21,828
Transport Assets – 39,242 2,775 14,649 19,778 5,129 39,242
Transport Assets – 39,242 2,775 14,649 19,778 5,129 39,242
Libraries – 5,547 392 2,071 2,796 725 5,547
Libraries – 5,547 392 2,071 2,796 725 5,547
Total Depreciation 1,624,536 1,961,302 138,709 732,140 988,483 256,343 1,961,302
TSH City Of Tshwane - Supporting Table SC13d Monthly Budget Statement - depreciation by asset class - M06 December
Description

43
(r) Table SC13e: Monthly budget statement – capital expenditure on upgrading of
existing assets by asset class
2016/17 Budget Year 2017/18
Audited
Outcome
Original
Budget
Monthly
actualYearTD actual
YearTD
budget
YTD
variance
YTD
variance
Full Year
Forecast
R thousands %
Capital expenditure on upgrading of existing assets by Asset Class/Sub-class
Infrastructure 14,147 213,541 27,182 55,745 59,044 3,299 5.6% 213,541
Roads Infrastructure – 151,049 27,074 52,465 38,992 (13,473) -34.6% 151,049
Roads – 91,049 26,538 36,603 22,972 (13,631) -59.3% 91,049
Road Structures – 60,000 536 15,862 16,020 158 1.0% 60,000
Storm water Infrastructure – 1,500 – – – – 1,500
Storm water Conveyance – 1,500 – – – – 1,500
Electrical Infrastructure 9,359 9,000 108 3,215 4,050 835 20.6% 9,000
MV Networks – 2,000 85 510 900 390 43.3% 2,000
LV Networks 6,862 7,000 22 2,705 3,150 445 14.1% 7,000
Capital Spares 2,497 – – – – – –
Water Supply Infrastructure – 17,000 – – 1,002 1,002 100.0% 17,000
Water Treatment Works – 15,000 – – 1,002 1,002 100.0% 15,000
Bulk Mains – 2,000 – – – – 2,000
Sanitation Infrastructure – 14,992 – – – – 14,992
Waste Water Treatment Works – 14,992 – – – – 14,992
Solid Waste Infrastructure – 5,000 – 65 5,000 4,935 98.7% 5,000
Waste Drop-off Points – 5,000 – 65 5,000 4,935 98.7% 5,000
Information and Communication Infrastructure 4,788 15,000 – – 10,000 10,000 100.0% 15,000
Distribution Layers 4,788 15,000 – – 10,000 10,000 100.0% 15,000
Community Assets 14,764 71,180 462 (6,272) 32,631 38,903 119.2% 71,180
Community Facilities 14,317 55,180 462 2,178 28,131 25,953 92.3% 55,180
Cemeteries/Crematoria 1,200 – – – – – –
Markets 5,498 2,500 451 441 1,125 684 60.8% 2,500
Airports 6,976 6,000 – 1,728 6,000 4,272 71.2% 6,000
Taxi Ranks/Bus Terminals – 42,180 – – 18,981 18,981 100.0% 42,180
Capital Spares 642 4,500 10 10 2,025 2,015 99.5% 4,500
Sport and Recreation Facilities 447 16,000 – (8,450) 4,500 12,950 287.8% 16,000
Outdoor Facilities 447 16,000 – (8,450) 4,500 12,950 287.8% 16,000
Other assets 7,542 20,750 – 750 9,750 9,000 92.3% 20,750
Operational Buildings 7,542 20,750 – 750 9,750 9,000 92.3% 20,750
Municipal Offices – 10,750 – 750 5,250 4,500 85.7% 10,750
Stores 7,542 10,000 – – 4,500 4,500 100.0% 10,000
Intangible Assets 5,345 4,000 – – 1,800 1,800 100.0% 4,000
Licences and Rights 5,345 4,000 – – 1,800 1,800 100.0% 4,000
Computer Software and Applications 5,345 4,000 – – 1,800 1,800 100.0% 4,000
Machinery and Equipment – 5,000 – – 2,250 2,250 100.0% 5,000
Machinery and Equipment – 5,000 – – 2,250 2,250 100.0% 5,000
Transport Assets – 37,000 7,681 45,225 16,650 (28,575) -171.6% 37,000
Transport Assets – 37,000 7,681 45,225 16,650 (28,575) -171.6% 37,000
Total Capital Expenditure on upgrading of existing assets 41,798 351,471 35,325 95,448 122,125 26,677 21.8% 351,471
TSH City Of Tshwane - Supporting Table SC13e Monthly Budget Statement - capital expenditure on upgrading of existing assets by asset class - M06 December
Description

44
(s) Municipal Manager’s quality certification
QUALITY CERTIFICATE
I, MOEKETSI MOSOLA, the City Manager of the City of Tshwane, hereby certify that
the monthly budget statement
for December 2017 has been prepared in accordance with the Municipal Finance
Management Act and regulations made under this act.
Dr Moeketsi Mosola
CITY MANAGER OF THE CITY OF TSHWANE
Signature: ______________________________________
Date: ______________________________________