f) · f)_ i ) rdtr no. 14z ii effect of sample holder geometry on pressure-time curves of lead...
TRANSCRIPT

F)_
I ) RDTR No. 14Z
II EFFECT OF SAMPLE HOLDER
GEOMETRY ON PRESSURE-TIMECURVES OF LEAD DIOXIDE--
CUPRIC OXIDE-SILICON STARTERCOMPOSITION: A NEW TEST
FIXTURE DESIGN
B', WILLIAM RIPLEYLKaI
JUL 17 1969
eRprnd ced by ,beCLEARIb'5HGUSE
for F'-deraI Sct zt~fc & Techn-,alInformation Sprisqf i,' Va 22151
Th~~~gie te acrog

U. S. NAVAL AN94UNITION DEPOTCrane, Indiana 47522
RDTR No. 142
EFFECT OF SAMPLE HOLDER GEOMETRY ONPRESSURE-TIME CURVES OF LEAD DIOXIDE-CUPRIC
OXIDE-SILICON STARTER COMPOSITION:A NEW TEST FIXTURE DESIGN
by
WILLIAM RIPLEY
"This report was reviewed for adequacy and technical accuracy byDuane M. Johnson
Released
SM .Fasig, DiretorResearch and Deveilopment Departmeiat
RDTR No. 142
TABLE OF CONTENTS
Page
Abstract - ------------------------ iii
I. Background -- - ------------------ 1
if. Variaticns in the Pressure-Time Curve----------2
III. Reproducibility of Results ...-.-.-.- ----------.. 4
IV. Design of a New Test Fixture ...-.-.-.-.- -----.-- 4
V. Discussion of Results ........-.....-.--- --------- 5
V1. Conclusion -. - . . . . .- . .- . .- . .- . .- . .- . .- . .- 8
VII. Future Plans --------------------------------- 11
Literature Cited - ----------------------------------- 13
Appendix I ------------------------------------------ 14
Table I. Reproducibility of Performance CharacteristicsBased on Present Test Fixture of 2-3-5 Starter Compositions Madewith 4.3p Silicon (Hummel), 6.Ou Cupric Oxide (Glidden), andLead Dioxide from Four Suppliers (A, B, C, D)
Table II. Performance Characteristics Based on PresentTest Fixture of 2-3-5 Starter Composition Made with 4.3p Silicon(Hummel), 6.Oj1 Cupric Oxide (Glidden), and Lead Dioxide fromVarious Suppliers (A, B, C, D, E, F, G)
Table III. Performance Characteristics Based on NewDesign Test Fixture of 2-3-S Starter Composition Made with4.3u Silicon (Humnmel), 6.Ou Cupric Oxide (Glidden), and LeadDioxide from Various Suppliers (A, B, C, D, E, F, G)
Table IV. Reproducibility of Performancz CharacteristicsBasid on New Design Test Fixture of 2-3-5 Starter Composition
Made with 4.3u Silicon (Hummel), 6.Ou Cupric Oxide (Gliddel,),and Lead Dioxide from Various Suppliers (A, B, C, D)
Table V. Ratio of Square of Standard Deviation Varianceson Burning Characteristics of 2-3-5 Starter Composition. Madewith Four Specimens of Lead Dioxide
Table VI. Comoarison of Burning Characteristics of 2-3-SStarter Composition Made with Eight Different Lead DioxideSpecimens

RDTR No. 142
Table VII. Effects of Formula Changes on the PerformanceCharacteristics of the Lead Dioxide--Cupric Oxide--Silicon Family
Figure I. Sample Holder Used in Present Pressure Test
Fixture
Figure 2. Sample Holder Used in New Pressure Test Fixture
Figure 3. Variations in Successive Runs on 2-3-5 StarterComposition in Present Pressure Test Fixture
Figure 4. Variations in Successive Runs on 2-3-5 StarterComposition in Present Pressure Test Fixture
Figure 5. Present Test Fixture
Figure 6. New Test Fixture
Figure 7. Electronic Components for New ?ressure Test Fixture
Figure 8. Strain Gauge Control Unit
Figure 9. Pressure-time Curves of 2-3-5 Starter CompositionMade with Different Lead Dioxide Specimens Using New Test Fixture
Figure 10. Pressure-time Curves of 2-3-5 Starter CompocitionMade with Different Lead Dioxide Specimens Using Present TestFixture
Figure 11. Effect of Gas Producing Impurities in Silicon onPressure-time Curve of 2-3-5 Starter Composition Using PresentTest Fixture
Figure 12. Effect of Gas Producing Impurities in Silicon onPressure-time Curve of 2-3-5 Starter Composition Using New TestFixture
ii
RDTR No. 142
ABSTRACT
Difficulties in interpreting pressure-time curve data
obtained on the present test fixture (Mk 25 Marine Location 1:07ker
Starter Composition) has led to the design of a new test fixture
with a sample geometry which produces a linear plot. A comperison
of results obtained on the two test fixtures is made. An optimum
range of burning characteristics for the new test fixture is
recommended. Also recommended is a basic starter composition
formula with enough flexibility to compensate for performance
variations due to variations in the reactivity of the chemical
ingredients.!I
iii
RDTR No. 142
EFFECT OF SAMPLE HOLDER GEOMETRY ONPRESSURE-TIME CURVES OF LEAD DIOXIDE-CUPRIC OXIDE-SILICON
STARTER COMPOSITION, A NEW TEST FIXTURE DESIGN
I. Background
a. A study of the burning characteristics of the lead dioxide-
cupric oxide-silicon starter composition used in the Mk 25 Marine
Location Marker was published in March 3964.1 The study utilized
pressure-time curves to determine the burning rate--as well as
other burning characteristics--of a family of starter mix
compositions in which the ratio of the three components were
systematically varied. During this study it ; s also demonstrated
that variations in the components themselves could lead to signifi-
cant variations in the performance of the starter composition.
b. Continuing difficulties with the performance of the starter
composition led to a study of the relationship between the
properties and the reactivity of lead dioxide specimens obtained
from various suppliers. The results of this study, published as
RDTR No. 114 in June of 1968 , confirmed large variations in the
r*activity of the various lead dioxide specimens, variations which
also affected the performance of the starter composition. When no
clear-cut correlations could be found between various chemical and
physical properties of the lead dioxide specimens and the performance
of the specimens in starter compositions as indicated by pressure-
time curves, it was decided to re-examine the pressure-time curve
test. This decision was also based on the experience tihat the
significance of press ime-time curve data is often difficult to
I-MRDTR No. 142
assess, that the extracticn of the data is somewhat azbitrary,
and that the relationship between different properties of the
pressure-time curve---i.e., the slope of the curve, the maximum
pressure, and the time to the peak--is noý well-enough understood
to be mathematically interpreted.
If. Variations in the Pressure-time Curve
a. Obviously, the shape of the pressure-time curve is determined
by many factors. It is felt that fundamentally, in terms of
burring characteristics, the pressure-time curve depends on the rate
of heat evolution and heat loss and the rate of gas evolution apd
zondensation. However, the shape of the pressure-time curve also
depends upon experimental factors such as the geometrical shape of
the sample holder.
b. Originally, the size and shape of the snaple holder wai
based on the size and shape of the phenolic cup which held the
starter composition in the Mk 25 Marine Location Marker: i.e., a
cylindrical cavity 0.875 inches in height by 1.50 inches in diameter.
The objective was, of course, to make the test condition a
facsimile of the actual condition, although aluminum was used
instead of plastic. The problem with this choice of geometry of
the burning charge is that it involve3 a constantly changing flame-
front and consequently generates a complex curve which is difficult
to interprcet. For the purposes of analysis and cniparison a
flame front which quickly reaches steady-state and prozeeds
accordingiy would generate ideally a linear slope. Variations from
2
RDTR No. 142
this linear slope due to non-homcgeneityof the sample or uneven
packing could be easily interpreted and corrected by reblending
or retesting; whereas, basic differences in the burning characteristics
of the composition would show approximate linearity but a different
slope. Thus, a sample holder such as Figure 1 is similar in
geometry to the actual plastic holder in the signal, but it is
difficult to interpret the significance of variations in the
pressure-time curve; while a sample holder such as Figure 2 is not
similar in geometry to the actual plastic holder in the signal;
it furnishes a pressure-time curve that is easy to interpret and
to compare with other pressure-time curves. From thi± standpoint,
it is preferable.
c. The difficulty of interpreting variations in pressure-time
curves is indicated by Figures 3a and 3b. These are pressure-time
curves obtained successively on the same Mk 25 starter composition.
Similarly, Figures 4a and 4b show pressure-time curves of another
starter composition. Both sets of figures were obtained on the
present test fixture, Figure 5, which is located in the Quality
Evaluation Laboratory in Building 2044. The significance and
cause of such variations are often impossible to explain under
prevailing conditions. Do they indicate differencesin the starter
mix or differences in the experimental conditions? We are not
certain.
3
RDTR No. 142
1II. Reproducibility of Results
a. Besides interpretability, reproducibility of results is
another important factor in evaluating the significance of pressure-
tibe curves. Consequently, in December of 1968 and January of
1969 a series of tests were performed in the Quality Evaluation
Laboratory to evaluate the reproducibility of results obtained on
the present test fixture. The results of these tests are shown
in Table I. Samples of 2-3-5 starter composition were prepazed
using 4.3p silicon from Hummel Chemical Company, 6 .0. cupric
oxide from Glidden, and lead dioxide from four suppliers. Three
series of tests were run on each of the samples. The tests were
about two weeks apart. Performance characteristics for 2-3-5
starter composition made from seven lead dioxide samples from five
suppliers are shown in Table II.
IV. Design of a New Test Fixture
a. During the last weeks of 1968 a new pressure test fixture
was designed and fabricated, Figures 6-8. The essential differences
in the new test fixture are the shape and size of the vessel
cavity, and the sample holder. The sample holder is a nickel
boat (Fisher 7-647) 3" long by 0.73" wide by 0.50" deep which
weighs approximately 28 grams. The volume of the vessel is
approximately 118 ml . The sample holder is loaded with 1Sg of
2-3-5 starter composiLion and ignited with a hot wire which is
attached to the screw that connects the sample holder to the lid of
the bomb so that ignition conditions are highly reproducible.
I
&XM&KZ SIG. &.T46
Performance characteristics for 2-3-5 starter compositiors maz
from the seven lead dioxide specimens under investigation are
shown in Table III for the new test fixture. Reproducibility of
performance characteristics of four of these specimens is shown
in Table IV.
V. Discussion of Results
a. Data obtained on reproducibility of results shown in
Tables I and IV for the present and the new test fixtures are
statistically evaluated. The ratio of the pooled variances (the
F test) is shown in Table V for the peak pressure, time to Pmax,
angle of slope, and tan. of the slope. Since F 0 1 (40, 40) = 2.11,
the F valves are significant for each of these characteristics.
In general, the data shows that results for the peak pressure is
slightly more reproducible for the present test fixture, while
the time to Pmax, angle of slope. and tangent of slope are
considerably more reproducible for the new test fixture.
b. Difficulties of interpreting pressure-time curves obtained
on the present test fixture have already been suggested. Again,
these difficulties arise from the condition that a constant
changing flame front generates a complex curve which is difficult
to interpret and which involves the subjective judgment of the
technician (e.g., in drawing the tangent to the slope of the curve).
The sample geometry of the new test fixture, on the other hand,
allows the burning front through the sample to immediately come to
steady-state, so that basically the resulting pressure-time curve

IRDTR No. 142
is a linear tunction. Pressure-time curves for 2-Z-5 starter
composition made with seven lead dioxide specimens under study
are shown in Figures 9 a-9 g for the new test fixture and i - Figures
lOa.Vg for the present test fixture. Conditions which cause
non-linear burning, such as uneven packing or non-homogeneity of the
sample, can be readily observed in pressure-,:ime curves obtained
on the new test fixture. With the complex curve obtained. o:i the
present tst fixture, such distinctions are not readily drawn.
Nor can i'. be determined whethe: or not ignition has occurred in
the center of the sample.
c. Generally, the data from both test fixtures are in
agreement on the burning rates of the various starter compositions
studied, Table VI. In either case, starter composition made with
Baker lead dioxide has the fastest burnizg rate and compositions
made from Allied lead dioxide and Eagle-Picher 0.32p lead dioxide
have the slowest burning rates. All the others fall in about the
same ordLr between these extremes. In bunting times, Baker
composition is the shortest on the present test fixture while
PepcL.n and Baker are the shortest on the nei test fixture. Eagle-
Picher 0.32p and Allied are the longest on both test fixtures.
Pressures obtained on both fixtures are comparable. There is of
course less dramatic difference in the peak pressure for the new
test fixture because the burning times aie slower due to the
geometry of the sample. However, this effect which influences
peak pressure in the present Lest fixture influences the slope in
6
RDTR No. :42
the new test fixtures. Unusual effects such as the presence of
gas producing impurities in the silicon are equally obvious using
either test fixture, as can be seen in Figures]l and 12 .
d. In the original work done on the present test fixture in
1963, 'Lurning characteristics limits were proposed as follows:
(1) Burning vote, 0 S° - 680
(2) Maximum pressure, Pmax 6.75 - ý.65 psi
(3) Reaction time, tPmax 6.1 - 7.9 secs
These values were empirically derived from experience based
on the burning characteristics of a larger number of different samples
over many months. However, as time passed variations in performance
of the composition brought about a relaxation of the above
requirements, particularly on the high side. For example, the
results in Table VI obtained on the present bomb show five of the
seven angles above 680. Two of the Pmax values are above the
original requirements and all of the burning times are too fast.
In general, these compositions appear to be much more reactive
than vere the typical 1963 compositions shown in Table XV of
RDTR No. 41, from which the original requirements were derived.
The reasons for this change ae not precisely kno,.n but it is the
r.ther usual sorZ of thing that happens to pyrotechnic compositions.
e. The following range of burning characteristics for pressure-
time curves obtained on the new test fixture are based on the
burning characteristics required on the present test fixture:
7
RDTR No. 142
(1) burning vote, 0 45 - 560
(2) Maximum Pressure, Pmax 9.5 - 12 psi
(3) Burning time, tPmax 10 - 16 secs
f. However, the real problem is not selecting some arbitrary
range for the optimum performance characteristics of the pressure-
time curves. Experience ultimately dictates this. The real
problem is continual variations in the performance of the composi-
tions due to variations in the properties and behavior of the
ingredients used. Present specifications cannot assure ingredients
such as lead dioxide or silicon that have consistent and
reproducible (predictable) burning properties. If this is true,
then what is needed is to establish optimum performuance requirements
based on the pressure-time curve and to establish a formula range
sufficiently broad to enable the performance requirencts to be
met even using ingredients which have varying reactivities.
Vg. Conclusion
a. Argumeni3 have been presented for adopting a pressure test
fixture which utilizes a sample geometry that burns at a steady
state and develops a linear slIpe:
l.. Samples with a large cylindrical geometry burn with an
increasing and then decreasing flame front that generates a
complex pressure-time curve. Such a carve is difficult to interpret
and the relationship between different properties of the curve such
as peak pressure, slope, and time to peak is obscure. Moreuver.
values for these properties are often difficult to ascertain o
8

RDTR No. 142
involve degrees of subjective judgment. On the other hand, a
sample geometry that burns to generate a basically linear slope
is simple and easy to .nterpret. Factors such as poor mixing or
uneven packing cause non-linearity and can easily be distinguished.
2. Values for the properties of the linear slope are
easier to measure, less subjective, and more reproduciole.
3. The linear pressure-time curve can be directly compared
as to burning rate with burning in the open which can be visually
observed and timed. This ran be •ised as a check on instrumentation
and a verification of unusual performance.
b. Furthermore, it is recommended that th. optimum range cf
burning characteristics obtained on the new test fixture should be
as follows (for 2-3-5 starter composition)!
1. Burning rate, e 4S-S-6
2. Maximum Pressure, Pmax 9.5-12.5 psi
3. Burning time, tPmax 10-16 secs
c. It is also recommended that a flexible formula such as
the following be adoptel for the 2-3-5 starter Lomposition:
Ingredient % by Weight
Lead dioxide 20% t 10%Cupric oxide 30% ± 10%Silicon 50% ± Is%
d. The effects of formula changes on the performance
characteristics of this family have already been reported in
RDTR No. 41. According to these findings the relationship between
the formula and the burning characteristics in a typical composition
9
can be seen in Table VII. Changes can be of two types. Either the
oxidizer-fuel ratio can be held constant and the ratio of lead
dioxide-cupric oxide varied, or the ratio of lead dioxide to
cupric oxide can be held constant and the fuel-oxidizer ratio varied.
It may be noted in Table VII that the 10-40-50 mix has almost
exactly the same burning characteristics as the 16-24-60 mix.
e. This data indicates that we can slow down the burning
characteristics of a 2-3-5 starter mix by either increasing the
silicon content, which d--reasesthe calorific output, or by
increasing the cupric oxide-lead dioxide ratio, which increases the
calorific output, or by a combination of both changes. Data
from Table VI on the starter mix made with Baker lead dioxide
indicates that the composition is burning too fast, with an angle
of 84.70 ani a burning time of 2.5 sec. How can we s!ow this
composition down so that it fits our burning requirements without
significantly decreasing the heat of reaction? An increase in
silicon will slow it dotn and decrease its calorific value, and
an increase in the cupric oxide-lead dioxide ratio will slow it
down but increase the calorific value. Thus, a formula consisting
of 17% lead dioxide, 38% cupric oxide, and 55% silicon should burn
slower at a lower maximum presrure and yet the heat of reaction
should remain about the same, i.e. 352.1 cal/g theoretical.
Similarly, data from Table VI on the starter mix made with Eagle-
Picher Grade 95 lead dioxide indicates that the composition is
burning too slowly, with an angle of 41W and a burning time of
10
I
RDTR No. 142
10.5 secs. Here we wish to increase the burning rate without s ig-
nificantly changing the calorific value or the maximum pressure.
A formula consisting of 30% lead dioxide, 20% cupric oxide, and
50% silicon should burn more rapidly, with a slight decrease in
calorific value and no significant increase in the maximum
pressure. Actually, these new formulas were burned in the present
test fixture. The starter mix made with Baker lead dioxide had
a 0 angle of 750, a maximum pressure of 8.8 psi, and a burn time
of 5.35 seconds. The starter mix made with Eagle-Picher Grade 95
lead dioxide had a 0 angle of 76.50, a maximum pressure of 8,4 psi,
and a burn time of 4.8 seconds. On the new test fixture the Baker
mix had a 0 of 50.40, a pressure of 10.4 psi, and a time of 13.1
seconds. The Eagie-Picher 95 mix had a e of 54.5%, a Pmax of
10.4 psi, and a burn time of 11.3 seconds. Results on the present
test fixture, while similar to the other mixes tested, are still
slightly higher than the original specification requirements. A
new Baker blend of 15-28-57 gave a e value of 460, Pmax 10.5 psi,
and time 15 seconds. A new Eagle-Picher 95 blend of 25-20-55
gave a 0 value of 470, Pmax 10.7 psi, and burn time 15.0 seconds.
VII. Future Plans
a. While trends are shown in Table VII which enable one to
alter the oxidizer-fuel ratio or the lead dioxide-cupric oxide
ratio so as to correct the burning characteristics of a 2-3-5
starter composition which does not meet the specification
requirements, further study of these phenomena should yield a
11

L RDTR No. 142
more precise method of arriving at the proper formula change.
b. Study of the 6-6-8 starter composition will be initiated
with an objective of determining optimum burning characteristics
and procedures for altering the basic formula in order to correct
the burning characteristics of compositions that fall outside the
established requirements.
12
LITERATURE CITED
1. Ripley, William, RDTR No. 41, Investigation of the BurningCharacteristics of the Lead Dioxide-CupricOxide.-Silicon Starter Composition, U. S.Naval Ammunition Depot, Crane, Indiana,26 March 1964.
2. Ripley, William, and Lipscomb, Charles, RDTR No. 114, APreliminary Investigationof the Reactivity of LeadDioxide, U. S. NavalAmmunition Depot, Crane,Indiana, 13 June 1968.
13
RCTR 142
APPENDIX I
14

nn-rn Ikj- IA.oj
TABLE I. Reproducibility of Performance Characteristics Based onPresent Test Fixture of 2-3-5 Ste-ter Compositions Made With 4.3pSilicon (Hummel), 6.O0. Cupric Oxide (Glidden), and Lead DioxideFrom Four Suppliers.
A. Lead Dioxide from J. T. Baker, Technical Powder, N.edium Cure2352
PEAK PRESSURE TIME TO ANGLE OF TAN OFPmax, Psi Pmax, Secs SLOPE, ° SLOPE
Series 1tun #1 11.8 2.0 84 9.59un #2 10.3 2.6 79 5.15un #3 10.8 2.1 84 9.59un #4 11.1 2.6 82 7.13lun #5 10.4 3.2 81.5 6.69
Series 2Run #1 11 2.8 80 5.67Run #2 11 2.4 82 7.13Run #3 10.4 2.6 81 6.32
eries 3Run #1 10.S 4.8 82 7.13Run #2 10.6 2.8 84 9.59Run #3 10.6 4.3 78 4.71
_" 10.77 2.93 81.59 7.15
_.44 .87 2.01 1.76
is
IRDTR No. 142
B. Lead Dioxide from Eagle-Picher o.S2, Pack 2-w-294 G/O #00290
PEAK PRESSURE TIME TO ANGLE OF TAN OF
_ . Pmax, Psi Pmax, Secs SLOPE, ° SLOPE
Series 1
un #1 9.85 3.2 7S.5 0 3.87un #2 9.45 3.5 74.5 3.60un #3 9.95 3.0 77.5 4.53un #4 9.7 3.8 77.0 4.34Ru #S 9.8 4.4 75.0 3.74
Series 2Run #1 9.5 3.2 78.0 4.71Run #2 10.1 3.1 77.0 4.34Run #3 9.5 3.9 77.0 4.34
Serics 3Run #1 1C.S 3.4 70 2.74Run #2 10.25 2.6 77 4.34
Rn #3 10.0 5.8 78 4.71
S9.87 3.63 76.05 4.11
_.11 .87 2.32 .59
•4
[ PIlDiR No. 142
C. Lead Dioxide from Pepcon, Pacific Engineering and ProductionCompany
PEAK PRESSURE TIME TO ANGLE OF TAN OFPmax, Psi Pmax, Secs SLOPE, 0 SLOPE
Series 1Run #1 7.95 4.0 74 3.48Run #2 8.15 3.4 72 3.08Run #3 8.2 3.0 77 4.34Run #4 8.15 3.8 78.5 4.92Run #S 8.2 2.8 75.S 3.87
Series 2Run #1 8.2 2.6 75 3.74Run #2 8,2 2.5 77 4.34Run #3 8.3 3.9 75 3.74
Series 3Run #1 8.75 2.5 78 4.71Run #2 8.25 4.5 74 3.48Run #3 8.5 3.2 74 3.48
_8.26 3.29 75.45 3.93
a .21 .68 1.98 .58
17
S PE TR No. 142
D. Lead Dioxide from Shepherd Chemical Company, Dense, GovernmentSpec-fic~ation, Lot 5337
PEAK PRESSURE TIME TO ANGLE OF TAN OF-P max, Psi lmax, Secs SLOPEo SLOPE
Series 1Run #1 7.8 S.o 64 2.05Run #2 8.1 3.2 75 3.74Run #3 8.15 4.0 69 2.68Run #4 8., 3.5 72 3.08Run F5 8.1 3.2 78 4.71
Series 2Run #1 8.3 3.2 72 3.08Run #2 8.0 6.4 70 2.74-"*" ~' 8.1 3.0 73 3.27
Series 3Run #1, 7.25 6.4 59 1.66Run #2 7.25 6.0 73 3.27Run #3 8.2.; 5.5 75 3.74
X 7.96 4.5B 70.91 3.09
_ .38 1.42 5.38 .83
18
IRDTR No. 142
TABLE II. Performance Characteristics Based on Present TestFixture of 2-3-5 Starter Composition Made With 4.3v Silicon(Humnmel), 6.011 Cupric Oxide (Glidden), and Lead Dioxide fromVarious Suppliers.
A. Lead Dioxide from Allied Chemical, B&A, ACS Reagent Powder,Code 1843
PEAK PRESSURE TIME TO ANGLE OF TAN OF_Pmax, Fsi Pmax, Secs SLOPE, SLOPE
Run #1 8.1 4.6 66.5 2.29Run #2 8.1 6.1 52.5 1.32Run #3 7.9 6.1 55.5 1.45Run #4 8.2 5.9 56.5 1.59Run #5 8.1 4.9 67.0 2.35
8.08 5.52 59.60 1.80.11 .72 6.67 .48
B. Lead Dioxide from J. T. Baker, Technical Powder, Medium Cure,2352
Run #1 11.8 2.0 84.0 9.59Run #2 10.3 2.6 79.0 5.15Run #3 10.8 2.1 84.0 9.59Run #4 il.l 2.6 87.0 7.13Run #5 10.4 3.2 89.5 6.69X10.88 2.50 84.70 7.63
61 .48 3.93 1.93
C. Lead Dioxide Prom Eagle-Picher 0.32 Pack 2-w-378 G/O #00290
Iun #1 9.1 5.5 65.5Run #2 t 9.6 5.1 65.0
un #3 919 6.8 58.5un #4 9.3 7.5 57.0up #5 9.65 5.4 63.0
9.51 6.06 61.80.31 1.04 3.85
19

RDTR No. 142
b. Lead Dioxide from Eagle-Picher 0.52 Pack #2-w-394 G/O #00290
PEAK PRESSURE TIME TO ANGLE OF TAN OFPmax, Psi Pmax, Secs SLOPE, 0 SLOPE
Run #1 9.1 5.5 6S.5Run #2 9.6 5.1 65.0Run #3 9.9 6.8 58.5Run #4 9.3 7.5 57.0Run #5 9.65 5.4 63.0
9.51 6.06 61.80.31 1.04 3.35
E. Lead Dioxide from Eagle-Picher .66 Pack #2-w-286 G/O #00290
Run #1 8.9 3.0 76Run #2 7.97 2.8 78.5Run #3 9.1 4.0 76Run #4 9.7 2.8 80un #5 9.75 3.4 73
9.08 3.20 76.7____.72 .51 2. 6 8
F. Leid Dioxide from Pacific Engineering Production Company
hun #1 7.95 4.0 74
un #2 8.15 3.4 72un #3 8.2 3.0 77un #4 8.15 3.8 78.5un #5 8.2 2.8 75.5
8.13 3.4 75.41.10 .51 2.53
20

[ RDTR No. 142
G. Shepherd Chemical Company, Dense, Government SpecificationLot S337
PEAK PRESSURE TIME TO ANGLE OF TAN OFPmax, Psi Pmax, Secs SLOPE, 0 SLOPE
Run #1 7.8 5.6 64Run #2 8.1 3.2 75Run #3 8.15 4.0 69Run #4 8.3 3.5 72Run #5 8.1 3.2 78X 8.09 3.90 71.600 .18 1.005 5.41
21
RDTR No. 142
TABLE 1II. Performance Characteristics Based on New Design Test
Fixture of 2-3-5 Starter Composition Made with 4.3p Silicon(Hummel), 6.Ou Cupric Oxide (Glidden), and Lead Dioxide fromVarious Suppliers.
A. Lead Dioxide from Allied Chemical, B&A, ACS Reagent Powder,Code 1843
PEAK PRESSURE TIME TO ANGLE OF TAN OF OPEN BURNING RATEPmax, Psi Pmax, Secs SLOPE, SLOPE Secs/3ipches
Run #1 11.0 17.2 43.70 0.96 15.8Run #2 11.5 15.4 48.3 1.12 15.9Run #3 10.4 15.4 45.4 1.01 16.7Run #4 l0.6 15.4 45.9 1.03 15.9Run #5 10.6 15.0 46.7 1.06 16.1
S10.82 15.68 45.92 1.036 16.08.44 .87 1.71 .059 .36
B. Lead Dioxide from J. T. Baker, Technical Powder, Medium Cure,2352
Run #1 12.1 11.2 59.2" 1.68 13.6Run #2 12.5 11.2 59.0 1.67 13.7Run #3 12.75 11.2 59.8 1.72 13.6Run #4 12.6 11.6 58.3 1.62 12.9Run #5 12.6 11.2 59.2 1.68 13.5i 12.51 11.28 59.1 1.674 13.46a .25 .18 .54 .036 .32
C. Lead Dioxide from Eagle Picher 0.32 Pack #2-w-378 G/O #00290
Run #1 12.5 19.1 44.4 .98 21.1Run #2 12.5 19.5 43.8 .96 20.7Run #3 12.8 19.5 44.8 .99 20.6Run #4 12.75 19.5 44.5 .98 22.6Run #5 13.7 18.7 47.5 1.09 22.7X 12.85 19.26 45.00 1.00 21.54a .49 .36 1.44 .05 1.03
22

RDTR No. 142
D. Lead Dioxide from Eagle-Picher 0.52 Pack #2-w-394 G/O #00290
PEAK PRESSURE TIME TO ANGLE OF TAN OF OPEN BURNING RATEPmax, Psi Pmax, Secs SLOPE, " SLOPE Secs/3 inches
Run #1 12.5 19.1 44.4 .98 21.1Run #2 12.5 19.5 43.8 .96 20.7Run #3 12.8 19.5 44.8 .99 20.6Run #4 12.75 19.5 44.5 .98 22.6Run #5 13.7 18.7 47.5 1.09 22.7X 12.85 19.26 45.00 1.00 21.54G .49 .36 1.44 .05 1.03
E. Lead Dioxide from Eagle-Picher 0.66 Pack #2-w-286 G/O #00290
Run #1 11.0 11.7 54.6 1 1.41 13.5Run #2 11.3 11.9 55.4 1.45 13.2Run #3 11.6 11.8 55.8 1.47 13.3Run #4 11.5 11.8 55.6 1.46 13.8Run #S 11.0 11.6 54.8 1.42 13.7Run #6 21.0 11.6 52.9 1.32
11.27 11.73 54.85 1.428 13.50a .29 .12 1.06 .057 .25
F. Lead Dioxide from Pepcon, Pacific Engineering Production Company
Run #1 10.5 10.8 55.4 1.45 13.3Run #2 9.9 11.3 53.0 1.33 12.5Run #3 11.5 10.1 59.0 1.67 13.0Run #4 10.5 10.5 56.4 1.50 12.4Run #5 10.75 11.1 55.6 1.46 11.5
10.63 10.76 55.88 1.482 12.54
23
23

RDTR No, 142
G. Shepherd Chemical Company, Dense, Government SpecificationLot 5337
PEAK PRESSURE TIME TO ANGLE OF TAN OF OPEN BURNING RATEPmax. Psi Pmax Secs SLOPE, 0 SLOPE Secs/3 inches
Run #1 9.6 14.2 46.40 1.05 15.5Run #2 9.7 14.2 45.7 1.03 15.4Run #3 10.1 13.5 48.2 1.12 14.5Run #4 9.5 13.5 46.5 1.06 15.1Run #5 9.8 13.9 46.9 1.07 15.1" 9.74 13.86 46.74 1.066 15.12
S.23 .35 .92 .034 .39
24

RDTR No. 142
TABLE IV. Reproducibility of Performance Characteristics Based onNew Design Test Fixture of 2-3-S Starter Compos-ition Made with4.3p Silicon (Hummel), 6.Oj Cupric Oxide (Glidden), and LeadDioxide from Various Suppliers.
A. Lead Dioxide from J. T. Baker, Technical Powder, Medium Cure,2352.
PEAK PRESSURE TIME TO ANGLE OF TAN OFPmax, Psi . Pmax, Psi SLOPE, 0 SLOPE
Series 1Run 91 12.1 11.25 59.2 1.68Run #2 12.5 11.25 59.0 1.67Run #3 12.7 11.25 59.3 1.72Run #4 12.6 11.6 58.3 1.62Run #5 12.6 11.25 59.2 1.68
Series 2Run #1 1 11.8 12.0 56.4 1.50Run #2 11.8 11.2 57.5 1.57Run #3 j I.8 11.2 56.8 1.53
Series 3Run #1 11.4 11.8 55.4 1.45Run #2 11.3 11.6 55.4 1.4SRun #3 11.7 12.0 55.4 1.45
S12.00 11.49 57,49 1.575_ _.52 .32 j 1.70 .104
25

B. Lead Dioxide from Eagle-Picher, 0.52p Pack #2-w-394 G/O #06290
PEAK PRESSURE TIME TO. ANGLE OF TAN OFPPmax, Psi Pmax, Psi SLOPE, 0 SLOPE
Series 1Run #1 11.4 13.4 52.3 1.29Run #2 11.S 13.15 52.7 1.31Run #3 11.4 13.15 52.7 1.31Run #4 12.0 13.15 53.9 1.37Run #5 11.3 13.1F 51.9 1.28
Series2Run #2 11.1 14.0 49.7 1.18
Run #2 11.2 13.0 52.2 1.29Run #3 11.4 13.7 50.9 1.23
Series 3Run #1 11.25 13.8 51.0 1.23Run #2 11.20 13.65 I 51.0 1.23Run #3 1 11.50 13.2 52.4 1.30
X 11.386 13.40 S1.88 1.27a .241 .34 1.15 .053
26
I.IUC. Lead Dioxide from Pepcon, Pacific Engineering Production Company
PEAK PRISSURE -TIME TO ANGLE OF TAN OFSeries Pmax, Psi P.wx, Secs SLOPE, SLOPE
Series1
Run #1 10.5 10.8 55.4" 1.45Run #2 9.9 11.3 53.0 1.33Run #3 11.5 10.1 59.0 1.67Run #4 10.5 10.5 56.4 1.50Run #5 10.75 11.1 55.6 1.46
Series 2Run #1 9.2 11.1 51.10 1.24Run #2 9.8 10.6 54.2 1.39Run #3 9.3 11.2 51.1 1.24
Series 3Run #1 9.4 11.4 52.7 1.31Run #2 9.7 10.6 53.5 1.35Run #3 9.7 10.2 54.7 1.41
10.02 10.81 54.25 1.395a .71 .44 2.34 .125
27

Vi'R No. 142
D. Lead Dioxide from Shepherd Chemical Company, Dense,Government Specification, Lot 5337
PEAK PRESSURE TIME TO ANGLE OF TAN OFPinax, Psi Pmax. Psi SLOPE, 0 SLOPE
Series 1Run #1 9.6 14.2 46.4 1.0SRun #2 9.2 14.2 45.7 1.03Run #3 10.1 13.5 48.2 1.12Run #4 9.5 13.5 46.5 1.06Run #5 9.8 13,9 46.9 1.07
Series 2Run #1 9.2 13.6 45.0 1.00Run #2 9.3 13.5 46.5 1.02Run #3 9.0 14.0 44.0 0.96
Series 3Rim #1 9.2 13.7 45.0 1.00Run #2 9.7 13.9 46.5 1.05Run #3 9.8 12.8 49.3 1.16
X 9.49 13.71 46.28 1.047a .34 .40 1.50 [ .056
.-
-~~V I Al '-
TABLE V. Ratio of Square of Standard Djeviation Variances onBurni-ng Characteristics of 2-3-5 Starter Composition. Made withFour Specimens of Lead Dioxide
SAMPLE PEAK TIME TO ANGLE OF ITANGENT OF!PRESSURE PEAK SLOPE ANGLE
!c X X(b XX XE X t i
rtD rt W I (lDf rt (DV+ 0 r+f D CA
rt C C+ C+
-- -- 3 -LI
Baker 0.44 0.52 0.87 0.32 ~2.01 1.70 i1.76 0.10
Eagle-Picher j1.0.52p 0.11 0.24 0.87 0.34 2.32 15 0. 0.005
Pepcon 0.21 0.71 0.68 0.44 1.98 2.34 10.S8 0.13
Shepherd 0.38 0.34 1.42 0.40 5.38 li.50 j0.83 !0.06F( 4 0 40 ) 2.404 6.98S 3.542 138.1
29
Df D )J.1 1 Al
TABLE VI. Comparison of Burning Characteristics of 2-3-5 StarterComposition Made with Eight Different Lead Dioxide Specimens
Results Obtained on Present Test Fixture
PbO ANGLE OF PRESSURE TIME TOSORCE SLOPE, 0 Pmax, Psi Pmax, Sec
Allied 59,60 8.08 S.S2Baker 84.7 10.90 2,50Eagle-Picher 0.32u 61.8 9.50 6.06Eagle-Picher 0.52p 75.9 9.75 3.58Eagle-Picher 0.66v 76.7 9.08 3.20Eagle-Picher 95 41 7.3 10.5Pepcon 71.4 8.13 3.40Shepherd 71.6 8.09 3.90
Results Obtained on New Test Fixture
Allied 45.9 10.8 15.7 1Baker 59.1 12.5 11.3Eagle-Picher 0.3 2p 45.0 12.8 19.3Eagle-Picher 0.52P 52.7 11.5 13.2Eagle-Picher 0.66i. 54.8 11.3 11.7Eagle-Picher 95 31.5 10.4 25.5Pepcon 55.9 10.6 10.8Shepherd 46.7 9.7 13.9
30
ZUJR Nrio. 142
TABLE VII. Effects of Formula Changes on the PerformanceCharacteristics of the Lead Dioxide--Cuprlc Oxide--Silicon Family
Oxidizer--Fuel Ratio Constant; Lead Dioxide--Cupric OxideVarying (Present Test Fixture)
PbO2 CuO Silicon 8 Pmax tPmax AH
10% 40% 50% 450 6.45 8.38 407.420 30 50 66 7.90 7.38 384.330 20 50 74 8.38 3.25 362.040 10 50 82 10.40 2.00 339.0
Lead Dioxide--Cupric Oxide Ratio Constant; Oxidizer--Fuel RatioVarying (Present Test Fixture)
SPbO2 CuO Silicon a Pmax tPmax AH
24% 36% 40% 560 9.75 7.88 461.620 30 so 66 7.90 7.38 384.316 24 60 45 6.5 8.75 307.8
31
RDTR No. 142
Figure 1. Sample Holder Used in PresentPressure Test Fixture
Figure 2. Saple Holder Used in NewPressure Test Fixture
32
-- -i
- ---- --.-- ----- --------------_

lu 67 0
IK
A IsJ.'I -H, - A-OZ iQ
C CO-
V~ ~~~~ ai '&AIl
2u- Q1 12)*
I 1 '~~'~~.9JC4
CjlIL
I a
lI.- I;
znI 3;ti
- a -. I j I ~1 I~Doo~aa -
~ I ~i~ -91.

0 U)
0 lwwI I
-JQ-
00
MC C I LU0
~ I ZD
() cr : LiC
WW 0
Icr 0 0ww
0 cr-
I- -~ Li
0
N 400
w aO
U McU
Z Nr
'Iz
C4 U
ZO0 I0ZNN
I ~0 0
D cd-
LALCC
V t-
< 00
L-9

I
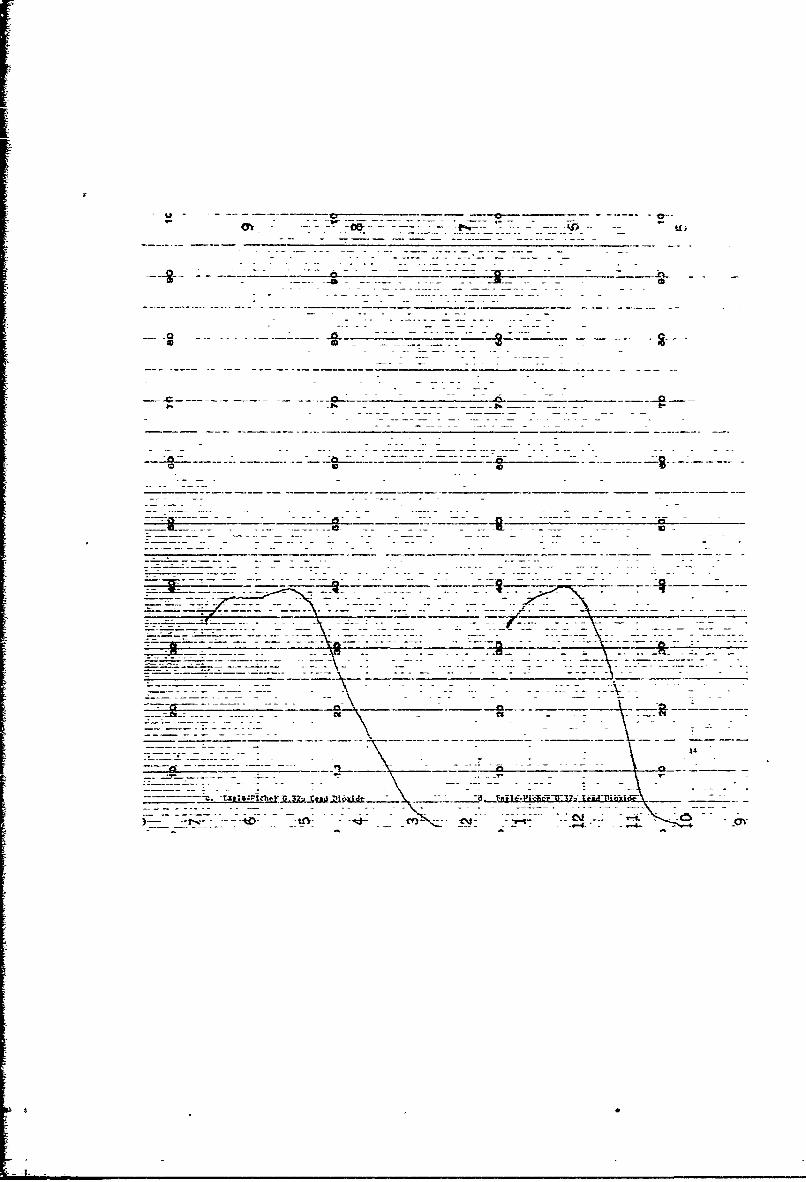
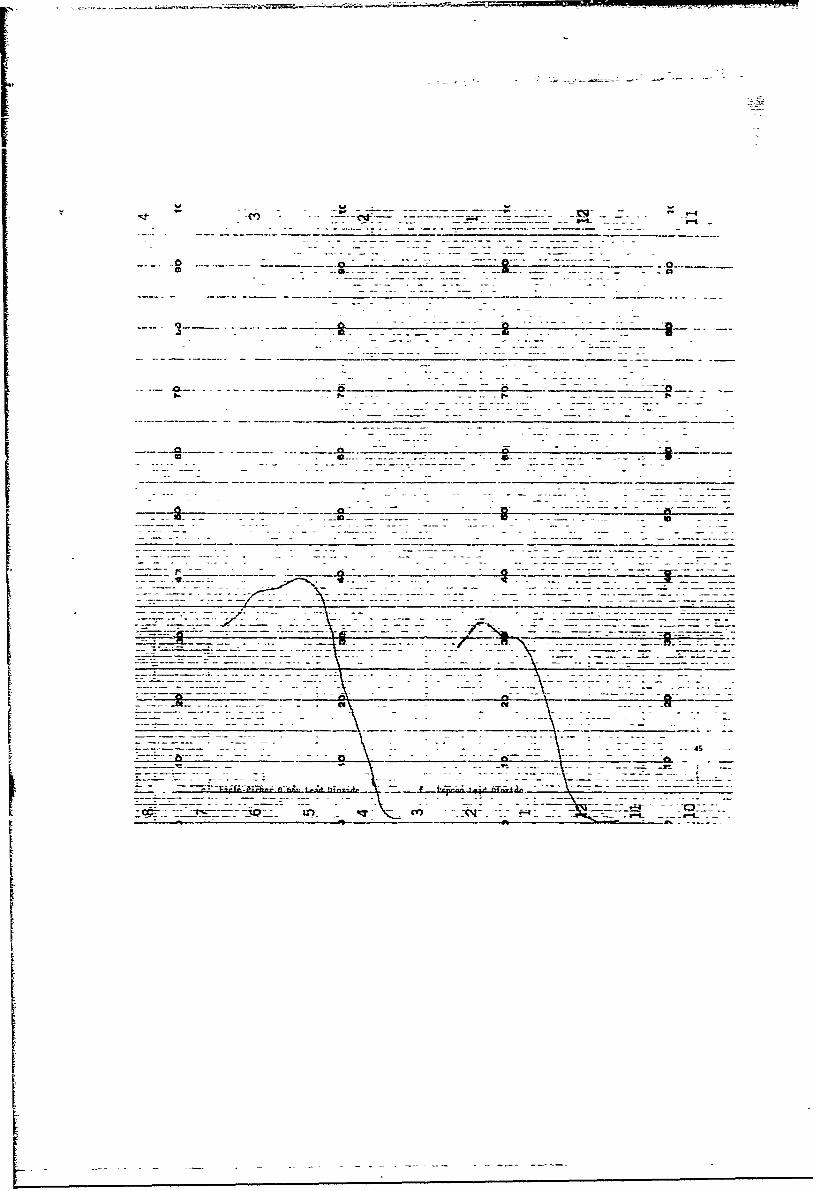
Figu~re 9. Pressure-time Curves of 2-S-S Starter Composition Jiadewith Different Lead Dioxide Specimens Using New TestFixture
a. Alij~e'] Lead Dioxide
S. .. i .- . -
..-.. ': II. • .
* o ,
- .-| - , -
-- . " I ""-" " I. " * I - , I .
* * -.
:- . . . i...... -.. i .. .:...]..
.1 .1 %., -I-I' ..-I
• . :I - .. - . . .4
* - . I .-. I -I- -
b. Baker Lead Dioxide
" -T I ; , __,--" '- - - I i. . .. I-' • . . . '-
5 i I- .5".
i.i' . -I , • ,
', , ' -' . ; -, j-4 .. . ... * - . . . . i. . . . -
S: . : . • .
! I " I "
. . . *,. . . . , - .- - .. . I•- -,. . . .
, I • !i I: x / : :,,.I: : •. !. . ,,",I . * *,,• • .-", .-" , •.5
39
C.Eagle-Picher 0.32 Lead Dioxide
V~-1 ,t~--1
d. Eal-Pce 0.2LjDixd
* . A
k t-40
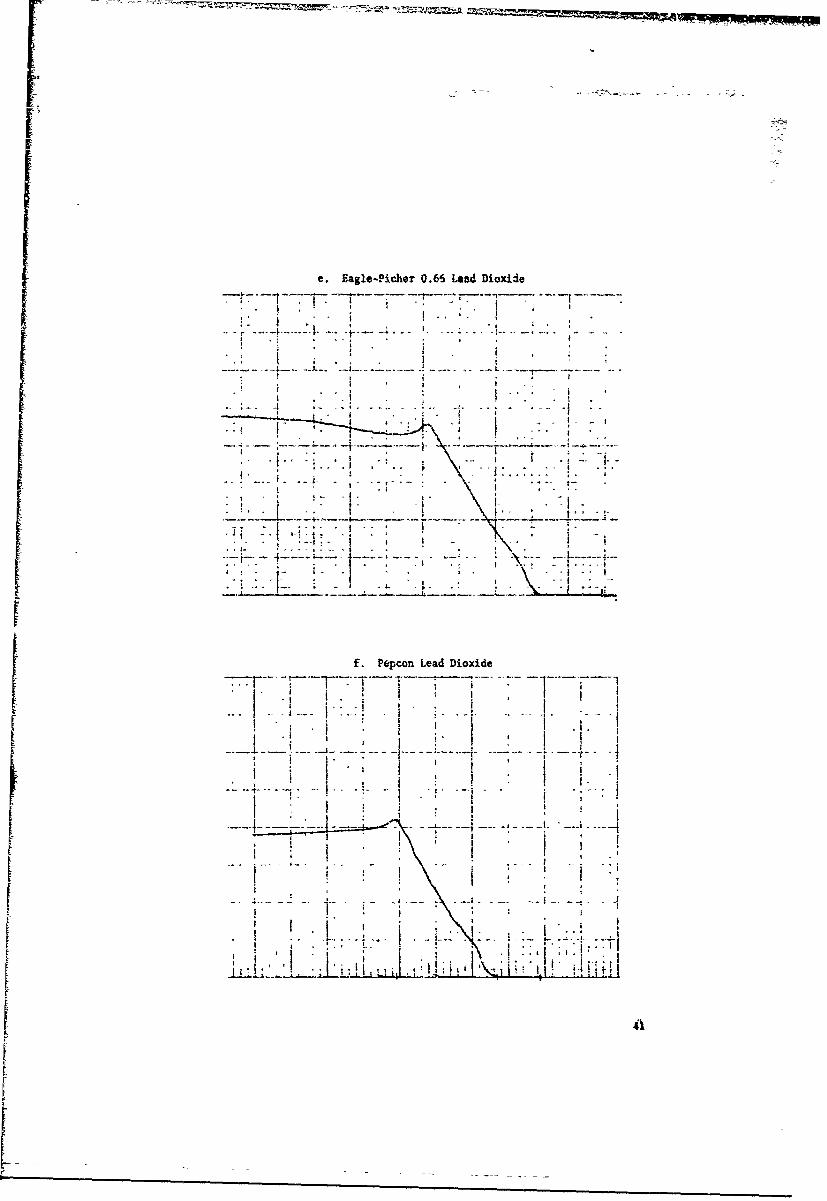
e. Eagle-Picher 0.66 Lead Dioxid1e
I. . S "
* 1 -
,, .. , . -
* I
4 . o .._ -
f. P~rpcon Lead Dioxide
4 S I I ' II - "SI I. .: - •
-.-. -±I- , ' '
I I ' ! 1I -, - ,
- ,.. .: - - i - \ -L -, . . . .. :
i • i • ; , \ • , ,
U .' _ .. .-I .- - : ." : ; ., ._.

----- 'm'g. Shepherd Lead Dioxide
SI " ". ..
S.. ............ *' " .. .... I...v I-.; . I
I, i "'".. t
. ... ....... .- I. j " '
*' . . I ÷ . . . -
- ; ;.- -I ,. - -. . .
S . ,. ,
-I * S-
i5 j .1" I. : •
I. .* I •,, .. - .... ,.." • \. '
42

- ------- ------ ~-- - - - ~ ------ "--~ --C
cd t -- --- -
hy.-- Vl7?- h~vFfr3 ~ --- E-- *-ga~.t o~t±~H~atM1,h- -
HE- I ------ Y--------'- - 0
-7--' - - ----
- L-- -e--7-- 7- -
-r~v- -tn -4 --- -(-ý -
-~t - .---- -- p

ID II
44IS' 7I
4b 1 12
~ i' I VI, . I

IZ
- - - I : 2 : -r- i- -

i
Figure 32. Effect of Gas Producing Impurities in Siliconon Pressure-time Curve of 2-3-S StarterComposition Using Nm Test Fixture
, . ' . " t
"- .... t- " , " I
- , . I, '
I.L -
TI-' ' .. .1'\
Ii\
II
l4
V

I i•~CIASSfIF 12D
DOCUMENT CONTROL DATA - R & D" t.ru , ,.. f r,,I� , h . tt' 4 .. ! .1,hstta I a.td dhd totti .,,,.t h, tc•w rd w.- 0- the, vw'.l# r ,t is e,1.,-itlrd)
esearc an' e "eop 4e• bepartment ,,.....c ... • , .. .. o~N~i~j~&C!~~ ~UNCLASSIFIEDU- S. Naval Ammunition Depot SFECrane, Indiana ,ou
Effect of Sample Holder Geometry on Pressure-Time Curves of Lead Dioxide-Cupric Oxide-Silicon Starter Composition: A New Test Fixture Design
A us... ueshIP wIF o'rs (flp ut" nI¢'p~ft ,,,,d ,,(l,ct'•l,n, dar,'.%b
RIPLEY, WILLIAM L.
23 May 1969 48. AC. 0 -4 T kA¢ C -oI G 14A a-4 10. 1:, • G;NATO 'S RF&-0f1t .aU..!, W*S1
h "RhOfc r No RDTR Nc. 142Air Task A35-532/323/69FI7-546-S02Work Unit 3 6, ." r , o , ,.R.u .Pon.. ,, ........ (A- .. ,e.,m , . .be . ,
ith
IC OmSlHm~hultIaf 5*A1
EF1J"1I
Distribution of this d cument is unlimited.
11 Ik t I VC-1 *C.Cu'. 1- S' " GSC -'J .L''A. AC'V
_Naval Air Systems Command13 AHS~hACI.
Difficulties in interpreting pressure-time curve data obtained on thepresent test fixture (Mk 25 Marine Location Marker Starter Composition) hasled to the design of a new test fixture with a sample geometry which producesa linear plot. A comparison of results obtained on the two test fixtures ismade. An optimum range of burning characteristics for thc new test fixture isrecommended. Also recommended is a basic starter composition formula withenough flexibility to compensate for performance variations due to variationsin the reactivity of the chemical ingredients.
•D• I NO1V 1473S ' O!0 .0 ? 0 6e('I fy('.'.it'•'o
-UNLLAb6iitj1j1NecuitIN Claqqtf'acauon
14 t L *1 * I.0K LINK C
Starter CompositionPressure-Time CuresPressure-Time Test Fixtui.burning CharacteristicsMk 25 Marine Location MarkerPerformance VariationsSiliconLead DioxideCupric Ox~deReproducibility of ResultsWilliam L. Ripley
DD-!O~11473 (BACK UNCLASSIF CIE(PAGE 2) eu*v Clasification