,f -) ,; / ,?a't- - ntrs.nasa.gov · pdf file3.2 conclusions ... 3.3 recommendations ......
TRANSCRIPT

Document Type:Document No:Document Rev:
Change No:Work Order:
TWRTWR-18901
000N/A
_,f -)
?,; "/ _,?A'T-"
FINAL REPORT FOR ETP-0403, RESIDUALSTRESS MEASUREMENTS AFTER PROOFAND FLIGHT
NASA/CR- - y;7- 208242
Prepared for:
NATIONAL AERONAUTICS AND SPACE ADMINISTRATIONGEORGE C. MARSHALL SPACE FLIGHT CENTER
MARSHALL SPACE FLIGHT CENTER, ALABAMA 35812
Contract No. NAS8-38100
DR No. 5-3
WBS. No. 4C205
ECS No. 00010932
ECP No.
ltNIOJIN.P.O.Box707,BrighamCity,UT84302-0707(801)863-3511
https://ntrs.nasa.gov/search.jsp?R=19980210623 2018-05-22T10:16:36+00:00Z


V. K. Henson, SA51E613-FY98-242
Distribution
R. B. Roth, TC/MSFCS. Cash, EE54A. Domal, EE5,3T.Shaffner, TC/KSCD. Burton, RMO/K68 (2)M. Rsher, USBI/K68R. Brown, CR65D. Hull, CR65R. Goins, Hernandez/MSFC
F. Bugg, ED26L. Clayton, ED63M. Hill, ED28G. Bishop, EE52J. Hester, EE51D. Ricks, EE54R. Nichols, EE51D. Hannsz, JSC/CBR. Sanders, JSC/MS4Central Documentation Repository, CN22D (5)
W/O Enclosure
S. Vigil, E68
CI_3IS r,'f__ _-
_ETIC
_cumen

SPACE OPIERATIONS
P.O. BOX 707
BRIGHAM CITY, UT 84302-0707
801-863-3511
THIOKOLAEROSPACE & _NDUSTRIAL TECHNOL_bE S
November 24, 1997E611 -FY98-242
George C. Marshall Space Flight CenterNational Aeronautics and Space AdministrationMarshall Space Flight Center, AL 35812
Attention Mr. V. K. Henson, SA51
Gentlemen:
Subject: Transmittal of Final Report for ETP-O403, Residual StressMeasurements After Proof and Flight, TWR-18901, DR 5-3,Type 2 Documentation
Transmittalof FinalReport forETP-0474, Evaluation ofElectrolessNickel Platingto Eliminate Fretting,TWR-19494,DR 5-3,Type 2 Documentation
Transmittal of Final Report for ETP-O492, Measured ResidualStresses in Cylinder SIN 53 Fretted Area, TWR-18901, DR 5-3,Type 2 Documentation
The subject documents report resultsof testingcompleted during theRedesign Program. The testdata was used invarious FlightReadinessReview presentations, but finaldocumentation was never completed. Inan effortto clean up open paperwork, we have recently devotedresources to complete the preparation and release of these three reports.The subject documents are being forwarded foryour information.
If you have any questions or comments concerning this transmittal, pleasedirect them to the undersigned at extension 347,5.
Very truly yours,
Test Management
Encl: a/s


Document Type: TWRDocument No: TWR-18901Document Rev: -
Change No: 000Work Order: N/A
FINAL REPORT FOR ETP-0403, RESIDUALSTRESS MEASUREMENTS AFTER PROOFAND FLIGHT
SR&QA Date PREPARER DateNot Required Ronald L. Webster.03681 28-OCT-1997
PM Date DE_SUPERVISOR Date
Scott R. Stein: 13537 17-NOV-1997 Jay V. Daines:03741 31 -OCT-1997
DE Date DATA_MANAGEMENT DateVicki B. Ca11:13022 03-NOV-1997 Irma Nieto:19249 18-NOV-1997
RELEASED18-nov-1997 13:07:26


•AINOmPAC II • INOUiTNIAL TIICNNOLOOII[I
ABSTRACT
The intent of this testing was to evaluate the residual stresses that occur in and around the attachment details of a case
stiffener segment that has been subjected to flight/recovery followed by proof loading. Not measured in this test were
stresses relieved at joint disassembly due to out-of-round and interference effects, and those released by cutting the
specimens out of the case segment.
The test article was lightweight case stiffener segment IU50715, S/N L023 which was flown in the forward stiffener
position on flight SRM 14A and in the aft position on flight SRM24A. Both of these flights were flown with the 3 stiffener
ring configuration. Stiffener L023 had a stiffener ring installed only on the aR stub in its fast flight, and it had both rings
installed on its second flight. No significant post flight damage was found on either flight. Finally, the segment was used
on the DM-8 static test motor in the forward position. No stiffener rings were installed. It had only one proof
pressurization prior to assignment to its fast use, and it was cleaned and proof tested aRer each flight. Thus, the segment
had seen 3 proof tests, two flight pressurizations, and two low intensity water impacts prior to manufacturing for use on
DM-8. On DM-8 it received one static firing pressurization in the horizontal configuration.
Residual stresses at the surface and in depth were evaluated by both the x-ray diffraction and neuu'on beam diffraction
methods. The x-ray diffraction evaluations were conducted by Technology for Energy Corporation (TEC) at their facilities
in Knoxville, TN. The neutron beam evaluations were done by Atomic Energy of Canada Limited (AECL) at the Chalk
River Nuclear Laboratories in Ontario. The results showed general agreement with relatively high compressive residualstresses on the surface and moderate to low subsurface tensile residual stresses.
REVISION.._ ooc NO. TWR-I8901 [V0L
SEC } PAGE i


TIlIOKOLAEIqOIPACII • iNDUSTRIAl* TmCHNOLOGI|8
Table Of Contents
1. INTRODUCTION ..................................................................................................................................................... i
1.1 TEST ARTICLE DESCRIPTION ....................................................................................................................... 3
2. OBJECTIVES ............................................................................................................................................................ 5
3. EXECUTIVE SUMMARY ....................................................................................................................................... 5
3.1 SUMMARY ......................................................................................................................................................... 5
3.2 CONCLUSIONS ................................................................................................................................................. 7
3.3 RECOMMENDATIONS ..................................................................................................................................... 7
4. INSTRUMENTATION ............................................................................................................................................. 8
5. PHOTOGRAPHY ...................................................................................................................................................... 8
6. RESULTS AND DISCUSSION ................................................................................................................................ 8
6.1 TEST DESCRIPTION ......................................................................................................................................... 8
6.2 DESCRIPTION AND JUSTIFICATION OF DEVIATIONS FROM THE TEST PLAN ................................ 1 !
6.3 TEST PREPARATIONS ................................................................................................................................... 11
6.4 TEST FACILITIES ........................................................................................................................................... 11
6.5 TEST PROCEDURES AND INSTRUMENTATION ................................................................................ _..... 11
6.6SIGNIFICANT FINDINGS ............................................................................................................................... 12
6.6.1 GENERAL OBSERVATIONS .................................................................................................................. 12
6.6.2 TEST DATA EVALUATIONS .................................................................................................................. 12
6.6.3 INFORMATION FROM STRESS ANALYSES ....................................................................................... 15
7. APPLICABLE DOCUMENTS ............................................................................................................................... 19
8. REFERENCES ........................................................................................................................................................ 19
APPENDIX A - VENDOR REPORT FOR X-RAY DIFFRACTION MEASUREMENTSAPPENDIX B - VENDOR REPORT FOR NEUTRON BEAM DIFFRACTION MEASUREMENTS
LIST OF FIGURES
Figure
Figure
Figure
Figure
Figure
Figure
Figure
Figure
Figure
Figure
Figure
Figure
Figure
Figure
Figure
1 Configuration of Factory Joint Alignment Slot Region ...................................................... 4
2 Configuration of Case Stiffener Stubs ................................................................................ 4
3 Summary of Hoop Residual Stresses on Factory Joint Features ......................................... 6
4 Summary of Residual Stresses on Stiffener Stubs .............................................................. 6
5 Comparison of Neutron Beam Measured and Analytical Residual Strains ........................ 7
6 Tang and Clevis Measurement Locations ........................................................................... 9
7 X-ray Diffraction Evaluation Points for Tang Specimens ................................................... 9
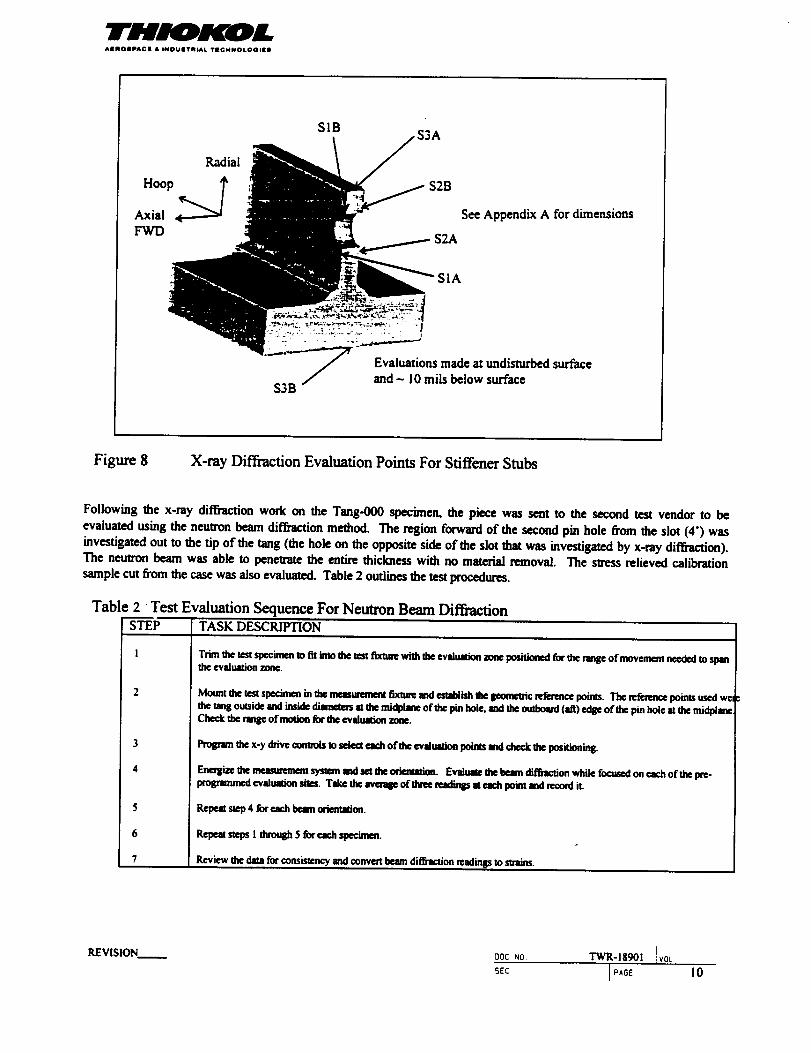
8 X-ray Diffraction Evaluation Points For Stiffener Stubs ................................................... 10
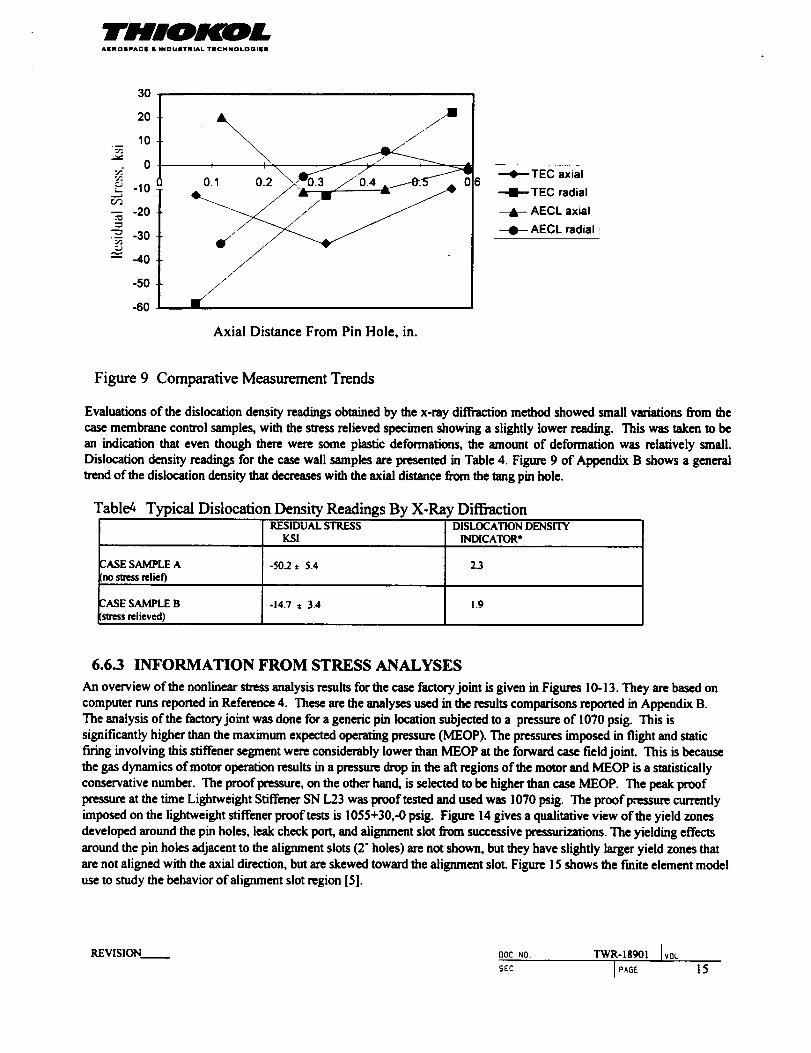
9 Comparative Measurement Trends .................................................................................. 15
l0 Finite Element Model of Typical Factory Joint Pin Locations ........................................ 16
11 FE Analysis Results for Tang Nodes .............................................................................. 16
12 FE Analysis Results for Outer Clevis Leg Nodes ........................................................... 17
13 FE Analysis Results for Inner Clevis Leg Nodes ............................................................ 17
14 Yield Zones for a Typical Pin Hole and an Alignment Slot ............................................ 18
15 Finite Element Model of the Alignment Slot Zone ......................................................... 18
REVISION oocNO. TWR-18901 IVOL
SEC I_GE ii

AINOIPACi • INDUITRIAL. TIGHNOLOGIII8
LIST OF TABLES
Table 1 Test Evaluation Sequence For X-Ray Diffraction .............................................................. 8
Table 2 Test Evaluation Sequence For Neutron Beam Diffraction ................................................. 10
Table 3 Comparison Of Key Residual Stress Values ...................................................................... 14
Table 4 Typical Dislocation Density Readings By X-Ray Diffraction ............................................ 15
REVISION____ o0¢ NO. TWR-18901 JV0L
SEC l p_G_ iii


THIOKOLAI[IItOSPAGE • iNOUSTRIAL YICHNOt.OGItll
1. INTRODUCTION
The steel case components of the Space Shuttle Reusable Solid Rocket Motor (RSRM) are fracture critical items. One
important issue in assuring flight safety for the motor components of the booster rockets is the fracture sensitivity foreach use (mission). This includes both basic flaw growth driven by repeated loads and stress corrosion cracking. The
conditions for su'ess corrosion cracking to occur are a combination of the following:
1. A sustained surface (or near surface) tensile stress exceeding the stress corrosion cracking susceptibility
limit (about 30 ksi for a 0.100 in. deep crack in the RSRM case material).
2. A sustained corrosive environment (salt water, humid air exposure)
There are two periods of sustained exposure to corrosion environments. The first is in sea air with high humidity prior to
flight. This occurs during the launch site storage, flight system assembly, roll-out, and on-pad operations. A significant sea
water exposure of case components occurs during recovery operations in the splashdown and tow back phases. Most of the
external surface of the case is painted to avoid corrosion exposure. Those areas where structural joints are to be made
cannot be painted and absolute corrosion protection cannot be assured even though a coating of CONOCO HD-2 grease is
used to protect the exposed surfaces and a sacrificial anode is attached to the case soon after splashdown. The joints
addressed by this set of tests are at the factory and field joints of the cylinder segments and the attachment stubs for the
stiffener rings on the aR segment.
Where absolute protection cannot be assured, the critical issue for stress corrosion cracking is what the stresses are at or
near the surfaces during the unlikely corrosive exposure. The residual stresses are a potential means of obtaining sustained
surface stresses. The residual stress distributions of most concern for stress corrosion cracking are tensile surface stresses
and in-depth distributions that can contribute to the development of high stress intensity factors at the location of the tip of
a potential macroscopic surfaceflaw (crack).
Although a major one, the stress corrosion cracking is not the only concern for the presence of residual stresses in the
RSRM case. Since the residual stresses are present for all loading applied after the residual stresses are developed, they
combine with the loading to increase or decrease the final sUx-sses. Knowing the location, sign, and magnitude of the
residual stresses is required to assess the slructural adequacy of the RSRM case.
Residual stresses result from nonuniform plastic deformations or from an assembly operation that suesses the mating parts.
There are several processes in motor manufacture and flight use which can produce residual stresses in the case
components. Some of them are:
1. Quenching during heat treaunent
2. Machining during case segment manufacturing
3. Local yielding during proof test
4. Blasting with grit or glass beads for surface cleaning
5. Fixturing and curing during motor manufacturing
6. Assembly with interferences and pre-loads
7. Local yielding during flight and recovery
Often the slresses produced from assembly are only present while the components are mated. They are released on
disassembly if no plastic deformations have occurred in the interim. Plastic deformations of assembled components can
alter the interference that produced the assembly stresses and lead to a different pattern of residual stresses in the
components after disassembly. Proof testing and water impact are two examples of loads that can produce plastic
deformations on an assembly.
Quenching stresses are usually highest on the surfaces of thick regions, and they often result in compressive residual
stresses which decrease with depth into the material. The residual stresses caused by machining after heat lreaunent are
highest at the surface and decrease rapidly into the depth of the material. This decay is much more rapid for machining
REVISION oocN0, TWR-18901 [VOL
s£c I PAGE I

TH IWDLAIIROSPAGm • |N_US"rNIAI. TmGffNOLO_III8
residual stresses than for quenching residual stresses. Tensile residual stresses may be found interior to the parts but atmuch lower magnitude over a large volume.
Residual suesses developed by machining usually do not penetrate deep enough to be a concern for macroscopic cracks.
Their influence is mostly at the surface. The machining and hole drilling can produce microscopic surface tearing in somesituations. These offer an opportunity for crack initiation in high load or repeated load situations.
The grit or glass bead blasting in cleaning operations produce a thin layer of compressive residual stresses at the blasted
surface. Since these are compressive stresses, they are likely to overwhelm any tensile surface stresses developed previousto the cleaning.
Residual stresses from proof testing and flight/recovery ioadings tend to be localized around attachments and other
structural details. These vary through the thickness at the details, but at a much slower rate and over a larger region than do
the quenching, machining, and sttrface blasting residuals. Both tensile and compressive surface stresses can be produced.
The highest residual stresses tend to be very localized and surrounded by a larger regions of residual stress at a lowermagnitude and opposite sign.
The proof and flight/recovery ioadings are the most concern for critical crack growth. The highest internal pressure seen
by the case components is the proof pressure. It is intentionally from 10% to 20% higher than the maximum expected
operating pressure for flight. The pressure histories in proof and flight are relatively short so that they have little direct
contribution to crack growth enhancement by stress corrosion cracking. The main con_butions of these pressure Ioadings
are the development of residual swesses and incremental crack growth. The factory and field joints experience stresses
high enough to locally yield the details around the pin holes, the base of the alignment slots, and the special ports used injoint assembly and leak checking. When the pressure is released, a portion of the yielded zone is forced into a reversed
yielding by the elastic recovery of the larger volume of adjacent material. This cyclic plastic deformation leads to a
complex pattern of residual stresses in the joint details. The size of cracks potentially allowed in flight components islimited by the refurbishment proof test and the NDE inspections for cracks prior to the next use.
The assembly of the field joints requires an interference between the tang capture feature and the inner clevis leg. This
interference adds locally to the residual stresses in the assembled RSRM. Although the factory joints do not have the
capture feature to induce the interference fit on assembly, there are unavoidable incongruencies that must be forced to
accommodate the assembly of either joint type. Each clevis joint has shims installed that take up radial slack around the
pins. Some of these may become hard contact points as the assembly is closed out. Additional long term stresses are
produced by the gravity loads imposed on the RSRM case while supporting the entire flight assembly on the MLP duringflight preparations.
Launch and flight loads are not long term loads, but (as noted above) the pressure loading combined with other flight loads
has the potential for altering the residual stress distribution by adjusting the local yielding and for growing existing cracks.
The recovery for reuse of the RSRM case components involves a water impact event that is well known for its ability to
produce high external side loading on the afi portions of the motor casing. This highly variable loading can produce
permanent deformation in the components of the aft segment of the case. This deformation is manifest as an out-of-round
condition at the factory joints and the stiffener ring attachment stub details after case disassembly. Local damage
experienced in the stiffener stub details can include hole and stub deformations and bolt hole ligament cracking. Local
deformations also occur in the factory joint details around the pin holes, alignment slots, and leak check ports. These all
contribute to the development of residual stresses.
Stiffener segments with bolt hole ligament cracks are not allowed in flight motors. They can be cleared for flight only ifthey have the cracked material removed in an approved "repair" processes. Stiffener stubs reworked to remove cracks arenot considered in this test effort.
The refurbishment process for preparing segments for theft next use involves removal of bonded insulation and paint by
high pressure water jet, glass bead blasting for cleaning of tang and clevis details, grinding and blending to remove surface
anomalies, and hydroproof testing at pressures higher than flight and with support conditions not fully simulating flight
conditions. The refurbishment process modifies the state of the residual stresses in a way that needs to be quantified to
REVISION DOC NO. TWR-I8901 Iv0L
5EC [ PAGE 2

- THIOKOLAIIROIIPAC il • |NDUIITRiAt. TIICHNOLOOlill
assure surface tensile residual stress are not developed that exceed the stress corrosion cracking susceptibility limit for theD6AC case material.
The intent of this testing was to evaluate the residual stresses that occur in and around the attachment details of a case
stiffener segment that has been subjected to flight/recovery followed by proof loading. Not measured in this test were
stresses relieved at joint disassembly due to out-of-round and interference effects, and those released by cutting the
specimens out of the case segment.
1.1 TEST ARTICLE DESCRIPTION
The test article was lightweight case stiffener segment 1U50715, S/N L023 which was flown in the forward stiffener
position on flight SRMI4A and in the aR position on flight SRM24A. Both of these flights were flown with the 3 stiffener
ring configuration. Stiffener L023 had a stiffener ring installed only on the aft stub in its first flight. It had both rings
installed on it second flight. No visible post flight damage was found for either flight. Finally, the segment was used on
the DM-8 static test motor in the forward position. No stiffener rings were installed. It had only one proof pressurization
prior to assignment to its fL-stuse, and it was cleaned and proof tested after each flight. Thus, the segment had seen 3 proof
tests, two flight pressurizations, and two low intensity water impacts prior to manufacturing for use on DM-8. On DM-8 itreceived one static firing pressurization in the horizontal configuration.
The RSRM cylinder segments are fabricated from D6AC steel per STW4-2606 and heat treated according to STW7-2608.
NOTE: The test plan (reference I) gives two incorrect designations for this segment. The title page refers to 1U50716-06
S/N L023 (a lightweight attach segment). The test component description in Section 2.0 refers to IU50715 S/N L032 (a
lightweight stiffener segment flown on flight 21A). The DM-8 motor used the lightweight attach segment S/N L032 and the
lightweight stiffener segment S/N L023. The correct designation of the test item is lightweight stiffener segment S/N L023flown on flights 14A and 24A. The similarity of the segment numbering gave opportunity for the confusion.
At the end of the DM-8 static firing, part of the case deluge system failed, and the ET attach segment was heat damaged
along with the forward end of the L023 stiffener segment for part of the circumference (the L032 attach segment had majorheat damage). The heat damage was due to static firing heat soak and the accumulation of slag in the bottom of the motor.
The heating was focused on the 0" angular position, which was the bottom in the static fning configuration. The aft half of
the L023 attach segment appeared unaffected. The segment was scrapped and allocated to various investigations andevaluations.
The failure investigation for DM-8 included a Rockwell C hardness survey and a dye pennetrant crack survey to assure the
heat affected areas were delineated. The cutting plan for the DM-8 accident investigation allocated portions of the
unaffected areas for this test as well as pieces from the damaged area for the accident investigation (see reference 2). Sevenlarge pieces were assigned to this residual stress investigation.
The excess heat from the DM-8 deluge failure produced various local deformations of the forward end of the segment
which would alter the residual slress state. Since it was necessary to cut out the test pieces from the case, the assembly and
test stand induced sl3"esses were relieved along with both the out-of-round and heat affected residual stresses in the segment.
There is no way to estimate what they were, but studies of out-of-round conditions suggest that the case is a thin shell that
does not require large forces to move it to an out-of-round condition. The residual stresses from any heat effects are
considered to have been small and of no consequence to this testing. The post flight inspection of this segment showed no
measurable damage from water impact on either flight. This suggests that the residual stresses relieved by removing the
test pieces from the cylinder (ignoring heat effects) were less than 2 ksi. This is an order of magnitude less than the typical
measurement accuracy of the x-ray diffraction process.
The case cleaning operations in refurbishment involve glass bead blasting which induces compressive residual sn'esses on
the blasted surfaces. This process tends to overwhelm (replace) the residual sl_-s that existed prior to blast cleaning on
the surface and to a depth of a few mils. This suggests the residual stressesprior to DM-8 manufacturing should have been
similar to the state after the acceptance proof testing and cleaning for fwst motor manufacturing. The static firing and flightslTessesare not as high as the proof su'esses,so negligible disturbance of the residual stressfields would have occurred over
the two flights and one static fu'ing.
REVISION.....__ DOC NO TWR-18901 Iv0LSEC I PAGE 3

AI[IqOIIPAGE • INOUllTIqiAi. YIICHNOLOGIEI
This sequence of observations suggest that the tested pieces of the lightweight stiffener S/N L023 were representative of
RSRM case material that has seen repeated refurbishments and proof tests. The effects of flight, water impact, repeated
blast cleaning, and static f'uing are expected to be negligible on this component. Thus the S/N L023 cylinder is considered
to be representative of the RSRM lightweight stiffener segments that have had three proof cycles applied. The major
contributors to the residual so'ess state are considered to be the repeated local plastic deformations from the 3 proof testsand the compressive surface residuals fi'om the last blast cleaning.
Figures 1 and 2 show the general configurations the alignment slot and stiffener stub features of a stiffener segment.
JOINT P_S
NOTE; pma ll_t slot _ ¢aty far aamm_y
Figure 1 Configuration of Factory Joint Alignment Slot Region
4_- ,. 7. , ._. - ,c ...... . : _._ -
14| SU-M.
Averl, OW Di_neler
IN _ E__N
Configuration of Case Stiffener Stubs
00C N0.
SEC
TWR-18901 I vOL
PAGE

THIOKOLA|ROIIPACI[ • INIDUIITRLAi. TIICNNOt.OOI|II
The cutting plan associated with this test is shown in the test plan (Reference 1, Figures I-3). The seven pieces produced
were labeled with the following identification codes:
Tang - 000
Tang - 118
Tang - 240Clevis - 118
Clevis - 240
F Stub - 166
A Stub- 166
The numbers for the specimens indicate the case reference angle to the center of the specimens. The three tang specimens
were centered on the alignment slots, providing 3 pin holes on either side of the alignment slot. The first pin holes on either
side of the slot see the largest pin loads from pressurization and were the specific targets of this testing. The two clevis
specimens were at corresponding locations on the forward end of the segment where there was no heat damage. Each of
the two stiffener stub specimens _pauned a 20" arc centered on the same angular position, again avoiding the heat affected
zone. Each stiffener stub specimen had 9 bolt holes available for evaluation. Each of the pieces were flame cut fi'om the
segment and abrasively trimmed to the final sizes using a hydrolaser to remove any heat affected material produced by the
flame cutting.
Two pieces of case membrane (9 in. long with a 16" arc) were used as material comparison standards in measurements of
grain dislocation density. One piece was supplied in the "as cut" condition, and the other received a laboratory heat
treaunent to remove any residual stresses.
2. OBJECTIVES
The objective of this test was to measure the residual messes near the structural details (factory joint and stiffener
attachment stubs) in a case segment that had experienced both flight loads and subsequent proof testing. The intent was to
use this data to compare with analytical computations and to assess basic su'uctmal integrity and the sensitivity of the case
components to stress corrosion cracking. A side objective was to compare the effectiveness of measuring residual stresses
by the x-my and neuu_n beam diffraction methods.
3. EXECUTIVE SUMMARY
3.1 SUMMARY
All test objectives were met. There were no abnormal occurrences or adverse findings. Figures 3 and 4 summarize the
residual stress results obtained from the x-ray diffi'action evaluations. Although the lightweight stiffener S/N L023 test
article had seen two flight uses, the effects of water impact and recovery were found to be minimal. The primary effects
represented in the residual stresses retained in the test pieces were from 3 proof tests and 2 refurbishments prior to the
DM-8 static firing.
It should be noted that a general review of these test results was presented in Reference 3 to support an evaluation of
damaged stiffener segments with the intent of defining conditions for their continued use.
This testing found no evidence of tensile residual stresses at the surface locations evaluated. No concerns were raised about
the stress corrosion potential at the surface or near surface in the cylinder joints or the stiffener stub bolt holes.
The magnitudes of the surface compressive stresses found were generally in the range of 100 to 150 ksi at all points
evaluated. They decreased rapidly with depth from the surface, extending inward less than 10 mils. The combination of
x-ray diffraction and material removal was not precise enough to estimate the actual depth of this effect. These surface
compressive stresses are most likely to be the result of the shot-peening effect from cleaning using glass bead blasting.
The subsurface residual stress readings at depths approaching 10 mils were mixed low tension and compression. The
majority of the readings were compressive with magnitudes less than 90 ksi. At locations that found tensile residual
REVISION.__._ OOC NO. TWR-18901 JV0L
SEe [ PAGE 5

mA|NOOPACm • INDUIITNrAL YIIC_INOLOGII[lll
sll'esses, most of them had magnitudes less than 10 ksi. Somewhat higher tensile residual stresses were found at a few
subsurface locations. The highest tensile reading found by the x-ray diffraction process was 28.1 ± 2.7 ksi. This was
measured in the hoop direction at point T4C on the Tang-240 specimen. Taking the measurement uncenain_ at that point,
the hoop residual stress could be as high as 30 ksi. A similar (but lower) reading was obtained at the same location on the
Tang- I! S specimen. Test point T4C was on the outboard surface of the tang midway from the edge of the pin hole and the
tip of the tang on the second hole from the aligmnent slot (4") at a depth of about 10 mils. The estimated crack tip residual
sn-ess panerns must be combined with these upper bound estimates to determine if a risk of stress corrosion augmentedcracking indicated for such a flaw. What is indicated by this finding is a need for careful and accurate surface crackdetection in the refurbishment process.
-102.4 {_ 114"-63.9 _ 114" -74.7 @ _6"
-39.5 @ _6_..._
C2B
NEUTRON26.0BEAM,'l 356* t
2.7..0
-51L6 ._
"All smla_s a_ m ksi
//I I \ f'_/'\ -iomiua._x-=ya_un.=m
_f_ /_ / / -I05.1# I I_\ // _ _ -77.2 @ 2.16"
/\ / c,o\..._ 7/ / _?.-.....=.l@ll_.._ _/ / .I 19.,@va6.
-\ k_\/ _'-'-7.60 I,..-
I \ Y --_ "l.lO'>_"
i K\ ,,,.'=/ \ _ "24.91 12"_,
/ \ -21,1 ,_l2,1,,l"
I \ t4s
-61.9 @ .r•-_0.6@ I__-'u'-,-2.0 _ 2_"
"l'.b_
Figure 3 Summary of Hoop Residual Stresses on Factory Joint Features
r SiB S3A [
Hoop Radial Hoop Axial
-16 -14 fwd 3 4 fwd
-4 -4aft 5 6 aft
HOOP RADIAL_,,,. _ _,,_[ S2B ]Hoop Radial
AXIAL _._._ "[ -30 -28 fwd I
SIA '¢- ]
Hoop Radial [ S3B S2A
7 -14 fwd ]Hoop Axial Radial-30 -20 aft / 4 2 fwd -4 -6 fwd
L 13 10 aft -61 -52 aft
Figure 4
RtVISION__._.
Summary of Residual Stresses on Stiffener Stubs
ooc NO.
SEC
TWR-18901 ]you
i_AGE 6
THIOKOLAIEIqOdipACII • INDUITNIAI. TIECI4NOLOGIEa
3.2 CONCLUSIONS
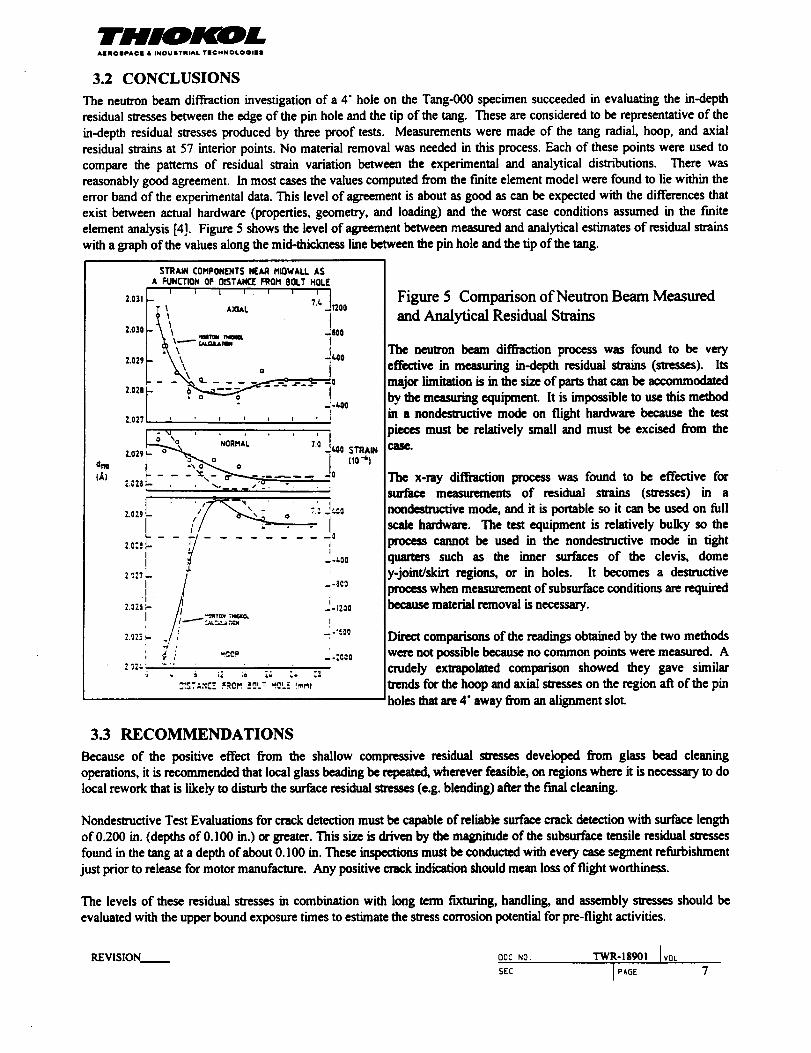
The neutron beam diffraction investigation of a 4" hole on the Tang-O00 specimen succeeded in evaluating the in-depthresidual stresses between the edge of the pin hole and the tip of the tang. These are considered to be representative of the
in-depth residual s_'esses produced by three proof tests. Measurements were made of the tang radial, hoop, and axialresidual strains at 57 interior points. No material removal was needed in this process. Each of these points were used to
compare the patterns of residual strain variation between the experimental and analytical distributions. There wasreasonably good agreement. In most cases the values computed from the finite element model were found to lie within theerror band of the experimental data. This level of agreement is about as good as can be expected with the differences thatexist between actual hardware (properties, geometry, and loading) and the worst case conditions assumed in the finite
element analysis [4]. Figure 5 shows the level of agreement between measured and analytical estimates of residual strainswith a graph of the values along the mid-thickness line between the pin hole and the tip of the tang.
2.031
2.010
7.029
2.028
2.027
STRA_ COMPONENTSNEAR MIOWAIJ. ASA FUNCTIONOF OISTANCE FROM BOLT HOLI
i i | I , i I I
- 7.1.
) _ I i i ! ,
1200
800
(.00
0
r "+'00
_\ ' 'NORMAL ' _ T')0 II,O0 STRAIN
+ -*.<3 O
Z.ODE [/_" '"o
I --.°°2.'_27" _'
:.-+_- 2.2.
2._2-c_- -, . 1...¢ ,
.;o¢o2 '_2_......
_(*-, If'' " g_ll- ta_l z +_t'_
Figure 5 Comparison of Neutron Beam Measured
and Analytical Residual Strains
The nenuron beam diffraction process was found to be very
effective in measuring in-depth residual su'ains (su-esses). Itsmajor limitation is in the size of parts that can be accommodated
the measuring equipment. It is impossible to use this methodin a nondes_ctive mode on flight hardware because the testpieces must be relatively small and must be excised fzom the
The x-ray diffraction process was found to be effective forsurface measurements of residual strains (stresses) in anondestructive mode, and it is portable so it can be used on fullscale hardware. The test equipment is relatively bulky so the
process cannot be used in the nondestructive mode in tightquarters such as the inner surfaces of the clevis, domey-joint/skirt regions, or in holes. It becomes a destructive
process when measurement of subsurface conditions are requiredbecause material removal is necessary.
Direct comparisons of the readings obtained by the two methodswere not possible because no common points were measured. Acrudely excal_lated comparison showed they gave similarIrends for the hoop and axial suesses on the region aft of the pinholes that are 4" away from an alignment slot.
3.3 RECOMMENDATIONS
Because of the positive effect from the shallow compressive residual stresses developed from glass bead cleaning
operations, it is recommended that local glass beading be repeated, wherever feasible, on regions where it is necessary to dolocal rework that is likely to disturbthe surface residual stresses (e.g. blending) after the final cleaning.
Nondestructive Test Evaluations for crack detection must be capable of reliable surface crack detection with surface length
of 0.200 in. (depths of 0.100 in.) or greater. This size is driven by the magnitude of the subsurface tensile residual sn'essesfound in the tang at a depth of about 0.100 in. These inspections must be conducted with every case segment refurbishmentjust prior to release for motor manufacture. Any positive crack indication should mean loss of flight worthiness.
The levels of these residual sffesses in combination with long term fixturing, handling, and assembly stresses should beevaluated with the upper bound exposure times to estimate the stress corrosion potential for pre-flight activities.
REVISION_._ OOC _0. TWR-18901 IvoLSEC i P*GE 7
TH IODLAIIRO|PAC| • INOUlTIIttAk TIlCNNOi.OGI|II
Thiseffortdidnotdealwiththeupperbound valuesofrecoverydamagethatcouldbe acceptedforreuse.Additional
attentionshouldbefocusedonthepostwaterimpactperiodofexposuretoseawaterwithmorerepresentativewaterimpact
damagethanwasproducedinthehardwareevaluatedhere.Thereshouldalsobeastudyofthechangesinresidualstressesaswellasthealteredassemblystressesthatarereleasedatpostflightsegmentdisassembly.
4. INSTRUMENTATION
The only instrumentation required was supplied by the testing vendors as part of the diffraction system used to measure theresidual stresses. The x-ray diffraction equipment conformed to MIL-STD-45662.
5. PHOTOGRAPHY
Still photographs were taken of the seven test specimens at various stages of the x-ray diffraction measurement process.These are presented in Appendix A. A photograph of the neutron diffraction test set up with the specimen in place isincluded in the vendor report (Appendix B).
6. RESULTS AND DISCUSSION
6.1 TEST DESCRIPTION
The test was conducted in accordance with the test plan, ETP-0403 (reference 1, ECS-2078). There was one deviationfrom this plan that is discussed in Section 7.1.1. It was the addition of test measurements using the netm'on beamdiffraction process.
Surface residual stress measurements using beam diffraction processes are nondestructive for steel. When subsurfaceevaluations are sought using the x-ray diffi-actionmethod, it is necessary to locally remove material between measurements.This is because the low power x-ray beam can penetrate only a few microm below the surface. The material removalmakes the process destructive. Both methods require dismantling portions of the details to get readings in comtricted areas(e.g. inside the clevis slot).
The x-ray diffraction measurements were taken at the full set of test points at the undisturbed surface and after a smallamount of material was removed. Some dismantling of the clevis pieces was needed to get access to the points inside theclevis. This was done after the readings were taken on the external points.
Two piecesofcasemembrane wereusedasmaterialcomparisonstandardsinmeasurementsofgraindislocationdensity.
One piecewas suppliedinthe"ascut"condition,andtheotherreceivedalabo.ratoryslressreliefheattreaunenttoremoveanyresidualstresses.
X-ray diffraction measurements were taken before and al%-r local material removal by electropolishing (etching). Thedepth of the material removed at each evaluation point was intended to be about 5 mils. This depth was selected toinvestigate the residual stresses that could exist at the depth of a surface crack that may not be detected. Table 1 lists thesequence of steps used in the test measurements at the points shown in Figures 6-8.
Table 1 Test Evaluation Sequence For X-Ray DiffractionSTEP TASK DESCRIPTION
1 Measure dislocation densities in the two pieces of reference material.
2 Layout measurement locations on the seven test pieces, and photograph the test piecns to record
measunm_¢nt locations.
3 Measure residual strains at prescribed locations. Measure dislocation densities at prescribedlocations.
4 Locally electropolish the test pieces to remove approximately 0.005 in. (5 mils) of material
from the surface of the pieces at the measurement locations.
5 Restore the layout of the measurement locations.
6 Re-measure the residual sl_esses at each prescribed location. Re-measure the dislocation
density at each point.
The actual material removal for the second set of readings were not sufficiently controllable to guarantee 5 mildepths obtained were closer to 10 mils.
REVISION ooc NO. TWR-18901
5EC ] OAGE
depth. The
IVQL

THIOAM'OLAIIIIOIIPA¢| & INOUIITRIAL YIICIqNOLOGilIII
C2B
C2A
Some of rite AECL
evaluation points
(57 in _1)
ClA
ClB
T4A
T4C
T4B
See Appendix A for dimensions
Evaluations made -, undisturbed
surface and - lO mils below surhce
Figure 6 Tang and Clevis Measurement Locations
Evaluations Mack at
Undisturbed Surface
and ~10 mils Below
Suffao)
See Appendix A for
Dbncmions
TIB
T1A
T4A T4BT4C T3A T3B
T2A
Figure 7 X-ray Diffraction Evaluation Points for Tang Specimens
REV1SION.._ OOC NO. TWR-18901 tVOL
I PAGEs_c 9
TDi I('OLA|IItOIlilAC I • INOUITIItlAt. TICHNOt.OG|i[II
S1B
Radial
Hoop lAxialFWD
S2B
S2A
See Appendix A for dimensions
S3B
Evaluations made at undisturbed surface
and - I0 mils below surface
Figure 8 X-ray Diffraction Evaluation Points For Stiffener Stubs
Following the x-ray diffraction work on the Tang-000 specimen, the piece was sent to the second test vendor to be
evaluated using the neutron beam diffraction method. The region forward of the second pin hole from the slot (4") was
investigated out to the tip of the tang (the hole on the opposite side of the slot that was investigated by x-ray di_on).
The neulron beam was able to peneuate the entire thickness with no material removal. The slress relieved calibration
sample cut from the case was also evaluated. Table 2 outlines the test procedures.
Table 2 ' Test Evaluation Sequence For Neutron Beam DiffractionSTEP TASK DESCRIPTION
Trim_'_:_'t spccima',to fit intoI_ _ flxum:wilh II_:_Mumion zoao pos_ _ _ _¢ of _ve_ _ m _the _Muation zone.
Mountthe test specimenin themms_t fixlxn and estabihh IheI_eOme_ricreferencepoints. 'T'_ _f_,_ poims us_ w_the tangoutsideand insided_ at themidpimeof firepinhole,andthe outboard(aft)edse of thepinhole atthe midplme.Checkthe nmgeof motionforthe evMuationzone.
Prolpramthe x-y driveconUoh to selecteach of the evallion pointsandcheckthe positioning.
Energize the measmeaml systemmd set theoticnlatim. Evalumethe beamdiffractionwhile focusedon each of the ira:.p_oBrmnm_l_Mulion sites.Takelhc _ ofthn_ readingsat_ point md record it
P._0ems_.p4 foreach 10_mori_mfion.
Rev_-wmedata_ consismncyando0nvmbeamdiffractionreadings to su-ains.
REVISION........_ ooc _o. TWR-18901 )VOL
sEc IPA6e 10

THIOI[OLAIIItOlliPACi • INIDUIITIqtlAL TIGNNOLOGIIIIB
6.2 DESCRIPTION AND JUSTIFICATION OF DEVIATIONS FROM THE TEST PLAN
After the test plan was written and released it was decided to involve two testing vendors to compare the effectiveness oftwo testing methods. The primary vendor selected was Technology for Energy Corporation (TEC) in Knoxville, TN. Themeasurement method they used was x-ray diffraction. The second vendor selected was Atomic Energy of Canada, Ltd.(AECL) at the Chalk River National Laboratories in Chalk River, Ontario, Canada. The measurement method they usedwas neutron beam diffraction. A description of the x-ray diffraction method is given in Appendix A. The neutron beamdiffraction method is described in Appendix B.
TEC conducted the test as described in the test plan. When TEC had finished the Tang-000 testing, it was sent to AECL tomeasure the residual stresses in the volume forward of a generic pin hole. This report presents the comparison of theresults.
NOTE: The test plan (reference 1) gives two incorrect designations for this segment. The title page refers to IU50716-06S/N L023 (a lightweight attach segment). The test component description in Section 2.0 refers to IU50715 S/N L032 (alightweight stiffener segment flown onflight 21A ). The DM-8 motor used the lightweight attach segment S/N L032 and thelightweight stiffener segment S/N L023. The correct designation of the test item is lightweight stiffener segment S/N L023flown on flights 14A and 24A. The similarity of the segment numbering gave opportunity for the confusion.
6.3 TEST PREPARATIONS
The test preparations consisted of identifying the case segment to be evaluated and selecting the pieces to be excised. Thetest specimens were extracted and prepared by Thiokol and then shipped to the test vendors' facilities. The locations for thetest measurements were marked on each test piece by the primaryvendor (TEC).
6.4 TEST FACILITIES
Two types of testing were employed in measuring residual sffesses. They were x-ray diffraction and neutron beamdiffraction. The x-ray diffraction tests were conducted at the TEC facilities in Knoxville, TN. The neutron beamdiffraction tests were conducted by AECL in the Chalk River National Laboratories in Chalk River, Ontario, Canada. Thetest vendors provided the equipment needed to conduct the tests.
6.5 TEST PROCEDURES AND INSTRUMENTATION
The test procedures were those appropriatefor beam diffraction measurements of residual strains in steel. This included thebeam generator (x-ray tube or nuclear reactor) and the equipment to measure the diffraction angle. The x-ray diffractionequipment was augmented with equipment and material to do local material removal by the electropolishing process. Allof this equipment and the depth measuring devices were provided and certified by the testing vendor.
Electropolishing was used to remove material from the test points in the x-ray diffraction method because the x-ray is onlycapable of penewating the steel a few microns. Electropolishing minimizes the disruptions to the residual stress field by notinducing thermal/meclmaical forces during material removal.
The neuu-on beam method is capable of measuring in-depth swains so material removal was not needed. No additionalinsU'umentation was required in either process.
Both procedures are based on electromagnetic wave diffraction at the grain boundaries where the beam is focused andutilize Bragg's Law. They use the wave diffraction angle to estimate the swains present in the material at the focus point.Having the sWainestimates at various directions at a point, they compute the stresses using Hooke's Law for the material.Qualitative estimates of the dislocation density are obtained fi'om the full-width half-maximum (FWHM). This is thediffraction peak width at half of its maximum intensity. The relative dislocation density is a qualitative measure of theintensity of the dislocations in the grain lattice structure of the material that is a signal of local plastic deformation.Increasing dislocation density suggests higher amounts of plastic deformation have occurred. (See the RecommendedReading list in Appendix A for more deal.)
REVISION ooc NO. TWR-18901 IVOL
SEC I PAGE ! I

THIOKOLAI[IItOIiPACIE • iNOUITRiAL TICFiNOLOGIIEI
6.6 SIGNIFICANT FINDINGS
6.6.1 GENERAL OBSERVATIONS
The testing provided generally consistent and reasonable data. No "bad" data readings were obtained because of the
interactive nature of the data collection process. A few of the test data points were re-evaluated and showed the intrinsic
variation. Each data point measurement provided an estimate for the residual stress and an uncertainty level. Only in the
low values of residual stTess were the uncertainty levels near the magnitude of the measured value. Uncertainty levels
ranged between 2 and 20 ksi with the higher uncertainty values corresponding to the higher residual stress magnitudes. Ingeneral the residual stresses were found to be low with the exception of the surface compressive stresses that are attributed
to the shot-peening effect of the glass bead blast cleaning.
Although the test measurements were interpreted as strains that are readily convened to messes, the relatively high
uncertainty levels for low readings interfered with the computation of principal stresses from the x-ray diffraction data.
This was because the measurements in each direction at a point are essentially independent and are not required to be self-
consistent by the measurement process. This shows up in differences between the results using the 0,45,90 measurements
compared to the 0,135,90 measmements. The readings obtained by repeating the evaluations at the "same" point showed
more variations than the error term. This was assumed to be due to the difficulty of assuring the beam is focused on thesame spot and the inherent level of variability of the metal grain structure.
Neutron beam measurements of strain dealt only with three orthogonal directions at points that were on a plane ofgeometric symmetry. Since no oblique directions were evaluated, it was not possible to demonstrate that this was also a
plane of symmetry for the swain. The evaluation of su'esses was further complicated because independent readings weretaken in the axial, radial, and hoop directions, and they were not always taken at the same location in all three directions.
An overview of the results are given in Figures 3 and 4. Detailed data listings of the readings can be obtained from the two
Appendices. Appendix A gives the information for the x-ray diffraction measurements, and Appendix B gives theinformation for the neutron beam measurements. The x-ray diffraction residual strain measurements were converted tosuesses by the vendor.
The neutron beam diffraction measurements were reported as strains. The strain measurements were taken at three
orthogonal directions (axial, radial, and hoop) with no readings at intermediate angles. This means there is no way to
estimate the shear strains. A quick look at the x-ray diffraction data shows that there are possibly significant shear strains
away from symmetry lines (e.g. around the pin holes that are next to the alignment slots or on the stiffener stub), and it
would be inappropriate to assume they were zero in some cases. There is enough uncertainty for the points located where
there is geometric symmetry (e.g. point locations T4A, T4B, and T4C) that it cannot be claimed with certainty there is
strain symmetry. The shear stress values obtained in the geometric symmetry conditions are small, however, and may be
resulting from measurement noise. It is often not possible to distinguish between measurement uncertainty (noise) andactual swain values where the strains are small and the noise is of the same order.
The only points evaluated by the neutron beam method were on the geometric symmetry plane extending aft from the
center of the pin hole on one of the 4" pin holes on Tang-000. (Note: x-ray diffraction measurements were taken on the
other 4" pin hole on the opposite side of the alignment slot on this specimen.) Su'ess estimates for the neutron beam
measurements have been computed as part of the test data evaluations using the isotropic form of Houke's Law. Assuming
shear swains are small on this geometric symmetry plane allows these to be treated as principal stresses.
Photographs of the test specimens at various stages of the x-ray diffraction testing are shown Appendix A. Appendix B hasa photograph of the neutron beam diffraction test facility.
6.6.2 TEST DATA EVALUATIONS
The x-my diffraction evaluations were successful in showing the surface residual stzesses and observing the generally rapid
decline of those residual stresses with depth into the material. All surface evaluations showed large biaxial compressive
residual stresses. They were in the range of-100 to -150 ksi with uncertainty values under 30 ksi. Typical uncertainty
REVISION ooc N0. TWR*I8901 [rOE
sEc j PA_E 12

THIOd OLAEROSPACE • INDUSTRIAL TIICHNOLOGIE8
values were around 10 ksi. No tensile surface residual su'esses were found at the surface across all points evaluated on all
of the specimens.
Subsurface evaluations at depths of up to l0 mils showed mixed compression and tension values. The compression values
were substantially decreased from the surface values. The largest magnitudes of the compression residual su'esses werebelow 90 ksi with most of them below 20 ksi. The tensile residual stresses found at depths up to l0 mils ranged in
magnitude of 2 ksi to about 29 ksi. Uncertainty values for the subsurface measurements were generally under l0 ksi, with
typical values under 5 ksL
The residualsmeasured by x-raydiffractiontellsimilarstorieson thetang(pinholes,alignmentslot,and leakcheckport),
theclevislegs,and thestiffenerstubs.Ingeneral,thereisa biaxialcompressiveresidualon allsurfacesintheorderof-130
ksi. These su'essesdrop offrapidlywithdepth intothe part.At I0 milsdepth thereare mixed compressiveand small
tensileresidualstressesthatareconsistentwithlocalyieldingfrom proofand flight.No particularpatlerncouldbe found
on thestiffenerstubholes.Notingtherelativelylow waterimpacteffectsencounteredinthetwo flights,itistobe expected
thattherewould be irregularvariationsfrom holetoholeon thestiffenerstubs.Detailedresidualstressdataareincludedin
Appendix A.
The maximum tensile residual stresses found at the 10 mil depth were in the outboard surface of the tang between the pin
hole and the tip of the tang. The highest readings were at the T4C evaluation points. These were between the edge of the
pin hole and the tang tip on the second hole from the alignment slot (4"), about 0.56 in. aft of the edge of the pin hole. The
peak values for the Tang-000, Tang-118, and Tang-240 test pieces were +16.4 ±5.2, +27.6 ±4.2, and +28.1 ±2.7 ksi,
respectively. A repeat of the reading on the Tang-240 specimen gave +22.7±3.6 ksi. These were all for the 0"
measurement direction(hoop)atpointT4C. Using themeasurements atthe0", 135",and 90" directionsforthe largest
Tang-240 readingsuggeststhe0"directionisa principaldirection.Using the 0",45",and 90"directionssuggeststhereisa
shear stress of about 2 ksi. As noted above, this may simply be due to measurement uncertainty. In either case, the
maximum principal stress of about 30 ksi is indicated by the first reading on Tang-240. This estimate includesmeasurement uncertainty and the possibility of some small shear swains. The average of the two readings on Tang-240 is
25.4 ksi, which would suggest a maximum principal stress around 28 ksi.
The holes next to the alignment slots are known to have the highest pin hole loading because they must support both the
axial bearing loading and a component of hoop loading to bridge across the missing pin at the alignment slot. This loading
must be distributed between the tang and the clevis legs across the slot through the pins adjacent to the slots. This load
redistribution carries on to the 4" and 6" holes in much smaller proportions compared to the 2" holes. This could account for
some lack of swain symmetry at the 4" holes. The effect is probably small enough at the 4" (and even smaller at the 6")
holes that it is masked by the measurement noise level.
The in-depth residual strains measured by the neutron beam diffraction method were successfully obtained for a large
number of points between the edge of the pin hole and the tip of the tang at the second pin hole from the alignment slot
(4"). A pattern of tensile and compressive strains were obtained that were compared to the analysis predictions for a
generic pin hole after unloading from a proof test pressure cycle. Part of the comparison plots are presented in Figure 5,
and the complete set is presented in the vendor report in Appendix B. The measured results showed trends in general
agreement with the analysis results. The AECL estimate of the upper bound on the su-ain measurement error was +310 x
10-6 in/in. This is equivalent to about ±9 ksi. This is a conservative upper bound (95% confidence level) that places theerror bounds of both methods at about the same level. The AECL data did not give a specific error bound for each reading.
Comparisons of the data fi'om the two vendors must recognize that they used different conventions for the measurement
directions. TEC data (x-ray diffraction) used the hoop direction as the first evaluation direction (0"). The direction for the
second reading depended of the location of the measurement. The determiner was the normal direction at the surface point.
Readings could only be taken in the surface plane of the test piece. The normal stresses on a free surface are zero. On the
tang and clevis points the axial direction was at the 90" orientation. On the stiffener stub, regions 1 and 2 had the radial
direction corresponding to the 90" direction. In region 3 it was the axial direction. The AECL data (neutron beam
diffraction) assumed the evaluation order was axial, radial (normal), and hoop at all points. Since these were all internal
points, the normal stresses were not zero.
REVISION....__ 00cN0 TWR-18901 ]v0L
SEC JPAGE 13

ABROIIPACm • INOUSTRL_I* TICNNOLOQIlll
No direct comparisons between the two measurement methods were possible because they had no common pointsevaluated. The x-ray diffraction work focused on surface and near surface residuals, the neutron beam diffraction work
emphasized in-depth measurements. An approximate comparison between the two methods was done on the outboard
surface of the tang near the location of evaluation points T4A, T4B, and T4C for all three tang specimens for the x-ray
beam and the points through the tang thickness at about the same positions relative to the pin hole measured by the neutron
beam. As noted above, tensile residual stresses were found at a depth of about 10 mils. The neutron beam evaluations
made nearest the surface were at a depth of I mm (-39 mils). Looking at the trend of the stresses obtained through the tang
thickness at points near the x-ray measurement points, an extrapolation from the 39 mils depth to the 10 mils was used as a
basis for comparison. Table 3 shows the results. These values indicate very similar patterns measured by the two methods.
The trends of the average of the TEC tang data and the crudely exwapolated AECL data are shown in Figure 9.
Table 3-Comparison Of Key Residual Stress ValuesX-RAY NEUTRON BEAM
POSITION STRESS - KSI STRESS - KSI POSITION
ID AXIAL DEPTH HOOP AXIAL AXIAL HOOP AXIAL DEPTH
IN. IN. MM/IN. MM/IN.
T4A 3 I000 0.088 --8.01 -61.9 -13.0 18.2 -36A 0.118 0.039
T4B 3 7.+000 0.305 --O.01 8.3 -15.2 - 0.8 -58.6 0.118 0.291
T4C 3 I 1.+000 0.545 --0.01 16.4 - 1.5 16.1 -60.2 0.118 0.448T4A 7 1
I 18 0.075 --0.01 -40.6 - 9.8 -12.6 *8.1 0.276 0.039T4B 7 7.+118 0.320 --0.01 -24.9 -43.4 - 7.9 -13.4 0.276 0.291T4C + 7 11.+118 0.565 --0.01 27.6 -22.3 4. ! - 4.0 0.276 0.448
T4A i I 1240 0.105 -0.01 -72.0 *i4.7 - 7.8 8.1 0.433 0.039T4B I 1 7.+240 0.324 -4).01 -21. I -40.2 7.8 26.0 0.433 0.29 ITIC I 1 1I.+240 0.555 --0.01 22.7 -6.1 -10.1 10.1 0.433 0.448T4A 15 Iave -58.2 -12.5 - 0.8 - 0.8 0.591 0.039T4B 15 7.+
ave -12.6 -32.9 - 1.9 ! 1.9 0.591 0.291T4C 15 11 .+ave 22.2 - 9.8 1.4 16.1 0.591 0.448
Residual measurements taken 45" off-axis at the 2" holes in the tang (locations T3A and T3B) showed surf_e and
subsurface values similar to the T4 measurements. There was a general biaxial compressive stress on the surface which
dropped off quickly below the surface. The subsurface residual stresses found on the 2" holes (next to the alignment slot)
were somewhat less than those found at the 4" holes. There were too few measurements taken to establish the pattern of
residual stress around the hole to determine at what angle the highest residuals
REVISION......._. ooc NO. TWR.18901 I VOL
sEc ]PAGe 14
THIOKOLA[INOIIPACI[ • INDUSTRIUkL. TECPiNOLOGIIll
30
20
10
0
-10
-20
-30
-40
-50
-60
a'_.\ /./==
0.2 /o.4. _ ol6
/
Axial Distance From Pin Hole, in.
_TEC axial
--B-- TEC radial
AECL axial
--Q-- AECL radial,
Figure 9 Comparative Measurement Trends
Evaluations of the dislocation density readings obtained by the x-ray diffraction method showed small variations fi'om the
case membrane control samples, with the stress relieved specimen showing a slightly lower reading. This was taken to be
an indication that even though there were some plastic deformations, the amount of deformation was relatively small.
Dislocation density readings for the case wall samples are presented in Table 4. Figure 9 of Appendix B shows a general
uend of the dislocation density that decreases with the axial distance from the tang pin hole.
Table4 Typical Dislocation Density Readings By X-Ray DiffractionRESIDUALSTRESS DISLOCATIONDENSITY
KSI INDICATOR*
3ASE SAMPLEA -50.2 ± 5.4 2.3no s'tmssrelief)
CASESAMPLEB -14.7 ± 3.4 1.9sUessrelieved)
6.6.3 INFORMATION FROM STRESS ANALYSES
An overview of the nonlinear stress analysis results for the case factory joint is given in Figures 10-13. They are based on
computer runs reported in Reference 4. These are the analyses used in the results comparisom reported in Appendix B.
The analysis of the factory joint was done for a generic pin location subjected to a pressure of 1070 psig. This is
significantly higher than the maximum expected operating pressure (MEOP). The pressures imposed in flight and static
fwing involving this stiffener segment were considerably lower than MEOP at the forward case field joint. This is because
the gas dynamics of motor operation results in a pressure drop in the at_ regions of the motor and MEOP is a statistically
conservative number. The proof pressure, on the other hand, is selected to be higher than case MEOP. The peak proof
pressure at the time Lightweight Stiffener SN 1.23 was proof tested and used was 1070 psig. The proof pressure currently
imposed on the lightweight stiffener proof tests is 1055+30,4) psig. Figure 14 gives a qualitative view of the yield zones
developed around the pin holes, leak check port, and alignment slot from successivepressurizations. The yielding effects
around the pin holes adjacent to the alignment slots (2" holes) are not shown, but they have slightly larger yield zones that
are not aligned with the axial direction, but are skewed toward the alignment slot. Figure 15 shows the t'mite element model
use to study the behavior of alignment slot region [5].
REVISION 00¢ NO. TWR-I8901 [VOL
SEC ]PAGE 15

TI,AINOIPA¢| • INOUSTNk_L TE¢ffNOLOQI|S
Figure 10 Finite Element Model of Typical Factory Joint Pin Locations
mOOK 4_o
II_a ILlm3 IJZ IZlI8
li$11. ,.4.1s.;4mecs.4.1s711wmJ i.tls41k4i$ o.ls49oe4w71123. -15)46. -4.14Salk_J I.lH41k4M O.14?lSW_
0.10_tlEa4JS 0740_. -¢.104_10*4M 0.1|441Ie4_ e.1O_O*_J
i.II*N_44S IllS. ,4JtINOW)S g.]gOSiS_0S 0.|447Ee4)S
0.15708_0S -IIIL ..47"J0. 0._)4JS*41S 1.1iS]m_4t7_. 471.] -II)41L N26. S44S.
Figure 11
REVISION
FE Analysis Results for Tang Nodes
ooc NO. TWR-18901 [VOL
SEC ]PAGE 16

•AINOIPAC| • INDUITN_L TICHNOLOGI88
mmm • S
5_1 ?$,44_ 1.]|31_ Z6.M 1._$?L$ _.44_ 1.]021_ X.$$_ 1._0
5715 73.44_ 1.1|21_ 14.$?_ 1._
4_? 75.44_ 1.2511_ 34.715_ 1._
4_9 71.44_ 1,2821_ ll.l_ l.m4Mr _.44_ 1.3821_ 36._ 1.1
45_ 75.44_ 1.2821_ 37.154_ I*D
4N$ _.44_ 1. 3521_ 17.2_ l.m4H? _.44_ 1,3821_ 1?.410_ 1.t
Mn 75.44_ 1.3|]1m _.W l*m
'i'm 21m
o.0000000B8440 (I, 050000_
0.00000000Ee4i0 0. 0000000011_,0420,0000Bit_ 0.00_844i0
0.0120009001;440 0.04_-44
0.01)O4_ 0,00000000ir_
0._ 0.04)04NHi00844200,00'8_ 0.000000008*44
0.440000001+40 0. H4PO0000K *,4Hi
0,84_ 0.004444_0.1_ O .44444_
ailed _ LDI mmR mSTlla_ 8_J_8
lU4DSJtk N00f IdtZ&L1088 IR _r 81
$7Q1 -4.187_*42-4.1|34f44_ ]144.
571) -1437. --4.14211_4_ 2541.
$125 0.1170J44S-4.1041J_e4 $421.
4127 |M?. -4. IS$7S_0S 4$$$.4249 -45].0 0.37508_e$ Se4$.
4M1 oll_i. 0.11JTS*e$ 7810.
4$7] -41.84 0.t&lllk4$ $]6.4442 16.45 HI3. 3011.
eSJ? IS.70 7917. 1451._el 01.12 4441. 577.1
4431 a.14 4547. 343.|
m m Into
3424. _.473_$ _1_.
44$.0 97.|$ _xs.-_t01HI. 880$. -472.$
*INS. )M. 244.S
123.0 -439.2 2L.2212$.1 -4_.4 _2a.3
74.U -4n.2 -24HI.2
$2._ -_.0 -4tS.431.$:1 0545.$ -41;35
3].10 -|U.4 -L2.74
I_ _ J_] JZ Jta
113I. 4.I114i.484.2}?N44i 0._)4)I*N 0.1f341441
1045. -St4l. -4.|l)0I*01 0.4720_4M 0.14NK444
0.14n8_05 |g3O. 4.1051844_ 0.LlI4844N 0.1437B4440.13441k49 4321. -4.22441k4S 0.25?08445 0.32251445
O.201NNk49 S00S. -1298. 0.300Mk4S 0.27048445
0.1_Sl442 7M2. -1194. 0.1824r_0S 0.X_ISE44S$.U4_S $272. -115.1 0.12_$ 0.1_$
11_P. _N_O. -1.$18 S712. 0447.
4442. $H.5 ?0.43 I)17. ' 0445.
4)44. 2S1.1 24.07 4)04 • 4210 *
XOO( _1
Figure 12 FE Analysis Results for Outer Clevis Leg Nodes
$_1 -4.12020e41_5-4.104011e44o4.t4291441$ $._.ilHJ40e4S-il.342];J442 _l_l$.
$T]1 -3$]1. 4.101M)*40-I.li141*tl INI. 440011k4J --2ii.4$724 0.L0141k4J-4.151Mle44-4.t$75P1442 1494. -9730. 2SlM.
4H$ -m.$ 4.744N -1044. -3871. 38_1. 17_.
4227 -_t024. -2321. 1$25. -1044. 42144. 2)40.4241 -1011. 0.401H1,45 3444. I22.20 171.$. -L/LN.
4M1 215.1 0. ]104m449 144$. 2215.? lr?l.. 2 -1_44.
45M$ 211.7 0.104Nk_J 044.4) NI.]i 177.1 -7122.2
I I
I.$_ItMN)MI*44 O.0_H)MHHII*MI.I I .HNNNH
0.I i. H0it01il_i
0.I O. 44044N4Hk400._ O. 444444448*ee
0.I $. 444444441_0
0oi 0.44wwwm40
-N$I. 4.t|)lldl4.|lllqP41 i.21111*4H |.tH�l*4i
*$|JJ. --4.l_l_844S-4.t0)41_44 0.24431k4_ 0.1244Hk4_
1.11|J004FI-e.140sme4S-e.121$s_4k6 0.142UP*4k8 0ol2251_4_?ON. -4H_. -e.?0|711*42 e.4451_45 0.74498445
$.4$42844$ --_H_. -0.10_,k45 e.275H445 0.34121*45
$.27400242 _/]2. -1400. $.1|7_qk45 0.20011.e$$.]10M_42 2304. -$]$.? $.22244_D$ 0.40551*45
04244_45 t41S. *_4.1 $.18_k45 0.17_20445
Figure 13
REVI$1ON...._
FE Analysis Results for Inner Clevis Leg Nodes
oo¢ NO.
SEC
TWR-I8901 IVOL
IPAGE 17

THIOI( DLAIAOSPAC| • INOUSTNk_L TECNNOLOGI|g
. "_ ,-, _} White none
Grey : once
Black = cyclic
"... ...-
Figure 14 Yield Zones for a Typical Pin Hole and an Alignment Slot
Figure 15 Finite Element Model of the Alignment Slot Zone
REVISION____ DOC NO. TWR.18@01 IVOL
SEC IP_GE 18

THIOKOLAI[NOIPACE • INOUSTRIAL Tl[GI4NOLOr:if II
.
Number
IU50715
STW4-2606
STW7-2608
MIL-STD-45662
APPLICABLE DOCUMENTS
Title
Stiffener Segment, Lightweight Case
Steel, Alloy, High Strength, D6AC (for Space Shuttle SRM Case Components).
Heat Treatment, Alloy Steel, D6AC (for Space Shuttle SRM Case Components).
Calibrate System Requirements.
Elecn'opolishing Machine Instruction Book
8. REFERENCES
!. ETP-0403, MEASUREMENT OF RESIDUAL STRESSES AFTER HYDROPROOF AND FLIGHT IN RSRM CASE
SEGMENT IU50716-067 SERIAL NO. L023. (shouldbe 1U50715), August 1988
2. ETP-0221 Rev A, EVALUATION OF OVERHEATED AFT CASE SEGMENT FROM DM-8, Sept. 1988
3. TWR-19326, STIFFENER SEGMENT DAMAGE CAUSED BY WATER IMPACT LOADS, July 1991
4. TWR- 17118 Rev A, RSRM CASE STRUCTURAL ANALYSIS SUMMARY, April 1988
5. TWR-65866, FACTORY JOINT ALIGNMENT SLOT/LEAK CHECK PORT ANALYSES (4 volumes), Feb. 1994
REVISION.___ ooc NO. TWR-18901 IV0L
SEC IPAGE 19

AIROIPAC I • INDUIITNLAt* T|CHNOLOGI|II
APPENDIX A o VENDOR REPORT FOR X-RAY DIFFRACTION MEASUREMENTS
The attached report and data summary pages were submitted by Technology for Energy Corporation (TEC) at thecompletion of the residual stress (strain) evaluations made on the seven pieces excised from the heat damaged forwardstiffener segment from the DM-8 static ruing. These pieces were selected from portions of the case segment where therewas no evidence of heat damage. This test article is considered to be representative of a case stiffener segment that hasexperienced three proof tests and negligible flight/recovery damage.
REVISION OOC NO, TWR-Ig901 IVOL
SEC I PAGE 20

i ,I-I1_:TECHNOLOGY for ENERGY CORPORATION
November 29, 1988
In reply, refer to:1188-EBSP-1705-32946
Morton Thiokol, Inc.Utah Tactical Division Building X-201080 North Main Street
Brigham City, Utah 84302
Attention: Dr. Dan Suthedand
Subject: Morton Thiokol, Inc. Purchase Order No. 9MN026Transmittal of R-88-049
Enclosure: TEC Report R-88-049
Dear Dr. Suthedand:
In accordance with the above subject contract, Technology for Energy Corporation (TEC)transmits herewith the data as required in the subject pumhase order.
If additional Information and/or clarification is required, please advise.
Sincerely,
TECHNOLOGY FOR ENERGY CORPORATION
Beth Pardue
Project Manager
EBP:bsh
CC: R.D. Wright, TECK.T. Woods, TEC
Morton Thiokol, Inc. Purchasing Department (Letter only)
ONE ENERGYCENTER LEXINGTONDRIVE P O BOX22996 KNOXVILLE.TN 37933-0996 PHONE (615) 966-5856 TELEX810 57G 1770


m
n
d
B
I
m
MORTON THIOKOL, INC.
RESIDUAL STRESS SUMMARY
TEC Report R-88-049
TEC PON 9MN026VOLUME 1 of 3
Prepared for:
Morton Thlokol, Inc.Utah Tactical Division Building X-20
1080 North Main Street
Bdgham City, Utah 84302
Submitted by:
Technology for Energy CorporationOne Energy Center, Lexington Ddve
P. O. Box 22996
Knoxville, Tennessee 37933-0996(615)96S-5856
Telex: 810-570-1770
November 29, 1988
i


MORTON TtilOKOL
Residual Stress Summary
RSRM Case Segment
Surface and subsurface residual stress measurements were made on seven pieces of D-6 ac solid
rocket booster casing sections. These sections were identified as follows:
Clevis 118
Clevis 240
Tang 000
Tang 118
Tang 240
Forward Stiffener Stub 166
Aft Stiffener Stub 166
Photographs and drawings of measurement locations are attached.
The testing followed Morton Thiokol Document WI'P-0403, "Measurement of Residual Stresses After
Hydroproof and Flight Loadings in RSRM Case Segment 1U50716-06 Serial No. L023."
Surface preparation consisted solely of removing paint on the painted sections. Paint was removed
without mechanical abrasion, which would alter the surface residual stress. The paint remover, KS-3
Paint Remover*, was applied to the surface until the paint loosened from the surface. The paint was
then removed by wiping with a soft cloth. Alcohol was wiped over the surface to remove any
residual KS-3.
The measurement locations were marked and photographed. Surface measurements were made at nil
accessible locations. After these measurements were made, sections of the stiffener stubs were
removed to allow access to the S 1 and $2 locations and sections of the clevises were removed to
allow access to the C2 locations. This sectioning was done by EDM milling. Upon completion of
the surface measurements, 10 mils of material were removed by electropolishing. Electropolishing
* Contains Methylene Chloride, lsopropanol, Ethylene Gycol Monobutyl Ether, and less than ,1%Methanol.

solutionsusedwere91%ButhylCellusolve,9%PerchloricAcidor 50%NitricAcid,50%Water.
Thesesolutionswererinsedfromtilesurfaceswithwaterimmediatelyafterelectropolishing.Alcohol
wasusedasafinal rinse. The measurement locations were again marked and subsurface
measurements made.
Measurement of Stress by X-Ray Diffraction
Of the various techniques for measuring residual stresses, the x-ray diffraction method is the most
developed and widely used. It is the only technique that is applicable to all crystalline materials, that
can measure the absolute stress in the component without the need for a measurement of the sample
in the unstressed state, and that is capable of making measurements in a localized region as small as
I mm in diameter. Because the penetration of the long wavelength X-rays is only a few tens of
microns, the Model 1600 Stress Analysis Systems are used to measure surface stresses.
Stresses are determined by measuring the strain in the atomic lattice and by relating the strains to
stresses through the elasticity theory. An incident beam of essentially monochromatic radiation of
wavelength _. is diffracted at an angle 20 which obeys Bragg's Law
n_. - 2(I sin0,
where n is the order of the reflection and d is the atomic spacing of the selected crystalline lattice
planes. The sample surface is at an angle 0 to the incident beam, and only grains with atomic planes
parallel to the surface diffract. From the 20 position of the peak, the atomic spacing of the diffracting
planes may be determined.
SOURCE
--- -- (STRESS}
X -RAY
SOURCE >.
PSPC
o(STRESSJ
I
i|
I
2e

When the sample is tilted at an angle _, the atomic planes that make an angle W with respect to the
surface now diffract. If there is no stress in the sample, the two diffraction curves superimpose.
However, in the presence of surface stresses, the atomic planes in different orientations are
compressed or dilated and a peak shift results. The stress, o, can be determined from the shift
through the relationship
E [ (d_F - do)
I + v sin _ ¥ do
where d¥ is the lattice spacing at a tilt angle _ and E and v are Young's modulus and Poisson's ratio
appropriate to the selected crystallographic planes. The values old V are obtained from Bragg's Law
(Equation 1) by careful analysis of the diffraction peak. Note that is is not necessary to know the d-
spacing of the unstressed material. Thus, an accurate and rapid measurement of the location of the
diffraction peaks can be used to determine the presence of loading or residual stresses.
The specific parameters used in this test program included:
Radiation: Cr Ka (Z = 2.29092,_)
Power: 35kV, 1.5 mA
Beam Size: -2 nun diameter
Data Acquisition Time: 60s at W = 0
A summary of the data along with the computer-generated data sheets are attached. The standard
reference material data for the as-received and stress relieved conditions are included for comparison.
The full-width half-maximum (FWHM), the diffraction peak width at half of its maximum intensity,
is a qualitative measurement of dislocation density, in other words, the larger the FWHM is, the
higher the dislocation density is.

Therepeatibility(precision)of the x-ray stress measurements on steel is generally within 5% or 5 ksi,
whichever is grealer. The error bar reported with the stress value is comprised of both counting
statistics errors and uncertainty due to metallurgical and mechanical factors (i.e., preferred
orientation, large grain size, stress gradients, shear stresses). This number is, in general, very
conservative.
The accuracy of the technique is within + 10 to 4-15 ksi. A discussion of sources of error can be
found in James and Cohen, "The Measurement of Residual Stresses by X-Ray Diffraction
Techniques," Treatise on Materials Science and Technology, Voi. 19A, 1980. The largest source of
error is the x-ray elastic constant, (1 + v) / E. This term generally varies from the bulk value by 10%,
but can vary as much as 50%. The x-ray elastic constant is multiplied by the slope of the d-spacing
versus sit_¥ line as part of the conversion from stain to stress. The value used in this program was
measured experimentally and reported in the open literature.
m
m
mm
qmm
m
iNto
m
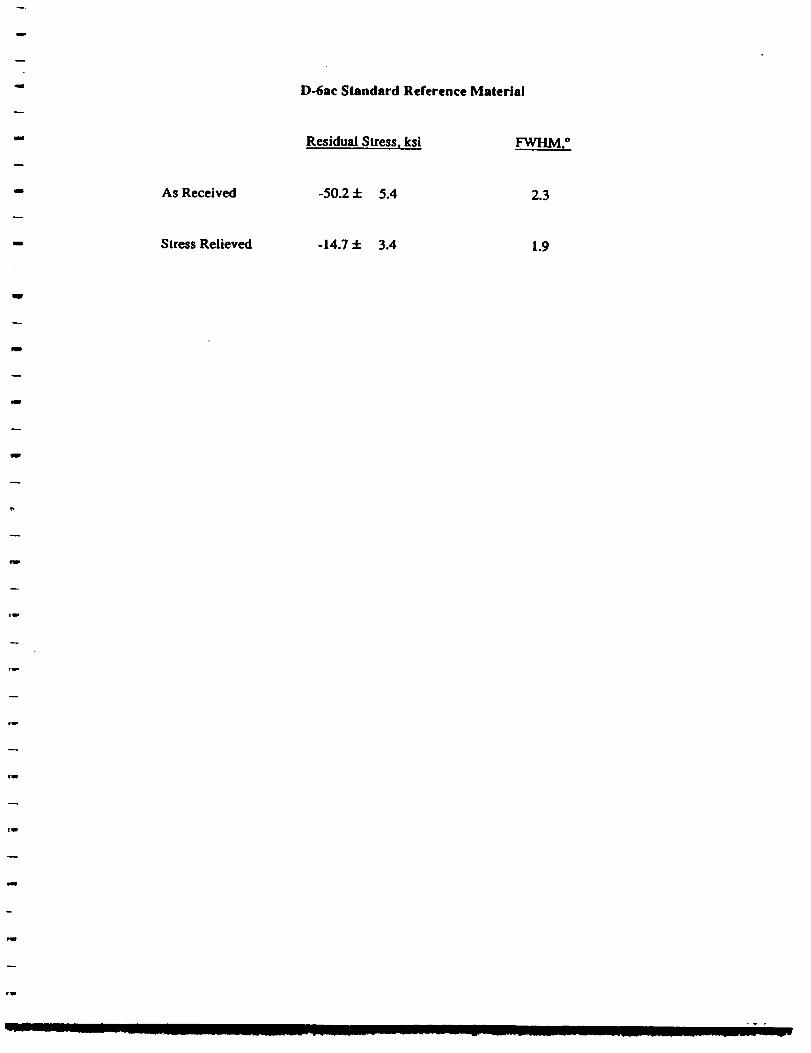
D-6ac Standard Reference Material
Residual Stress, ksi FWHMT
As Received -50.2 + 5.4 2.3
Stress Relieved -14.7 + 3.4 1.9

RecommendedReading
B.D. Cullity, Elements of X-Ray Diffraction, Addison-Wesley, Reading, MA, 2nd Edition, 1977, pp.447-477.
M. E. Hilley el al., (eds.), Residual Stress Measurement by X-Ray Diffraction - SAE J784a, SAE,Warrendale, PA, 1971.
Noyan and Cohen, Residual Stress Measurement by Diffraction and Interpretation, Springer-Verlag,New York, 1987.
Metals Handbook, ASM, Metals Park, Ohio, 9th Ed. Vol. 10, 1986, pp. 380-392.

"X1, 3(2 ARE LOCAL DIRECTIONS OF THE ANSYS
FINITE ELEMENT COORDINATE SYSTEM

____ Residual Stress Analysis Report ____'_
ze: 01-0CT-88 Time: 11:05:19
Sample Description :
MORTON THIOKOL/REFERENCE SAMPLE/STRESS RELIEVED
LONG DIRECTION
System Hardware Configuration :
Auto F'si Angle Drive
Psi Angle Position Encoder
ADC Channels Full Scale
Collimator Slit Type -
256
Rectangular 1.50
X-ray Target Material and Wavelength
Detector Mounting Block Bragg Angle
PSI Oscillation Angle Range
High Voltage and Beam Current
Peak Bounding Range (percent)
Chromium 2. 29092
156.00
0.00
35000. i. 50
20.
Material ID Number
Material Type D-6AC
55
(Cr 211)
Stress Spectra File Specifications
Stress Spectra Acquisition Date:
Stress Spectra Count Time (see)
01-0CT-88
000408.SPC
11:03:54
60
....libration File Specifications CLC256.156
Detector- Calibration Coefficients
A -0.675706E-08 B 0.254374E-05 C 0.0593568 D 148.3517
Psi Sin'2(Psi) Pk Chan Intens FWHM
-45.0 0.50457 139.75 737.8 2.13
....25.0 0.18138 137.91 812.6 2.17
0.0 0.00001 136.35 933.6 2.12
25.0 0.17613 137.18 857.0 2.13
45.0 0.49592 138.80 807.7 2.12
Kalp Cor
0.15424
0.15374
0.15287
0.15326
0.15382
2-Theta D Spacing St. Dev.
156.52 1. 169926 0. 000029
156.41 i. 170159 0.000031
156.32 i. 170355 0.000027
156.37 I. 170250 c'_.000029
156.47 1. 170045 0.000026
Fitted Delta D vs Sin_'2(Psi) Data
D Spacing Intercept
Slope of Fitted Line
Material Stress Constant
Residual Stress
Counting Statistics Stress Error (+/-)
Goodness of F£t Stress Error (+/-)
Total Stress Error (+/-)
-19. i ksi
1.6 ksi
4.1 ksi
4.4 ksi
i. 170344
-7. 236994E-04
3. 240000E-08
-131.6 MPa
11.3 MPa
28.5 MPa
30.6 MPa

Sample Description :MnRTONTHIOKOL/REFERENCESAMPLE/STRESSRELIEVED
_G DIRECTION
Stress Spectra File Specifications
Residual Stress (ksi) -19.(:)9Statistical Error (+/-) (ksi) 4.44
1.171141- d(psi) J-__FH_II.IL_ ,..,:_.c:in..-.id(F,:_i)
(')C)(')4 (')8. S F'C
(mpa) -131.59
(mpa ) 30.65
• i,, _c),_,._,:_-
i. 170GSS-
i. i70412 -4 >
_.1701-q
i , " ._O----C-';,.-- tib ._.,b ,=,s
L.
-_... ><
S:in .,',_'(p s:i )I I I I I I I I
0.0 E).i 0.2 (..-_.3 0.4 0.5 0. Ei 0.7 q-._.:::

Residual Stress Analysis Report
_e: (]II-0CT-88 Time: I0:46:2A
Sample Description :MORTON THIOKOL/REFERENCE SAMPLE/AS RECEIVED
LONG DIRECTION/ROTATED 180 DEG.
System Hardware Configuration :
Auto Psi Angle Drive
Psi Angle F'osition Encoder
ADC Channels Full Scale
Collimator Slit Type -
256
Rectangular 1.50
X-ray Target Material and Wavelength
Detector Mounting Block Bragg Angle
PSI Oscillation Angle Range
High Voltage and Beam Current
Peak Bounding Range (percent)
Material ID Number
Material Type D-6AC
Chromium 2. 29092
156.00
0.00
35000. i. 50
20.
55
(Cr 211)
Stress Spectra File Specifications
Stress Spectra Acquisition Date:
Stress Spectra Count Time (sec)
01-0CT-88
000407.SPC
10:45:01
60
_libration File Specifications CLC256.156
Detector Calibration Coefficients
A -0.675706E-08 B 0.254374E-05 C 0.0593568 D 148 _ _
Psi Sin' 2(Psi) Pk Chan Intens FWHM
-45.0 0. 51038 151.01 17.0 2.64
-25.0 0.18037 135.40 45.3 2.76
0.0 0. 00000 133.32 60.7 2.59
25.0 0. 17660 136.02 46.8 2.47
45.0 0.49_()3 146.35 18.3 2.91
Kalp Cot
0.16033
6).15443
0.15347
0.15404
0.15897
2-Theta D Spacing St. Dev.
157.19 1. 168535 0. 000033
156.26 1. 170480 0.(])00155
156.14 I. 170745 0. 000127
156.30 i. 170400 0. 000170
156.91 i. 169108 0. 000088
Fitted Delta D vs Sin"2(Psi) Data
D Spacing Intercept
Slope of Fitted Line
Material Stress Constant
Residual Stress
Counting Statistics Stress Error (+/-)
Goodness of Fit Stress Error (+/-)
Total Stress Error (+/-)
-111.3 ksi
6. i ksi
21. i ksi
2_ 0 ksi-"m
i. 171001
-4. 221517E-03
3. 2400__0E-08
-767.2 MPa
42.3 MPa
145..3 MPa
15!. 4 MPa

Sample Description :M°RTONTHIOKOL/REFERENCESAMPLE/AS
_G DIRECTION/ROTATED 180 DEG.
Stress Spectra File Specifications
Residual StressStatistical Error (+/-)
1.1713°7- d psi)
I • I _"I_4. m,
1.17(}192-
1.16;9640 -
i. I_9E:$3S-
•I .I _--"?. ,-_'.---'--,..I.
,A
... -.....• °..%
"-..
RECEIVED
(ksi )
(ksi )
•'--' I ."- I'--"d->F H_ ING
-111.27
21.96
,.,:-":: :27:ir,...-.;.--'( p _._i )
"°,_.
%....
"-._.
"v"._...
,,,..
_°.
,:)00407.SPC
(mpa) -767,16
(mpa) 151.38
ci r,.,'-.2(F' :-: i )I I I I I I I I


TECHNOLOGY for ENERGY CORPORATION
December 22, 1988
In reply, refer to:1288-ESSP-1772-32946
Dr. D. W. SutherlandHurton Thlokol, Inc.Structures Design, Aerospace GroupP. O. Box 707Brigham City, Utah 84302-0707
Dear Dan:
The exact locations of the stress measurements have been measured using aset of calibrated calipers. They are reported below and compared tolocations In your letter of 9/25/88 (L221:FY89:L06). These locationsrepresent the after etching locations. The electropoltshing removed somematerlal near the edge of the hole thus affecting the precise location ofthe measurement. Since TEC no longer has the Tang 000 sections,locations from this piece are not included.
If you need additional information, please contact me. It's been mypleasure working with you thls year, and I look forward to working wlthyou next year.
Sincerely,
TECHNOLOGY FOR ENERGY CORPORATION
E. Beth Pardue
Supervisor
Stress Analysis Laboratory
EBP/bsh
co: L. A. LoweryJ. C. Robinson
ONE ENERGY CENTER LEXINGTON DRIVE P O BOX 22996 KNOXVILLE, TN 37933-0996 PHONE (615) 966-5856 TELEX 810 570 I ," '_


/
Tanl 2_0
Clevis 118
Clevis 240
Number
T3AT3BTqAT4BTqC
T3AT3"TqATqBTqC
C1AC1BC2AC2B
ClACIBC2AC2a
NouLnal Location
_vou Bd_e of HoLe, ln.
0.150.31O.OT0.320.56
0.150.310.070.320.56
0.35O.OT0.36O.OT
0.350.070.360.07
Actual Location
froa Edse of Eole I in.
0.1510.3040.072 ,o'750.31U ,92o0.533 .5_
0.149o.3160.063 ./o50.308 ,3250.546 .._5.<"
0.3660.0760.3270.074
0.3580.0740.3260.110 "
hi4
"P @ C,,
._77_
,'bf_
,5_
.oo0
T_B
T_c.
o. 08_
O 3og

Evaluations Made atUndisturbed Surfaceand - I0 mils BelowSurface
See Appendix A forDimensions
T1B
T4A
T4B
T2A
T4C T3A T3B

Tang 000
Residual Stress, ksi
Angle Directions
MeasurementPoint e11(0°) eao_(45° ) e22(90 o ) ep (13s°)
T:L_k SurfaceSubsurface
-147.4 + 6.1+3.1 ÷ 3.9
-137.7 + 18.1:_7.8 + 2.8
-127.2 + 28.3+3.6 + 6.8
-136.8 + 17.0
+0.7 + 4.5
TIB -145.8 + 8.7+6.9 + 6.7
-141.0 + 10.6a
-1,1 + 4.6-121.6 +_.21.1
+2.9 + 6.4-136.0 + 14.3
o
+7.3 + 6.4m
T2A -137.1 + 6.7
-46.2 + 6.8
-128.0 + 13.3
-26.7 + 4.7-116.7 + 22.6
-16.3 + 4.8-126.7 + 20.0
-24.6 + 5,4
T3A -142.7 + 8.9
-89.8 + 6.3-137.I _+ 7.I
-78.0 _+ 4.1
-I36.8 + 6.2
-31.8 + 7.8
-140.4 + 7.3
-45.7 + 4.1
T3B Surface
Subsurface
-140.0 + 11.6
-83.6 + 5.4
-138.4 +_. 4.7
-16.1 + 3.8
-138.1 + 7.1
+1.8 + 5.9-162.1 ± 4.2)-146.3 _+ 6.2
-29.5 + 3.4
T4A SurfaceSubsurface
-147.1 + 8.6
-61.9 + 7.1
-131.9 + 9.1-47.6 + 4.8
-116.2 + 9.3-13.0 + 3.0
-134.3 + 5.0-36.9 + 3.1
T4B Sttrfa_Subsurface
-1396 ± 8.0+8.3 + 4.7
-133.9 + 4.0-7.5 + 4.9
-136.1 + 4.8-15.2 + 8.2
-139.7 + +8.8+1.6 + 6.5
T4C SurfaceSubsurface
-143.4 + 5.2+16.4 + 5.2
-137.3, + 4.0+15.0 + 7.4
-140.8 + 4.8-1.5 + 7.5
-149.0 + 6.5
+3.9 + 5.4

Tang 118
Residual Stress, ksi
MeesurementPoint *11(0 °)
Angle Directions
ecta(45°) e22(90 °) el3p(zas°)
T2A
T$A
TSB
T4A
-142.0 +_. 7.3-50.3 + 3.5
-128.9 + 24.3-56.6 + 8.9
• , |,
-139.4 + 13.7.22.2 + 2.7
-129.8 + 4.9-40,8 _+ 6.0
-139.5 ,+ 14.1-33.1 _+ 8.4
.134.8 + 10.7-10.0 + 7.0
.136.3 + 24.1-37,8 ,+ 8,8
-128.9 + 8.3•66.2 + 4.3
-136.0 + 11.5-36.2 + 4.2
-146.9 ,+ 14.3.28.6 ± 2.6
-132.6 + 7.7+10.3 + 5.0
-130.8 +_ 0.1+13.3 + 2.9
-136.6 _+ 9.1-17.9 + 3.4
•123.8 + 6.7m
-36.4 + 4.4-123.9 * 10.6
m
-9.8 + 5.7-134.6 + 5.5
-17.1 + 3.9
T4B 8urfscg8ubsurface
-140,5 _.+ 7.3-24.9 + 6.0
-125.0 + 4.7-38,8 + 2.8
-126.6 + 4.3-43,4 +_ 2.8
-138.9 + 7.3-30.6 + 4.8
m
T4C SurTaceSubs u.-_c,,
, ,, ,,
-138.7 + 7.1+27.6 ,+ 4.2
-129.6 + 8.3•_2.1 ._ 3.5
-129.7 +_ 4,4.22.3 + 5.6
-138.7 ,+ 6.0-2.6 + 4.3

Tans240
Residual Stress, ksl
-_iile Directions
IL
MeasurementPoint e11 (00) eotcL(450 ) e22(90" ) e_(135 °)
T2A Surface
Subsurface
.=,8 ÷ 167"_ ._27.,_,_8.e -I_51÷ 14.8_,
.I..4 ; le.2.) .136.9 ; 16.13-..o _: 6._ ...6 __4._ .36.8; 7.6-
TaA -138.2 + 6,1 -126.3 _+ 6.7 -136.4 _ 3.8 -187.1 ± 6.7-5T.3 _.+ 2.9 -67.8 4. 4.6 .27.9 _+ 4.9 -27.3 + 4.2
T3B Burr'ace
Subsurface.187.2 ± 4.8 -I.23,2 _+. 4.3 -127.3 ± 8.i -143.0 ± 3.1
-21.I ± 6.3 +7.8 +_ 3.4 +15.2 ± 2.4 -13,5 ± 3.8
T4A -131.I + 3.6-72.0 ÷ 6.5
-127.2 ÷ 5.9
-41.9 _+ 2,9
-1B4.6 ± 6.8-14,7 ± 4.0
-141.4 ± 6.2-49.8 4- 3.0
m
T4B Sur/'aeeSubsurface
-I25.9 + 8.0-21.1 ± 6.2
-124.1 ± 8.0 -133.3 +_.10.4 -132.6 _+ 6.8-26,3 ± 3.2 .40.2 ± 5,7 -25.8 ± 4.2
T4C Surface
Subsur/'ace-132.6 + 4.8 -118,0 + 10.3+28,1 + 2.'['__ +7.7 ; 2.9.22.7 :_. 8..J
-181.2 + 10.0
-6.1 +_. 8.1
'1 '
-132.7 ÷ 6.0
-0.0 + 3.4

I'^N c,. ooo

T'AWCl 118


L.
mm _

Clevis 118
Residual Stress, ks/
I III III
Angle Directions
MeasurementPoint ell(O') saa(45") 822(90" ) ® (188°)
C1B
Surface .121.0 ± 5.8 -112,4 ± 24,4
Subsurface +92.2 ± 6.5 -14,1 ± 7,2
Surface -146.8 + 7.0 -121,4 _+ 14.18ubsurfsos -105,8 + 4.7 -77.5 + 6.2
-118.0 + 23.9_
;-19.s ;
-88.9 + 17.6t
-88.8 +_ 8.9
-119.2 ÷ 18.9
-18.2 + 6.6
Jl ,
-I12.0 ± 20.0-88.8 + 9.2
CSA
C2B
Surface -116.I + 16,5Subsurface -63.9 + 19.6
-128.2 ± 25.8-86.4 + 8.9
u
-121.9 .,- 7.0
-47.4 + 8.6
-124.5 + 15.2m
-89,6 + 8.8
-128.7 ÷ 11.9m
-87,0 + 3,2
.126,8 ± 4.9-6,8 + 6,8
.129,8 ± 19.8-32.6 +_ _,4
I/ ///_ / / /_ l, ,: t", _ /-,_ /', ...../'///'/ "--"<- //_t

Clevis 240
Residual 8trNs, ksi
CIA
CIB
Meltsurentgnt
Point e11(0") e,,a(45 ° )
8m_c, -111.4 + 5.4m
•119.8 ± 9.8
-0.8 + 5.2
Anll, Directions
8ub,urf-c, +19.8 + 8.2
-96.7 + 8.g
-35.3 _.+ 3.2
8urea,
8ubsurfsce
-137.6 + 5.1
-77.2 4- 5.8
*22(90" ) , ._(I56.)
-115.7 +_ 18.1"_
-106.8 + 17.$J+7.8 _ 7.
-61.2 + 18.o-"_..s2.9±-17ej-22.5 + 4.2
-98.2 + 10,6
.56.5 + 5.5
.U4.8 + 9.6-$9.6 :f: 6.9
.117.1 ± _,$-_.7 + 3.5
-120.3 4. 21.4-46.e + 8.1
-127.7 ± 15.4-69.5 + 5.7
C2B -1_.8 4. 7.$-74.7 + 8.7
-151.8 ± 11.9-8&8 + 7.5
1
,..,-;
-134.4 4. 8.9
-4,9 4, 4.2
o
-122.3 + 23.0
-42.5 ± 4.8

Ilq

CL_v tS
as4 23_


Forward Stiffener Stub 166
Residual Situs,
p ,
MoaeurementPoint %1(0")
81A -134.9 + 18,6w
+6.8 + 4.5
I
Ansle Directions,,=e
eaa(480) e29(90")
-129,4 + 0.3-14.0 + 6.0
w
• pp(la5°)
81B
82A
82B
8SA
-147,0 4. la.8-16.8 ± 7.9
-1_9,$ +_ 13.3-3.6 + 7.1
-123.6 + 8.7•80.0 +_ 4.5
-189.7 + 7.9
+8.4 + 6.7-158.3 4. 19.8
•.4.9 ÷ 6,6
-140.4 + 9.2
-14.0 4. 3.7
-147.9 + 8.7
-6.0 4. 8.6
-125.8 _+ 11.@-28,0 :!: 6.6
.148,8 4. 8,1+3.8 _+ 6.0
-142.2 ± 8.6+8.1 + 7.6
83B .118.8 4. 90,1
+8.2 + 8,8
_ 11.6"1,-109.1 + 21.6"_ -117.7 +
.116,1 _ 19,2.) .114.9 + 1+2.4 + 4.s +8.0 ; _'- ;' eis.,)'L"
ilI I

]7
Aft 8tiffener 8tub 166
R_dual 8tr_s, kli
Angle DirecUen,
MeasurementPoint ell (0.) eaa (46") e22(90. ) e_ _(135")
SIA Surface -140.3 +_. 12.1 -133.8 + 10.0
SIB
Subsurface -30.1 + 5.6 -7.3 +_ 7.3 -28.8 +_. 5.5
Surface -141.2 +_.10.9Subsurface -3.6 + 4.8 -26.8 +_. 4.2
-141.0 + 5.0-4.0 + 3.9
82JL Surface -120.8 + 10.18ubsur_ce -60.6 + 5.3
-154.2 + 5.7-81.8 _+ 9.3 -56.2 +. 24.3
82)8 Sm'tkce -137.1 + 7.3Sulmm'face -21.5 _.+ 3.8
-170.2 + 6.4-10.1 + 3.2 -26.6 + 6.9
S3A Surface -146.2 + 4.5 -148.6 _+ 152 -139.7 + 19.8 -141.7 + 12.1Subsurface +4.8 + 7.5 +5.6 + 5.5 +5.8 + 8.1 -4.3 + 6.2
JJ
83B Surface -122.0 _+ 42 -115.2 + 12.0 -114.6 +_. 1S.2 -117.1 +_ I0.08ubeurface +12.8 + 10.2 +8.4 + 6.6 +10.1 + 9.1 +8.6 + 4.8

FwD ¢,r=F_I_NI_R Ib_
41IFWD c_.rll::l;l_N_ I bfo
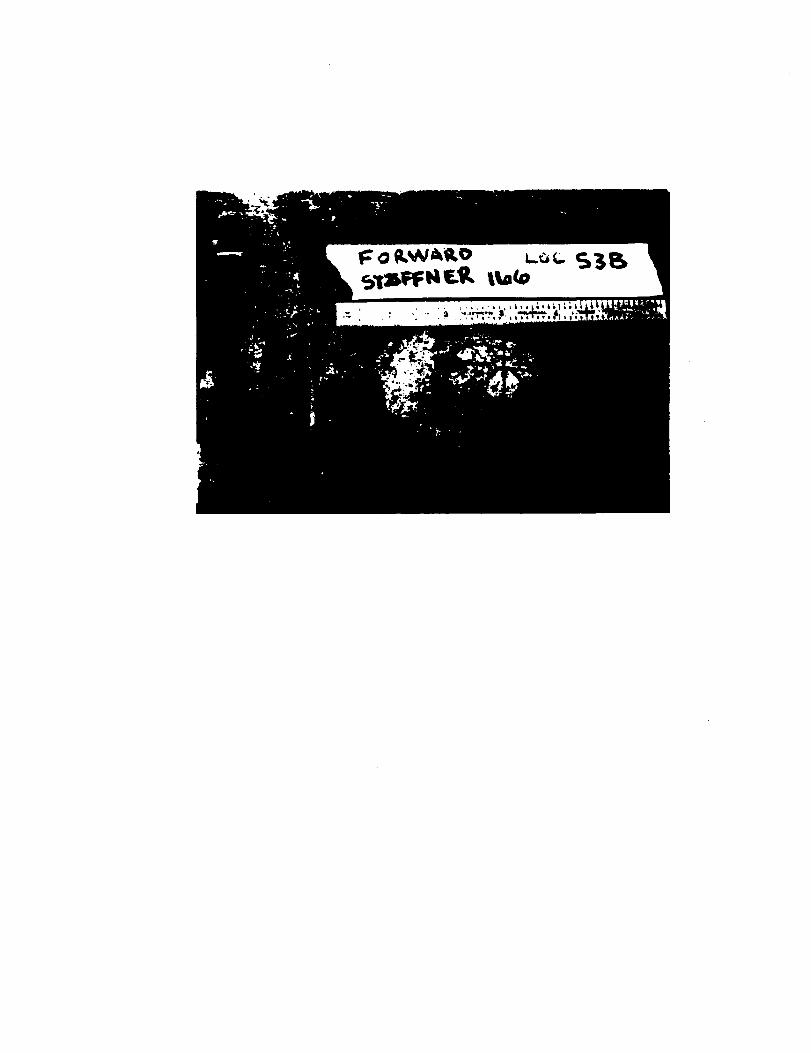


AilNOSIIhl4Cll • INOtJliTIIIIAL TIIGffNOt.OGlll8
APPENDIX B - VENDOR REPORT FOR NEUTRON BEAM DIFFRACTION MEASUREMENTS
The attached report was submitted by Atomic Energy of Canada Limited (AECL) at the completion of the measurements of
the residual strains on Tang 000 in the region of the tang forward of the pin hole at the 4" position. It provides a description
of the neutron beam measurement process, identifies the region evaluated, presents the measured data, and compares the
results to an elasto-plastic analysis of the residual strains around a generic (not next to an alignment slot) pin hole in afactory joint tang.
NOTE: The test plan gives two incorrect designations for this segment. The title page refers to IU50716-06 S/N L023 (a
lightweight attach segment). The test component description in Section 2.0 refers to IU50715 S/N L032 (a lightweight
stiffener segment flown onflight 21A). The DM-8 motor used the lightweight attach segment S/N L032 and the lightweight
stiffener segment S/N L023. The correct designation of the test item is lightweight stiffener segment S/N L023 flown onflights 14A and 24A. The similarity of the segment numbering gave opportunity for the confusion.
Unfortunately the erroneous description of the case stiffener segment was carried into this vendor report in Section 2.1.That reference should be 1U50715 S/N 10023 with history noted above.
This test article was the other half of Tang-000 tested earlier by TEC using the x-ray diffraction method.
REVISION oocNO. TWR-18901 Iyou
sEc [PAGE 21


PROTECTED
MORTON THIOKOL
_ R_ WAS _EO t_ CON_ IY Ar_ _ _m"
r,O4wdA'nA_Pd _ _ mY _ _. NO t'_tm_,Or,A'nON
om 'r_,I,NSFEM Of ANY _ TIO_ CONT_O NEMEW .I PEM-
,m.._D IN _ _NC| Of AN AGItEIEMEN'Ir v_m 1'tee OV_EMfSl
NEITHER _ DOCUMENT NOlq ANY iNf-ONMATt0N IN TNE I_)CU.
MENT MAY I_ IIUL4SED TO ANY TNiRO pAMI"_F WSn4OUT TNI[
CONSENT 0f THE OWNER¢S_
NEUTRON DIFFRACTION MEASUREMENTS
OF RESIDUAL STRAINS NEAR
A PIN HOLE IN A SOLID FUEL
BOOSTER ROCKET CASING
ANDI-25
T.M. Holden*, J.H. Root* and R.R. Hosbons**
Abstract
The elastic strains corresponding to residual stresses in the region between thepin hole and the end of the tang were measured using a neutron diffractiontechnique.
The largest strains were found to be near the pln hole in the region which
yields under a combination of pin bearing and hoop tension loadlngs. The
largest elastic compressive hoop strain observed was -2300 x I0-6. In the same
region tensile axial strains of 1200 x 10-6 and tensile normal strains of1400 × lO"6 were observed.
* Neutron and Solid State Physics Branch** Advanced Materials Research Branch
Neutron and Solid State Physics Branch
Atomic Energy of Canada LimitedChalk River Nuclear Laboratories
Chalk River, Ontario, Canada, KOJ IJO
1989 June

PROTECTED
MORTON THIOKOL ANDI-25
- I -
1.0 INTRODUCTION
The cases of the motors for NASA's Space Shuttle booster rockets are
assembled from a number of case segments. Each of these segments is machined
from a single forging. The forglngs are made from D6AC, a High Strength Low
Alloy Steel.
During proof testing of the case segments, local regions near some of the
structural details yield. When the proof test pressure is released local
elastic residual stress fields must develop to maintain compatibility between
the yielded and non-ylelded regions of the case. D6AC steel is kno_m to be
moderately susceptible to stress corrosion cracking if exposed to sufficiently
high tensile stresses for a long enough period of time in a water or humid air
environment. It is important therefore that the design engineers be able to
determine the sign and magnitude of the residual stresses associated with local
yielding, since tensile residual stresses of sufficient magnitude could, if
present, lead to stress corrosion cracking.
Residual stresses are presently being determined from elastic plastic
finite element analyses. To obtain a direct experimental check on the accuracy
of these computed residual stresses, Morton Thlokol, Inc. decided to obtain
measured values for the residual stresses near some of the structural details in
an actual piece of flight hardware. As part of this effort a contract was
awarded to The Chalk River Nuclear Laboratories of Atomic Energy of Canada
Limited to measure the residual stresses near a pin hole in a factory Joint tang
using a neutron diffraction technique. This report presents the results of
those measurements.
2. EXPERIMENTAL
2.1 Sample
The specimen examined is a portion of the tang of Case segment IU50715 S/N
a llghtvelght stiffener segment. This segment vas flown in the aft e_ p_,%
position on motor 21A, and was used in the forward position on test motor DM-8. _.
A proof test was performed on the case before Flight 21 and before its use in
the DM-8 test motor. At the conclusion of the DM-8 test, the ET attach case

PROTECTEDNORTON THXOKOL ANDI-25
-2-
segment and lightweight stiffener SIN 032 were subjected to a localized
overheating as the result of a failure in the external case cooling system. The
forward end of SIN L032 was damaged along a band centered on the zero degree
longitudinal llne, but the remainder of the case was unaffected. As a result of
the local overheating, the case segment was scrapped, and it was possible to
obtain residual stress test specimens from portions of the case which had not
been overheated.
Tensile coupons cut from the case segment forging after heat treatment had
been tested to verify the mechanical properties of the forging. These tests
indicated the yield strength of the naterlal to be 199.7 × I03 psi (1398 MPa).
This strength level is vlthln specification.
Three residual stress specimens were cut from the tang. Each specimen yam
centered on one of the three alignment slots. Figure 1 shows the cutting sketch
for the tang specimens. One of the three specimens was supplied to AECL. This
specimen contains the alignnent slot which was originally located at zero
degrees on the case. Note that the measurements were made on a pin hole four
degrees around a complete tang from the alignment slot.
A small piece of case membrane which had been stress relieved at 1000" F
(558* C) in a laboratory furnace was also provided to AECL. This material was
examined as an example of a reference interplanar spacing.
2.2 Neutron Diffraction
It is possible to make measurements of the interplanar spacing of the
atomic lattice through the complete thickness of a rocket casing by neutron
diffraction because thermal neutrons of the wavelength used in the experiment
are only attenuated by a factor of l0 in passing through 16 mn of steel. The
neutron diffraction method is the only way of getting this information directly
and non-destructively by experiment. The measured strains may then be compared
with the results of computer modeling.
In the presence of residual tensile stress the atomic planes in the grains
which make up the casing are slightly pulled apart. The lattice spacing, dhk x,
is related to the diffraction angle, 20hkX, by the Bragg equation,
2dhk I sin #hk x = _ (1)

PROTECTEDMORTON THIOKOL ANDI-25
- 3-
where (hkl) labels the family of crystallographic planes and _ is the calibrated
neutron wave length 2.6139 _. The shift in the angular position of the
diffraction peaks can thus be used as a miniature internal strain gauge. If the
lattice spacing can be measured in a straln-free component, or In a part of the
casing believed not to be subjected to a perturbing influence such as a pin
hole, the residual strain can be computed. Finally if the elastic constants are
known, the residual stress components may be calculated from the measured
residual strain components.
2.3 Experimental Procedure
The measurements were made with the L3 spectrometer at the NRU reactor,
Chalk River Nuclear Laboratories, employing the (113) planes of a squeezed Ge
crystal as monochromator to provide a neutron beam of wavelength 2.6139 _. The
collimations of the beams before and after the sample were 0.19 and 0.21 degrees
respectively.
Slits in absorbing cadmium sheet, each 1.3 mm vlde and 2 mm high placed in
both the incident and diffracted beams, defined the gauge volume, a column 2 mm
high whose cross section in the horizontal plane is a parallelogram centered
over the sample table of the spectrometer. By moving the sample on a computer
controlled X-Y drive any desired point may be brought into the gauge volume.
Each diffraction measurement gives the average Interplanar spacing of those
grains in the gauge volume whose normals lle along the bisector of the included
angle between the incident and diffracted beams. Positioning of the gauge
volume in the casing was achieved wlth an accuracy of ± 0.I mm. Reference
positions were established at the ID and OD of the casing and at the position of
the outside diameter of the pin hole by moving the wall, or hole surface,
through the gauge volume and examining the characteristic intensity change.
Three different geometrical arrangements of the component are needed to set the
required directions in the component along the bisector of the incident and
scattered beams. Fig. 2 shows a photograph of the set-up for measuring the hoop
strain near the pin hole.
PROTECTED
MORTON THIOKOL ANDI- 25
- 4 -
The instrumental lineshape for neutron diffraction is Gaussian so that the
angular position of the diffraction peak was obtained, to a precision of ± 0.012
deE. in this experiment, by fitting a Gaussian peak on a sloping background to
the experimental data. The important parameters are peak position, peak width
and integrated intensity. By measuring the linevldth of the diffraction peaks
of standard Ge and KCI powders the instrumental llnevldth at the diffraction
angle for the component was found to be 0.42 ± 0.0! degree. The average
linevidth observed in the present measurements, 0.83 ± 0.05 degree, is much
greater than this indicating that there is an intrinsic linevldth stemming from
the tempered martenslte nlcrostructure.
The experiments reported here were carried out with the (110) reflection of
the ferrtttc phase. No surface preparation was required for the measurement.
2.4 Determination of Lattice Spacing in the Stress Free Condition
Three axial d-spacing measurements were made at different locations through
the thickness of the sample wall at a point located I00 nn from the edge of the
pin hole. The results of these measurements are show on in Table I. There was
no through-wall variation of lattice spacing at I00 mm. The average spacing was
found to be 2.0283 ± 0.0002 _.
Seventeen through-wall measurements of lattice spacing in the axial, hoop
and normal orientations were made on the piece of stress relieved reference
material. The results of these measurements are sunmarized in Table 2. There
is no significant through-vail variation and the average spacing is
2.0281 ± 0.0002 _. The average peak width is 0.76 ± 0.04 deE. which is slightly
less than the average peak vidth in the component.
The average value for the three measurements on the sample itself (2.0283_)
was selected as the reference value with respect to which strains were
calculated.
3. _E_ULTS
Three strain components (axial, hoop and normal) were measured at a number
of points between the pin hole and the end of the tang. All of the points lie
in a plane defined by the axis of the pin hole and the North-South axis through

PROTECTEDMORTON THIOKOL ANDI-25
-5-
the pin hole shown in the schematic diagram of the tang end of the casing (see
Figure 3).
3.1 Axial Strain Measurements
The results of eighty-two (Ii0) lattice spacing measurements in the axial
direction are tabulated in Table 3 and plotted in Figure 4. The location of the
center of the gauge volume is indicated by its distance from the edge of the
hole and its distance from the outer surface of the tang. The outer surface of
the tang is chamfered near its end. Two of the axial measurement stations (23
and 27 mm from the edge of the hole) are in the chamfered portion of the tang.
Note that the location of the measurement points at these positions is measured
from the local outer diameter of the case segment.
At 3 mm from the hole the axial strain is tensile at every point through
the thickness vlth a maximum at the ID. Between 7 and 15 mm from the hole
compressive strains are observed. These strains vary somewhat through the
thickness wlth higher compressive strains occurring on the ID of the tang.
Finally, we note that beyond 19 mm from the hole the axial strains are
essentially zero.
A total of twenty readings of the diffraction angle were taken at the nine
stations located 3 mm from the edge of the hole. Figure 5 shows a third order
polynomial curve to fit to this data. The standard deviation of the data points
from this curve is 0.014 deg. For a normal distribution of errors we expect
one-thlrd of the observations to depart from a fitted curve by more than one
standard error. In the present case seven out of twenty observations lle more
than one standard error from the curve. Assuming an error band equal to ± 2a we
have b(2#) = ±0.028 degrees. The error in the d-spaclng is given in terms of
the error in (28) and the error in A by
Adhkl " dhkl I b_._ ! cot (0hkl)A(20hkl) ] (2)2
Setting dhk I = 2.0283_, A = 2.6139_, AA = ± 5 x lO-S_, Ohk z = 40 deE., and
A(2ehkl) = ± 0.028 deg., we obtain Adhk I = ± 0.00063_ which corresponds to an
error in strain measurement of ± 310 # (I # is equal to a strain of 10-6).
The data points plotted in Figures 4, 6, 7 and 8 should be considered to have

PROTECTED
MORTON THIOKOL ANDI-25
- 6-
this error band which corresponds to a 95% confidence limit. The errors derived
from the Gausslan fitting procedure (in Tables I-5) are standard errors (±o)
with a 91Z confidence limit.
3.2 Normal Strain Measurements
The component of residual strain normal to the surface of the tang was
measured at 57 points. The results of these measurements are tabulated in Table
4 and plotted in Figure 6. The normal strain is tensile all through the wall at
3 a from the pin hole and shows a marked Laxlatm close to the inner surface.
Note that the measurements were made ! ,m from the two surfaces.
The results at 7 mn indicate tensile normal strains near the inner surface
falling to nearly zero at the outer surface. The through-wall variation is
negligible at 11 mm from the pin hole and beyond.
3.3 Hoop Strain Measurements
The hoop component of residual strain is plotted in Fig. 7 as a function of
distance from the outside wall at various distances from the pin hole. The data
are summrized in Table 5.
The hoop strain is strongly compressive at 3 mm from the hole. The hoop
strain becomes more compressive as we pass from the OD to the IDwhich matches
the increasing tensile axial component of strain along this path. At distances
of |5 and 19 mn the strains are tensile, matching a compressive tendency in the
axial component. The hoop strain beyond 19 _ is near zero although it shows a
tendency to increase from the OD to the ID.
3.4 Variation of Strains Along the Mid Surface of the Shell
Figure 8 shows all three strain components as a function of distance from
the pin hole near the mld-wall of the component: this figure conveniently
summarizes the trends.
The largest strains observed occur in the hoop direction. The hoop strain
at 3 _ from the hole is about -1920 _. The compressive strain decreases in
magnitude with distance from the pin hole, falling to zero at about 8 _ from
the hole. Beyond 8 _ the residual hoop strain becomes tensile reaching a
maximum value of 640 # at 12 mm from the hole. At larger distances the hoop

PROTECTEDMORTON THIOKOL ANDI-25
- 7 -
strain remains tensile but falls towards zero vlth increasing distance from the
pin hole.
The axial strain and normal strain at any given location usually have the
opposite sign from the hoop stress. At 3 mm from the pin hole they have values
of 590 _ and 390 _, respectively.
The llnewldth of diffraction peaks has contributions from the instrumental
llnevldth and any intrinsic effects. As mentioned previously, the measured
llnevldths (F_HM) are much wider than the known instrumental llnewldth. Ve have
obtained the intrinsic llnewldth, bs, by subtracting the instrumental llnevidth
bz from the measured llnevldth b in quadrature, (b') 2 = a2 -(bx) 2. This
procedure assumes that both linevldth contributions are Gausslan in form. If we
assume further that the intrinsic linevidth has its origin in a distribution of
strains in the gauge volume, then the root mean square strain may be calculated
from b by differentiating Bragg's law and relating the standard deviation of the
intrinsic width to the half-vldth
IA--ddlrms = AI2__1 cot 0 (3)
The result, derived from measurements of diffraction peaks in the normal, hoop
and axial strains near the midvall, is shown in Fig. 9. There is very little
extra linevidth in the regions of the component which have high residual strain.
The large rms strain distribution is therefore mainly a property of the starting
material.
4.0 ANALYTICAL RESULTS
The residual stresses induced in a factory Joint tang by proof testing have
been calculated in reference I. The results of that analysis were supplled by
Morton Thlokol to AECL in the form of contour diagrams of hoop, axial and normal
residual stress in the region between the pin hole and the end of the tang.
The following assumptions were made in the finite element analysis:

PROTECTED
NORTON TitIOKOL ANDI-25- 8 -
a. A classical incremental elastlc-plastlc material model was used.
Kinematic hardening was assumed with a billnear unlaxlal stress/strain
curve.
b. The material was assumed to have a 0.2 percent offset yield strength of
180 ksl (1260 MPa) a Young's modulus of 29.6 x 10³ ksl (207 GPa) and a
plastic modulus of 400 ksl (2800 MPa).
c. The finite element model was based on minimum geometry and minimum
membrane thickness.
d. A maximum proof test pressure of 1070 psi (7.5 MPa) was assumed.
5.0 COMPARI$ON OF EXPERIMENTAL AND ANALYTIqALAL_LTS
The stresses were read off the contour dlaErams on a 2 mm x 2 mm grid in
the plane of measurement and the three components of residual strain calculated
from the three components of residual stress vlth the aid of the following
equations,
en _ _vaA _ v.-ox" E - E E (4)
go. ga £a.Ea = - E + E " E (5)
go. Eo x gje, = - E - E + E (6)
In equations 4 through 6, H, A, N stand for hoop, axial and normal. The
values of E, Young's modulus and v, Polsson's Ratio, were taken to be 200 GPa
and 0.3 respectively. The computed strains are shown by short dashed lines in
Figures 4,6,7 and 8.
Most of the measured values of strain are rather small. Only five measured
strains are greater than 1500 _, a value for which the experimental error band
is still Z 20 percent. Almost half of the measured values are essentially zero;
i.e., the magnitude of the measured strain is less than the half width of the
error band.
Nevertheless there is reasonably good agreement between the analytical and
experimental values. In most cases the value calculated using finite element

PROTECTEDMORTONTHIOEOL ANDI-25
- 9 -
analysis lles within the error band of the measured data.
The agreement is about as good as one could expect given the differences
which exist between the dimensions and mechanical properties of the actual
hardware and the worst case dimensions and properties assumed in the finite
element analysis.
6.0 ACKNOVLEDGEMERT
We vlsh to acknowledge the expert technical assistance of D.C. Tennant,
H.F. Nieman, M.M. Potter, G.A. Tapp and L. MacEvan. The help given by J.F.
Dalnes in discussions and for sending numerical data, contributed greatly to the
understanding of the problem.
7.0 REFERENCE
I. M.J. Sandor, et. al., TlrR-17118, Supplement A, Revision A, "RSRM Case
Structural Analysis - Factory Joint", Section 5.4 'Residual Stresses
and Strains', April 2, 1988, Morton Thlokol, Inc., Brigham City, Utah.
PROTECTEDMORTONT]]IOKOL
- 10-ANDI-25
TABLEI
MEASUREMENTOFAXIAL D-SPACING I00 MM FROM PIN HOLE
Distance from
pln holemr.
Distance from
outside wall 2e A(2e) _zzomm deg. deg.
100.00 3.4 -80.058(12) 0.76(3) 2.0283(3)5.4 -80.056(8) 0.77(2) 2.0283(2)7.4 -80.053(6) 0.73(1) 2.0284(1)
(dzzo) av 2.0283 ± 0.0002 A

PROTECTEDMORTON THIOKOL 11-
ANDI-25
TABLE 2
MORTON THIOKOL REFERENCE SAMPLE
Component
Distance from b(2#)outside vail 2#dee deg
mm
Axial
Hoop
Normal
108
6
4
2
II9
7
53
I
II
I09
7
5
3
-80.044(9) 0.80(2)-80.031(7) 0.81(2)-80.040(7) 0.79(2)-80.037(7) 0.77(2)-80.024(12) 0.78(2)
-80.035(8) 0.77(2)-80.035(8) 0.79(2)-80.055(8) 0.75(2)-80.031(10) 0.78(2)-80.033(7) 0.74(2)-80.037(7) 0.79(2)
-80.030(7) 0.70(2)-80.027(6) 0.70(1)-80.026(7) 0.69(I)-80.022(9) 0.80(2)-80.034(10) 0.80(3)-80.033(8) 0.77(2)
2.0279(2)
2.0282(2)
2.0280(2)
2.0281(2)2.0284(3)
2.0282(2)2.0281(2)2.0277(2)2.0282(3)2.0282(2)2.0281(2)
2.0282(2)2.0283(2)2.0283(2)2.0284(2)2.0281(2)2.0281(2)
Average 2.0281 ± .0002

pROTBCTEDMORTON THIOKOL - 12 -
TABLE 3
AXIAL STRAIIqS
_DI-25
Distance from
pin holemm
Distance from
outside vailmm
2#
deg.
a(2e)deg.
Strain
(x 106 )
7
II
15.7
15.715.3
15.3
15.3
11.411.49.4
9.4
7.4
7.45.4
5.4
3.4
3.4
1.81.8
1.8
1.0
1.0
15.7
14.5
14.5
II .4
11.4
9.4
9.47.4
5.4
3.4
2.2
2.2
1.0
15.7
14.9
14.9
11.4
80.120(15)80.136(14)
80.146(16)
80.114(14)80.110(14)
80.138(13)80.142(14)
80.150(13)80.152(10)
80.178(15)
80.178(13)80.206(15)
80.172(11)
80.190(12)80.177(13)
80.181(12)80.205(12)80.197(11)80.148(10)80.176(13)
80.274(11)
80.246(15)
8o.268(13)80.237(16)
80.218(9)
80.253(9)80.231(13)80.249(9)
80.250(12)
80.276(9)
80.258(12)
80.265(12)
80.268(10)
80.306(10)80.306(12)80.280(13)80.276(12)
0.82(4)0.83(4)0.83(4)0.78(3)
0.85(3)0.84(3)0.79(3)
0.71(3)0.85(3)
0.79(4)0.84(3)
0.90(4)0.84(3)0.85(3)
0.88(3)0.82(3)
0.86(3)0.87(3)0.85(2)0.88(4)
0.86(3)0.83(4)0.82(3)0.87(4)0.79(2)0.83(2)0.81(3)
0.79(2)0.78(3)0.78(2)
0.82(3)0.81(3)0.79(3)
0.81(2)0.83(3)0.80(3)0.82(3)
2.0307(3)2.0304(2)2.0302(3)2.0308(3)2.0309(3)2.0303(3)
2.0302(3)2.0301(3)
2.0300(2)
2.0295(3)
2.0295(3)2.0289(3)
2.0296(2)
2.0292(3)
2.0295(3)
2.0294(3)
2.0289(3)2.0291(2)2.0301(2)2.0295(3)
2.0275(2)2.0281(3)2.0276(3)2.0282(3)2.0286(2)2.0279(2)2.0284(3)2.0280(2)2.0280(2)
2.0274(2)
2.0278(3)
2.0276(3)
2.0276(2)
2.0268(2)2.0268(3)2.0273(3)
2.0274(3)
11801040
94012301280
99094089084059059O300640440590540300390890590
-390
-100
-350
-50
150
-20050
-150
-150
-440
-250
-350
-350
-740
-740
-490
-440

PROTECTEDMORTON THIOKOL
15
19
23
27
9.4
7.4
5.43.4
2.2
2.21.0
15.7
14.3
14.3
11.4
10.49.4
8.4
7.4
6.4
5.4
3.41.8
1.8
1.0
14.7
II.49.4
7.4
5.4
3.41.8
13.010.6
8.66.64.62.61.0
9.38.46.44.42.41.6
7.4
7.4
7.4
7.4
- 13
8o.254(11)8o.247(14)8o.268(13)80.279(13)
80.270(12)
80.272(9)80.264(9)
80.277(8)80.277(8)80.274(9)80.242(13)80.240(12)80.243(11)
80.231(10)
80.258(13)
80.260(11)80.239(11)
80.237(11)80.248(10)80.260(9)
80.236(8)
80.253(10)80.234(10)80.238(10)80.214(10)80.231(10)80.248(10)80.238(7)
80.227(6)80.238(11)80.227(10)80.231(10)80.231(11)80.227(12)80.238(6)
80.241(6)80.248(10)80.227(13)80.231(12)80.231(10)80.243(5)
80.130(14)80.219(16)80.256(13)80.236(17)
0.77(3)0.80(4)0.83(3)0.80(3)0.83(3)0.78(2)0.77(2)
0.80(2)0.80(2)0.76(2)0.88(3)0.81(3)0.76(3)0.76(2)o.81(3)
0.77(3)
0.76(3)0.79(3)
0.81(2)0.81(2)0.75(2)
0.77(2)0.77(3)0.75(1)0.74(2)0.76(2)0.75(2)0.77(2)
0.73(1)
0.74(1)0.74(1)0.73(2)0.73(2)0.76(1)0.71(2)
0.71(1)0.69(1)0.70(1)0.71(1)0.70(1)0.70(1)
0.84(4)0.87(4)0.72(3)O.BO(5)
2.0279(2)2.0280(3)2.0276(3)2.0273(3)2.0276(2)2.0275(2)2.0277(2)
2.0274(2)2.0274(2)2.0275(2)2.0281(3)2.0282(2)2.0281(2)2.0284(2)2.0278(3)2.0278(2)2.0282(2)2.0282(2)2.0280(2)2.0278(2)2.0283(2)
2.0279(2)2.0283(2)2.0282(2)2.0287(2)2.0284(2)2.0280(2)
2.0282(2)
2.0285(1)2.0282(2)2.0285(2)2.0284(2)2.0284(2)2.0285(2)2.0282(1)
2.0282(1)2.0280(2)2.0285(2)2.0284(2)2.0284(2)2.0281(1)
2.0305(3)2.0286(3)2.0278(3)2.0283(4)
ANDI-25
-200
-150
-350
-490
-350
-390-300
-440
-440
-390
-I00-50
-I00
50
-250
-250-50
-50
-150
-250
0
-200
0-50
200
50
-150
-50
I000
I0050
50
I00
-50
-50
-1501005O
5O
-100
1090
150
-250
0

PROTECTEDMORTONTHIOKOL - 14-
TABLE 4
NORMALSTRAINS
ANDI-25
Distance from
pin holemm
Distance from
outside wallmm
28deg.
3
7
11
15
1.0
2.0
5.07.0
15.714.7
13.7
II .7
9.7
15.7
14.7
13.7
11.79.7
7.0
5.0
2.0
1.0
15.714.7
13.7
II .7
9.7
7.0
5.0
2.0
1.0
15.7
14.7
13.7II .7
9.7
7.0
5.0
2.0
1.0
80.190(7)80.175(10)
80.182(8)80.195(6)
80.122(7)8O.lO1(8)80.107(8)80.149(8)
80.157(7)
80.177(6)80.183(8)80.185(6)80.190(8)80.192(10)80.211(9)80.211(12)
80.223(8)
80.217(7)
80.234(7)80.234(6)80.229(10)80.233(7)80.252(11)80.211(15)
80.240(10)
8o.238(lO)80.246(7)
80.248(6)80.235(8)80.238(8)80.254(8)80.230(8)80.220(12)80.240(8)80.244(8)
80.240(6)
0.70(2)0.71(2)0.73(2)0.76(1)0.73(2)0.73(2)0.74(2)0.72(2)0.78(2)
0.68(1)0.71(2)0.72(1)0.77(2)0.73(2)0.77(2)0.76(3)
0.73(2)0.68(1)
0.71(1)0.68(1)0.72(1)0.74(2)0.81(3)0.80(4)0.74(2)0.72(2)0.67(1)
0.69(1)0.72(2)0.73(2)0.74(2)0.76(2)0.79(3)0.74(2)0.69(2)0.67(1)
2.0292(2)2.0295(2)2.0294(2)2.0291(1)2.0307(2)2.0311(2)
2.0310(2)
2.0301(2)
2.0299(2)
2.0295(1)2.0294(2)2.0293(1)2.0292(2)2.0292(2)2.0288(2)2.0288(3)2.0285(2)2.0287(1)
2.0283(1)2.0283(1)2.0284(2)2.0283(2)2.0279(2)2.0288(3)2.0282(2)
2.0282(2)
2.0280(I)
2.0280(1)2.0283(2)2.0282(2)2.0279(2)2.0284(2)2.0286(3)2.0282(2)
2.0281(2)
2.0282(I)
440590
540
390
11801380
1330
890790
590
540490
440
440
250
250
I00
200
0
0
50
0
-200
250
-50
-50
-150
-150
0
-50
-200
50
150
-50
-I00-50

PROTECTEDMORTON THIOKOL
19
23
27
2
5
9
13
15.714.713.711.79.77.05.02.01.0
7.05.02.01.0
7.05.02.01.0
7.07.07.07.0
- 15 -
80.250(8)80.251(6)
80.248(6)
80.255(8)
80.260(8)80.245(11)
80.244(8)80.233(7)80.236(6)
80.242(12)
80.228(8)80.243(8)
80.239(7)
80.240(11)
80.237(12)80.222(10)
80.243(6)
80.179(7)80.182(10)80.222(14)80.239(11)
0.70(2)0.71(1)o.71(i)0.75(2)0.79(2)0.78(3)0.77(2)
0.69(2)0.67(1)
0.76(3)0.74(2)0.68(2)0.67(2)
0.75(3)0.76(3)0.72(2)0.69(1)
0.77(2)0.74(2)0.74(4)0.78(3)
2.0280(2)2.0279(I)
2.0280(I)
2.0279(2)
2.0278(2)
2.0281(2)2.0281(2)
2.0283(2)
2.0283(I)
2.0281(3)
2.0284(2)
2.0281(2)2.0282(2)
2.0282(2)2.0282(3)2.0286(2)2.0281(I)
2.0295(2)2.0294(2)2.0286(3)2.0282(2)
ANDI-25
-150-200-150-200-250-100-100
00
-10050
-100-50
-50
-50
150
-lO0
590
540
150
5O

PROTECTED
MORTON THIOKOL - 16 -
TABLE 5
HOOP STRAINS
ANDI-25
Distance from
pin holemm
Distance fromoutside vail
mm
2e
deg.
A(2e)deg.
Strain
(x 106)
3
11
15
19
11.010.08.07.05.02.01.0
11.010.08.07.05.02.01.0
II .0I0.0
8.07.0
5.02.01.0
II.0
10.08.0
7.0
5.02.0
1.0
11.010.0
8.07.05.02.01.0
80.457(13)
80.454(16)
80.404(15)80.418(15)
80.392(13)80.379(14)80.378(16)
80.263(13)80.267(11)80.219(14)80.270(14)8o.223(lO)80.215(13)
80.249(12)
8o.193(11)8o.192(12)80.156(12)80.174(14)
80.168(11)
80.204(15)
80.197(13)
80.184(13)
80.212(12)
80.205(13)
80.199(16)
80.222(17)80.237(9)80.234(17)
80.188(14)80.201(13)80.226(13)80.208(14)80.207(14)80.212(13)
80.246(14)
0.81(4)0.85(4)0.90(4)0.83(4)
0.90(4)
0.84(4)
0.81(4)
0.80(3)0.84(3)0.81(3)0.75(4)0.75(2)0.79(3)0.85(3)
0.76(3)0.81(3)0.74(3)0.76(4)0.79(3)0.80(4)0.77(3)
0.78(3)0.74(3)0.84(3)0.84(4)0.89(4)0.81(2)0.80(4)
0.78(3)0.80(3)0.76(3)0.82(4)0.82(3)0.78(3)0.81(4)
2.0236(3)
2.0241(3)
2.0248(3)
2.0244(3)2.0250(3)
2.0253(3)2.0253(3)
2.0277(3)2.0276(2)2.0286(3)2.0275(3)2.0285(2)2.0287(3)2.0280(3)
2.0292(2)2.0292(3)2.0299(3)2.0296(3)2.0297(2)2.0289(3)2.0291(3)
2.0294(3)2.0288(3)2.0289(3)2.0290(3)2.0286(4)2.0282(2)2.0283(4)
2.0293(3)2.0290(3)2.0285(3)2.0289(3)2.0289(3)2.0288(3)2.0281(3)
-2320-2070-1730-1920-1630-1480-1480
-300
-350
150
-390I00
200
-150
440
440790
640
690
300
390
540250
300
350150
-50
0
490
350I00
300
3OO
250
-I00

PROTECTEDMORTONTHIOKOL
23
27
7.66.65.63.62.6
9.47.45.43.41.4
- 17
80.200(11)80.217(11)80.224(9)80.216(9)
80.223(11)
80.203(11)80.216(6)80.222(7)80.226(9)80.239(6)
0.76(3)0.80(3)
0.76(2)0.77(2)0.77(3)
0.73(3)0.72(1)0.73(2)0.73(2)0.76(1)
2.0290(2)2.0287(2)2.0285(2)2.0287(2)2.0285(2)
2.0290(2)2.0287(1)2.0286(2)2.0285(2)2.0282(2)
ANDI-25
350200100200100
350200150100-50

PROTECTED
MORTON THIOKOL
- 18-ANDI-25
CUT THREE FROM TANG OF STIFFENER SEGMENT
WHICH WAS IMMEDIATELY AFT OF ET ATTACH SEGMENT
=
O
N
_t_D
)
12 5/8" 12 5/8"
_: 0 5/8" 9 5/8" -I
l ....I i
q,, o o _\_//_: o o bICOVER THESE HOLES WITH TAPE
SO THAT HOLE SURFACES WILL NOTBE DAMAGED DURING HANDLING.
I
I
II
TRIM ALONG THIS LINE UABRASIVE CUTTING TECHNIO.UE-J
FLAME CUT FROM CASESEGMENT ALONG THIS LINE
-I
(T=
O
TAG SPECIMENS
Flg. 1 - Cutting sketch for tang specimens taken from a segment of a solidfuel booster rocket.

PROTECTED
MORTON THIOKOL- 19-
ANDI-25
Fig. 2 - Photograph of the solid fuel booster rocket casing on the L3
spectrometer at the NRU reactor.

PROTECTEDMORTONTHIOKOL
- 20 -ANDI-25
°
NORTH
I XIAL
_ "_NORMAL
Fig. 3 - Schematic diagram of the tang end of a solid fuel booster rocket
casing indicating axial, hoop and normal directions. The plane in vhlch the
measurements were taken is the top plane of the diagram defined by the axis ofthe bolt hole and a North-South axis indicated on the diagram.

PROTECTED
MORTON THIOKOL
- 21 -ANDI-25
c_I0
IAI
2.031
2,030
2,029
2.029
102B
2O27
2.028
2.027
2.028
2.027
2.028
1028
2.02B
2,027
AXIAL RESIDUAL STRAINS
_ I I I l I I I l
o\ o .,__Dyed
1200
80O
z.O0
0
t ; I I I I I t
1o_o Ii _'-t"4°°
l l t I I I I I I
-i o ..I_° _ _0Os.rR_NflO"6 )
o o -800l l l I I I l i--
o o--O f_,4"_--O.L _" --
Ts,_ o o _-,.00
-800I I I I t I I 1--
19 o
B
I--// 0 0
I I I I I I I 6 t23 o _0 o o ,-_ -.-- .... __..---,__ _
/i I
/ I I l I I t l ,, I :27 A o_ o y_ o -t 0_ o o I
I
I I I I I t l l I0 2 Z. 6 8 10 12 l& 16
DISTANCE FROH OUTSIDE DIAHETER {ram)
Flg. 4 - Variation of the axial strain through the wall of the casing from
the outside wall for distances of 3, 7, 11, 15, 19, 23 and 27 mm from the
outside diameter of the bolt hole. Short dashed lines indicate the results offinite element calculations.

PROTECTEDMORTONTHIOKOL
- 22 -
i I I I I ' I i ' ( • I " | ' l
OO CO CO CO 00 CO CO CO CO CO 00 CO CO
ANDI-25
c_
p
O
n-
C_
O
O
r-- _.
_O
u_
O
Fig. 5 - Third order polynomial fit to the twenty measurements of diffraction
angle for the axial strain component measured at a distance of 3 mm from the
edge of the pin hole. Error bands for ±a and ±20 are shown by dotted curves.
PROTECTEDMORTONTHIOKOL
- 23 -
ANDI-25
d11o
(A)
NORMAL RESIDUAL STRAINS
t I I i l 7 °-i .i o_.-.-_1200
2.031-3
2.03C
02.029 -
7
2.029 -
2.028--
I11
2.029--
2.028
2.028
2.028
2.028- -tOI t t
27
2.028 - o
%. s s
o
I I I I l
0 "_
- 800
- _.00
I I I- 800
_" 0
- t.O0
0
I I I t
-1600
I I I
--_-- n-- -- "/% --
O --
J I I I15
I I _ I I
U
I I i19
I I t23
I I I. I , I, -- 600
I
I
I I , I I t I-- _00
I
I
L_
I
I
I I I I I el l0 2 _ 6 8 10 12 16 16
DISTANCE FROM OUTSIDE DIAMETER (ram)
o
o o --0
STRAIN(10-6)
Flg. 6 - Variation of the normal strain through the wall of the casing for
distances of 3, 7, 11, 15, 19, 23 and 27 mm from the outside diameter
of the bolt hole. Short dashed lines indicate the results of finite elementcalculations.
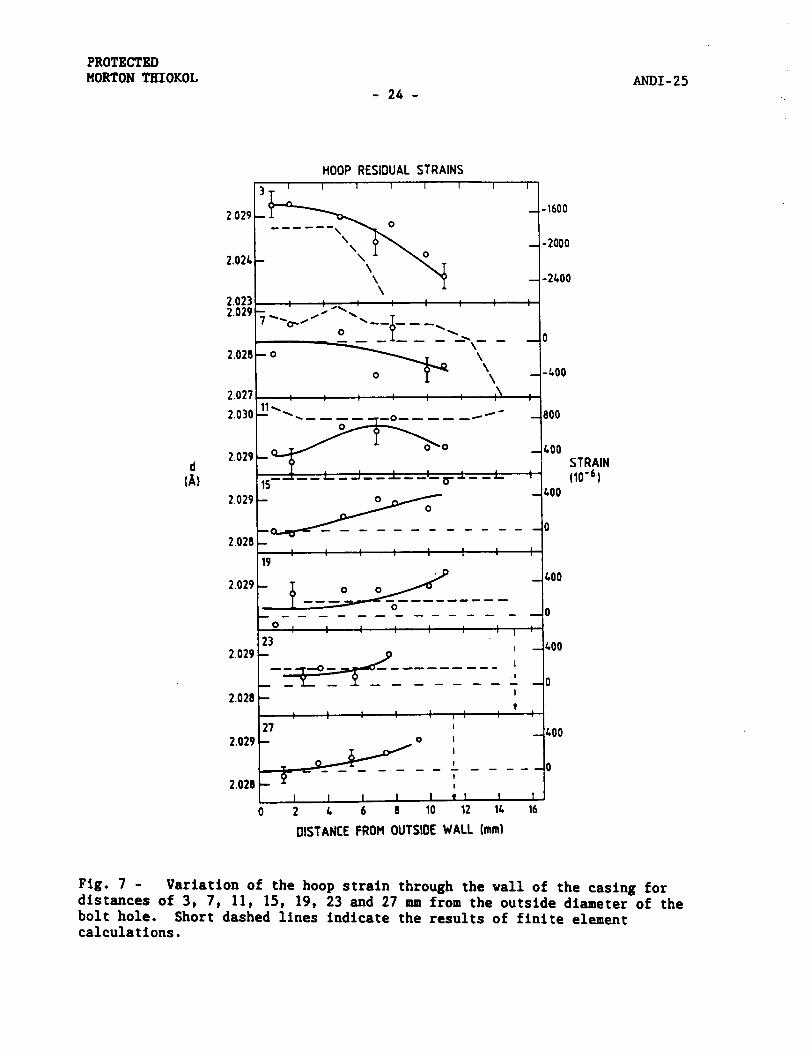
PROTECTED
MORTON THIOKOL
- 24 -ANDI-25
d
(A)
2.029
2.02_
HOOP RESIDUAL STRAINS
3 _l I I I I 1 I I
--__o" o _ -1600"" _ -2000
\\ _ - -2_00\
2.023 t _ .._. t t t t t o2 029 - .. ... -.• 7 "o--" "---T-- --_
2.028 -- o _ \\\ --._00
2.02"/ , I I t t t t\ I [
2030 _"_ ...... o...... "" - 800
2.029 z.00 STRAIN
(10"6)
2.029-- _ -1 z'O0
__ .JO
I I I i I I2.028 -
I19
2.029 -,I,
1
o I23
2.029
2.028
2.029
2.028
I I I I l I i
I
- r_ t
It
I I I I I , I I27 ,
I
I
I
I I I I I T I l0 2 Z,,, 6 8 10 12 l&, 16
DISTANCE FROM OUTSIDE WALL (ram)
1°I
- _.00
0
t
_ 1.00
0
Fig. 7 - Varlatlon of the hoop straln through the vail of the casing for
distances of 3, 7, II, 15, 19, 23 and 27 n from the outside diameter of the
bolt hole. Short dashed lines indicate the results of finite elementcalculations.
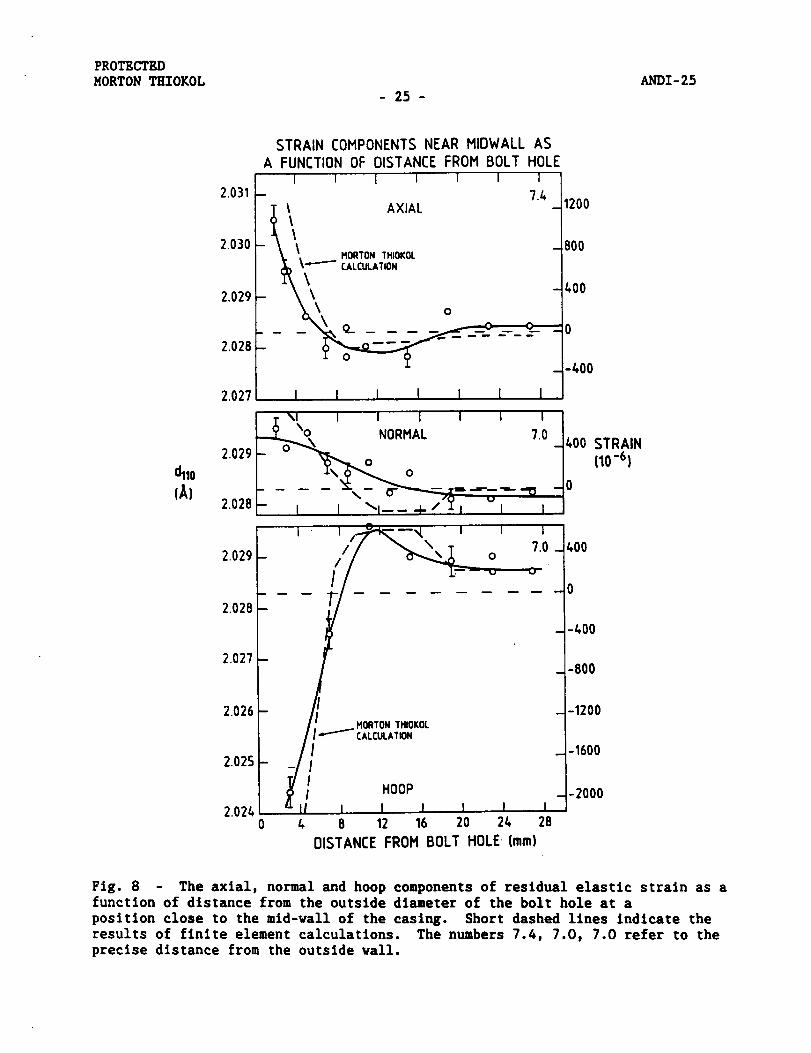
PROTECTED
MORTON THIOKOL- 25 -
ANDI-25
_I0
(A)
STRAIN COMPONENTS NEAR MIDWALL AS
A FUNCTION OF DISTANCE FROM BOLT HOLE
i i _ i i I i i i
2.031 F 7 4 |
AXIAL ' 1200
2.030 - _ \ MORTONTHIOKOL _ 800
(_ _,_"-"_ CALCULATION
2.029- "\" -400
_.......
400
2.027 I I I I I I I
L\o 7.0 _2.029 -
2.028 - ' _- o-_--'--"-_" "" "_ - 0- I I "1--- +/ iI I I
2.028
2.027
2.026MORTON THIOKOLCALCULATION
I w
2.025 III HOOP _
2.024 I I0 4 8 12 16 20 21+ 28
DISTANCE FROM BOLT HOLE (mm)
400 STRAIN[10-6)
400
-400
-800
-1200
-1600
-2000
Flg. 8 - The axial, normal and hoop components of residual elastic straln as afunction of dlstance from the outside diameter of the holt hole at a
position close to the mld-wall of the casing. Short dashed lines indicate theresults of finite element calculations. The numbers 7.4, 7.0, 7.0 refer to the
precise distance from the outside wall.

PROTECTEDMORTONTHIOKOL
- 26 -ANDI-25
Er_
(10-4)
7O
6O
50
_0
3O
2O
10
RMS STRAIN AS A FUNCTIONOFDISTANCE FROM BOLT HOLE
I I I I I I I
- •
O
-- •
0 I I I I I I I0 I. 8 12 16 20 2/. 28
DISTANCE FROM BOLT HOLE {mm)
Flg. 9 - Root mean square strain derived from the intrinsic llnevldth of the
diffraction peaks as a function of distance from the bolt hole near the midvall.
Solid circles, open circles, and diamonds correspond to axial, hoop and normalresults respectlvely.